california geothermal forum · california geothermal forum “a path to increasing geothermal...
TRANSCRIPT

California Geothermal Forum
“A path to Increasing Geothermal Development in California”
October 20, 2016

Berkshire Hathaway Energy Overview• 11.5 million customers
worldwide
• 21,000 employees worldwide
• $85.0 billion of assets
• $18.1 billion of revenue
• 32,600 miles of transmission lines
• 16,400 miles of natural ,gas pipeline
• More than 34,000 MW of owned and contracted generationcontracted generation capacity
• 34% renewableor non-carbon
22
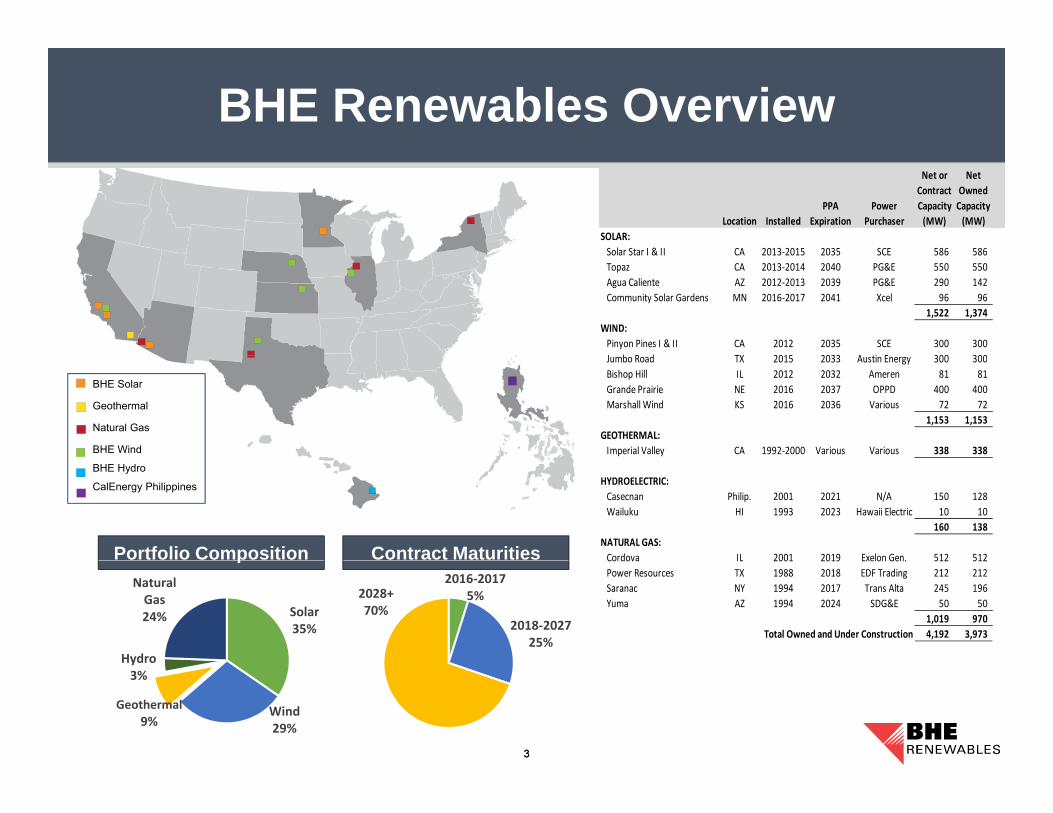
BHE Renewables OverviewNet or NetContract Owned
PPA Power Capacity CapacityLocation Installed Expiration Purchaser (MW) (MW)
SOLAR:Solar Star I & II CA 2013‐2015 2035 SCE 586 586 Solar Star I & II CA 2013 2015 2035 SCE 586 586
Topaz CA 2013‐2014 2040 PG&E 550 550 Agua Caliente AZ 2012‐2013 2039 PG&E 290 142 Community Solar Gardens MN 2016‐2017 2041 Xcel 96 96
1,522 1,374 WIND: Pinyon Pines I & II CA 2012 2035 SCE 300 300 J b R d TX 2015 2033 A i E 300 300
BHE Solar
Geothermal
Natural Gas
BHE Wind
Jumbo Road TX 2015 2033 Austin Energy 300 300 Bishop Hill IL 2012 2032 Ameren 81 81 Grande Prairie NE 2016 2037 OPPD 400 400 Marshall Wind KS 2016 2036 Various 72 72
1,153 1,153 GEOTHERMAL: Imperial Valley CA 1992‐2000 Various Various 338 338
Portfolio Composition Contract Maturities
BHE Hydro
CalEnergy Philippines HYDROELECTRIC: Casecnan Philip. 2001 2021 N/A 150 128 Wailuku HI 1993 2023 Hawaii Electric 10 10
160 138 NATURAL GAS:Cordova IL 2001 2019 Exelon Gen. 512 512p
2016‐20175%
2018‐202725%
2028+70%Solar
35%
Hydro
Natural Gas24%
Cordova IL 2001 2019 Exelon Gen. 512 512 Power Resources TX 1988 2018 EDF Trading 212 212 Saranac NY 1994 2017 Trans Alta 245 196 Yuma AZ 1994 2024 SDG&E 50 50
1,019 970 Total Owned and Under Construction 4,192 3,973
Wind29%
Geothermal9%
y3%
33

History of CalEnergy
Ownership History
1980s Two Competing Businesses - Unocal & Magma
Development Timeline
1993 Magma Purchases Unocal’s Interest
1995 CalEnergy Purchases Magma’s Interest
1999 MEHC* & El Paso Energy 50/50 Ownership1999 MEHC & El Paso Energy 50/50 Ownership
2003 MEHC* & TransAlta 50/50 Ownership
2014 Berkshire Hathaway Energy 100% Ownership * MEHC – MidAmerican Energy Holding Company
Capacity Brine ProcessingPlant Start-Up MW Technology Unit 1 1982 10 pH-Mod/CRC*Vulcan 1986 38 pH-Mod/CRC*Hoch 1989 42 pH Mod/CRC*
gy g p y
Hoch 1989 42 pH-Mod/CRCElmore 1989 42 CRCUnit 3 1989 50 pH-Mod/CRC*Unit 2 1990 18 pH-Mod/CRC*Leathers 1990 42 CRCUnit 4 1996 44 pH-Mod/CRC*
4
Unit 5 2000 46 pH-Mod/CRC*Turbo-expander 2000 10 pH-Mod/CRC* Total 342
* Combination of patented CrystallizerCrystallizer, Reactor, Clarifier andpH-Modification technology
4
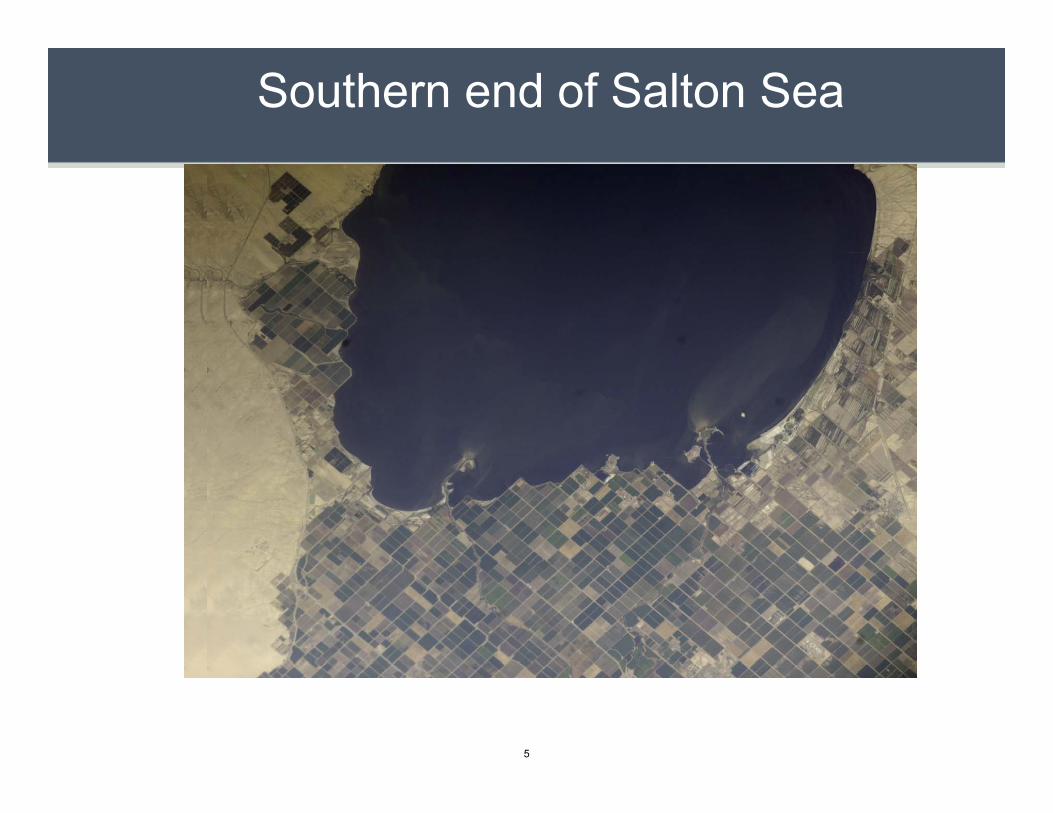
Southern end of Salton Sea
5
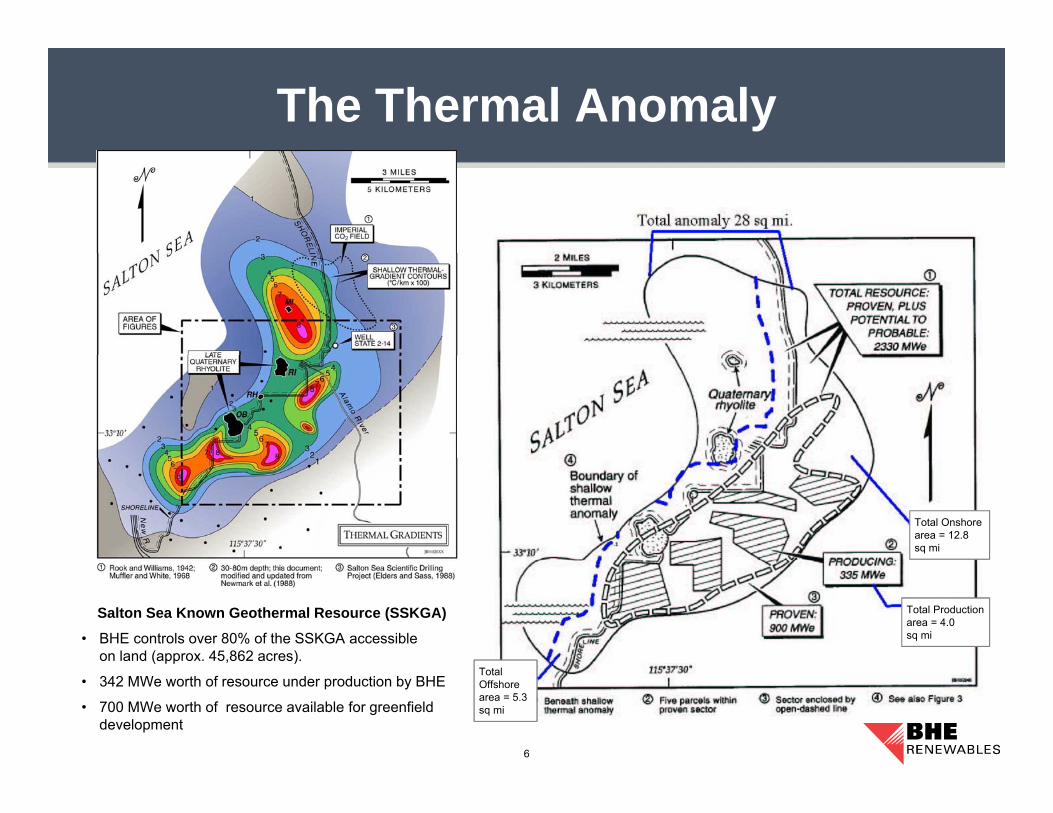
The Thermal Anomaly
Total Onshore area = 12.8 sq mi
Total Production area = 4.0 sq mi
Salton Sea Known Geothermal Resource (SSKGA)
• BHE controls over 80% of the SSKGA accessibleon land (approx. 45,862 acres).
Total Offshore area = 5.3 sq mi
6
( pp )
• 342 MWe worth of resource under production by BHE
• 700 MWe worth of resource available for greenfield development

BHE Production Units
Total Onshore area = 12.8 sq mi
Total Production area = 4.0 sq mi
Total Offshore area = 5.3 sq mi
Production Units Power Plants Capacity
Region 1 Unit S S Unit 1 10 MWRegion 1 Unit S.S. Unit 1 10 MWS.S. Unit 2 17 MWS.S. Unit 3 50 MWS.S. Unit 4 44 MWS.S. Unit 5 46 MW
Region 2 Unit Vulcan 38 MWHoch/Del Ranch 42 MW
7
Hoch/Del Ranch 42 MWCE Turbo 10 MW
Elmore Unit Elmore 42 MW
River Ranch Unit Leathers 42 MW(a.k.a. Leathers Unit)

Imperial Valley Geothermal
8

Elmore Facility and Red Hill Bay ̴ 2006
9
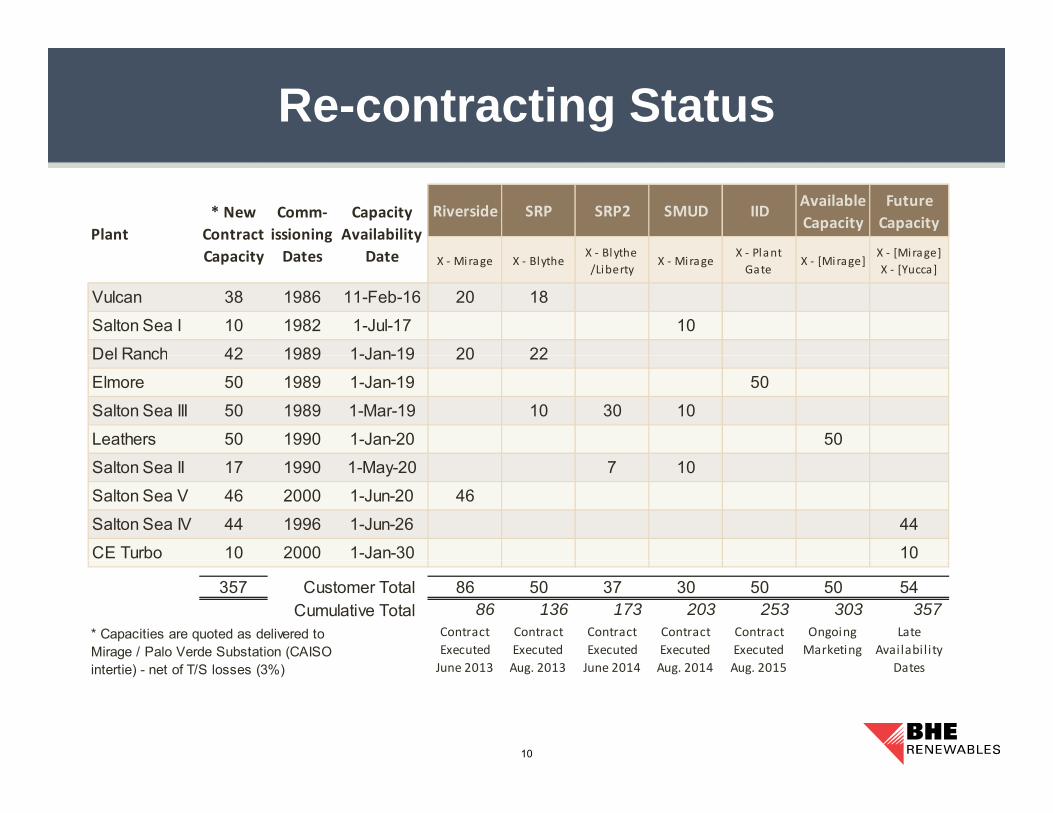
Re-contracting Status
Riverside SRP SRP2 SMUD IIDAvailableCapacity
FutureCapacity
X Blythe X Plant X [Mirage]
Capacity Availability
D tPlant
* New Contract C it
Comm‐issioningD t X ‐ Mirage X ‐ Blythe
X ‐ Blythe/Liberty
X ‐ MirageX ‐ Plant Gate
X ‐ [Mirage]X ‐ [Mirage]X ‐ [Yucca]
Vulcan 38 1986 11-Feb-16 20 18
Salton Sea I 10 1982 1-Jul-17 10
Del Ranch 42 1989 1-Jan-19 20 22
DateCapacity Dates
Del Ranch 42 1989 1-Jan-19 20 22
Elmore 50 1989 1-Jan-19 50
Salton Sea III 50 1989 1-Mar-19 10 30 10
Leathers 50 1990 1-Jan-20 50
Salton Sea II 17 1990 1-May-20 7 10
Salton Sea V 46 2000 1-Jun-20 46
Salton Sea IV 44 1996 1-Jun-26 44
CE Turbo 10 2000 1-Jan-30 10
357 Customer Total 86 50 37 30 50 50 54Cumulative Total 86 136 173 203 253 303 357
Contract Executed
20 3
Contract Executed
20 3
Contract Executed
20
Contract Executed
20
Contract Executed
20
Ongoing Marketing
Late Availability
* Capacities are quoted as delivered to Mirage / Palo Verde Substation (CAISO
10
June 2013 Aug. 2013 June 2014 Aug. 2014 Aug. 2015 Datesintertie) - net of T/S losses (3%)

Salton Sea Known Geothermal Resource Area (SSKGRA)( )
• Everything we do is with precipitating brines as our primary focusprimary focus
Or cause to happen suddenly or unexpectedly a change from a liquid to a solid
– And a picture is worth …….
11
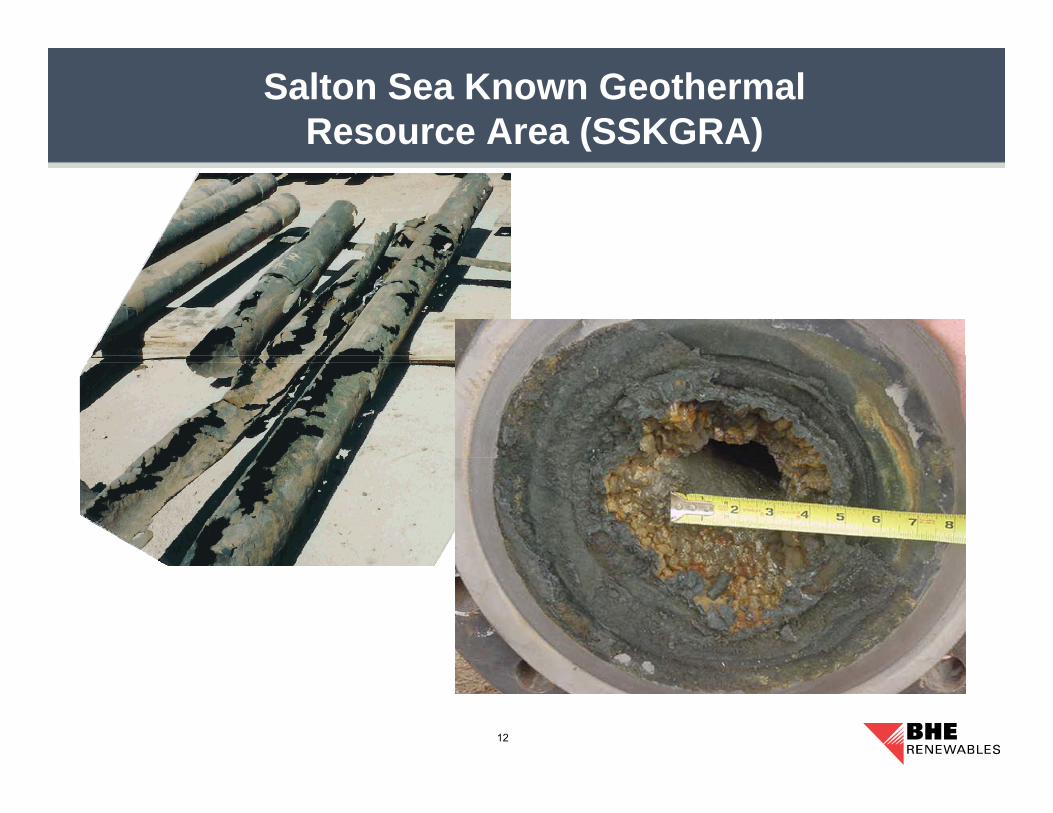
Salton Sea Known Geothermal Resource Area (SSKGRA)( )
12
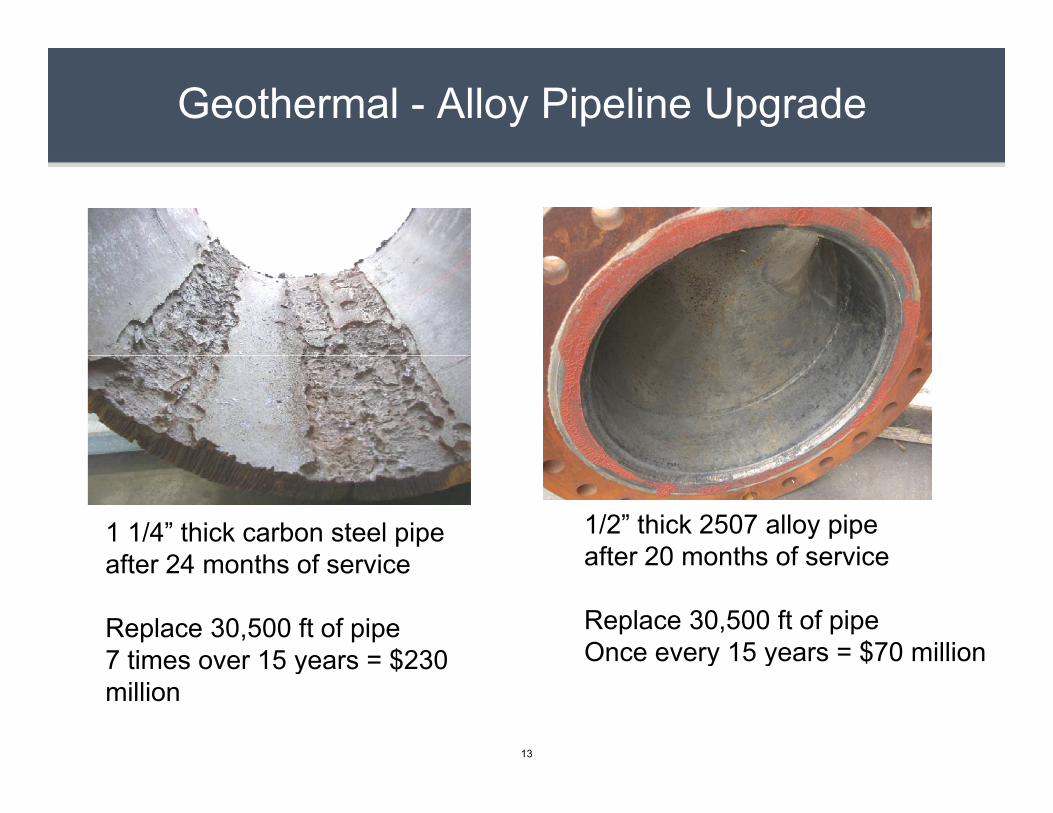
Geothermal - Alloy Pipeline Upgrade
1 1/4” thick carbon steel pipeafter 24 months of service
1/2” thick 2507 alloy pipeafter 20 months of serviceafter 24 months of service
Replace 30,500 ft of pipe7 times over 15 years = $230
after 20 months of service
Replace 30,500 ft of pipeOnce every 15 years = $70 million7 times over 15 years = $230
milliony y $
13

Flexibility or Load Following Geothermal Generation
• Operational Challenges at the SSKGRA
− Each time you change the temperature or flow of the brine you create scale or something falls out of solution To combat we use alloy piping in all conduit that has any possibility of To combat, we use alloy piping in all conduit that has any possibility of
contacting the brine. Approx. 35 miles at CalEnergy 10 times the cost of traditional carbon steel
− Each production well has the life expectancy of 25 thermal cycling events, whether one week or 20 years Cost of new production well, approx. $12 to $16m
14
Flexibility or Load Following Geothermal Generation (cont )Generation (cont.)
− Even a partial thermal cycle or restricting the flow of brine from a “steady state” will stress the entire well integritya steady state will stress the entire well integrity
The reservoir is under-pressured and the wells are not flowing artisan. The wells have to be induced to flow but once flowing, the g,production wells are free flowing. If the wells are shut in for a significant period of time, they lose the ability to flow. Starting a well to flow again requires days to reach temperatures.
Not keeping stable flow in injection and production pipelines casing static brine to sit in place. This leads to precipitation of scale in the pipelines
15

Flexibility or Load Following Geothermal Generation (cont.)Generation (cont.)
• Operational Challenges at the SSKGRA (cont.)
− Uninterrupted brine flow and temperature incorporating a “by passing” approach would create a negative environmental impactimpact To circumvent the production process and vent to atmosphere or “flow
thru” in lieu of abatement of H2S, CO2,benzene, and noise, would significantly violate permits.
− Geothermal brines contain significant concentrations of non-condensable gases, such as hydrogen sulfide, carbon dioxide,
d th lik S h ti l l h d lfid tand the like. Such gases, particularly hydrogen sulfide must be abated to comply with environmental restrictions. Abatement methods are very expensive
16
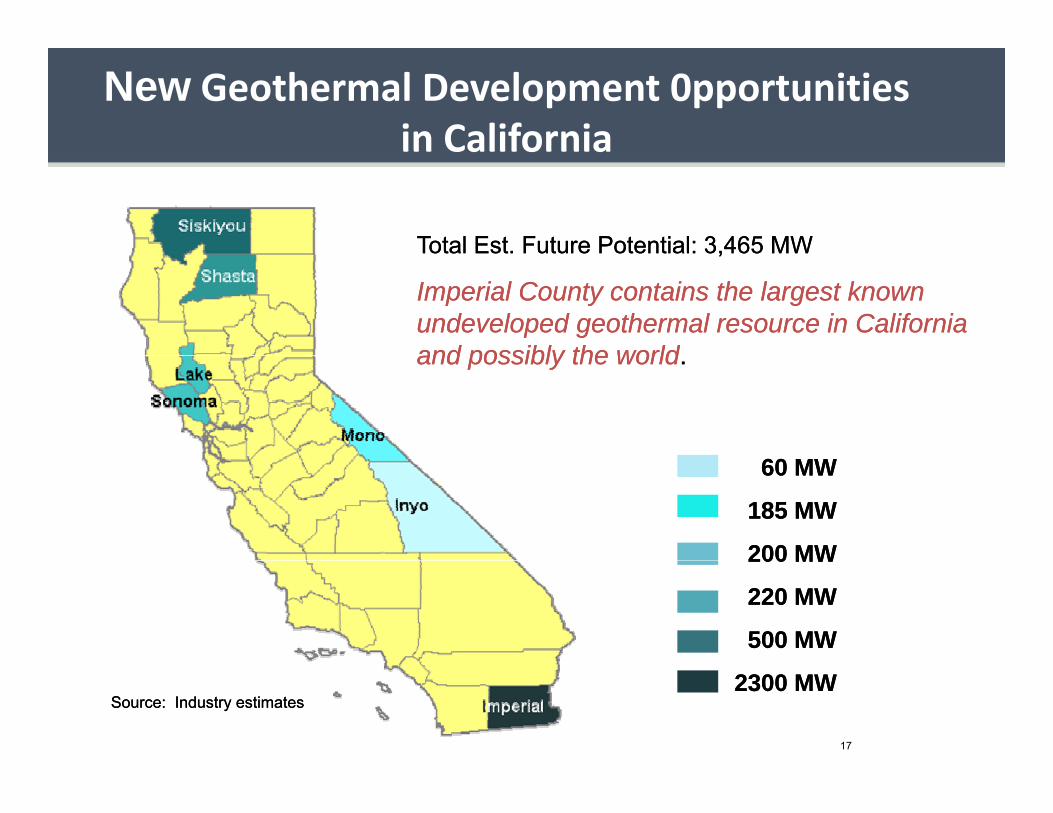
New Geothermal Development 0pportunities in Californiain California
Total Est. Future Potential:Total Est. Future Potential: 33,,465465 MWMWTotal Est. Future Potential: Total Est. Future Potential: 33,,465 465 MWMW
Imperial County contains the largest known Imperial County contains the largest known undeveloped geothermal resource in California undeveloped geothermal resource in California and possibly the worldand possibly the worldand possibly the worldand possibly the world..
60 60 MWMW
185 185 MWMW
200 MW200 MW200 MW200 MW
220 MW220 MW
500 MW500 MW
2300 2300 MWMWSource: Industry estimatesSource: Industry estimates
17

BHE Future Development Resources
Future Black Rock Development
- Approximately 700 MW of fi ld d l t t ti l
18
greenfield development potential
- 159 MW fully permitted
- Subsurface leases held without production until 2025

Black Rock 1 Black Rock 1 -- 3 and 4 3 and 4 -- 66
BR 4-6BR 4-6
LeathersElmore
HochAdminBR 1-3
19
Vulcan
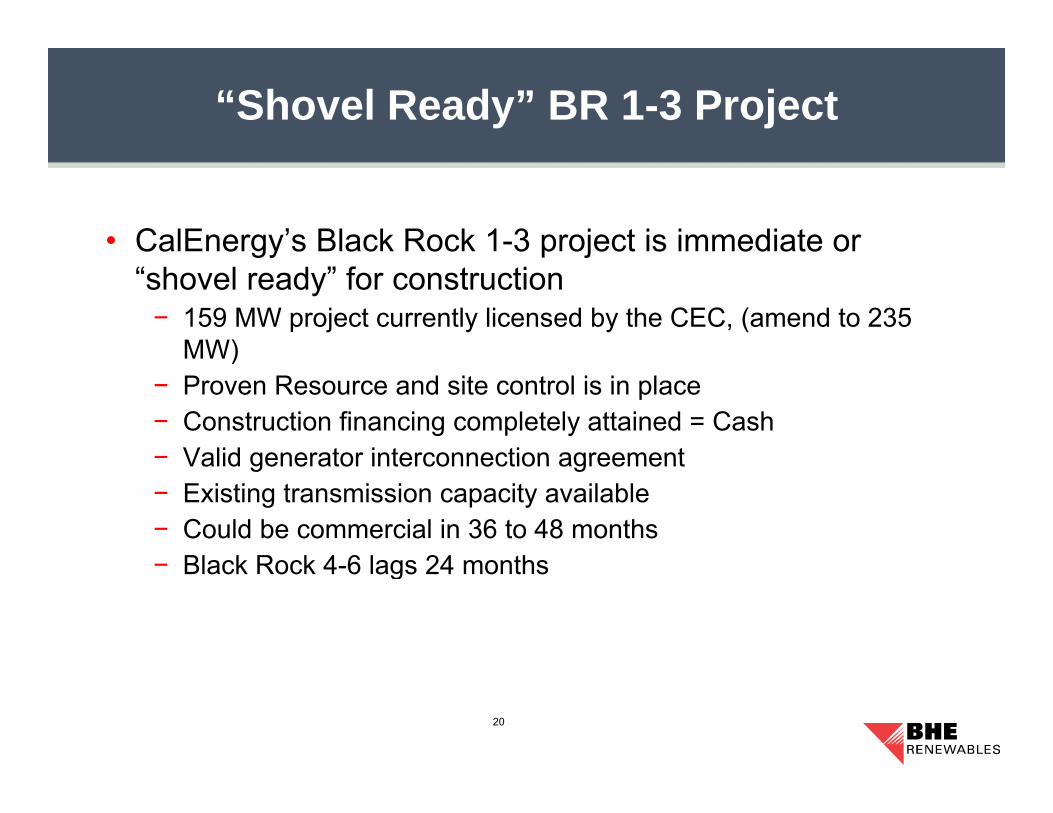
“Shovel Ready” BR 1-3 Project
• CalEnergy’s Black Rock 1-3 project is immediate or gy p j“shovel ready” for construction− 159 MW project currently licensed by the CEC, (amend to 235
MW)MW)− Proven Resource and site control is in place− Construction financing completely attained = Cash− Valid generator interconnection agreement− Valid generator interconnection agreement − Existing transmission capacity available− Could be commercial in 36 to 48 months
Black Rock 4 6 lags 24 months− Black Rock 4-6 lags 24 months
20

Other Developers at the Salton Sea
• EnergySource– 49 9 MW operating plant – 201249.9 MW operating plant 2012– 85 MW Imperial Wells – development pipeline
• Controlled Thermal Resources– 250 MW Hell’s Kitchen – development pipeline
21
So what’s the problem?
MarketMarket• To expensive – Least Cost – Least Cost (Absent Best Fit)
• No Investor Owned Utility procured any meaningful Geothermal generation to reach 33% RPS
• Mostly Solar and a little Wind
• Geothermal is undervalued• Geothermal is undervalued
22

Main barriers preventing more geothermal generation g
• Material Integration with other renewable technologies g gthat recognize − Property tax exemption status− Federal incentives or subsidizesFederal incentives or subsidizes − Time of use pricing − Appropriate adder valuation of non renewable backstopping of
intermittent resourcesintermittent resources Including an adder caused by an increase of carbon
– Level the playing fieldLevel the playing field
23

Main barriers preventing more geothermal generation g
• Ancillary Values Integration Recognition y g g
– Geothermal plants provide the counties that they are sited in, generally with the highest revenue streams in the county
– Geothermal plants require between 5 and 19 time as many employees to operate compared to other intermittent resources
– Importing out-of-state generation provides zero benefit to the schools and communities of Californians
24
Main barriers preventing more geothermal generation g
• SB350 - 50% Renewable Portfolio Standard
‒ Main barrier is the culture at the state agencies that believe that a reliable grid without a balanced portfolio can be achieved, i.e. “least cost – least cost”
‒ In a 50% RPS California, a true mix of renewable technologies is required to meet carbon reduction goals economically asis required to meet carbon reduction goals economically, as revealed in the “Low Carbon Grid Study” recently released.
‒ Specifically points to the procurement of renewables from p y p pdisadvantaged communities of California Imperial County the most disadvantaged county in California and home to
the SSKGRA is anxious to partake.
25
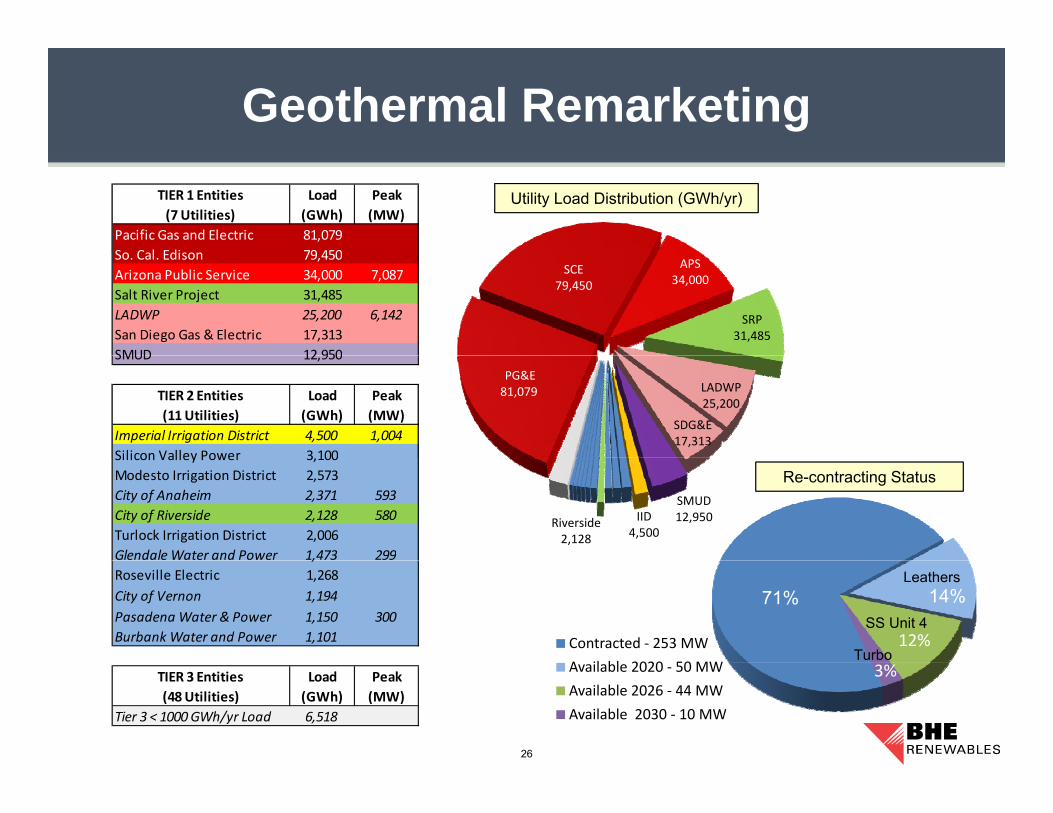
Geothermal RemarketingUtility Load Distribution (GWh/yr)
Pacific Gas and Electric 81,079So Cal Edison 79 450
TIER 1 Entities(7 Utilities)
Peak (MW)
Load(GWh)
SCE79,450
APS34,000
SRP31,485
So. Cal. Edison 79,450Arizona Public Service 34,000 7,087Salt River Project 31,485LADWP 25,200 6,142San Diego Gas & Electric 17,313SMUD 12 950
PG&E 81,079 LADWP
25,200
SDG&E17,313
SMUD 12,950
Imperial Irrigation District 4,500 1,004Silicon Valley Power 3 100
Load(GWh)
TIER 2 Entities(11 Utilities)
Peak (MW)
SMUD12,950IID
4,500Riverside2,128
Re-contracting StatusSilicon Valley Power 3,100Modesto Irrigation District 2,573City of Anaheim 2,371 593City of Riverside 2,128 580Turlock Irrigation District 2,006Glendale Water and Power 1,473 299
Contracted ‐ 253 MWA il bl 2020 50 MW
14%
12%
71%
,Roseville Electric 1,268City of Vernon 1,194Pasadena Water & Power 1,150 300Burbank Water and Power 1,101
Leathers
SS Unit 4
Turbo
26
Available 2020 ‐ 50 MWAvailable 2026 ‐ 44 MWAvailable 2030 ‐ 10 MW
3%
Tier 3 < 1000 GWh/yr Load 6,518
TIER 3 Entities(48 Utilities)
Load(GWh)
Peak (MW)