calcium carbonate deposition by coralline algae … carbonate deposition by... · calcium carbonate...
TRANSCRIPT

CALCIUM CARBONATE DEPOSITION BY CORALLINE ALGAE AND CORALS IN RELATION TO THEIR ROLES
AS REEF-BUILDERS
Thomas F. Goreau Department of Physiology, Uniiersity of the West Indies, Mona, Jamaica, W . I .
and Department of Marine Biochemistry and Ecology, New York Zoological Society, New York, N . Y .
BACKGROUND
The scleractinian corals and the lithothamnioid algae which secrete large massive skeletons of aragonitic or calcitic CaCOI have for a long time been regarded as the main reef frame-builders and cementers (Gardiner, 1931; Ladd and Tracey, 1949; Ladd, 1961), the algal component being dominant in the building up of atoll reefs (Gardiner, 1903; Tracey et al., 1948). Much less well understood in the formation of reefs and their associated unconsolidated deposits is the part contributed by the smaller calcareous algae since these are not, except for some of the Halimedas, very conspicuous components of the reef biota. Nevertheless, a study of fine reef sediments indicates that these algae are much more important in this respect than has been realised.
Field investigations under way in Jamaica since 1960 show that over 70 per cent of the total CaCOa contained in the large reef systems is in the form of fine, unconsolidated sand deposited in thick beds over large areas adjacent to the living reef frame. The chief sand builders appear to be the small delicate calcareous algae, with Foraminifera, mollusks, and echinoderms also making important contributions; the corals and massive lithothamnioid algae are relatively insignificant as a source of fine detritus in most environments. Our studies have also pointed out that the ma- jority of the sand building flora actually occurs in the reef itself, so that the framework zones (see below for definitions) must be the principal site of aand production, not the lagoons.
It is often very difficult to evaluate quantitatively the role played by a species in a reef community in terms of the rate with which it contributes CaCOa to the system. This is due to the lack of correlation between the abundance, or standing crop of a species, and the volume of skeletal detritus it produces. Neither underwater population surveys nor sedimentary analyses give accurate information in this respect : biological surveys tend to overemphasize the importance of the standing crop, whereas sedimento- logical analyses deal with the end product of a complex chain of biological,
127

128 Annals New York Academy of Sciences
chemical and hydrological events and ignore losses due to mass transpor- tation and solution. The unifying principle that is missing is a rate parameter, i e . , the velocity with which calcium carbonate is formed by the different lime producing organisms under natural conditions, probably a far more important quantity than either standing crop or sedimentary mass.
In addition to their ability to form CaC03, impregnated exoskeletons, reef-corals, and calcareous algae possess in common the capacity to photo- synthesize. Indeed calcification and photosynthesis unfailingly occur together in all Recent reef-building organisms regardless of whether they are plant or animal; but, whereas the algae are true photoautotrophes, the reef-corals are carnivorous plankton feeders (Yonge, 1940) which have only secondarily acquired photosynthesis by their commensal association with zooxanthellae. The effect of xanthellar photosynthesis in corals is to stimulate CaCOa deposition into the skeleton so that the rate of cal- cification increases in bright light, and falls by an average of ninefold when the corals are put into total darkness (Goreau, 1959b). I n species which lack zooxanthellae, or in cases where the algae have been removed by grow- ing the corals in darkness for a time, the calcification rates are low and un- responsive to changes in the light intensity (Goreau, 1961~; 1961b). Pre- liminary experiments on three calcareous algae showed that these calcify more rapidly than the corals and that skeletogenesis is less effectively controlled by the light intensity (Goreau, 1961a). In view of the need for more information on the calcification rates of reef-building algae, a com- prehensive physiological and environmental study on CaC03 production and photosynthesis was undertaken on 36 of the principal coralline algae inhabiting the reefs of Jamaica; only the first part of the work is presented in this paper, the ecological investigations are to be published elsewhere in greater detail.
DEFINITION OF TERMS AND CONCEPTS
As it is difficult to divorce problems of calcification physiology from the ecological and geological aspects of carbonate deposition in reef environ- ments, it is desirable to introduce here certain terms as an aid in bridging the conceptual gaps between these widely separate disciplines.
1 . Reef. The term reef, as used in this paper, specifically refers to lo- calised and distinctive limestone structures of Recent organic origin, varied in size, always raised above the level of the surrounding sea bottom (Lowenstam, 1950, 1957; Kornicker and Boyd, 1962) and formed by tropical shallow water Scleractinh and coralline algae.
1. Reef framework. The primary reef framework is an organised and

Goreau : Calcium Carbonate Deposition 129
cemented mass of large interlocking coral and algal colonies buried in their original position by subsequent overgrowth on all sides. This type of reef structure is formed only in the shallow, well illuminated, turbulent environrneiits above the wave base, and is the result of an ordered com- munity growth response to environmrntal factors, such as the power and direction of thr prevailing seas and thc gcomorphology of the underlying platform. The sessile organic associations which build up this substrate are primary framework comniuriiticas. Secwirlury or detrihl reejs occur in the poorly illuminated and calm habitats of deeper water below the normal wave base. These structures intergrade with primary framework reefs, but are typically composed of uncemented and unsorted reef talus derived by fallout from the shallower zones, plus skeletal material de- posited in silu by corals, algae and Gorgonacea (Goreau and Hartman, 1963).
These terms embrace all the frame- work and those sublittoral environments in which transport and deposition of freshly formed skeletal CaC03 detritus from the framework communities is the dominant factor. Since lagoon and forward slope regions are also included, the overall volume of biogenic CaC03 in the system as a whole is usually much greater than that of the framework alone.
The primary frame- work is the functional core of the reef system because most of the biomass, and most of the CaC03 production, occur in this part of the community. The framework substrate provides optimal growth conditions for the calcareous biota because it is mechanically stable in the face of the break- ing waves, its enormous surface area permits maximum exposure of the attached organisms to light and nutrients while effectively dissipating the force of the seas, and it is a self-cleaning habitat in which sedimentation is prevented by turbulence of the water. Lastly, the framework acts as a breakwater and retaining wall which dams back large volumes of reef sand in the protected lee, thus forming the typical lagoon environments so commonly associated with coral reefs.
Hermatypic organisms are those which, by virtue of their power to produce hard limestone impreg- nated skeletons, are able to build shallow water reef systems. The herm- atypic scleractinian and hydrocorals are distinguished by the presence of commensal xooxanthellae which arr always laceking in ahermatypic, or non reef-building, species.
The f unctional classification of hermatypes depends on the type of calcareous residue which remains after the death of the organisms. The unit size of the skeletal mineral aggregate is the determining factor: species with large tough colonies
3. The reef system or reeJ complex.
4. The relation of the Jramework to the reef system.
5. Hermatypic, or reef-building, organisms.
6. Categories of re<[-buildiny wya?iiunu.

130 Annals New York Academy of Sciences
taking part in the framework formation are called primary, or frame- building, hermatypes; those species with smaller, more fragile, colonies tending to form gravelly detritus are secondary hermatypes; the sand builders are those species having such small skeletal units that their cal- careous residue can form only more or less fine grained detritus which accumulates in beds of unconsolidated sand or silt. A special subcategory of the primary hermatypes are the reef cementers which encrust and con- solidate primary and secondary framework into mechanically stable aggregates; many common primary hermatypes are both frame-builders and reef cementers.
Besides corals and algae, a large number of other taxa also contribute significant amounts of CaC03 to reef systems. The various categories and groups are listed in TABLE 1 in the approximate order of their import- ance, but it should be understood that this may vary considerably from place to place. The daggers denote groups containing species which are dealt with in this paper.
7. Taxonomic characteristics of reef building algae and corals. For readers unfamiliar with the algae and corals referred to in this paper, a brief description is given below with special reference to the calcified structures : the algal genera are separately described because of their varied skeletal characteristics, whereas the corals are treated as a single group due to their basic uniformity.
CALCIFICATION PHYSIOLOGY
CLASS RHODOPHYTA: THE RED ALGAE
1. Genus Peyssonelia. Plants crustose, thin, usually dark red, calcified on lower side, mostly attached but edges often free, to 5 cm. across. Pre- fers dimly lit “twilight” habitats a t all depths in the reef. Weak reef cementer, forms sand. Common.
2. Genus Lithoihamnium. Hard encrusting, erect, or rounded cal- careous masses up to 10 cm. across, greyish pink to light purple. Encrusts coral detritus, found in all zones of the reef. Miqeral is calcitic CaC03 with 3 to 25 per cent MgCOs (Chave, 1954). Forms boulders, acts as reef cementer and framework builder. Abundant in certain zones.
Hard encrusting or free growing masses, usually with nodular or branching protuberances. Yellowish to pinkish purple. Occurs mostly in shallow water, attached or free living, colonies small and delicately branched, or massive to about 30 cm. Mineral is calcitic CaC03 with about 3 to 30 per cent MgC03, forms coarse sand or framework. Often locally abundant.
3. Genus Gmiolithon.

Goreau : Calcium Carbonate Deposition TABLE I
SEDIMENTARY CATEGORIES OF SHALLOW WATER CALCAREOUS TUA OF WEST INDIAN REEFS
131
Sedimentary classification
Primary hermatypea (f ramebuilders)
Secondary hermatypes (f ramefillers, framecementem)
Sand formers
Taxonomic group*
Anthozoa, Order: Scleractiniat Hydrozoa, Order: Milleporinat Rhodophyta, Order: Cryptonemiales,
Subfamily Melobeaiaceaet
Anthozoa, Order: Scleractiniat Hydrozoa, Order: Milleporinat Rhodophyta, Subfamily Melobesiaceat Mollusca
Rhodophyta, Orders: Nemalionaleet
Chlorophyta, Orders: Caulerpaleat,
Protozoa, Order: Foraminifera Molluaca, Ordera: Pelecypoda, Gaatropoda Anthozoa, Order: Scleractiniat Echinodermata, Classes: Echinoidea,
Ophiuroidea, Asteroidea, Crinoidea, Holothuroidea
Cryptonemialeat, Bonnemakonialeat
Daaycladaleat
Porifera Phaeophyta, Order: Dietyotaleat Anthozoa, Order: Gorgonacea Ectoprocta Vermes Vertebrata
*Animal classification according to Hyman (1941; 1955; 1Y59), and algal taxonomic
tGroups with species dealt with in this paper. subdivisions according to Taylor (1960) and Silva (1962).
The lack of easily recognisable characteristics among the genera Litho- thamnium, Goniolilhon, and Lithophyllum often makes species identification in the field very difficult. However, because most of these algae resemble each other so closely in their appearance, habitat requirements, and their roles as hermatypes, we have combined them for the sake of convenience into an artificial group called the lithothamnioid algae (M. Doty, private communication).
Small, tufted, finely branching plants less than 5 cm. high. Branches composed of short, strongly calcified and articulated segments about 0.25 to 0.30 mm. in diam- eter. Forms medium fine fraction of sand. Abundant in rear zone.
4. Genus Corallina. Color pale pink to purplish.
Skeletal mineral is calcitic CaC03.

132 Annals New York Academy of Sciences
5. Ccnus Jnniu. Densely tufted, finely branching, plants less than (i rm. high. Branches composed of short rouritl articulated segments about 0.2 mni. in diameter, strongly calcified, dividing dichotomously, often with swollen coriceptacles in nodal segments. Com- mon in very shallow turbulent water on reef flat and rear zone, occurs on dead coral or epiphytic on fleshy sea weeds. Mineral is calcitic CaC03. Sand builder.
6. Genus Liagoru. Plants bushy, soft or mucous, to 30 cm. tall, on exposed, shallow rocky bottoms. Branches very flexible, without seg- ments or joints, from 2 mm. to 1 cm. in diameter, color white to pink, with disperse to firm subcortical aggregates of Calcified needles which are ara- gonitic CaC03. Forms medium to fine sand.
Seg- ments articulated, cylindrical or flattened, 1 to 4 mm. diameter, hard, well calcified, color white to purplish. Occurs on dead coral or in seagrass. Skeletal mineral is calcitic CaC03 containing about 15 per cent MgC03. Forms coarse to medium fine sand. Abundant on exposed parts of shallow framework, rubble, etc.
8. Genus Guluxuuru. Plants bushy, to 20 cm. tall, flexible branches articulated, 1 to 5 mm. diameter, segments cylindrical or flattened, reddish brown to yellow in color. Cortical zone of segments weakly to moderately calcified, hollow in center. Occurs in open habitats, attached to hard substrates. Abundant on reef flat and back reef zone. Calcareous ma- terial is aragonite. Forms fine fraction of sand.
Color pink to dark red.
7. Genus Amphiroa. Bushy or matted, plants to 10 cm. tall.
CLASS CHLOROPHYTA: THE GREEN ALGAE
1 . Genus Halimedu. Plants bushy, or trailing to 1 m. long but usually less, with or without sand holdfast. Branches with calcified segments connected through flexible nodes. Segments discoid, lobed or cylindrical, color light to dark green, 2 mm. to 45 mm. across, 0.3 to 3 mm. thick, more or less strongly calcified throughout except at nodes. Most species prefer hard substrates but also occurs in sandy environments. Mineral skeleton is aragonitic CaC03, forms coarse fraction of reef sand. Abundant in all parts of reef.
Plants erect, to 20 cm. tall, stalked, with holdfast below and tuft above composed of branched filaments fron 0.1 to 0.8 mm. diameter. Color green. Occurs on sandy substrates. Filaments super- ficially covered by a thin crust of aragonitic CaC03, forms fine fraction of reef sand. Locally abundant on soft bottom.
Plants erect, to 20 cm. tall, stalked with holdfast below and terminal fan- or funnel-shaped blade above. Composed of
2. Genus Penicillus.
3. Genus Udoteu.

Goreau : Calcium Carbonate Deposition 133
branched filaments, 0.05 to 0.1 mm. in diameter. Color greyish green to dark green. Occurs on sandy bottom, often locally abundant. Filament superficially covered by more or less strongly mineralised crust of aragonit,ic CaCO,. Forms fine sand fraction.
Plants erect, to 10 cm. tall, with or without sand holdfast, capitate, with numerous imbricated blades each made up of parallel rows of filaments from 0.2 to 0.4 mm. in diameter. Color green. Common on sand, or attached to dead coral. Filaments weakly to mod- erately mineralised crust of aragonitic CaC03, forms fine fraction of reef sand.
6. Genus Cymopolia. Plants bushy to 15 cm. tall, branches jointed, individual segments terete or spherical, to 3 mm. in diameter, separated by flexible nodes, terminal segments with conspicuous tuft of fine filaments about 2-3 mm. long. Plants bright green, grow in turbulent shallow water on hard substrates. Mineral is CaCO,, forms medium coarse sand. Not common in Jamaica.
4. Genus Rhipocephalus.
COELENTERATA: CLASS HYDROZOA
Order MILLEPORINA : The False, or Stinging, Corals
1. Genus Millepora. Colonies encrusting at first, later forming large compressed blades entire or with digitate protuberances. ' Skeleton massive, perforate. Outer layer of dimorphic polyps contains zooxan- thellae, color light brownish yellow. Abundant, sometimes dominant in shallow reef zones to 20 m. Colonies to 3 m. high and 10 m. across, com- posed of aragonitic CaCO,, primary frame-builder.
COELENTERATA: CUSS ANTHOZOA
Order SCLERACTINIA: The True, or Stony, Corals
1 . Numerous genera. Colonies may be variously branched, foliate, encrusting, or massive. Dense perforate exoskeleton covered by outer polypary layer. Hermatypic species always contain zooxanthellae. Color of reef-builders ranges from yellowish through green, brown, grey and mauve. Size ranges from about 0.5 cm. to circa 8 m. high and 10 m. across. Hermatypic corals occur mostly on hard bottom. Abundant, often dominant, from the surface to about 80 m. The exoskeleton is aragonitic CaC03. The large Scleractinia are the most important primary frame-builders in West Indian reefs.

134 Annals New York Academy of Sciences
PROCEDURE
1 . Principles Underlying the Method
When living calcareous algae and corals are immersed in sea water con- taining both &Ca++ and H14C03-, the activities are taken up and frac- tionated by the organisms, under nonequilibrium conditions, according to the following scheme:
1. WaWO, in mineral skeleton 2. 14C fixed into organic compounds chiefly
by photosynthesis, very little by heterotrophic exchange
in exchangeable body pools
1. *CaWOa in mineral skeleton 2. No photosynthesis. Small amounta of
I4C fixed into organic matter by
3. Small amounts of Wa++ and HWOs-
3. Small amounte of Wa++ and H14COs- Wa++ and HWOa- in I=; sea water
in Dark heterotrophic exchange
in exchangeable body pools
Calcium is deposited into the skeleton both in light and in dark, the amount available for exchange being very small in corals (Goreau, 1955; Goreau and Goreau, 1960b). The fate of the carbonate carbon after uptake depends partly on the presence or absence of photosynthesis: in light, I4C is fixed into the tissues as organic matter as well as into the skeleton as Ca14C03 (Goreau, 1961b).
2. Radioactive Labelling of the Specimens
Specimens for the experiments are collected by swimmers or SCUBA divers, taking only healthy growing forms detached entire with their hold- fasts to avoid injury. Sorting is done underwater and the material kept in plastic tubs in a shallow part of the reef until the start of the experiment.
The labelling procedure is carried out in numbered wide-mouth, one-liter, screw-top jars or large ten-liter pyrex desiccator jars. Equal numbers of light and dark jars are used, the latter made light proof with black poly- ethylene tape. The isotope mixture is prepared from stock &CaC12 and NaH14C03 diluted in small amounts of filtered sea water adjusted to pH 7.7 and added to the loaded jars so that the final activity of the medium is about 0.1 mc./l. The isotope addition marks the initial time of the run. After 15 minutes to ensure mixing and equilibration, 100 ml. of water are quickly taken from each jar for determination of initial specific activi-
Goreau : Calcium Carbonate Deposition 135
ties. The containers are tightly closed, and set on their sides in a clear patch of the reef among corals at depths of 1.5 to 2 meters, taking care that the light jars are not shaded by corals. All jars should be gently turned every 15 to 20 minutes to prevent stagnation. The experiments are run during late morning to midday with the sun near zenith to ensure maximum insolation. The dark jars are set out in shaded places under coral heads to avoid heat absorption from sun light. Water temperatures in the reef were between 28.5 and 20.1" C., and did not vary by more than 0.2" C. during any one experirncnt.
The runs are terminated after 1.5 to 2.5 hours by removing the test colonies from the radioactive medium into fresh "cold" sea water, fre- quently changed over a two-hour period to wash out occluded isotope from the tissues and skeleton. Water samples are taken promptly from each jar for determination of the final specific activities. To minimise altera- tions in the specific activities due to exchange with suspended matter or bacteria, the water samples are filtered through Whathman No. 54 paper and stored in hermetically sealed polythene containers with a small amount of thymol as preservative. These are refrigerated until the samples can be analysed. No significant changes in specific activities have been ob- served in control samples kept under these conditions for a period of three moii t hs.
3. Preparation of the Samples for Analysis
After washing, the corals and algae are drained on filter paper, and packed for transport to the laboratory. Following a preliminary trimming, the specimens are dried in a warm air oven at 50" C. for several days, then carefully cleaned under a binocular loupe. With corals and massive calcareous algae, care is taken to remove boring organisms, the bushy green and red algae are searched carefully for adherent filamentous forms, Crustacea, worm tubes, Foraminifera, and stray sand grains. The samples are cut up into portions of about 100 mg. and dried to constant weight over P206 in vucuo.
.
4. Reagents
Only reagents specifically used in the fractionation technique per se are listed below. The reagents for the calcium and nitrogen determinations are not given here as they can be found in standard references.
Freshly distilled water is deionised by passage through a column containing a mixed bed of Amberlite IR-4B and IR 120 resins. This water, which should give no
1. Carbon dioxide and ammonia jree distilled waier.

136 Annals New York Academy of Sciences
visible precipitate with BaCIz, is stored in an aspirator bottle fitted with a soda lime tube to guard against contamination by atmospheric COZ.
2. Methanol wash mixture. This is prepared from boiled Cot free Merck’s pro analysi absolute methanol mixed with equal parts of freshly deionised water, and stored in an aspirator bottle fitted with soda lime tube. 3. Phosphoric acid. Concentrated H$04 A.R. is used as high-tempera-
ture lubricant for ground glass joints connecting the reaction flask to the fractionator.
4. Hydrochloric acid. Concentrated HCl A.R. is taken from freshly opened bottles. Older stock is first boiled in small volumes to remove COz, and stored in tightly stoppered containers.
6. Perchloric acid. Merck’s 70 per cent pro anal& HCIOl is used as oxidant for the wet combustion of organic matter. This is taken directly from new stock bottles.
6. Potassium dichromate. Merck’s pro analysi K2CrZO7 is taken from a recently opened stock container, recrystallised twice to remove dust and organic contaminants, and stored in a tightly covered jar.
Saturated baryta is first prepared from Merck’s pro analysi Ba(0H)z . 8Hz0 and left to stand several days for the carbonate to settle out. The clear supernatant is then diluted with an equal volume of newly prepared deionised water, and this is again allowed to stand for several days before using. This solution is stable and will remain clear if adequately protected against atmospheric COz. The half- saturated working solution is best kept in a large aspirator bottle guarded by a soda lime absorption tube and the nozzle of the delivery tube should be protected from contact with the air by a glass cap.
7. Barium hydroxide (Baryta).
6 . Fractionation oJ Activities in the Samples
1 . Description of the fractionator. Fractionation of the activities is carried out in the fractionator shown by the diagram in FIGURE 1. The apparatus consists of a reaction vessel fitted with a combined air inlet and access funnel, and connected via the exhaust side to a cold trap offset to one side; this in turn leads by separate circuits A and B to the COz absorption towers 9, 10, 14 and 15 charged with a solution of Ba(OH)2. The entire procedure is carried out under reduced pressure, the gases resulting from the decomposition of the sample being transferred to the absorption towers in a slow flow of air drawn through the apparatus by a pump connected to the exhaust side of the system.
The separation of activities in the fractionator involves four consecutive operations: using circuit A, the CaC03 in the sample is decomposed with concentrated HCl, the resulting CO, being collected as BaCOs in tower 9;

Goreau : Calcium Carbonate Deposition 137
air
'" 7
tocircuit B to circuit A 11 16 + y a n v a c
r;
1 4
f
P ; FIGURE 1. Apparatus for chemical fractionation of Wa and 14C activities in samples
of corals and coralline algae. Circuits A and B are slightly offset for the sake of clarity. (1) and (2) are wash towers for removal of NH, and C02 from the aspirated air; (3) trap; (4) access and loading funnel, with two way tap; (5) digestion flask; (6) waste receiver flask; (7) reflux condenser acting a~ cold trap; (8) 120" tap for directing flow of gases through either circuits A or B which branch off beyond this point. Circuit A consists of (9) and (lo), the former is tower 9 in the text, the latter is its safety tower. These contain Ba(OH)* for trapping CO1 derived from the acid decomposition of mineral carbonates in the samples. This circuit contains towers (12) and (13) which remove HClO, fumes from effluent gas before this reaches towers (14) and (15) which are loaded with Ba(OH)Z for the absorption of COz derived from wet oxidation of the organic matter in the sample. Circuit B rejoins A at stopcock (11) which connects the apparatus to the vacuum line via a common outlet, the flow being regulated by valve (16).
Circuit B starts a t tap (8).
using circuit B, the organic matter in the sample is oxidised with hot con- centrated perchloric acid, the resulting COz being collected as BaC03 in tower 14; calcium remaining in the digestion flask is recovered by oxalate precipitation from an aliquot of the digest; organic nitrogen is determined by the Kjeldahl method on an aliquot of the digest.
2. Preparation of the fractionator. Before starting the analyses, the scrubbing towers which remove ammonia and COz from the incoming air are charged with dilute HsP04and NaOH respectively. The two wash towers in circuit B are also charged: the first with acidified 1 M KC1 to remove perchloric acid fumes from the effluent, and the second with boiled distilled water. All glassware with which the sample comes into contact

138 b l s New York Academy of Sciences
should be chemically clean. Prior to loading the sample the entire ap- paratus is connected up and gassed out for about 10 minutes by drawing ammonia and C02 free air through both circuits under reduced pressure. The joints and taps should be lubricated with silicone grease (for excep- tions, see below) and checked for leaks. The gassing out should remove all traces of COz from both circuits. The pressure is then allowed to equalise with the atmosphere, and the two absorption towers plus the safety towers are each charged with 200 ml. of half-saturated baryta.
The dried and weighed sample is now introduced into the reaction flask with about 10 mg. of pure recrystallised KzCrz07, and washed in with a small amount of deionised water. The readion flask is connected to the apparatus after wetting the ground glass joint with a few drops of syrupy HJ'04. All joints which come into contact with the hot and corrosive gases evolved during wet combustion must be lubricated with concentrated phosphoric acid; silicone grease must not be used as it is decomposed at high temperatures. 3. Recovery of carbonate carbon. Air is slowly drawn through circuit A
adjusting the gas flow by turning the control tap on the air exit line. The baryta in the absorption tower should remain clear a t this stage. Five milliliters of concentrated HCl are slowly added to the reaction flask through the access funnel, followed by an equal volume of deionised water. Some foaming may be encountered at this stage. The C02 evolved during this step is carried over to tower 9 where it is trapped as BaCOa. This step must be done slowly, and at first, without heat to ensure complete absorption of the initial COz burst following addition of the acid. When the reaction subsides, the mixture is heated to boiling for about ten minutes until the volume is reduced by half and all organic matter is in homogen- eous suspension.
The water and acid are removed by condensation in the cold trap before the effluent gas reaches the baryta solution in tower 9. At the end of the operation, the condensate in the waste trap should be boiled to drive out any dissolved COz. The heat is then turned off, but gassing over is con- tinued for about five minutes to cool the reaction mixture to room tem- perature, and to remove the last traces of COr from the circuit.
The air flow is switched over to circuit B, which differs from circuit A in that additional scrubbing and wash towers containing acidified 1 M KC1 and boiled distilled water respectively are inserted between the cold trap and tower 14 for the purpose of removing perchloric acid gas from the effluent prior to its passage through the baryta.
Fifteen ml. of 70 per cent HC104 are slowly admitted to the reaction flask through the access funnel and washed in with 10 ml. of deionised water. The mixture is slowly heated until it changes from green to dirty
4. Recovery of organic carbon.

Goreau : Calcium Carbonate Deposition 139
hrown color. Diie care must be taken at this stage to avoid foaming or bumping. No trouhle will be encountered if sample weights are adjusted so that the total organic carbon content, is less than 15 mg. When more organic matter is present, a larger reactioii flask has to bc used and the operator should be protected by a safety shield.
As soon as the charring and foaming subside, the temperature is raised to the boiling point and heating continued for ten minutes or until the digest is reduced to approximately one third of its original volume. Oxida- tion of organic matter, as shown by the appearance of a cloudy precipitate of BaC03 in tower 14, does not occur until digestion at full heat has taken place for about five minutes. The approaching end point of the reaction is marked by a succession of conspicuous color changes: first from brown to clear green; then suddenly to bright orange. The brown is due to the presence of charred organic matter, the green to orange transition indicates a change in the state of oxidation of the Cr+++ to Cr207-- which occurs only when all reducing substances, including organic matter have disap- peared. However, the digest occasionally remains green even after pro- longed heating, probably due to the liberation of silicate when the glass surface is attacked. Flasks in which this happens are replaced by new ones.
Heating is discontinued as soon as the digest changes to a brick red syrupy consistency. The contents of the reflux trap are again heated to drive off dissolved C02. Gassing over is continued for 15 minutes to cool to room temperature. Any precipitate in the reaction flask is redissolved by slow addition of a small amount of deionised water through the access funnel. The cooled clear orange digest is accurately made up to a standard volunie frotn which aliquots are taken for the calcium and nitrogen de- terminations. The solution is stable and may be stored provided the container is tightly stoppered.
The BaC03 suspensions in the two absorption towers are recovered separately by draining the baryta directly into marked, clean, and dry volumetric flasks. The walls of the towers are rinsed down with methanol water and the washings added to the flasks. The suspensions are made up to standard volumes with freshly prepared deionised water, and the flasks tightly stoppered to keep out atmospheric C02.
The wet oxidation procedure described above has been modified from van Slyke et al. (1940). The original method, using a mixture of con- centrated fuming H2S04 and H P 0 4 with a solid oxidant such as Cr03, could not be applied to our samples because the evolution of SOz and SO, produced high blank values, and quantitative recovery of calcium from the digest as the oxalate was complicated by the presence of large amounts of excess sulfate and phosphate. These difIiculties were overcome by using 70 per cent HC104 with a small amount of KzCrzO, as the oxidant mixture,

140
Perchloric acid, however, has the disadvantage that it produces largc volumes of hot corrosive gases during the digestion. This is corrected by the reflux trap which cools the effluents and condenses out most of the fumes, the subsequent passage of the gas through acidified KCl removing the remaining HC104 as potassium perchlorate. The location of the cold trap with respect to the reaction flask is very important; it has to be offset to one side to prevent the condensate being returned to the reaction mix- ture. If refluxing occurs, the digestion temperature can not rise high enough for effective oxidation of the organic matter in the normal time.
6. Recovery and measurement of the 14C and &Ca activities. The BaC03 fractions collected from towers 9 and 14 are shaken for several minutes to give a homogeneous slurry. Aliquots are pipetted directly onto numbered and preweighed planchets made of Whatman’s No. 54 hardened filter paper, clamped into filter cones and mounted on suction flasks attached to a filter pump. The pipet and filter cone are washed through with methanol water because the low surface tension of the alcohol prevents the BaC03 from “creeping.)’
The planchets are dried with a heat lamp for one hour, and counted under an end window Geiger-Muller tube. After weighing to determine the thickness of the filter oake in mg./cm.2, the planchets are counted, the result is corrected for self absorption and multiplied by the aliquot factor to obtain the total 14C activity of the samples.
The 46Ca activity is isolated from aliquots of the digest by precipitation as the oxalate. This is filtered onto numbered preweighed planchets made from Whatman’s No. 42 filter paper, and mounted in filter cones attached to suction flasks. After drying under a heat lamp, the planchets are counted, weighed and the total 46Ca activity calculated in counts per min- ute after corrections for radioactive decay, self absorption, and aliquot factors have been applied.
In order to cal- culate the amounts of calcium and carbon taken up by the test organisms during an experiment, the specific activities of the sea-water medium must be determined in counts per minute per e m . calcium or carbon. Initial and final water samples are always taken from each jar to determine whether changes in the specific activities have occurred during the ex- perimental runs.
The extraction of the activities from the sea water samples involves only circuit A; the perchloric acid digestion is omitted. The refrigerated water samples are warmed to room temperature before opening the bottles. The fractionator is prepared as above, and tower 9 of circuit A charged with baryta, 25 or 50 ml. of sea water are carefully, but quickly, pipetted into the reaction flask via the access funnel, and immediately washed in with
Annals New York Academy of Sciences
6. Fractionation of activities in the sea-wabr samples.

Goreau : Calcium Carbonate Deposition 141
10 ml. deionised water. A gentle air flow is started through circuit A, and the sea water is acidified with 5 ml. concentrated HC1 which is added through the access funnel followed by 10 ml. deionised water. The solu- tion is slowly heated to boiling for 10 minutes to drive off the Cot which is absorbed in tower 9. The contents of the waste trap are boiled to drive off dissolved COz. The mixture is allowed to cool by maintaining suction for a further 10 minutes. The fractions collected at room temperature are made up to standard volumes and activities assayed on aliquot samples as above.
7. Defermination o j the nitrogen content. The nitrogen content is deter- mined on replicate aliquots of the digest run directly through a Pregl micro- Kjeldahl still without further treatment. The ammonia is collected in 2 per cent boric acid and back titrated with 0.01 N HzSOa to the reagent blank value, using screen methyl red as the indicator. The aliquot nitrogen multiplied by the aliquot factor gives the total N content of the sample.
6. Calculation of Deposition and Accretion Rates
The calculation of these quantities depends on knowing the specific activities, i.e., the counts per unit weight of calcium and carbonate carbon, in the medium in which test organisms were run. To compensate for any changes in specific activities that may have occurred during the experi- ments, the average of the initial and final values of the runs are used in the computation of the results.
The deposition rate D is calculated according to the formula:
total corrected activity of sample in cpm mean specific activity of medium in cpm
D = (t in lirs)-' (mg. N)-l
The accretion, or growth, rates are calculated when the total calcium and organic carbon contents of the samples are known. Accretion is an incremental function which is best expressed as the per cent increase in calcium or organic carbon content of the sample per hour. The accretion rate I is calculated by the formula:
.
x 100 weight of calcium or carbon deposited p e r hr total calcium or carbon content in sample
Z -
7. Blanks, Standards, and Controls
A reagent blank is run at the start of each day's work, using operating times of 20 minutes for circuit A and 30 minutes for circuit B, and the general procedure described above. The fractions are collected from

142 Annals New York Academy of Sciences
towers 9 and 14, filtered and the residue weighed to determine the blank BaCOa, if any. The digest is collected and analysed for ammonia. Blank values are generally less than 0.1 mg. BaCOa for circuit A, and less than 0.3 mg. BaCOp for circuit B. High blanks may be caused in circuit B if the digest is accidentally allowed to over heat or dry out. Blank values for ammonia are usually too low to detect by our micro-Kjeldahl method.
For testing the recovery of calcium and carbonate we use a standard made from analytical grade CaCOa dried a t 100" C. and stored over PzOa. Weighed aliquots of about 20 mg. are introduced into the reaction flask and run through the same procedure as described in part 6 of this section. The RaC0p is recovered from tower 9 by filtration. The cake is dried, weighed, and recovery expressed in per cent of the calculated value. Car- bonate recoveries are routinely between about 99 and 103 per cent. The calcium is precipitated from the acid digest with oxalate, filtered, dried and weighed, the recovery values ranging between 99.5 and 101.5 per cent. Perchloric acid digestion does not significantly alter calcium recovery.
Organic carbon and nitrogen recoveries are determined using dried alanine as standard. Aliquots weighing 15 to 20 mg. are introduced into the reaction chamber, and run through the entire procedure as given above. The organic carbon recoveries are determined from the amount of BaCOa in tower 14 after digestion with perchloric acid. The nitrogen content is determined on replicate aliquots of the digest by the Kjeldahl method. Carbon recoveries from standard alanine samples are between 98.5 and 103.8 per cent; nitrogen recoveries are between 99.5 and 101 per cent. To eave time the standard runs on,calcium carbonate and alanine are usually combined in a single operation.
Extensive tests were initially made to measure carbon and nitrogen recoveries on organic compounds other than alanine, ie., cellulose, casein, oleic acid, urea, cystine, guanine HC1, and glucose. Oleic acid proved extremely refractory owing to its tendency to sputter and flare into smoky red flames and to condense as an intractable tar in the cooler parts of the circuit. The other substances so far tested by our method gave recoveries comparable with those for alanine.
The efficiency of our fractionation method with respect to the oxidation of organic carbon and its recovery as BaCOa is influenced by the size of the sample, ie., by the amount of organic carbon present in the digest. Carbon recoveries from standard samples are consistently better if these contain less than 25 mg. organic carbon. In large mmples, greater than 50 mg. C, recoveries tend to be slightly low probably due to formation of carbon monoxide by incomplete oxidation. This is avoided by keeping the amount of organic carbon in the digesting mixture below 20 mg.
Isotope separation by this method is highly efficient. When a sample

Goreau : Calcium Carbonate Deposition 143
containing only Wa is run no activity appears in the waste trap or in any of the absorption towers and isotope recovery from the digest is quantita- tive within the limits of accuracy of our measurements.
To test reliability of transfer of 14C activities through the different circuits, solutions containing standard amounts of NaH14COa and uniformly labelled *4C-gl~~ose mixed with carrier bicarbonate and glucose were run through the complete procedure. The carbonate and organic carbon activities were quantitatively transferred to towers 9 and 14, and no 14C remained behind ill digest.
CALCIFICATION RATES OF THE CORALLINE ALGAE
1. Deposition and Accretion Rates
Calcium deposition was investigated in eighteen species of Chlorophyta of five genera, and sixteen species of Rhodophyta in eight genera. Also included was Padina, one of the l’haeophyta. The majority of these algae are common in Jamaican reefs to about twenty meters and some to more than fifty meters. All the Chlorophyta, and most of the Rhodo- phyta, investigated belong to the category of reef sand builders because of the size of their skeletal remains, ranging from Halimeda detritus (greater than 2 cm.) to the fine calcareous silts formed by Penicillus, Udotea, Liagora, etc. (less than 10 p). Only three of the Rhodophyta, marked by asterisks in TABLE 2, are massive enough to be frame-builders or frame cementers.
The mean calcification rates of the coralline algae are listed in TABLE 2. Light and dark calcium deposition rates in pgm. Ca/mg. N/hr. are given in columns two and four. Light and dark accretion rates in per cent increment/hr. are given in columns three and five. The species are listed in the table according to their calcification rates in light: the fastest species first, and the slowest species last. The figures are the means f the stand- ard deviations; the number of experiments is given in brackets. The light : dark ratios of the mean calcification and incremental rates are shown. in columns six and seven.
To allow an estimate of the variability, the calcium uptakes were meas- ured on the terminal, growing, parts of individual plants, not on pooled series. The large standard deviations of the results in TABLE 2 show that calcification rates within any given species sometimes vary by more than one order of magnitude around the mean, whereas the variance of the photosynthetic data is rather less, as shown in TABLE 4. The standard error of the analytical method is very small and we interpret the scatter of the results as caused by growth fluctuations of the plants themselves. This idea receives support from long term observations carried out in our

144
Accretion per cent inere-
ment/hr.
Annals New York Academy of Sciences
the means
De- Ac- po,i- cre- tion t im _ _
TABLE 2 CALCIUM U P T A ~ BY CALCAREOUS ALQAE IN LIOET AND DARK
Species
1 G. subvert i -
cillata L. valida L. pedicillata A.rigida G. oblongata
P. capitatus G.apectabile* H. incraseata J. adherens G. squalida H.monile H. opuntia U. cyathifor-
mia L i t h o t h a m -
nium sp.* H. tuna H. goreauii U. conglutin-
ata R h i p o c e p h -
aluasp. P. aanctae-
crucia C.cubensis H. discoidea
v.platy1obu P.lamoureuxii P.pyriformia G. cylidrica A. tribulus H. gracilis
A. f I W i m 8
v. opuntioi- dm
R. phoenix H. aimulans U. verticilloaa J. capillacea Q. marginata L. incertum* C. barbata U. tlabellum
Light
Depoaition pgni. Ca/mg. N/hr
2
4318 k2901.2 (3) 4314 f3924.3 (4) 3551 f3028.2 (3) 2465 f 33.2 (4) 1592 f 282.5 (6)
1377 f1306.2 (8) 1435 f 71.4 (3) 870 f 119.6 (5) 722 f 567.5 (3) 688 f 314.6 (5) 431 f 307.8 (5) 365 f 58.4 (5)
361 f 86.5 (6)
341 f 174.4 (3) 310 f 234.4 (10 277 f 40.4 (4)
224 f 19.1 (5)
221 (1)
191 (1) 188 (1)
183 f 121.8 (4) 166 f 116.2 (3) 154 f 76.5 (5) 150 (1) 147 f 54.3 (4)
1394 f 1818.0 (9)
130 f 15.6 (3) 113 f 36.1 (6) 108 f 23.5 (4) 103 f 119.5 (10 58.6 (1) 45.6f 11.5 (3) 30.8f 3.15 (4) 18.9 (1) 16.5 (1)
5.2 f 3.16 (3) 1.8 f 6.40 (6) 3.1 f 6.86 (5) 3.88i 0.224 (5) 1.2 f 2.45 (6) 2.6 f 1.69 (10) 3.76f 7.348 (8) 3.71f 0.141 (3) 5.19 f 0.620 (5) 1.03 f 0.959 (3) 3.04 f 10.198 (7) l.0lf 0.600 (5) 1 6 4 f 0.424 (8)
l.89f 0.45 (6)
3.21 f 0.100 (3) 1.9 f 2.55 (7) 1.20 f 0.055 (5)
1.74+ 0.927 (3)
1.85f 0.100 (2)
1.36 (1) -
1.50f 0.100 (4) 1.68f 0.45 (3)
1.31 (1) 1.llf 0.032 (4)
1.68 f 0.200 (3)
).la* 0.032 (3) 1.32 f 0.264 (5) 1.13 f 0.045 (5) 1.23 f 0.424 (6)
1.16f 0.063 (3) LO2 (1) 1.17 (1) 1.17 (1)
-
Accretion par cent inire-
meiit/hr.
3
4.3 f 5.20 (3) 5.6 f 5.39 (4)
1.54 f 0.674 (4) 6.03 i 4.12 (6)
7.51 f 17.291 (8) 1.05 f 0.100 (3) 3.7 f0.412 (5) 1.61 f 1.40 (3) 2.63 2.36 (4) 1.37 f0.244 (5) 0.89 f 0.223 (5)
3.8 f 1.01 (6)
0.241 f 0.100 (3) 1.36 f 1.26 (10, 0.33 f 0.055 (4)
9.6 f 8.83 (3)
3.86 f 3.464 (9)
2.8 f 1.02 (5)
1.28 (1)
0.20 (1) 0.17 (1)
0.83 f 0.374 (4) 2.05 f 0.700 (3) 1.28 f 0.346 (5) 0.51 (1) 0.18 f 0.071 (4)
2.22 1.55 1.83 1.17 1.89 1.57 1.18 1.75 1.66 1.44 0.93 1.49 2.18 2.00 1.55 1.48 0.73 0.71 2.18 1.56 0.40 0.33 1.53 1.3G 0.71 1.35
1.68 2.01
1.51 1.14 0.86 0.71 1.83 1.64
2.67 1.61
1.67 1.51
1.870.56 - -
1.19 1.06 2.53 3.01
1.79 1.63 1.63 1.72
1.43 0.76
0.82 1.53 0.96 0.79 1.50 2.84 0.78 1.28
2.34 2.13 1.09 1.27
,2.8 2.7 2.4 1.7
- -
0.28 f 0.141 (3) 1.04 f 0.282 (6 ) 0.37 f 0.141 (4) 1.58 f 0.860 (10: 0.19 (1) 0.34 f 0.045 (3) 0.03 f 0.01 (4) 0.46 (1) 0.28 (1)
Light/
Dark ratio of 1 dark
Deposition pgm. Cn/nig. N/Iir.
4
948 f 490.0 (3) 355 f2604.0 (6) 874 f 1824.8 (5) 077 f 1568.4 (5) 959 f 654.9 (6) 498 f1740.7 (10 632 f 421.3 (8) 927 f 272.1 (3)
332 f 310.0 (3) 713 f2320.0 (7) 281 f 263.9 (5) 517 f 562.6 (8)
215 f 81.4 (6)
226 f 137.9 (3) 359 f 467.8 (7) 151 f 39.8 (5)
83.7f 48.27 (3)
132 f 39.1 (2)
102.0 (1)
197 f 153.7 (5)
-
154.4f 37.10 (4) 65.6f 21.50 (3)
107.8f 33.6 (3) 84.4 (1) 89.9f 9.95 (4)
158.0f 82.1 (3) 118.4f 29.29 (5) 72.1f 14.63 (5)
132.0f 62.1 (6)
19.5f 4.123 (3) 28.3 (1) 6.7 (1) 6.7 (1)
-
5 1 0 1 7
Rates are means f the standard deviation. Number of experiments in parentheses. *Frame-building, or frame-cementing, algae.

Goreau : Calcium Carbonate Deposition 145
laboratory on cultured calcareous algae of a number of representative species. Over a period of 15 months, we have found that these plants grow in spurts: for example, the Halimedas often double the number of segments in their branches in a 36-hour period, following a quiescent stage during which few changes are noted. Under field conditions, however, there is no practical way of ascertaining which individuals in a population are in process of growing, hence our selection was to a certain extent ran- dom and the scatter of the data is indicative of the variance in growth rates found in the natural populations on which these experiments were made.
Comparison of calcification data shows that the growth rates within a population group are far more homogeneous then growth rates between different groups of the same species. This indicates that there may be some physiological synchrony within restricted assemblages, a suggestion supported by many of our field observations on natural populations of reef algae. For instance, among Halimedas fruiting bodies (gametangia) often appear simultaneously on many plants within small groups, but not in adjacent ones; also, Halimeda, Penicillus, Udotea, and Galaxaura often form separate stands in which the age and size composition of the popula- tions are different from those of neighbouring patches. It is therefore to be expected that calcification rates will vary according to the stage of growth and development of a given population.
There is no information as to the effects of seasonal and other secular fluctuations on the calcification rates of coralline algae. A preliminary experiment was carried out on eight species over a 24-hour period to test for diurnal variations and none were observed.
Under the conditions of our experiments, the highest calcification rates were found in Rhodophyta of the genera Galaxaura, Liagora, and Am- phiroa, whereas the Chlorophyta of genera Pencillus and Halimeda had distinctly slower rates. Reference to TABLE 3 shows that a majority of the Rhodophyta had mean calcification rates above 500 figm. Ca/mg. N/hr. while most of the Chlorophyta were below this. The highest calcifica- tion rate we observed was 11,075 pgm. Ca/mg. N/hr., with an accretion rate of 15 per cent per hour, in a Liagora valida.
The mineral accretion rates are given in TABLE 2 as the per cent iricrerneiit per hour in relation to the total calcium content. The calcium deposition and accretion rates are not in constant relation to each other: for example, high deposition rates were found in Goniolithon spectabile but the accretion rates were low because of the large amounts of lime already present in this heavily calcified species; on the other hand, low deposition rates in Udotea cmglutinata resulted in high accretion rates because of the small amount of CaC03 initially present.
An interesting problem concerns the relation of calcium deposition to
.

146 Annals New York Academy of Sciences TABLE 3
SPECIE8 FREQUENCY DIBTRIBUTION O F RHODOPHYT.4 AND CHLOROPHYTA WITH REBPECT TO THE CALCIFICATION RATE IN LIGHT
Number of species Calcification rates in light
(pgm. Ca/mg. N/hr.) Rhodophyta Chlorophyta
0- 99 100- 499 500- 999
1000- 1999 > 2000
2 14
1 1 0
calcium accretion among the various genera tested. When these functions are graphed together without regard to generic affinities, as in FIGURE 2, the point scatter is so large as to give a meaningless plot. However, in genera containing three or more species, the points for the individual ones fall into definite linear subgroups most of which are defined by re- gression curves having slope coefficients near unity, except for Halimeda and Penicillus where the slope is less. This indicates that there is a corre- lation between the deposition and accretion of calcium the nature of which differs from genus to genus. In most of the genera, the regressions of deposition upon accretion, as calculated by the least squares method, intercept the abscissa to the right of the origin, suggesting that appreciable skeletal calcium accretion still occurred when the calcium deposition rate was zero. This deviation, henceforth called the &value, is directly pro- portional to the mean nitrogen content, and to a lesser degree related to the mean organic carbon content in the genera concerned, as shown in
The large &values suggest that an appreciable part of the measured calcium accretion in these algae was due to the deposition of an unlabelled substance which behaved like calcium during the fractionation procedure, but which did not appear in the deposition rates since it was not radio- active. A minor part of this may he strontium, but the Sr concentrations in sea water and in these algae (Odum, 1957a; 1957b) are too small to account for the observed E-values. Our present working hypothesis is that the deviations are caused by isotopic dilution of calcium during trans- port from the medium into the skeleton. The source of the inactive isotope is believed to be a pool of nonexchangeable calcium held in a bound form in the algal cells where it may serve as a preferential pathway for calcifica- tion.
FIGURE 3.

Goreau : Calcium Carbonate Deposition 147 h
1. V Lithotharnnioids 2. 4 Arnphiroa
I - I. Galaxaura Z 5. 0 Halimeda - P - E 6. 0 Penicillus
,oI. : 3. A Jania
\
\
103 7, A Udotea
Is,
z a
0 L
2 w 2 a 10
u, 4
In
, , , , , , , L 1 I , . , , . I
10
f
0.1 1 .o lo1, 0.01
CALCIUM ACCRETION, % INCREMENT / HOUR FIG~JRE 2. The relationship of calcium deposition in light to calcium accretion in
seven genera of coralline algae. Within each genus, there is a clear linear correlation of deposition to accretion. The regression lines, fitted by least squares, have slopes around unity, except for Penicillus and Halimeda in which they are less. Only the curves for Lithotharnnioids and HaZimeda psee through the origin, the remainder have positive intercepts on the x-axis. The positions of the x-intercepts have an inverse relation to the degree of calcification, the more heavily mineralised genera are on the left, the lees calcified ones are on the right. The significance of the deviation, also called the &value, is discussed in the text.
2. Effect of Light on CaCOs Deposition in Algae
The degree to which the light intensity influences algal calcification is shown by the mean light : dark ratios given in columns six and seven of TABLE 2. The majority of the species calcified somewhat faster in light than in dark; in 50 per cent of the species the light : dark ratios are between 1 and 1.99, in 25 per cent the ratios are between 2 and 3. Of the eight algae with light : dark ratios higher than 2, seven are species restricted in their vertical distribution to depths above 25 meters.
Of 32 species tested, 22 per cent had mean light : dark ratios below unity

148 Annals New York Academy of Sciences
1. 0 Arnphiroa 2. 0 Jania 3 . 0 Gaiavaura 4. V Penicillus
5. A
/
A
B
N = Nitrogen
1. C = Carbon
4.0
3.0
2.0 s 0 ;D 0
1.0 g 0.8 is
Z 0.6 0.5 3 0.4 z
0.3
0.2
0.1 0.01 002 0.03 0.05 0.07 0.10 0.20 0.30
DELTA VALUE
FIQURE 3. The relationship of organic carbon and nitrogen content to the &value in five genera of calcareous algae. The points represent generic averages. Curves A and B are the regressions of nitrogen and organic carbon content on the &value. The slopes and intercepts were calculated by the least squares method.
which shows that the calcification rates in the dark were higher than in light. With one exception, “reversal” was observed only in Chlorophyta having a wide vertical distribution. On the basis of our present data, the Rhodophyta have slightly higher light : dark ratios than the Chloro- phyta, ie., calcification in the former is somewhat more potentiated by light than in the latter, but additional data are required to determine whether the difference is significant.
In view of the evidence presented in this section, showing that the coralline algae can still calcify rapidly in darkness in the absence of photo- synthesis, the statement by Blinks (1951, p. 265) and Revelle and Fair- bridge (1957, p. 262) that “algal calcification may be a simple precipitation reaction due to photosynthetic COz utilisation causing an increase in the HCOI- to the point where CaCOa becomes insoluble” seems to be incorrect.

Goreau : Calcium Carbonate Deposition 149
3. E$ect of Adverse Environmental Condiiims on A lgal Calcification
There is evidence that the calcification process in the algae is inore sensitive to adverse environmental conditions than photosynthesis. Dur- ing several field runs, high winds and heavy seas made it necessary to collect the experimental specimens in very unfavourable circumstances and to carry out the labelling runs on the beach under unnatural light and temperature conditions. In such cases the calcification rates were in- variably reduced by more than one order of magnitude whereas no signifi- cant changes were observed in the rates of photosynthesis. The cause of this effect is not yet understood, but we believe that it may be due partly to small injuries suffered by the algae as a result of the violent turbulence and abrasion by suspended sediment, partly to unavoidable rough handling by divers who were preoccupied with their own safety, as well as changes in light intensity and water temperature which occurred during the labelling runs. Although the data from these runs has not been included in this paper, such experiences serve to emphasize the point that the normal calcification of algae can be studied only intact and well-acclimated in- dividuals, and that environmental changes, even when occurring naturally, may cause drastic changes in calcium uptake without necessarily affecting the rate of photosynthesis. It is hoped that this problem can be investi- gated further in the near future.
PRIMARY CARBON FIXATION IN THE CORALLINE ALGAE
1 . Rates of Organic Carbon Formation and Accretion
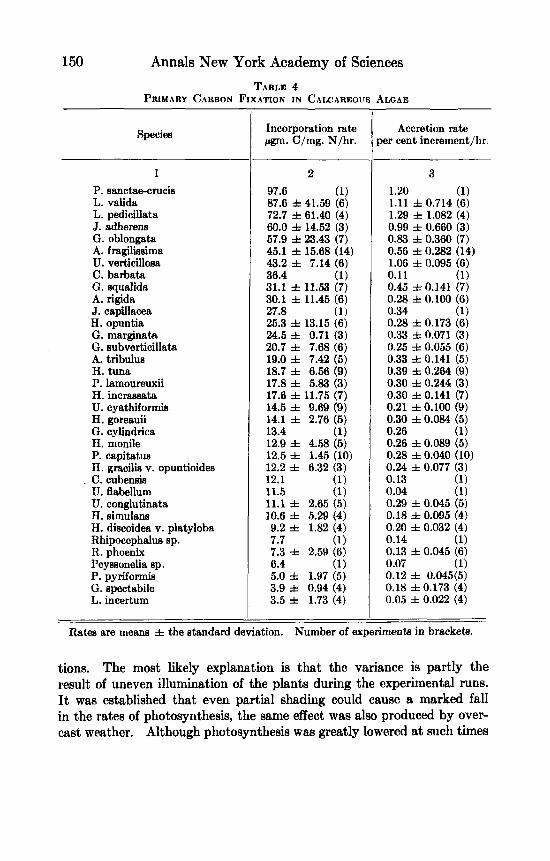
By the procedure described in this paper, the measure of photosynthesis is the fixation rate of I4C-carbonate into the organic fraction of the algae. This function is expressed both in terms of the incorporation rate as pgm. C/mg. N/hr., and as the per cent increment of organic C/hr., which is the accretion rate. The mean rates of photosynthesis f the standard devia- tion are listed for 36 species in TABLE 4. The data are not corrected for dark fixation, which was in all cases very small. Column 2 of TABLE 4 gives the carbon incorporation rates as a function of the total N content, and column 3 shows the corresponding accretion rates as the per cent increment in relation to the total organic carbon content.
The variance of the data, expressed by the standard deviations, was quite large, and was not a “locality effect’’ since no consistent differences were observed in the variance of the results from individuals of the same population as compared to that of individuals taken from different popula-
150 Annals New York Academy of Sciences TABLB 4
PRIMARY CARBON FIXATION IN CALCAREOIW ALGAE
Species
1
P. sanctae-crucis L. valida L. pedicillata J. adherens G. oblongata A. fragilissima U. verticillma C. barbata G. squalida A. rigida J. capiUacea H. opuntia G. marginata G. eubverticillata A. tribulus H. tuna P. lamoureuxii H. incrassata U. cyathiformia H. goreauii G. cylindrica H. monile P. capitatua H. gracilia v. opuntioides C. cubenaia U. flabellum U. conglutinata H. simulana H. discoidea v. platyloba Rhipocephalua sp. R. phoenix Peyaaonelia sp. P. pyriformis G. spectabile L. incertum
Incorporateion rate pgm. C/mg. N/hr.
2
97.6 (1) 87.6 f 41.59 (6) 72.7 f 61.40 (4) 60.0 f 14.52 (3) 57.9 f 23.43 (7) 45.1 f 15.68 (14) 43.2 f 7.14 (6) 36.4 (1) 31.1 f 11.53 (7) 30.1 f 11.45 (6) 27.8 (1) 25.3 f 13.15 (6) 24.5 f 0.71 (3) 20.7 f 7.68 (6) 19.0 f 7.42 (5) 18.7 f 6.56 (9) 17.8 f 5.83 (3) 17.6 f 11.75 (7) 14.5 f 9.69 (9) 14.1 f 2.76 (5 ) 13.4 (1) 12.9 f 4.58 (5) 12.5 f 1.45 (10) 12.2 I 6.32 (3) 12.1 (1) 11.5 (1 ) 11.1 f 2.65 (5) 10.6 d= 5.29 (4) 9.2 f 1.82 (4) 7.7 (1) 7.3 I 2.59 (6) 6.4 (1) 5.0 f 1.97 (5) 3.9 f 0.94 (4) 3.5 f 1.73 (4)
Accretion rate per cent increment/lir.
3
1.20 (1 1 1.11 f 0.714 (6) 1.29 f 1.082 (4) 0.99 f 0.660 (3) 0.83 f 0.360 (7) 0.56 f 0.282 (14) 1.06 f 0.095 (6) 0.11 (1) 0.45 f 0.141 (7) 0.28 f 0.100 (6) 0.34 (1) 0.28 f 0.173 (6) 0.33 f 0.071 (3) 0.25 f 0.055 (6) 0.33 f 0.141 (5) 0.39 f 0.264 (9) 0.30 f 0.244 (3) 0.30 f 0.141 (7) 0.21 f 0.100 (9) 0.30 f 0.084 (5) 0.26 (1) 0.26 f 0.089 (5) 0.28 f 0.040 (10) 0.24 f 0.077 (3) 0.13 (1) 0.04 (1) 0.29 f 0.045 (5) 0.18 f 0.095 (4) 0.20 f 0.032 (4) 0.14 (1) 0.13 f 0.045 (6) 0.07 (1) 0.12 f 0.045(5) 0.18 f 0.173 (4) 0.05 f 0.022 (4)
Rates are means f the standard deviation. Number of experiments in brackets.
tions. The most likely explanation is that the variance is partly the result of uneven illumination of the plants during the experimental runs. It was established that even partial shading could cause a marked fall in the rates of photosynthesis, the same effect was also produced by over- cast weather. Although photosynthesis was greatly lowered at such times

Goreau : Calcium Carbonate Deposition 151
the calcification was not observed to change significantly provided that the sea remained calm and the water temperature stayed the same. Photo- synthetic rates measured under these conditions have not been included in this paper, but it is worthwhile to point out that algal calcification and photosynthesis are totally unlike in their response to such environmental factors as changes in light intensity, whereas the opposite is true for the reef -corals.
TABLE 4 shows that the fastest species on the average photosynthesized thirty times as rapidly as the slowest. Within the limits of the data vari- ance, the observed differences in rates of photosynthesis between species were consistent under similar experimental conditions, and reflect basic constitutional dissimilarities in the photosynthetic capabilities of the algae. Thus the rhodophycean genera Liagora, Galaxaura, Jania, and Amphiroa photosynthesized faster than the chlorophycean genera Halimeda, Udotea, and Penicillus which in turn were always faster than Peyssonelia, Gonioli- thon, and Lithothamniuwi. Analysis of the data in TABLE 4 shows that the mean primary carbon fixation rates of the Chlorophyta are in the range of 6 to 50 pgm. C/mg. N/hr., whereas the majority of the Rhodo- phyta are in the range of 20 to 90 pgm. C/mg. N/hr., with the important exception of the massive Lithothamnioids which all have rates less than 5 pgm. C/mg. N/hr. The Rhodophyta thus contain both the fastest and the slowest primary producers, whereas the Chlorophyta are some- where in between.
Primary carbon fixation and the incremental accretion of organic matter have a simple linear relationship to each other which seems independent of the taxonomic affinities of the algae concerned. The high degree of sig- nificance of the correlation between these functions is shown by the plot in FIGURE 4, their close proportionality is indicated by the fit of the cal- culated regression which intercepts the coordinates very near to the origin. The apparently uniform correlation between photosynthesis and organic growth in all the algae investigated is in strong contrast to the far more complex relationship between calcium deposition and skeletal growth described before and shown in FIGURE 2.
2. Relation of Photosynthesis to Calcification in the Coralline Algae
The question of whether calcification and photosynthesis are correlated in the lime producing algae depends on what is meant by correlation. Obviously some overall proportionality must exist during the growth of the individual; the uncertainty is whether there is any specific linkage, faculta- tive or obligatory, of the two processes so that the rate of one is directly

Annals New York Academy of Sciences
I: hlorophyceae 0
Rhodophyceae a Phaeophyceae Q,
6
n = 36
0.1 0.2 0.3 0.4 0.5 0.6 0.7 0.8 0.9 1.0 1.1 1.2 1.3
MEAN ORGANIC CARBON ACCRETION RATE ,(% Increment/ hour)
FIGURE 4. The relationship of carbon fixation rate, i e . , photosynthesis, to organic carbon accretion rate in 36 species of calcareoua algae. The two functions have an overall linear correlation showing that the organic carbon accretion rate of the various species is equal to the H power of the carbon fixation rate. The regression line waa fitted by the least squares method.
controlled by the rate of the other. On a statistical level, there appears to be a slight stimulatory effect of photosynthesis on calcification since the average light : dark calcification ratio of the algae as a whole is somewhat greater than unity; but, compared with the hermatypic corals the response of the calcification process to light in the algae seems too weak and incon- stant to affect significantly the role these organisms play in the growth and maintainance of reefs.
On a more general level, it is of some interest to consider the problem of whether fast calcifying algae photosynthesize more rapidly, and vice versa. When photosynthesis and calcification, expressed as deposition rates in terms of total nitrogen content, are plotted against each other, the result is the meaningless scatter diagram shown in FIGURE 5 which suggests that skeletogenesis has no consistent relationship to the rate of primary pro-

Goreau : Calcium Carbonate Deposition
looO I 153
Rhodophyceae
Chlorophyceae
Phaeophyceae (Padina only)
0 0-
0 0
0
I I 1 1 . 1 1 1 I I I I 1 1 1 1 1 I I I I I l l 1 1 10 100 1000 MEAN CALCIUM DEPOSITION RATE IN LlGH T (pg WmgNlhr )
FIGURE 5. Plot of carbon fixation/mg. N against calcium uptake/mg. N in 35 The scatter of the points indicates a complete absence of any corre- calcareous algae.
lation between these two functions within the group of species tested.
ductivity. On the other hand, these functions have a highly significant linear correlation when they are expressed in terms of the per cent increment per hour, i.e., the accretion rate as shown by the plot in FIGURE 6. Since many different species are involved the correlation can not be interpreted as being due to a stimulatory effect of photosynthesis on calcification per se. It is much more probable that the connection arises from the circumstance that in plants, the accretion rate of organic carbon must be a measure of the rate of growth of the tissue mass, whereas the velocity of photosynthetic carbon fixation is more directly related to the carbon turn- over rate. If normal anatomical relationships are to be maintained during all stages of growth and development of the plants, the rate of CaCOa accretion of the skeleton must be in proportion to the growth rate of the tissue mass, i.e., cell proliferation and skeletal growth must be matched.

154 Annals New York Academy of Sciences
0 Rhodoplyceae
o Chlorophyceae A
Rh.
Ch.
= v------ 4 0 1 0.01 01 1 .o 10
4 wauM ACCRETION RATE IN LIGHT (%incrtmnt/hr)
FIGURE 6. The relationship of calcium and organic carbon accretion rates in 18 Chloro- phyta and 16 Rhodophyta. There is an overall linear correlation between thew func- tions which is somewhat different in the two classes of algae tested as shown by the slopes of the regression lines. The curves were fitted by the least squares method. As the carbon accretion is related to tiesue growth and the calcipm accretion to skeletal growth, the dopee of the lines indicate that tissue growth rats in the Chlorophyta are proportional to the 0.3 power of the skeletal growth rate, whereas in the Rhodo- phyta, the t h e growth rate is proportional to the 0.5 power of ekeletogenesis.
CALCIFICATION AND PHOTOSYNTHESIS IN HERMATYPIC COELENTERATES
The corals used in this study are Acropora cervicomis and Pm'tes porites forma furcata, and a Hydrocoralline Millepora cmplanata. These species are common in shallow water where they are often the dominant elements of reef communities. No attempt was made to determine calcification and photosynthesis rates of whole colonies, but sampling was restricted to the apical fast growing parts. The determination of the chlorophyll a concentration was carried out on separate samples of A. cervicmis only, using Odum's (1958) modification of the method of Richards with Thomp- son (1952).
Calcification and primary productivity in these corals are given in TABLES
5 and 6, deposition being expressed in pgm. Ca or C/mg. N/hr., and ac- cretion as per cent increment of Ca or C/hr. Both light and dark rates are given for calcium uptake, the light : dark ratios being shown in columns 5 and 6 of TABLE 5.
Among the hermatypic coelenterates, the fastest calcium uptakes were observed in the apical corallites of the staghorn coral A. cervicmis. How- ever, due to the large amount of CaCOs in the skeleton, the calcium accre-

Goreau : Calcium Carbonate Deposition
TABLE 5 RATES OF CALCIUM DEPOSITION AND ACCRETION I N HERMATYPIC COELENTERATA
155
Deposi- tion
1
118.48 134.34 63.6
106.2
77.26 78.42 34.01 64.3 60.7 42.2
86.6 77.3 60.3
26.7
A . cerviwrnis apical corallites (pooled samples)
Accre- tion
~~
2 0.280 0.330 0.140 0.272
0.102 0.089 0.059 0.102 0.091 0.066
0.026
~~
--
- -
~ _ _ _ 0.028
lateral corallites (pooled samplea)
M. m p l a n a t o terminal cm. only (pooled samples)
P . furcala terminal cm. only (pooled samples)
Deposition in pgm. 1
Light Dark
Deposi- tion
3 47.9 19.43 20.6 18.4
1'3.03 10.16 9.48 4.90 - -
65.2 34.4 15.2
5.6
Accre- tion
4
0.060 0.039 0.029 0.04
0.019 0.011 0.010 0.017 - -
0.014 - -
0.008
L/D ratios
Deposi- tion
5 2.47 6.91 3.10 5.8
4.9 7.7 3.6
13.1 - -
1.3 2.3 4.0
4.8
i/mg. N/hr. Accretion in per cent increment/hr.
Accre- tion
6
4.67 8.7 4.8 6.8
5.4 8.1 5.9 6.0 - -
1.9 - -
3.5
tion rates of even the fast growing corals are very low with respect to de- position rates. I n this regard, the corals resemble the massive Litho- thamnioids more than the fine branched algae.
One of the most revealing differences we have found between corals and algae concerns the magnitude of their respective light : dark calcification ratios: in the reef corals the light : dark ratio is rarely less than 3, whereas in the algae it is never above 3. In eleven species of hermatypic corals previously investigated, the average light : dark ratio was 9.02 (Goreau and Goreau, 1959) ; in the present series, excluding M. complanatu which is a Hydrocoralline, the ratio is 5.9. By comparison, the average light : dark ratio of the algae listed in TABLE 2 is about 1.6. This marked difference indicates that the potentiating effect of light and photosynthesis on cal- cification is far more significant in the hermatypic Scleractinia than in the coralline algae.
In corals with determinate colony shapes, the amount of living tissue is directly proportional to the surface area and the skeletal 1111188 is propor-

156
Carbon deposition rate pgm. C/mg. N/hr. Species
Annals New York Academy of Sciences
Carbon accretion rate per cent increment/hr.
Amopora c e r v i m i s apical corallites (pooled samples)
9.4 8.5
12.09
0.184 0.155 0.220
lateral corallites (pooled samplea)
- Millepora eomplunuta
terminal 1 cm. only (pooled samplea)
terminal 1 cm. only (pooled samples)
- P o n h furcata
12.16 8.08
11.22
0.273 0.169 0.188
19.70 5.40 3.92
0.200 0.107 0.060
13.80 0.188
tional to the volume, the two parameters are related by a constant which varies according to the species (Goreau and Goreau, 1960b, and unpub- lished observations). Since skeletogenesis in the scleractinian corals can take place only at the colony surface where the living tissues are localised, it follows that the calcium deposition rate per mg. N is an area dependent function, but the accretion rate, calculated in terms of the amount of skeletal CaCOa already present, is a volume dependent function. In species with strongly developed apical growth gradients the relationship of calcification to accretion will change according to whether the measure- ments are made in the terminal corallites where growth is in the axial di- rection, or in the lateral corallites where growth is in the radial direction. An example of this is seen in two adjacent regions of A. cervicornis branches where separate measurements were made on the large terminal corallite and on smaller lateral corallites two to three cm. behind the tip. In the apical polyps there is a one to one relationship between area growth and volume growth as shown by the unit slope of the regression line in FIGURE 7. In the lateral polyps 2 cm. behind, the regression coefficient is only 0.6 which means that the volume increases as the 3/5 power of the area. The difference of the two regression coefficients indicates that axial growth is about 1.7 times as fast as radial growth. In A. cervicornis rapid lengthwise growth of the terminal corallites is achieved at the expense of a hard dur- able skeleton: these polyps are so poorly mineralised that they can easily

0.50 - 1. Terminal corallites 0
-z 0.40 7
P CI 0.30 C
E f 0.20
s V C .- v
- 2.
-
-
5 0.03 9
1 2 3 4 - crn
I I . I & I I I

158 Annals New York Academy of Sciences
DISTANCE FROM TIP OF BRANCH, CM.
FIGURE 8A. The organic nitrogen content of A. cerviconzis branches as a function of the distance in centimeters from the apical corallites. The data are from four separate colonies collected from different depths and zones of a reef. One cm. long sections were sawed out of the branches a t stated distances from the branch tips, all pieces from ho- mologous sites in other branches were pooled, the number of such samples is indicated alongside each of the pointe in the graphs. The per cent N decreases with increasing
continued, bottom of oppoeite page

Goreau : Calcium Carbonate Deposition
Deposition
9.4 8.5
12.09
12.16 8.08
11.22
159
Accretion
0.184 0.160 0.209
0.273 0.169 0.188
Under the conditions of our experiments, the primary carbon fixation rates of hermatypic corals are in the =me range as many Chlorophyta, and greater than Rhodophyta belonging to the massive genera Litho- thamnium and Goniolithon. The rates of photosynthesis of the corals are summarised in TABLE 7, both as organic carbon deposition rates per mg. N, and as the per cent increment of organic carbon per hr., but it should be emphasized that all these values are given in terms of the whole coral- zooxanthella association, not the coral alone. Rough estimates suggest that primary productivity of the zooxanthellae in corals may be two or three times as high per unit of nitrogen as that of Padina and Liagora, but this has not yet been determined on an animal-free basis.
TMLE 7 CALCIFICATION, PHOTOSYNTHESIS, AND CHLOROPHYLL A CONTENT
I N APICAL AND LATERAL CORALLITES OF Acropora Cervicornia
Apical corallites (pooled samples)
Lateral corallites (pooled samples)
Calcification
Deposition
118.48 134.34 63.59
77.26 78.42 34.01
Accretion
0.200 0.220 0.180
0.102 0.118 0.059
Photosynthesis Average Chlorophyll u
content* in pgm./mg.N
49.7
107.8
Deposition rates in pgm. C or Ca/mg. N/hr. Accretion rates in per cent increment /hr. Chlorophyll a content in pgm. /mg. N. *The chlorophyll a values were not determined on the same samples aa those used for
the calcification and photosynthesis measurements. All the specimens were, however, collected in the same locality and at the same depth, and were taken from colonies of the same sire.
distauce from the branch tips, the changes being west marked in the first three c111. This effect is the result of the inoreasing amount of CaCOs underlying each unit area of tissue aa the branch widens below the tip. The curves of all the different colonies tested are essentially parallel, but the individual colonies showed well defined and consistent differences in the per cent N, for example, the corals from very shallow water had a significantly higher N content than those from a depth of ten meters.
Comparison of xanthellar chlorophyll concentrations per mg. N in terminal, subterminal and lateral corallitea of A . cervicornis. The graphs show that the pigment concentrations/mg. N are from three to ten times higher in the lateral corallites than in the apical ones. This represents an absolute increase in the amount of pigment per unit area of living polypary tissue mostly due to the greater concentration of zoo- xanthellae in the lateral corallitea.
FIGURE 8B.

160 Annals New York Academy of Sciences
With the exception of low values in M . complanuta due to accidental shading in twoof the runs, the photosynthetic rates observed in these corals were surprisingly uniform despite the great inherent differences of their calcification rates. This is especially well shown by P. porites and A . cervicornis which had approximately similar rates of photosynthesis yet very divergent rates of calcification.
Control of mineralisation rates in corals by photosynthesis is implicit in the high light : dark ratios of the deposition process. Nevertheless, localised differences in calcium uptake such as in A . cervicornis are not entirely due to photosynthesis as shown by the fact that calcification gradients are maintained in total darkness (see TABLE 5) which indicates regulation of skeletogenesis by factors other than xanthellar photosynthesis.
Changes of the chlorophyll almg. N in A . cervicornis branches were not accompanied by parallel changes in photosynthesis and calcification under the conditions of our experiments. The data in TABLE 7 and FIGURE 8B show that the fast calcifying apical polyps contain only 0.1 to 0.3 as much chlorophyll/mg. N as the more slowly calcifying lateral corallites, but the primary productivity of the two is about the same. There are several explanations for the lack of proportionality between photosynthesis and pigment content in these corals. The most probable cause is that crowd- ing of zooxanthellae in the lateral corallites is such that only the top layer receives full illumination, and is capable of maximum photosynthesis; the rest are shaded to various degrees depending on their distance from the surface. Furthermore, the apical polyps, though they contain fewer zooxanthellae and less chlorophyll/mg. N than the lateral corallites, are so located that they receive light from all directions, whereas the sides of the branches are always to some extent shaded.
CONCLUDING REMARKS : RELATIONSHIP OF CALCIFICATION TO PHOTOSYNTHESIS AS A FACTOR GOVERNING POPULATION COMPOSITION AND GROWTH FORM OF THE HERMATYPIC
BIOTA IN THE REEF
The following discussion will examine the relationships of calcification and photosynthesis in coralline algae and corals with respect to vertical distribution, colony shapes, and the role these organisms play in the dn- position of reef sedimenta.
TABLE 8 which sumniarises our observations on species number versus depth for calcareous algae and corals in Jamaican reefs, shows that at a depth of 60 meters the species variety of the Rhodophyta is reduced by about 90 per cent, Chlorophyta by about 60 per cent, and reef corals by about 75 per cent.

-~
Class
~- -~
Coelenterata Hermatypic, Scleractinia, & Hydrocora
Algae Rhodophy ta Chlorophyta Halirneda on1
__.__
Goreau : Calcium Carbonate Deposition
TABLE 8 SPECIES NUMBER Versus DEPTH OF CORALS AND CORALLINE ALGAE IN JAMAICAN REEFS
Total s p e c i e 8
number*
40
29 27 11
Mean light :dad ratio of
calcificationt
9.0
1.5 1.4 1.14f
Number of speciee at
161
Per cent reduction at 60 m.
75
90 60 36
*C’., Gore:tu (1959a) and unpublished obeervations. tCf., (hreuu and Goreau (1959). $Average L/I) ratio of X specks (TABLE 2).
The fast calcifying red algae with high rates of photosynthesis, e.g., Liagora, Galaxaura, Amphiroa, and Jania are all common at depths less than 20 meters and scarce below 30 meters. The genera Lithothamnium and Peyssonnelia occur in all zones of the reef and are the only calcareous Rhodophyta we have so far found at 60 meters: our data show that these are also among the slowest of the primary producers (see TABLE 4).
Seven of the eleven calcareous Chlorophyta found at the 60-meter level belong to the genus Halimeda, a group which is outstandingly suc- cessful in coloiiising bottom habitats where ambient light intensities are from 10 to 200 times less than at the surface. At 60 meters they are a dominant floral component, often achieving a standing crop approaching that of shallow water Halimedu communities. Unlike Gilmartin (1960) at Eniwetok Atoll, we have observed in Jamaica distinct deep water Halimeda associations, characterised by two species and one variety which occur abundantly only below 30 meters and are rare above that. Some of the Halimedas found at the 60-meter level were investigated by our Wa/14C method, e.g., H . tuna, H . gracilis var. opuntioides, and H . discoidea. How- ever these are also common in all depth zones of the reef habitat, and our experiments were carried out on the shallow water forms.
The Halimedas are exceptional among the calcareous Chlorophyta in that they tend to be more heavily calcified in deep than in shallow water. Although this may be due to a decreased amount of organic matter rather than an increased calcification, the overall effect is the opposite of what is
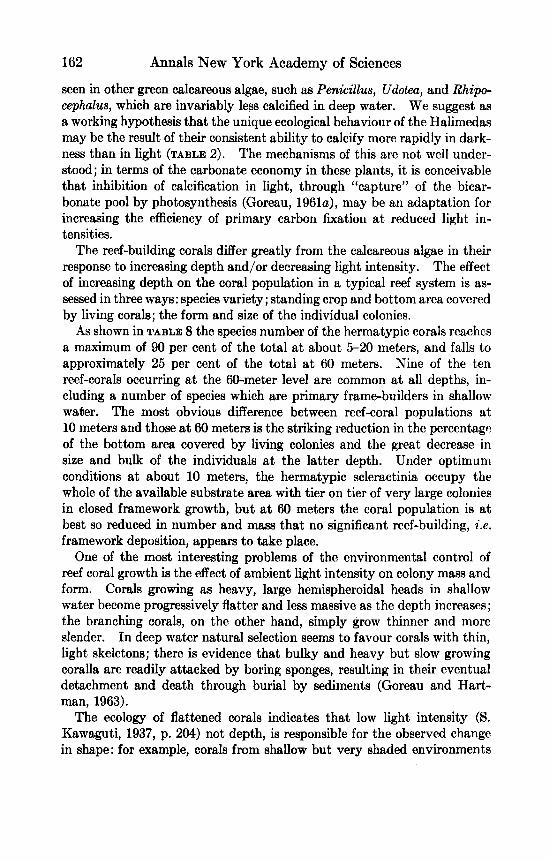
162 Annals New York Academy of Sciences
seen in other green calcareous algae, such as Penicillus, Udotea, and Rhipo- cephalus, which are invariably less calcified in deep water. We suggest as a working hypothesis that the unique ecological behaviour of the Halimedas may be the result of their consistent ability to calcify more rapidly in dark- ness than in light (TABLE 2). The mechanisms of this are not well under- stood; in terms of the carbonate economy in these plants, it is conceivable that inhibition of calcification in light, through “capture” of the bicar- bonate pool by photosynthesis (Goreau, 1 9 6 1 ~ ) ~ may be an adaptation for increasing the efficiency of primary carbon fixation at reduced light in- tensities.
The reef-building corals differ greatly from the calcareous algae in their response to increasing depth and/or decreasing light intensity. The effect of increasing depth on the coral population in a typical reef system is as- sessed in three ways: species variety; standing crop and bottom area covered by living corals; the form and size of the individual colonies.
As shown in TABLE 8 the species number of the hermatypic corals reaches a maximum of 90 per cent of the total at about 5-20 meters, and falls to approximately 25 per cent of the total at 60 meters. Nine of the ten reef-corals occurring a t the 60-meter level are common at all depths, in- cluding a number of species which are primary frame-builders in shallow water. The most obvious difference between reef-coral populations at 10 meters and those at 60 meters is the striking reduction in the percentage of the bottom area covered by living colonies and the great decrease in size and bulk of the individuals at the latter depth. Under optimum conditions a t about 10 meters, the hermatypic scleractinia occupy the whole of the available substrate area with tier on tier of very large colonies in closed framework growth, but at 60 meters the coral population is at best so reduced in number and mass that no significant reef-building, i .e. framework deposition, appears to take place.
One of the most interesting problems of the environmental control of reef coral growth is the effect of ambient light intensity on colony mass and form. Corals growing as heavy, large hemispheroidal heads in shallow water become progressively flatter and less massive as the depth increases; the branching corals, on the other hand, simply grow thinner and more slender. In deep water natural selection seems to favour corals with thin, light skeletons; there is evidence that bulky and heavy but slow growing coralla are readily attacked by boring sponges, resulting in their eventual detachment and death through burial by sediments (Goreau and Hart- man, 1963).
The ecology of flattened corals indicates that low light intensity (S. Kawaguti, 1937, p. 204) not depth, is responsible for the observed change in shape: for example, corals from shallow but very shaded environments

Goreau : Calcium Carbonate Deposition 163
are indistinguishable from colonies of the same species growing on open bottom at 50 meters depth. The massive to flat transition often occurs in different parts of the same individual; for example, in large Monhstrea annulam's, the upper well illuminated regions grow as massive rounded protuberances, but on the shaded sides the coral becomes flattened so that it resembles overlapping roof shingles (Goreau, 19594.
The flattening response of reef corals is due to a progressive change of a three-dimensional growth plan to a two dimensional one. A simple cal- culation demonstrates some consequences of such a transformation by comparing two corals with identical radii of 10 cm.: one a hemispheroid and the other a conoid disc with a central thickness of 3 cm. (FIQURE 9). As shown in TABLE 9 the transformation of a hemispheroid to a discoid growth form decreases the colony weight by 85 per cent, while the living surface area is only decreased by 50 per cent. Most important, the amount CaC03 per unit area of polypal tissue is decreased by 70 per cent.
The mechanism of flattening has not been investigated: the change of a three-dimensional to a two-dimensional symmetry implies the development of a strong peripheral growth gradient in the latter, whereas none exists in the former. In its simplest terms, flattening in corals reduces the
A B
'-+- fn c 1 0 c m -b +10cm + - = Living polyps on coral surface
FIGURE 9. Outline sketch comparing the shapes of the two coral colonies described in TABLE 9. Colony A hae the flattened configuration typical of corals growing in deep or poorly illuminated reef habitats, and its base tapers to a thin weak stalk which is not protected by living polyps. Colony B shows the hemispheroidal shallow water ecotype found in the well-lit surface zones of the reef. In this variant, the living polyps extend down to the base to form a thick, strong attachment. The dimensions correspond to those given in TABIZ 9 and are given in centimeters.
The individuals shown are of the same species.

164 Annals New York Academy of Sciences TABLE 9
WITH FLATTENING OF REEF CORALS IJNDER CONDITIONS OF REDUCED LIQHT INTENSITY
CHANGES IN AREA, IrOLUME, AND M A R S ASSWIATEU
Parameter
Radius Height A m Volume Weight* Weight/cm.'
A Flat
colony
10 cm. 3 cm.
314 cm.' 314 690 gm.
2.2 gm. cm.-*
B Hemispheroidal
colony
10 cm. 10 cm.
629 cm.* 2095 ~ m . ~ 4.603 gm.
7.3 gm. cm.4
Ratio B/A
1 .o 3.33 2.0 6.7 6.7 3.3
*Calculated on the basis that the aragonitic COI lum haa a specific gravity of 2.93, and that 25 per cent of the colony volume is empty space. The tissue weight haa been neglected.
skeletal mass far more than the polypal surface area. An allometric trans- formation of this kind may be explained on the basis that increase in size and the regulation of shape in reef-corals do not go hand in hand but are the result of two entirely different types of growth, one of which is strongly influenced by the ambient light intensity while the other is not. Calcifica- tion is the only growth function in corals that is known to be under control of the light intensity, and this in turn depends on the depth; the trans- mittance to 60 meters being only 3 to 5 per cent of the light flux at the surface. It is thus reasonable to propose that CaC03 deposition into the skeleton by corals, ie., growth in bulk and volume, will decrease in pro- portion to the fall of the ambient light intensity with depth. By itself, however, this cannot account for the flattening phenomenon since an overall decrease in the rate of skeleton accretion will merely reduce the size of the corals without affecting their shape. To explain the flattening, it is neces- sary that the surface area occupied by the living polyps be decreased much less than the skeletal volume of the, coral. This can occur only if the proliferation and growth of new tissue is controlled by factors other than the ambient light intensity, ie., the food supply. Scleractinia are carniv- orous zooplankton feeders (Yonge, 1940) and in general there is sufficient plankton in the euphotic zone for this not to become a limiting factor in coral growth. During our underwater studies in Jamaica, we have ob- served as much zooplankton at the base of the reef as at the surface, and

Goreau : Calcium Carbonate Deposition 165
thcre is no reason to believe that deep corals are less wcll fed than shallow ones. As long as the food supply is adequate, tJissutl growth will procrcrl normally, even when the calcification rate is very low. Under such con- ditions, however, tissue growth is faster than skeletal accretion with the result that the colony must spread out, becoming much thinner and flatter. This adaptation ceases to become effective as soon as the calcification rate falls so low, as it must at greater depths, that growth of the colony cannot keep ahead of more rapidly growing sessile organisms such as Gorgonia and sponges, which find the struggling and undersized scleractinian a ready made base for attachment that is soon hemmed in and overwhelmed.
We have not observed changes of a similar nature in any of the cal- careous algae, although occasional individuals of Penicillus and Halimeda, growing in very shaded environments, tend to become elongated or to have enlarged segments. The failure of the coralline algae to show analogous changes in growth geometry with depth may hc due to the fact that nutri- tion and growth of the plant thallus depend entirely on photosynthesis and light intensity, whereas the calcification process does not.
The effect of flattening on the capacity of corals to build a mechanically resistant reef framework must be briefly considered. In Jamaica, active formation of consolidated framework by corals and algae is limited to depths less than 25 meters, despite the fact that a varied reef coral fauna is found to at least 50 meters (Goreau, 1961~). Since reef formation depends on the ability of corals to build up large, tough, and heavy colonies, the progressive flattening and slower growth rate of corals in deep or poorly illuminated environments will inevitably result in smaller and much lighter coralla which are not massive enough to serve as building blocks for a true framework.
ACKNOWLEDGMENTS
The investigations reported here were supported by grants G-14589 from the National Science Foundation, and contracts NR 104400 and NR 104-556 of the U. S. Navy Office of Naval Research. The underwater work would have been impossible without the steady assistance of E. A. Graham, D. L. Fraser, S. K. Amman, D. A. Catt, T. A. Smith, R. L. Walker, and J. C. Lang, during diving operations in 1961 and 1962. For laboratory assistance the writer gratefully acknowledges the help of J. A. I'igueroa, J. C. Lang, and C. Spence. For help with identifications of calcareous algae thanks are due to E. A. Graham, L. Green, R. P. Bengry, W. R. Taylor, and L. H. Colinveaux, but the final responsibility for the identifications rest with the author. Grateful thanks are also due to N. I. Goreau, G. C. Lalor, and C. von Holt for their help and advice in the

166 Annals New York Academy of Sciences
analytical phases of this work. For discussion and criticism of parts of this paper, the author is much indebted to K. E. Chave, F. R. Fosberg and E. G. Purdy.
REFERENCES
ALLEN, J. R. L. & J. W. WELLEI. 1962. Holocene coral banks and subsidence in the
BLINKS, L. R. 1951. Physiology and biochemistry of algae. In Manual of Phycology :
CHAVE, K. E. 1954. Aspects of the biogeochemistry of magnesium. I. Calcareous
GARDINER, J. S. 1903. The Fauna and Geography of the Maldive and Laccadive
GARDINER, J. S. 1931. Coral Reefs and Atolls. Macmillan. London. GILMARTIN, M. 1960. The ecological distribution of the deep water algae of Eniwetok
Atoll. Ecology. 41: 210-221. GOREAU, T. F. 1959a. The ecology of Jamaican coral reefs. I. Species composition
and zonation. Ecology. 40: 67-90. GOREAU, T. F. 1959b. The physiology of skeleton formation in corals under different
conditions. Biol. Bull. 116: 59-75. GOREAU, T. F. 1961a. Problems of growth and calcium deposition in reef corals.
Endeavour. 20: 32-39. GOREAU, T. F. 1961b. On the relation of calcification to primary productivity in reef
building organisms. I n The Biology of Hydra: 269-285. H. M. Lenhoff and W. F. Loomis, Eds. University of Miami Press. Miami, Fla.
GOREAU, T. F. 1961c. The structure of the Jamaican reef communities. Geological aspects. Final Progress Report, O.N.R. contract Nonr(6)4034O(NR 104-556).
GOREAU, T. F. & V. T. BOWEN. 1955. Calcium uptake by coral. Science. 122: 1188-1189.
GOREAU, T. F. & N. I. GOREAU. The physiology of skeleton formation in corals. 11. Calcium deposition by hermatypic corals under various conditions in the reef. Biol. Bull. 117: 2:Q-250.
GOREAU, T. F. & N. 1. GOREAU. The phyaiology of skeleton formation in corals. Calcification rate aa a function of colony weight and total nitrogen content in the reef coral Municinu areolata (Linnaeua).
GOREAU, T. F. & N. I. GOREAU. 19606. The phyaiology of skeleton formation in corals. IV. On isotopic equilibrium exchangea of calcium between corallum and environment in living and dead reef-building corals.
GOREAU, T. F. AND W. D. HARTMAN. 1963. Boring sponges aa controlling factors in the remodelling of coral reefs. In Mechanisms of Hard Tissue Destruction. R. F. Sognnaw, Ed. In press.
HYMAN, L. H. 1941. The Invertebrates. Vol. I. Protozoa through Ctenophora. McGraw-Hill. New York.
HYMAN, L. H. 1955. The Invertebrates. Vol. IV. Echinodermata, the coelomate Bilateria. McGraw-Hill. New York.
HYMAN, L. H. 1959. The Invertebrates. Vol. V. Smaller Coelomate Groups. McGraw-Hill. New York.
KAWAOUTI, S. 1937. On the physiology of reef corals. 11. The effect of light on colour and form of reef corals.
KAWAGUTI, S. & D. SAKUMOTO. 1949. The effect of light on the calcium deposition of corals.
KORNICKER, L. S. & D. W. BOYD. 1962. Shallow water geology and environmenta of Alacran reef complex, Campeche Bank, Mexico. Am. Assoc. Petrol-Geol. Bull.
Niger River delta. J. Geol. 70: 381-397.
263-291. G. M. Smith, Ed. Chronica Botanica. Waltham, Mass.
marine organisms. J. Geol. 62: 266-2&3.
Archipelagoes. Cambridge, England. 2 vol.
1959.
1960~. 111.
Biol. Bull. 118: 419-429.
Biol. Bull. 119: 416-427.
Palm Trop. Sta. Stud. 2: 199-208.
Bull. Oceanogr. Inst. Taiwan. 4: 65-70.
46: 640-673.

Goreau : Calcium Carbonate Deposition 167 LADD, H. S. & J. I. TRACEY. 1949. The problem of coral reefs. Scientific Monthly.
LADD, H. S. 1961. Reef building. Science. 134: 703-715. LOWENSTAM, H. A. 1950. Niagaran reefs of the Great Lakes area. J. Geol. 68: 430-
487. LOWENETAM, H. A. 1957. Niagaran reefs in the Great Lakes area. In Treatise in
Marine Ecology and Paleoecology. Volume 2: 215-248. H. S. Ladd, Ed. Geol. SOC. America, Memoir 67.
ODUM, H. T. 1957~. Strontium in natural waters. Publ. Inst. Mar. Sci. (Texas).
ODUM, H. T. 19573. Biogeochemical deposition of strontium. Publ. Inst. Mar. Sci.
ODUM, H. T., W. MCCONNELL & W. ABBOTT. The chlorophyll a of communi-
PAASCHE, E. 1962. Coccolith formation. Nature. 193: 1094-10’35. REVELLE, R. & R. W. FAIRBRIDOE. 1957. Carbonates and carbon dioxide. In
Treatise on Mbrine Ecology and Palaeoecology 1: 2?9-296. J. W. Hedgepeth, Ed. Geol. SOC. America, Memoir 67.
RICHARDS, F. A,, WITH T. G. THOMPSON. 1952. The estimation and characteris tion of plankton populatisns by pigment analyses. 11. A spectrophotometric metliod for the estimation of plankton pigment. J. Mar. Research. II: 156-17’2.
SETCHELL, W. A. A botanical view of coral reefs, especially those of the Indu- Pacific region. Proc. 3rd Pan-Par. Sci. Congress. Tokyo. 2: 1837-1843.
SILVA, P. C. 1962. Classification of algae. Appendiz A. In Physiology and Bio- chemistry of Algae. p. 827-837. It. A. Lewin, Ed. Academic Press. New York.
TAYLOR, W. R. Marine algae of the eastern tropical and subtropical coasts of the Americas. The University of Michigan Press. Ann Arbor, Mich.
TEICHERT, C. 1958. Cold and deep-water coral banks. Am. Assoc. Petrol. Geol. Bull. 42: 1064-1082.
TRACEY, J. I., H. S. LADD & J. E. HOFFMEISTER. 1948. Reefs of Bikini, Marshall Islands.
V.4N SLYKE, D. D. & J. FOLCH. 1940. Manometric carbon determination. J. Biol. Chem. 1S6: 509.
VAUQHAN, T. W. & J. W. WELLS. Revision of the suborders, families and genera of the Scleractinia. Geol. SOC. Am. Special Paper. 44: 1-363.
YONQE, C. M. 1940. The biology of reef building corals. Brit. Mus. (N.H.) Great Barrier Reef. Exped. 1928-1929.
69: 1-8.
4: 22-37.
(Texas). 4: 38-114.
ties. 1958.
Publ. Inst. Mar. Sci. (Texas). 6: 65-96.
1928.
1960.
Bull. Geol. SOC. Am. 60: 861-878.
1943.
Sci. Reports. 1: 353-361.