ca chorus™ for db2 database management chorus 03 0 00-enu...dba command manager for db2 (see page...
TRANSCRIPT
User Guide Version 03.0.00, Fourth Edition
CA Chorus™ for DB2 Database Management
This Documentation, which includes embedded help systems and electronically distributed materials, (hereinafter referred to as the “Documentation”) is for your informational purposes only and is subject to change or withdrawal by CA at any time. This Documentation is proprietary information of CA and may not be copied, transferred, reproduced, disclosed, modified or duplicated, in whole or in part, without the prior written consent of CA.
If you are a licensed user of the software product(s) addressed in the Documentation, you may print or otherwise make available a reasonable number of copies of the Documentation for internal use by you and your employees in connection with that software, provided that all CA copyright notices and legends are affixed to each reproduced copy.
The right to print or otherwise make available copies of the Documentation is limited to the period during which the applicable license for such software remains in full force and effect. Should the license terminate for any reason, it is your responsibility to certify in writing to CA that all copies and partial copies of the Documentation have been returned to CA or destroyed.
TO THE EXTENT PERMITTED BY APPLICABLE LAW, CA PROVIDES THIS DOCUMENTATION “AS IS” WITHOUT WARRANTY OF ANY KIND, INCLUDING WITHOUT LIMITATION, ANY IMPLIED WARRANTIES OF MERCHANTABILITY, FITNESS FOR A PARTICULAR PURPOSE, OR NONINFRINGEMENT. IN NO EVENT WILL CA BE LIABLE TO YOU OR ANY THIRD PARTY FOR ANY LOSS OR DAMAGE, DIRECT OR INDIRECT, FROM THE USE OF THIS DOCUMENTATION, INCLUDING WITHOUT LIMITATION, LOST PROFITS, LOST INVESTMENT, BUSINESS INTERRUPTION, GOODWILL, OR LOST DATA, EVEN IF CA IS EXPRESSLY ADVISED IN ADVANCE OF THE POSSIBILITY OF SUCH LOSS OR DAMAGE.
The use of any software product referenced in the Documentation is governed by the applicable license agreement and such license agreement is not modified in any way by the terms of this notice.
The manufacturer of this Documentation is CA.
Provided with “Restricted Rights.” Use, duplication or disclosure by the United States Government is subject to the restrictions set forth in FAR Sections 12.212, 52.227-14, and 52.227-19(c)(1) - (2) and DFARS Section 252.227-7014(b)(3), as applicable, or their successors.
Copyright © 2013 CA. All rights reserved. All trademarks, trade names, service marks, and logos referenced herein belong to their respective companies.
CA Technologies Product References
This document references the following CA Technologies products:
■ CA Chorus™
■ CA Chorus™ Software Manager (CA CSM)
■ CA Chorus™ for DB2 Database Management (CA Chorus for DB2 Database Management)
■ CA Detector® for DB2 for z/OS (CA Detector)
■ CA Insight™ Database Performance Monitor for DB2 for z/OS (CA Insight DPM)
■ CA Plan Analyzer® for DB2 for z/OS (CA Plan Analyzer)
■ CA RC/Migrator™ for DB2 for z/OS (CA RC/Migrator)
■ CA RC/Query for DB2 for z/OS (CA RC/Query)
■ CA RC/Update™ for DB2 for z/OS (CA RC/Update)
■ CA Subsystem Analyzer for DB2 for z/OS (CA Subsystem Analyzer)
Contact CA Technologies
Contact CA Support
For your convenience, CA Technologies provides one site where you can access the information that you need for your Home Office, Small Business, and Enterprise CA Technologies products. At http://ca.com/support, you can access the following resources:
■ Online and telephone contact information for technical assistance and customer services
■ Information about user communities and forums
■ Product and documentation downloads
■ CA Support policies and guidelines
■ Other helpful resources appropriate for your product
Providing Feedback About Product Documentation
If you have comments or questions about CA Technologies product documentation, you can send a message to [email protected].
To provide feedback about CA Technologies product documentation, complete our short customer survey which is available on the CA Support website at http://ca.com/docs.
Documentation Changes
The following documentation updates have been made in the fourth edition of this documentation:
■ Override Work Data Set Allocations—Added this topic back to the guide.
■ Removed the CDBAMDL(MJETJOB) CETJPLD platform LOADLIB troubleshooting topic—You no longer need to specify the CA Chorus load library in the OFAPROC concatenation.
The following documentation updates have been made in the third edition of this documentation:
■ Legal Notices (see page 2)—Updated to reflect public documentation legal disclaimer.
The following documentation updates have been made in the second edition of this documentation:
■ DBA Command Manager for DB2 (see page 65)—Noted that changes that are made to the SQLID and Explain Schema values are not saved in this module.
■ Issue SQL Statement or DB2 Command (see page 66)—Removed note about limiting comments to 72 characters. This is no longer a limitation in the DBA Command Manager for DB2 module.
The following documentation updates have been made since the last release of this documentation:
■ Global:
– Changed Visualizer references to Topology Viewer.
– Changed role references to discipline.
■ DB2 Knowledge Center Best Practices (see page 14)—Added a recommendation to index the CA Chorus for DB2 Database Management User Guide and CA Chorus for DB2 Database Management Site Preparation Guide.
■ CA Chorus for DB2 Database Management Log Files (see page 70)—Added information about the Object Framework Services agent (OFA) logs.
■ CA Chorus for DB2 Database Management TSF Examples (see page 62)—Created this topic from r2.5 workflows.

Contents 7
Contents
Chapter 1: Introduction 11
CA Chorus for DB2 Database Management Architecture .......................................................................................... 12
DB2 Knowledge Center Best Practices ....................................................................................................................... 14
How to Quickly Assess System Health ........................................................................................................................ 15
How to Troubleshoot in CA Chorus for DB2 Database Management ........................................................................ 16
How to Address an Issue in the Metrics Panel ........................................................................................................... 19
How to Create a Batch Reporting Job ........................................................................................................................ 20
Chapter 2: Configuring Your System for CA Chorus for DB2 Database Management 23
Set User Parameters ................................................................................................................................................... 23
Override Work Data Set Allocations ........................................................................................................................... 24
Your Active Configuration .......................................................................................................................................... 27
Chapter 3: Viewing DB2 Object Data in the Investigator 29
Object Management .................................................................................................................................................. 29
View Catalog Objects ................................................................................................................................................. 29
Storage Group ..................................................................................................................................................... 30
Database ............................................................................................................................................................. 30
Table Space ......................................................................................................................................................... 30
Table .................................................................................................................................................................... 31
Materialized Query Table .................................................................................................................................... 31
Index .................................................................................................................................................................... 31
View .................................................................................................................................................................... 31
Column ................................................................................................................................................................ 32
Synonym .............................................................................................................................................................. 32
Alias ..................................................................................................................................................................... 32
Sequence ............................................................................................................................................................. 32
Routine ................................................................................................................................................................ 33
Trigger ................................................................................................................................................................. 33
Distinct Type........................................................................................................................................................ 33
Package ............................................................................................................................................................... 33
Plans .................................................................................................................................................................... 34
Schemas .............................................................................................................................................................. 34
User ..................................................................................................................................................................... 35
Role ..................................................................................................................................................................... 35
8 User Guide
View Object Relationships .......................................................................................................................................... 36
How to Migrate DB2 Objects ...................................................................................................................................... 37
View DB2 Object Relationships in the Topology Viewer ..................................................................................... 38
Create Analysis Profiles ....................................................................................................................................... 39
Migrate DB2 Objects ........................................................................................................................................... 40
How to Manage DB2 Object Migrations .................................................................................................................... 42
View Object Migration Analysis Status ............................................................................................................... 43
View Object Migration Status ............................................................................................................................. 44
Chapter 4: Viewing DB2 Object Performance Data in the Investigator 45
Performance Management ........................................................................................................................................ 45
Application Performance Monitoring ........................................................................................................................ 46
View Application Performance Activity............................................................................................................... 47
Active Threads ..................................................................................................................................................... 47
Active Threads by Connection............................................................................................................................. 48
Current Lock Contentions ................................................................................................................................... 48
Locks Currently Held ........................................................................................................................................... 48
Plan Suspension Summary .................................................................................................................................. 48
Plans .................................................................................................................................................................... 49
Packages .............................................................................................................................................................. 49
SQL Activity ......................................................................................................................................................... 49
Dynamic SQL Activity .......................................................................................................................................... 49
SQL Errors ............................................................................................................................................................ 50
View by Keys ....................................................................................................................................................... 50
Chart Data ........................................................................................................................................................... 51
Subsystem Performance Monitoring ......................................................................................................................... 51
View Subsystem Performance Activity ............................................................................................................... 52
Active Alerts ........................................................................................................................................................ 53
Overview Snapshot ............................................................................................................................................. 53
System Parameters ............................................................................................................................................. 53
System Statistics .................................................................................................................................................. 54
DB2 Address Space Messages ............................................................................................................................. 57
Deadlock/Timeout Details ................................................................................................................................... 57
Dynamic SQL Cache ............................................................................................................................................. 58
Remote Locations................................................................................................................................................ 58
Buffer Pool List .................................................................................................................................................... 58
Group Buffer Pool List ......................................................................................................................................... 58
Group Buffer Pool Attributes .............................................................................................................................. 58
Storage Utilization ............................................................................................................................................... 59
Datasets Allocated .............................................................................................................................................. 59
Log Allocations .................................................................................................................................................... 59
Contents 9
Logging Status ..................................................................................................................................................... 59
IFI Destination Statistics ...................................................................................................................................... 59
IFCID Activity ....................................................................................................................................................... 59
History ................................................................................................................................................................. 60
Database Activity ................................................................................................................................................ 60
Table/Index Space Activity .................................................................................................................................. 60
Table Activity ....................................................................................................................................................... 60
View DB2 Object Performance Data in the Time Series Facility................................................................................. 61
CA Chorus for DB2 Database Management TSF Examples .................................................................................. 62
Chapter 5: Using the DBA Command Manager for DB2 Module 65
DBA Command Manager for DB2 ............................................................................................................................... 65
Explain an SQL Statement .......................................................................................................................................... 65
Issue SQL Statement or DB2 Command ..................................................................................................................... 66
Chapter 6: Troubleshooting 69
Information Gathering ............................................................................................................................................... 69
CA Chorus for DB2 Database Management Log Files .......................................................................................... 70
Application Performance View By Keys Xmreq Error ................................................................................................. 72
Application and Subsystem Performance History Versus Current Interval ................................................................ 73
OFA Temp Work Data Sets High-Level Qualifier ........................................................................................................ 73
Missing Security Setup for Object Migrator ............................................................................................................... 74
@DEFAULT Member of CFGFILE................................................................................................................................. 74
Custom CFGFILE Member for User ............................................................................................................................. 75
CDBAMDL(MJETJOB) CETJPLD platform LOADLIB ...................................................................................................... 76
NUM ON and the OFA Configuration Data Set ........................................................................................................... 76
No Response Received for Submitted Migration Request ......................................................................................... 77
Catalog and Performance Folders Do Not Expand ..................................................................................................... 78
Receive an Error Message in the Command Manager ............................................................................................... 78
SQL Statements are Consuming Excess CPU Time ..................................................................................................... 79
BPA0148E Message Received..................................................................................................................................... 80
ETJOF999E Error Received ......................................................................................................................................... 80
ETJBP056W Unable to Open SELECT Data Set ........................................................................................................... 81
CAEU9126E dsGroup(ssid) Not Found in dsConf(DEFAULT) ....................................................................................... 81
Appendix A: DB2 Metrics Used by the Time Series Facility 83


Chapter 1: Introduction 11
Chapter 1: Introduction
CA Chorus for DB2 Database Management Architecture
12 User Guide
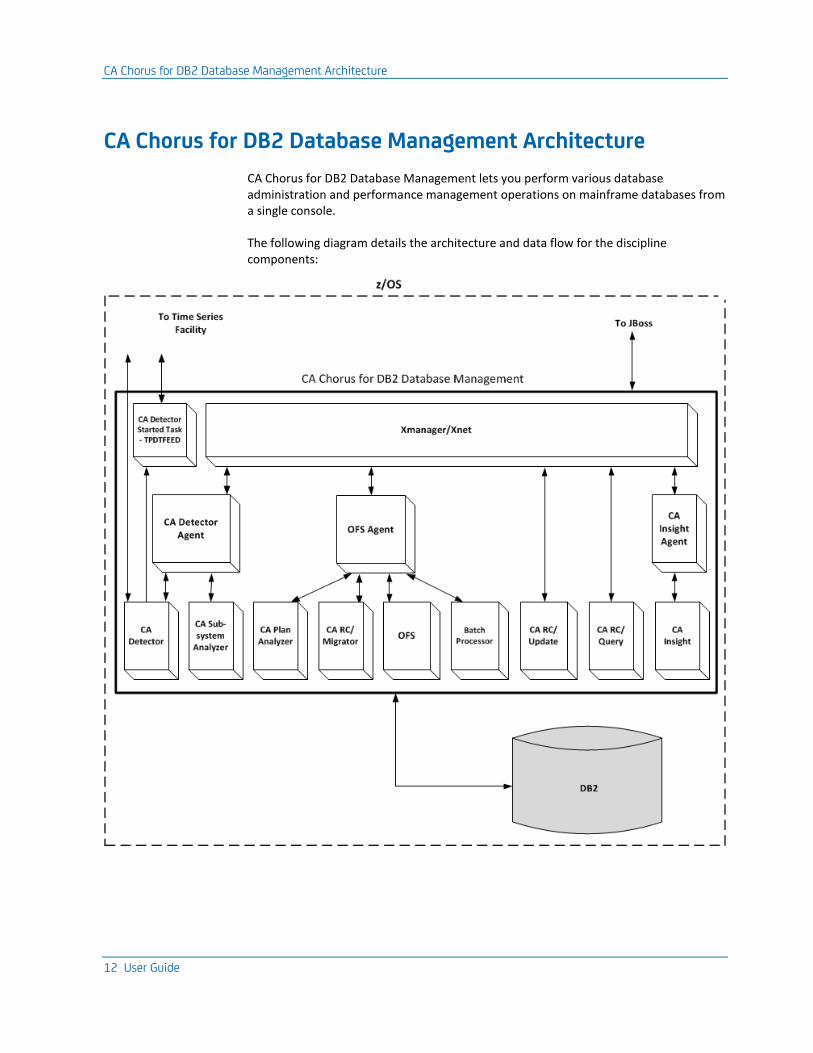
CA Chorus for DB2 Database Management Architecture
CA Chorus for DB2 Database Management lets you perform various database administration and performance management operations on mainframe databases from a single console.
The following diagram details the architecture and data flow for the discipline components:
CA Chorus for DB2 Database Management Architecture
Chapter 1: Introduction 13
The following list details the components and products that you use with this discipline:
JBoss
Hosts the CA Chorus application. JBoss is an open source Java-based application server that operates cross-platform. JBoss is usable on any operating system that supports Java.
CA Datacom/AD
Supplies the database for CA Chorus for DB2 Database Management usage.
CA Detector Started Task - TPDTFEED
Invokes the CA Detector Unload utility to gather and send DB2 performance data to TSF. This component starts only by automation, and it is not a permanent address space. This component is a short-running started task that stops after it transfers DB2 performance data to TSF.
Xmanager
Establishes and controls an execution environment for all products. Xmanager (Execution Manager) executes as a started task in its own address space by all products on a single LPAR. If you have products that are installed on multiple LPARs, repeat the customization steps on each LPAR.
Xnet
Provides a shared communications subsystem for all CA Database Management Solutions for DB2 for z/OS. Xnet (Execution Manager Networking) executes as a started task in its own address space. Xnet works with the Xmanager address space for CA Database Management Solutions for DB2 for z/OS.
CA Database Management Solutions for DB2 for z/OS
Provides the tools for you to manage your DB2 environment. CA Chorus for DB2 Database Management interfaces directly with the following products:
■ CA Detector
■ CA Insight DPM
■ CA Plan Analyzer
■ CA RC/Migrator
■ CA RC/Query
■ CA RC/Update
■ CA Subsystem Analyzer
■ General functions:
– Batch Processor
– CA Chorus DBA Services (FMID EU9/CHRDBM) (OFS agent, OFA)
DB2 Knowledge Center Best Practices
14 User Guide
Product Agents
Translates communications among CA Chorus, CA Chorus for DB2 Database Management, and CA Database Management Solutions for DB2 for z/OS products.
DB2 for z/OS
Indicates the IBM DB2 for z/OS version that you are using with CA Chorus and CA Chorus for DB2 Database Management.
DB2 Knowledge Center Best Practices
The Knowledge Center is the repository for all CA Chorus documentation. The Knowledge Center includes online help and guides from CA, user-generated documentation, and links to third-party content. Links to relevant topics appear in the Knowledge Center window when you click the online help icon or by searching. When you request online help, the search engine finds topics that are focused on the task you are performing. The engine also searches based on your location in the interface. This information appears in the Knowledge Center window and is updated whenever you refresh the window or click the online help icon.
We recommend that you add database administration-specific documentation to your Knowledge Center. For example, you could add documentation that is associated with a specific release of IBM DB2. This best practice helps ensure that your Knowledge Center includes accurate and current DB2 information.
We recommend that you add the following content to your Knowledge Center:
■ CA Mainframe Value Program reports
■ IBM DB2 Command Reference
■ IBM DB2 Reference Summary
■ IBM DB2 SQL Reference
The CA Chorus Product Guide includes the steps to add documentation to the Knowledge Center.
Note: Access to the Knowledge Center configuration is restricted. For details about defining Knowledge Center access permissions, see the CA Chorus Administration Guide. To request access, contact your Security Administrator.
We also recommend that you configure your search settings so that only CA back-end product content specific to your role appears in Knowledge Center results. Implementing this recommendation can improve the relevance of search results. For the configuration steps, see the CA Chorus Product Guide.
How to Quickly Assess System Health
Chapter 1: Introduction 15
How to Quickly Assess System Health
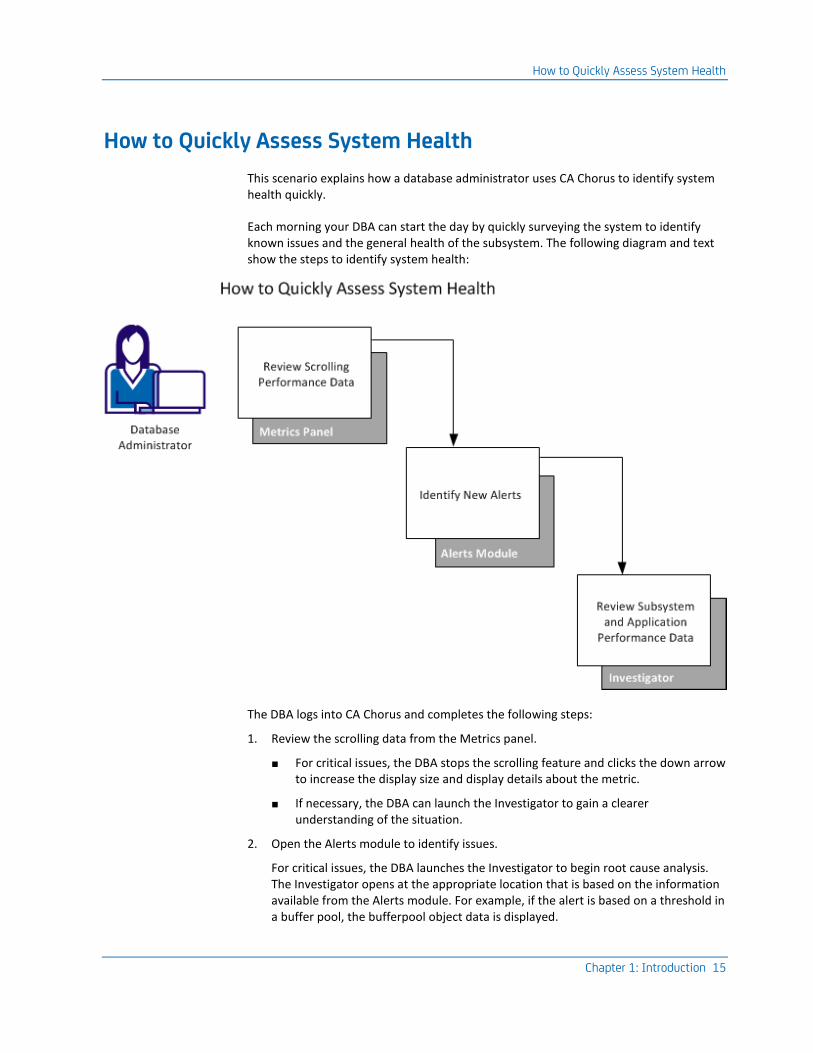
This scenario explains how a database administrator uses CA Chorus to identify system health quickly.
Each morning your DBA can start the day by quickly surveying the system to identify known issues and the general health of the subsystem. The following diagram and text show the steps to identify system health:
The DBA logs into CA Chorus and completes the following steps:
1. Review the scrolling data from the Metrics panel.
■ For critical issues, the DBA stops the scrolling feature and clicks the down arrow to increase the display size and display details about the metric.
■ If necessary, the DBA can launch the Investigator to gain a clearer understanding of the situation.
2. Open the Alerts module to identify issues.
For critical issues, the DBA launches the Investigator to begin root cause analysis. The Investigator opens at the appropriate location that is based on the information available from the Alerts module. For example, if the alert is based on a threshold in a buffer pool, the bufferpool object data is displayed.
How to Troubleshoot in CA Chorus for DB2 Database Management
16 User Guide
3. Add the Investigator module to a dashboard, click Start New Investigation, and drill down to the applicable subsystem
4. Select Overview Snapshot from the Subsystem Performance folder. This folder provides a real-time system status overview of the DB2 subsystem to help you determine at a glance the health of the subsystem.
5. Select a performance entity from the Application Performance folder. From here, highlight a critical application (plan, package, and so on) and select the details option under the Actions pane. The DBA can review these details to identify any questionable activity.
By beginning the day in this manner, the DBA quickly identifies the health of the system. Most likely, the result of this inquiry leads the DBA to the first task of the day (troubleshooting, performance tuning, and so on).
How to Troubleshoot in CA Chorus for DB2 Database Management
This scenario explains how a database administrator uses CA Chorus modules and tools to troubleshoot DB2 issues.
Your company strives to give its employees the best opportunity to succeed. As such, they have started a corporate initiative to monitor DB2 systems. To support this corporate goal, your company gathers the following metrics in a spreadsheet quarterly to confirm that they adhere to internal service-level agreements (SLAs):
■ Number of critical issues
■ Response time
■ Closure time
To help ensure that the response time and closure time do not exceed the SLA, particularly for high severity issues, each morning your DBAs review the alerts that have occurred. The alerts are generated based on thresholds set in CA Insight DPM. The Alerts module displays issues when a defined processing limit is reached or exceeded on the systems that the DBA is monitoring. The Alerts module lets DBAs monitor and investigate alerts from the workspace as they are generated. It contains all of the alerts that the DBA sees automatically based on the discipline.
How to Troubleshoot in CA Chorus for DB2 Database Management
Chapter 1: Introduction 17
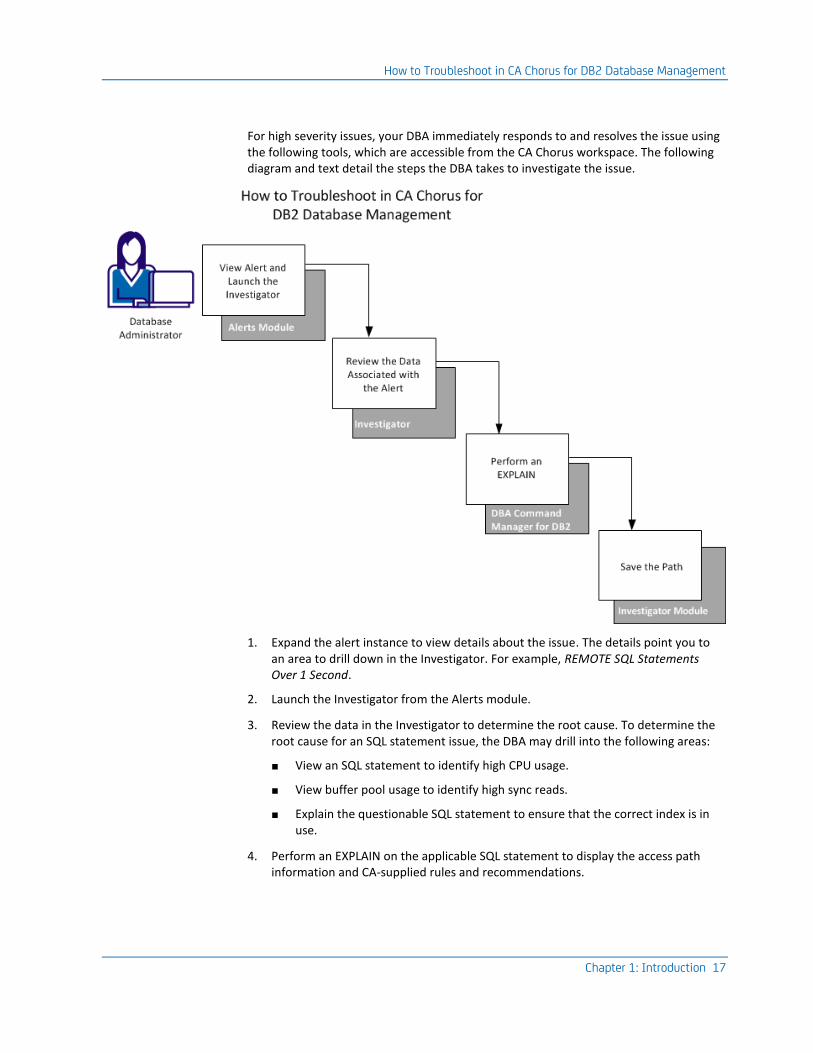
For high severity issues, your DBA immediately responds to and resolves the issue using the following tools, which are accessible from the CA Chorus workspace. The following diagram and text detail the steps the DBA takes to investigate the issue.
1. Expand the alert instance to view details about the issue. The details point you to an area to drill down in the Investigator. For example, REMOTE SQL Statements Over 1 Second.
2. Launch the Investigator from the Alerts module.
3. Review the data in the Investigator to determine the root cause. To determine the root cause for an SQL statement issue, the DBA may drill into the following areas:
■ View an SQL statement to identify high CPU usage.
■ View buffer pool usage to identify high sync reads.
■ Explain the questionable SQL statement to ensure that the correct index is in use.
4. Perform an EXPLAIN on the applicable SQL statement to display the access path information and CA-supplied rules and recommendations.
How to Troubleshoot in CA Chorus for DB2 Database Management
18 User Guide
5. To resolve an SQL statement issue, the DBA might perform one of the following tasks using DBA Command Manager for DB2 module:
■ Create a missing index entry.
■ Execute RUNSTATS with the applicable parameters.
■ Modify an index entry.
■ Modify a statement.
6. Save the path in the Investigator module so that other users can use this path to understand how you resolved the issue.
7. Add a note in the row of the root cause.
8. Confirm that the alarm is cleared in the Alerts module.
By using CA Chorus tools, a DBA can quickly and efficiently identify an issue, determine the root cause, and enter the commands to resolve it. These actions help improve their response time for DB2 database issues.
How to Address an Issue in the Metrics Panel
Chapter 1: Introduction 19
How to Address an Issue in the Metrics Panel
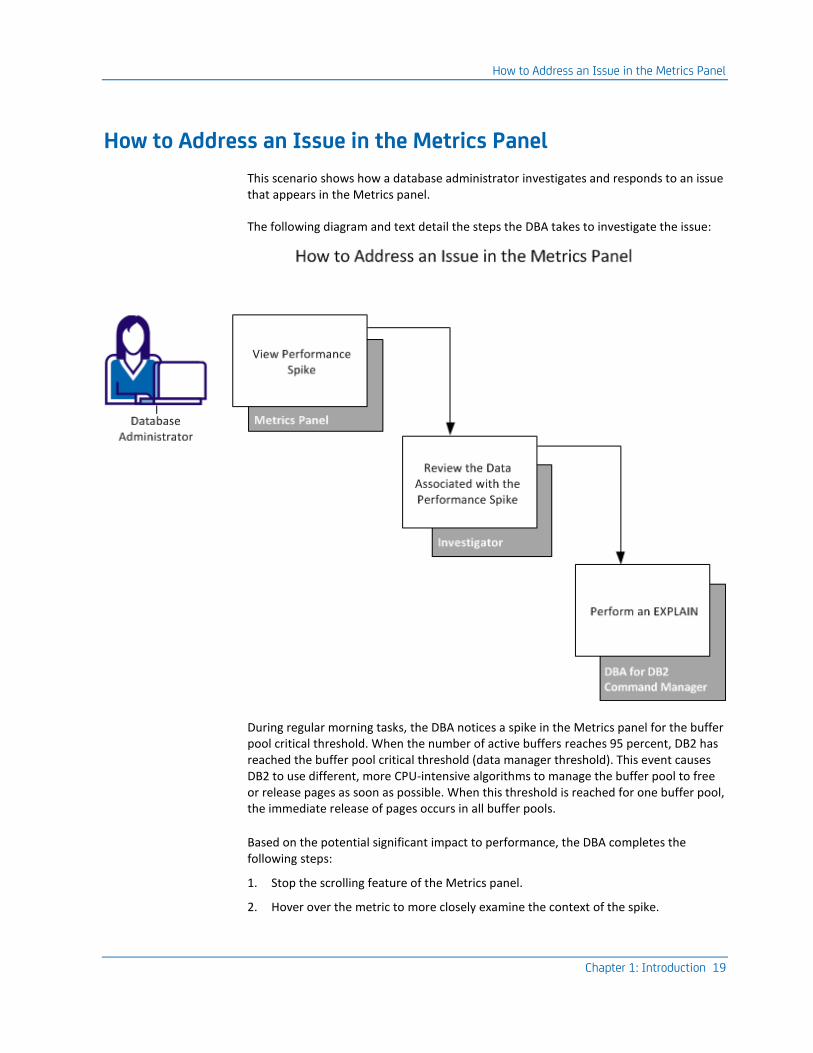
This scenario shows how a database administrator investigates and responds to an issue that appears in the Metrics panel.
The following diagram and text detail the steps the DBA takes to investigate the issue:
During regular morning tasks, the DBA notices a spike in the Metrics panel for the buffer pool critical threshold. When the number of active buffers reaches 95 percent, DB2 has reached the buffer pool critical threshold (data manager threshold). This event causes DB2 to use different, more CPU-intensive algorithms to manage the buffer pool to free or release pages as soon as possible. When this threshold is reached for one buffer pool, the immediate release of pages occurs in all buffer pools.
Based on the potential significant impact to performance, the DBA completes the following steps:
1. Stop the scrolling feature of the Metrics panel.
2. Hover over the metric to more closely examine the context of the spike.
How to Create a Batch Reporting Job
20 User Guide
3. Click the metric to view a larger graphical representation version of the metric in a dashboard.
The spike indicates that the active buffers are at 98 percent.
4. Launch the Investigator from the Metrics panel.
The Investigator opens with the tree expanded to the area in question.
5. Drill down to view specific buffer pools that are exhibiting the problem.
6. Add the DBA Command Manager for DB2 to a dashboard.
7. Execute a DB2 EXPLAIN on the SQL statement and returns the access path information from the EXPLAIN statement and CA-supplied rules and recommendations, related to the SQL submitted.
With this information, the DBA can continue troubleshooting efforts. This scenario shows one of the many ways that you can use CA Chorus tools to troubleshoot with this discipline.
How to Create a Batch Reporting Job
This scenario explains how and why a database administrator creates a batch reporting job.
As a DBA, you are involved in capacity planning. You are responsible for monitoring table spaces so that you know when more DASD is needed. The CA Chorus Investigator lets you easily search for all table spaces in a database and save the search query to a JCL batch job. This batch job, when executed, generates a report. After you create the JCL, you can run the report every week. You can also add the batch job to a job scheduler so that it executes at predetermined intervals, providing updated reports on the table space sizes.
How to Create a Batch Reporting Job
Chapter 1: Introduction 21
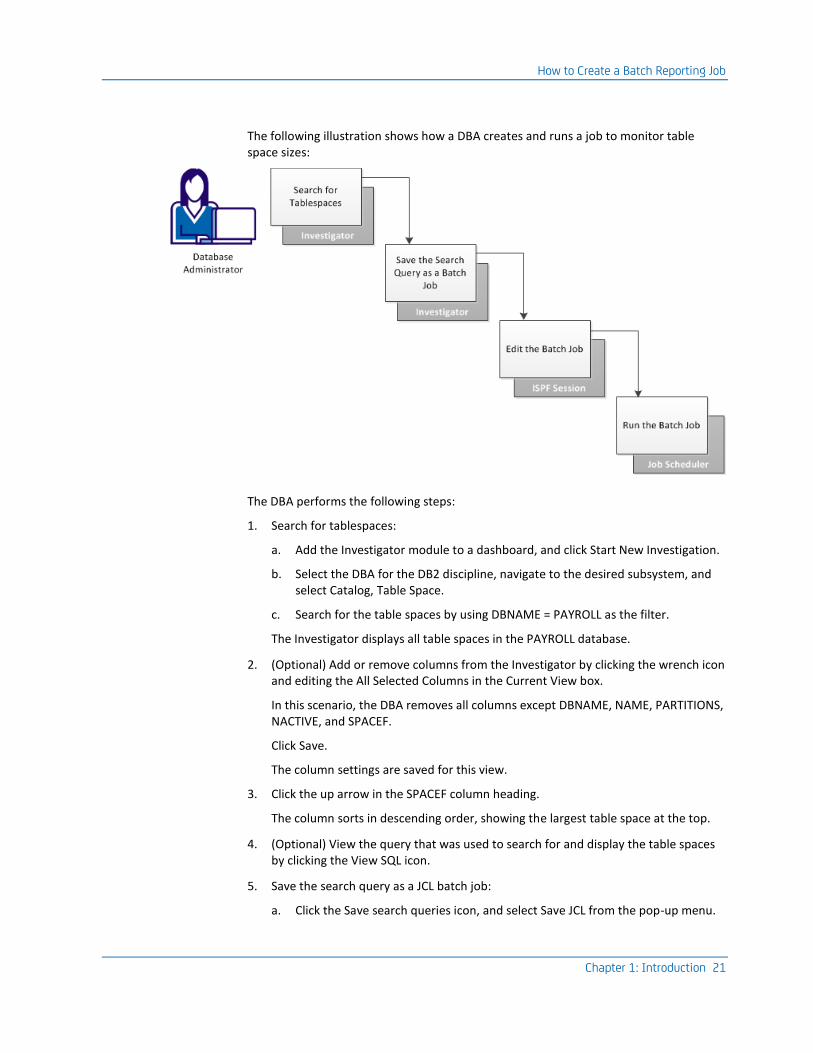
The following illustration shows how a DBA creates and runs a job to monitor table space sizes:
The DBA performs the following steps:
1. Search for tablespaces:
a. Add the Investigator module to a dashboard, and click Start New Investigation.
b. Select the DBA for the DB2 discipline, navigate to the desired subsystem, and select Catalog, Table Space.
c. Search for the table spaces by using DBNAME = PAYROLL as the filter.
The Investigator displays all table spaces in the PAYROLL database.
2. (Optional) Add or remove columns from the Investigator by clicking the wrench icon and editing the All Selected Columns in the Current View box.
In this scenario, the DBA removes all columns except DBNAME, NAME, PARTITIONS, NACTIVE, and SPACEF.
Click Save.
The column settings are saved for this view.
3. Click the up arrow in the SPACEF column heading.
The column sorts in descending order, showing the largest table space at the top.
4. (Optional) View the query that was used to search for and display the table spaces by clicking the View SQL icon.
5. Save the search query as a JCL batch job:
a. Click the Save search queries icon, and select Save JCL from the pop-up menu.
How to Create a Batch Reporting Job
22 User Guide
b. Enter the following information:
■ (Optional) The name of the data set and member containing the JCL template to apply to the job. This step is performed only when more than one template is available. The default is chorus_runtime_hlq.CETJEZTR(EZTMPL01).
■ The name of a data set and member name in which to save the JCL batch job.
■ A description of the batch job being saved (for example, "Payroll Table Spaces").
Click Save.
c. Click OK in response to the successful save message.
Note: You can also save the search query as an Investigator query by clicking the Save search queries icon and selecting Save Query. This feature saves you from creating the query each time you want to view the information in the Investigator. Also, you can export the list of table spaces that currently appear in Investigator by clicking the Export icon.
6. Open an ISPF session and display the data set member containing the saved JCL job.
7. Edit the job according to the comments provided in the JCL, and then save the JCL.
8. Add the job to a scheduler, specifying how often to execute the job and where to direct the generated report output.
By using the Investigator to create batch jobs that can be run on a schedule, you can monitor table space sizes.
Chapter 2: Configuring Your System for CA Chorus for DB2 Database Management 23
Chapter 2: Configuring Your System for CA Chorus for DB2 Database Management
Set User Parameters
You can set user-specific parameters for schema and SQL ID to control the data that appears when you work in the Investigator. These parameters are passed to the database for authorizing.
■ Schema shows related objects in the database as part of a logical group. An object is assigned to a schema when it is created.
■ SQL IDs grant different levels of access in DB2. Each SQL ID is associated with an authorization identifier, which includes various privileges to perform tasks within a database. As you work in CA Chorus for DB2 Database Management, you can set parameters to change the SQL ID to perform different tasks. The SQL ID field defaults to the last-used SQL ID. If the last-used SQL ID is not available, the SQL ID defaults to the user ID. When you are completing tasks in this discipline, you can select one of these IDs or type in a new one. To request a new SQL ID or to change an existing SQL ID, contact your DB2 system administrator.
Note: If you log out from CA Chorus when you have two or more modules open in the dashboard with different SQL IDs, the next time that you log in all modules will have the same SQL ID based on the last saved SQL ID.
Follow these steps:
1. Add the Investigator module to a dashboard, and click Start New Investigation.
2. Select DBA from the discipline drop-down list.
3. Navigate to the DBA object in the Objects tree.
The Data pane displays the data for the selected DBA object.
4. Click the icon in the Investigator toolbar.
5. Define the user parameters in the new dialog, and click Save.
Note: The SQL ID and SCHEMA default to the user ID.
If you do not want to save the parameters, clear the applicable check box.
Override Work Data Set Allocations
24 User Guide
Override Work Data Set Allocations
You can override the Object Migrator and DBA Command Manager for DB2 work data set allocations on specific systems and for specific users. To do so, edit the members in the Object Migrator configuration data set to add <SYSTEM> and <PREFIX> control statements.
Follow these steps:
1. Edit the configuration members that you want to update to add the following control statements, replacing the italicized text with valid values:
<SYSTEM:lpar>
<PREFIX>
%TSOPREFIX or %USERID or Qualifier
</PREFIX>
</SYSTEM:lpar>
<SYSTEM:lpar>
Specifies the LPAR (logical partition) or system-specific information.
lpar
Identifies the logical partition or system name. Replace with values that are valid at your site. For example, if the system name is D10A, specify <SYSTEM:D10A>.
<PREFIX>
Specifies the prefix or high-level qualifier for use with the data set. The following symbols are supported for <PREFIX>:
■ %TSOPREFIX (uses the TSO prefix from the TSO user profile table)
■ %USERID (uses the CA Chorus user ID as the high-level qualifier)
■ Qualifier (uses the specified qualifier). For example, MCOE.CHORUS01;. The semi-colon (;) is required.
If <PREFIX> is specified in the user configuration member or in the global @DEFAULT member, the user member is used first and then the global member.
If <PREFIX> is not specified, tsoprefix.userid.ETJ is used. If these values are the same for a user, userid.ETJ is used.
Note: To specify override values for a specific member on multiple systems, repeat these statements in the member as needed.
The member is updated.
2. Repeat as needed for each member.
The data set allocations are overridden.
Override Work Data Set Allocations
Chapter 2: Configuring Your System for CA Chorus for DB2 Database Management 25
Example: Override Data Set Allocations Using the TSO Prefix
This example shows how to use the TSO prefix during data set allocations:
<SYSTEM:SYS1>
<PREFIX>
%TSOPREFIX
</PREFIX>
</SYSTEM:SYS1>
If these control statements are added to the @DEFAULT member, the agent uses TSOPREFIX.ETJ.* if no user configuration member is specified. Otherwise, the agent retrieves the TSO prefix from the TSO user profile table and uses it.
Example: Override Data Set Allocations Using the CA Chorus User ID
This example shows how to use the CA Chorus user ID as the high-level qualifier during data set allocations:
<SYSTEM:SYS1>
<PREFIX>
%USERID
</PREFIX>
</SYSTEM:SYS1>
If these control statements are added to the @DEFAULT member, the agent uses the value userid.ETJ.* during run time if no user configuration member is specified.
Example: Override Data Set Allocations Using a Different High-Level Qualifier
This example shows how to use a site-specified high-level qualifier during data set allocations:
<SYSTEM:SYS1>
<PREFIX>
CHORUS.TEMP;
</PREFIX>
</SYSTEM:SYS1>
Override Work Data Set Allocations
26 User Guide
Example: Override Data Set Allocations Using the MYID.HLQ Prefix
This example shows how to use the MYID.HLQ prefix during data set allocations. To do so, add <SYSTEM> and <PREFIX> control cards to the user ID member:
<SYSTEM:SYS1>
<PREFIX>
MYID.HLQ;
</PREFIX>
</SYSTEM:SYS1>
During run time, the agent ignores the values in the @DEFAULT member and instead uses the value MYID.HLQ.ETJ*. If these control statements are added to the @DEFAULT member, the agent uses the value MYID.HLQ.ETJ* during run time if no user ID member is specified.
Example: Override Data Set Allocations without Specifying a Prefix Value
This example shows how to override data set allocations without specifying a prefix value to <SYSTEM> and <PREFIX> control cards in the user ID member:
<SYSTEM:SYS1>
<PREFIX>
</PREFIX>
</SYSTEM:SYS1>
During run time, the agent ignores the @DEFAULT member and uses the value TSOPREFIX.USERID.ETJ.* if the values for TSOPREFIX and USERID are different. If the values for TSOPREFIX and USERID are the same, the agent uses the value TSOPREFIX.ETJ.*. If these control statements are added to the @DEFAULT member, the agent uses TSOPREFIX.USERID.ETJ.* if the values for TSOPREFIX and USERID are different. If the values for TSOPREFIX and USERID are the same, the agent uses the value TSOPREFIX.ETJ.*.
Your Active Configuration
Chapter 2: Configuring Your System for CA Chorus for DB2 Database Management 27
Example: Override Data Set Allocations When the Configuration File contains the @DEFAULT and User ID Members
These examples show how to override the prefix values that are based on the originating system during data set allocations. To do so, add <SYSTEM> and <PREFIX> control cards to the @DEFAULT and user ID members:
The @DEFAULT member contains the following:
<SYSTEM:SYS1>
<PREFIX>
MCA11
</PREFIX>
</SYSTEM:SYS1>
The user ID member contains the following:
<SYSTEM:SYS2>
<PREFIX>
MCOE
</PREFIX>
</SYSTEM:SYS2>
During run time, the agent uses the value MCA11.ETJ.* for requests coming from SYS1 and the value MCOE.ETJ.* for requests coming from SYS2.
Your Active Configuration
CA Chorus offers a logical view of the DB2 subsystems that your system administrator creates. Your administrator configures your view of the DB2 subsystems by combining one or more installations of CA Database Management Solutions for DB2 for z/OS products into a logical grouping named confederation. To accomplish this task, the administrator defines connections from the CA Chorus server to the Xnet communications servers, assigning each connection to a confederation.
Note: If you are running any DB2 subsystems in Compatibility Mode (CM), override the DB2 execution mode as described in the CA Chorus Manual Configuration Guide.
Each confederation includes its own unique name. When you are working in CA Chorus, you are always working in your active confederation. The simplest configuration consists of one confederation that includes all CA Chorus-enabled DB2 product installations. Your system administrator can define more confederations with unique names, such as test and production.
Your Active Configuration
28 User Guide
To view data from a confederation, open one of the folders below the Active Configuration folder in the Investigator. The Active Configuration folder includes the following subfolders:
Active DB2 subsystems
Displays a consolidated view of the active DB2 subsystems for all configured Xnets that are defined to the CA Chorus server.
DBA Xnet agents
Displays a consolidated list of all active Xnet agents and their supported DB2 subsystems. This list includes Xnet agents from all configured Xnets identified in the CA Database Management Solutions for DB2 for z/OS configuration file (db2tools.cfg) joined with configuration file information.
Note: For conceptual and procedural information about adding or removing confederations, see the CA Chorus Manual Configuration Guide.
Chapter 3: Viewing DB2 Object Data in the Investigator 29
Chapter 3: Viewing DB2 Object Data in the Investigator
Object Management
To manage and troubleshoot your database effectively, you must be able to take an inventory of your catalog and to analyze object relationships quickly.
The Investigator helps you view and analyze critical information stored in your DB2 catalog by providing multiple work areas to help you manage your data:
■ The table view presents information about objects in rows and sortable columns that you can click to navigate to related data. The Investigator displays data in the table view by default. Each table includes a list of actions you can select to drill further into your object data. You can also display all available data for an object type, or you can filter the data based on customizable search criteria. After you retrieve specific data, you can manage this data using other modules and functionality in CA Chorus.
■ The Topology Viewer provides a pictorial overview of data, which lets you quickly identify relationships.
View Catalog Objects
Use this procedure to display DB2 catalog object data in the Investigator. An object tree is used with nodes that represent the DB2 catalog objects such as database, table space, tables, and so on. This data lets you determine status, identify an issue, and confirm changes in the DB2 database.
As you drill down into catalog tabular data, the Investigator table header includes information to indicate how you arrived at a piece of data. If you filter data, those values appear as header information in your results. Sets of actions are provided to view, navigate, and perform administrative actions like migrate and visualize.
Follow these steps:
1. Add the Investigator module to a dashboard, and click Start New Investigation.
2. Select DBA for DB2 from the discipline drop-down list.
3. Open a confederation folder.
4. Drill down to and select an object type from a catalog folder.
5. Click the Filter icon, which resides above the table on the left.
View Catalog Objects
30 User Guide
6. Filter data using the available drop-down lists.
The Investigator displays tabular data that meets your filter criteria.
7. (Optional) Select rows of data and specify the action to perform.
The applicable data appears, with header information that provides the context for the data.
Note: If multiple rows are selected, the Detail pane shows information for only the first row selected.
Storage Group
A storage group is a DB2 object that represents a named set of DASD volumes that are controlled by a specified VSAM catalog. DB2 maintains and monitors storage groups and uses them to store DB2 table spaces and index spaces. A storage group can be assigned to a database, table space, or index space. All tables that reside in a given table space use the storage group for the table space.
When you select storage groups from the Investigator, CA Chorus displays the information necessary to monitor storage group definitions, user authorizations, and object dependencies.
Database
A database is a logical collection of tables, associated indexes, and table spaces. You can grant authority to a user to access all of the data in a database as one unit. Physical data storage is not allocated to a database when it is created; instead, storage is allocated for a table space or index space within the database.
When you select databases from the Investigator, CA Chorus displays the information necessary to monitor DB2 database definitions, user authorizations, and object dependencies.
Table Space
A table space is a DB2 object consisting of VSAM Linear Data Set (LDS) that contains one or more DB2 tables. When you create a table space, you designate its database and storage group. If you do not specify a database and storage group, DB2 uses DSNDB04 as the default database and SYSDEFLT as the default storage group.
When you select table space from the Investigator, CA Chorus displays the information necessary to monitor table space definitions, access privileges, and object dependencies.

View Catalog Objects
Chapter 3: Viewing DB2 Object Data in the Investigator 31
Table
A table is a collection of rows, all having the same columns. All data in DB2, including the system catalog information, is stored in tables. When you select tables from the Investigator, CA Chorus displays the information available in the DB2 system catalog concerning DB2 tables and their related objects.
Materialized Query Table
A materialized query table (MQT) lets you improve response time for complex queries. Use the Investigator to view basic information for each MQT that matches your selection criteria. This query includes Information that is available in the DB2 system catalog concerning MQT DB2 tables.
Index
An index is a DB2 object that contains an ordered set of pointers into a table. The index is based on one or many columns in a table and can be created at any time after the target table has been created. It is more efficient to load the table after the indexes have been defined.
An index is used to improve performance and help ensure uniqueness of the columns. Every index occupies its own index space, which consists of one to several LDS VSAM data sets. The index space is always stored in the same database as the target table. When you create the index (index space), you designate its storage group or VSAM catalog for explicit VSAM definitions and buffer pool. If you do not specify a buffer pool or storage group, the index uses the storage group and buffer pool that are designated for the database. An index can be partitioned or simple.
When you select indexes from the Investigator, CA Chorus displays the information necessary to monitor index definitions and plan dependencies.
View
A view is a DB2 object that provides an alternate way of viewing a table or another view. A view can include all or some of the columns contained in the tables on which it is defined. A view can represent one or multiple tables and views. A view can be used like a table, but a view does not occupy any space because it is merely an alternate representation of the actual data. When you select views from the Investigator, CA Chorus displays the information available in the DB2 system catalog concerning DB2 views and their related objects.
View Catalog Objects
32 User Guide
Column
The Column folder lets you view how a column is defined across multiple tables and indexes, which is beneficial for implementing standard field definitions and enforcing those standards within the DB2 system. When you select columns from the Investigator, CA Chorus displays cross-reference information for all table columns defined in the DB2 system.
Synonym
A synonym provides an alternate name for a table or view. This functionality lets you refer to the DB2 object represented by the synonym without using a fully qualified name. Users create synonyms to refer to tables by names that are easier to remember than their fully qualified names. These alternate names can also be used in applications to reference tables without tying the source code to the physical object.
A table and its synonyms must exist within the same DB2 subsystem and can be accessed by their creator only. When a table is dropped, the synonyms are also dropped.
When you select synonyms from the Investigator, CA Chorus displays a list of all defined synonyms within the DB2 system and their corresponding table and view names.
Alias
An alias is an alternate name for a table or view. It is similar to a synonym, except that no special authority is required for its use. An alias is available to all users; it is the equivalent of a public synonym. When you select aliases from the Investigator, CA Chorus displays table or view data. Aliases are available to all users.
Sequence
A sequence provides recoverable, unique sequential numbers for applications and is especially useful in providing keys. In contrast to identity columns, sequences are standalone objects that applications can use to avoid concurrency and performance problems that can result when applications generate their own sequence numbers. After a sequence is defined, many users can access and increment it concurrently, including multiple DB2 members in a data sharing group.
When you select sequences from the Investigator, CA Chorus displays a user-defined stored object that generates a sequence of numeric values in ascending or descending order.
View Catalog Objects
Chapter 3: Viewing DB2 Object Data in the Investigator 33
Routine
A routine can be any user-defined function or stored procedure. When you select routines from the Investigator, CA Chorus displays the information available in the DB2 system catalog concerning DB2 user-defined functions, stored procedures, and their related objects.
Trigger
A trigger is a schema object that defines a set of actions (SQL statements) that are executed when a specific SQL data change operation occurs in a specified table. Triggers provide automatic execution of a set of SQL statements whenever a specified event occurs. These SQL statements can validate and edit database changes, read and modify the database, and invoke functions that perform operations inside and outside the database.
When you select triggers from the Investigator, CA Chorus displays cross-reference information for all triggers defined in the DB2 system.
Distinct Type
A distinct type is a user-defined data type that shares its internal representation with a built-in data type. The built-in data type is the source type. The name of a distinct type is qualified with a schema name. A distinct type is subject to the same restrictions as its source type.
Distinct type is a separate and incompatible data type because it does not automatically inherit the functions and operations of its source type. Only the functions and operators that are explicitly defined on a distinct type can be applied to it. When you select distinct types from the Investigator, CA Chorus displays cross-reference information for all user-defined data types.
Package
A package is a single-bound Database Request Module (DBRM) created using the BIND PACKAGE command. A DBRM consists of SQL statements that are separated from an application program by the precompiler.
View Catalog Objects
34 User Guide
Among the many benefits of using packages is the reduction of bind time. When a plan references packages, binding can be done at the package level, rather than at the plan level. Using a version identifier for packages is another important benefit. You can have multiple versions of the same DBRM name on a single DB2 subsystem. This functionality provides improved recovery and fallback, and the ability to store test and production data on the same DB2 subsystem. When you select packages from the Investigator, CA Chorus displays your DB2 application plans.
Plans
Application plans are the bound application programs that access DB2 data. Any application program that accesses DB2 has an application plan, which defines the relationship between the program and its DB2 data. When you select plans from the Investigator, CA Chorus displays detailed information about DB2 application plans.
Schemas
When tables, views, indexes, and aliases are created, they are given a qualified name. When the qualified name is a two-part name, the first part (an authorization ID) is a qualifier that distinguishes the object from other objects that have the same name. The second part is the name of the object. To be consistent with the ANSI/ISO SQL92 standard, the concept of qualified names is extended to refer to the qualifier as a schema name. The qualifier of user-defined distinct types (user-defined functions and triggers, and stored procedures), is a schema name.
All objects that are qualified by the same schema name can be thought of as a group of related objects. A schema name has a maximum length of 8 bytes.
You can use the Investigator to perform the following tasks:
■ List cross-reference information for all schemas defined in the DB2 system.
■ View the number of routines, distinct types, and triggers for a specific schema.
■ View distinct type information such as the owner, source, schema, metatype. length, scale, and so on.
■ View routine information such as the name, creator, owner, type, source, number of parameters, language, and so on.
■ View trigger information such as the name, owner, time, event, granularity, and so on.
■ View user authorization information such as grantee, grantor, authority level, and so on.
View Catalog Objects
Chapter 3: Viewing DB2 Object Data in the Investigator 35
User
You can use the Investigator to view the authorized users or group of users for each of the DB2 privilege classes:
■ System
■ Table
■ Database
■ Plan
■ Package
■ User/Resource
Note: Authorizations for collections are stored with the User/Resource privilege class.
You can also view the authorizations by DB2 object type versus user.
Role
A role is a user-defined database entity that groups privileges together. A role can be assigned to a primary authorization ID or can be shared by all users (PUBLIC). The role is available only in a trusted context (which enables the establishment of a trusted relationship between a DB2 database management system and an external entity). By assigning privileges to a role and then using trusted contexts to limit the circumstances in which the role can be used, you can reduce the risk of unauthorized use of privileges.
You can use the Investigator to perform the following tasks:
■ List the user-defined roles, from which you can choose a role and can see detailed information.
■ View detailed information about each specific role and its schema.
■ List the dependent objects for each role.

View Object Relationships
36 User Guide
View Object Relationships
As a DB2 database administrator, you can view object relationships for database objects (databases, tables, and so on) and application objects (plans, packages) to reveal the hierarchy of DB2 data structures. This information provides an overall view of the system. This information is necessary when assessing the effects of object deletion, alteration on dependent objects, or when planning new migrations. You can view all, child, and parent relationships.
You can customize the dependent object view by levels and include or can exclude creator IDs.
Follow these steps:
1. Add the Investigator module to a dashboard, and click Start New Investigation.
2. Select DBA from the discipline drop-down list.
3. Navigate to the DBA object in the Objects tree.
The Data pane displays the data for the selected DBA object.
4. Click the Filter icon, which resides above the table on the left.
5. Filter data using the available drop-down lists.
The Investigator displays tabular data that meets your filter criteria.
6. Select rows of data and specify the action to perform.
The applicable data appears, with header information that provides the context for the data.
How to Migrate DB2 Objects
Chapter 3: Viewing DB2 Object Data in the Investigator 37
How to Migrate DB2 Objects
Migration tasks can be complex, labor-intensive, and therefore error-prone. The Object Migrator is a wizard that automates the replication of DB2 objects, security, and data between local or remote DB2 subsystems. The Object Migrator is designed for the mainframe novice who can use the wizard to perform up to 100 jobs simultaneously.
The Object Migrator includes an analysis function to specify the parameters and changes during the migration before performing the actual migration. You can perform the analysis based on options you choose and can analyze and view the results. When an analysis shows that the migration would produce unintended results, you can customize the migration and can repeat the analysis until the migration produces the desired results.
As a database administrator (DBA), you can automate the process of migrating DB2 objects, data, and security using the Object Migrator, which guides you through the migration steps from selecting objects, creating analysis profiles, to viewing the final results.
Having an automated migration process for DB2 objects helps reduce the potential for error, simplifies database administration tasks, saves time, and increases database availability by reducing downtime. Automated migration also increases DBA productivity by freeing them to maintain DB2 environments efficiently and to manage performance issues proactively.
Note: Stored procedure migration is not supported.
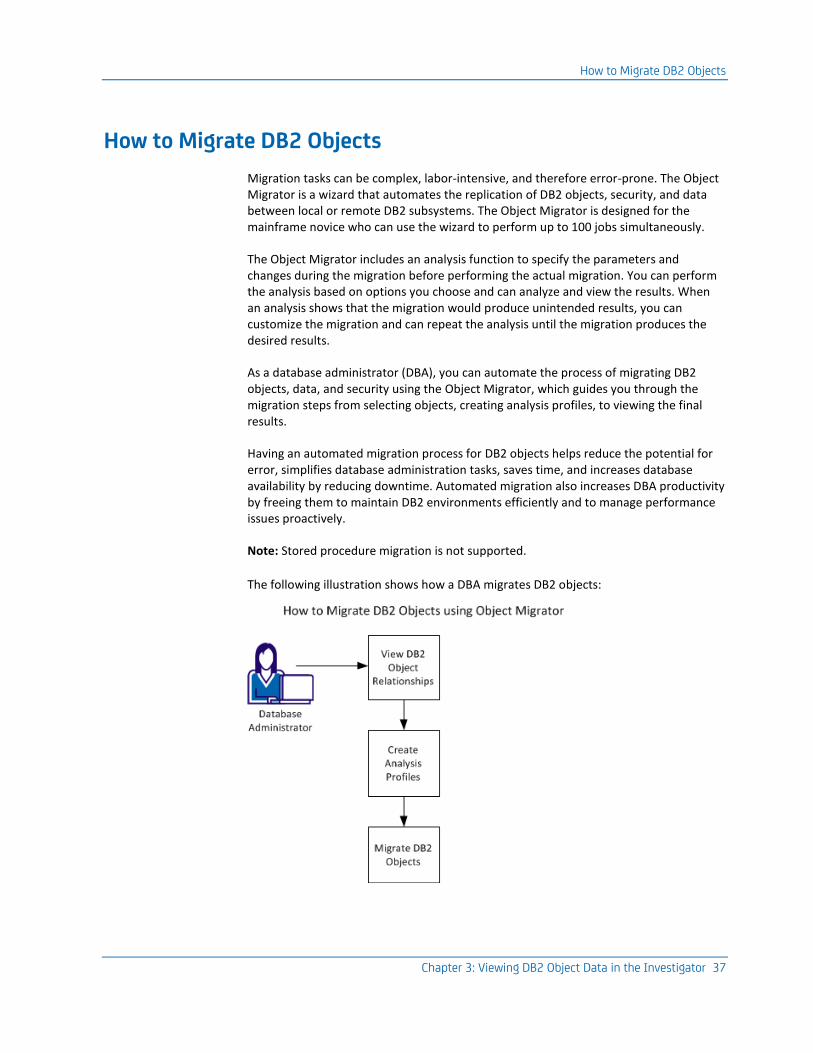
The following illustration shows how a DBA migrates DB2 objects:
How to Migrate DB2 Objects
38 User Guide
To migrate DB2 objects using Object Migrator, complete the following tasks:
1. View DB2 Object Relationships in the Topology Viewer
2. Create Analysis Profiles (see page 39)
3. Migrate DB2 objects. (see page 40)
View DB2 Object Relationships in the Topology Viewer
The Topology Viewer provides a pictorial view of your DB2 catalog objects in your system and their relationships. Labeled shapes identify each object, and lines connect objects to show parent-child relationships. Each shape symbolizes a different object type. Each object appears with text to indicate the object type and object name. For example, a table space appears as a square with the words Table Space: SYSDDF. This functionality lets you quickly see the object type and identify the object name.
This view can simplify your ability to identify relationships as you manage your data because the pictorial view can be easier to read than a tabular view. You can also drill down to isolate data within your system. The Topology Viewer provides a better understanding of the DB2 object relationships before you migrate changes and can help when you are performing the following tasks:
■ Troubleshooting
■ Taking inventory of your system
■ Identifying migration sources
You can launch the Topology Viewer for any row of object data in the catalog of the Investigator. You cannot display application performance or subsystem performance activity in the Topology Viewer.
Note: This task is not required to migrate DB2 objects. However, we recommend that you view the object relationships before proceeding with a migration. Viewing the object relationships provides a clear understanding of the relationships between the objects to help determine the possible impact of the migration before it occurs.
Example: Visualize Objects in the ADMNUSER Table
A DBA often must find the family of objects that relate to a table (that is, the database name, table space name, indexes, and views). With CA Chorus for DB2 Database Management, you can log in to a central web browser and access all systems across multiple LPARs. Not only one LPAR as is the case with the 3270. In the following example, the DBA is trying to identify the objects that are associated with the ADMNUSER table in the DA0G subsystem. This information is especially useful for troubleshooting and planning exercises.
How to Migrate DB2 Objects
Chapter 3: Viewing DB2 Object Data in the Investigator 39
Follow these steps:
1. Add the Investigator module to a dashboard, and click Start New Investigation.
2. Enter the subsystem name in the tree search area.
3. Select the Catalog to display its contents.
4. Select the Table folder.
5. Enter your filter criteria, and click Filter.
6. Select the applicable table row, and click Add to Topology Viewer in the right pane.
The Topology Viewer opens, loads, and displays the objects that are related to the ADMNUSER table. In this case, the table has two index children. Additionally, the table is part of a table space, which is part of a database and storage group.
Create Analysis Profiles
After you have viewed the DB2 object relationships for the objects that you are migrating, you can create an analysis profile. The analysis profile describes the changes that you want to occur in the target environment during the migration. The analysis options let you change the effects of the migration without having to change the migration definition. Instead of setting up analysis options each time you perform a migration, we recommend that you create analysis profiles that you can reuse and share. The analysis options generate a script or work list that describes the actions to be performed on the target system during the migration. Select the profile that you need before you submit the migration.
Analysis profiles contain predefined analysis option specifications. Save your specifications in a profile and can reuse the profile at any time.
Follow these steps:
1. Navigate in the Investigator to the DB2 catalog object (storage group, database, table space, table, index, or view) that you want to migrate, and highlight one or more rows of data.
The Actions pane opens.
Note: If you are still viewing the objects from the Topology Viewer, select the Table View icon from the main Topology Viewer toolbar. The Investigator displays the objects that were previously selected for viewing the DB2 object relationships.
2. Select Migrate under Navigation in the Actions pane.
The Object Migrator wizard opens to the Select objects page.
3. Review the object selections, and click Next.
The Specify Analysis Options dialog opens. A list of existing public and private profiles appears in the Specify Analysis Options Profile section. If needed, update existing profiles.
How to Migrate DB2 Objects
40 User Guide
4. Select New profile, select the analysis options that you want to include for the migration, and click Save.
5. Specify a name for the profile and whether others can use it (public or private).
A message indicates that the profile is saved. You can now select the profile for use when you specify analysis options during a migration.
Migrate DB2 Objects
Changes in applications often force the supporting database to change. As a DBA, you are constantly adding and modifying the data and infrastructure and moving and reorganizing data to adapt to changing business processes. Database migration replicates database objects, databases, security, and data between DB2 subsystems or within the same DB2 subsystem. During migration, you can implement changes to database objects in the new environment and can have the target environment adopt certain changes and attribute differences from the source environment.
The following list provides examples of when database objects must be migrated:
■ To use a database or objects in a database, as the basis for a new database
■ To move the test object changes into production
■ To copy a database before you implement changes or for disaster recovery purposes
The Object Migrator wizard in CA Chorus for DB2 Database Management generates scripts that analyze the migration request and then migrate objects from one DB2 environment to another. The migration can be customized by choosing which objects to include, analyzing the migration request, and specifying the global changes to apply to the target environment. The wizard lets you migrate DB2 catalog objects avoiding JCL changes and syntax errors. You can use the wizard to perform up to 100 jobs simultaneously.
Follow these steps:
1. Navigate to the DB2 catalog object that you want to migrate, and highlight one or more rows of data.
2. Select Migrate under Navigation in the Actions pane.
The Object Migrator wizard opens to the Select objects page.
How to Migrate DB2 Objects
Chapter 3: Viewing DB2 Object Data in the Investigator 41
3. Set up the migration:
a. Review the DB2 object selections, and click Next.
Note: If necessary, delete any objects that you want to exclude from the migration before you click Next.
The Specify Analysis Options dialog opens and displays the source LPAR, DB2 subsystem identifier, and SQLID associated with the selected objects.
b. Specify analysis options, and click Next.
The analysis options include a description for the migration, selection of the target system where the data is migrated, and selection of the profile you created previously. The profile selection is optional.
The Specify Migration Changes dialog opens. From this dialog, you can specify global changes on the target system by object type and attribute. These changes can help ensure that objects in the target systems adopt a specific naming convention. The changes also predefine attributes such as the segment size, data capture changes, CLOSE, buffer pool, and so on.
c. (Optional) Define object changes by object type and attribute that you want to apply globally on the target system.
The global changes help to verify that new objects on the target system adopt a naming convention. The global changes also help ensure that predefined attributes are applied (such as the SEGSIZE, data capture changes, CLOSE, buffer pool, and so on).
4. Submit the migration for analysis:
a. Click Submit.
The migration is submitted for analysis and the View Analysis Status dialog opens. This dialog provides the submitted analysis statement status.
b. View the status and information about the current analysis requests:
a. When the status changes to Completed or Error, click Next.
The analysis produces migration control statements to perform the migration and the Migration Control Statements dialog opens. These controls statements identify the objects for migration and any dependencies while preserving the target data.
b. Review messages about the analysis and review and edit the results.
When an analysis shows that the migration would produce unintended results, you can customize the migration and can repeat the analysis until the migration produces the desired results.
How to Manage DB2 Object Migrations
42 User Guide
5. Execute the migration:
a. Click Submit to execute the migration control statements.
If you edited the migration control statements, you are prompted to confirm the changes before execution. Otherwise, the View Migration Status dialog opens and displays the status details about the submitted migration statements. When the status changes to Completed, the migration results are displayed for review.
b. Review the results and click Finish to complete the migration.
The selected DB2 objects are migrated.
You have successfully evaluated a migration candidate, built an analysis profile, and migrated DB2 objects.
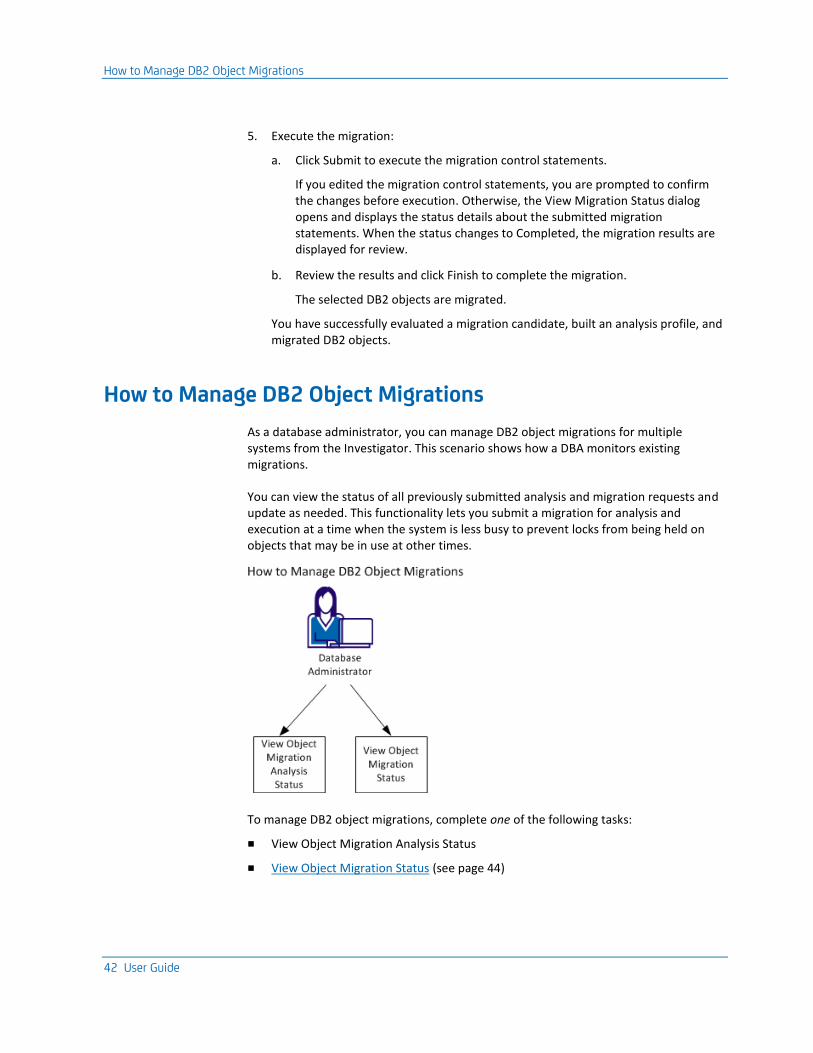
How to Manage DB2 Object Migrations
As a database administrator, you can manage DB2 object migrations for multiple systems from the Investigator. This scenario shows how a DBA monitors existing migrations.
You can view the status of all previously submitted analysis and migration requests and update as needed. This functionality lets you submit a migration for analysis and execution at a time when the system is less busy to prevent locks from being held on objects that may be in use at other times.
To manage DB2 object migrations, complete one of the following tasks:
■ View Object Migration Analysis Status
■ View Object Migration Status (see page 44)
How to Manage DB2 Object Migrations
Chapter 3: Viewing DB2 Object Data in the Investigator 43
View Object Migration Analysis Status
After you submit a migration for analysis, the analysis produces migration control statements that you can review, edit, and submit for migration. These controls statements identify the objects for migration and any dependencies while preserving the target data.
The Quick Links module lets you submit a migration for analysis and review the output messages and results at a later time after the analysis has been performed.
Follow these steps:
1. Add the Quick Links module to a dashboard.
2. Click the View Object Migration Analysis Status link.
The Submitted Analysis Statement Status dialog appears. This dialog lists the status of previously submitted DB2 object migration analysis requests.
Note: You can also view the status of previously submitted analyses by clicking Analysis Status in the STATUS pane of the Investigator or at the bottom of any Object Migrator dialog.
3. (Optional) Select an analysis and browse, delete, edit, or update as needed.
Note: We recommend that you review the messages and browse the results before submitting. When the analysis shows that the migration would produce unintended results, update the migration as needed and repeat the analysis until the migration produces the desired results.
4. When the analysis produces the desired results, click Submit to execute the migration control statements.
The migration is submitted for analysis and the View Analysis Status dialog opens. This dialog provides the submitted analysis statement status.
5. When the status changes to Completed or Error, click Next.
The analysis produces migration control statements to perform the migration and the Migration Control Statements dialog opens. These controls statements identify the objects for migration and any dependencies while preserving the target data.
6. Review messages about the analysis and review and edit the results.
When an analysis shows that the migration would produce unintended results, you can customize the migration and can repeat the analysis until the migration produces the desired results.
7. Click Submit to execute the migration control statements.
If you edited the migration control statements, you are prompted to save the changes. Otherwise, the View Migration Status dialog opens and displays the status details about the submit migration statements.
How to Manage DB2 Object Migrations
44 User Guide
8. When the status changes to Completed, click Next.
The migration results appear in a dialog for review.
9. Review the results and click Finish to complete the migration.
The selected DB2 objects are migrated.
You have successfully evaluated a migration candidate, built an analysis profile, and migrated DB2 objects.
View Object Migration Status
After you submit a migration for execution, the migration results and related messages are produced. You can view or delete the migration from the Quick Links module.
Follow these steps:
1. Add the Quick Links module to a dashboard.
2. Click the View Object Migration Status link.
The Submitted Migration Statement Status dialog opens.
3. Connect to an LPAR and SSID to view the status of DB2 object migration requests that have been submitted.
Note: You can also view the status of previously submitted migration requests by clicking Migration Status in the STATUS pane of the Investigator or at the bottom of any Object Migrator dialog.
This status includes the following:
■ Name
■ Migration status (completed, suspended, started, or submitted)
■ Date and time relative to the status
4. Select an action from the list to manage the migration.
Chapter 4: Viewing DB2 Object Performance Data in the Investigator 45
Chapter 4: Viewing DB2 Object Performance Data in the Investigator
Performance Management
The Investigator helps you review and monitor DB2 applications and subsystem performance by providing multiple work areas to help you manage your data:
■ The table view presents information about application workload characteristics and resource use in rows and sortable columns that you can click to navigate to related data. The Investigator displays data in the table view by default. Each table includes a list of actions you can select to drill further into your application and subsystem data.
■ The chart view provides a graphical representation of application performance metrics in the form of pie charts.
■ The Time Series Facility (TSF) lets you chart application performance metrics in the form of graphs over a specific collection interval or multiple time periods.
The Investigator provides application and subsystem performance data by data sharing group and non-data sharing groups. Data sharing integration lets you view the collection statistics of a data sharing group's members as an integrated whole and comparatively.
You must start and stop collection activities through CA Detector, CA Insight DPM, or CA Subsystem Analyzer.
Note: For more information about starting and stopping collection, see the CA Detector, CA Insight DPM, or CA Subsystem Analyzer documentation.
Note: When you add a note to performance data in the Investigator, it can appear on multiple rows of data.
Application Performance Monitoring
46 User Guide
Application Performance Monitoring
In enterprises that rely on their DB2 database applications, IT teams must locate, analyze, and control resource-hungry or poorly performing DB2 applications and SQL. These tasks help to optimize performance and minimize system resource consumption.
CA Chorus for DB2 Database Management lets you identify and address resource-intensive SQL, focusing your performance tuning efforts on the areas that need the most assistance. You can drill down to the level that you need, conserve resources, and perform detailed application performance analysis, without conducting inefficient and high-cost SQL performance traces.
CA Chorus for DB2 Database Management lets you view and act on current and historical DB2 accounting trace information from various application levels to understand the application workload and performance fully. This capability lets you determine the most frequently used plans, programs, and SQL statements without resource-intensive DB2 performance traces. You can use this information to view your top ten worst performing DB2 SQL statements, packages, and plans that are executing in your environment. Dynamic and static DB2 SQL statements are also monitored. This information lets you focus your tuning efforts where they are most needed.
Additional capabilities let you analyze SQL activity and view and understand SQL error activity.
You can use DB2's ability to collect statistics in real time to help monitor the activity against your packaged application objects. Real-time statistics lets DB2 collect statistics on table spaces and index spaces and periodically write this information to two user-defined tables. Beginning with DB2 9, these tables are an integral part of the system catalog. User-written queries and programs, or a DB2-supplied stored procedure, or Control Center, can use the statistics to make decisions for object maintenance.
You can analyze DB2 performance from the application folders in the Investigator. The Investigator provides actions that help you drill down further into application performance activity. The actions let you view application performance activity at various levels to perform the following functions:
■ Evaluate application performance at multiple levels of granularity
■ Collect static and dynamic SQL statements from multiple sources
■ View current DB2 users
■ Trace DB2 application calls
■ View threads currently executing on a DB2 subsystem
■ Analyze access paths using EXPLAIN processing
Application Performance Monitoring
Chapter 4: Viewing DB2 Object Performance Data in the Investigator 47
This information helps you analyze real-time performance to identify and address applications and SQL statements causing poor performance. It can also help you reduce the SQL impact on DB2 and optimize overall DB2 performance, and identify the most frequently used plans, packages, and SQL statements.
View Application Performance Activity
You can view current and historical application performance activity in the Investigator for data sharing groups and individual DB2 subsystems. This data lets you monitor resource activity and performance on your monitored DB2 subsystems and data sharing groups.
Follow these steps:
1. Add the Investigator module to a dashboard, and click Start New Investigation.
2. Select DBA for DB2 from the discipline drop-down list.
3. Open a confederation folder.
4. Drill down to an application performance activity.
Application performance data appears.
5. Click the Filter icon, which resides above the table on the left.
6. Filter data using the available drop-down lists. Use the Select Time Range fields to indicate whether you want to view current or historical collection interval data. To view current interval data, specify the same Start Date and End Date or click Reset.
The Investigator displays tabular data that meets your filter criteria.
7. (Optional) Select a row of data and specify the Action to perform.
The applicable data appears, with header information that provides the context for the data.
Active Threads
Application thread activity has perhaps the greatest impact on DB2 performance. Getting accurate and timely information about individual threads is therefore important. DB2 accounting data provides that information.
When you select Active Threads in the Investigator, the following DB2 thread activity is provided so that you can examine and evaluate current activity from a DB2 thread perspective:
■ Thread details
■ Number of buffer pools and group buffer pools that have been accessed
■ Remote location details of the distributed allied thread on the local system
Application Performance Monitoring
48 User Guide
■ SQL statement identification information, bind data, and resource use
■ Summary information for all locks that are held for a thread
■ Packages or DBRM detail information
Control block sampling is used to provide this information.
Select a thread and use DB2 cancel thread commands to cancel it. You can also show:
■ Group buffer pool and buffer pool details
■ The current SQL statement
■ Thread information
■ Packages
■ Locks held
Active Threads by Connection
This application performance activity shows the distribution of work across DB2 connections. You can see at a glance where the heaviest workload is in your system.
Current Lock Contentions
This application performance activity shows the contention information for threads currently involved in a deadlock or timeout.
Locks Currently Held
This application performance data lets you evaluate locks currently held by a thread. You can see the lock type, lock state, lock resource, and the number of locks that are held for all locks that are owned by the thread. Output is grouped by lock type, state, and resource. One row of summarized lock data is provided for each lock resource.
If no locks are currently held by any application, no data is provided.
Plan Suspension Summary
This application performance folder shows the plans that are currently waiting for locks and plans that have waited for locks since the request started. The information appears in ascending order by plan name and is useful to help determine the plans and pagesets that are involved most frequently in suspensions.
Application Performance Monitoring
Chapter 4: Viewing DB2 Object Performance Data in the Investigator 49
Plans
You can view current and historical application activity and resource use from a plan name perspective for a specific DB2 subsystem or data sharing group. You can use this information to identify which plans are most frequently used within the DB2 subsystem being viewed, and you can also examine resource use by plan name. One row of data appears for each plan listed.
Note: The data is not obtained directly from the IBM instrumentation facility, but the values are similar. Different levels of granularity are reported than what may be indicated in the IFCID records. For more information about IFCIDs, see the IBM DB2 Administration Guide.
You can view application activity from a plan name perspective and easily identify which plans are most frequently used within the DB2 subsystem being viewed.
Packages
You can evaluate current and historical application performance and resource use from an application package point of view on a specific DB2 subsystem or data sharing group. You can use this information to:
■ Identify which packages are using the most resources
■ View the DB2 plans that have used the package
■ View the SQL calls originating from the package
One row of data appears for each package listed.
All major accounting data values can be viewed for the packages listed.
Additionally, you can invoke the DBA for DB2 Command Manager module to evaluate program SQL call access path information.
SQL Activity
This application performance monitoring lets you view the SQL calls issued during the collection interval on your monitored DB2 subsystems and data sharing groups.
Dynamic SQL Activity
This application performance activity lets you view current and historical dynamic SQL activity on your monitored DB2 subsystems. This information helps you identify which dynamic SQL statements are the most frequently used or most resource-intensive.

Application Performance Monitoring
50 User Guide
SQL Errors
This application performance activity lets you view current and historical data about application errors that are incurred as a result of abnormal SQL call return codes. You can use this information to determine which SQL errors are occurring most frequently. You can view all users and programs that encountered the error.
No performance trace activity is required for SQL error collection.
Note: You can create profiles in CA Detector to tailor SQL error collection by excluding SQL error conditions that are of no interest to you. Additional thresholds are also provided so that you can limit the amount of SQL error information you want retained. For more information about using the collection and reporting facilities of CA Detector, see the CA Detector documentation.
View by Keys
You can view application activity from the perspective of optional additional view by keys as follows:
■ The DB2 connection user ID (AUTHID)
■ The correlation ID, such as the batch job name or the CICS transaction name
■ The DB2 connection type, such as TSO or CICS.
■ The connection name, such as the CICS region name.
■ The remote location name or IP address.
■ The end user ID specified for distributed and RRSAF connections.
■ The end user transaction and workstation ID specified for distributed and Resource Recovery Services Attachment Facility (RRSAF) connections.
Note: You must have enabled Additional View By Keys on the CA Detector collection start and specified a collection profile.
Important! Enabling additional keys collection activity can result in a significant increase in main storage requirements for active collections and DASD requirements for historical data. For more information about limiting the impact of this support, see the CA Detector User Guide.
You can select a key and can view all plans and packages that the key executed during the collection interval. You can also view exception SQL and SQL error collection data for the key.
Subsystem Performance Monitoring
Chapter 4: Viewing DB2 Object Performance Data in the Investigator 51
Chart Data
When you are viewing plan, package, SQL, or dynamic SQL column data in a table list, use the chart (graph) icon to view a graphical representation of the following data:
■ The percentage of total interval or package INDB2 time (TIMEPCT)
■ The percentage of total interval or package INDB2 CPU time (CPUPCT)
■ The total or average number of getpage requests (GETPAGE)
■ All wait times (TOTAL_WTIME)
The ability to see activity graphically, at a glance, can help you identify and understand your system's health. Charts also help you to identify data anomalies.
CA Chorus for DB2 Database Management collects current data to build a chart.
Follow these steps:
1. Add the Investigator module to a dashboard, and click Start New Investigation.
2. Select DBA for DB2 from the discipline drop-down list.
3. Click the Chart icon from the table list.
The column data for TIMEPCT appears in the form of a pie (circle) chart.
4. Select other column values from the drop-down list.
New data appears in the graph based on your selection.
Subsystem Performance Monitoring
As DB2 applications increase in complexity and the DB2 databases grow in size, helping ensure that performance becomes increasingly critical. When transactions use dynamic SQL that enters DB2 through various gateways or JDBC connections, it is crucial that your DB2 subsystems and applications are performing at their best.
The CA Chorus for DB2 Database Management discipline provides real-time performance monitoring of DB2 applications and subsystems, enabling database administrators (DBAs) to detect and correct performance problems rapidly. This discipline collects data from the z/OS subsystem interface, DB2 and z/OS control blocks, and DB2 performance traces to provide online access to critical performance statistics. In addition, you can monitor subsystems and application statistics to assess and troubleshoot problems as they arise. This functionality helps DBAs identify performance problems as they occur, fix critical issues before they impact service levels, and track performance trends for proactive performance management.
Subsystem Performance Monitoring
52 User Guide
You can monitor current and historical DB2 subsystem performance data from the Investigator:
Note: Only database, table space and index space, and table activity can be viewed from data sharing groups.
The Investigator provides actions that help you drill down further into subsystem performance activity. The actions let you view subsystem activity at various levels to help reduce the time and effort involved in identifying and correcting DB2 performance problems.
View Subsystem Performance Activity
You can view current and historical subsystem performance activity from the Investigator. This data lets you monitor and tune DB2 subsystem performance and activity. This data is accumulated from DB2 startup (Accum) or the difference between the current and the previous time interval (Delta).
Follow these steps:
1. Add the Investigator module to a dashboard, and click Start New Investigation.
2. Select DBA for DB2 from the discipline drop-down list.
3. Open a confederation folder.
4. Drill down to a subsystem performance activity.
Subsystem performance data appears.
5. Click the Filter icon, which resides above the table on the left.
6. Filter data using the available drop-down lists. Use the Select Time Range fields to indicate whether you want to view current or historical collection interval data. To view current interval data, specify the same Start Date and End Date or click Reset.
The Investigator displays tabular data that meets your filter criteria.
Subsystem Performance Monitoring
Chapter 4: Viewing DB2 Object Performance Data in the Investigator 53
7. (Optional) Select rows of data and specify the Action to perform.
The applicable data appears.
8. (Optional) Change parameter values unique to the current dialog using the following View drop-down list values:
Accum
Displays data representing total statistical accumulation since DB2 was started.
Delta
Displays the difference between values that are found at this interval and the last interval (current interval value - previous interval value).
The values increase if you change from Delta to an Accum view. The values decrease if you change from an Accum to a Delta view.
Active Alerts
This subsystem performance folder provides a system status overview of the active alerts by severity on your DB2 subsystems. Additional system information is also provided.
Overview Snapshot
This subsystem performance folder provides a system status overview of the DB2 address space to help you determine at a glance whether the subsystem is having problems. The data that is displayed is Accum (from the time DB2 was started) or Delta (difference between the current and previous time). The system status information is provided and refreshed every 30 seconds.
System Parameters
This subsystem performance folder data shows current and historical system statistics data for the DB2 subsystem you are currently monitoring.
DDF Statistics
This subsystem performance folder shows Distributed Data Facility (DDF) related statistics. This information helps you determine the amount of distributed activity that is occurring at each remote location.
Subsystem Performance Monitoring
54 User Guide
Current Lock Contentions
This subsystem performance folder shows one row of lock data for each holder and waiter in a lock resource contention. You can monitor this information to determine how long a thread is active, how much of that time is spent in DB2, and how much time is spent waiting for DB2 resources. If no lock contentions exist, no data appears.
System Statistics
System Statistics data provides information about the DB2 subsystem you are currently monitoring. Information is displayed for one DB2 subsystem at a time.
DB2 Address Space Statistics
This subsystem performance folder displays a breakdown of the CPU time that is used for each of the DB2 address spaces. You can use this information to see how much and what type of CPU time is being consumed by the DB2 subsystem. It shows how much zIIP and main processor CPU is being used by DB2.
Subsystem Services
This subsystem performance folder displays counts of threads that are processed by the DB2 subsystem services address space. You can use this information to determine if threads are being queued.
DB2 Command Counts
This subsystem performance folder provides a list of DB2 command-related subsystem statistics.
IFI Statistics
This subsystem performance folder provides a list of Instrumentation Facility Interface (IFI) related statistics.
Latch Statistics
This subsystem performance folder provides latch counters that are maintained by the latch manager for the collection interval. The counters are incremented each time a latch suspension occurs. Typically, latch effects are small in comparison with lock suspensions.
Subsystem Performance Monitoring
Chapter 4: Viewing DB2 Object Performance Data in the Investigator 55
Storage Statistics
This subsystem performance folder shows storage acquisition counts for the DB2 address spaces. You can use this information to determine whether storage shortages are occurring.
Remote Location Totals
This subsystem performance folder shows remote location data summarized for all locations.
Logging Statistics
This subsystem performance folder monitors logging statistics on your DB2 subsystems.
SQL Counts
This subsystem performance folder displays the DB2 subsystem's SQL activity for the past 30 seconds (delta) or since the current DB2 subsystem was initialized (accum). The fields display the total number of statements that were issued for each SQL statement type.
LOB XML
This subsystem performance folder indicates the maximum storage that is used for large object (LOB) and XML values in MB.
Parallelism
This subsystem performance folder provides detailed information about the DB2 subsystem's parallel I/O activity, as well as RID pool statistics. This information can help you diagnose problems due to multiple index, list prefetch, or RID processing storage failures, which can be from a shortage of virtual storage in the database services (DBM1) address space.
List Prefetch
This subsystem performance folder shows the list prefetch for this DB2 subsystem. You can use this information to determine whether storage problem, which affect the list prefetch are occuring.
Routine Counts
This subsystem performance folder displays statistics relating to the use of DB2 routines including stored procedures, user-defined functions, and triggers.
Subsystem Performance Monitoring
56 User Guide
Dynamic Prepare and Row Access
This subsystem performance folder displays statistics relating to the use of the dynamic prepare function and row access.
Dataset Drain
This subsystem performance folder lists data set open and drain processing activity for the past 30 seconds (delta) or since the current DB2 subsystem was initialized (accum). This information can help you diagnose problems in thrashing situations, data set open delays, and failures. In addition, it can help you determine whether the DSMAX parameter in the DB2 DSNZPARM is appropriate.
Bind Auth Check
This subsystem performance folder lists BIND, REBIND, and FREE activity for plans and packages, and authorization check information. Statistics appear for the most recent interval (delta), or since DB2 was initialized (accum).
Buffer Pool Totals
This subsystem performance folder provides summarized statistics for defined buffer pools.
RID Pool
This subsystem performance folder shows statistics about the data manager row identifier (RID) list processing. RID list processing is used for a single index (index access with the list prefetch) or for multiple indexes (multiple index access).
Lock Statistics
This subsystem performance folder displays locking statistics including timeouts, deadlocks, and suspensions for the monitored DB2 subsystem. These statistics are for "logical" locks used to control concurrency between transactions. You can use this information to determine whether timeouts or deadlocks are occurring.
EDM Pool
This subsystem performance folder summarizes environmental descriptor manager (EDM) pool activity. You can use this information to determine how the EDM pool resources have been allocated and the number of I/Os to the directory.
Subsystem Performance Monitoring
Chapter 4: Viewing DB2 Object Performance Data in the Investigator 57
Group Buffer Pool Totals
This subsystem performance folder provides summarized statistics for each group buffer pool in the coupling facility cache structure. This information shows group buffer pool use across all DB2 subsystems in the data sharing group and can help you determine resource balancing or resource allocation problems.
Global Lock Statistics
This subsystem performance folder displays information about physical locks that are used by data sharing and acquired by DB2 to ensure the consistency of data cached in different DB2 subsystems. The subsystems, not the transactions, own these locks. This information can be used to determine whether the group buffer pool parameters need tuning because of large numbers of contentions.
Language Environment Access
This subsystem performance folder shows the statistics that are related to LE token usage and management. Token counts, storage utilization, and processing time while managing LE tokens are included.
Starjoin Pool
This subsystem performance folder displays Starjoin Pool usage data for this DB2 subsystem and provides failure information and details about how it is being used.
DB2 Address Space Messages
This subsystem performance folder provides the last set of WTO messages that are recorded by DB2 through IFCID 197. One row is returned for each message line. Use this display to view errors that are reported by DB2 messages.
Deadlock/Timeout Details
This subsystem performance folder provides one row of data for each holder and waiter of the resources (contention information) for completed threads involved in a deadlock or timeout.
If no deadlocks or timeouts have occurred, no data appears.
Subsystem Performance Monitoring
58 User Guide
Dynamic SQL Cache
The Dynamic SQL Cache subsystem performance folder provides information about dynamic SQL statements that are cached for reuse. Use this information to determine cached dynamic SQL statements and the accumulated resource use for each statement. The complete cached SQL statement can also be displayed.
Remote Locations
This subsystem performance folder provides collection statistics for each DB2 remote location. One row is returned for each remote location.
Buffer Pool List
This subsystem performance folder provides accumulated sizing and I/O activity data for DB2 buffer pools that have a defined size on your monitored DB2 subsystems to determine the status of buffer pools. One row of data is returned for each defined buffer pool.
Workfile Utilization
This subsystem performance folder shows an overview of the utilization of all work file databases as a whole. You can use this information to determine utilization for the work file databases.
This subsystem performance folder provides parameter information for each buffer pool that is defined to DB2. One row of data appears for each buffer pool.
Group Buffer Pool List
This subsystem performance folder provides one line of statistics for each group buffer pool that is connected to the DB2 subsystem. This information can help you determine resource balancing or resource allocation problems. One row of data is returned for each group buffer pool.
Group Buffer Pool Attributes
This subsystem performance folder provides parameter information for each group buffer pool that is connected to this DB2 or data sharing member. One row of data appears for each group buffer pool defined.
Subsystem Performance Monitoring
Chapter 4: Viewing DB2 Object Performance Data in the Investigator 59
Storage Utilization
This subsystem performance folder shows storage usage for the DB2 subsystem as recorded in the IFCID 225 record. This information is collected when the request is first started and at every statistics interval. Use this information to determine how DB2 is using virtual storage.
Datasets Allocated
This subsystem performance folder provides a list of currently open DB2 data sets in the DBM1 address space and information about their use, allocation, and extents. This information can help you determine data sets with a large number of extents.
Log Allocations
This subsystem performance folder displays the DB2 subsystem's log data sets and their related ZPARM values. You can use this information to determine which logs are available or waiting for archive conditions.
Logging Status
This subsystem performance folder displays the DB2 subsystem's log data sets and their status.
IFI Destination Statistics
This subsystem performance folder provides collection statistics for each trace destination for which at least one record was written. One row appears for each trace destination used.
IFCID Activity
This subsystem performance folder returns collection statistics for each IFCID for which at least one record was written. One row is returned for each IFCID used.
Subsystem Performance Monitoring
60 User Guide
History
The History component stores DB2 subsystem Interval Statistics and Thread Accounting data. This component provides a high-speed, continually available facility for the storage and online access of recent-past DB2 performance data.
Note: If your data center wants to store and access history data, activate the CA Insight DPM online history component as described in the CA Insight DPM System Reference Guide.
Database Activity
This subsystem performance folder lets you view current and historical information about getpage requests, physical I/O activity, and buffer pool hit ratios for the selected database.
You can view current and historical data about how the databases on your system are impacting your DB2 workload. You can view information about the tables, table spaces, and index spaces in your database on an individual basis or all at one time. This information helps you to identify which databases are most frequently used within the DB2 subsystem being viewed and you can also examine resource use by database.
Table/Index Space Activity
This subsystem performance folder shows current and historical data about getpage requests, physical I/O activity, and buffer pool hit ratios for table spaces and index spaces.
Table Activity
This subsystem performance folder displays the tables that have been referenced during the current or historical collection interval that is impacting your workload and how those tables are being accessed. You can view the tables being used, their associated database and table space names, as well as data related to the tables' getpage activity. One row of data appears for each table.

View DB2 Object Performance Data in the Time Series Facility
Chapter 4: Viewing DB2 Object Performance Data in the Investigator 61
View DB2 Object Performance Data in the Time Series Facility
The Time Series Facility (TSF) stores data that is collected and provided by CA products. TSF provides a single point for collection, storage, management, and organization of the product data. When you request a Time Series chart from the Investigator, TSF provides the data content for the chart.
TSF lets you quickly compare performance data, which can help you complete the following tasks:
■ Troubleshoot an issue
■ Identify an area that is approaching a questionable threshold
■ Compare data from a different or similar time period
Each selected metric produces a chart and each selected entity produces a line on the chart. You can produce up to four charts with up to four entities on each chart. You can set time ranges and end dates. Data that is presented on the charts appears in local time. However, the data may have been collected from a different time zone and may reflect the performance issues of this different time zone.
You can add DB2 application performance entities to TSF with CA Chorus for DB2 Database Management. This feature lets you automate tracking and graphing of comparative historical data analysis for easier diagnosis and resolution of performance issues. TSF displays DB2 application performance data and supports graphing over time. When you add a DB2 application performance object (plan, package, SQL activity, and dynamic SQL) to TSF, it becomes an entity. You can then use it to create a graph to view performance data over time.
Note: For detailed common TSF concepts and procedures, see the CA Chorus Product Guide.
This example shows how to add and analyze a DB2 package using TSF.
Follow these steps:
1. Navigate the Investigator tree to the Application Performance folder, and select Packages.
2. Highlight the required package, and click Add Entity to Time Series.
The package is added to the TSF, and the TSF panel appears.
3. Select the entity from the Chart Selection Tools section.
The list of metrics for the selected entity appears.
4. Select the required metric.
The metric is highlighted.
View DB2 Object Performance Data in the Time Series Facility
62 User Guide
5. Click Perform Charting.
TSF produces a chart for the selected metric. The selected entity becomes a line on the chart.
6. Select an entity from the Contributors drop-down list, and click Contributors.
The Entities panel becomes the Base Entities panel and shows the original criteria that the Investigator passed for the selected entity.
7. Click the Contributors drop-down list.
The drop-down list shows the valid contributors.
Note: To exit the contributors function, click Back to Entities.
8. Select a contributor type.
A list of all the contributors for the selected entity and metric combination appears.
9. Click Perform Charting.
The new chart is generated from the selected entities.
CA Chorus for DB2 Database Management TSF Examples
Example: Long Program Execution
The operations manager wants to know why a program seems to be taking longer to execute each time it is run. The manager first noticed the increase in execution time a few days ago and has now noticed that the issue is getting progressively worse.
Database administrators are regularly asked about past events that may be affecting current system performance (programs running faster or slower, permissions that are changed, and so on).
CA Chorus captures performance data from CA products at intervals set within Time Series Facility (TSF) parameters. Therefore, all of the DB2 executions have been captured, which can help you analyze a problem.
You can identify when this program was executed and can investigate the cause of the longer elapsed time. To do so, launch the Investigator and select the program that you want to investigate from the history or from the active display. Select the TSF. From TSF, specify a date range to view performance data in chart form. Use the chart to identify when the change in the package execution time began. After you identify when execution time degraded, look for prior events that could have triggered the issue.
View DB2 Object Performance Data in the Time Series Facility
Chapter 4: Viewing DB2 Object Performance Data in the Investigator 63
Example: Post Upgrade Behavior
The operations manager wants to know if a DB2 process is taking less time to execute after a recent upgrade. The upgrade was completed a few days ago, and the manager wants to confirm that the upgrade has improved performance.
CA Chorus captures performance data from CA mainframe products at intervals that are set within TSF parameters. Database Administrators can use the TSF to create two charts to identify performance improvement. The first chart shows the current performance. The second chart shows the performance from the same day and time a week before the upgrade.
Example: Graph Application Performance Data
The need to graph and compare DB2 application performance data is high on the database administrator priority list. Today, you can use CA Detector to collect and aggregate data for reporting purposes. After the data is loaded into DB2 tables, use utilities, such as UNLOAD, to transfer the data into comma-delimited files. You can then FTP the file to your PC and load it into a software program to perform graphing. The process can be time-consuming and error prone.
With CA Chorus for DB2 Database Management, these steps are automated through TSF, which stores data that is collected and provided by CA products, such as CA Detector. TSF provides a single point for collection, storage, management, and organization of the product data. When you request a Time Series chart from the Investigator, TSF provides the data content for the chart and the ability to select different metrics to graph over time and to compare with different points.
To graph application performance data in CA Chorus for DB2 Database Management, complete the following steps:
1. Enable TSF to collect and manage DB2 application performance data within the enterprise. The TSF started task collects and manages the data regardless of the LPAR location.
2. Set up a CA OPS/MVS EMA task to run a started task to transport the data to the TSF. Complete this step for each CA Detector collection that you want.
3. The centralized Time Series Facility started task manages all performance data from all DB2 subsystems. The data retention and aggregation (up to five tiers) is defined during post-installation configuration. Each tier is defined with an expiration time in days, months, years, and a resolution for aggregation of one hour, two hours, and so on. The data is automatically moved to the next tier based on the tier expiration time and eventually purged based on the last tier expiration.
All CA Detector data from all subsystems across all LPARs are now available to you to manage and graph in the TSF.

Chapter 5: Using the DBA Command Manager for DB2 Module 65
Chapter 5: Using the DBA Command Manager for DB2 Module
DBA Command Manager for DB2
The DBA Command Manager for DB2 module processes SQL and database management commands. This module lets you dynamically run DB2 utilities and application programs. The module also lets you execute DB2 commands, submit SQL commands, and view the results. You can open the DBA Command Manager module from many places in the Investigator.
CA Chorus limits each user session to one instance of this module. If you attempt to add a second module to your workspace, CA Chorus displays an error message.
The default values for SQLID and Explain Schema are populated from the Set SQL Parameters option in the CA Chorus Investigator. If you change these values in the DBA Command Manager for DB2, they are not saved.
Note: For more information about DB2 and SQL command syntax, see the DB2 Reference Guide.
More information:
Set User Parameters (see page 23)
Explain an SQL Statement
Use the DBA Command Manager for DB2 module or Explain action in the Investigator to explain an SQL statement. A DB2 EXPLAIN is executed on the SQL statement and access path information and CA-supplied rules and recommendations for that statement are returned.
Note: EXPLAIN processing does not currently support comments. Comments that are added while developing complicated statements must be removed before doing an EXPLAIN.
This module can explain DML statements such as SELECT, INSERT, and UPDATE. Do not explain DDL statements, which typically begin with CREATE or ALTER for example.
Issue SQL Statement or DB2 Command
66 User Guide
Follow these steps:
1. Add the DBA Command Manager for DB2 module to a dashboard.
2. Enter an explainable SQL statement in the text box and click the Explain button.
Note: Enter the statement syntax using capital letters, and enter only one SQL statement at a time. EXPLAIN does not support embedded comments.
The module explains the statement. The module also displays the access path information. This information appears under the Access Path tab and CA-supplied rules and recommendations for the SQL statement under the Rules and Recommendations tab.
The first 2000 rows are returned. Remaining rows are truncated.
Important! Each user must complete the CA Plan Analyzer @DEFAULT ruleset to receive a complete output of the recommended rules and recommendations.
If the @DEFAULT rule set is not defined in CA Plan Analyzer, the EXPLAIN request output may be incomplete.
Note: Syntax checking is performed before performing an EXPLAIN. Nonexplainable SQL statements, such as DDL, can produce a SQL syntax error instead of a nonexplainable statement error.
Issue SQL Statement or DB2 Command
Use the DBA Command Manager for DB2 module to enter an SQL statement or a DB2 command. This module processes the DB2 command or SQL statement, displays the returned messages, and displays the results of the SQL execution, if applicable.
Follow these steps:
1. Add the DBA Command Manager for DB2 module to a dashboard.
2. Use the connection toolbar to select the DB2 subsystem and LPAR, SQLID, Explain Schema, and the maximum number of SELECT statements to review and display.
Note: If the selected subsystems do not appear, close and reopen the module.
3. Enter the SQL statement or DB2 command in the text box, and click Submit.
Note: Enter the statement syntax using capital letters. Enter one SQL statement at a time. The module input statements are limited to 1,000,000 characters. Multi-line comments are not supported.
Issue SQL Statement or DB2 Command
Chapter 5: Using the DBA Command Manager for DB2 Module 67
The following processing occurs:
■ If you entered an SQL statement, the Messages tab contains the status of the SQL execution unless you executed a single SELECT query. In this instance, the Messages tab is disabled. The Results tab contains the output from running an SQL SELECT statement. The data that is retrieved from a column of type XML, CLOB, BLOB, or DBCLOB is limited to 32 KB per row.
■ If you entered a DB2 command, the module executes the DB2 command and displays the results of the command in the Messages tab. If the size or the sum of the column length is larger than 4096 bytes, the data is truncated.
Note: This module cannot display binary data in hexadecimal form.
4. (Optional) Click the Recent Commands History icon to display the last 100 previously saved command entries. The most recently saved commands appear on the top. These commands are sorted by date and time. The grid contains two columns—Description and Date/Time. The description inside the grid is an active link. Selecting this link closes the panel and populates the Input field with the selected history item. Initially, the active link displays the first 50 characters of the command. When you click the active link, the module fetches the entire command from the database and displays it in the input area.
5. (Optional) Click the Import icon to import SQL statements or DB2 commands from a .txt file or a .sql file. Click Browse to select a file, and click Import. The SQL statements or the DB2 commands from the selected file appear in the input text area. Click Submit and the output appears in the command results area.
Note: The DBA Command Manager for DB2 validates the selected file. The file must be a .txt file (UTF-8 or ASCII) or .sql file, less than 100 KB. Binary files are not supported.

Chapter 6: Troubleshooting 69
Chapter 6: Troubleshooting
Information Gathering
If you encounter an issue in CA Chorus or any discipline, we recommend that you answer the following questions and you gather the following information before contacting CA. Doing so can expedite the resolution.
■ What CA Chorus product are you running?
■ What version of CA Chorus software are you running?
■ In what module or component are you working?
■ If you are working in a module with folders, which folder were you working in?
■ What were you trying to do in the product?
■ What path have you taken to get to this error?
In addition, we recommend that you secure a screen shot with the error message and any associated log files so that we can review exactly what you are seeing in the product and in the logs.
Information Gathering
70 User Guide
CA Chorus for DB2 Database Management Log Files
When determining the root cause of an issue, we may ask for log files to review the performance history of CA Chorus for DB2 Database Management. The following list provides a high-level introduction to the types of logs and their locations:
Note: For log details and locations for common CA Chorus functionality, see the CA Chorus Administration Guide.
CA Insight DPM
Includes CA Insight DPM performance data. Each CA Insight DPM data collector started task is continuously monitoring the performance indicators for one DB2 subsystem. CA Insight DPM logs operational status information to the joblog and SYSOUT data sets. This logging reflects local z/OS system time.
Log Location: Spool data sets in the z/OS job output for the started task.
CA Chorus for DB2 Database Management Responsibilities: CA Insight DPM provides data for several Application Performance and Subsystem Performance displays. CA Insight DPM also sends DB2 Alert data to Xmanager, which feeds it into the CA Chorus server.
OFA logs
(Optional) Directs output to a data set instead of SYSOUT (the default). Add the following DD statements for the sequential log data sets to the OFAPROC started task JCL:
//LOGGER1 DD DISP=SHR,DSN=hlq.LOGGER1
//LOGGER2 DD DISP=SHR,DSN=hlq.LOGGER2
Allocate the sequential log data sets manually with the following attributes:
■ Record format: VB
■ Record length: 1028
■ Block size: 6144
■ Cylinders: 20
Note: To turn off the logging capability for OFAPROC, contact CA Support for instructions.
Information Gathering
Chapter 6: Troubleshooting 71
Xmanager Logs
Includes performance information for Xmanager, which unifies each installation of CA Database Management Solutions for DB2 for z/OS into a functional group and provides the execution base for CA Detector and CA Subsystem Analyzer. Xmanager also includes CA Chorus Alert processing services for CA Insight instances that are part of its functional group. Xmanager logs operational status information to the joblog and SYSOUT data sets. Xmanager’s logging reflects local z/OS system time.
Log Location: Spool data sets in the z/OS job output for the started task
CA Chorus for DB2 Database Management Responsibilities: Xmanager provides data for several subsystem performance and application performance displays. It also feeds Alert data to the CA Chorus server for the DB2 Alerts feature.
Xnet Logs
Includes performance information regarding this subsystem that is shared by all CA Database Management Solutions for DB2 for z/OS products. Xnet provides communications services for the CA Database Management Solutions for DB2 for z/OS products in its functional group. Xnet also provides real-time configuration information to CA Chorus. Xnet logs operational status information to the joblog data sets and the Xnet log file data sets (normally there are two log file data sets). Every CA Chorus request to a CA Database Management Solutions for DB2 for z/OS product in its functional group is logged in the Xnet log file data sets. The logging for each transaction identifies the user ID making the request and the product agent that is processing the request. Timestamps in the Xnet log files reflect the local z/OS system time where Xnet is running. The Xnet log files are plain text, and you can upload them to a PC for viewing or inclusion in an email.
Log Location: Spool data sets in the z/OS job output for the task and the db2tools-hilevel.XNETLOG1 and db2tools-hilevel.XNETLOG2 data sets.
CA Chorus for DB2 Database Management Responsibilities: Xnet provides data for system configuration. It also provides routing information to the CA Chorus server and manages the requests between the CA Chorus server and the CA Database Management Solutions for DB2 for z/OS products in its functional group.
Application Performance View By Keys Xmreq Error
72 User Guide
Application Performance View By Keys Xmreq Error
Symptom:
The following message displays:
CAEU9320E U2X Xmreq request failure
CAEU9001I agtDate(mm/dd/yyyy) agtTime(17:53:02.810)
agtSysplex(PLEXC1) agtSystem(ssid) agtOs(z/OS 01.13.00)
agtJobname(PTXGBNET) agtError(12 xC) agtReason(20 x14) agtXman(8282)
agtAgent(U2XAGENT) agtUser(USERA05-00000004)
agtFunction(KYSUMOUT.S.A) agtSSID(ssid)
CAEU9002I dshDate(mm/dd/yyyy) dshTime(17:53:02.822)
dshSysplex(PLEXC1) dshSystem(ssid) dshOs(z/OS 01.13.00)
dshJobname(CHRA1JBO) dshError(0 x0) dshReason(0 x0)
dshName(db2tools/1.0) dshAgent(U2XAGENT )
dshUser(USERA05-00000004) dshXport(8282) dshXipaddr(ssid)
dsConf(USERA05 ) dsSystem(ssid ) dsGroup() dsSSID(ssid)
dsFunction(PDT:KYSUMOUT)
Solution:
Follow these steps:
1. Verify that the CA Detector profile used to start the data collection is set to collect KEY information.
2. Verify that the CA Detector collection was started with View by Keys is set to Y.
Application and Subsystem Performance History Versus Current Interval
Chapter 6: Troubleshooting 73
Application and Subsystem Performance History Versus Current Interval
Symptom:
How do I view the history interval as opposed to the current interval. This data is provided from CA Detector and CA Subsystem Analyzer collections.
Solution:
Time-based CA Chorus for DB2 Database Management objects contain both a history and a current interval view (with the exclusion of the Subsystem Performance History objects). Complete the following tasks from the Investigator to view current or historical data:
■ To view current interval data:
– Set the Start Date and End Date to the current date.
– Set the Start Time and End Time to the same value.
■ To view historical data, set the Start Date, End Date and the Start Time End Time to the desired interval.
OFA Temp Work Data Sets High-Level Qualifier
Symptom:
I am not allowed to allocate data sets under my high-level qualifier (HLQ).
Solution:
During Command Manager and Object Migrate processing, the OFS agent allocates temporary work data sets under the user's prefix.
Follow these steps:
1. Identify the user HLQ by issuing the following command:
TSO PROFILE
Output similar to the following sample data is provided:
IKJ56688I CHAR(0) LINE(0) PROMPT INTERCOM NOPAUSE MSGID MODE
NOWTP
MSG NORECOVER PREFIX(USERA01) PLANGUAGE(ENU) SLANGUAGE(ENU)
VARSTORAGE(LOW)
IKJ56689I DEFAULT LINE/CHARACTER DELETE CHARACTERS IN EFFECT FOR
THIS TERMINAL
Missing Security Setup for Object Migrator
74 User Guide
The PREFIX variable contains the HLQ. If this value is blank, the request is likely to fail.
2. Add the <PREFIX> parameter to the configuration file member under the following circumstances:
■ The PREFIX value is not defined.
■ The user does not want the temporary work data sets to be allocated under the PREFIX high-level qualifier.
Note: The PREFIX could be defined at the LPAR level.
The temporary work data sets are allocated to the work packs and are deleted according to the specifications at your site.
More information:
Override Work Data Set Allocations (see page 24)
Missing Security Setup for Object Migrator
Symptom:
The following message is displayed upon submitting an Object Migrate request:
ETJQM049W EXECUTION STATUS ERROR
This message indicates a problem with CA Datacom/AD job status authentication.
Solution:
Verify that all additional permissions applicable to Object Migrator were executed.
@DEFAULT Member of CFGFILE
Symptom:
The following message occurs in the CA Chorus UI when submitting the Object Migrate request:
ETJQM030E DEFAULT MEMBER IN CFGFILE IS MISSING.
Solution:
Once the CFGFILE is allocated, create at least one member in that data set with the member name of @DEFAULT.
Custom CFGFILE Member for User
Chapter 6: Troubleshooting 75
Follow the instructions on defining XML-like tags and parameters for <JOB CARD>, <MODEL4>, and <MODEL4C>. The tags must match the examples. If NUM ON is set, issue NUM OFF.
The MODEL4 and MODEL4C parameters stand for the Utility Model name and the Utility Model creator. These values come from Utility Model Services in CA RC/Migrator (RC/M Profile, option 6).
Note: For more information about models, see the CA RC/Migrator User Guide.
You can always override the value of the Utility Model by specifying model information in the UI. If you do not override the model in the UI, the order of execution is as follows:
1. Model definitions from the users CFGFILE.
2. Model definitions from the @DEFAULT member.
Note: For more information about this configuration, see the CA Chorus for DB2 Database Management Installation Guide.
Custom CFGFILE Member for User
Symptom:
The following message is issued for the Object Migrator analysis, but the status remains Submitted in the UI and never changes:
Migration Analysis successfully submitted.
The job appears to be stuck.
Solution:
Verify that the background job was submitted for the user. The job could have failed because of incorrect accounting information. In this case, the UI is not updated.
Each user may require their own member in the Object Migrator configuration file (CFGFILE). The member name has to be the same as the users logon ID. The users may specify JOBCARD and CA RC/Migrator Utility Model Services.
To ensure that the job was submitted for the user, complete the following steps:
1. Verify that the logon ID member exists in the CFGFILE.
2. If a logonid does not exist, review the JOBCARD in the @DEFAULT member.
CDBAMDL(MJETJOB) CETJPLD platform LOADLIB
76 User Guide
CDBAMDL(MJETJOB) CETJPLD platform LOADLIB
Symptom:
The following message is issued for an Object Migrator analysis, but the status remains Submitted in UI.
Migration Analysis successfully submitted.
The following message appears in TSO:
15.40.28 JOB14687 $HASP165 DEFAULQM ENDED AT USILCA11 - JCL ERROR
CN(INTERNAL)
Solution:
These messages indicate that you have JCL errors in the MJETJOM model that are caused by missing CA Chorus load library.
Follow these steps:
1. Update the MJETJOM model to add the CA Chorus platform load library. This library is required for the Object Migrator to get status information for jobs.
Note: For more information about updating this member, see the CA Database Management Solutions for DB2 for z/OS Implementation Guide.
2. Specify TCP/IP libraries only if they are required to resolve the IP address. Otherwise, the TCP/IP libraries are not needed.
If OFA needs TCP/IP libraries, then MJETJOM needs them. Otherwise, they are not required.
NUM ON and the OFA Configuration Data Set
Symptom:
The following message is issued for an Object Migrator analysis, but the status remains Submitted in UI.
Migration Analysis successfully submitted.

No Response Received for Submitted Migration Request
Chapter 6: Troubleshooting 77
The JCL for the user looks as follows:
//DEFAULQM JOB (129300000),'@DEFAULT',CLASS=A,MSGCLASS=X,
JOB15115
********************** EXPECTED CONTINUATION NOT RECEIVED
*********************
//SYSIN DD * GENERATED STATEMENT
// MSGLEVEL=(1,1),REGION=0M,NOTIFY=USERA01
//SYSIN DD * GENERATED STATEMENT
/*JOBPARM S=ssid
The OFA CONFIG members are created with NUM ON, which becomes part of the JOBCARD and creates JCL problems.
Solution:
Follow these steps: for all members in the CONFIG data set
1. Specify UNNUM to remove sequence numbers.
2. Specify NUM OFF to turn number mode off.
3. Resubmit the analysis.
No Response Received for Submitted Migration Request
Symptom:
A migration request was submitted, but no response was received. The Migrate action is shown as submitted, but no results or failure are returned to the user. Upon investigation, an account ID not found error is found.
Solution:
This problem indicates that the user ID associated with the migration has not been added to the Object Migrator configuration data set members list. Add the user ID to the config.om.pds.
Note: For more information about the Object Migrator configuration PDS and members, see the CA Chorus for DB2 Database Management Installation Guide.
Catalog and Performance Folders Do Not Expand
78 User Guide
Catalog and Performance Folders Do Not Expand
Symptom:
When I try to view catalog or performance data in the Investigator, the CA Chorus for DB2 Database Management folders do not expand.
Solution:
If the folders do not expand and CA Chorus does not display an error message, contact your system administrator. They can determine if the applicable Xnet and agents are up and running. If the system administrator cannot identify the issue, contact CA Technical Support.
Note: The CA Chorus Product Guide includes an architectural diagram of the base product, which can aid in your troubleshooting efforts. The CA Chorus Administration Guide includes commands to start and stop the agents.
More information:
CA Chorus for DB2 Database Management Architecture (see page 12)
Receive an Error Message in the Command Manager
Symptom:
I entered an SQL command in the DBA Command Manager for DB2 module, and I receive an error.
Solution:
Some messages clearly state the issue. For example, the following error message indicates that you have used an incorrect range:
-490, ERROR: NUMBER 1000000000000000 DIRECTLY SPECIFIED IN AN SQL STATEMENT IS OUTSIDE THE RANGE OF ALLOWABLE VALUES IN THIS CONTEXT (1, 2147483647)
Other messages can be less clear. For example, the following message indicates that you have specified an undefined name, but the message does not detail what constitutes a defined name:
-204, ERROR: SYSIBM.SYTABLES IS AN UNDEFINED NAME
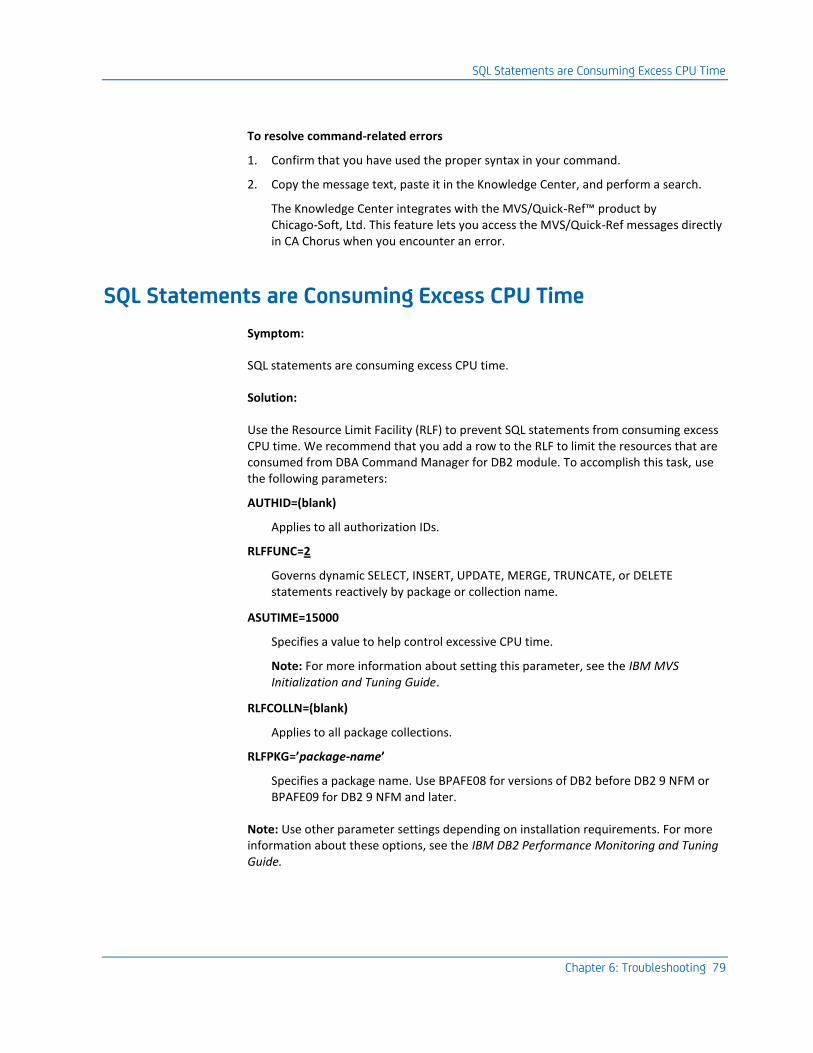
SQL Statements are Consuming Excess CPU Time
Chapter 6: Troubleshooting 79
To resolve command-related errors
1. Confirm that you have used the proper syntax in your command.
2. Copy the message text, paste it in the Knowledge Center, and perform a search.
The Knowledge Center integrates with the MVS/Quick-Ref™ product by Chicago-Soft, Ltd. This feature lets you access the MVS/Quick-Ref messages directly in CA Chorus when you encounter an error.
SQL Statements are Consuming Excess CPU Time
Symptom:
SQL statements are consuming excess CPU time.
Solution:
Use the Resource Limit Facility (RLF) to prevent SQL statements from consuming excess CPU time. We recommend that you add a row to the RLF to limit the resources that are consumed from DBA Command Manager for DB2 module. To accomplish this task, use the following parameters:
AUTHID=(blank)
Applies to all authorization IDs.
RLFFUNC=2
Governs dynamic SELECT, INSERT, UPDATE, MERGE, TRUNCATE, or DELETE statements reactively by package or collection name.
ASUTIME=15000
Specifies a value to help control excessive CPU time.
Note: For more information about setting this parameter, see the IBM MVS Initialization and Tuning Guide.
RLFCOLLN=(blank)
Applies to all package collections.
RLFPKG=’package-name’
Specifies a package name. Use BPAFE08 for versions of DB2 before DB2 9 NFM or BPAFE09 for DB2 9 NFM and later.
Note: Use other parameter settings depending on installation requirements. For more information about these options, see the IBM DB2 Performance Monitoring and Tuning Guide.
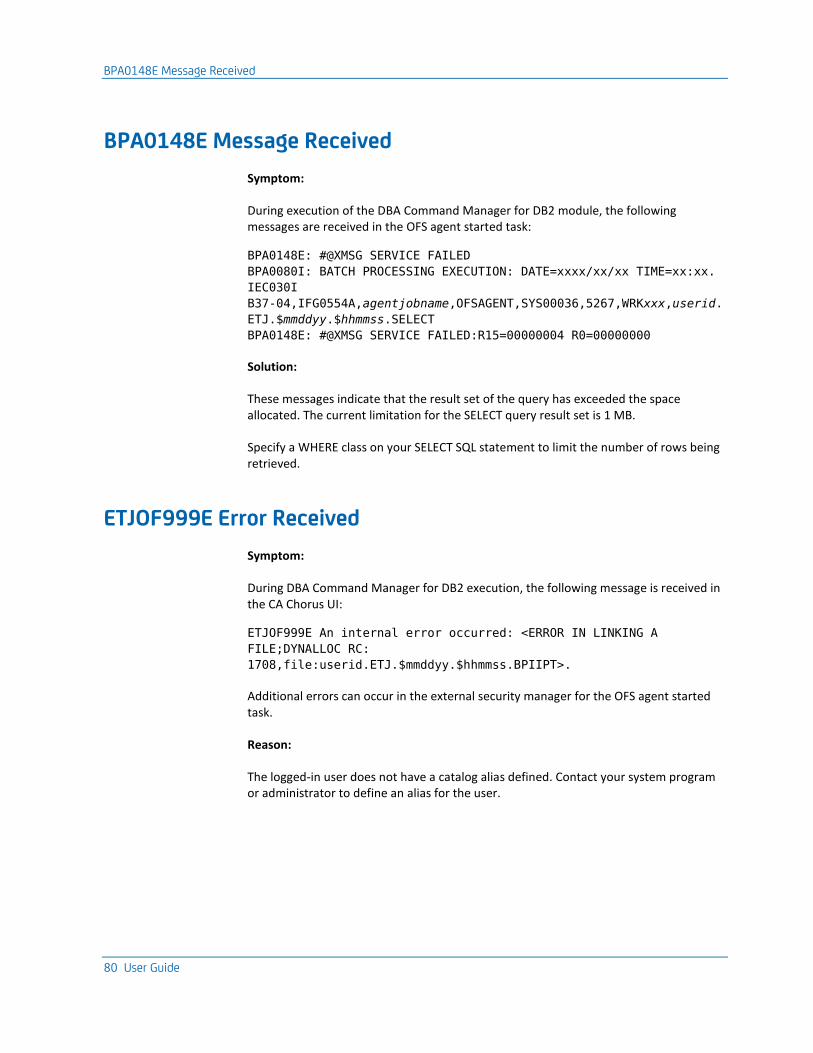
BPA0148E Message Received
80 User Guide
BPA0148E Message Received
Symptom:
During execution of the DBA Command Manager for DB2 module, the following messages are received in the OFS agent started task:
BPA0148E: #@XMSG SERVICE FAILED
BPA0080I: BATCH PROCESSING EXECUTION: DATE=xxxx/xx/xx TIME=xx:xx.
IEC030I
B37-04,IFG0554A,agentjobname,OFSAGENT,SYS00036,5267,WRKxxx,userid.
ETJ.$mmddyy.$hhmmss.SELECT
BPA0148E: #@XMSG SERVICE FAILED:R15=00000004 R0=00000000
Solution:
These messages indicate that the result set of the query has exceeded the space allocated. The current limitation for the SELECT query result set is 1 MB.
Specify a WHERE class on your SELECT SQL statement to limit the number of rows being retrieved.
ETJOF999E Error Received
Symptom:
During DBA Command Manager for DB2 execution, the following message is received in the CA Chorus UI:
ETJOF999E An internal error occurred: <ERROR IN LINKING A
FILE;DYNALLOC RC:
1708,file:userid.ETJ.$mmddyy.$hhmmss.BPIIPT>.
Additional errors can occur in the external security manager for the OFS agent started task.
Reason:
The logged-in user does not have a catalog alias defined. Contact your system program or administrator to define an alias for the user.
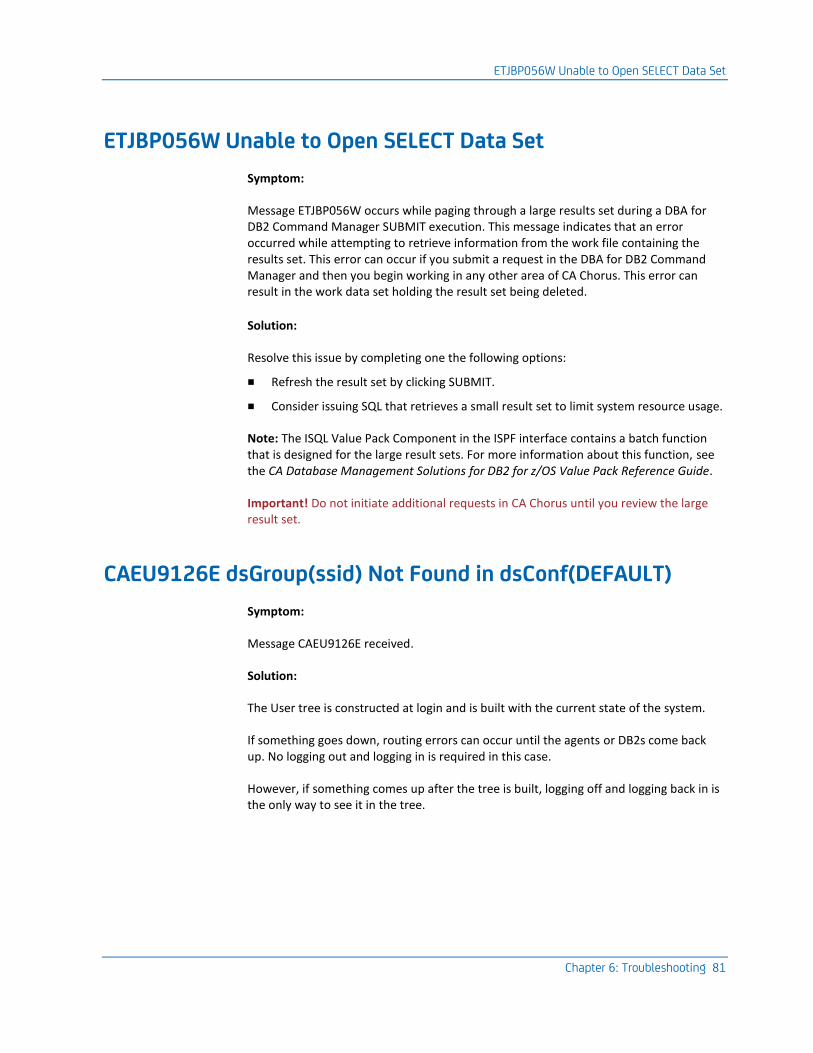
ETJBP056W Unable to Open SELECT Data Set
Chapter 6: Troubleshooting 81
ETJBP056W Unable to Open SELECT Data Set
Symptom:
Message ETJBP056W occurs while paging through a large results set during a DBA for DB2 Command Manager SUBMIT execution. This message indicates that an error occurred while attempting to retrieve information from the work file containing the results set. This error can occur if you submit a request in the DBA for DB2 Command Manager and then you begin working in any other area of CA Chorus. This error can result in the work data set holding the result set being deleted.
Solution:
Resolve this issue by completing one the following options:
■ Refresh the result set by clicking SUBMIT.
■ Consider issuing SQL that retrieves a small result set to limit system resource usage.
Note: The ISQL Value Pack Component in the ISPF interface contains a batch function that is designed for the large result sets. For more information about this function, see the CA Database Management Solutions for DB2 for z/OS Value Pack Reference Guide.
Important! Do not initiate additional requests in CA Chorus until you review the large result set.
CAEU9126E dsGroup(ssid) Not Found in dsConf(DEFAULT)
Symptom:
Message CAEU9126E received.
Solution:
The User tree is constructed at login and is built with the current state of the system.
If something goes down, routing errors can occur until the agents or DB2s come back up. No logging out and logging in is required in this case.
However, if something comes up after the tree is built, logging off and logging back in is the only way to see it in the tree.

Appendix A: DB2 Metrics Used by the Time Series Facility 83
Appendix A: DB2 Metrics Used by the Time Series Facility
Note: For a description of the DB2 metrics that TSF can use, see the PDTMET member of your_db2tools_hlq.CDBAPARM library.