bycatch estimates of coastal bottlenose dolphin …northeast fisheries science center reference...
TRANSCRIPT

Northeast Fisheries Science Center Reference Document 01-15
November 2001
Bycatch Estimatesof Coastal Bottlenose
Dolphin (Tursiops truncatus)in U.S. Mid-Atlantic
Gillnet Fisheriesfor 1996 to 2000
by
Debra L. Palka and Marjorie C. Rossman
00-14 Report of the 31st Northeast Regional Stock Assessment Workshop (31st SAW): Public Review Workshop. [Bythe 31st Northeast Regional Stock Assessment Workshop.] October 2000.
00-15 Report of the 31st Northeast Regional Stock Assessment Workshop (31st SAW): Stock Assessment ReviewCommittee (SARC) Consensus Summary of Assessments. [By the 31st Northeast Regional Stock AssessmentWorkshop.] October 2000.
00-16 Assessment of the Georges Bank Winter Flounder Stock, 1982-1987. By R.W. Brown, J.M. Burnett, G.A. Begg,and S.X. Cadrin. [A report of Northeast Regional Stock Assessment Workshop No. 28.] December 2000.
00-17 Assessment of the Georges Bank Atlantic Cod Stock for 2000. By L. O'Brien and N.J. Munroe. [A report of the 3rdTransboundary Resources Assessment Committee Meeting.] December 2000.
01-01 Description of the 2000 Oceanographic Conditions on the Northeast Continental Shelf. By M.H. Taylor and C.Bascuñán. February 2001.
01-02 Update Assessment of American Plaice in the Gulf of Maine - Georges Bank Region for 2000. By L. O'Brien andC. Esteves. [A report of Northeast Regional Stock Assessment Workshop No. 32.] February 2001.
01-03 Assessment of the Silver Hake Resource in the Northwest Atlantic in 2000. By J.K.T. Brodziak, E.M. Holmes,K.A. Sosebee, and R.K. Mayo. [A report of Northeast Regional Stock Assessment Workshop No. 32.] March 2001.
01-04 Report of the 32nd Northeast Regional Stock Assessment Workshop (32nd SAW): Public Review Workshop.[By the 32nd Northeast Regional Stock Assessment Workshop.] April 2001.
01-05 Report of the 32nd Northeast Regional Stock Assessment Workshop (32nd SAW): Stock Assessment ReviewCommittee (SARC) Consensus Summary of Assessments. [By the 32nd Northeast Regional Stock AssessmentWorkshop.] April 2001.
01-06 Defining Triggers for Temporary Area Closures to Protect Right Whales from Entanglements: Issues and Op-tions. By P.J. Clapham and R.M. Pace, III. April 2001.
01-07 Proceedings of the 14th Canada-USA Scientific Discussions, January 22-25, 2001, MBL Conference Center,Woods Hole, Massachusetts. By S. Clark and R. O'Boyle, convenors. May 2001.
01-08 TRAC Advisory Report on Stock Status: A Report of the Fourth Meeting of the Transboundary ResourcesAssessment Committee (TRAC), St. Andrews Biological Station, St. Andrews, New Brunswick, April 17-20,2001. [By the 4th Transboundary Resources Assessment Committee Meeting.] July 2001.
01-09 Results of a Field Collection of Biopsy Samples from Coastal Bottlenose Dolphin in the Mid-Atlantic. By J.Nicolas, D.C. Potter, C.W. Potter, and P.E. Rosel. July 2001.
01-10 Assessment of the Georges Bank Atlantic Cod Stock for 2001. By L. O'Brien and N.J. Munroe. [A report of the 4thTransboundary Resources Assessment Committee Meeting.] July 2001.
01-11 Protocol and Guide for Estimating Nucleic Acids in Larval Fish Using a Fluorescence Microplate Reader. ByE.M. Caldarone, M. Wagner, J. St. Onge-Burns, and L.J. Buckley. July 2001.
01-12 Northeast Fisheries Science Center Publications, Reports, and Abstracts for Calendar Year 2000. By L. Garnerand J.A. Gibson. August 2001.
01-13 Elemental Composition of Fish Otoliths: Results of a Laboratory Intercomparison Exercise. By V.S. Zdanowicz.September 2001.
01-14 Identification of Seasonal Area Management Zones for North Atlantic Right Whale Conservation. By R.L.Merrick, P.J. Clapham, T.V.N. Cole, P. Gerrior, and R.M. Pace, III. October 2001.
Recent Issues in This Series:
Northeast Fisheries Science Center Reference Document 01-15
U.S. DEPARTMENT OF COMMERCENational Oceanic and Atmospheric Administration
National Marine Fisheries ServiceNortheast Region
Northeast Fisheries Science CenterWoods Hole, Massachusetts
November 2001
Bycatch Estimatesof Coastal Bottlenose Dolphin (Tursiops truncatus)
in U.S. Mid-Atlantic Gillnet Fisheriesfor 1996 to 2000
by
Debra L. Palka and Marjorie C. RossmanNational Marine Fisheries Serv., 166 Water St., Woods Hole, MA 02543

This series is a secondary scientific literature series designed to assure the long-term documenta-tion and to enable the timely transmission of research results by Center and/or non-Centerresearchers, where such results bear upon the research mission of the Center (see the outside backcover for the mission statement). These documents receive internal scientific review but no technicalor copy editing. The National Marine Fisheries Service does not endorse any proprietary material,process, or product mentioned in these documents.
To obtain additional paper copies of documents in this series, contact the senior Center authorof the desired document. Refer to the title page of the desired document for the senior Center author'sname and mailing address. If there is no Center author, or if there is corporate (i.e., non-individualized) authorship, then contact the Center's Woods Hole Laboratory Library (166 Water St.,Woods Hole, MA 02543).
To access electronic copies of documents in this series, go to http://www.nefsc.nmfs.gov/nefsc/publications/, choose the "Selected, Full-Text, Online Publications" link, then scroll down to thecurrent-year section of the list of titles to find the document.
This report's publication history is as follows: manuscript submitted for review--October 11,2001; manuscript accepted through technical review--October 30, 2001; manuscript acceptedthrough policy review--November 2, 2001; and camera-ready copy submitted for publication--November 2, 2001. This report may be cited as:
Palka, D.L.; Rossman, M.C. 2001. Bycatch estimates of coastal bottlenose dolphin (Tursiops truncatus) in U.S.Mid-Atlantic gillnet fisheries for 1996 to 2000. Northeast Fish. Sci. Cent. Ref. Doc. 01-15; 77 p. Availablefrom: National Marine Fisheries Service, 166 Water St., Woods Hole, MA 02543-1026.
Northeast Fisheries Science Center Reference Documents
-iii-
TABLE OF CONTENTS
page
EXECUTIVE SUMMARY . . . . . . . . . . . . . . . . . . . . . . . . . . . . . . . . . . . . . . . . . . . . . . . . . . . . . v
INTRODUCTION . . . . . . . . . . . . . . . . . . . . . . . . . . . . . . . . . . . . . . . . . . . . . . . . . . . . . . . . . . . . 1
METHODS . . . . . . . . . . . . . . . . . . . . . . . . . . . . . . . . . . . . . . . . . . . . . . . . . . . . . . . . . . . . . . . . . 3 1. Bycatch Rates
1.A. Data . . . . . . . . . . . . . . . . . . . . . . . . . . . . . . . . . . . . . . . . . . . . . . . . . . . . . . . . 31.B. Development of a GLM Bycatch Model . . . . . . . . . . . . . . . . . . . . . . . . . . . . 41.C. Bycatch Rate Estimates . . . . . . . . . . . . . . . . . . . . . . . . . . . . . . . . . . . . . . . . . 7
2. Commercial Gillnet Landings2.A. Data . . . . . . . . . . . . . . . . . . . . . . . . . . . . . . . . . . . . . . . . . . . . . . . . . . . . . . . . 82.B. Prorating Commercial Gillnet Landings . . . . . . . . . . . . . . . . . . . . . . . . . . . . 8
2.B.1 Management Units Adjacent to New Jersey through Virginia . . . . 92.B.2 North Carolina Management Units . . . . . . . . . . . . . . . . . . . . . . . . 10
3. Observer Coverage . . . . . . . . . . . . . . . . . . . . . . . . . . . . . . . . . . . . . . . . . . . . . . . . . . . 104. Total Bycatch . . . . . . . . . . . . . . . . . . . . . . . . . . . . . . . . . . . . . . . . . . . . . . . . . . . . . . . 10
RESULTS . . . . . . . . . . . . . . . . . . . . . . . . . . . . . . . . . . . . . . . . . . . . . . . . . . . . . . . . . . . . . . . . . . 111. Bycatch Rates
1.A. Data . . . . . . . . . . . . . . . . . . . . . . . . . . . . . . . . . . . . . . . . . . . . . . . . . . . . . . . 111.B. Development of a GLM Bycatch Model . . . . . . . . . . . . . . . . . . . . . . . . . . . 111.C. Bycatch Rate Estimates . . . . . . . . . . . . . . . . . . . . . . . . . . . . . . . . . . . . . . . . 14
2. Commercial Gillnet Landings2.B. Prorating Commercial Gillnet Landings
2.B.1 Management Units Adjacent to New Jersey through Virginia . . . 152.B.2 North Carolina Management Units . . . . . . . . . . . . . . . . . . . . . . . . 16
3. Observer Coverage3.A. Management Units Adjacent to New Jersey through Virginia . . . . . . . . . . 173.B. North Carolina Management Units . . . . . . . . . . . . . . . . . . . . . . . . . . . . . . . 18
4. Total Bycatch . . . . . . . . . . . . . . . . . . . . . . . . . . . . . . . . . . . . . . . . . . . . . . . . . . . . . . . 18
DISCUSSION . . . . . . . . . . . . . . . . . . . . . . . . . . . . . . . . . . . . . . . . . . . . . . . . . . . . . . . . . . . . . . . 191. Bycatch Rates . . . . . . . . . . . . . . . . . . . . . . . . . . . . . . . . . . . . . . . . . . . . . . . . . . . . . . . 192. Commercial Gillnet Landings . . . . . . . . . . . . . . . . . . . . . . . . . . . . . . . . . . . . . . . . . . . 213. Observer Coverage . . . . . . . . . . . . . . . . . . . . . . . . . . . . . . . . . . . . . . . . . . . . . . . . . . . 214. Total Bycatch . . . . . . . . . . . . . . . . . . . . . . . . . . . . . . . . . . . . . . . . . . . . . . . . . . . . . . . 23
REFERENCES . . . . . . . . . . . . . . . . . . . . . . . . . . . . . . . . . . . . . . . . . . . . . . . . . . . . . . . . . . . . . . 24
TABLES . . . . . . . . . . . . . . . . . . . . . . . . . . . . . . . . . . . . . . . . . . . . . . . . . . . . . . . . . . . . . . . . . . . 25

-iv-
FIGURES . . . . . . . . . . . . . . . . . . . . . . . . . . . . . . . . . . . . . . . . . . . . . . . . . . . . . . . . . . . . . . . . . . 58
APPENDIX A. . . . . . . . . . . . . . . . . . . . . . . . . . . . . . . . . . . . . . . . . . . . . . . . . . . . . . . . . . . . . . . 72
APPENDIX B. . . . . . . . . . . . . . . . . . . . . . . . . . . . . . . . . . . . . . . . . . . . . . . . . . . . . . . . . . . . . . . 73

-v-
EXECUTIVE SUMMARY
To assess the status of coastal bottlenose dolphins (Tursiops truncatus), estimates of populationsize and human-caused mortalities are required. The purpose of this manuscript is to estimatehuman-caused mortalities of coastal bottlenose dolphins due to bycatch in mid-Atlantic gillnetfisheries operating during 1996 to 2000 in oceanic waters (outside of bays) adjacent to NewJersey to North Carolina.
During summer (May to October), three coastal bottlenose dolphin management units reside inthese waters: the Northern migratory, Northern NC, and Southern NC management units, andduring winter (November to April) there is one management unit: the mixed stock managementunit. This management unit was divided into two sub-units, one off North Carolina and one offVirginia. This is because, during winter most coastal bottlenose dolphins are off North Carolina,however, a small percentage are off Virginia; thus, bycatch rates off these two states differ. Themanagement units in waters north of Cape Hatteras extend12 km offshore, and those south ofCape Hatteras extend 27 km offshore.
Total bycatch was defined as the product of the bycatch rate, takes per unit effort, estimated froma sample of the fishery, and the total effort from the fishery. Due to practical reasons, bycatchrates were defined as the ratio of observed dead coastal bottlenose dolphins to observed metrictons of fish landed. Consequently, total effort was total commercial gillnet landings. Bycatch rates were estimated from a sample of fishing trips observed by the National MarineFisheries Service (NMFS) Northeast Fisheries Science Center (NEFSC) fisheries samplingprogram. These rates were estimated using a generalized linear model (GLM) that quantified therelationship between the number of observed takes and several variables: observed landings,seasonal management unit, body of water (state or federal waters), and mesh size category (small(# 5 inches), medium (> 5 to < 7 inches) or large ($7 inches)). These variables were chosen outof 14 variables using a stepwise selection method. The GLM model is essentially a way to, inone step, estimate separate bycatch rates within each seasonal management unit for sub-fisheriesrepresented by their mesh size and where they fish. Two variables not included in the bycatchmodel for practical reasons were a finer definition of distance from shore, and the presence orabsence of an anchor. These two variables did not significantly improve the model’s fit.
Total commercial metric tons of fish landed by the mid-Atlantic gillnet fishing fleet werecalculated using landings recorded in the NMFS Northeast Region (NER) dealer reportedcommercial landings database and the North Carolina Division of Marine Fisheries (NCDMF)trip ticket program. These two databases contain the amount of fish landed by species. Togenerate bycatch estimates, landings were needed for each level of the factors selected by theGLM. Because data from NER and NCDMF lacked information on haul locations, landings ofspecific fish species (to account for the GLM factor mesh size category) from either the NERvessel trip reports (VTR) or NEFSC fisheries sampling databases were used to prorate totallandings from the NER and NCDMF databases to water bodies within seasonal managementunits (to account for the GLM factors seasonal management and water body). Ideally, VTR data
would be the best to use for the prorations, because these data are suppose to be a census of thefishing fleet. However, the fisheries sampling observer data from North Carolina were morerepresentative than the North Carolina VTR data with respect to species composition and relativequantities of fish landed. Thus, fishery sampling observer data were used to prorate landingsfrom North Carolina, and VTR data were used for the other states.
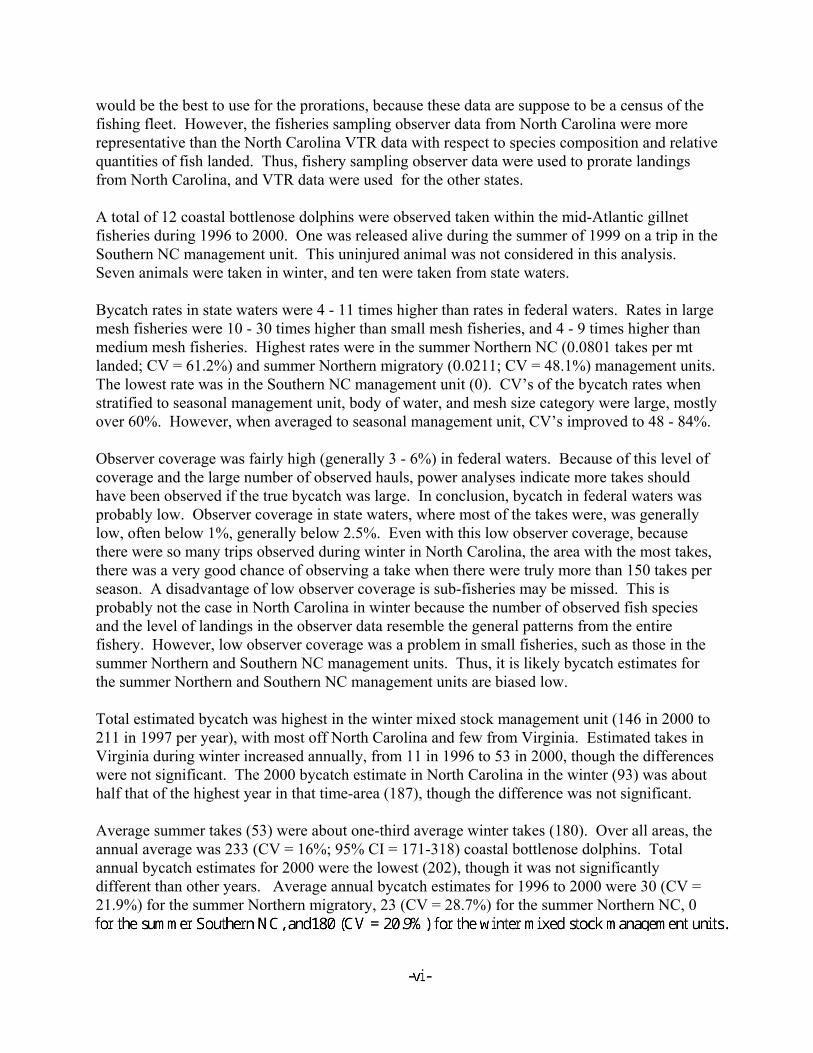
A total of 12 coastal bottlenose dolphins were observed taken within the mid-Atlantic gillnetfisheries during 1996 to 2000. One was released alive during the summer of 1999 on a trip in theSouthern NC management unit. This uninjured animal was not considered in this analysis. Seven animals were taken in winter, and ten were taken from state waters.
Bycatch rates in state waters were 4 - 11 times higher than rates in federal waters. Rates in largemesh fisheries were 10 - 30 times higher than small mesh fisheries, and 4 - 9 times higher thanmedium mesh fisheries. Highest rates were in the summer Northern NC (0.0801 takes per mtlanded; CV = 61.2%) and summer Northern migratory (0.0211; CV = 48.1%) management units. The lowest rate was in the Southern NC management unit (0). CV’s of the bycatch rates whenstratified to seasonal management unit, body of water, and mesh size category were large, mostlyover 60%. However, when averaged to seasonal management unit, CV’s improved to 48 - 84%.
Observer coverage was fairly high (generally 3 - 6%) in federal waters. Because of this level ofcoverage and the large number of observed hauls, power analyses indicate more takes shouldhave been observed if the true bycatch was large. In conclusion, bycatch in federal waters wasprobably low. Observer coverage in state waters, where most of the takes were, was generallylow, often below 1%, generally below 2.5%. Even with this low observer coverage, becausethere were so many trips observed during winter in North Carolina, the area with the most takes, there was a very good chance of observing a take when there were truly more than 150 takes perseason. A disadvantage of low observer coverage is sub-fisheries may be missed. This isprobably not the case in North Carolina in winter because the number of observed fish speciesand the level of landings in the observer data resemble the general patterns from the entirefishery. However, low observer coverage was a problem in small fisheries, such as those in thesummer Northern and Southern NC management units. Thus, it is likely bycatch estimates forthe summer Northern and Southern NC management units are biased low.
Total estimated bycatch was highest in the winter mixed stock management unit (146 in 2000 to211 in 1997 per year), with most off North Carolina and few from Virginia. Estimated takes inVirginia during winter increased annually, from 11 in 1996 to 53 in 2000, though the differenceswere not significant. The 2000 bycatch estimate in North Carolina in the winter (93) was abouthalf that of the highest year in that time-area (187), though the difference was not significant.
Average summer takes (53) were about one-third average winter takes (180). Over all areas, theannual average was 233 (CV = 16%; 95% CI = 171-318) coastal bottlenose dolphins. Totalannual bycatch estimates for 2000 were the lowest (202), though it was not significantlydifferent than other years. Average annual bycatch estimates for 1996 to 2000 were 30 (CV =21.9%) for the summer Northern migratory, 23 (CV = 28.7%) for the summer Northern NC, 0

1
INTRODUCTION
In accordance to the 1994 amendments to the Marine Mammal Protection Act (MMPA), thestatus of all marine mammal stocks within the US EEZ are assessed by comparing the populationsize, and resulting potential biological removal (PBR) level, to the annual human-causedmortalities levels. The purpose of this manuscript is to estimate for seasonal coastal bottlenosedolphin management units, the human-caused mortalities during 1996 to 2000 that were due tobycatch in mid-Atlantic gillnet fisheries. The mid-Atlantic gillnet fisheries being consideredtake place in oceanic waters adjacent to New Jersey to North Carolina.
The combined results of genetic, stable isotope, telemetric, and photo identification analyseswere used to define the spatial ranges of mid-Atlantic bottlenose dolphin (Tursiops truncatus)seasonal management units (SEFSC, in review). These results revealed that the coastal form ofbottlenose dolphins inhabit waters out to 12 kilometers from shore when off the coasts of NewJersey to Cape Hatteras, NC (35° 13.8' N), and out to 27 kilometers when in waters from CapeHatteras, NC to Jacksonville, FL. These results also revealed the coastal bottlenose dolphinsmove between two seasonal habitats, where summer was defined as May to October and winteras November to April. Thus, the seasonal management units of the coastal bottlenose dolphinthat will be considered here include (Figure 1):
During summer (May to October): 1) Northern Migratory Management Unit,
located between New Jersey (40° 30' N) and the North Carolina/Virginia border(36° 31.8' N);
2) Northern NC Management Unit, located between the North Carolina/Virginia border (36° 31.8' N) and CapeLookout, NC (34° 37.8' N);
3) Southern NC Management Unit, located between Cape Lookout, NC (34° 37.8' N) and Murrell’s Inlet, SC (33°31.2' N);
During winter (November to April):4) Mixed Stock Management Unit,
located mainly north of Murrell’s Inlet, SC (33° 31.2' N) to the NorthCarolina/Virginia border (36° 31.8' N), however, few are within Virginia waters,thus there are two sub-units:a) NC Mixed Stock Sub-Management Unit, andb) VA Mixed Stock Sub-Management Unit.
Total bycatch of dolphins from these seasonal management units was defined as the product ofthe: 1) bycatch rate, takes per unit effort, estimated from a sample of the fishery, and 2) totaleffort from the entire fishery. Due to practical reasons, the bycatch rate was defined as the ratioof the observed number of dead coastal bottlenose dolphin takes to observed metric tons of fish
2
landed. Consequently, total effort was defined as total commercial gillnet landings (in metrictons).
Bycatch rates were estimated from a sample of fishing trips observed by the National MarineFisheries Service (NMFS) Northeast Fisheries Science Center (NEFSC) fisheries samplingprogram. This program, initiated during mid-1994 in mid-Atlantic waters, was designed tomonitor the incidental take of marine mammals in selected fisheries. The total commercialmetric tons of fish landed by the mid-Atlantic gillnet fishing fleet were calculated using landingsrecorded in the NMFS Northeast Region (NER) dealer reported commercial landings databaseand the North Carolina Division of Marine Fisheries (NCDMF) trip ticket program. These twodatabases contain the amount of fish landed by species for different types of fishing gear.
In the past, the NEFSC used the ratio method (Cochran 1977) to estimate total bycatch of marinemammals in fisheries (e.g., Rossman and Merrick 1999). However, other analytical methodswere necessary in this case because the 1996 to 2000 data set of observed coastal bottlenosedolphin bycatch was binomially distributed (contains either zero or one bottlenose dolphin perfishing haul) with a very large proportion of zeros (13 bottlenose dolphin takes in over 7000observed hauls, Waring et al. 2000). Two methods that have been used to estimate bycatch fromdata sets with such properties include the delta method (for example for marine mammals andturtles bycaugth in the pelagic long line fishery; Johnson et al. 1999), and the generalized linearmodel (GLM) method (for example, for fish bycatch in US shrimp trawls; Ortiz et al. 2000).
After preliminary analysis and review of these three statistical methods, the GLM method wasdetermined to be the most appropriate analytical method for the coastal bottlenose dolphinbycatch data. This is because (Table 1):
1) Half of the assumptions for the ratio method were violated, 2) All the assumptions for the GLM method were valid; and 3) Though the two primary assumptions from the delta-distribution method were not
violated, conditions that indicated the presence of a positive bias and inefficiencycould be demonstrated.
Thus, the GLM method will yield the most accurate and least biased bycatch rates and mortalityestimates.
Section 1 of this manuscript describes the fishery sampling observer data and statistical methodsused to estimate bycatch rates. The bycatch rates were estimated from a GLM that used gearcharacteristics and fishing practices to predict the number of coastal bottlenose dolphin takes thatwere observed in the fishery sampling observer program. Section 2 describes the landingdatabases and analytical methods used to estimate total commercial gillnet landings in oceanicwaters (excluding bays and sounds) for the factors selected by the bycatch rate model. Section 3reports observer coverage of each dolphin seasonal management unit. And finally, section 4reports annual estimates of bycatch from the mid-Atlantic gillnet fisheries for each coastalbottlenose dolphin seasonal management unit for 1996 to 2000.
3
METHODS
1. Bycatch Rates
1.A. Data
Bottlenose dolphins were observed taken in mid-Atlantic gillnet fisheries in both the coastalbottlenose dolphin habitat ( 0 to 12 (or 27) km from shore - as defined above) and offshorebottlenose dolphin habitat (outside of the coastal bottlenose dolphin habitat). This paper focusesonly on coastal bottlenose dolphin takes.
To estimate coastal bottlenose dolphin bycatch rates, the NMFS/NEFSC fisheries samplingobserver data collected during 1996-2000 were used. The fishery observer program collects dataon characteristics of the trip, haul, gear, economic factors, fish species caught, and incidentaltakes. Trip characteristics include the vessel name and number, date sailed, date landed, homeport, port fish landed, steam time, and number of crew. Economic factors related to the tripinclude the tons of ice used, fuel used, damage costs, and price of water, food, oil, and bait. Characteristics of a haul include weather conditions, wind speed and direction, wave height,depth range, time string soaked for, direction string set, latitude and longitude of the set and haullocations, date of the set and haul, time set and time hauled, fish species captain targeted,presence and quantity of fish caught to be landed and to be discarded, presence of incidentaltakes of marine mammals, seals, turtles, or birds, and presence and number of active and passivedeterrent devices. Gear characteristics include number of nets, length and height of a net,hanging ratio, vertical mesh count, mesh size range, twine size, number of strands in the net, netmaterial, net color, use of a float line, length of float line, material of float line, number of floats,length of lead line, number and width of spaces between nets, presence of and length of tiedowns, and weight of anchor, if used. When an incidental take occurs, the following are alsorecorded: species identification, number of each species, net animal caught in, condition of thebody, body length, sex, tag number (if body returned to sea), types of samples taken (body partsor whole animal), and frame number of roll of film if pictures were taken.
The GLM of bycatch rates used data from those gillnet hauls observed within the oceanic portionof the coastal bottlenose dolphin habitat (excluded bays and sounds), and within the time periodNovember 1995 to November 2000. This time period covers winter 1996 (November 1995through April 1996) to summer 2000 (May through October 2000). The data include all types ofgillnets; those that were anchored and not anchored, and those on the bottom, in the watercolumn, and at the surface. Because it was not possible to distinguish between these differenttypes, all types were included in this analysis. Only dead bottlenose dolphin were considered toin the bycatch estimate.
To investigate bycatch rates in the winter mixed stock management unit, only trips that landed inNorth Carolina and Virginia were used. This was done because field observations indicate that

4
during winter, most coastal bottlenose dolphins are found in waters off North Carolina, with veryfew dolphins off Virginia, and even fewer, if any, north of Virginia (SEFSC in review). Thus,bycatch from the winter mixed stock management unit was the sum of the bycatch from thewinter VA mixed stock sub-management unit and from the winter NC mixed stock sub-management unit. To investigate bycatch rates in the Northern migratory management unitduring summer, trips that landed in New Jersey, Delaware, Maryland, and Virginia were used. For bycatch rates in the Southern NC management unit, only trips from North Carolina wereused. Although this management unit extends into South Carolina, only very limited gillnettingis allowed in South Carolina, so it was assumed there was no bycatch in the waters of SouthCarolina.
1.B. Development of a GLM Bycatch Model
The aim of the GLM was to use the fishery observer program data to describe the relationshipbetween bycatch rates of coastal bottlenose dolphins (number of bottlenose dolphin takes permetric tons of landings of fish) and important gear characteristics and fishing practices. A wayto interpret a GLM like this is, in one step, estimate separate bycatch rates within each seasonalmanagement unit for sub-fisheries that are represented by some combination of gearcharacteristics and fishing practices. Examples of gear characteristics include twine size, string length, and soak duration. Examplesof fishing practices include season, year, location, and management unit. All variables that wereinvestigated were defined in Table 2. Assuming the observed trips were representative of theentire fishery, the GLM was then used to predict bycatch rates that explicitly account fordifferences in gear characteristics and fishing practices. This assumption is investigated in theproration section below.
The steps to develop the GLM between the bycatch rate of coastal bottlenose dolphins andpotential explanatory variables (gear characteristics and fishing practices) were: 1) determine thegeneral formula for the model, 2) determine most appropriate statistical distribution to model therelationship, 3) select a set of variables that best describes the relationship, 4) investigate if othervariables should be included, and then 5) check the fit of the model.
Step 1: determine best general formula for the modelThe bycatch rate of bottlenose dolphins is a ratio of two quantities: count of observed bottlenosedolphin takes, and metric tons of observed fish landings. A GLM of the bycatch rate is:
log ...takeslandings b b x b x
= + + +0 1 1 2 2 (1)
which can be re-written as:
5
( )log log( ) ...takes landings b b x b x= + + + +0 1 1 2 2 (2)
where the b’s are parameter coefficients and x’s are the gear characteristic and fishing practicevariables. In words, Equation 2 means the number of takes is modeled by a set of explanatoryvariables (b0 + b1 x1 + b2 x2 + ...) and an offset variable (log(landings)). Equation 2 becomes thegeneral formula for the GLM used in this analysis.
Step 2: determine most appropriate distribution to model the relationshipThe question is: What type of distribution best models the relationship between the responsevariable (number of bottlenose dolphin takes) and potential explanatory variables (managementunit, landings kept, gear characteristics and fishing practices)? In this case, the number ofdolphin takes were counts that ranged from zero to one. The Poisson distribution is commonlyused with count data. The Binomial distribution is used with binary data, that is, datarepresented by the presence or absence of a factor (zero or one take per haul). In the case ofbottlenose dolphin takes both the Poisson and Binomial distributions are applicable because thedolphin takes are counts that range from zero to one. There is no a prior reason that the count ofdolphins caught in a gillnet are limited to just zero and one (thus, leading to a Poissondistribution), however, in our sample, the counts have been limited to zero and one (thus, leadingto a Binomial distribution). When the response variable is a binary response, and the othervariables in the model are explanatory variables, using the Binomial distribution is equivalent tothe Poisson distribution. McCullagh and Nelder (1991) recommends that when there is a singleresponse variable that is binomially distributed, it is simpler and more natural to use theBinomial distribution, though the Poisson distribution is also appropriate.
Step 3: select a set of variables that best describes the relationshipThe backward-forward stepwise selection method was used to determine the best fitting model. This method starts with a complex model and then, in steps, successively simplifies the model sothat the fit improves at each step. In this analysis, the complex model contained variables thatwere essential for the purpose of estimating the total bycatch, as well as other potentialexplanatory variables. The two essential variables are landings kept and management unit. Thelatter is essential because the model must estimate the total bycatch rate for each managementunit. So, for example, even if management unit was not one of the best fitting variables in thebycatch model, it was necessary to include it in the model. Potential explanatory variablesincluded in the model have two requirements: 1) be related to the bycatch rate of coastalbottlenose dolphins, and 2) be structured such that both observed and total landings kept can becalculated for each level of the variable.
It was necessary to pool levels of some variables which have many levels, were continuous, orhad to be redefined to calculate total landings for each level. This was necessary becausecommercial landings were known for specific fish species, but not known for other variables,such as mesh size, twine size, soak duration, etc. So, to determine the best way to pool like-levels and account for the fish species landed, the classification TREE method was used(Venables and Ripley, 1999). For example, to determine the best definition of categories of
6
mesh sizes, the classification TREE method was used to divide mesh sizes into groups of meshsizes that best predicted the mesh size used for each target species. The classification TREEmodel was fit using binary recursive partitioning whereby data were successively split alongcoordinate axes of the predictor variables so that at any node, the split maximally distinguishedthe response variable in the left and right branches. Splitting continued until nodes were pure ordata were too sparse. The new definition of levels of the mesh size were then put into the GLMto determine how the new classification was related to the bycatch rate.
The final model selected was the combination of variables that best fit the data, i.e., had thesmallest Akaike Information Criterion (AIC), which is defined as:
(3)( ) ( )AIC likelihood of el number of parameters= − • + •2 2log m od
The AIC is similar to an adjusted R2 in regular regression in that it is a measure of the level ofparsimony. A parsimonious model is a model that fits the data well and includes as fewparameters as possible.
Step 4: investigate if other variables should be includedBecause not all variables were included in the complex model used in the stepwise selectionmethod, it was of interest to investigate if including other variables could improve the fit of themodel. This was done by adding additional variables into the model that resulted from thestepwise selection method and evaluating the AIC statistic. If the AIC decreased, then theadditional variable improved the fit of the model. A Chi-square test between the models withand without the new variable was used to determine if the improvement was significant. Theadditional variables also had to be evaluated to determine the practicality in calculating totallandings for the fleet for each level.
Step 5: check the fit of the modelA model provides an accurate description and inference for a data set only if it fits that data setwell. Tests of each parameter, summary goodness-of-fit statistics, and investigation of residualswere used to determine the adequacy of the model fit, where a residual is the difference betweenthe observed value and the value predicted by the model. For a model that fits perfectly, eachresidual equals zero; that is, the observed value equals the predicted value.
To test the significance of each variable in the model, an analysis of deviance for the sequentialaddition of each variable was conducted. This test indicates the significance of a variable giventhe variables already in the model. If the p-value for the Chi-square test is less than 0.05 thenthat variable is important and adds new information, even after adjusting for the previousvariables.
The purpose of goodness-of-fit tests are to test whether the chosen model fits the data. Thiswas done by performing a Fisher Exact test and a linear regression on the predicted and actualnumber of takes within each management unit. Within each management unit, the sum of

7
predicted takes, and sum of observed takes were computed. Using these sums, the following nullhypothesis (H0) was tested:
H0: number of predicted takes = number of actual takes.
The Fisher Exact test is similar to the Pearson’s Chi-square test, but the Fisher Exact test doesnot require large sample sizes within a cell, as the Chi-square test does. Thus, the Fisher Exacttest is more appropriate in this case. If the p-value for this test is less than 0.05 then the nullhypothesis is rejected, implying that the number of predicted takes does not equal the actualtakes and so the model does not fit well.
A linear regression between the number of predicted takes and the number of observed takesvisually displays how well the model fits, and the R2 value of the regression indicates how wellthe model predicted the actual data. R2 ranges from 0 to 1, where 0 indicates no associationbetween the actual and predicted values (the model does not fit) and 1 indicates perfectassociation (the model fits perfectly).
Goodness-of-fit statistics broadly summarize how well the model fits the data. To obtain furtherinsight into details of the fit of the model, the structure of the residuals (difference betweenobserved and predicted values) were investigated. Examining a plot of residuals againstpredicted values can reveal unexplained structure in the residuals of, say, only a part of the data. In a model that fits well there is no structure in the residuals; the pattern appears as randomnoise. Two sets of diagnostic plots were investigated. The first set of diagnostic plots comefrom a diagnostic model that was between the predicted number of takes from the GLM modeland the observed number of takes. The diagnostic plots included: 1) a plot of the residuals fromthe diagnostic model versus the predicted values from the GLM model, and 2) a plot of theobserved number of takes versus the predicted number of takes from the diagnostic model. Thesecond set of diagnostic plots were plots of the relative contribution of each level of eachexplanatory variable. In a model that fits well, residuals are spread evenly around the mean ofeach level, and standard errors (SE) are tight around the mean.
1.C. Bycatch Rate Estimates
Parameters estimates from the best fitting GLM were used to predict the average bycatch rate foreach management unit, accounting for important gear characteristics and fishing practicesselected by the model.
The coefficient of variation (CV) of a bycatch rate was estimated using bootstrap re-samplingtechniques. The re-sampling unit was a haul and was sampled with replacement. One thousandbootstrap samples were drawn. The CV of the bycatch rate was defined as the standard error(SE) of the bycatch rates from the 1000 bootstrap samples divided by the bycatch rate estimatedfrom the original data.

8
2. Commercial Gillnet Landings
2.A. Data
Two data sources used to compile total gillnet landings during the time period winter 1996(November 1995 through April 1996) to summer 2000 (May to October 2000) were: 1) the NMFSNER dealer reported commercial landings database; and 2) the NCDMF trip ticket programdatabase.
The NER dealer reported commercial landings database contains data on commercial landings ofmarine species harvested from both state (0 to 4.8km (0 to 3 nautical miles (nmi)) from shore) andfederal waters (4.8 to 320km (3 to 200 nmi) from shore). Data from the states of Maine throughNorth Carolina are contained in this database. Data on species harvested exclusively under statejurisdiction are reported to NMFS by the state of Virginia. In contrast, data on species harvestedunder both state and federal jurisdictions combined are reported by the states of Maryland,Delaware and New Jersey. Data from all states are collected from federally permitted seafooddealers and include species, market category, pounds landed, gear type, water body (whenavailable), date, port, and county where species were landed. However, data on individual triplocation or gear characteristics are not recorded in this database (Wigley et al. 1998).
The NCDMF data from the trip ticket program include commercial landings from North Carolinaonly. These data are collected by federally permitted seafood dealers and include speciesharvested from both state and federal waters. Similar to the NER dealer database, the NCDMFinclude data on species, pounds landed, gear type, water body, date, and county where specieswere landed, but no data on individual trip location or gear characteristics.
When we requested the NCDMF data from the state of North Carolina, the data from 2000 wereconsidered by the state of North Carolina as preliminary. These data will have to be requestedagain and bycatch estimates will have to be re-calculated. Therefore, it is possible landings fromNorth Carolina during 2000 will change, and so may the 2000 bycatch estimates for managementunits off North Carolina.
2.B. Prorating Commercial Gillnet Landings
To generate estimates of total bycatch, landings were needed for each level of the factors selectedby the GLM (seasonal management unit, mesh size category, and water body). Because data inthe NER and NCDMF databases lacked information on haul locations, data from the NEFSCfishery sampling observer data or NER vessel trip reports (VTR) data, which do include locationsof fishing trips, were used to prorate the landings to water body. The VTR data have also beenused to prorate NER landings to water body for bycatch estimates from the Northeastmultispecies gillnet fisheries in the Gulf of Maine region (Rossman and Merrick 1999). Theproration factor was the percentage of landings of specific fish species (to account for the GLMfactor mesh size category) that were within each water body and seasonal management unit (toaccount for the GLM factors seasonal management and water body). There were landings from

9
three water bodies included in the landing databases: 1) state waters within the coastal dolphinhabitat; 2) federal waters within the coastal dolphin habitat; and 3) federal waters outside thecoastal dolphin habitat (within the offshore dolphin habitat). Only the first two water bodies wereneeded to estimate bycatch of coastal bottlenose dolphins.
For NER landings data from several mid-Atlantic states, landings from state oceanic waters wereexplicitly defined, and so proration of landings within the state coastal habitat was not necessary. While for data from other states, landings from state oceanic waters were combined with federaloceanic waters and so proration was necessary to determine the landings within each water body. Because quality of location data in the VTR and fishery sampling observer databases varied bystate, prorations of landings from a state were calculated from the database with the highestquality data for that state. Ideally, the VTR data is the best database to use for the prorations,because these data are suppose to be a census of the fishing industry. In contrast, the fisherysampling observer data was designed to be a sample of the fishery. However, in North Carolina,the VTR data were missing trips from most of the counties and many of the smaller sub-fisheries. Thus, landings from North Carolina were prorated using the fishery sampling observer data, whilelandings from the other states were prorated using the VTR data. Details of the prorationmethods for each management unit are described below.
2.B.1. Management Units adjacent to New Jersey through Virginia
VTR data were used to prorate commercial gillnet landings from the NER dealer landingsdatabase to the water bodies within the seasonal management units adjacent to Virginia,Maryland, Delaware, and New Jersey. For each season, winter 1996 to summer 2000, total effort for a management unit and water body(Hysumw) was defined as metric tons of fish landed (H) by year (y), season (s), management unit(u), mesh category (m), and water body (w). This was estimated by first, prorating the individualstate’s (t) total landings (Htysum) by the percentage of fish landed within each water body, asreported in the VTR database (Dtysumw), then summing over the states (t):
H Ht
ysumw tysum tysumw= •∑ ρ (4)
where
ρtysumwHtysumwHtysum
water body landingstotal landings
= = (5)
Gillnet landings from Virginia state waters were explicitly defined and so did not have to beprorated. Landings from Virginia federal waters were prorated to the federal coastal habitat andthe federal offshore habitat water bodies. In contrast, gillnet landings from state waters ofMaryland and New Jersey were not explicitly defined and so landings for these states wereprorated to all three water bodies. Ocean gillnet landings from Delaware came entirely fromwithin the state coastal habitat water body and hence did not have to be prorated.
10
2.B.2. North Carolina Management Units
To determine which data set contained the most representative sample of North Carolina’sfisheries, landings from the VTR database were compared to landings from the fisheries samplingobserver and the NCDMF databases. It was found that the VTR’s were only available from Darecounty. Therefore, fishery harvests south of Cape Hatteras were not reported in the VTR data. Although the number of VTR’s submitted by North Carolina have consistently increased since1996, the proportion of VTR’s with missing or unknown locations has also increased. On theother hand, the NEFSC sampling fisheries observer database included information on trip’slocations and contained samples of gillnet trips from all counties, and samples from trips thatlanded many species, even rare species (Appendix A). An interpretation of this is, in order tocapture the rare species and also capture the same peaks as in the NCDMF landings data, thefishery sampling observer program must be tracking the spatial and temporal patterns of thedifferent sub-fisheries fairly well. In conclusion, the fisheries sampling observer data from NorthCarolina are likely a more representative sample than the NC VTR data. Therefore, the NEFSCfisheries sampling observer data were used to prorate commercial landings from the NCDMFdatabase to water bodies within the winter NC mixed stock, summer Northern NC, and summerSouthern NC management units.
Total effort within the North Carolina seasonal management units, water bodies, and meshcategories were defined using Equations 4 and 5, where the state (t) was always North Carolinaand the proration (D) was estimated from observer data.
Gillnet landings from North Carolina state waters were explicitly defined and so did not have tobe prorated. Therefore, only landings from North Carolina federal waters were prorated to thefederal coastal habitat and federal offshore habitat water bodies.
3. Observer Coverage
Observer coverage of the mid-Atlantic gillnet fisheries was defined as the percent of observedmetric tons of fished landed from the fishery sampling observer data to the total metric tons offish landed. Observer coverage was calculated for each year, seasonal management unit, andwater body combination. Years included 1996 to 2000; seasons included summer (May toOctober) and winter (November to April); water bodies included state waters within the coastaldolphin habitat, federal waters within the coastal dolphin habitat, and federal waters outside thecoastal dolphin habitat. The pro-rated metric tons of landings to water body were used as themeasure of effort for each strata.
4. Total Bycatch
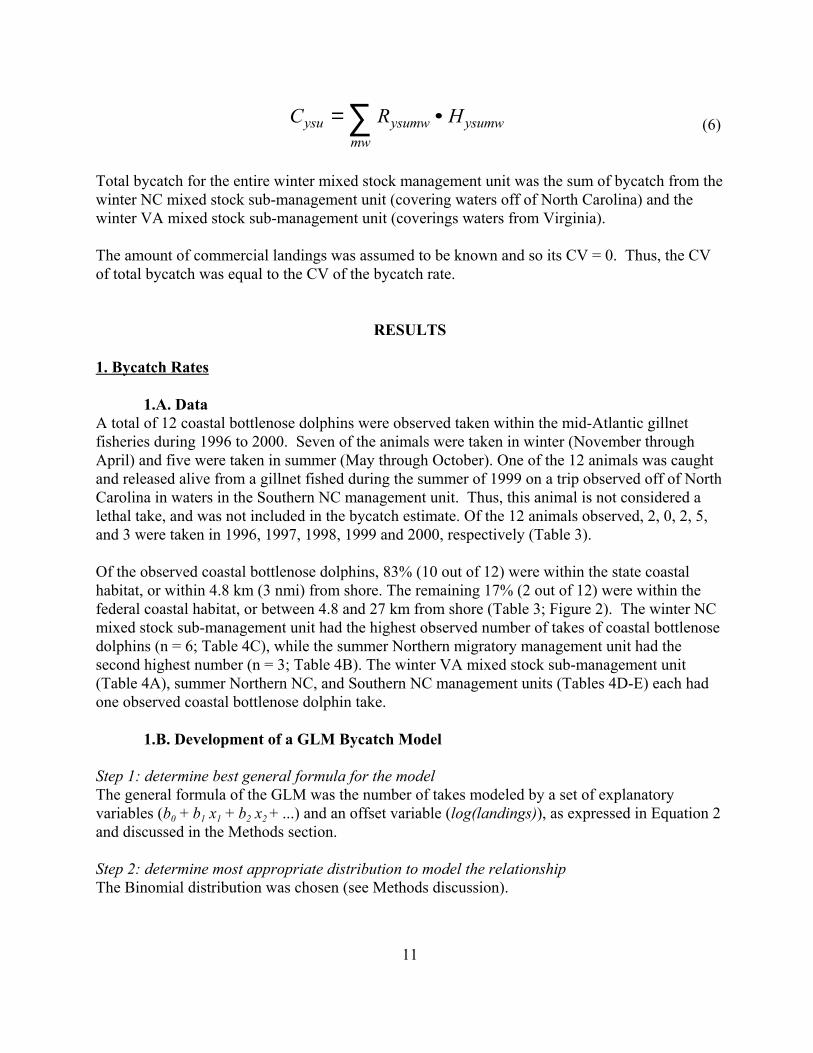
Total bycatch within a year for a seasonal management unit (Cysu) was the sum of bycatchestimates from all water bodies and mesh size category combinations within that seasonalmanagement unit and year combination. Each bycatch estimate was the product of the bycatchrate (R) as estimated by the GLM and landings (H):
11
C R Hysu ysumw ysumwmw
= •∑ (6)
Total bycatch for the entire winter mixed stock management unit was the sum of bycatch from thewinter NC mixed stock sub-management unit (covering waters off of North Carolina) and thewinter VA mixed stock sub-management unit (coverings waters from Virginia).
The amount of commercial landings was assumed to be known and so its CV = 0. Thus, the CVof total bycatch was equal to the CV of the bycatch rate.
RESULTS
1. Bycatch Rates
1.A. DataA total of 12 coastal bottlenose dolphins were observed taken within the mid-Atlantic gillnetfisheries during 1996 to 2000. Seven of the animals were taken in winter (November throughApril) and five were taken in summer (May through October). One of the 12 animals was caughtand released alive from a gillnet fished during the summer of 1999 on a trip observed off of NorthCarolina in waters in the Southern NC management unit. Thus, this animal is not considered alethal take, and was not included in the bycatch estimate. Of the 12 animals observed, 2, 0, 2, 5,and 3 were taken in 1996, 1997, 1998, 1999 and 2000, respectively (Table 3).
Of the observed coastal bottlenose dolphins, 83% (10 out of 12) were within the state coastalhabitat, or within 4.8 km (3 nmi) from shore. The remaining 17% (2 out of 12) were within thefederal coastal habitat, or between 4.8 and 27 km from shore (Table 3; Figure 2). The winter NCmixed stock sub-management unit had the highest observed number of takes of coastal bottlenosedolphins (n = 6; Table 4C), while the summer Northern migratory management unit had thesecond highest number (n = 3; Table 4B). The winter VA mixed stock sub-management unit(Table 4A), summer Northern NC, and Southern NC management units (Tables 4D-E) each hadone observed coastal bottlenose dolphin take.
1.B. Development of a GLM Bycatch Model
Step 1: determine best general formula for the modelThe general formula of the GLM was the number of takes modeled by a set of explanatoryvariables (b0 + b1 x1 + b2 x2 + ...) and an offset variable (log(landings)), as expressed in Equation 2and discussed in the Methods section.
Step 2: determine most appropriate distribution to model the relationshipThe Binomial distribution was chosen (see Methods discussion).
12
Step 3: select a set of variables that best describes the relationshipThe full model (a large, complex model) had the essential variables (management unit and theoffset of landings) and many other potential explanatory variables:
log(num.bodo) ~ MU + offset(log(land.kept.mton)) + state.or.fed + year + (7)target.species + soak.duration + km.hr + season + string.length +escape.panel.used + twine.size + mesh.size.
All variables investigated, their definitions, and abbreviations are listed in Table 2., The fullmodel was used to start the stepwise model selection.
Using the backward-forward stepwise model selection method, the model:
log(num.bodo) ~ MU + state.or.fed + mesh.size + offset(log(land.kept.mton)) (8)
was chosen because it fit the data the best (i.e., it had the lowest AIC; Table 5).
The variable mesh.size had values that range from 1.3 to 13 inches. To use Equation 8 toestimate total bycatch, the bycatch rate for each mesh size must be multiplied by the totallandings for each mesh size. Due to the lack of mesh size data in the commercial landingsdatabases, it was not possible to determine total landings for each mesh size directly. So a meshsize proxy was generated by creating three categories of mesh sizes (small, medium, and large),where each target species was assigned to a mesh size category.
The best definition of mesh size categories was defined using a classification TREE method thatused mesh size, management unit, and year to predict the target species. Using this model, it waspossible to correctly predict which target species the captain was fishing for 74% of the time. This TREE model indicated the appropriate cut points for the mesh size categories were 5.1 and6.85 inches (Figure 3). This resulted in three mesh size categories: small: #5.0 inches, medium: >5.0 to < 7.0 inches, and large: $7.0 inches. These categories represent different groups of targetspecies quite well (Table 6). Using this definition of mesh size categories, the NEFSC fisherysampling observer data (Appendix B) and total commercial landings were divided into seasonalmanagement units, water bodies, years, and mesh size categories.
Using mesh size categories (mesh.cats) in the GLM improved the AIC to174.3 from 175.38,which was for the model that used the exact mesh size (mesh.size). In other words, the modelthat used the mesh size categories fit the data slightly better. In conclusion, the best fitting modelwas:
log(num.bodo) ~ MU + state.or.fed + mesh.cats + offset(log(land.kept.mton)) (9)
Step 4: determine if other variables should be includedBecause not all potential variables were included in the complex, full model, other variables wereadded to the model to determine if the fit could be improved. Eight additional variables were
13
investigated, and it was found that they did not significantly improve the fit (Table 7). The AICwas lower (i.e., the model fit slightly, but not significantly, better) when two types of variableswere added.
The first type of variable that improved the fit was finer resolution of the distance from shore(dist2shore and dist2shoreA). The model in Equation 9 included the variable state.or.fed, whichindicated if the haul was in state or federal waters. But when an even finer resolution of distancefrom shore was included in the model, the new model fit slightly better. The new model indicatedthe bycatch rate was highest for observed hauls within 3 km of shore. A Chi-square testcomparing the model with and without dist2shoreA indicated the model with dist2shoreA was nota significantly better model (P2 test; p=1.0). In addition, for the purposes of estimating the totalbycatch, the variable dist2shoreA was problematic in that it required a further very fine-scaleproration of the landings data. That is, it would of been necessary to estimate total landings thatused a specific mesh size category and that were caught between the shore and 3 km, between 3and 4.8 km, and between 4.8 km and the outside of the coastal bottlenose dolphin habitat (12 or27 km). Because of this complexity and lack of significance, this variable was not used in thebycatch model.
The second variable type that improved the fit of the model was the presence or absence of ananchor (anchor.used). As with the distance to shore variables, adding anchor.used did notsignificantly improve the model (P2 test; p=0.81). In addition, it was not practical to use it toestimate total landings because it was not possible to predictable divide the fish species caught (areliable variable in the landings databases) into those caught in strings with or without an anchor. For example, 54% of the observed hauls that targeted Atlantic croaker did not use an anchor, and42% of the observed hauls that targeted spiny dogfish did not use an anchor.
Step 5: check the fit of the modelAn analysis of deviance for the sequential addition of each variable was conducted to test thevariable’s significance. The results (Table 8) indicated that the variable management unit (MU)was not as important as the other variables variable. However, it was necessary to include it inthe model to produce a bycatch rate for each management unit . The other two variables,state.or.fed and mesh.size.catagory, were significant and therefore, useful in modeling the bycatchrate. This analysis also indicated that the state.or.fed variable was more highly correlated withbycatch than the mesh.cat variable was.
The tests for goodness-of-fit investigate if the chosen model fits the data, i.e., the predictednumber of takes equals the observed number of takes. Within a management unit, this hypothesiscould not be rejected using the Fisher Exact test (Table 9); thus, indicating the model fits the data. The linear regression results indicated the same thing. Fits between observed number of takesand predicted number of takes for a management unit were quite good (R2 greater than 0.5) for allmanagement units, except the summer Northern Migratory management unit, where the R2 was0.34 (Table 9; Figures 4A and 4B). For this management unit, the model slightly under-estimatedthe number of takes.

14
Two sets of diagnostic plots displayed the structure of residuals of a model between the predictedand observed number of takes in a seasonal management unit. The first set of diagnostic plotsindicated that there were no obvious outliers, but there still was some unexplained structure in theresiduals (Figures 5A and 5B). In a model that fits perfectly, the residuals would be scatteredabout zero with no pattern. The R2 for this model was 0.75 (CV=0.12) and the slope was 0.92. Ifthere was a perfect fit, the R2 and slope would both be 1.0. The second set of diagnostic plots(Figure 6) showed the SE bars were fairly tightly clustered around the mean, especially for levelsof variables with many observed hauls, and the spread of the residuals were what is exceptedwhen the number of takes are restricted to the values of zero and one. In a model that fitsperfectly, the residuals would be spread evenly around the mean of each level of the explanatoryvariable, and the SE bars would be tight around the mean. Overall, the fit was good.
1.C. Bycatch Rate Estimates
The best fitting and practical model was Equation 9, where the AIC was 174.3. The variables inthat model were water body, mesh size category, and seasonal management unit (Table 10). Thecoefficients for this model were:
Intercept state orfederal
smallmesh
mediummesh
NC mixWintersub-MU
VA mixWintersub-MU
NNCSummerMU
NmigratorySummer MU
-4.214 1.214 0.595 0.929 0.768 0.066 -0.508 -0.724
where MU is management unit. The coefficient for the last level of each variable (federal waters,large mesh size, and Southern NC management) is by definition zero because the base line levelis defined as federal waters, large mesh size, and in Southern NC management unit, so, all otherlevels are relative to this base line level.
Within the coastal dolphin habitat, estimated bycatch rates for hauls in state waters were higherthan rates in federal waters (Table 11A). Rates in large mesh fisheries were highest, and rates insmall mesh fisheries were lowest. Rates in the summer Northern NC and summer Northernmigratory management units were highest (Table 12), and rates in the Southern NC managementunit were the lowest (no observed dead animals, though one animal was released alive anduninjuried). Even though there were no observed dead takes in the Southern NC managementunit, the model predicted a very small bycatch rate.
The CV’s of the bycatch rates when stratified to seasonal management unit, body of water, andmesh size are large, mostly over 60% (Table 11B). However, when averaged to seasonalmanagement unit, the level we are most interested in, the CV’s improved to 48 - 84% (Table 12).
15
2. Commercial Gillnet Landings
2.B. Prorating Commercial Gillnet Landings
2.B.1. Management Units adjacent to New Jersey through Virginia
Winter Virginia mixed stock Sub-Management Unit (Virginia only):All water bodies: Most of the gillnet landings from ports that fished in the winter VA mixed stocksub-management unit were from federal waters (both inside and outside the coastal dolphinhabitat), and were from the medium mesh category which was dominated by the dogfish fishery(Figure 7). The medium mesh category fisheries landings (dominated by dogfish and Americanshad) from state waters were significantly less than that from federal water. The majority oflandings from the small mesh category originated from state waters and were dominated bycroaker, weakfish, bluefish and Atlantic mackerel fisheries. Most of the landings from the largemesh category were attributed to the striped bass fishery within state waters, and to the monkfish(anglerfish) fishery in federal waters.
Coastal Habitat water bodies: The majority of gillnet landings from the coastal dolphin habitatoriginated from state waters (Table 13A). Most of the landings from federal waters in the coastaldolphin habitat were from the medium mesh category, while most landings from state coastalwaters were from the small mesh category. As an aside, most of the landings from federal waterscame from areas outside of the coastal dolphin habitat.
Winter Northern Migratory Management Unit (Maryland, Delaware, and New Jersey only):Winter landings from Maryland (Table 13B), Delaware (Table 13C), and New Jersey (Table 13D)were prorated into the three water bodies. However, these landings were not used in the bycatchestimate because it was assumed that there were very few, if any, coastal bottlenose dolphins inthese waters during the winter; thus, it was assumed the bycatch estimate for these waters waszero.
Summer Northern Migratory Management Unit:Virginia
All water bodies: The largest landings within a year-mesh size category occurred in1999 in thefederal offshore habitat waters within the large mesh monkfish category (Figure 8). Other thanthis exception, most gillnet landings from Virginia ports that fished in the summer Northernmigratory management unit habitat originated from state waters within the small mesh category,and were dominated by the croaker and spot fisheries. Fisheries within the medium mesh categorywere primarily harvested from federal waters and were dominated by dogfish. Most landings fromthe large mesh category were for black drum within state waters, and for monkfish in federalwaters.
Coastal Habitat water bodies: Most gillnet landings from the coastal dolphin habitat of theVirginia portion of the summer Northern migratory management unit were from state waters and

16
the small mesh category (Table 13E). Again, most of the fish caught in federal waters werecaught outside of the coastal dolphin habitat.
MarylandAll water bodies: Most gillnet landings from the ports in Maryland that were derived from thesummer Northern migratory management unit habitat were from the large and medium meshcategories, dominated by monkfish and dogfish, respectively (Figure 9). The small meshcategory was dominated by several species: croaker, spot, bluefish, weakfish and menhaden.
Coastal Habitat water bodies: Most of the landings within the coastal habitat came from federalwaters (Table 13F). Landings from the federal coastal habitat came from the small meshcategory, except in 1999 when medium mesh landings were at a high.
DelawareAll water bodies: Because there were no reported landings in federal waters for the Delawareportion of the summer Northern migratory management unit, landings were not prorated, and soall landings were attributed to the state coastal habitat (Figure 10). The majority of landings werefrom the small mesh category, which was dominated by the croaker, bluefish and weakfishfisheries. In 1996, less than 1 mt was landed within the medium mesh category, which wasdominated by shad. There were no landings from the large mesh category.
Coastal Habitat water bodies: Within state waters, there were no landings reported from the largemesh category during any year, and from the medium mesh category during 1997 to 2000 (Table13G). Nearly all landings were from the state coastal dolphin habitat small mesh category, wherethe landings were small, less than 6.5 mt per year.
New JerseyAll water bodies: Landings from New Jersey ports that fished within the summer Northernmigratory management unit habitat were similar across all mesh categories (Figure 11). Bluefishand weakfish dominated the small mesh category landings, dogfish dominated the medium meshcategory landings, and monkfish dominated the large mesh category landings.
Coastal Habitat water bodies: Coastal habitat landings from the small mesh category originatedmainly from state waters, while the majority of landings from the medium and large meshcategories originated from federal coastal waters (Table 13H). Again, landings from federalwaters outside of coastal dolphin habitat made up most of the New Jersey landings.
2.B.2. North Carolina Management Units
Winter North Carolina Mixed Stock Sub-Management Unit:All water bodies: Reported landings from federal waters were highest for fish species in themedium mesh category (dominated by dogfish), second highest in the small mesh category(dominated by Atlantic croaker, bluefish and weakfish), and lowest in the large mesh category(dominated by monkfish; Figure 12). Within each mesh category, landings from state waterswere nearly similar to landings from federal waters, in terms of species composition and

17
quantities landed. The exception is in the large mesh category, where striped bass dominatedlandings in state waters, and monkfish dominated landings in federal waters.
Coastal Habitat water bodies:. Most of the gillnet landings within the winter NC mixed stocksub-management unit habitat came from small mesh fisheries with catches in state waterstypically exceeding those from federal coastal waters (Table 13I). There appears to have been asignificant shift in the pattern of landings in federal waters during 2000; prior to 2000 most of thesmall mesh catches came from federal coastal waters, but in 2000 most came from federaloffshore waters, outside the coastal dolphin habitat.
Summer Northern North Carolina Management Unit:All water bodies: Most gillnet landings from ports that fished during summer within the NorthernNC management unit habitat originated in state waters (Figure 13). In particular, most werewithin the small mesh category (dominated by spanish mackerel, spot and bluefish). Landingsfrom state waters in the medium mesh category were dominated by sharks, king mackerel anddogfish. The large mesh category had the least amount of landings from both state and federalwaters. All landings from federal waters were from the small and medium mesh categories, withthe exception of 1996, when there was fishing for monkfish.
Coastal Habitat water bodies:. The majority of gillnet landings within this management unit wasfrom small mesh fisheries within state waters (Table 13J).
Summer Southern North Carolina Management Unit:All water bodies: Nearly all gillnet landings from ports that fished during summer within theSouthern NC management unit habitat originated from state waters within the small meshcategory and was dominated by the spot fishery (Figure 14). Landings from state waters withinthe medium mesh category were dominated by sharks, fluke and king mackerel. All landingsfrom federal waters were from the small mesh category, and was dominated by the spot fishery.
Coastal Habitat water bodies:. Nearly all the gillnet landings within the coastal dolphin habitat inthis management unit were from the small mesh fisheries in state waters (Table 13K).
3. Observer Coverage
3.A. Management Units adjacent to New Jersey through Virginia
Winter Virginia mixed sub-management unit (Virginia only):Annual number of trips observed and percent coverage of gillnet landings within this seasonalsub-management unit ranged from a low of 35 trips (7.50% coverage) in 1996 to a high of 92 trips(3.27% coverage) in 2000 (Table 4A). Although coverage of the gillnet fisheries was highest inthe federal coastal and offshore habitats there was considerable variability, ranging from 8.20%-100% and 0.25%-57.51%, respectively. Landings reported in 1996 for federal water bodies werevery low compared to other years. Coverage was lowest in the state coastal habitat, ranging from0.50%-1.48%.

18
Summer Northern migratory management unit (Virginia through New Jersey):Annual number of trips observed and percent coverage of gillnet landings within these seasonalmanagement unit ranged from a low of 110 trips (1.50% coverage) in 1999 to a high of 162 trips(2.94% coverage) in 2000 (Table 4B). Coverage of gillnet fisheries was highest in the federalcoastal and offshore habitats, ranging from 3.43%-16.60% and 1.24%-3.50%, respectively.Coverage was lowest in the state coastal habitat, ranging from 0.58%-2.98%.
3.B. North Carolina Management Units
In general, the NEFSC fisheries sampling observer data appear to be fairly representative of theNorth Carolina gillnet fishery, especially in the winter when most of the fishing occurs. In NorthCarolina, the diversity of fish species landed in the observed trips and the relative pattern ofquantities of landings resemble that from the NCDMF landings (Appendix A).
Winter North Carolina mixed stock sub-management unit:Annual number of trips observed and percent coverage of gillnet landings within this seasonalsub-management unit ranged from a low of 104 trips (1.69% coverage) in 1997 to a high of 173trips (1.97% coverage) in 1999 (Table 4C). Coverage of the gillnet fisheries was highest infederal coastal and offshore habitats, ranging from 2.45%-4.51% and 2.76%-5.65%, respectively.Coverage was lowest in the state coastal habitat, ranging from 0.41%-1.49%.
Summer Northern North Carolina management unit (Dare and Hyde counties):Annual number of trips observed and percent coverage of gillnet landings within this seasonalmanagement unit ranged from a low of 1 trip (0.20% coverage) in 1997 to a high of 35 trips(3.28% coverage) in 2000 (Table 4D). Although coverage of gillnet fisheries was highest in thefederal coastal and offshore habitats there was considerable variability, ranging from 0.00%-18.07% and 0.00%-24.18%, respectively. Coverage was lowest in the state coastal habitat,ranging from 0.00%-2.53%.
Summer Southern North Carolina management unit (Carteret, Onslow , Pender, NewHanover, Brunswick counties:
Annual number of trips observed and percent coverage of gillnet landings within this seasonalmanagement unit ranged from a low of 0 trips (0.00% coverage) in 1996 and 1997, to a high of 44trips (3.4% coverage) in 2000 (Table 4E). Beginning in 1998, coverage improved; in the federalcoastal and federal offshore habitats coverage ranged from 3.12%-100% and 2.32%-100%,respectively, and coverage in the state coastal habitat ranged from 0.96%-2.70%.
4. Total Bycatch
Total estimated bycatch was highest in the winter mixed stock management unit (146 in 2000 to211 in 1997), with most of the takes coming from waters off North Carolina and only a few fromoff Virginia (Tables 14 and 15). The annual differences in this management unit were notstatistically different.

19
Estimated takes in Virginia during winter increased, from a low of 11 in 1996 to a high of 53 in2000, though the differences were not significant (Table 15). The increase was due to increasedlandings in the large mesh fisheries in state waters (in particular striped bass), from 29 mt in 1996to 248 mt in 2000 (Table 14A).
The 2000 bycatch estimate in North Carolina during winter (93) was about half that from the yearwith the highest bycatch in the same area and season (187 in 1997), though the difference was notsignificant (Table 15) . This difference was due to a decrease in landings from all mesh sizefisheries in state waters and the small mesh fisheries in federal waters; however, the landings inthe large mesh fisheries in federal waters inside the coastal dolphin habitat increased from 59 in1999 to 283 in 2000 (Table 14C).
Average estimated summer takes (53) were about one-third of the average winter takes (180). Inall waters between New Jersey and North Carolina, during 1996 to 2000, an average of 233 (CV= 16%; 95% CI = 171-318) coastal bottlenose dolphins were taken during a year (Table 15). Total annual bycatch estimates for 2000 were the lowest in the series (202), though the decreasewas not significant.
The level of uncertainties (%CV) about the annual estimates were fairly high, ranging from 48%to 84% (Table 15). The uncertainties about the 5-year averages were lower (22% to 42%).
Five-year average annual bycatch estimates for the management units were 30 (CV = 21.9%) forsummer Northern migratory, 23 (CV = 28.7%) for summer Northern NC, 0 for summer SouthernNC, and180 (CV = 20.9%) for the winter mixed stock management units (Table 15).
DISCUSSION
1. Bycatch Rates
Two factors that had the highest correlation with the bycatch rate were distance from shore andmesh size. The bycatch rate was highest for hauls that were within state waters, particularlywithin 3 km of shore. This could be because there are more dolphins closer to the shore, as seenduring aerial surveys conducted off New Jersey to North Carolina (Garrison and Yeung, inreview). The GLM also detected bycatch rates were highest for hauls that used large mesh sizes($7 inches), intermediate for medium mesh sizes (>5 to <7 inches), and lowest for hauls that usedsmall mesh sizes (#5 inches). One interpretation of the mesh size categories is these categoriesrepresent different sub-fisheries within the mid-Atlantic that have different bycatch rates.
Two variables that were not included in the bycatch model for practical reasons, but couldpossibly be useful were a finer definition of distance from shore (dist2shoreA) and the presenceor absence of an anchor (anchor.used). The effect of adding either of these two variables into thebycatch model was not significant; that is, they were not as important as the variables already inthe model. The model already included a variable that was a measure of distance from shore(state.or.fed). So it is reasonable to believe that there may be a pattern in the bycatch rate of hauls
20
within state waters. Especially because there appears to be a density gradient of coastalbottlenose dolphins relative to distance from shore, where there are more coastal bottlenosedolphins near the beach, and less offshore.
The other variable that slightly improved the bycatch model was anchor.used. However, theobservation that strings with anchors had a higher bycatch rate than strings without anchors mayonly be a statistical artifact. That is, it is known that strings with large mesh sizes have a higherbycatch rate than strings with small mesh sizes. Of the observed strings that used large meshsizes, 73% used an anchor, while only 46% that used small mesh sizes used an anchor. Thus,even if there was no true relationship between bycatch and the presence of an anchor, it is morelikely that a take would be observed in a string with an anchor, because strings with anchors tendto use larger mesh sizes. In statistical terms, the variables mesh.cats and anchor.used are aliased,that is, they are correlated and so represent similar bycatch rates. Still another way to look at thedata is 10 of the 11 dead bottlenose dolphins were taken in nets that had an anchor. Thus, it ispossible that even within each mesh size category, nets with an anchor have a higher chance oftaking a bottlenose dolphin. This could be investigated further.
The bycatch rate model was used to estimate the average bycatch rate within a seasonalmanagement unit. It is important not to over-interpret these estimated bycatch rates. That is, themodel is valid when estimating rates within the times and areas sampled, but they are notnecessarily valid for the future or in areas not sampled. To make the inference to other times andareas, two assumptions must be made: 1) gear characteristics and fishing practices must somehowpredict the probability of a bycatch; that is, there is a cause-and-effect relationship; and 2) fishingpractices and combination of gear characteristics that were observed in the data will be the sameas in other times and areas. Neither of these assumptions have been shown to be valid or invalid. Consequently, caution should be exercised when applying modeled results to times and areasother than that used to develop the model.
Most biological systems demonstrate inter-annual variability. Yet the stepwise selection methoddid not choose the variable year. This could be because there is little or no inter-annualvariability, or there were insufficient data to accurately distinguish inter-annual variability in thebycatch rates within seasonal management unit, water body, and mesh size category. It is morelikely that the latter is true. In the future, it is possible that fishery management actions or otherevents will cause fishing practices to alter sufficiently to change the bycatch rate. If this isthought to be happening or one wants to investigate inter-annual changes, then in the future whenthere are more data, the model can to be modified to explicitly account for effects of year, and yetstill maintain the same bycatch rate estimates for 1996 to 2000.
Landings were used as the unit of effort in the bycatch rate because no other data were availablefor the measure of effort in the entire fishery. This unit of effort may not be the ideal measurebecause landings data from both the NER dealer and NCDMF databases may under-estimatefishing effort because, for example, not all landings are recorded into these databases, and somefishing effort may result in no landings. Thus, the total amount of fishing effort, the bycatch rate,and total bycatch is likely to be negatively biased. The magnitude of this bias is unknown. Othermeasures of effort should be explored and evaluated.

21
2. Commercial Gillnet Landings
Because the bycatch rate model accounted for sub-fisheries (mesh size categories and waterbody), some of the commercial landings had to be prorated using data that were collected fromonly a sample of the total landings (VTR and NEFSC fisheries sampling observer data). In thepast, the amount of landings have been assumed to be known with certainty and so its CV equaledzero. However, when prorating the landings using data from a sample there is some uncertainty. Therefore, the CV should not equal zero. In the present analysis this component of the CV hadnot been estimated and so the presented CV’s of the total bycatch estimates are biased low bysome unknown amount. One reasonable way to obtain a CV of the prorated landings is by usingbootstrap re-sampling techniques, because it is not possible to derive a theoretical CV. While theCV of landings when prorated using the VTR data is probably small because, for many states, theVTR data is a large sample of the total landings, the exact amount is presently unknown. Thiscould be investigated further.
In the NCDMF database, when the number of vessels that report landings from a waterbody/county combination was equal to or less than three, their landings were consideredconfidential and so were not provided to us. This means that during summer when there were fewvessels fishing from some North Carolina counties in some water bodies, these landings would beconsidered confidential. In these cases, the landings we reported were biased low and observercoverage biased high. Though, since there were only three or less vessels fishing, it was unlikelythat the level of effort was not large, the bycatch estimate likely small, especially compared to thewinter in NC, and so the level of bias also likely small.
Winter landings reported from 1996 for federal water bodies landed in Virginia were very lowcompared to other years. If these landings were erroneous, the reported levels of landings,bycatch estimate, as well as observer coverage would also be erroneous. This requires furtherinvestigation.
3. Observer Coverage
Observer coverage in federal waters, both inside and outside of the coastal bottlenose dolphinhabitat, was generally 3 - 6%. In federal waters outside of coastal dolphin habitat no coastaldolphin takes were observed. Because of the relatively high level of coverage in federal watersoutside of the coastal dolphin habitat and the large number of observed hauls, more observedtakes should have been observed if the true bycatch was high. For example, assuming a binomialdistribution of bycatch rates, for the total landings in federal waters outside the winter NC mixedstock sub-management unit during 1996 to 2000 (6238 mt) (annual estimates in Table 4C), and anaverage observer coverage of 4% (annual estimates in Table 4C), there was a 64% chance ofobserving one or more takes sometime during 1996 to 2000 if there were truly 25 dolphins takenin total during all five years, 87% chance if there were truly 50 dolphins taken, and a 98% chanceif there were truly 100 takes during all five years. But a take was not observed. In conclusion, itis highly likely that the bycatch is very small in federal waters outside the coastal dolphin habitat,especially outside the winter NC mixed stock sub-management unit.
22
In federal waters inside the coastal bottlenose dolphin habitat, two bottlenose dolphins wereobserved taken (Table 2), and the observer coverage was generally between 2.5 and 6%, withsome times and places higher (> 17% in winter VA mixed stock sub-management unit during1996 to 1998), and other times and places lower (0% in the Southern NC management unit in thesummers of 1996 to 1997). The only take observed in federal waters inside the coastal bottlenosedolphin habitat in the winter NC mixed stock sub-management unit was during 1998, the yearwith the highest observer coverage (4.51%). One interpretation of this is that the true bycatch infederal coastal waters was low because we needed a fairly high coverage of 4.5% to see one take. That is, assuming a binomial distribution of bycatch rates, for the 1,991 mt of landings in thefederal coastal waters of the winter NC mixed stock sub-management unit (Table 4C), with anaverage observer coverage of 4.51%, there was a 90% chance of observing one or more takes ifthere were truly 50 dolphins taken in this time and area, and a 99% chance if there were truly 100takes. In contrast to the year with the lowest coverage, 2.45% coverage in 2000, there was a 80%chance of observing one or more takes if there were truly 50 dolphins taken in this seasonalmanagement unit, and a 91% chance if there were truly 100 takes. It was estimated that therewere on average eight animals per year taken in this management unit (annual estimates in Table14C). If it is true that the observer coverage (average of 2.9%) was too low in most years to haveobserved a take, then the estimated average bycatch of eight animals per season may benegatively biased perhaps up to 64% (2.9/4.5). If this level of bias were true, the estimatedaverage bycatch for the federal coastal waters in the winter NC mixed stock sub-management unitwould increase to only13 animals. In conclusion, the bycatch in federal waters inside the coastaldolphin habitat was probably low, though not as low as outside the dolphin habitat.
Observer coverage in state waters was generally low, often below 1%, generally below 2.5%. However, even though the observer coverage was low, there were nine observed takes in statewaters, five of which were in the winter NC mixed stock sub-management unit. In thismanagement unit, average observer coverage in state waters was 0.8% with an average of 3876mt of landings in the winter season (annual estimates in Table 4C). Using these facts andassuming a binomially distributed bycatch rate, if there were 50, 100, 150, 200, or 250 animalsthat were truly taken in the winter season, then there was a 33%, 56%, 71%, 81% and 92%chance of observing one take in the winter season, respectively. The landings in these statewaters have been declining, but the observer coverage has been increasing. So in the most recentyear, using the facts from 2000 (2246 mt landed and a 1.49% observer coverage), there was a90% chance of observing a take if there were truly 150 animals taken in the winter season. Inother words, even with the low observer coverage, because there were so many trips observed(i.e., tons of landings observed), there was a good chance of observing a take in the winter NCwaters when the true number of takes were 150 or more animals per season.
Low observer coverage was a problem in small fisheries (few mt landed), such as those in thesummer Northern and Southern NC management units. In the Southern NC management unit,there was no coverage during 1996 and 1997, and a maximum of 2.7% observer coverage in1999, when there were only 128 mt of landings from this seasonal management unit. The onlyobserved take was during 1999, the year with the most coverage. Note, this animal was releasedalive from a net that soaked for a half hour, so it was not included in the bycatch estimate. Assuming takes were binomially distributed, there was a 72% chance of observing a take if the
23
true number of takes were 45 animals per season, and a 91% chance if there were truly 70 animalstaken. Thus, due to low coverage of a small fishery, it is likely the bycatch estimates for thesummer Northern and Southern NC management units are biased low, by an unknown amount.
4. Total Bycatch
The CV’s around the 5-year mean bycatch estimates ranged from 22 to 42% (Table 15). Themost uncertainty was around the winter VA mixed stock sub-management unit, where the 95%confidence interval was16 to 74 animals per season. This may be due to low observer coverage(average of 1.1%) in state coastal habitat waters (annual estimates in Table 4A) or to the fact thatcoastal bottlenose dolphins may not always be present in waters off of Virginia during the winter.
In the NC winter mixed stock sub-management unit, the bycatch for 2000 (93) was about 40%lower than the average from the previous years (159 during1996 to1999). This change was due toa decline in landings in state waters, particularly that from the large mesh fisheries, and not due toa change in the bycatch rate. The reason for the decreased landings may be fishery managementactions, natural variability in the distribution of dolphins and/or fishers, or something else. Itdoes not appear that the change in landings during the winter 2000 season (November 1999through April 2000) was due to the monkfish fishery management plan implemented on 1 May2000, or a closure for turtles from 12 May to 12 June 2000. If these or other fishery managementplans do influence future distributions and quantities of landings, then future bycatch estimates ofcoastal bottlenose dolphins will probably vary from that seen in this paper. In general it isexpected that if landings decline so will the bycatch estimate.
Bycatch rates were highest for large mesh fisheries that target monkfish, striped bass, and blackdrum. So changes in these fisheries will have large influences on the bycatch estimate. Themonkfish fishery was relatively small in coastal dolphin habitat and more intense in watersoffshore the coastal dolphin habitat, while the striped bass and black drum fisheries were moreintense in state waters. Striped bass landings have been increasing, while monkfish landingsstarted decreasing in 2000 and is suppose to continue decreasing. If both of these patternscontinue to hold true for the future, and the bycatch rates of monkfish and striped bass haulscontinue to be similar to each other, then it is possible that bycatch of coastal bottlenose dolphinswill not decrease, even though fishing for monkfish declines drastically.
24
REFERENCES
Cochran, W.G. 1977. Sampling Techniques, third edition. John Wiley and Sons. New York. 417p.
Garrison, L. and Yeung, C. In review. Abundance estimates for Atlantic bottlenose dolphin stocks during winter andsummer, 1995.
Johnson, D.R., Yeung, C. and Brown, C.A. 1999. Estimates of marine mammal and marine turtle bycatch by the USAtlantic pelagic longline fleet in 1992-1997. NOAA Technical Memorandum NMFS-SEFSC-418, 70p.
McCullagh, P. and Nelder, J.A. 1991. Generalized linear models, second edition. Chapman and Hall. New York.511p.
Ortiz, M., Legault, C.M., Ehrhardt, N.M. 2000. An alternative method for estimating bycatch from the US shrimptrawl fishery in the Gulf of Mexico, 1972-1995. Fish. Bull. 98: 583-599.
Rossman, M. and Merrick R. 1999 Harbor porpoise bycatch in the Northeast multispecies sink gillnet fishery and theMid-Atlantic coastal gillnet fishery in 1998 and during January-May 1999. Northeast Fish. Sci. Cent. Ref.Doc. 99-17; 36 p.
Southeast Fisheries Science Center (SEFSC). In review. Preliminary stock structure of coastal bottlenose dolphinsalong the Atlantic coast of the USA.
Venables, W.N. and Ripley, B.D. 1999. Modern applied statistics with S-Plus, third edition. Springer. New York.501p.
Wigley, S., Terceiro, M., DeLong, A. and Sosebee, K. 1998. Proration of 1994-96 USA commercial landings ofAtlantic cod, haddock, and yellowtail flounder to unit stock areas. Northeast Fish. Sci. Cent. Ref. Doc. 98-02; 32 p. Available from: National Marine Fisheries Service, 166 Water Street, Woods Hole, MA 02543-1026 USA.

25
Table 1. Assumptions for three methods that can be used to estimate the bycatch rate of coastal bottlenosedolphins and if it was found to be valid.
Assumption TestedValid
Ratio Method
1. The relationship between the numerator (number of dolphins) anddenominator (landings kept) of the ratio estimator is a straight linethrough the origin.
No
2. The variance of the landings kept about the above line is proportional tothe number of dolphin takes.
Yes
3. The CV’s of the numerator and denominator should be less than 10%. No
4. The sample size within a stratum exceeds 30. Yes
Delta-distribution Method
1. The data can be easily divided into events with a zero bycatch rate and apositive bycatch rate and the data are dominated by a large proportion ofzeros.
Yes
2. Positive bycatch rates follow a log-normal distribution. Yes
3. There are no small departures of the log-normal distribution, especiallyfor small positive values.
No
4. The sample size of positive events is greater than 15 within a stratum. No
Log-linear Regression Method
1. The bycatch rates follow a Poisson distribution, or Yes
2. The variance in the bycatch rate is constant over the range of the bycatchrate values.
Yes

26
Table 2. Gear characteristics and fishing practice variables investigated, in alphabeticalorder.
____________________________________________________________________________________ Variable Name Description
____________________________________________________________________________________anchor.used = presence or absence of an anchor.
depth = minimum depth string was set in (in fathoms)dist2shore = distance to shore (in km) binned into the following categories:
(0-0.5], (0.5-1], (1-1.5], (1.5-2], (2-2.5], (2.5-3], (3-3.5], (3-4], (4-5], (5-6], and >6.
dist2shoreA = distance to shore (in km) binned into the following categories:(0-3] and >3
escape.used = presence or absence of an escape panelkm.hr = product of length of string (in km) and soak duration (in hours)
land.kept.mton = weight of landings of all fish species kept and not discarded (in metrictons)
mesh.size = size of mesh (in inches)mesh.cats = target species that predominately use small (#5.0 inches), medium (>5.0
to <7 inches), and large mesh sizes ($7 inches)month = month
MU = seasonal management units:All of NC in winter (NC mixed stock sub-management unit)VA mixed stock sub-management unit in winterNorthern NC in summerNorthern migratory in summerSouthern NC in summer
net.height = height of netnum.bodo = number of dead bottlenose dolphins observed taken
season = winter (November to April)summer (May to October)
set.dir = direction net was set. Choices are:with depth, against depth, with a loran line, with the tide, with a compassdirection, mixed reasons, other, unknown.
soak.duration = length of time (hours) net was left in waterstate.or.fed = indicator if the haul was in state or federal waters
string.length = length of string (in feet)target.species = primary fish species captain said they were fishing for
target.twine.cats = target species that predominately were in nets with small (<0.57mm),medium (>= 0.57 to <=0.81 mm), and large twine sizes (> 0.81 mm)
tie.used = presence or absence of tie downstwine.size = size of twine size (in mm)
year = 1996 = November 1995 to October 19961997 = November 1996 to October 19971998 = November 1997 to October 19981999 = November 1998 to October 19992000 = November 1999 to October 2000
____________________________________________________________________________________

27
Table 3. Coastal bottlenose dolphin takes observed by year, water body, and season.
Year State CoastalHabitat
Federal CoastalHabitat
SeasonalTotal
AnnualTotal
Winter Summer Winter Summer Winter Summer
1996 1 1 0 0 1 1 2
1997 0 0 0 0 0 0 0
1998 0 1 1 0 1 1 2
1999 3 21 0 0 3 2 5
2000 2 0 0 1 2 1 3
Sub-Total 6 4 1 1 7 5 12
Total(percent)
10 (83%)
2 (17%)
7(58%)
5(42%)
12(100%)
1 One animal was caught and released alive in a haul in the Southern NC management unit. All otheranimals caught were dead.

28
Table 4A. Number of observed gillnet trips and hauls, and percent observer coverage(defined as the ratio of gillnet landings (mt) observed to gillnet landings collectedby the NER dealer reported landings program), by seasonal management unit, yearand water body (state-coastal habitat, federal-coastal habitat, and federal-offshorehabitat). Highlighted rows indicate when and where a coastal bottlenose dolphintake was observed.
Winter (Nov-Apr) - VA Mixed Stock Sub-Management Unit (Virginia only)Year water body NER
landings*NEFSCobservedlandings
%Observercoverage
Observednumber oftrips
Observednumber ofhauls
ObservedTakes
1996 state - coastal 428.15 5.23 1.22 9 21 0
fed - coastal 6.95 6.95 100.00 11 43 0
fed - offshore 39.89 22.94 57.51 15 62 0
TOTAL 468.04 35.12 7.50 35 126 0
1997 state - coastal 791.04 5.97 0.75 9 34 0
fed - coastal 109.38 18.82 17.21 18 96 0
fed - offshore 1739.40 32.60 1.87 13 86 0
TOTAL 2639.82 57.39 2.17 40 216 0
1998 state - coastal 984.52 4.94 0.50 11 31 0
fed - coastal 29.71 10.65 35.85 21 73 0
fed - offshore 1368.15 3.45 0.25 13 93 0
TOTAL 2382.38 19.04 0.80 45 197 0
1999 state - coastal 838.33 12.45 1.48 28 89 1
fed - coastal 206.03 16.90 8.20 44 164 0
fed - offshore 1712.08 15.21 0.89 13 86 0
TOTAL 2756.44 44.56 1.62 85 339 1
2000 state - coastal 750.47 11.13 1.48 43 170 0
fed - coastal 172.68 14.48 8.38 34 133 0
fed - offshore 353.23 16.13 4.57 15 73 0
TOTAL 1276.38 41.74 3.27 92 376 0
Total Observed Coastal Bottlenose Dolphins 1* NER gillnet landings reported for federal waters were prorated to coastal and offshore habitats.
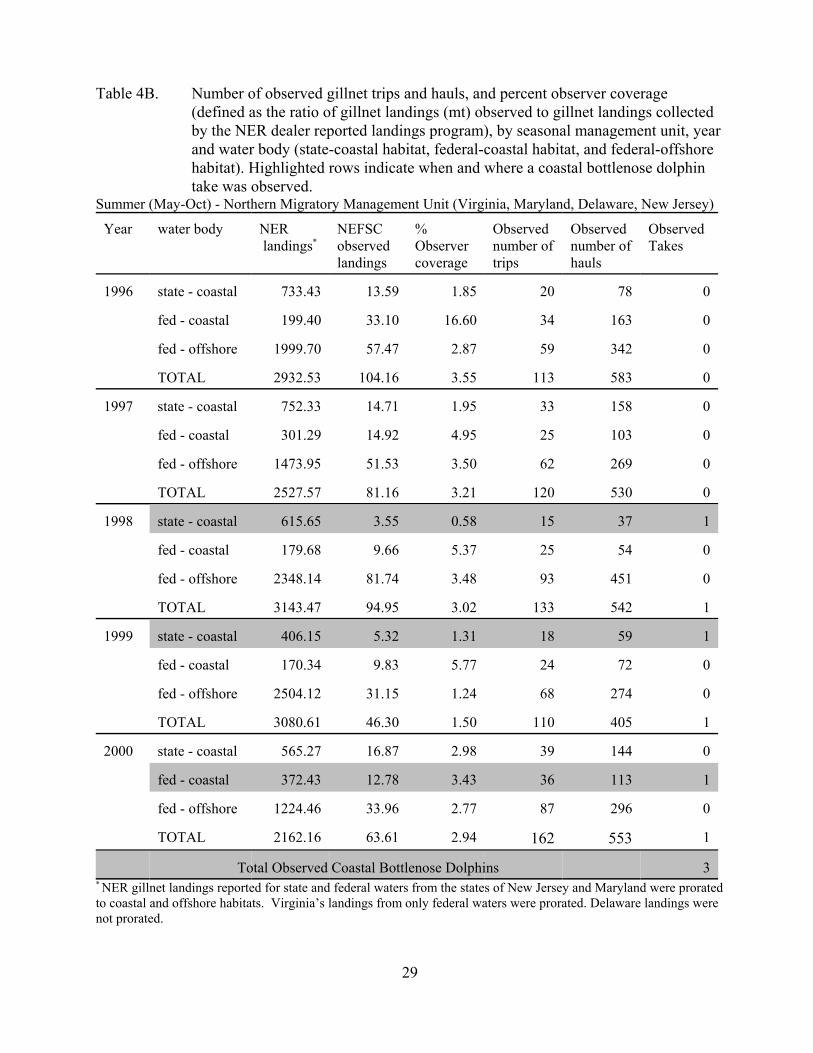
29
Table 4B. Number of observed gillnet trips and hauls, and percent observer coverage(defined as the ratio of gillnet landings (mt) observed to gillnet landings collectedby the NER dealer reported landings program), by seasonal management unit, yearand water body (state-coastal habitat, federal-coastal habitat, and federal-offshorehabitat). Highlighted rows indicate when and where a coastal bottlenose dolphintake was observed.
Summer (May-Oct) - Northern Migratory Management Unit (Virginia, Maryland, Delaware, New Jersey)
Year water body NER landings*
NEFSCobservedlandings
%Observercoverage
Observednumber oftrips
Observednumber ofhauls
ObservedTakes
1996 state - coastal 733.43 13.59 1.85 20 78 0
fed - coastal 199.40 33.10 16.60 34 163 0
fed - offshore 1999.70 57.47 2.87 59 342 0
TOTAL 2932.53 104.16 3.55 113 583 0
1997 state - coastal 752.33 14.71 1.95 33 158 0
fed - coastal 301.29 14.92 4.95 25 103 0
fed - offshore 1473.95 51.53 3.50 62 269 0
TOTAL 2527.57 81.16 3.21 120 530 0
1998 state - coastal 615.65 3.55 0.58 15 37 1
fed - coastal 179.68 9.66 5.37 25 54 0
fed - offshore 2348.14 81.74 3.48 93 451 0
TOTAL 3143.47 94.95 3.02 133 542 1
1999 state - coastal 406.15 5.32 1.31 18 59 1
fed - coastal 170.34 9.83 5.77 24 72 0
fed - offshore 2504.12 31.15 1.24 68 274 0
TOTAL 3080.61 46.30 1.50 110 405 1
2000 state - coastal 565.27 16.87 2.98 39 144 0
fed - coastal 372.43 12.78 3.43 36 113 1
fed - offshore 1224.46 33.96 2.77 87 296 0
TOTAL 2162.16 63.61 2.94 162 553 1
Total Observed Coastal Bottlenose Dolphins 3* NER gillnet landings reported for state and federal waters from the states of New Jersey and Maryland were proratedto coastal and offshore habitats. Virginia’s landings from only federal waters were prorated. Delaware landings werenot prorated.
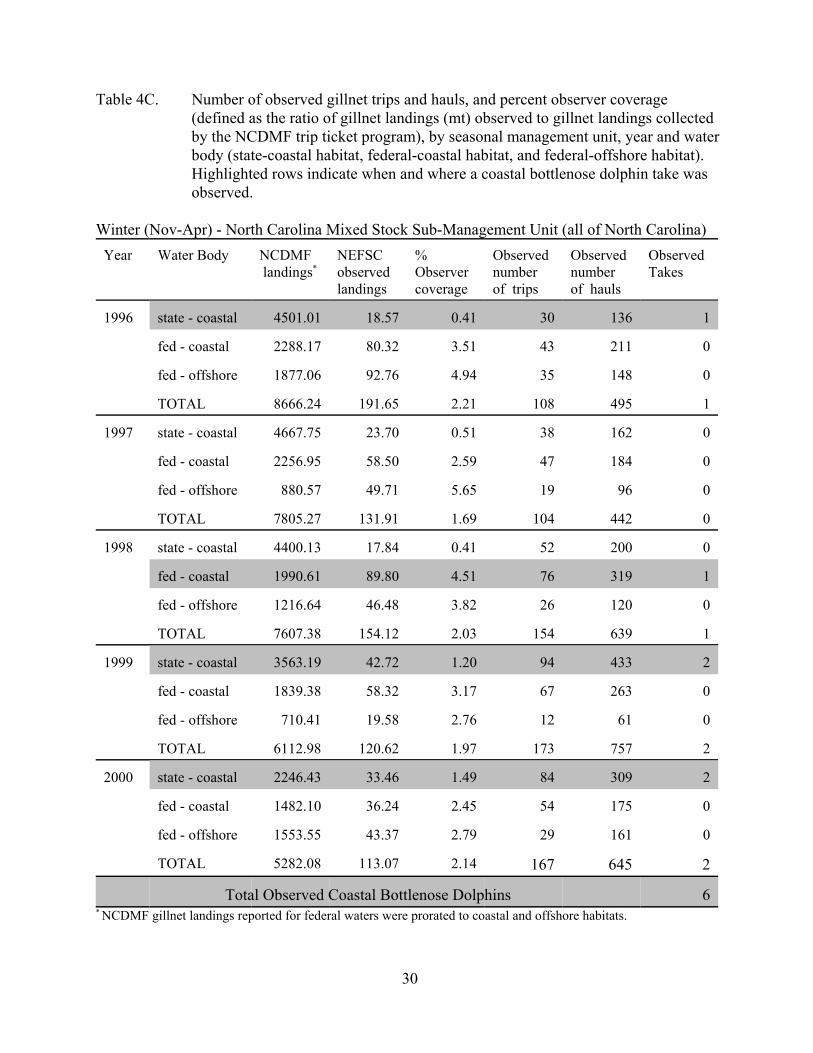
30
Table 4C. Number of observed gillnet trips and hauls, and percent observer coverage(defined as the ratio of gillnet landings (mt) observed to gillnet landings collectedby the NCDMF trip ticket program), by seasonal management unit, year and waterbody (state-coastal habitat, federal-coastal habitat, and federal-offshore habitat).Highlighted rows indicate when and where a coastal bottlenose dolphin take wasobserved.
Winter (Nov-Apr) - North Carolina Mixed Stock Sub-Management Unit (all of North Carolina)Year Water Body NCDMF
landings*NEFSCobservedlandings
%Observercoverage
Observednumber of trips
Observednumber of hauls
ObservedTakes
1996 state - coastal 4501.01 18.57 0.41 30 136 1
fed - coastal 2288.17 80.32 3.51 43 211 0
fed - offshore 1877.06 92.76 4.94 35 148 0
TOTAL 8666.24 191.65 2.21 108 495 1
1997 state - coastal 4667.75 23.70 0.51 38 162 0
fed - coastal 2256.95 58.50 2.59 47 184 0
fed - offshore 880.57 49.71 5.65 19 96 0
TOTAL 7805.27 131.91 1.69 104 442 0
1998 state - coastal 4400.13 17.84 0.41 52 200 0
fed - coastal 1990.61 89.80 4.51 76 319 1
fed - offshore 1216.64 46.48 3.82 26 120 0
TOTAL 7607.38 154.12 2.03 154 639 1
1999 state - coastal 3563.19 42.72 1.20 94 433 2
fed - coastal 1839.38 58.32 3.17 67 263 0
fed - offshore 710.41 19.58 2.76 12 61 0
TOTAL 6112.98 120.62 1.97 173 757 2
2000 state - coastal 2246.43 33.46 1.49 84 309 2
fed - coastal 1482.10 36.24 2.45 54 175 0
fed - offshore 1553.55 43.37 2.79 29 161 0
TOTAL 5282.08 113.07 2.14 167 645 2
Total Observed Coastal Bottlenose Dolphins 6* NCDMF gillnet landings reported for federal waters were prorated to coastal and offshore habitats.
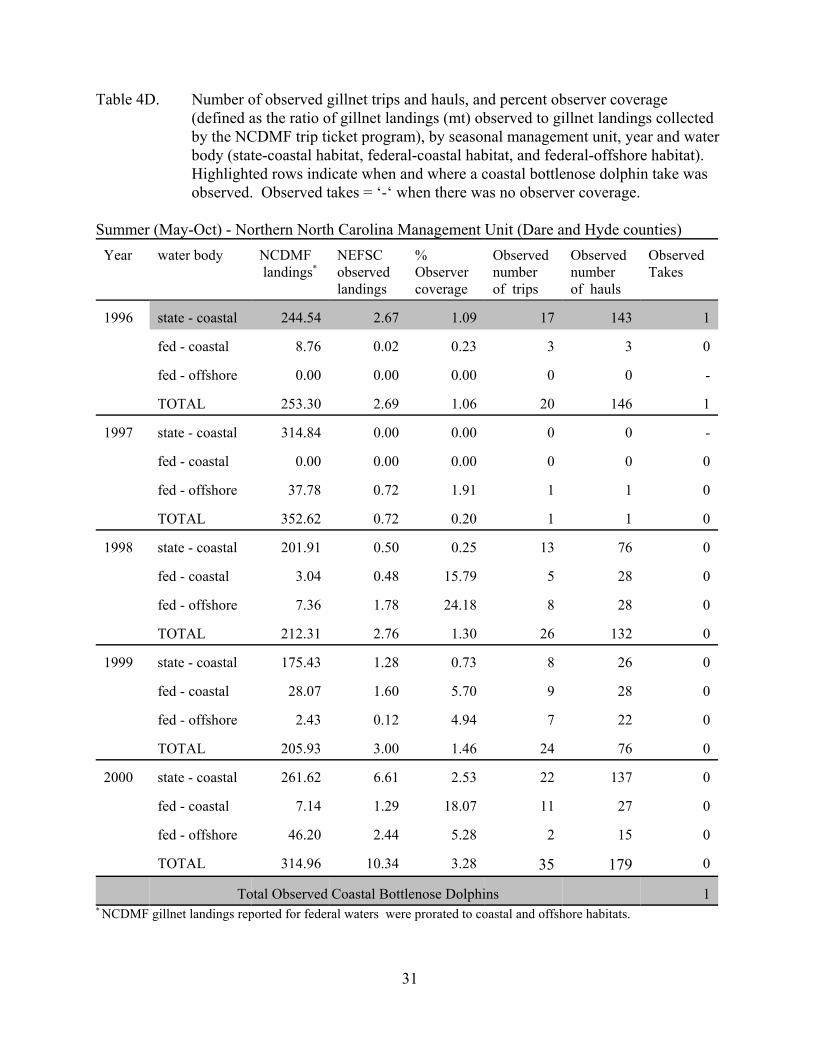
31
Table 4D. Number of observed gillnet trips and hauls, and percent observer coverage(defined as the ratio of gillnet landings (mt) observed to gillnet landings collectedby the NCDMF trip ticket program), by seasonal management unit, year and waterbody (state-coastal habitat, federal-coastal habitat, and federal-offshore habitat).Highlighted rows indicate when and where a coastal bottlenose dolphin take wasobserved. Observed takes = ‘-‘ when there was no observer coverage.
Summer (May-Oct) - Northern North Carolina Management Unit (Dare and Hyde counties) Year water body NCDMF
landings*NEFSCobservedlandings
%Observercoverage
Observednumber of trips
Observednumber of hauls
ObservedTakes
1996 state - coastal 244.54 2.67 1.09 17 143 1
fed - coastal 8.76 0.02 0.23 3 3 0
fed - offshore 0.00 0.00 0.00 0 0 -
TOTAL 253.30 2.69 1.06 20 146 1
1997 state - coastal 314.84 0.00 0.00 0 0 -
fed - coastal 0.00 0.00 0.00 0 0 0
fed - offshore 37.78 0.72 1.91 1 1 0
TOTAL 352.62 0.72 0.20 1 1 0
1998 state - coastal 201.91 0.50 0.25 13 76 0
fed - coastal 3.04 0.48 15.79 5 28 0
fed - offshore 7.36 1.78 24.18 8 28 0
TOTAL 212.31 2.76 1.30 26 132 0
1999 state - coastal 175.43 1.28 0.73 8 26 0
fed - coastal 28.07 1.60 5.70 9 28 0
fed - offshore 2.43 0.12 4.94 7 22 0
TOTAL 205.93 3.00 1.46 24 76 0
2000 state - coastal 261.62 6.61 2.53 22 137 0
fed - coastal 7.14 1.29 18.07 11 27 0
fed - offshore 46.20 2.44 5.28 2 15 0
TOTAL 314.96 10.34 3.28 35 179 0
Total Observed Coastal Bottlenose Dolphins 1* NCDMF gillnet landings reported for federal waters were prorated to coastal and offshore habitats.
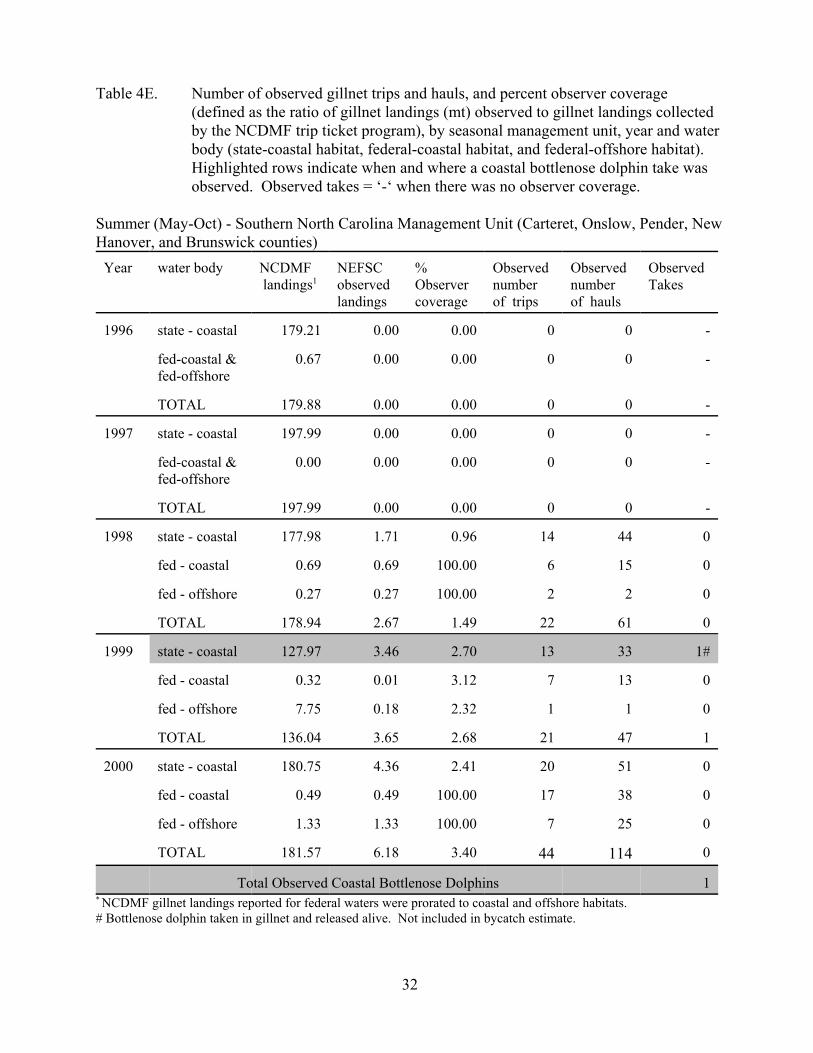
32
Table 4E. Number of observed gillnet trips and hauls, and percent observer coverage(defined as the ratio of gillnet landings (mt) observed to gillnet landings collectedby the NCDMF trip ticket program), by seasonal management unit, year and waterbody (state-coastal habitat, federal-coastal habitat, and federal-offshore habitat).Highlighted rows indicate when and where a coastal bottlenose dolphin take wasobserved. Observed takes = ‘-‘ when there was no observer coverage.
Summer (May-Oct) - Southern North Carolina Management Unit (Carteret, Onslow, Pender, NewHanover, and Brunswick counties)
Year water body NCDMF landings1
NEFSCobservedlandings
%Observercoverage
Observednumber of trips
Observednumber of hauls
ObservedTakes
1996 state - coastal 179.21 0.00 0.00 0 0 -
fed-coastal &fed-offshore
0.67 0.00 0.00 0 0 -
TOTAL 179.88 0.00 0.00 0 0 -
1997 state - coastal 197.99 0.00 0.00 0 0 -
fed-coastal &fed-offshore
0.00 0.00 0.00 0 0 -
TOTAL 197.99 0.00 0.00 0 0 -
1998 state - coastal 177.98 1.71 0.96 14 44 0
fed - coastal 0.69 0.69 100.00 6 15 0
fed - offshore 0.27 0.27 100.00 2 2 0
TOTAL 178.94 2.67 1.49 22 61 0
1999 state - coastal 127.97 3.46 2.70 13 33 1#
fed - coastal 0.32 0.01 3.12 7 13 0
fed - offshore 7.75 0.18 2.32 1 1 0
TOTAL 136.04 3.65 2.68 21 47 1
2000 state - coastal 180.75 4.36 2.41 20 51 0
fed - coastal 0.49 0.49 100.00 17 38 0
fed - offshore 1.33 1.33 100.00 7 25 0
TOTAL 181.57 6.18 3.40 44 114 0
Total Observed Coastal Bottlenose Dolphins 1* NCDMF gillnet landings reported for federal waters were prorated to coastal and offshore habitats.# Bottlenose dolphin taken in gillnet and released alive. Not included in bycatch estimate.

33
Table 5. Results from a stepwise selection of a model of bycatch rates of coastal bottlenosedolphins in mid-Atlantic gillnets using gear characteristics and fishing practices. The statistics provided for each model includes: degrees of freedom of the model(DF), deviance of the model (Deviance), residual degrees of freedom (Resid DF),residual deviance (Resid Dev), and the AIC. The smaller the AIC the better themodel fits.
Model DF Deviance Resid. DF Resid. Dev AIC
full1 4424 120.92 208.92
-twine size 15 18.13 4439 139.05 197.05
-target species 17 19.06 4456 158.11 182.11
-escape panel used 1 0.00 4457 158.12 180.12
-string length 1 0.12 4458 158.13 178.13
-year 1 0.26 4459 158.39 176.39
-km.hr 1 1.71 4460 160.09 176.09
-soak duration2 1 1.28 4461 161.38 175.381 full model: log(num.bodo) ~ MU + offset(log(land.kept.mton)) + state.or.fed + year +
target.species + soak.duration + km.hr + season + string.length +escape.panel.used + twine.size + mesh.size
2 final model: log(num.bodo) ~ MU + state.or.fed + mesh.size + offset(log(land.kept.mton))
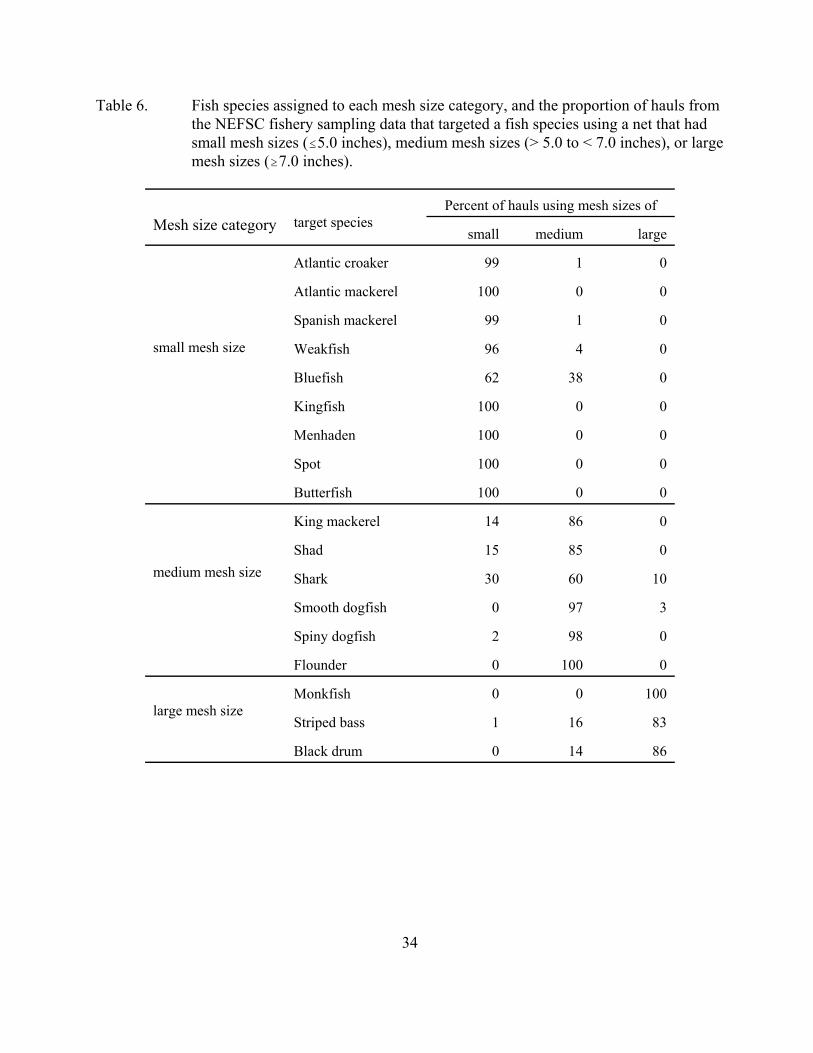
34
Table 6. Fish species assigned to each mesh size category, and the proportion of hauls fromthe NEFSC fishery sampling data that targeted a fish species using a net that hadsmall mesh sizes (#5.0 inches), medium mesh sizes (> 5.0 to < 7.0 inches), or largemesh sizes ($7.0 inches).
Mesh size category target speciesPercent of hauls using mesh sizes of
small medium large
small mesh size
Atlantic croaker 99 1 0
Atlantic mackerel 100 0 0
Spanish mackerel 99 1 0
Weakfish 96 4 0
Bluefish 62 38 0
Kingfish 100 0 0
Menhaden 100 0 0
Spot 100 0 0
Butterfish 100 0 0
medium mesh size
King mackerel 14 86 0
Shad 15 85 0
Shark 30 60 10
Smooth dogfish 0 97 3
Spiny dogfish 2 98 0
Flounder 0 100 0
large mesh sizeMonkfish 0 0 100
Striped bass 1 16 83
Black drum 0 14 86

35
Table 7. AIC values for models that added one more variable into the best fitting modelchosen from the stepwise selection method. The lower the AIC the better the fit.
* indicates the model fits better than the “best model”1
Model AIC
“best model”1 174.33
“best model” + set.dir 181.55
“best model” + month 177.51
“best model” + depth 176.18
“best model” + tie.used 175.94
“best model” + net.height 174.38
“best model” + dist2shore 170.87*
“best model” + dist2shoreA 169.98*
“best model” + anchor.used 167.79*
1 the “best model” is log(num.bodo) ~ MU + state.or.fed + mesh.cats +offset(log(land.kept.mton))
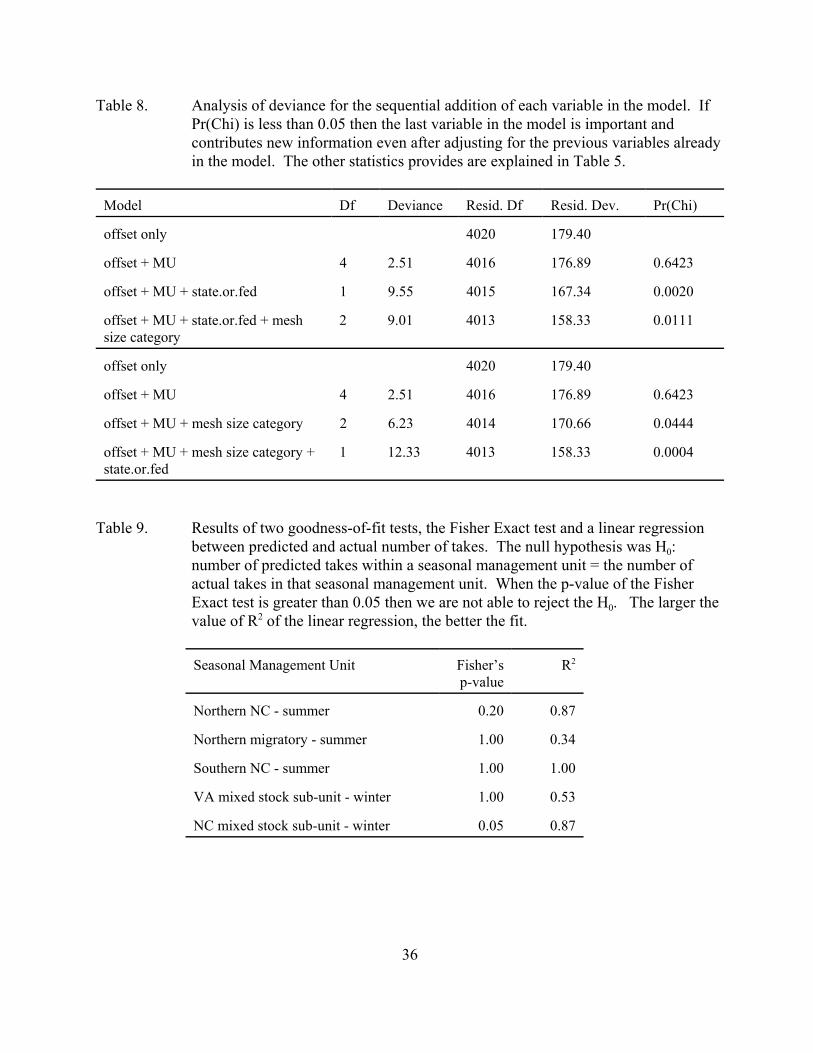
36
Table 8. Analysis of deviance for the sequential addition of each variable in the model. IfPr(Chi) is less than 0.05 then the last variable in the model is important andcontributes new information even after adjusting for the previous variables alreadyin the model. The other statistics provides are explained in Table 5.
Model Df Deviance Resid. Df Resid. Dev. Pr(Chi)
offset only 4020 179.40
offset + MU 4 2.51 4016 176.89 0.6423
offset + MU + state.or.fed 1 9.55 4015 167.34 0.0020
offset + MU + state.or.fed + meshsize category
2 9.01 4013 158.33 0.0111
offset only 4020 179.40
offset + MU 4 2.51 4016 176.89 0.6423
offset + MU + mesh size category 2 6.23 4014 170.66 0.0444
offset + MU + mesh size category +state.or.fed
1 12.33 4013 158.33 0.0004
Table 9. Results of two goodness-of-fit tests, the Fisher Exact test and a linear regressionbetween predicted and actual number of takes. The null hypothesis was H0:number of predicted takes within a seasonal management unit = the number ofactual takes in that seasonal management unit. When the p-value of the FisherExact test is greater than 0.05 then we are not able to reject the H0. The larger thevalue of R2 of the linear regression, the better the fit.
Seasonal Management Unit Fisher’sp-value
R2
Northern NC - summer 0.20 0.87
Northern migratory - summer 1.00 0.34
Southern NC - summer 1.00 1.00
VA mixed stock sub-unit - winter 1.00 0.53
NC mixed stock sub-unit - winter 0.05 0.87
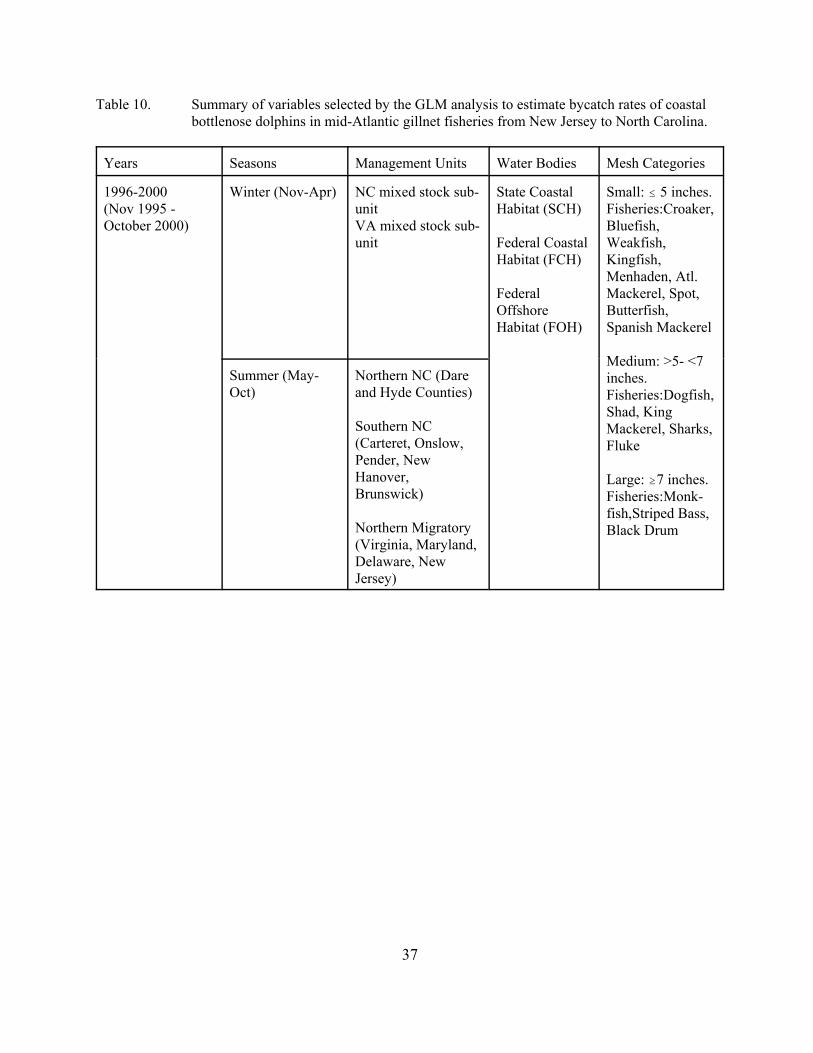
37
Table 10. Summary of variables selected by the GLM analysis to estimate bycatch rates of coastalbottlenose dolphins in mid-Atlantic gillnet fisheries from New Jersey to North Carolina.
Years Seasons Management Units Water Bodies Mesh Categories
1996-2000(Nov 1995 -October 2000)
Winter (Nov-Apr) NC mixed stock sub-unitVA mixed stock sub-unit
State CoastalHabitat (SCH)
Federal CoastalHabitat (FCH)
FederalOffshoreHabitat (FOH)
Small: # 5 inches.Fisheries:Croaker,Bluefish,Weakfish,Kingfish,Menhaden, Atl.Mackerel, Spot,Butterfish,Spanish Mackerel
Medium: >5- <7inches.Fisheries:Dogfish,Shad, KingMackerel, Sharks,Fluke
Large: $7 inches.Fisheries:Monk-fish,Striped Bass,Black Drum
Summer (May-Oct)
Northern NC (Dareand Hyde Counties)
Southern NC(Carteret, Onslow,Pender, NewHanover,Brunswick)
Northern Migratory(Virginia, Maryland,Delaware, NewJersey)

38
Table 11. Estimated bycatch rate (number of coastal bottlenose dolphin takes/metric tons offish landed) and coefficient of variation (CV) for each seasonal management unit,mesh size category (small, medium, and large), and distance from shore (statewaters, federal waters within the coastal bottlenose dolphin habitat).
A. Bycatch rateManagementUnit
Body of water Bycatch rate
Small mesh(#5.0 inches)
Medium mesh(> 5.0 to < 7.0)
Large mesh($7.0 inches)
NC mixed stock -winter
state 0.0159 0.0504 0.3222
federal 0.0014 0.0047 0.0403
VA mixed stock -winter
state 0.0075 0.0243 0.1825
federal 0.0007 0.0022 0.0193
N. Migratory -summer
state 0.0266 0.0824 0.4458
federal 0.0024 0.0079 0.0663
N. NC -summer
state 0.0698 0.1979 0.6885
federal 0.0066 0.0213 0.1632
S. NC -summer
state 0.0006 0.0020 0.0173
federal 0.0001 0.0002 0.0016
B. Coefficient of variation (CV)ManagementUnit
Body of water %CV
Small mesh(#5.0 inches)
Medium mesh(> 5.0 to < 7.0)
Large mesh($7.0 inches)
NC mixed stock -winter
state 87.9 46.5 64.8
federal 114.7 89.3 92.7
VA mixed stock -winter
state 120.0 126.5 107.1
federal 146.4 160.5 129.9
N. Migratory -summer
state 64.9 70.7 64.7
federal 111.5 113.6 109.6
N. NC -summer
state 100.3 94.1 92.4
federal 171.1 159.3 134.3
S. NC -summer
state 111.8 146.6 206.3
federal 146.8 527.2 184.8
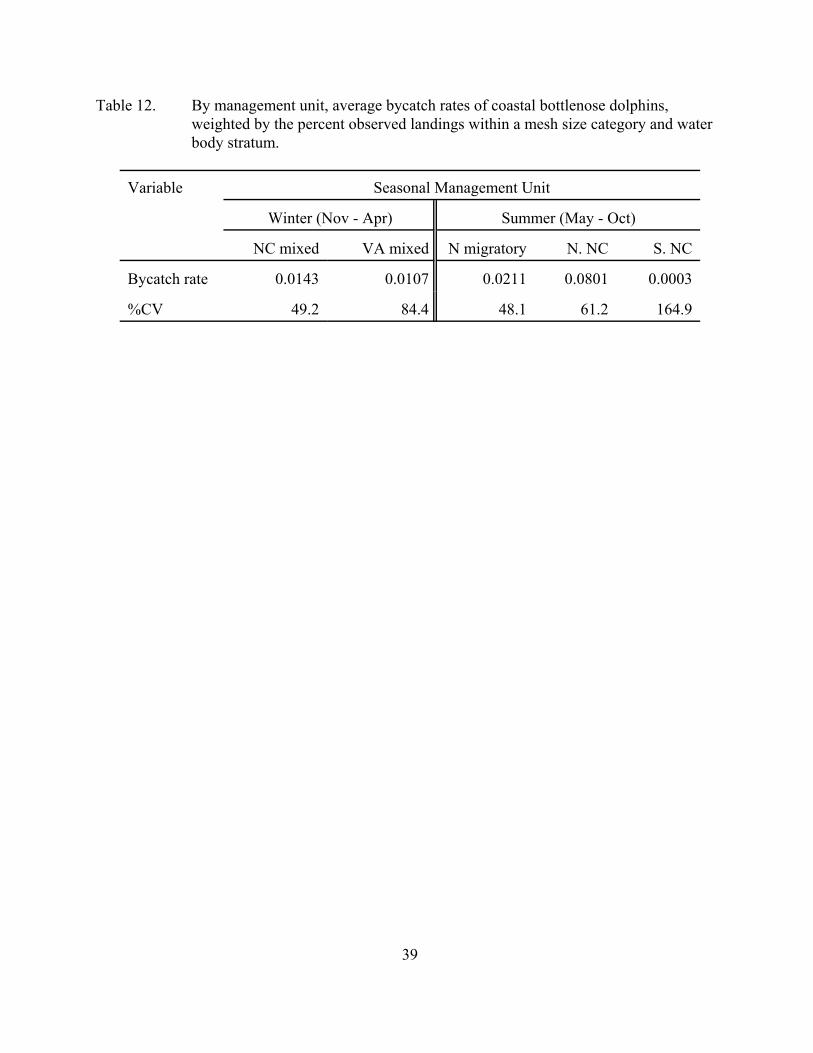
39
Table 12. By management unit, average bycatch rates of coastal bottlenose dolphins,weighted by the percent observed landings within a mesh size category and waterbody stratum.
Variable Seasonal Management Unit
Winter (Nov - Apr) Summer (May - Oct)
NC mixed VA mixed N migratory N. NC S. NC
Bycatch rate 0.0143 0.0107 0.0211 0.0801 0.0003
%CV 49.2 84.4 48.1 61.2 164.9


41
Table 13A.
Winter-Virginia/VA Mixed Stock Sub-Management UnitNER Dealer Reported Commercial Landings (MT) from Federal Waters Prorated to Coastal and Offshore Habitats
Year
SMALL MESH MEDIUM MESH LARGE MESH
%VTRMT
NERDealerTotalMT
Landedin
federalwaters
ProratedNER MT
%VTRMT
NERDealerTotal MT
Landed in
federalwaters
ProratedNERMT
%VTRMT
NERDealerTotal MT
Landed in
federalwaters
ProratedNERMT
FCH FOH FCH FOH FCH FOH FCH FOH FCH FOH FCH FOH
1996 . . 0.50 . . 0.00 100.00 35.06 0.00 35.06 0.00 100.00 4.83 0.00 4.83
1997 18.46 81.54 1.70 0.31 1.39 5.94 94.06 1738.33 103.25 1635.08 5.35 94.65 108.75 5.82 102.93
1998 17.51 82.49 10.87 1.90 8.96 1.57 98.43 1378.05 21.67 1356.38 68.58 31.42 8.94 6.13 2.81
1999 46.11 53.89 33.98 15.67 18.31 8.05 91.95 1787.20 143.86 1643.34 47.97 52.03 96.93 46.50 50.43
2000 66.44 33.56 27.00 17.94 9.06 28.92 71.08 405.20 117.19 288.01 40.07 59.93 93.71 37.55 56.16
Winter-Virginia/VA Mixed Stock Sub-Management UnitNER Dealer Reported Commercial Landings (MT) from State Coastal Habitat
YearSmallSCH
MediumSCH
LargeSCH
1996 255.91 143.00 29.24
1997 298.45 435.54 57.04
1998 451.40 426.34 106.77
1999 329.30 291.00 218.03
2000 313.13 188.89 248.46

42
Table 13B.
Winter-Maryland/Northern Migratory Management UnitNER Dealer Reported Commercial Landings (MT) from Oceanic Waters Prorated to All Habitats
Year
SMALL MEDIUM LARGE
%VTRMT
NERDealerTotalMT
Landedin
Oceanicwaters
ProratedNER Dealer
MT
%VTRMT
NERDealerTotal MT
Landed in
federalwaters
ProratedNER Dealer
MT
%VTRMT
NERDealerTotal MT
Landed in
federalwaters
ProratedNER Dealer
MT
SCH FCH FOH SCH FCH FOH SCH FCH FOH SCH FCH FOH SCH FCH FOH SCH FCH FOH
1996 53.89 1.92 92.70 106.16 5.72 2.04 98.40 0.39 1.56 98.05 3480.29 13.70 54.21 3412.38 2.14 1.14 96.72 115.70 2.48 1.31 111.90
1997 10.07 19.38 70.56 48.19 4.85 9.34 34.00 0.01 7.73 92.26 2109.51 0.21 163.11 1946.19 0.01 3.16 96.83 166.59 0.01 5.27 161.31
1998 27.18 9.80 63.02 34.12 9.27 3.34 21.50 2.51 2.79 94.70 920.14 23.09 25.69 871.36 6.00 8.15 85.85 102.14 6.13 8.32 87.69
1999 36.68 9.84 53.48 91.82 33.68 9.03 49.10 33.21 0.56 96.12 1050.91 34.89 5.87 1010.14 9.46 0.93 89.61 95.68 9.05 0.89 85.74
2000 52.06 1.64 46.30 68.71 35.77 1.13 31.81 18.95 6.38 74.67 274.27 51.97 17.51 204.79 17.37 12.56 70.07 65.04 11.30 8.17 45.57
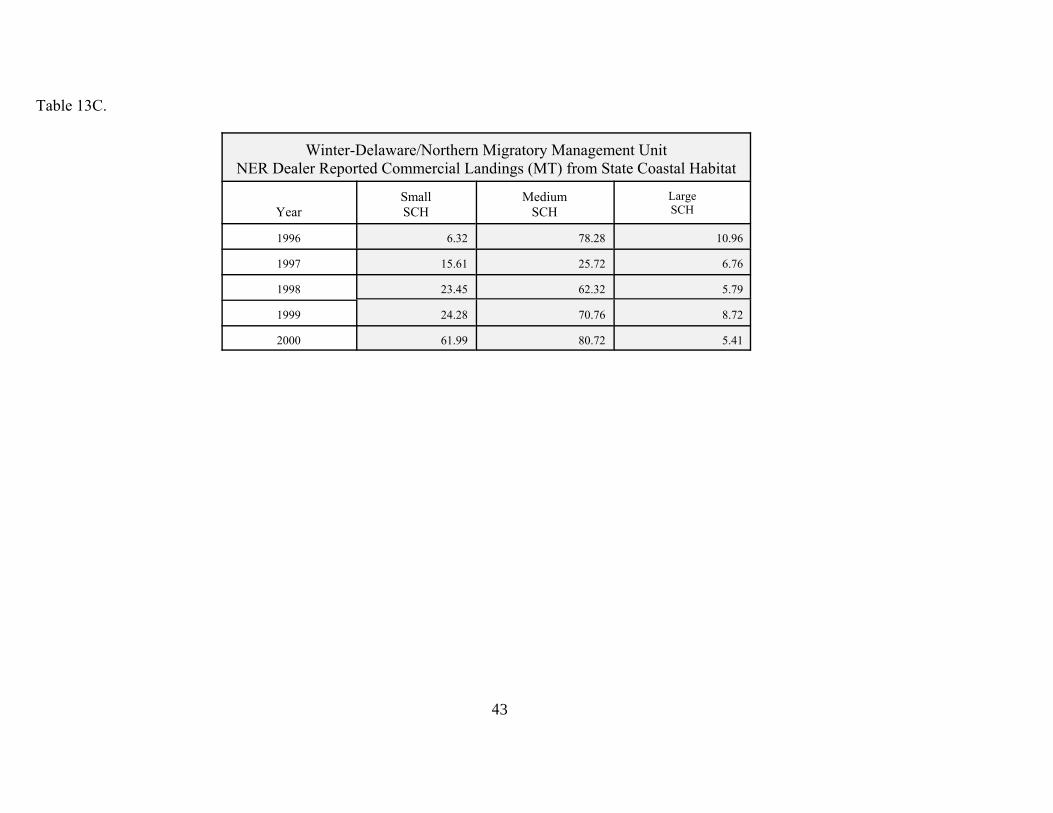
43
Table 13C.
Winter-Delaware/Northern Migratory Management UnitNER Dealer Reported Commercial Landings (MT) from State Coastal Habitat
YearSmallSCH
MediumSCH
LargeSCH
1996 6.32 78.28 10.96
1997 15.61 25.72 6.76
1998 23.45 62.32 5.79
1999 24.28 70.76 8.72
2000 61.99 80.72 5.41
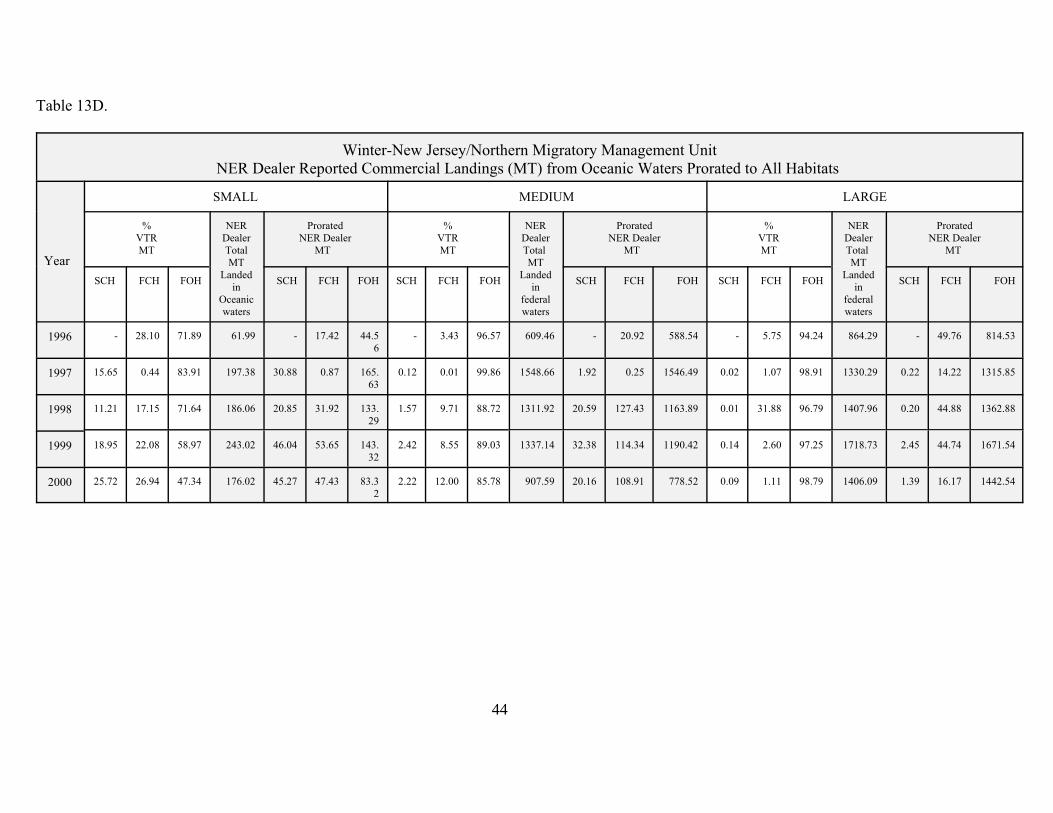
44
Table 13D.
Winter-New Jersey/Northern Migratory Management UnitNER Dealer Reported Commercial Landings (MT) from Oceanic Waters Prorated to All Habitats
Year
SMALL MEDIUM LARGE
%VTRMT
NERDealerTotalMT
Landedin
Oceanicwaters
ProratedNER Dealer
MT
%VTRMT
NERDealerTotal MT
Landed in
federalwaters
ProratedNER Dealer
MT
%VTRMT
NERDealerTotal MT
Landed in
federalwaters
ProratedNER Dealer
MT
SCH FCH FOH SCH FCH FOH SCH FCH FOH SCH FCH FOH SCH FCH FOH SCH FCH FOH
1996 - 28.10 71.89 61.99 - 17.42 44.56
- 3.43 96.57 609.46 - 20.92 588.54 - 5.75 94.24 864.29 - 49.76 814.53
1997 15.65 0.44 83.91 197.38 30.88 0.87 165.63
0.12 0.01 99.86 1548.66 1.92 0.25 1546.49 0.02 1.07 98.91 1330.29 0.22 14.22 1315.85
1998 11.21 17.15 71.64 186.06 20.85 31.92 133.29
1.57 9.71 88.72 1311.92 20.59 127.43 1163.89 0.01 31.88 96.79 1407.96 0.20 44.88 1362.88
1999 18.95 22.08 58.97 243.02 46.04 53.65 143.32
2.42 8.55 89.03 1337.14 32.38 114.34 1190.42 0.14 2.60 97.25 1718.73 2.45 44.74 1671.54
2000 25.72 26.94 47.34 176.02 45.27 47.43 83.32
2.22 12.00 85.78 907.59 20.16 108.91 778.52 0.09 1.11 98.79 1406.09 1.39 16.17 1442.54

45
Table 13E.
Summer-Virginia/Northern Migratory Management UnitNER Dealer Reported Commercial Landings (MT) from Federal Waters Prorated to Coastal and Offshore Habitats
Year
SMALL MEDIUM LARGE
%VTRMT
NERDealerTotalMT
Landedin
federalwaters
ProratedNER MT
%VTRMT
NERDealerTotal MT
Landed in
federalwaters
ProratedNERMT
%VTRMT
NERDealerTotal MT
Landed in
federalwaters
ProratedNERMT
FCH FOH FCH FOH FCH FOH FCH FOH FCH FOH FCH FOH
1996 100.00 0.00 0.26 0.26 0.00 87.19 12.81 173.70 151.45 22.25 0.83 99.17 26.33 0.22 26.11
1997 45.07 54.93 0.07 0.03 0.04 0.00 100.00 32.99 0.00 32.99 0.00 100.00 2.34 0.00 2.34
1998 12.26 87.74 0.54 0.07 0.47 20.47 79.53 17.58 3.60 13.98 0.36 99.64 234.79 0.85 233.94
1999 22.08 77.92 19.48 4.30 15.18 11.75 88.25 132.34 15.55 116.79 0.01 99.99 614.92 0.07 614.85
2000 14.57 85.43 81.60 11.98 69.71 8.05 91.95 86.10 6.93 19.17 0.23 99.76 112.25 0.26 111.99
Summer-Virginia/Northern Migratory Management UnitNER Dealer Reported Commercial Landings (MT) from State Coastal Habitat
YearSmallSCH
MediumSCH
LargeSCH
1996 447.12 85.55 15.56
1997 501.05 36.29 5.66
1998 219.39 43.55 16.85
1999 109.28 58.92 4.95
2000 219.16 29.82 5.80

46
Table 13F.
Summer-Maryland/Northern Migratory Management UnitNER Dealer Reported Commercial Landings (MT) from Oceanic Waters Prorated to All Habitats
Year
SMALL MEDIUM LARGE
%VTRMT
NERDealerTotalMT
Landedin
Oceanicwaters
ProratedNER Dealer
MT
%VTRMT
NERDealerTotal MT
Landed in
federalwaters
ProratedNER Dealer
MT
%VTRMT
NERDealerTotal MT
Landed in
federalwaters
ProratedNER Dealer
MT
SCH FCH FOH SCH FCH FOH SCH FCH FOH SCH FCH FOH SCH FCH FOH SCH FCH FOH
1996 83.19 5.78 11.03 7.38 6.14 0.43 0.81 0.00 30.80 69.20 106.09 0.00 32.68 73.41 0.00 0.00 100.0 138.01 0.00 0.00 138.01
1997 10.45 67.48 22.07 17.23 1.80 11.63 3.80 23.95 21.84 54.20 30.45 7.29 6.65 16.50 1.81 10.78 87.41 149.07 2.70 16.08 130.30
1998 4.18 52.20 43.62 20.16 0.84 10.53 8.79 47.26 16.25 36.50 38.92 18.39 6.32 14.20 0.13 0.00 99.87 159.00 0.21 0.00 158.79
1999 0.61 56.87 42.52 46.35 0.28 26.36 19.71 0.99 60.32 38.68 83.90 0.83 50.61 32.45 0.00 0.00 100.0 134.16 0.00 0.00 134.16
2000 2.95 28.29 68.77 26.10 0.77 7.38 17.95 0.00 73.03 26.97 11.59 0.00 8.46 3.13 0.00 0.25 99.75 42.08 0.00 0.11 41.98
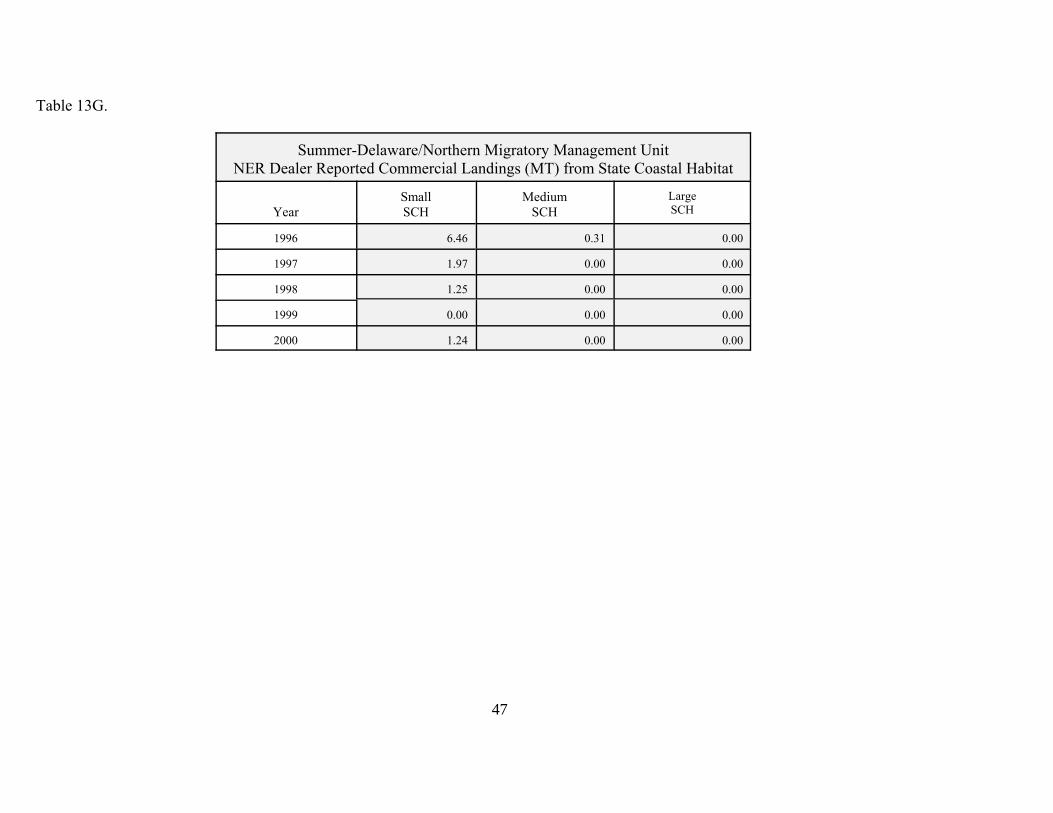
47
Table 13G.
Summer-Delaware/Northern Migratory Management UnitNER Dealer Reported Commercial Landings (MT) from State Coastal Habitat
YearSmallSCH
MediumSCH
LargeSCH
1996 6.46 0.31 0.00
1997 1.97 0.00 0.00
1998 1.25 0.00 0.00
1999 0.00 0.00 0.00
2000 1.24 0.00 0.00
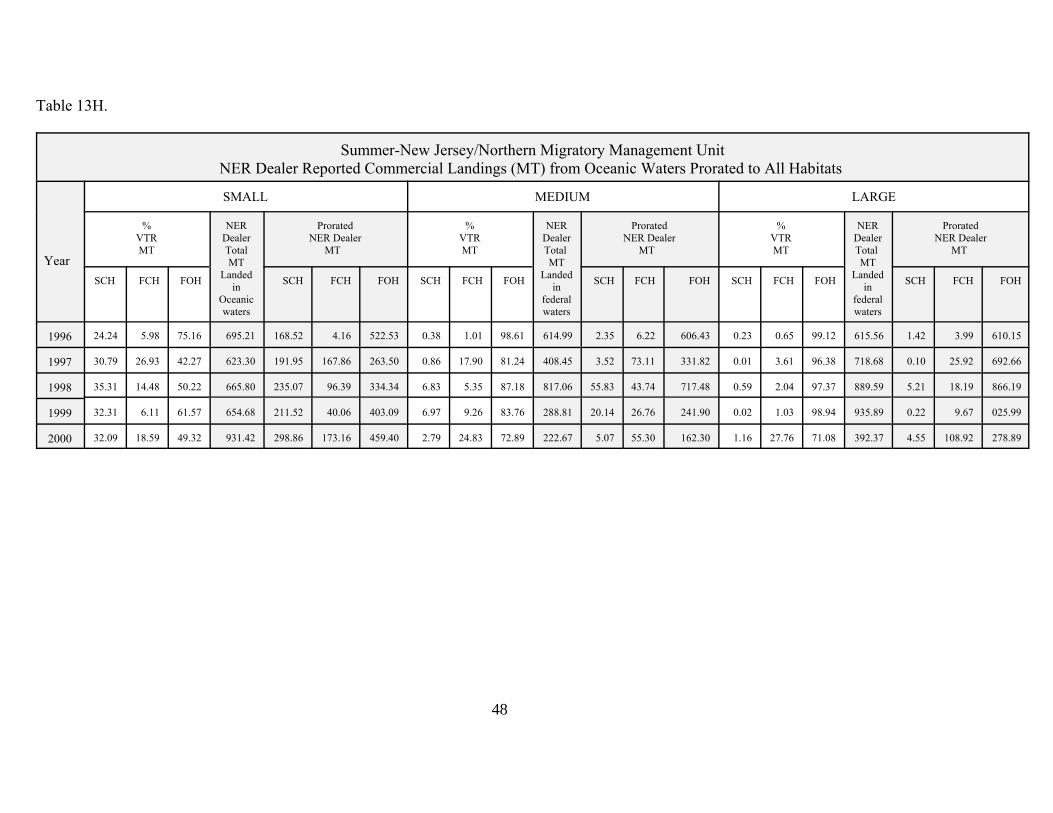
48
Table 13H.
Summer-New Jersey/Northern Migratory Management UnitNER Dealer Reported Commercial Landings (MT) from Oceanic Waters Prorated to All Habitats
Year
SMALL MEDIUM LARGE
%VTRMT
NERDealerTotalMT
Landedin
Oceanicwaters
ProratedNER Dealer
MT
%VTRMT
NERDealerTotal MT
Landed in
federalwaters
ProratedNER Dealer
MT
%VTRMT
NERDealerTotal MT
Landed in
federalwaters
ProratedNER Dealer
MT
SCH FCH FOH SCH FCH FOH SCH FCH FOH SCH FCH FOH SCH FCH FOH SCH FCH FOH
1996 24.24 5.98 75.16 695.21 168.52 4.16 522.53 0.38 1.01 98.61 614.99 2.35 6.22 606.43 0.23 0.65 99.12 615.56 1.42 3.99 610.15
1997 30.79 26.93 42.27 623.30 191.95 167.86 263.50 0.86 17.90 81.24 408.45 3.52 73.11 331.82 0.01 3.61 96.38 718.68 0.10 25.92 692.66
1998 35.31 14.48 50.22 665.80 235.07 96.39 334.34 6.83 5.35 87.18 817.06 55.83 43.74 717.48 0.59 2.04 97.37 889.59 5.21 18.19 866.19
1999 32.31 6.11 61.57 654.68 211.52 40.06 403.09 6.97 9.26 83.76 288.81 20.14 26.76 241.90 0.02 1.03 98.94 935.89 0.22 9.67 025.99
2000 32.09 18.59 49.32 931.42 298.86 173.16 459.40 2.79 24.83 72.89 222.67 5.07 55.30 162.30 1.16 27.76 71.08 392.37 4.55 108.92 278.89

49
Table 13I.
Winter-North Carolina Mixed Stock Sub-Management UnitNCDMF Commercial Landings (MT) from Federal Waters Prorated to Coastal and Offshore Habitats
Year
SMALL MESH MEDIUM MESH LARGE MESH
%Observed
MT
NCDMFTotalMT
Landedin
federalwaters
ProratedNCDMF
MT
%Observed
MT
NCDMFTotal MT
Landed in
federalwaters
ProratedNCDMF
MT
%Observed
MT
NCDMFTotal MT
Landed in
federalwaters
ProratedNCDMF
MT
FCH FOH FCH FOH FCH FOH FCH FOH FCH FOH FCH FOH
1996 91.80 8.20 1605.56 1473.85 131.70 33.78 66.23 2402.85 811.59 1591.26 1.74 98.26 156.83 2.73 154.10
1997 97.65 2.35 1341.57 1309.99 31.58 61.11 38.89 1547.77 945.68 601.80 0.52 99.48 248.48 1.29 247.19
1998 65.66 34.34 1867.72 1226.33 641.39 72.41 27.59 1052.83 762.36 290.48 0.67 99.33 286.69 1.92 284.76
1999 73.14 26.86 1657.41 1212.26 445.15 86.21 13.79 658.74 567.89 90.85 25.35 74.65 233.65 59.22 174.42
2000 30.02 69.98 1960.36 588.46 1371.90 77.09 22.91 792.77 611.12 181.65 100.00 0.00 282.51 282.51 0.00
Winter-North Carolina Mix Management UnitNCDMF Commercial Landings (MT) from State Coastal Habitat
YearSmallSCH
MediumSCH
LargeSCH
1996 2514.31 1926.59 60.11
1997 1911.32 2714.94 41.49
1998 2813.81 1543.12 43.19
1999 2365.58 1047.66 149.94
2000 1271.44 942.02 32.97
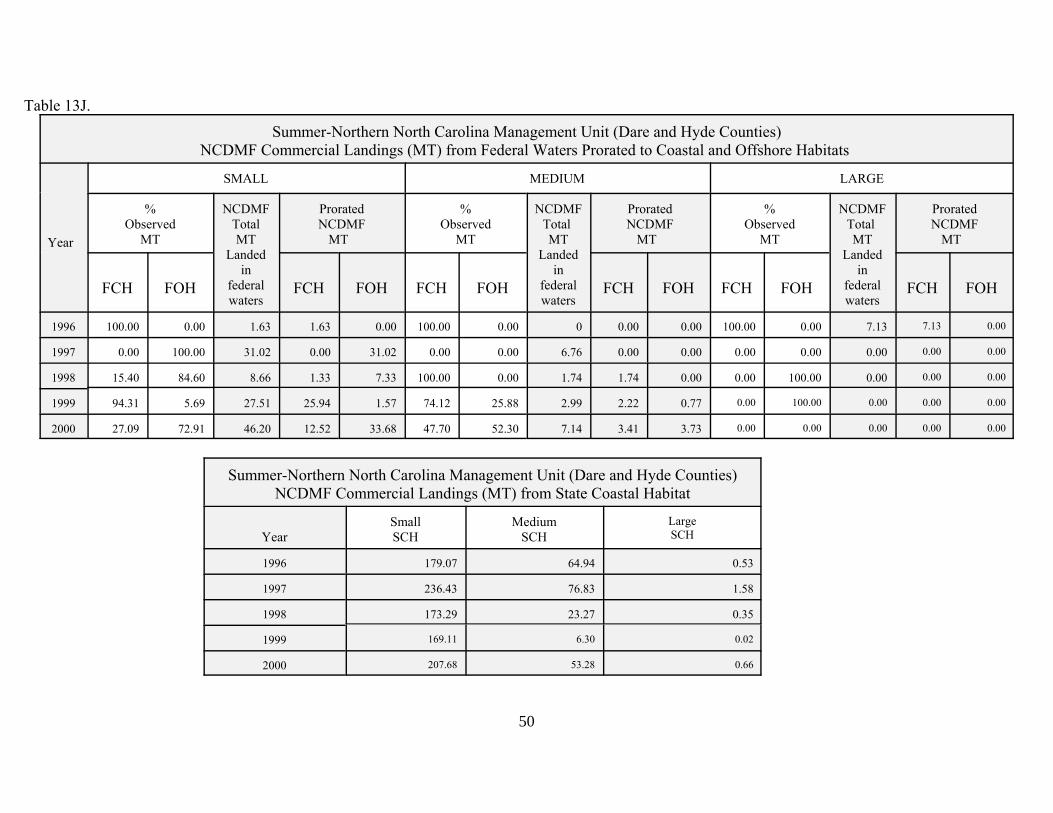
50
Table 13J.
Summer-Northern North Carolina Management Unit (Dare and Hyde Counties)NCDMF Commercial Landings (MT) from Federal Waters Prorated to Coastal and Offshore Habitats
Year
SMALL MEDIUM LARGE
%Observed
MT
NCDMFTotalMT
Landedin
federalwaters
ProratedNCDMF
MT
%Observed
MT
NCDMFTotal MT
Landed in
federalwaters
ProratedNCDMF
MT
%Observed
MT
NCDMFTotal MT
Landed in
federalwaters
ProratedNCDMF
MT
FCH FOH FCH FOH FCH FOH FCH FOH FCH FOH FCH FOH
1996 100.00 0.00 1.63 1.63 0.00 100.00 0.00 0 0.00 0.00 100.00 0.00 7.13 7.13 0.00
1997 0.00 100.00 31.02 0.00 31.02 0.00 0.00 6.76 0.00 0.00 0.00 0.00 0.00 0.00 0.00
1998 15.40 84.60 8.66 1.33 7.33 100.00 0.00 1.74 1.74 0.00 0.00 100.00 0.00 0.00 0.00
1999 94.31 5.69 27.51 25.94 1.57 74.12 25.88 2.99 2.22 0.77 0.00 100.00 0.00 0.00 0.00
2000 27.09 72.91 46.20 12.52 33.68 47.70 52.30 7.14 3.41 3.73 0.00 0.00 0.00 0.00 0.00
Summer-Northern North Carolina Management Unit (Dare and Hyde Counties)NCDMF Commercial Landings (MT) from State Coastal Habitat
YearSmallSCH
MediumSCH
LargeSCH
1996 179.07 64.94 0.53
1997 236.43 76.83 1.58
1998 173.29 23.27 0.35
1999 169.11 6.30 0.02
2000 207.68 53.28 0.66
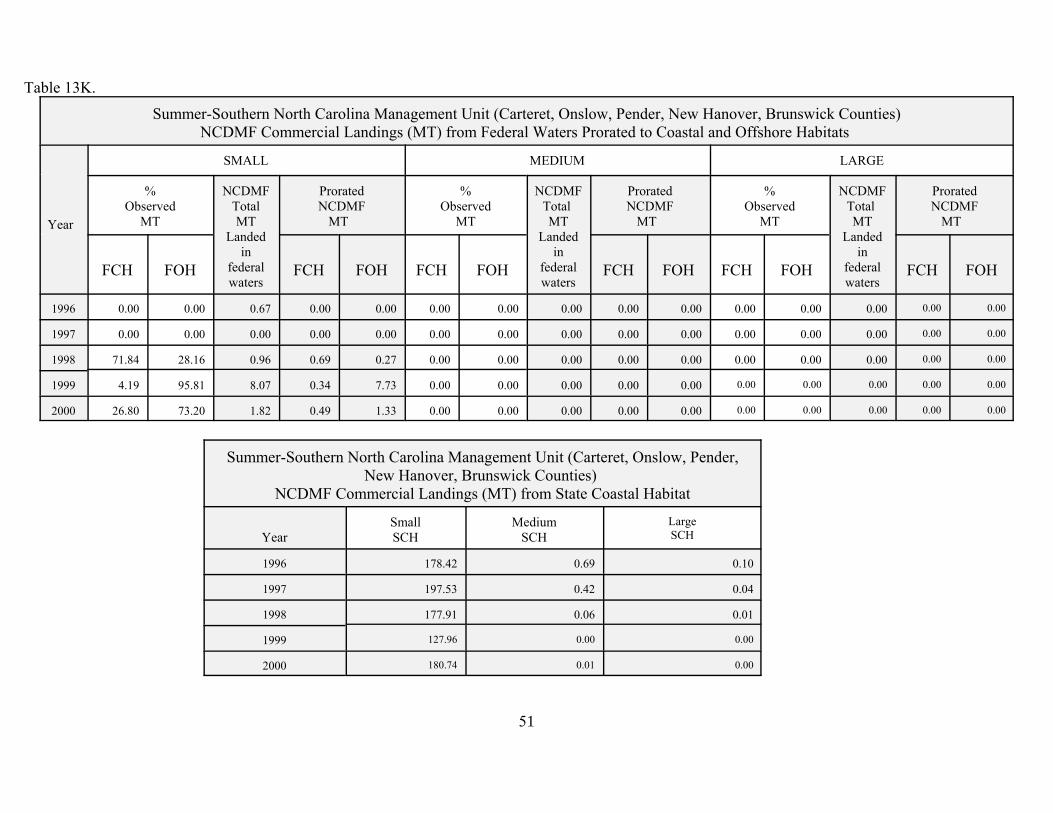
51
Table 13K.
Summer-Southern North Carolina Management Unit (Carteret, Onslow, Pender, New Hanover, Brunswick Counties)NCDMF Commercial Landings (MT) from Federal Waters Prorated to Coastal and Offshore Habitats
Year
SMALL MEDIUM LARGE
%Observed
MT
NCDMFTotalMT
Landedin
federalwaters
ProratedNCDMF
MT
%Observed
MT
NCDMFTotal MT
Landed in
federalwaters
ProratedNCDMF
MT
%Observed
MT
NCDMFTotal MT
Landed in
federalwaters
ProratedNCDMF
MT
FCH FOH FCH FOH FCH FOH FCH FOH FCH FOH FCH FOH
1996 0.00 0.00 0.67 0.00 0.00 0.00 0.00 0.00 0.00 0.00 0.00 0.00 0.00 0.00 0.00
1997 0.00 0.00 0.00 0.00 0.00 0.00 0.00 0.00 0.00 0.00 0.00 0.00 0.00 0.00 0.00
1998 71.84 28.16 0.96 0.69 0.27 0.00 0.00 0.00 0.00 0.00 0.00 0.00 0.00 0.00 0.00
1999 4.19 95.81 8.07 0.34 7.73 0.00 0.00 0.00 0.00 0.00 0.00 0.00 0.00 0.00 0.00
2000 26.80 73.20 1.82 0.49 1.33 0.00 0.00 0.00 0.00 0.00 0.00 0.00 0.00 0.00 0.00
Summer-Southern North Carolina Management Unit (Carteret, Onslow, Pender,New Hanover, Brunswick Counties)
NCDMF Commercial Landings (MT) from State Coastal Habitat
YearSmallSCH
MediumSCH
LargeSCH
1996 178.42 0.69 0.10
1997 197.53 0.42 0.04
1998 177.91 0.06 0.01
1999 127.96 0.00 0.00
2000 180.74 0.01 0.00
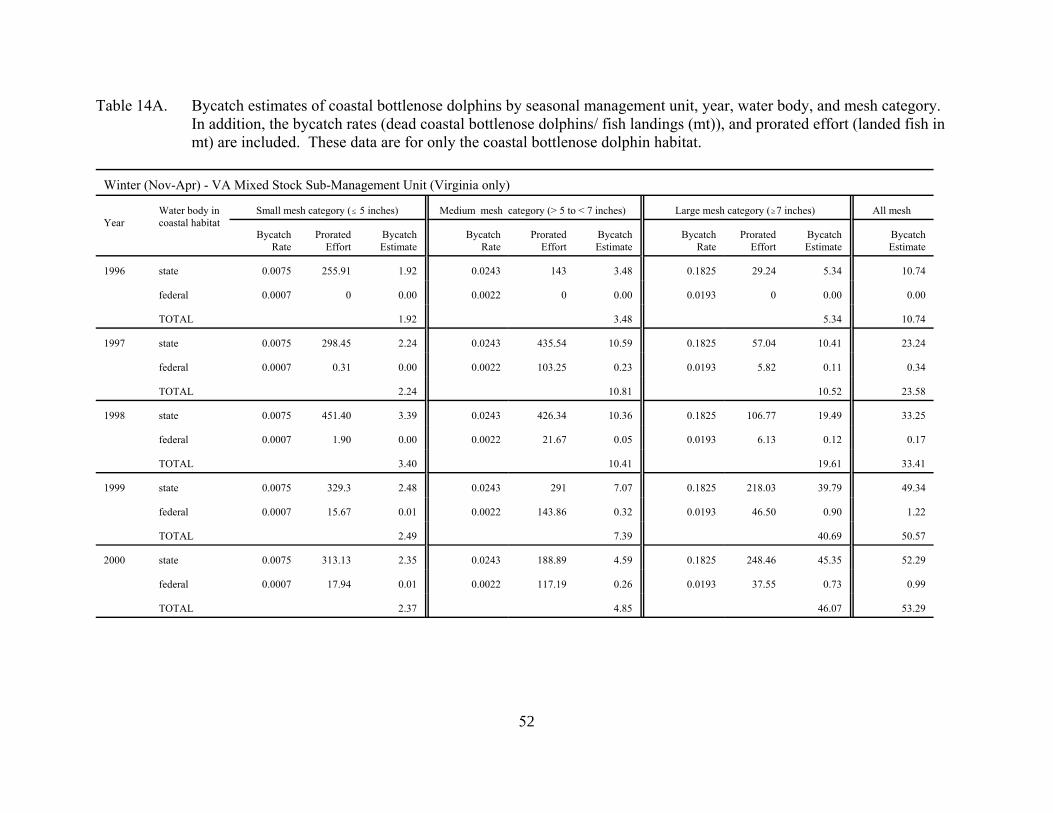
52
Table 14A. Bycatch estimates of coastal bottlenose dolphins by seasonal management unit, year, water body, and mesh category. In addition, the bycatch rates (dead coastal bottlenose dolphins/ fish landings (mt)), and prorated effort (landed fish inmt) are included. These data are for only the coastal bottlenose dolphin habitat.
Winter (Nov-Apr) - VA Mixed Stock Sub-Management Unit (Virginia only)
YearWater body incoastal habitat
Small mesh category (# 5 inches) Medium mesh category (> 5 to < 7 inches) Large mesh category ($7 inches) All mesh
BycatchRate
ProratedEffort
BycatchEstimate
BycatchRate
ProratedEffort
BycatchEstimate
BycatchRate
ProratedEffort
BycatchEstimate
BycatchEstimate
1996 state 0.0075 255.91 1.92 0.0243 143 3.48 0.1825 29.24 5.34 10.74
federal 0.0007 0 0.00 0.0022 0 0.00 0.0193 0 0.00 0.00
TOTAL 1.92 3.48 5.34 10.74
1997 state 0.0075 298.45 2.24 0.0243 435.54 10.59 0.1825 57.04 10.41 23.24
federal 0.0007 0.31 0.00 0.0022 103.25 0.23 0.0193 5.82 0.11 0.34
TOTAL 2.24 10.81 10.52 23.58
1998 state 0.0075 451.40 3.39 0.0243 426.34 10.36 0.1825 106.77 19.49 33.25
federal 0.0007 1.90 0.00 0.0022 21.67 0.05 0.0193 6.13 0.12 0.17
TOTAL 3.40 10.41 19.61 33.41
1999 state 0.0075 329.3 2.48 0.0243 291 7.07 0.1825 218.03 39.79 49.34
federal 0.0007 15.67 0.01 0.0022 143.86 0.32 0.0193 46.50 0.90 1.22
TOTAL 2.49 7.39 40.69 50.57
2000 state 0.0075 313.13 2.35 0.0243 188.89 4.59 0.1825 248.46 45.35 52.29
federal 0.0007 17.94 0.01 0.0022 117.19 0.26 0.0193 37.55 0.73 0.99
TOTAL 2.37 4.85 46.07 53.29
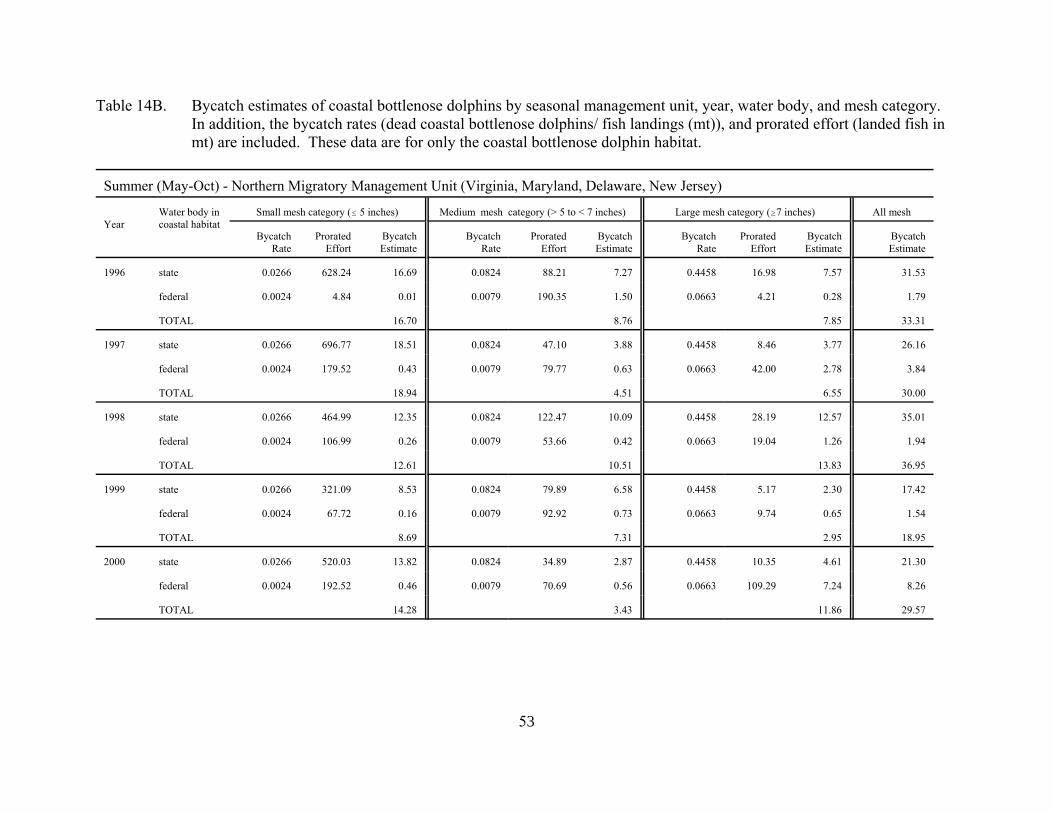
53
Table 14B. Bycatch estimates of coastal bottlenose dolphins by seasonal management unit, year, water body, and mesh category. In addition, the bycatch rates (dead coastal bottlenose dolphins/ fish landings (mt)), and prorated effort (landed fish inmt) are included. These data are for only the coastal bottlenose dolphin habitat.
Summer (May-Oct) - Northern Migratory Management Unit (Virginia, Maryland, Delaware, New Jersey)
YearWater body incoastal habitat
Small mesh category (# 5 inches) Medium mesh category (> 5 to < 7 inches) Large mesh category ($7 inches) All mesh
BycatchRate
ProratedEffort
BycatchEstimate
BycatchRate
ProratedEffort
BycatchEstimate
BycatchRate
ProratedEffort
BycatchEstimate
BycatchEstimate
1996 state 0.0266 628.24 16.69 0.0824 88.21 7.27 0.4458 16.98 7.57 31.53
federal 0.0024 4.84 0.01 0.0079 190.35 1.50 0.0663 4.21 0.28 1.79
TOTAL 16.70 8.76 7.85 33.31
1997 state 0.0266 696.77 18.51 0.0824 47.10 3.88 0.4458 8.46 3.77 26.16
federal 0.0024 179.52 0.43 0.0079 79.77 0.63 0.0663 42.00 2.78 3.84
TOTAL 18.94 4.51 6.55 30.00
1998 state 0.0266 464.99 12.35 0.0824 122.47 10.09 0.4458 28.19 12.57 35.01
federal 0.0024 106.99 0.26 0.0079 53.66 0.42 0.0663 19.04 1.26 1.94
TOTAL 12.61 10.51 13.83 36.95
1999 state 0.0266 321.09 8.53 0.0824 79.89 6.58 0.4458 5.17 2.30 17.42
federal 0.0024 67.72 0.16 0.0079 92.92 0.73 0.0663 9.74 0.65 1.54
TOTAL 8.69 7.31 2.95 18.95
2000 state 0.0266 520.03 13.82 0.0824 34.89 2.87 0.4458 10.35 4.61 21.30
federal 0.0024 192.52 0.46 0.0079 70.69 0.56 0.0663 109.29 7.24 8.26
TOTAL 14.28 3.43 11.86 29.57
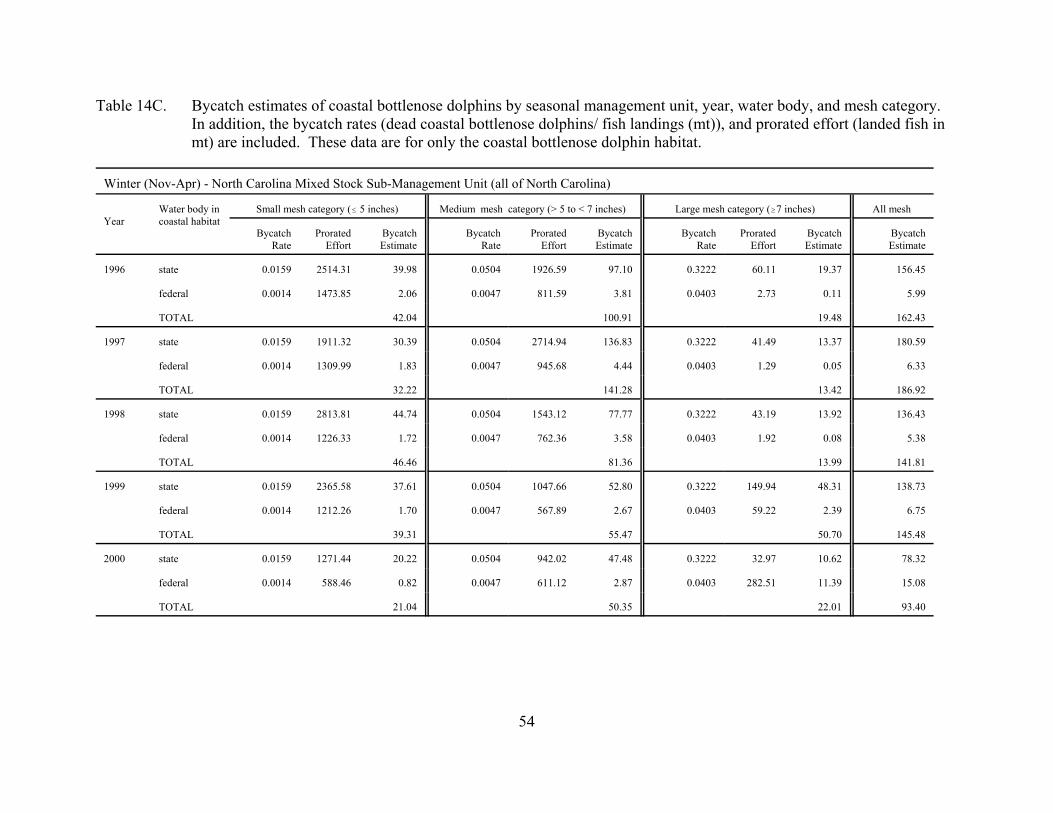
54
Table 14C. Bycatch estimates of coastal bottlenose dolphins by seasonal management unit, year, water body, and mesh category. In addition, the bycatch rates (dead coastal bottlenose dolphins/ fish landings (mt)), and prorated effort (landed fish inmt) are included. These data are for only the coastal bottlenose dolphin habitat.
Winter (Nov-Apr) - North Carolina Mixed Stock Sub-Management Unit (all of North Carolina)
YearWater body incoastal habitat
Small mesh category (# 5 inches) Medium mesh category (> 5 to < 7 inches) Large mesh category ($7 inches) All mesh
BycatchRate
ProratedEffort
BycatchEstimate
BycatchRate
ProratedEffort
BycatchEstimate
BycatchRate
ProratedEffort
BycatchEstimate
BycatchEstimate
1996 state 0.0159 2514.31 39.98 0.0504 1926.59 97.10 0.3222 60.11 19.37 156.45
federal 0.0014 1473.85 2.06 0.0047 811.59 3.81 0.0403 2.73 0.11 5.99
TOTAL 42.04 100.91 19.48 162.43
1997 state 0.0159 1911.32 30.39 0.0504 2714.94 136.83 0.3222 41.49 13.37 180.59
federal 0.0014 1309.99 1.83 0.0047 945.68 4.44 0.0403 1.29 0.05 6.33
TOTAL 32.22 141.28 13.42 186.92
1998 state 0.0159 2813.81 44.74 0.0504 1543.12 77.77 0.3222 43.19 13.92 136.43
federal 0.0014 1226.33 1.72 0.0047 762.36 3.58 0.0403 1.92 0.08 5.38
TOTAL 46.46 81.36 13.99 141.81
1999 state 0.0159 2365.58 37.61 0.0504 1047.66 52.80 0.3222 149.94 48.31 138.73
federal 0.0014 1212.26 1.70 0.0047 567.89 2.67 0.0403 59.22 2.39 6.75
TOTAL 39.31 55.47 50.70 145.48
2000 state 0.0159 1271.44 20.22 0.0504 942.02 47.48 0.3222 32.97 10.62 78.32
federal 0.0014 588.46 0.82 0.0047 611.12 2.87 0.0403 282.51 11.39 15.08
TOTAL 21.04 50.35 22.01 93.40

55
Table 14D. Bycatch estimates of coastal bottlenose dolphins by seasonal management unit, year, water body, and mesh category. In addition, the bycatch rates (dead coastal bottlenose dolphins/ fish landings (mt)), and prorated effort (landed fish inmt) are included. These data are for only the coastal bottlenose dolphin habitat.
Summer (May-Oct) - Northern North Carolina Management Unit (Dare and Hyde counties)
YearWater body incoastal habitat
Small mesh category (# 5 inches) Medium mesh category (> 5 to < 7 inches) Large mesh category ($7 inches) All mesh
BycatchRate
ProratedEffort
BycatchEstimate
BycatchRate
ProratedEffort
BycatchEstimate
BycatchRate
ProratedEffort
BycatchEstimate
BycatchEstimate
1996 state 0.0698 179.07 12.50 0.1979 64.94 12.85 0.6885 0.53 0.36 25.71
federal 0.0066 1.63 0.01 0.0213 0.00 0.00 0.1632 7.13 1.16 1.17
TOTAL 12.51 12.85 1.53 26.89
1997 state 0.0698 236.43 16.50 0.1979 76.83 15.20 0.6885 1.58 1.09 32.79
federal 0.0066 31.02 0.20 0.0213 6.76 0.14 0.1632 0.00 0.00 0.35
TOTAL 16.70 15.35 1.09 33.14
1998 state 0.0698 178.29 12.44 0.1979 23.27 4.61 0.6885 0.35 0.24 17.29
federal 0.0066 1.33 0.01 0.0213 1.74 0.04 0.1632 0.00 0.00 0.05
TOTAL 12.45 4.64 0.24 17.33
1999 state 0.0698 169.11 11.80 0.1979 6.30 1.25 0.6885 0.02 0.01 13.06
federal 0.0066 25.94 0.17 0.0213 2.22 0.05 0.1632 0.00 0.00 0.22
TOTAL 11.97 1.29 0.01 13.28
2000 state 0.0698 207.68 14.49 0.1979 53.28 10.54 0.6885 0.66 0.45 25.49
federal 0.0066 12.51 0.08 0.0213 3.41 0.07 0.1632 0.00 0.00 0.15
TOTAL 14.58 10.62 0.45 25.65

56
Table 14E. Bycatch estimates of coastal bottlenose dolphins by seasonal management unit, year, water body, and mesh category. In addition, the bycatch rates (dead coastal bottlenose dolphins/ fish landings (mt)), and prorated effort (landed fish inmt) are included. These data are for only the coastal bottlenose dolphin habitat.
Summer (May-Oct) - Southern North Carolina Management Unit (Carteret, Onslow, Pender, New Hanover, Brunswick counties)
YearWater body incoastal habitat
Small mesh category (# 5 inches) Medium mesh category (> 5 to < 7 inches) Large mesh category ($7 inches) All mesh
BycatchRate
ProratedEffort
BycatchEstimate
BycatchRate
ProratedEffort
BycatchEstimate
BycatchRate
ProratedEffort
BycatchEstimate
BycatchEstimate
1996 state 0.0006 178.42 0.11 0.0020 0.69 0.00 0.0173 0.10 0.00 0.11
federal 0.0001 0.67 0.00 0.0002 0 0.00 0.0016 0 0.00 0.00
TOTAL 0.11 0.00 0.00 0.11
1997 state 0.0006 197.53 0.12 0.0020 0.42 0.00 0.0173 0.04 0.00 0.12
federal 0.0001 0.00 0.00 0.0002 0 0.00 0.0016 0 0.00 0.00
TOTAL 0.12 0.00 0.00 0.12
1998 state 0.0006 177.91 0.11 0.0020 0.06 0.00 0.0173 0.01 0.00 0.11
federal 0.0001 0.69 0.00 0.0002 0 0.00 0.0016 0 0.00 0.00
TOTAL 0.11 0.00 0.00 0.11
1999 state 0.0006 127.96 0.08 0.0020 0 0.00 0.0173 0 0.00 0.08
federal 0.0001 0.34 0.00 0.0002 0 0.00 0.0016 0 0.00 0.00
TOTAL 0.08 0.00 0.00 0.08
2000 state 0.0006 180.74 0.11 0.0020 0.01 0.00 0.0173 0 0.00 0.11
federal 0.0001 0.49 0.00 0.0002 0 0.00 0.0016 0 0.00 0.00
TOTAL 0.11 0.00 0.00 0.11
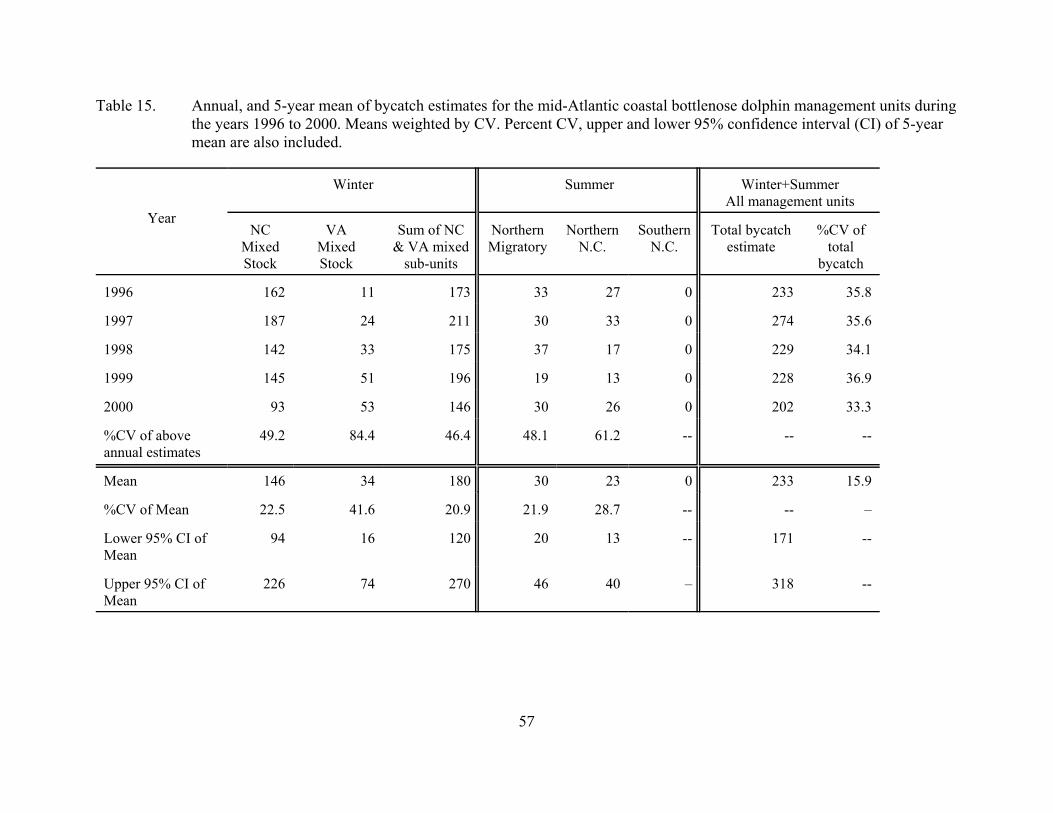
57
Table 15. Annual, and 5-year mean of bycatch estimates for the mid-Atlantic coastal bottlenose dolphin management units duringthe years 1996 to 2000. Means weighted by CV. Percent CV, upper and lower 95% confidence interval (CI) of 5-yearmean are also included.
Year
Winter Summer Winter+SummerAll management units
NCMixedStock
VA Mixed Stock
Sum of NC& VA mixed
sub-units
NorthernMigratory
NorthernN.C.
SouthernN.C.
Total bycatchestimate
%CV oftotal
bycatch
1996 162 11 173 33 27 0 233 35.8
1997 187 24 211 30 33 0 274 35.6
1998 142 33 175 37 17 0 229 34.1
1999 145 51 196 19 13 0 228 36.9
2000 93 53 146 30 26 0 202 33.3
%CV of aboveannual estimates
49.2 84.4 46.4 48.1 61.2 -- -- --
Mean 146 34 180 30 23 0 233 15.9
%CV of Mean 22.5 41.6 20.9 21.9 28.7 -- -- –
Lower 95% CI ofMean
94 16 120 20 13 -- 171 --
Upper 95% CI ofMean
226 74 270 46 40 – 318 --

Figure 1. The US mid-Atlantic stratified to spatial and temporal coastal bottlenose dolphin manage-ment units.
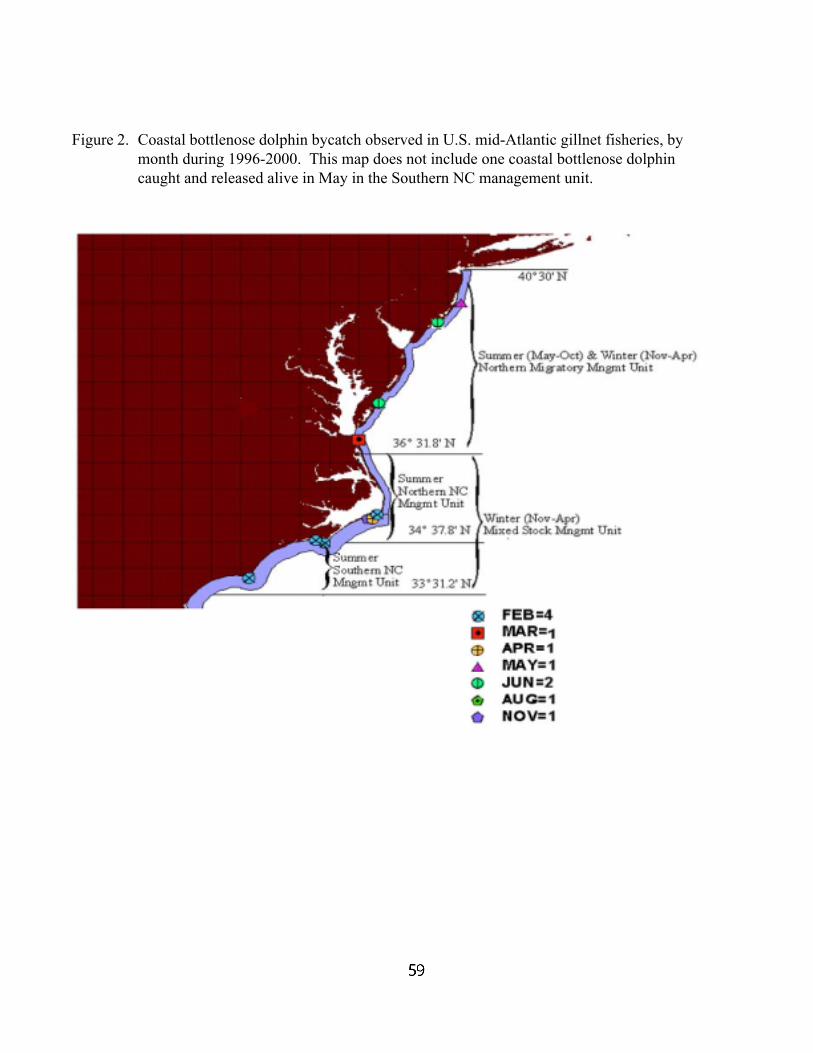
Figure 2. Coastal bottlenose dolphin bycatch observed in U.S. mid-Atlantic gillnet fisheries, bymonth during 1996-2000. This map does not include one coastal bottlenose dolphincaught and released alive in May in the Southern NC management unit.
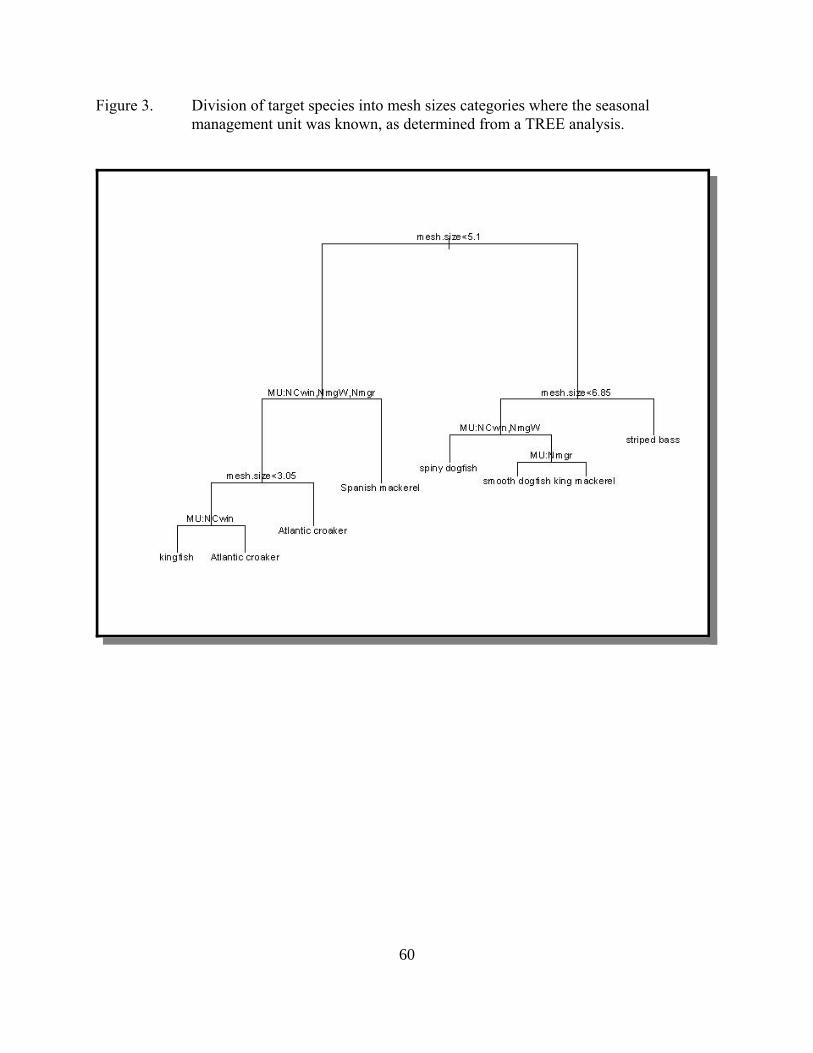
60
Figure 3. Division of target species into mesh sizes categories where the seasonalmanagement unit was known, as determined from a TREE analysis.

61
Figure 4. Plot of the predicted number of coastal bottlenose dolphin takes versus theobserved number of takes for each seasonal management unit. A. Mesh sizecategories for each observation. B. Water body for each observation.
A.
B.
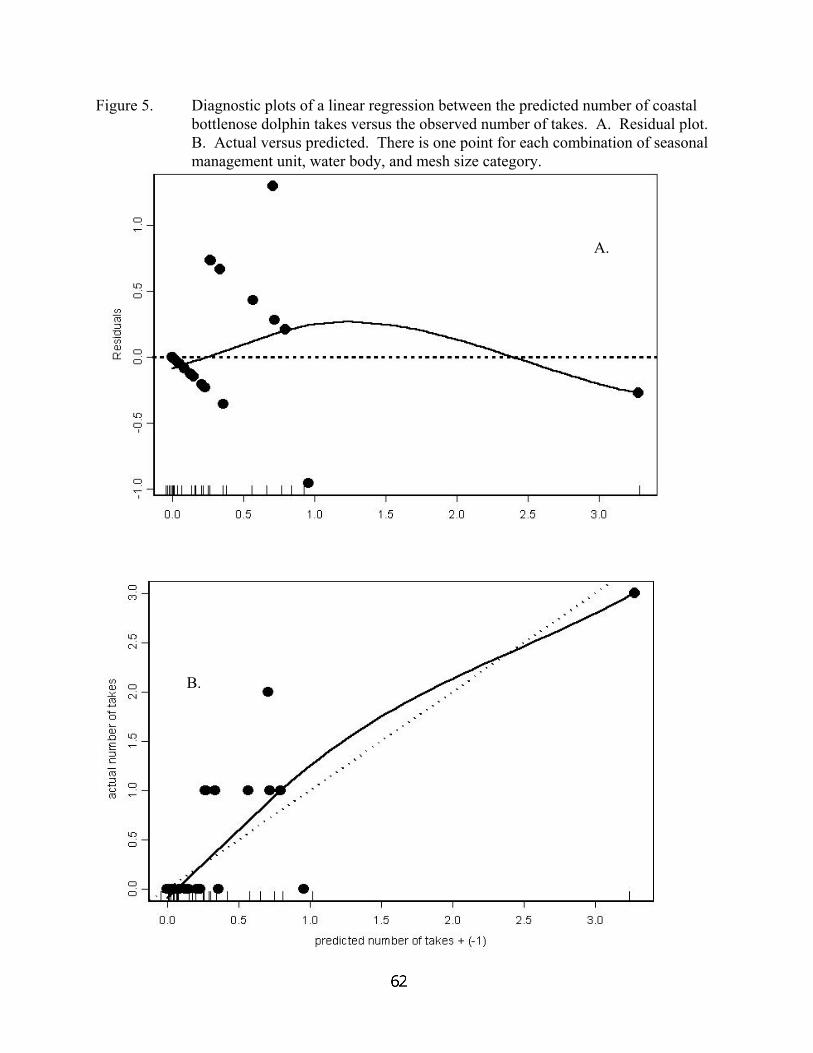
61
Figure 5. Diagnostic plots of a linear regression between the predicted number of coastalbottlenose dolphin takes versus the observed number of takes. A. Residual plot. B. Actual versus predicted. There is one point for each combination of seasonalmanagement unit, water body, and mesh size category.
A.
B.
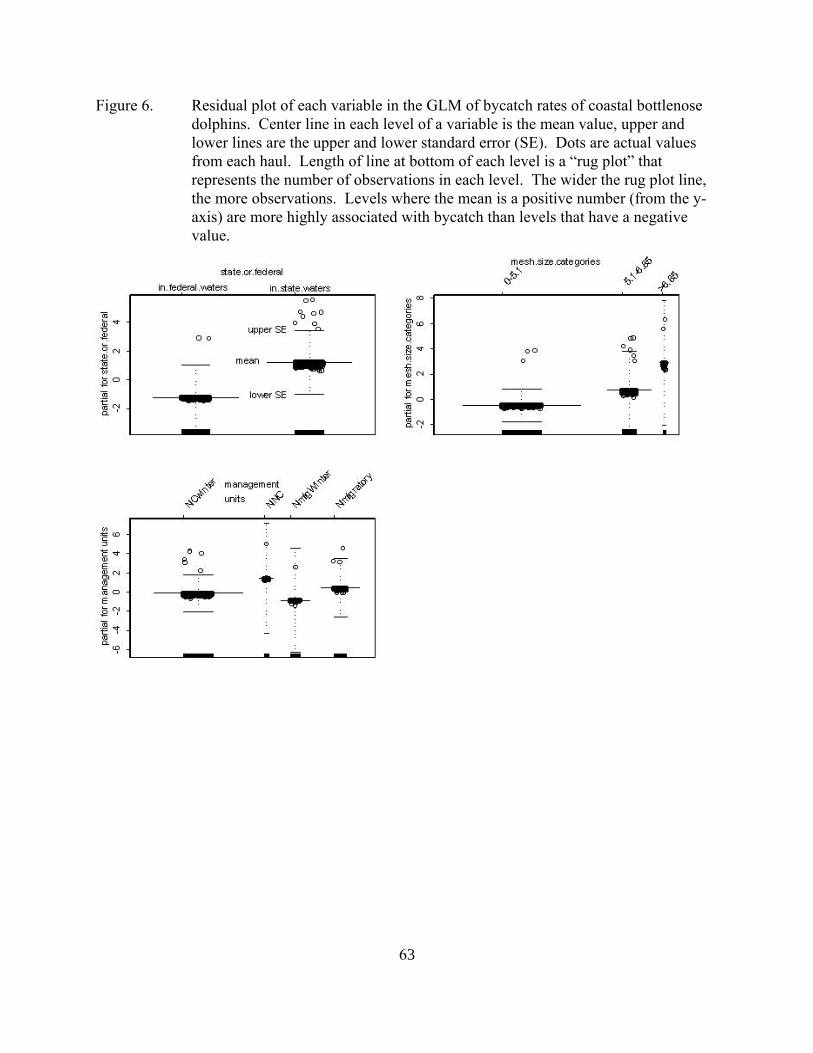
63
Figure 6. Residual plot of each variable in the GLM of bycatch rates of coastal bottlenosedolphins. Center line in each level of a variable is the mean value, upper andlower lines are the upper and lower standard error (SE). Dots are actual valuesfrom each haul. Length of line at bottom of each level is a “rug plot” thatrepresents the number of observations in each level. The wider the rug plot line,the more observations. Levels where the mean is a positive number (from the y-axis) are more highly associated with bycatch than levels that have a negativevalue.
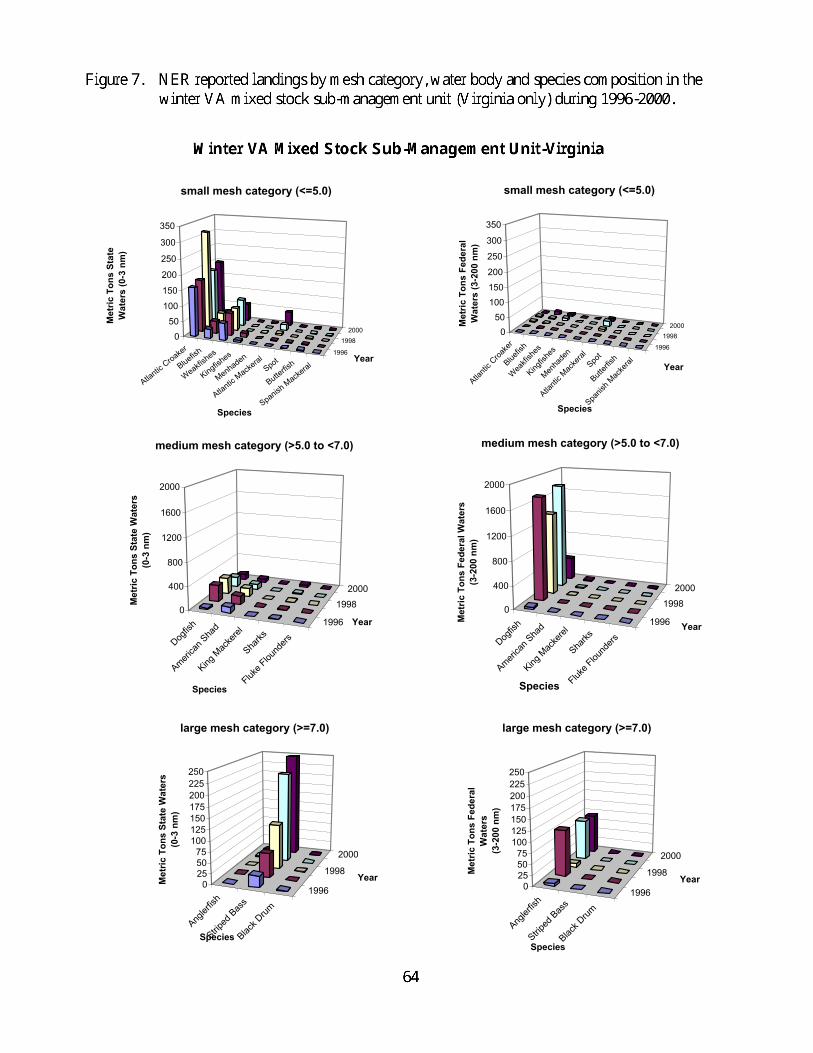
Atlantic Croaker
Bluefish
Weakfishes
Kingfishes
Menhaden
Atlantic Macke
ralSpot
Butterfis
h
Spanish M
ackeral
1996
19982000
050
100150
200
250
300
350
Met
ric T
ons
Stat
e W
ater
s (0
-3 n
m)
Species
Year
small mesh category (<=5.0)
Atlanti
c Croa
ker
Bluefis
h
Weakfi
shes
Kingfis
hes
Menha
den
Atlanti
c Mac
keral
Spot
Butterf
ish
Spanis
h Mac
keral
1996
19982000
050
100150200
250
300
350
Met
ric T
ons
Fede
ral
Wat
ers
(3-2
00 n
m)
Species
Year
small mesh category (<=5.0)
Dogfis
h
America
n Sha
d
King M
acke
rel
Sharks
Fluke F
lound
ers1996
19982000
0
400
800
1200
1600
2000
Met
ric T
ons
Stat
e W
ater
s(0
-3 n
m)
Species
Year
medium mesh category (>5.0 to <7.0)
Dogfis
h
America
n Sha
d
King M
acke
rel
Sharks
Fluke F
lound
ers
1996
19982000
0
400
800
1200
1600
2000
Met
ric T
ons
Fede
ral W
ater
s(3
-200
nm
)
Species
Year
medium mesh category (>5.0 to <7.0)
Angler
fish
Striped
Bass
Black D
rum
1996
1998
2000
0255075
100125150175200225250
Met
ric T
ons
Stat
e W
ater
s (0
-3 n
m)
Species
Year
large mesh category (>=7.0)
Angler
fish
Striped
Bass
Black D
rum
1996
1998
2000
0255075
100125150175200225250
Met
ric T
ons
Fede
ral
Wat
ers
(3-2
00 n
m)
Species
Year
large mesh category (>=7.0)
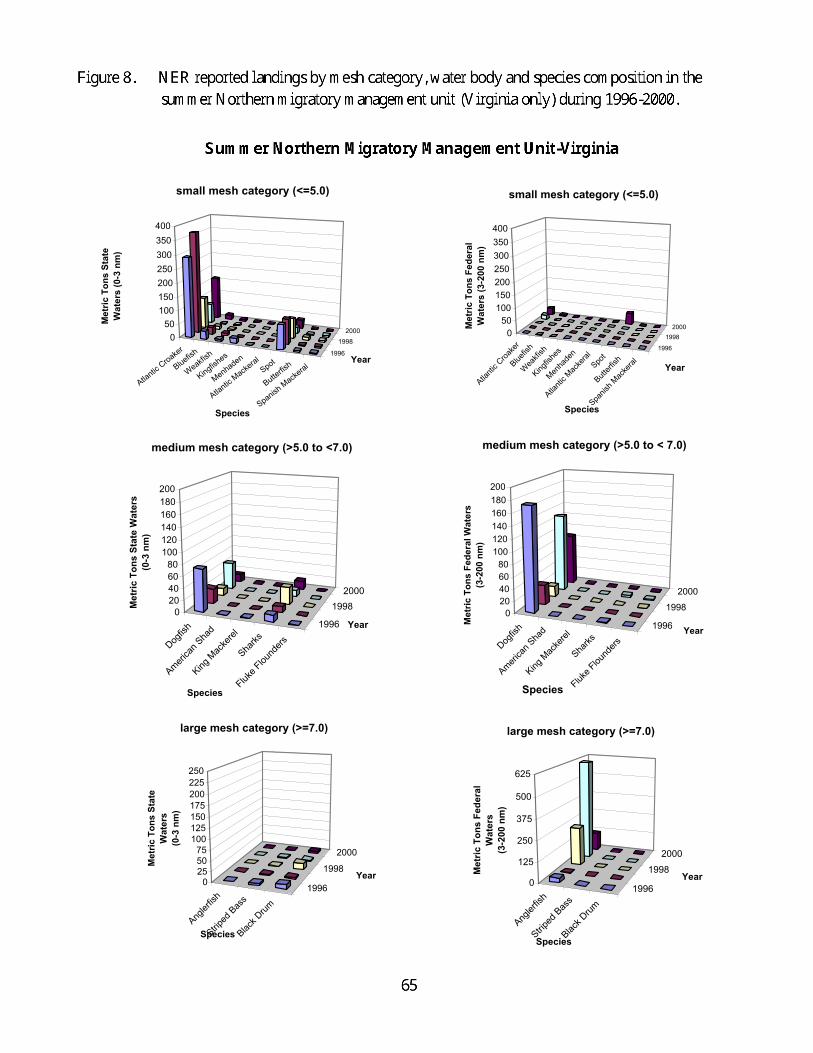
Atlantic Croaker
Bluefish
Weakfish
Kingfishes
Menhaden
Atlantic Macke
ralSpot
Butterfis
h
Spanish M
ackeral
1996
19982000
050
100150200250300350400
Met
ric T
ons
Stat
e W
ater
s (0
-3 n
m)
Species
Year
small mesh category (<=5.0)
Atlanti
c Croa
ker
Bluefis
h
Weakfi
sh
Kingfis
hes
Menha
den
Atlanti
c Mac
keral
Spot
Butterf
ish
Spanis
h Mac
keral
1996
19982000
050
100150200250300350400
Met
ric T
ons
Fede
ral
Wat
ers
(3-2
00 n
m)
Species
Year
small mesh category (<=5.0)
Dogfis
h
America
n Sha
d
King M
acke
rel
Sharks
Fluke F
lound
ers
1996
19982000
020406080
100120140160180200
Met
ric T
ons
Stat
e W
ater
s(0
-3 n
m)
Species
Year
medium mesh category (>5.0 to <7.0)
Dogfis
h
America
n Sha
d
King M
acke
rel
Sharks
Fluke F
lound
ers
1996
1998
2000
020406080
100120140160180200
Met
ric T
ons
Fede
ral W
ater
s(3
-200
nm
)
Species
Year
medium mesh category (>5.0 to < 7.0)
Angler
fish
Striped
Bass
Black D
rum
1996
1998
2000
0255075
100125150175200225250
Met
ric T
ons
Stat
e W
ater
s (0
-3 n
m)
Species
Year
large mesh category (>=7.0)
Angler
fish
Striped
Bass
Black D
rum
1996
19982000
0
125
250
375
500
625
Met
ric T
ons
Fede
ral
Wat
ers
(3-2
00 n
m)
Species
Year
large mesh category (>=7.0)
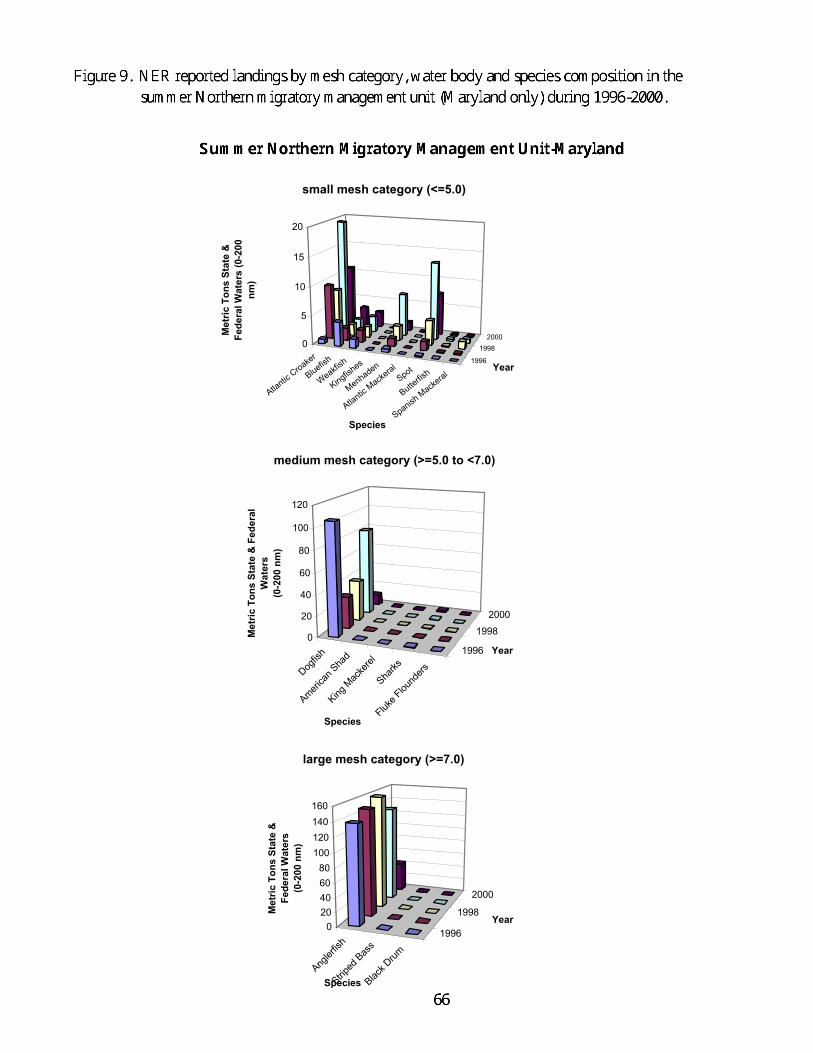
Atlantic Croaker
Bluefish
Weakfish
Kingfishes
Menhaden
Atlantic Macke
ralSpot
Butterfis
h
Spanish M
ackeral
1996
19982000
0
5
10
15
20M
etric
Ton
s St
ate
&
Fede
ral W
ater
s (0
-200
nm
)
Species
Year
small mesh category (<=5.0)
Dogfis
h
America
n Sha
d
King M
acke
rel
Sharks
Fluke F
lound
ers
1996
19982000
0
20
40
60
80
100
120
Met
ric T
ons
Stat
e &
Fed
eral
W
ater
s(0
-200
nm
)
Species
Year
medium mesh category (>=5.0 to <7.0)
Angler
fish
Striped
Bass
Black D
rum
1996
1998
2000
020406080
100120140160
Met
ric T
ons
Stat
e &
Fe
dera
l Wat
ers
(0-2
00 n
m)
Species
Year
large mesh category (>=7.0)
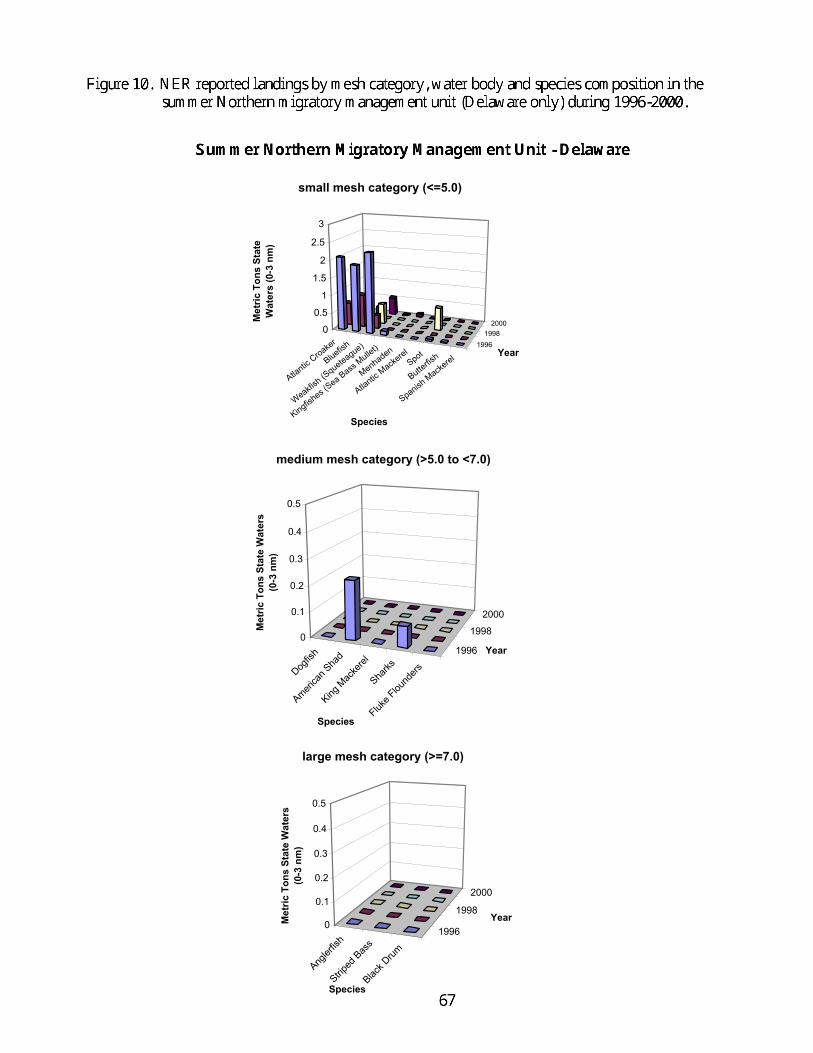
Atlantic Croaker
Bluefish
Weakfish (S
queteague)
Kingfishes (
Sea Bass Mullet)
Menhaden
Atlantic Macke
relSpot
Butterfis
h
Spanish M
ackerel
19961998
20000
0.5
1
1.5
2
2.5
3
Met
ric T
ons
Stat
e W
ater
s (0
-3 n
m)
Species
Year
small mesh category (<=5.0)
Dogfis
h
America
n Sha
d
King M
acke
rel
Sharks
Fluke F
lound
ers
1996
1998
2000
0
0.1
0.2
0.3
0.4
0.5
Met
ric T
ons
Stat
e W
ater
s(0
-3 n
m)
Species
Year
medium mesh category (>5.0 to <7.0)
Angler
fish
Striped
Bass
Black D
rum
1996
1998
2000
0
0.1
0.2
0.3
0.4
0.5
Met
ric T
ons
Stat
e W
ater
s (0
-3 n
m)
Species
Year
large mesh category (>=7.0)
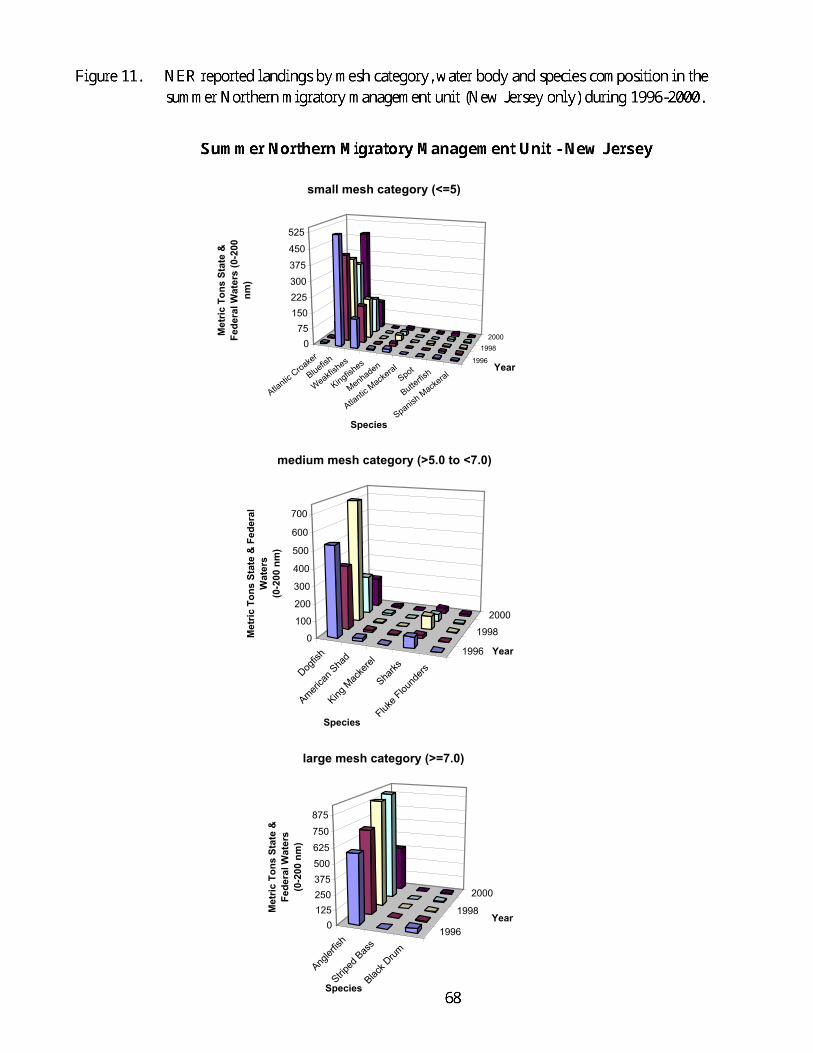
Atlantic Croaker
Bluefish
Weakfishes
Kingfishes
Menhaden
Atlantic Macke
ralSpot
Butterfis
h
Spanish M
ackeral
1996
19982000
075
150225300375450525
Met
ric T
ons
Stat
e &
Fe
dera
l Wat
ers
(0-2
00
nm)
Species
Year
small mesh category (<=5)
Dogfis
h
America
n Sha
d
King M
acke
rel
Sharks
Fluke F
lound
ers
1996
1998
2000
0
100
200
300
400
500
600
700
Met
ric T
ons
Stat
e &
Fed
eral
W
ater
s(0
-200
nm
)
Species
Year
medium mesh category (>5.0 to <7.0)
Angler
fish
Striped
Bass
Black D
rum
1996
1998
2000
0125250375500625750875
Met
ric T
ons
Stat
e &
Fe
dera
l Wat
ers
(0-2
00 n
m)
Species
Year
large mesh category (>=7.0)

Atlantic Croaker
Bluefish
Weakfishes
Kingfishes
Menhaden
Atlantic Macke
ralSpot
Butterfis
h
Spanish M
ackeral
1996
19982000
0
400
800
1200
1600
Met
ric T
ons
Stat
e W
ater
s (0
-3 n
m)
Species
Year
small mesh category (<=5.0)
Atlanti
c Croa
ker
Bluefis
h
Weakfi
shes
Kingfis
hes
Menha
den
Atlanti
c Mac
keral
Spot
Butterf
ish
Spanis
h Mac
keral
19961998
20000
400
800
1200
1600
Met
ric T
ons
Fede
ral
Wat
ers
(3-2
00 n
m)
Species
Year
small mesh category (<=5.0)
Dogfis
h
America
n Sha
d
King M
acke
rel
Sharks
Fluke
1996
19982000
0
500
1000
1500
2000
2500
3000
Met
ric T
ons
Stat
e W
ater
s(0
-3 n
m)
Species
Year
medium mesh category (>5.0 to <7.0)
Dogfis
h
America
n Sha
d
King M
acke
rel
Sharks
Fluke
1996
19982000
0
500
1000
1500
2000
2500
3000
Met
ric T
ons
Fede
ral
Wat
ers
(3-2
00 n
m)
Species
Year
medium mesh category (>5.0 to <7.0)
Angler
fish
Striped
Bass
Black D
rum
1996
1998
2000
0
50
100
150
200
250
300
Met
ric T
ons
Stat
e W
ater
s (0
-3 n
m)
Species
Year
large mesh category (>=7.0)
Angler
fish
Striped
Bass
Black D
rum
1996
1998
2000
0
50
100
150
200
250
300
Met
ric T
ons
Fede
ral
Wat
ers
(3-2
00 n
m)
Species
Year
large mesh category (>=7.0)
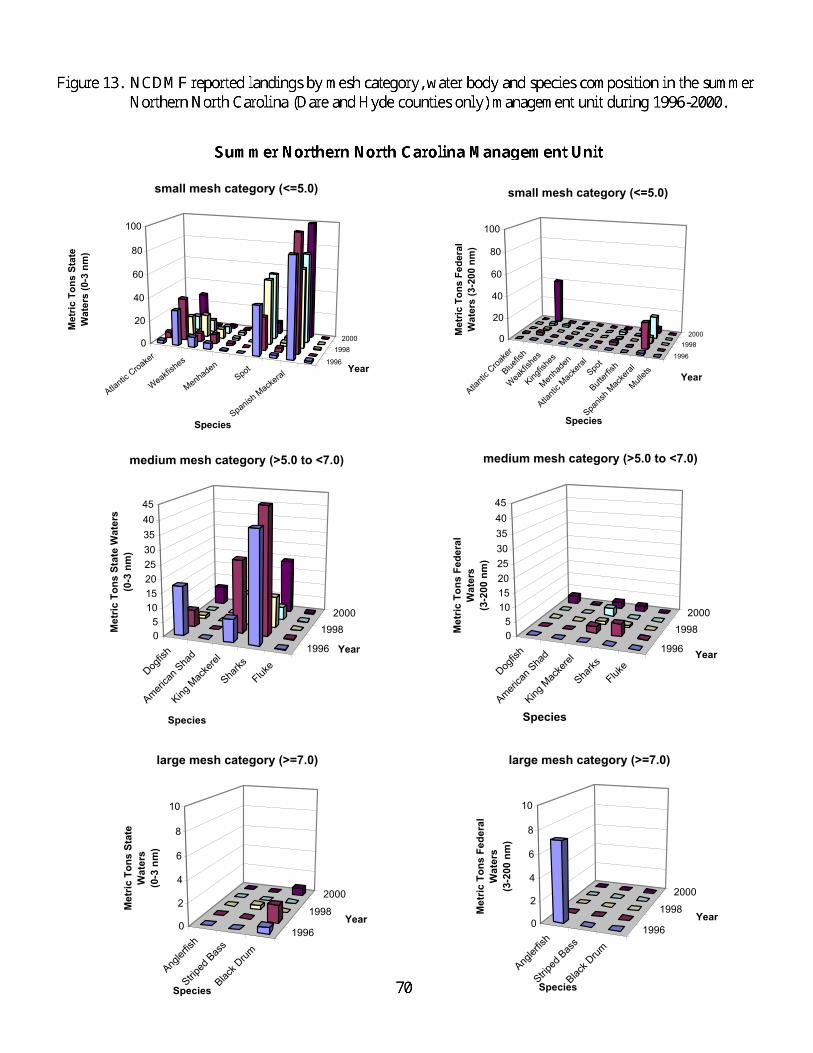
Atlantic Croaker
Weakfishes
MenhadenSpot
Spanish M
ackeral
1996
199820000
20
40
60
80
100
Met
ric T
ons
Stat
e W
ater
s (0
-3 n
m)
Species
Year
small mesh category (<=5.0)
Atlanti
c Croa
ker
Bluefis
h
Weakfi
shes
Kingfis
hes
Menha
den
Atlanti
c Mac
keral
Spot
Butterf
ish
Spanis
h Mac
keral
Mullets
1996
199820000
20
40
60
80
100
Met
ric T
ons
Fede
ral
Wat
ers
(3-2
00 n
m)
Species
Year
small mesh category (<=5.0)
Dogfis
h
America
n Sha
d
King M
acke
rel
Sharks
Fluke
1996
19982000
05
1015202530354045
Met
ric T
ons
Stat
e W
ater
s(0
-3 n
m)
Species
Year
medium mesh category (>5.0 to <7.0)
Dogfis
h
America
n Sha
d
King M
acke
rel
Sharks
Fluke
1996
19982000
05
1015202530354045
Met
ric T
ons
Fede
ral
Wat
ers
(3-2
00 n
m)
Species
Year
medium mesh category (>5.0 to <7.0)
Angler
fish
Striped
Bass
Black D
rum
1996
1998
2000
0
2
4
6
8
10
Met
ric T
ons
Stat
e W
ater
s (0
-3 n
m)
Species
Year
large mesh category (>=7.0)
Angler
fish
Striped
Bass
Black D
rum
1996
19982000
0
2
4
6
8
10
Met
ric T
ons
Fede
ral
Wat
ers
(3-2
00 n
m)
Species
Year
large mesh category (>=7.0)

Atlantic Croaker
Weakfishes
MenhadenSpot
Spanish M
ackeral
1996
199820000
20
40
60
80
100
120
Met
ric T
ons
Stat
e W
ater
s (0
-3 n
m)
Species
Year
small mesh category (<=5.0)
Atlanti
c Croa
ker
Bluefis
h
Weakfi
shes
Kingfis
hes
Menha
den
Atlanti
c Mac
keral
Spot
Butterf
ish
Spanis
h Mac
keral
Mullets
1996
199820000
20
40
60
80
100
120
Met
ric T
ons
Fede
ral
Wat
ers
(3-2
00 n
m)
Species
Year
small mesh category (<=5.0)
Dogfis
h
America
n Sha
d
King M
acke
rel
Sharks
Fluke
1996
19982000
00.050.1
0.150.2
0.250.3
0.350.4
0.450.5
Met
ric T
ons
Stat
e W
ater
s(0
-3 n
m)
Species
Year
medium mesh category (>5.0 to <7.0)
Dogfis
h
America
n Sha
d
King M
acke
rel
Sharks
Fluke
1996
1998
2000
00.050.1
0.150.2
0.250.3
0.350.4
0.450.5
Met
ric T
ons
Fede
ral W
ater
s(3
-200
nm
)
Species
Year
medium mesh category (>5.0 to <7.0)
Angler
fish
Striped
Bass
Black D
rum
1996
1998
2000
00.10.20.30.40.50.60.70.80.9
1
Met
ric T
ons
Stat
e W
ater
s (0
-3 n
m)
Species
Year
large mesh category (>=7.0)
Angler
fish
Striped
Bass
Black D
rum
1996
19982000
00.10.20.30.40.50.60.70.80.9
1
Met
ric T
ons
Fede
ral
Wat
ers
(3-2
00 n
m)
Species
Year
large mesh category (>=7.0)
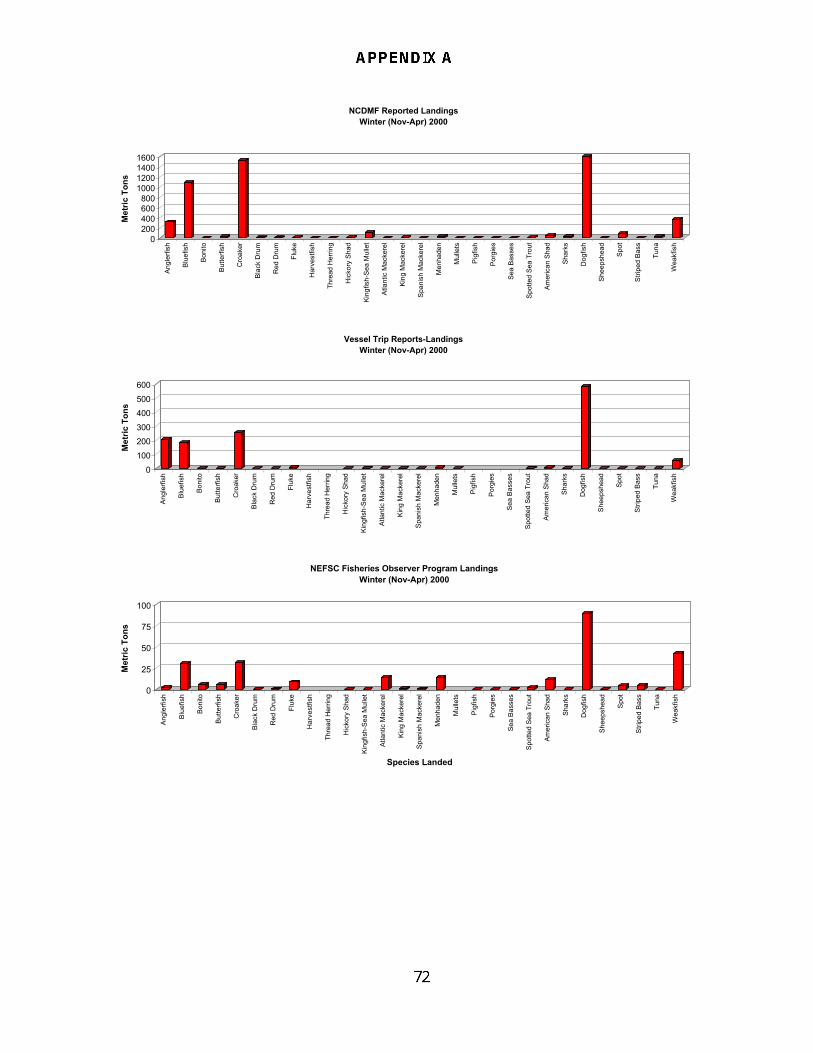
0200400600800
1000120014001600
Met
ric T
ons
Angl
erfis
h
Blue
fish
Boni
to
Butte
rfish
Cro
aker
Blac
k D
rum
Red
Dru
m
Fluk
e
Har
vest
fish
Thre
ad H
errin
g
Hic
kory
Sha
d
King
fish-
Sea
Mul
let
Atla
ntic
Mac
kere
l
King
Mac
kere
l
Span
ish
Mac
kere
l
Men
hade
n
Mul
lets
Pigf
ish
Porg
ies
Sea
Bass
es
Spot
ted
Sea
Trou
t
Amer
ican
Sha
d
Shar
ks
Dog
fish
Shee
pshe
ad
Spot
Strip
ed B
ass
Tuna
Wea
kfis
h
NCDMF Reported LandingsWinter (Nov-Apr) 2000
0100200300400500600
Met
ric T
ons
Angl
erfis
h
Blue
fish
Boni
to
Butte
rfish
Cro
aker
Blac
k D
rum
Red
Dru
m
Fluk
e
Har
vest
fish
Thre
ad H
errin
g
Hic
kory
Sha
d
King
fish-
Sea
Mul
let
Atla
ntic
Mac
kere
l
King
Mac
kere
l
Span
ish
Mac
kere
l
Men
hade
n
Mul
lets
Pigf
ish
Porg
ies
Sea
Bass
es
Spot
ted
Sea
Trou
t
Amer
ican
Sha
d
Shar
ks
Dog
fish
Shee
pshe
ad
Spot
Strip
ed B
ass
Tuna
Wea
kfis
h
Vessel Trip Reports-LandingsWinter (Nov-Apr) 2000
0
25
50
75
100
Met
ric T
ons
Angl
erfis
h
Blue
fish
Boni
to
Butte
rfish
Cro
aker
Blac
k D
rum
Red
Dru
m
Fluk
e
Har
vest
fish
Thre
ad H
errin
g
Hic
kory
Sha
d
King
fish-
Sea
Mul
let
Atla
ntic
Mac
kere
l
King
Mac
kere
l
Span
ish
Mac
kere
l
Men
hade
n
Mul
lets
Pigf
ish
Porg
ies
Sea
Bass
es
Spot
ted
Sea
Trou
t
Amer
ican
Sha
d
Shar
ks
Dog
fish
Shee
pshe
ad
Spot
Strip
ed B
ass
Tuna
Wea
kfis
h
Species Landed
NEFSC Fisheries Observer Program LandingsWinter (Nov-Apr) 2000

73
Appendix B
Table 1A. Data from the NEFSC fishery sampling observer database including number of trips and hauls, amount of fish landed (in metrictons), and number of observed bottlenose dolphins from hauls by mesh sizes (small, medium, and large), water bodies (statecoastal and federal coastal), year (November 1995 to October 1996 = 1996, etc.), and seasonal management units. Note, trips maynot be unique within a year because it is possible that a trip consisted of hauls that used nets with mesh sizes from more than onemesh size category. Also note, summation of hauls within a year-water body may not equal the corresponding sum of hauls inTable 4 because there were some hauls that did not record a mesh size and so were included in Table 4, but not in this Appendix.
AWinter-VA Mixed Stock Sub-Management Unit (Virginia only)
Small mesh (# 5 inches) Medium mesh (>5 to <7 inches) Large mesh ($7 inches)
WaterBody Year Trips Hauls
MetricTons Takes Trips Hauls
MetricTons Takes Trips Hauls
MetricTons Takes
State CoastalHabitat
1996 8 15 4.65 0 1 5 3.81 0 1 1 0.15 0
1997 8 19 8.40 0 4 9 1.82 0 3 6 0.44 0
1998 9 21 5.66 0 3 4 2.22 0 4 6 0.31 0
1999 18 58 15.18 0 8 9 3.39 0 10 22 1.69 1
2000 31 126 11.02 0 5 6 3.59 0 14 35 2.22 0
FederalCoastalHabitat
1996 8 23 3.63 0 4 19 10.24 0 1 1 0.30 0
1997 10 65 6.96 0 11 27 12.31 0 3 4 0.29 0
1998 7 22 5.07 0 9 23 19.94 0 11 28 6.09 0
1999 26 89 12.68 0 15 27 20.27 0 16 48 6.19 0
2000 19 53 6.90 0 7 14 5.67 0 18 66 8.61 0
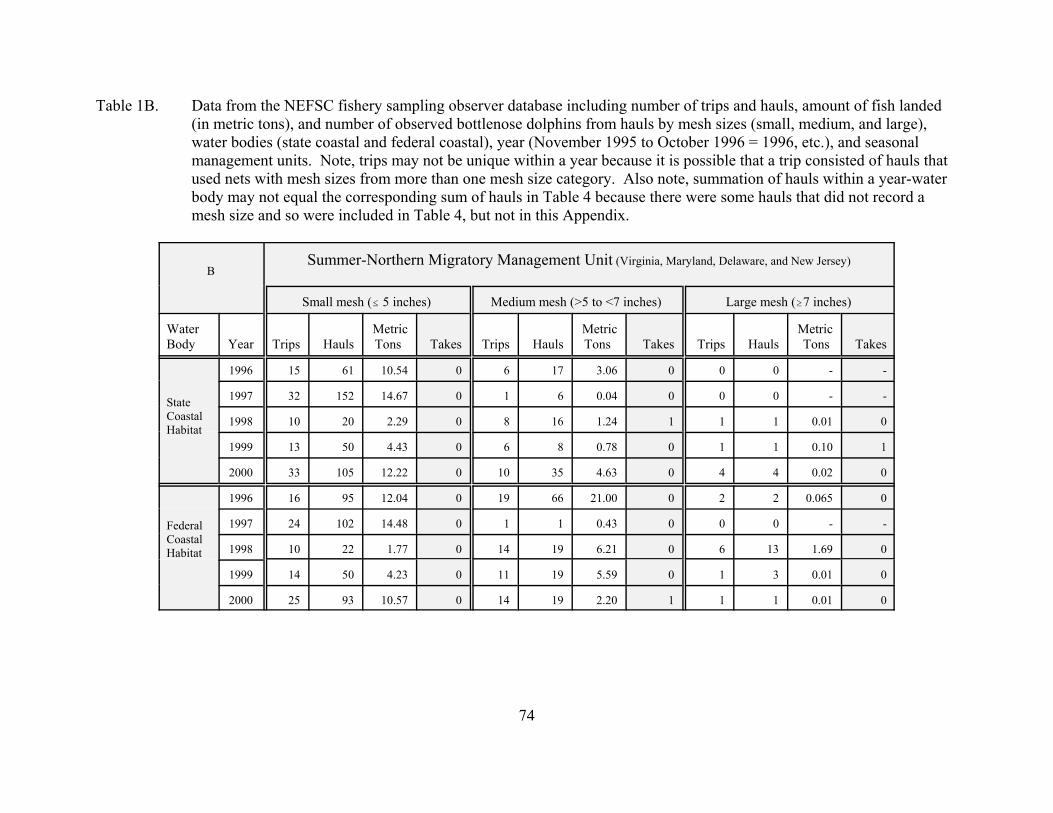
74
Table 1B. Data from the NEFSC fishery sampling observer database including number of trips and hauls, amount of fish landed(in metric tons), and number of observed bottlenose dolphins from hauls by mesh sizes (small, medium, and large),water bodies (state coastal and federal coastal), year (November 1995 to October 1996 = 1996, etc.), and seasonalmanagement units. Note, trips may not be unique within a year because it is possible that a trip consisted of hauls thatused nets with mesh sizes from more than one mesh size category. Also note, summation of hauls within a year-waterbody may not equal the corresponding sum of hauls in Table 4 because there were some hauls that did not record amesh size and so were included in Table 4, but not in this Appendix.
BSummer-Northern Migratory Management Unit (Virginia, Maryland, Delaware, and New Jersey)
Small mesh (# 5 inches) Medium mesh (>5 to <7 inches) Large mesh ($7 inches)
WaterBody Year Trips Hauls
MetricTons Takes Trips Hauls
MetricTons Takes Trips Hauls
MetricTons Takes
State CoastalHabitat
1996 15 61 10.54 0 6 17 3.06 0 0 0 - -
1997 32 152 14.67 0 1 6 0.04 0 0 0 - -
1998 10 20 2.29 0 8 16 1.24 1 1 1 0.01 0
1999 13 50 4.43 0 6 8 0.78 0 1 1 0.10 1
2000 33 105 12.22 0 10 35 4.63 0 4 4 0.02 0
FederalCoastalHabitat
1996 16 95 12.04 0 19 66 21.00 0 2 2 0.065 0
1997 24 102 14.48 0 1 1 0.43 0 0 0 - -
1998 10 22 1.77 0 14 19 6.21 0 6 13 1.69 0
1999 14 50 4.23 0 11 19 5.59 0 1 3 0.01 0
2000 25 93 10.57 0 14 19 2.20 1 1 1 0.01 0
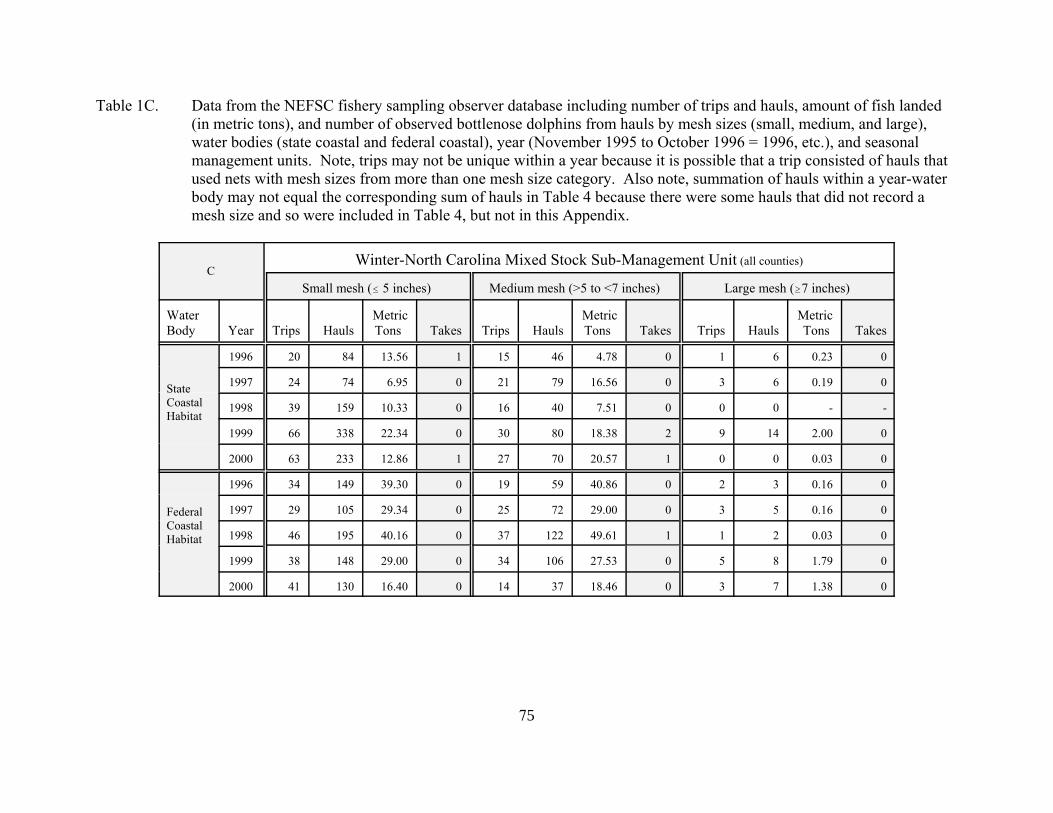
75
Table 1C. Data from the NEFSC fishery sampling observer database including number of trips and hauls, amount of fish landed(in metric tons), and number of observed bottlenose dolphins from hauls by mesh sizes (small, medium, and large),water bodies (state coastal and federal coastal), year (November 1995 to October 1996 = 1996, etc.), and seasonalmanagement units. Note, trips may not be unique within a year because it is possible that a trip consisted of hauls thatused nets with mesh sizes from more than one mesh size category. Also note, summation of hauls within a year-waterbody may not equal the corresponding sum of hauls in Table 4 because there were some hauls that did not record amesh size and so were included in Table 4, but not in this Appendix.
CWinter-North Carolina Mixed Stock Sub-Management Unit (all counties)
Small mesh (# 5 inches) Medium mesh (>5 to <7 inches) Large mesh ($7 inches)
WaterBody Year Trips Hauls
MetricTons Takes Trips Hauls
MetricTons Takes Trips Hauls
MetricTons Takes
State CoastalHabitat
1996 20 84 13.56 1 15 46 4.78 0 1 6 0.23 0
1997 24 74 6.95 0 21 79 16.56 0 3 6 0.19 0
1998 39 159 10.33 0 16 40 7.51 0 0 0 - -
1999 66 338 22.34 0 30 80 18.38 2 9 14 2.00 0
2000 63 233 12.86 1 27 70 20.57 1 0 0 0.03 0
FederalCoastalHabitat
1996 34 149 39.30 0 19 59 40.86 0 2 3 0.16 0
1997 29 105 29.34 0 25 72 29.00 0 3 5 0.16 0
1998 46 195 40.16 0 37 122 49.61 1 1 2 0.03 0
1999 38 148 29.00 0 34 106 27.53 0 5 8 1.79 0
2000 41 130 16.40 0 14 37 18.46 0 3 7 1.38 0

76
Table 1D. Data from the NEFSC fishery sampling observer database including number of trips and hauls, amount of fish landed(in metric tons), and number of observed bottlenose dolphins from hauls by mesh sizes (small, medium, and large),water bodies (state coastal and federal coastal), year (November 1995 to October 1996 = 1996, etc.), and seasonalmanagement units. Note, trips may not be unique within a year because it is possible that a trip consisted of hauls thatused nets with mesh sizes from more than one mesh size category. Also note, summation of hauls within a year-waterbody may not equal the corresponding sum of hauls in Table 4 because there were some hauls that did not record amesh size and so were included in Table 4, but not in this Appendix.
DSummer-Northern North Carolina Management Unit
(Dare and Hyde Counties)
Small mesh (# 5 inches) Medium mesh (>5 to <7 inches) Large mesh ($7 inches)
WaterBody Year Trips Hauls
MetricTons Takes Trips Hauls
MetricTons Takes Trips Hauls
MetricTons Takes
State CoastalHabitat
1996 13 102 2.36 1 5 41 0.31 0 0 0 - -
1997 0 0 - - 0 0 - - 0 0 - -
1998 12 60 0.31 0 3 16 0.19 0 0 0 - -
1999 7 23 1.22 0 2 3 0.06 0 0 0 - -
2000 20 117 6.06 0 4 20 0.55 0 0 0 - -
FederalCoastalHabitat
1996 0 0 - - 3 3 0.01 0 0 0 - -
1997 0 0 - - 0 0 - - 0 0 - -
1998 5 16 0.32 0 4 12 0.16 0 0 0 - -
1999 1 1 1.51 0 2 2 0.09 0 0 0 - -
2000 8 16 0.63 0 2 9 0.66 0 2 2 0.01 0

77
Table 1E. Data from the NEFSC fishery sampling observer database including number of trips and hauls, amount of fish landed(in metric tons), and number of observed bottlenose dolphins from hauls by mesh sizes (small, medium, and large),water bodies (state coastal and federal coastal), year (November 1995 to October 1996 = 1996, etc.), and seasonalmanagement units. Note, trips may not be unique within a year because it is possible that a trip consisted of hauls thatused nets with mesh sizes from more than one mesh size category. Also note, summation of hauls within a year-waterbody may not equal the corresponding sum of hauls in Table 4 because there were some hauls that did not record amesh size and so were included in Table 4, but not in this Appendix.
ESummer-Southern North Carolina Management Unit(Carteret, Onslow, Pender, New Hanover, and Brunswick Counties)
Small mesh (# 5 inches) Medium mesh (>5 to <7 inches) Large mesh ($7 inches)
WaterBody Year Trips Hauls
MetricTons Takes Trips Hauls
MetricTons Takes Trips Hauls
MetricTons Takes
State CoastalHabitat
1996 0 0 - - 0 0 - - 0 0 - -
1997 0 0 - - 0 0 - - 0 0 - -
1998 14 44 1.71 0 0 0 - - 0 0 - -
1999 12 32 3.45 1* 1 1 0.01 0 0 0 - -
2000 18 37 4.35 0 3 14 0.03 0 0 0 - -
FederalCoastalHabitat
1996 0 0 - - 0 0 - - 0 0 - -
1997 0 0 - - 0 0 - - 0 0 - -
1998 6 15 0.69 0 0 0 - - 0 0 - -
1999 7 13 0.01 0 0 0 - - 0 0 - -
2000 17 38 0.49 0 0 0 - - 0 0 - - * coastal bottlenose dolphin was observed taken and released alive and uninjured.


Research Communications UnitNortheast Fisheries Science Center
National Marine Fisheries Service, NOAA166 Water St.
Woods Hole, MA 02543-1026
NOAA Technical Memorandum NMFS-NE -- This series is issued irregularly. The series typically includes: data reports of long-term or largearea studies; synthesis reports for major resources or habitats; annual reports of assessment or monitoring programs; documentary reports ofoceanographic conditions or phenomena; manuals describing field and lab techniques; literature surveys of major resource or habitat topics; findingsof task forces or working groups; summary reports of scientific or technical workshops; and indexed and/or annotated bibliographies. All issuesreceive internal scientific review and most issues receive technical and copy editing.
Northeast Fisheries Science Center Reference Document -- This series is issued irregularly. The series typically includes: data reports on fieldand lab observations or experiments; progress reports on continuing experiments, monitoring, and assessments; background papers for scientificor technical workshops; and simple bibliographies. Issues receive internal scientific review, but no technical or copy editing.
The mission of NOAA's National Marine Fisheries Service (NMFS) is "stewardship of living marine resources for the benefit of the nationthrough their science-based conservation and management and promotion of the health of their environment." As the research arm of the NMFS'sNortheast Region, the Northeast Fisheries Science Center (NEFSC) supports the NMFS mission by "planning, developing, and managingmultidisciplinary programs of basic and applied research to: 1) better understand the living marine resources (including marine mammals) ofthe Northwest Atlantic, and the environmental quality essential for their existence and continued productivity; and 2) describe and provide tomanagement, industry, and the public, options for the utilization and conservation of living marine resources and maintenance of environmentalquality which are consistent with national and regional goals and needs, and with international commitments." Results of NEFSC research arelargely reported in primary scientific media (e.g., anonymously-peer-reviewed scientific journals). However, to assist itself in providing data,information, and advice to its constituents, the NEFSC occasionally releases its results in its own media. Those media are in four categories:
Publications and Reportsof the
Northeast Fisheries Science Center
OBTAINING A COPY: To obtain a copy of a NOAA Technical Memorandum NMFS-NE or a Northeast Fisheries Science CenterReference Document, or to subscribe to the Fishermen's Report or the The Shark Tagger, either contact the NEFSC Editorial Office(166 Water St., Woods Hole, MA 02543-1026; 508-495-2228) or consult the NEFSC webpage on "Reports and Publications" (http://www.nefsc.nmfs.gov/nefsc/publications/).
ANY USE OF TRADE OR BRAND NAMES IN ANY NEFSC PUBLICATION OR REPORT DOES NOT IMPLYENDORSEMENT.
STANDARD MAIL A
The Shark Tagger -- This newsletter is an annual summary of tagging and recapture data on large pelagic sharks as derived from the NMFS'sCooperative Shark Tagging Program; it also presents information on the biology (movement, growth, reproduction, etc.) of these sharks assubsequently derived from the tagging and recapture data. There is internal scientific review, but no technical or copy editing, of this newsletter.
Fishermen's Report -- This information report is a quick-turnaround report on the distribution and relative abundance of commercial fisheriesresources as derived from each of the NEFSC's periodic research vessel surveys of the Northeast's continental shelf. There is no scientific review,nor any technical or copy editing, of this report.