bureau of energy efficiency (bee) -...
TRANSCRIPT

MANUAL ON ENERGY CONSERVATION MEASURES
IN
CERAMIC CLUSTER
MORBI
Bureau of Energy Efficiency (BEE) Ministry of Power, Government of India
Prepared By
SEE - Tech Solutions Pvt. Ltd.

Manual on Energy Conservation Measures in Ceramic Industry
1 of 96
MANUAL ON
ENERGY CONSERVATION
MEASURES
IN CERAMIC INDUSTRY
Based on findings of BEE’s SME Program for
Morbi Ceramic Cluster
Sponsored by
Bureau of Energy Efficiency (BEE),
Ministry of Power, Government of India, New Delhi
www.bee.nic.in
Executing Agency
SEE – Tech Solutions Pvt. Ltd
11/5, MIDC, Infotech Park, Near VRCE Telephone Exchange,
South Ambazari Road, Nagpur – 440022
Website: www.letsconserve.org
April, 2010

Manual on Energy Conservation Measures in Ceramic Industry
2 of 96
BEE
The mission of Bureau of Energy Efficiency (BEE) is to develop policy and strategies
with a thrust on self-regulation and market principles, within the overall framework of the
Energy Conservation Act (EC Act), 2001 with the primary objective of reducing energy
intensity of the Indian economy. This will be achieved with active participation of all
stakeholders, resulting in accelerated and sustained adoption of energy efficiency in all
sectors. The setting up of Bureau of Energy Efficiency (BEE) provides a legal framework
for energy efficiency initiatives in the country.
Bureau of Energy Efficiency (BEE) is implementing a program (BEE’s SME Program) to
improve the energy performance in 25 selected SME clusters. The objective of the
program is to accelerate the adoption of EE technologies and practices in the chosen SME
clusters through knowledge sharing, capacity building and development of innovative
financing mechanisms. Further information is available at www.bee-india.nic.in
SEE-Tech Solutions Pvt. Ltd.
SEE-Tech Solutions is a consulting & performance contracting firm for energy cost
minimization. Its mission statement is “Conserve our essential companion – Energy &
Environment”, serving since 1993, it has completed more than 500 energy conservation
assignments. It has contributed uniquely to the field by developing and implementing
knowledge based software solutions: See-UtiSave & See-ThermiSave, which are being
used by many Energy Auditors & Energy Managers. SEE-Tech Solutions is currently
developing REEC (Regional Energy Efficiency Centre) with assistance from USAID in
its ECO-III project, where in 150 energy conservation measures will be demonstrated for
hands on capacity building in Energy Efficiency & Renewable Energy in industries &
buildings. In this REEC, requirements of SMEs are duly addressed. Further information is
available at www.letsconserve.org
SEE-Tech Solutions is Executing Agency for BEE’s SME project in Morbi Ceramic
Cluster.
DISCLAIMER
This manual has been developed by SEE-Tech Solutions for BEE on the terms of
engagement as Executing Agency. Contents in this report are based on observations made
during the field studies at Morbi, data and information provided by the units and based on
information generally available to the public from sources believed to be reliable. No
representation is made that it is timely accurate or complete. SEE-Tech Solutions has
taken due care in compilation of data and information, however SEE-Tech Solutions does
not guarantee the accuracy adequacy or completeness of any information and it is not
responsible for errors or omissions or for the results obtained from the use of such
information and specially states that it has no financial liability to what so ever to the
users of this manual. This manual is published with the understanding that SEE-Tech
Solutions is supplying information but is not attempting to render detail engineering
services, if such services are required the assistance of an appropriate professional
organization (Technology suppliers & LSPs) should be sought.

Manual on Energy Conservation Measures in Ceramic Industry
3 of 96
Foreword & Acknowledgement
SMEs have played a very significant role in Indian Economy, be it % of GDP, export or
employment. However on technology and production cost front there is substantial
potential for improvement through energy cost reduction and corresponding GHG
emission reduction.
In BEE’s SME Program 25 SME clusters have been identified for implementation of the
program. Morbi Ceramic Cluster is one of them. There are more than 450 units and 50
more are coming up. Ceramic manufacturing is highly energy intensive, about 25% to
30% of the production cost is energy cost. It was interesting to find that Morbi SME
cluster consumes 40 to 45 x 109 MJ of total energy, which is one of the highest in various
SME cluster in India. Total energy consumption in Morbi ceramic cluster is about 1% of
India’s energy consumption. Such high energy consumption is also attributed to the fact
that more than 70% of tile manufacturing in India is from Morbi.
Under this program total 75 Energy Audits are carried out in various ceramic units in
Morbi which include Vitrified Tiles, Wall Tiles, Floor Tiles, Sanitary wares & others.
The study has focused on identifying technology gaps and techno-economically feasible
projects to reduce energy cost as well as corresponding GHG emissions. The study has
also identified application of renewable energy in Ceramic manufacturing. For
implementing the technologies, appropriate vendors/suppliers have been identified and
pursued to serve Morbi Cluster. Local Service Providers (LSPs) have also been identified
and developed.
This manual serves as a reference document for the units in Morbi cluster covering brief
information on BEE’s SME Program, Cluster level scenario at Morbi, Summery of
Energy Audit findings and Technology assessment, Environmental benefits from
identified technologies, Details of energy saving technologies, their saving potential, List
of Technology providers, List of LSPs and several other related information so that the
SME units can use this manual to understand process wise energy cost in ceramic
manufacturing, compare their energy consumption with the benchmark and identify
suitable technologies and their suppliers to reduce their energy consumption and thereby
energy cost.
The next steps in the project involve developing DPRs (Detail Project Reports) for the
identified technologies which will be used by the units for availing finance. SIDBI
already has scheme for financing Energy Efficiency projects in SMEs. These DPRs will
increase number of projects financed by banks. CDM PINs are also being developed to
facilitate CDM projects arising from these identified technologies.
We urge SME units in Morbi Cluster to take advantage of this project, refer to the
manual, interact with LSPs, Technology suppliers and forth coming DPRs in detail and
implement the projects to reduce the energy cost.
We thank industrial associations at Morbi, Ceramic units, LSPs, Technology suppliers,
local banks and all those who took keen interest in the project and development of this
manual. We also thank BEE and TERI for their timely advice and support in executing
the project.
Milind Chittawar, CEO & MD
SEE-Tech Solutions Pvt. Ltd

Manual on Energy Conservation Measures in Ceramic Industry
4 of 96
Table of Contents
1.0 ABOUT BEE’S SME PROGRAM.......................................................................8
1.1 Project Objectives ....................................................................................................8
1.2 Expected Project Outcome.......................................................................................8
1.3 Project Duration.......................................................................................................8
1.4 Identified Clusters under the Program .....................................................................9
2.0 CLUSTER SCENARIO ......................................................................................10
2.1 Overview of SME Cluster......................................................................................10
2.1.1 Cluster Background ...................................................................................10
2.1.2 Products Manufactured ..............................................................................10
2.1.3 Classification of Units................................................................................10
2.1.4 Production Capacity (In Tonnes or Pieces per Year) Detail.......................11
2.1.5 Raw Materials Used...................................................................................11
2.2 Energy Situation in the cluster...............................................................................12
2.2.1 Types of Fuels Used and Prices .................................................................12
2.2.2 Fuels and Electricity Consumption in a Typical Unit ................................12
2.2.3 Specific Energy Consumption (In Appropriate Unit) ................................13
2.3 Manufacturing process/technology overview in a typical unit ..............................13
2.3.1 Process Technology....................................................................................13
2.3.2 Process Flow Diagram ...............................................................................16
2.4 Current Policies and Initiatives of Local Bodies ...................................................18
2.5 Issues Related To Energy Usage and Conservation and Barrier in Technology Up-
Gradation................................................................................................................19
2.5.1 Energy Availability ....................................................................................19
2.5.2 Technological Issues ..................................................................................19
2.5.3 Financial Issues..........................................................................................20
2.5.4 Manpower Related Issues ..........................................................................20
2.5.5 Technology & Service Providers Related issues .......................................20
3.0 ENERGY AUDIT AND TECHNOLOGY ASSESSMENT .............................21
3.1 Methodology Adopted For.....................................................................................21
3.1.1 Energy Use and Technical Study ...............................................................21
3.1.1.1 Pre-Energy Audit Activities ......................................................................21
3.1.1.2 Preliminary Energy Study..........................................................................21
3.1.1.3 Detailed Energy Study...............................................................................22
3.2 Observations Made During the Energy Use and Technology Studies Carried Out
In the Cluster..........................................................................................................22
3.2.1 Manufacturing Process and Technology/Equipments Employed ..............22
3.2.2 Energy Consumption Profile & Availability..............................................23
3.2.3 Capacity Utilization Factor ........................................................................23
Manual on Energy Conservation Measures in Ceramic Industry
5 of 96
3.2.4 Housekeeping Practices .............................................................................24
3.2.5 Availability of Data and Information.........................................................24
3.2.6 Any Other Relevant Aspect .......................................................................24
3.3 Technology Gap Analysis and Implementation of Small Group Activities ..........24
3.3.1 Technology Gap Analysis and Process Up-Gradation ...............................25
3.3.2 Implementation of Small Group Activities ................................................48
3.4 Energy Conservation Measures Identified.............................................................55
3.4.1 Proposals for Energy Conservation & Technology Up-Gradation ............55
3.4.1.1 Proposal Description Including Technology/Product Specifications,
Benefits of Implementation, Cost of Implementation, Monetary Savings,
Simple Payback Period and Issues/Barrier in Implementation for Each
Proposal .....................................................................................................55
3.4.2 Availability of Technology in Local/National/International Market .........65
3.4.3 Availability of Local Service Providers Who Can Take Up the Proposals65
3.5 Identification of technologies/equipments for DPR preparation ...........................67
3.5.1 Justification for Technologies Identified for DPR Preparation..................67
3.6 ENVIRONMENTAL BENEFITS ......................................................................71
4.0 CONCLUSION ....................................................................................................73
4.1 Summary of Findings.............................................................................................73
4.1.1 All Energy Saving Proposals/Measures Identified For the Cluster ...........73
4.1.2 Technology Gap Assessment for All Energy Saving Proposals/
Measures Identified For the Cluster...........................................................74
4.1.3 Techno-Economics for all Energy Saving Proposals.................................74
4.1.4 Barriers in Implementation of Identified Energy Saving Proposals ..........76
4.1.5 Short Listed Technology/Products for DPRs .............................................76
4.2 Summary of Level of Awareness on Energy Efficiency and Energy Efficient
Products in the Cluster ...........................................................................................77
Manual on Energy Conservation Measures in Ceramic Industry
6 of 96
List of Tables
Table No. 1: List of Identified Clusters under BEE SME Program.....................................9
Table No. 2: Ceramic Industrial Units at Morbi & their % share......................................10
Table No. 3: Ceramic Units at Morbi, Production Wise Breakup.....................................10
Table No. 4: Morbi Ceramic Cluster Total Production, Turnover and Employees...........11
Table No. 5: Annual Production of Ceramic Products in a Typical Ceramic Industry .....11
Table No. 6: Fuel and Electricity Consumption in a Typical Unit ....................................12
Table No. 7: Specific Energy Consumption Range in Ceramic Units in Morbi................13
Table No. 8: Details of Associations of Morbi Ceramic Cluster.......................................18
Table No. 9: Energy Consumption Scenario at Morbi Ceramic Cluster ...........................23
Table No. 10: Specific Energy Consumption in Ceramic Manufacturing.........................25
Table No. 11: Theoretical Air Required and the Recommended Excess Air for Proper
Combustion of Fuels ....................................................................................31
Table No. 12: kVAr required for Power Factor Correction...............................................41
Table No. 13: General Selection Criteria for Compressors ...............................................44
Table No. 14: Specific Power Consumption for Reciprocating Compressor ....................45
Table No. 15: Effect of Intake Air Temperature on Energy Consumption .......................45
Table No. 16: Energy Efficient Technology Providers .....................................................47
Table No. 17: Details of the Vendors for Supplying the Identified Technologies ............65
Table No. 18: Details of the Identified Technical Experts to Assist For Implementation of
Above Identified Projects in Ceramic Industry............................................66

Manual on Energy Conservation Measures in Ceramic Industry
7 of 96
List of Figures
Figure No. 1: Process Flow Diagram of Wall/Floor/Vitrified Tiles..................................16
Figure No. 2: Process Flow Diagram of Sanitary Wares...................................................17
Figure No. 3: Cogeneration through Gas Turbine .............................................................27
Figure No. 4: Cogeneration through Gas Engine...............................................................28
Figure No. 5: Preheating of Slurry Input of Spray Dryer through Solar Energy...............29
Figure No. 6: Thermal Image Showing the Surface Temperature of Kiln ........................32
Figure No. 7: Graph Showing the Quantification of Heat Loss through Kiln Surface......32
Figure No. 8: Preheating Of Combustion Air by Smoke Air through Recuperator ..........33
Figure No. 9: Use of Hot Air Directly As a Combustion Air in Tunnel Kiln ...................34
Figure No. 10: Standard Motor Vs Energy Efficient Motor..............................................42
Figure No. 11: Sankey Diagram for Energy Utilization in Compressors ..........................44
Figure No. 12: Relationship of SGA and energy saving ...................................................49
Figure No. 13: Example of Organizational Structure with Overlapping...........................50
Figure No. 14: Positioning of SGA in Main Job Structure................................................50
Figure No. 15: 10 Stages for Success ...............................................................................52
List of Annexure
Annexure–1: Technology/Equipment Assessment Summary ............................................78
Annexure–2: Details of Technologies/Services Providers for the Cluster.........................86
Annexure–3: Financial Schemes Available with Local Banks for Improving Energy
Efficiency in the Cluster ........................................................................................89
Annexure–4: Name and Addresses of Units in the Cluster (Audited) ...............................92

Manual on Energy Conservation Measures in Ceramic Industry
8 of 96
1.0 ABOUT BEE’S SME PROGRAM
1.1 Project Objectives
Bureau of Energy Efficiency (BEE) is implementing a program (BEE’s SME Program) to
improve the energy performance in 25 selected SME clusters. Morbi Ceramic Cluster is
one of them. Objective of the program is to accelerate the adoption of energy efficient
technologies and practices in the chosen SME clusters through technology gap studies,
energy audits, benchmarking, knowledge sharing, capacity building at local level and
development of readily usable DPRs to facilitate financing of energy efficient projects.
1.2 Expected Project Outcome
Under this BEE SME Program, following outcome is envisaged for Morbi Cluster:
Activity 1: Energy Use and Technology Analysis
This activity has developed information based on the status of Morbi Ceramic Cluster,
identification and detailing of all possible energy efficiency measures, their techno-
economic feasibility, overall potential to impact energy and environmental scenario.
Energy use and status of adaptation of technology in order to improve energy
performance of the units in the cluster has been studied and analyzed. 15
technologies/energy conservation measures have been identified preparation of DPR
(Detail Project Report). This stage has been completed and findings have been presented
in this manual.
Activity 2: Capacity Building of LSPs and SMEs
This activity has been started, LSPs have been identified and capacity creation among
local service providers/technology providers in Morbi SME cluster has also been started
which is helping the LSPs to undertake implementation of the identified energy efficiency
measures.
Activity 3: Implementation of energy Efficiency Measures
Scope of this activity is to facilitate the implementation of energy efficiency measures in
Morbi cluster through development of ready to use DPRs to facilitate bank financing.
Development of 15 DPRs is in progress.
Activity 4: Facilitation of Innovative Financing Mechanism
As the objective of this activity is to facilitate the uptake of energy efficiency measures
through innovative financing mechanisms without creating market distortion, efforts are
in progress to develop such mechanisms.
1.3 Project Duration
Complete project duration is about 2.5 years. Project has started in March 2009. Most of
the activities will be completed by December 2010. This project will be completed latest
by June 2011.
Manual on Energy Conservation Measures in Ceramic Industry
9 of 96
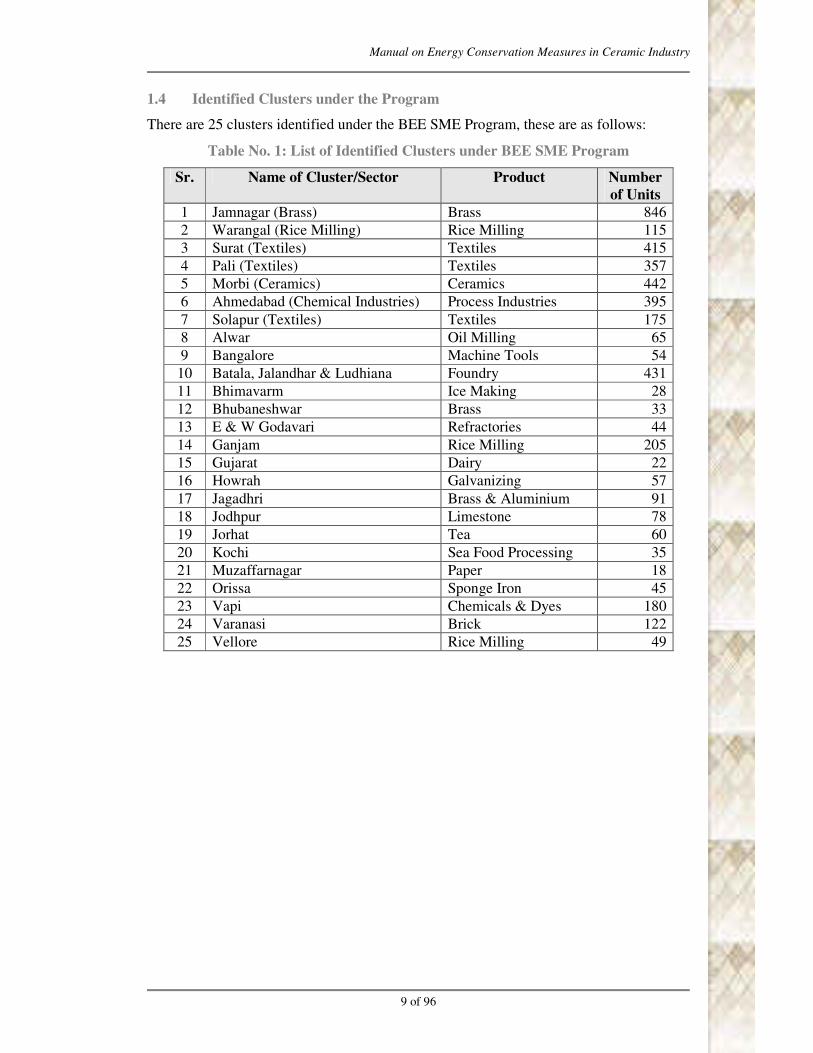
1.4 Identified Clusters under the Program
There are 25 clusters identified under the BEE SME Program, these are as follows:
Table No. 1: List of Identified Clusters under BEE SME Program
Sr. Name of Cluster/Sector Product Number
of Units
1 Jamnagar (Brass) Brass 846
2 Warangal (Rice Milling) Rice Milling 115
3 Surat (Textiles) Textiles 415
4 Pali (Textiles) Textiles 357
5 Morbi (Ceramics) Ceramics 442
6 Ahmedabad (Chemical Industries) Process Industries 395
7 Solapur (Textiles) Textiles 175
8 Alwar Oil Milling 65
9 Bangalore Machine Tools 54
10 Batala, Jalandhar & Ludhiana Foundry 431
11 Bhimavarm Ice Making 28
12 Bhubaneshwar Brass 33
13 E & W Godavari Refractories 44
14 Ganjam Rice Milling 205
15 Gujarat Dairy 22
16 Howrah Galvanizing 57
17 Jagadhri Brass & Aluminium 91
18 Jodhpur Limestone 78
19 Jorhat Tea 60
20 Kochi Sea Food Processing 35
21 Muzaffarnagar Paper 18
22 Orissa Sponge Iron 45
23 Vapi Chemicals & Dyes 180
24 Varanasi Brick 122
25 Vellore Rice Milling 49

Manual on Energy Conservation Measures in Ceramic Industry
10 of 96
2.0 CLUSTER SCENARIO
2.1 Overview of SME Cluster
2.1.1 Cluster Background
Morbi SME Cluster is mainly famous for Ceramic Tiles production and manufacturing
over 70% of India’s total ceramic tiles production. The nearest airport is at Rajkot, which
is 67 Km from Morbi by road. From Ahmedabad, Morbi could be reached by Railway as
well as by Road; the distance is about 184 KM. Taxis are available from Rajkot as well as
Ahmedabad to reach Morbi.
There are approximately 479 ceramic units in this cluster which are engaged in
manufacturing of Wall Tiles, Vitrified Tiles, Floor Tiles, Sanitary wares, Roofing Tiles
and others. There are around 50 more ceramic units coming up in Morbi.
2.1.2 Products Manufactured
Different types of ceramic products manufactured in Morbi SME cluster are as follows:
Table No. 2: Ceramic Industrial Units at Morbi & their % share
Sr. Type of Industry Units %
1 Wall Tiles 178 37 %
2 Vitrified Tiles 36 8 %
3 Floor Tiles 52 11%
4 Sanitary Wares 43 9%
5 Spray Dryer Mud Manufacturing Units 40 8%
6 Roofing Tiles (seasonal operation) 120 25%
7
Third Firing Manufacturing (Producing
pictures on tiles) 10 2%
Total 479 100%
2.1.3 Classification of Units
The ceramic units can be categorized based on the basis of type of product and the
production capacity of the plant, viz.
1. Wall Tiles
2. Floor Tiles
3. Vitrified Tiles
4. Sanitary Wares
Table No. 3: Ceramic Units at Morbi, Production Wise Breakup
Type of
product
No. of Units. Production (Boxes/day)
Scale of
Unit
Small Medium Large Total Small Medium Large Total
Wall Tiles 43 100 35 178 2,500 3,500 7,500 13,500

Manual on Energy Conservation Measures in Ceramic Industry
11 of 96
Type of
product
No. of Units. Production (Boxes/day)
Scale of
Unit
Small Medium Large Total Small Medium Large Total
Floor Tiles 8 38 6 52 3,000 4,000 7,000 14,000
Vitrified
Tiles
22 4 26* 4,000 8,000 12,000
Sanitary
Wares
10 24 9 43 300 600 1,000 1,900
* - in case of vitrified tiles during our audit, 10 vitrified tiles units are proposed units.
Therefore, we not able to consider the proposed vitrified units category wise. Presently
the vitrified units are 26 but within 1.5 year this 10 vitrified units will be in operation.
Table No. 4: Morbi Ceramic Cluster Total Production, Turnover and Employees
Sr. Data Value
1 Total Cluster Production (KT/Yr) 4,749
2 Total Cluster Turnover (Crore Rs./Yr) 3,529
3 Total no. of employees 67,750
2.1.4 Production Capacity (In Tonnes or Pieces per Year) Detail
Average annual production in a typical ceramic unit for different types of product
category is as follows:
Table No. 5: Annual Production of Ceramic Products in a Typical Ceramic Industry
Sr. Type of Industry Production in a Typical Unit*
1 Vitrified Tiles 7,55,879 to 13,76,289 Boxes/year
2 Wall Tiles 6,33,053 to 38,09,931 Boxes/year
3 Floor Tiles 14,93,322 to 42,76,309 Boxes/year
4 Sanitary Wares 5,23,496 to 7,74,389 Pieces/year
* Details:
In Vitrified Tiles, one box contains 4 tiles (size 600 mm x 600 mm),
In Wall and Floor tiles one box contains 84 tile (size 4 inch x 4 inch), 44 tiles (size 6 inch
x 6 inch), 90 tiles (size 8 inch x 3 inch) , 25 tiles (size 8 inch x 8 inch), 15 tiles (size 8
inch x 12 inch), 13 tiles (size 10 inch x 10 inch), 10 tiles (size 10 inch x 13 inch), 8 tiles
(size 10 inch x 16 inch), 5 tiles (size 13 inch x 24 inch), 10 tiles (size 12 inch x 12 inch), 7
tiles (size 12 inch x 18 inch ), 6 tiles (size 16 inch x 16 inch).
2.1.5 Raw Materials Used
The raw Material used is clay which is supplied from Rajasthan and Gujarat, various
additives are also used such as feldspar, silica etc.

Manual on Energy Conservation Measures in Ceramic Industry
12 of 96
2.2 Energy Situation in the cluster
2.2.1 Types of Fuels Used and Prices
Details of different types of fuels used in Morbi ceramic cluster along with their price and
calorific value is as follows:
Table No. 6: Types of Fuel Used and Prices*
Sr. Type of Energy Price of Fuel, Energy Calorific Value
1 Electricity Rs. 4.92 to Rs. 5.84 per kWh -
2 Natural Gas** Rs. 14 to 17 per SCM 8,800 Kcal/SCM
3 Charcoal Rs. 8 per Kg 6,500 Kcal/Kg
4 Lignite Rs. 1.5 per Kg 3,500 Kcal/Kg
5 Saw Dust Rs. 1.5 per Kg 4,801 Kcal/Kg
6 Indonesian Coal Rs. 2.7 per Kg 5,500 Kcal/Kg
7 Biomass based Briquette Rs. 3.5 per Kg 4,000 Kcal/Kg
8 HSD Rs. 35 per lit 11,000 Kcal/Kg
* Reference period is July 2009 to December 2009
** It has been observed that Natural Gas price has reducing in past few years. The
reduction has been observed from 23 Rs/SCM to 15 Rs/SCM.
2.2.2 Fuels and Electricity Consumption in a Typical Unit
Average thermal fuel and electricity consumption in a typical ceramic unit considering
the minimum and maximum capacity ceramic units are as given below
Table No. 6: Fuel and Electricity Consumption in a Typical Unit
Type of
Energy
Electricity
(KWh/day)
Natural gas
(SCM/day)
Solid Fuel (in terms of
lignite), Kg/day
Scale of
Unit Small Medium Large Small Medium Large Small Medium Large
Wall Tiles 3,000 5,000 8,000 2,500 3,500 7,500 8000 9600 12000
Floor Tiles
3,000 5,000 8,000 3,000 4,000 7,000 12000 14000 16000
Vitrified
Tiles *NA 20,000 40,000 NA 9,000 20,000 20000 30000
Sanitary
Wares 800 1,500 3,000 400 800 1,400 NA NA NA
Application To drive all motive loads
& lighting
Fuel for Kiln, Spray
Drier, Drier
Fuel for Spray Drier, Drier
& Kiln through direct
combustion or gasifier
* NA - Not Applicable

Manual on Energy Conservation Measures in Ceramic Industry
13 of 96
2.2.3 Specific Energy Consumption (In Appropriate Unit)
Based on the data provided by the units in the cluster Specific Energy Consumption for
thermal and electrical energy has been calculated, which is as follows. Here in if solid
fuels are also use then their equivalent NG consumption is calculated and provided below.
Table No. 7: Specific Energy Consumption Range in Ceramic Units in Morbi
Electrical Energy
Consumption
Thermal Energy
(Natural Gas)
Sr. Type of
Industry
Value Unit Value Unit
1 Vitrified Tiles 3.71 to 5.01 kWh/m2 1.51 – 2.11 SCM/m2
2 Wall & Floor
Tiles 1.51 - 1.92
kWh/m2
1.28 - 1.8 SCM/m
2
3 Sanitary
Wares
57- 128 kWh/MT 81.48 - 110
SCM/MT
2.3 Manufacturing process/technology overview in a typical unit
2.3.1 Process Technology
Manufacturing process and technologies that are in use in Morbi Ceramic Cluster are as
follows. The technologies that are used elsewhere in the world in ceramic manufacturing
but not used in Morbi (or that are less popular in Morbi) are also covered.
Production Process of Wall/Floor/Vitrified tiles:
Process flow diagram for Wall, Floor & Vitrified tiles is shown in item 2.3.2.
Wet Grinding
Raw materials such as clay, feldspar, quartz, calcite etc. are mixed with water in a proper
proportion and are grinded in a ball mill to make a homogeneous mixture. Ball Mill is a
batch type of process. After completion of one batch of ball mill, slurry is taken in to the
underground tanks fitted with agitator motor in each tank to maintain the uniformity of
mixture (i.e. avoiding settling of solid particles). Ball mills and blungers are used for
grinding.
Continuous wet grinding process/technology also exists but it is not in use in Morbi. Dry
grinding technology is also available but it is also not in use in Morbi. This is mostly due
to non suitability of raw material in Morbi for dry grinding process.
Spray Drying
After preparation of the slurry of required density, it is stored in underground tanks,
which are continuously agitated to maintain uniformity of the slurry. Slurry is then
pumped through a hydraulic pump into the spray dryer where the slurry is sprayed
through nozzles. Material is dried in spray dryer, thus the moisture which is added during
the grinding process in the ball mill is removed in the spray drier. Input moisture to spray
drier is 35 to 40%, which is dried to 5 to 6 %. Product from the spray dryer is then stored
in silos. Hot flue gases at a temperature of about 550 to 600 oC is used as heating source;

Manual on Energy Conservation Measures in Ceramic Industry
14 of 96
hot gases are generated by combustion of variety of fuels such as lignite, Indonesian coal,
saw dust, briquette, natural gas through direct combustion as well as through gasifier.
As of date, Co-generation technology is not in use in Morbi Ceramic units. However with
increase in exposure on gas turbine technology some of the units in Morbi are seriously
considering co-generation. Specifically tile manufacturing units have good potential of
co-generation, which in principle means, at the operating cost level co-generation
technology can generate electricity almost at the utility (PGVCL) cost and can make
spray drying energy cost almost free as the hot exhaust of the gas turbine is sufficient for
spray drying. In case of Morbi natural gas price is reducing while electricity tariff has
increased in past few years.
Pressing
The product from the spray dryer is then sent to the hydraulic press where the required
sizes of biscuit tiles are formed and sent to dryer through conveyer.
In press, advanced technology is available which enables 3 step pressing to single step
pressing, which improves productivity.
Drying
After press, biscuits containing about 5% to 6% moisture are sent to drier and dried to
about 2% to 3% moisture level in case of vitrified tiles. In case of wall and floor tiles,
biscuits are directly baked to a temperature of about 1100 to 1150 oC and after glazing, it
is baked again. In some ceramic units, hot air from kiln cooling zone exhaust is used in
dryers which saves energy consumption in driers.
Glazing
After drying, biscuit tiles are sent for glazing on the glaze line. Glaze is prepared in ball
mills. Glazing is required for designing on tiles.
Firing and Baking
After glazing, the biscuit tiles are sent for final firing in the kiln. The glazed tiles are fired
at a temperature of 1100 to 1150 oC in the kiln. Natural gas as well as producer gas from
gasifier is used as fuel in the kiln.
Sizing
Tiles coming out of the kiln are sent for sizing and calibration in case of wall and Floor
Tiles. The tiles are cut to proper sizes so that all tiles have same dimensions. After sizing
finished product is sent for dispatch.
Polishing
Polishing is required for Vitrified Tiles. Polishing utilizes 40% to 45% of total electricity
consumption in case vitrified units. After kiln the vitrified tiles are passed through
polishing line. Polishing line consist of sizing, calibration and polishing machines.
Manual on Energy Conservation Measures in Ceramic Industry
15 of 96
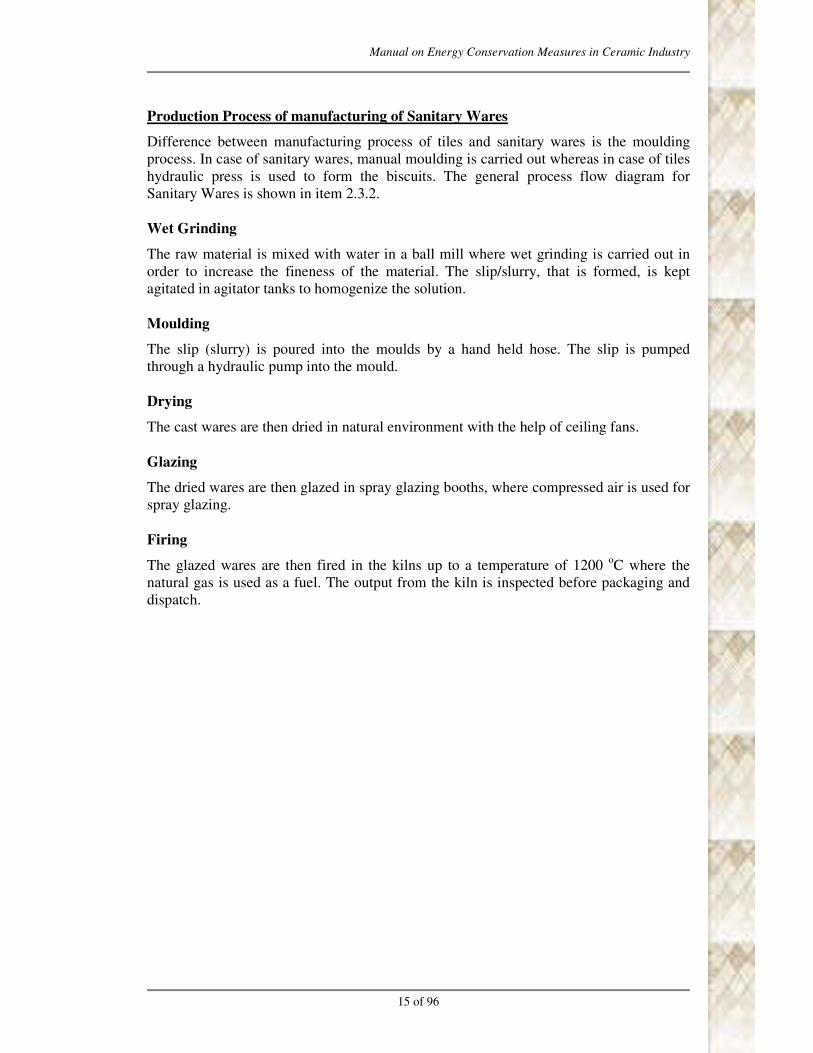
Production Process of manufacturing of Sanitary Wares
Difference between manufacturing process of tiles and sanitary wares is the moulding
process. In case of sanitary wares, manual moulding is carried out whereas in case of tiles
hydraulic press is used to form the biscuits. The general process flow diagram for
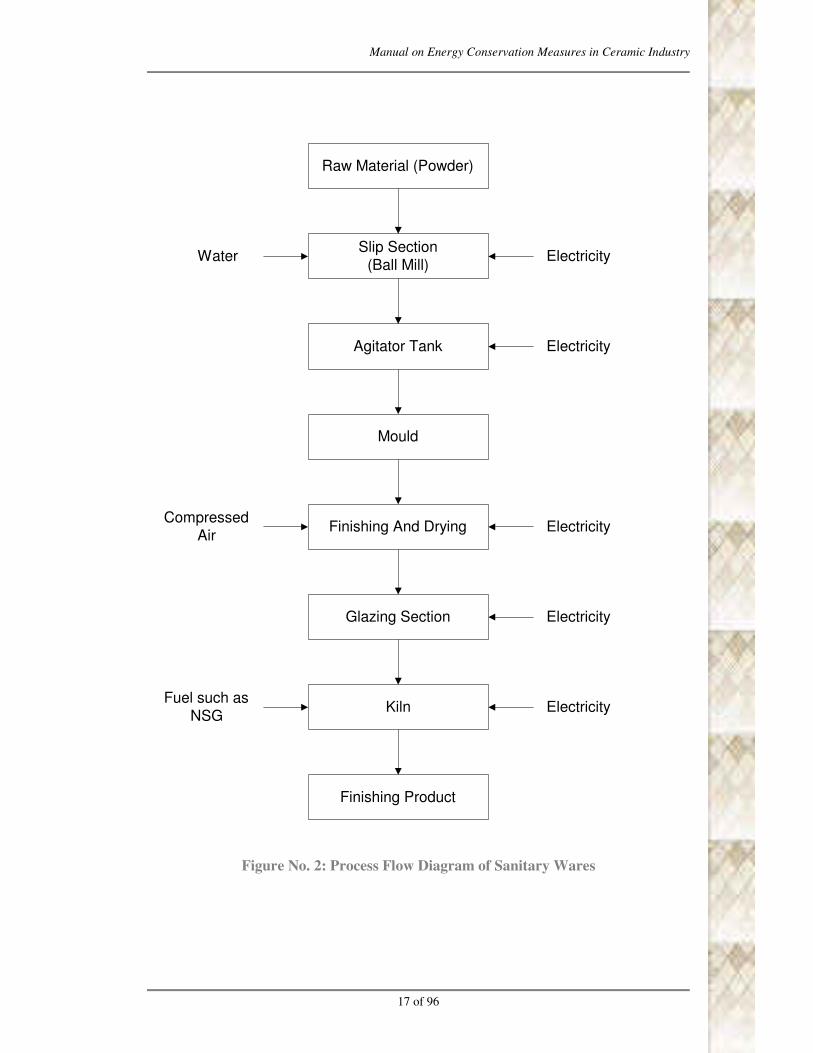
Sanitary Wares is shown in item 2.3.2.
Wet Grinding
The raw material is mixed with water in a ball mill where wet grinding is carried out in
order to increase the fineness of the material. The slip/slurry, that is formed, is kept
agitated in agitator tanks to homogenize the solution.
Moulding
The slip (slurry) is poured into the moulds by a hand held hose. The slip is pumped
through a hydraulic pump into the mould.
Drying
The cast wares are then dried in natural environment with the help of ceiling fans.
Glazing
The dried wares are then glazed in spray glazing booths, where compressed air is used for
spray glazing.
Firing
The glazed wares are then fired in the kilns up to a temperature of 1200 oC where the
natural gas is used as a fuel. The output from the kiln is inspected before packaging and
dispatch.

Manual on Energy Conservation Measures in Ceramic Industry
16 of 96
2.3.2 Process Flow Diagram
Raw Material
BallMill Blunger
Agitation Tanks
Spray Dryer
Press
Dryer
Glaze Line & Glaze Room
Kiln
Polishing/Sizing
Finished Product
Electricity
Electricity
Electricity
Electricity
Electricity
Electricity
Electricity
Electricity
Water
Fuel such asLignite, NG etc
Compressed Air
NG (Optional)
Water in Glaze room and
compressed air in glazeline
Fuel such as NG, Coal,
Briquette etc
Figure No. 1: Process Flow Diagram of Wall/Floor/Vitrified Tiles
Manual on Energy Conservation Measures in Ceramic Industry
17 of 96
Raw Material (Powder)
Slip Section
(Ball Mill)
Agitator Tank
Mould
Finishing And Drying
Glazing Section
Kiln
Finishing Product
Electricity
Electricity
Electricity
Electricity
Electricity
Water
Compressed
Air
Fuel such as
NSG
Figure No. 2: Process Flow Diagram of Sanitary Wares

Manual on Energy Conservation Measures in Ceramic Industry
18 of 96
2.4 Current Policies and Initiatives of Local Bodies
Table No. 8: Details of Associations of Morbi Ceramic Cluster
Sr. Name of Association Contact Details Activities performed
1. Gujarat Ceramic Floor
Tiles Manufacturers'
Association
Address:8 - A,
National Highway, 2 -
Bhagwati Chamber,
Morbi-363642
Mr. Becharbhai Patel -
09825230692 ♦ Work for arranging various
seminars,
♦ Arrange workshops,
♦ Inviting various agencies etc.
apart from representing the
cluster to various government
organizations and business
forums
2. Morbi Sanitary Wares
Manufacturers
Association
Address:8 - A,
National Highway, 2 -
Bhagwati Chamber,
Morbi-363642
Mr. Vijaybhai Patel
02822 - 240053, 240968 ♦ Work for arranging various
seminars,
♦ Arrange workshops,
♦ Inviting various agencies etc.
apart from representing the
cluster to various government
organizations and business
forums
3. Morbi Dhuva Glaze
Tiles Association
Address:8 - A,
National Highway, 2 -
Bhagwati Chamber,
Morbi-363642
Mr. Becharbhai Patel -
09825230692 ♦ Work for arranging various
seminars,
♦ Arrange workshops,
♦ Inviting various agencies etc.
apart from representing the
cluster to various government
organizations and business
forums
4. Gujarat Granito
Manufacturing
Association
Address:8 - A,
National Highway, 2 -
Bhagwati Chamber,
Morbi-363642
Mr. Becharbhai Patel -
09825230692 ♦ Work for arranging various
seminars,
♦ Arrange workshops,
♦ Inviting various agencies etc.
apart from representing the
cluster to various government
organizations and business
forums
5. Morbi Roofing Tiles
Manufacturing
Association
Address: Savsar Plot
Main Road, Near old
bus stand, P.O.No. 130,
Morbi
Mr. Jayantilal Patel -
09825224900, 02822 –
240100
♦ Arrange seminars,
♦ Arrange workshops for
awareness against the availability
of financial funding
Manual on Energy Conservation Measures in Ceramic Industry
19 of 96
2.5 Issues Related To Energy Usage and Conservation and Barrier in Technology
Up-Gradation
2.5.1 Energy Availability
There is no problem about availability of electrical and thermal energy at Morbi. Weekly
electrical load-shedding is there. Thermal fuels are easily available. Natural gas is
supplied by GSPC (Gujarat State Petroleum Corporation). There is good network for
natural gas supply in Morbi. Most of the units are having their own DG sets to generate
electricity in absence of grid power. Gujarat Mineral Development Corporation provides
monthly quota for coal procurement to the units. Various forms of biomass are also used
as a source for thermal energy. Various forms of biomass such as briquette, saw dust,
wood etc. are also used as a source for thermal energy.
Though there is good potential for co-generation, but no plant has yet commissioned gas
turbine or gas engine based co-generation. Interest in gas turbine based co-generation has
started picking up in the cluster and within a few months (in 2010) it is expected that co-
generation plants will be commissioned and put in use.
The cluster started with kerosene as thermal fuel in early 90s, then in mid 90s shifted to
LPG. After 2000, as the cost of the energy from LPG was higher as compared to that
from coal based gasification, units shifted to producer gas (generated by partial
combustion of solid fuel through Gasifier). However in past few years, when the natural
gas reached Morbi, many units started using Natural Gas for the kiln. Gasifier (producing
producer gas) and potrifier (equipment using fluidized bed coal combustion to deliver hot
flue gas) still remained as most chosen source of energy for spray dryer. With passage of
time and quality related issues, some of the units took initiative and shifted their spray
dryer operations on Natural Gas. Now those who have opted for Natural Gas based drying
are seriously considering co-generation. Over a period of time, Natural Gas prices have
reduced while grid electricity prices are going up thus making a stronger case for co-
generation.
2.5.2 Technological Issues
In Morbi cluster, overall technical understanding on ceramic manufacturing is good and
rapidly increasing. Important equipments like kiln, polishing machine etc are bought from
Italy (Sacmi) and China (Modena), which are leading suppliers of these equipments world
over. Many of the unit owners are frequently visiting international ceramic fairs and
ceramic process equipment suppliers, thus keeping them informed. In past few years
variable frequency drives have been adopted widely. It has been observed that at cluster
level there is committed interested for leadership and following up is quick. In general,
there is readiness to adopt provided delivery, outcome and results are demonstrated.
However the first change is still a challenge, upon success, later on duplication and
adaptation is extremely prevalent in the cluster. The technologies need to be demonstrated
within the cluster. While carrying out the audits and presenting the Energy Audit reports
to the units, in the discussion with the plant owners & other personnel, many of them
agreed with many of the identified energy saving measures and technologies but they
demanded demonstration of the energy saving technologies in any plant and thereafter
they have readiness to follow.

Manual on Energy Conservation Measures in Ceramic Industry
20 of 96
2.5.3 Financial Issues
Availing finance is not the major issue. Among the SMEs, the larger units, if convinced,
are capable of either financing it themselves or get the finance from their banks. The
smaller units will require competitive loan and other support to raise the loan. However as
most of them have been able to expand their setup and grow, there is readiness to spend
for energy efficiency technologies which have good returns. Energy Efficiency Financing
Schemes such as SIDBI’s, if focused on the cluster, will play a catalytic role in
implementation of identified energy conservation projects & technologies.
The cluster has significant potential of co-generation through gas turbine, which can free
over 100 MW from the grid in coming 3 years. However though there are good returns,
this project is highly capital intensive and requires support of policy as well as innovative
financial mechanisms. Initiative has already been taken by some of the units to install gas
turbine based co-generation. Reputed Gas Turbine manufacturers have also started giving
due focus to the cluster for adaptation of co-generation. CDM needs to be duly applied to
generate additional cash flow to further improve the returns from the project.
2.5.4 Manpower Related Issues
At Morbi ceramic cluster, availability of skilled manpower is one of the limitations.
Number of ceramic units has grown fast as compared to the availability of skilled
manpower. One local technical person available at Morbi takes care of about 5 to 10
ceramic units. For major equipments like Kiln, Polishing Machine etc. maintenance or the
repair work of these equipments is taken care by the equipment suppliers themselves.
Even international suppliers like Sacmi, KEDA, Modena depute at least one of their
representative at Morbi for the maintenance work. For other issues, Local technical
persons at Morbi take care of most of the matters.
Specialized and focused training of the local service providers on better operation and
maintenance of the equipments, importance of the energy and its use and energy
conservation measures will improve awareness among the unit owners and workforce.
Original equipment suppliers should also participate in these programs.
2.5.5 Technology & Service Providers Related issues
Many of the new technology provider’s (especially some foreign technology leaders)
have not shown keen interest in implementation of their new innovative technologies.
This appears to be because of fear of duplication.

Manual on Energy Conservation Measures in Ceramic Industry
21 of 96
3.0 ENERGY AUDIT AND TECHNOLOGY ASSESSMENT
3.1 Methodology Adopted For
3.1.1 Energy Use and Technical Study
3.1.1.1 Pre-Energy Audit Activities
Methodology adopted for pre - energy audit activities has been as follows:
1. Based on the situation analysis data provided by BEE on Morbi ceramic cluster,
the activities were evolved and planed accordingly. Three ceramic units were
visited and observed in detail to get deeper understanding of the energy issues in
the industry before starting the work.
2. Visited the associations and met with the officials of the associations, taken their
feedback and views.
3. Based on the visit, identified high energy consuming equipments and analyzed
ongoing technologies and started identifying gaps at the cluster level.
4. Prepared the data collection and equipment measurement format for the energy
audit and its field measurements
5. Prepared a list of 75 units to be audited taking care that all types and sizes are
covered.
6. Depending on visit to the 3 units, started identifying possible energy conservation
areas.
7. Finally classified the units to be studied as:
• ������������
• ���������
• ���������������
• ���������������
Allocation of one person (who can also speak local language) from our team to work full
time to convince the plant owners/persons to get ready for conducting the energy audit
Used local maps, books and information provided by association to get further details on
the cluster
3.1.1.2 Preliminary Energy Study
Number of preliminary energy audit studies was done in 52 ceramic units
Methodology adopted for Preliminary Energy Audit study has been as follows:
1. Collection of the past one year electrical and thermal energy consumption data
2. Establishment of the energy consumption scenario at the plant
3. Establishment of the benchmarks of specific energy consumption of typical
equipments wherever possible
4. Study of major energy consuming equipments at the plant
5. Identification of major energy consuming sections and further work on
identification of energy conservation opportunities
6. Detailing of no cost and low cost saving measures at the plant.
7. Identification of the areas for detailed study and listing the measurements required
8. Modified previous formats for data collection and measurements and finalized
them for detail energy audit study

Manual on Energy Conservation Measures in Ceramic Industry
22 of 96
3.1.1.3 Detailed Energy Study
Number of detailed energy audit studies was done in 23 ceramic units
Methodology adopted for Detail Energy Audit study has been as follows:
1. Detail observations on the equipments in terms of their functions, energy
requirements
2. Electrical measurements on the electrical equipments by Load Analyzer which
includes the measurement of Voltage, Current, kW, PF on the equipments such as
transformer, motors, capacitors, air compressors, blowers etc.
3. Thermal measurements which include the temperature measurement by
thermocouple and thermal imager, %CO2 in flue gas measurement by orsat
apparatus which are crosschecked by Oxygen analyzer, air velocity measurement
by anemometer etc on equipments such as kiln, dryer, spray dryer etc.
4. Arriving at energy balance and Specific Energy Consumption at plant level and
process level
5. Carried out all the required measurements to quantify specific energy
consumption at each of the major process steps for electrical energy consumption
- i.e. kWh/MT or kWh/m2 & Rs./MT or Rs/m
2 at Ball Mill, Agitation, Spray
Dryer, Press, Kiln and Polishing Section and for thermal energy consumption –
i.e. NG in SCM/m2 or SCM/MT at Spray Drier, Drier & Kiln
6. Developed process benchmarks by identifying ongoing best practices so as to
promote their repetition in the cluster
7. Identification of alternative lower energy consumption or lower energy cost option
to deliver same process function
8. Analyzed saving potential and investment required accordingly prioritized the
measures and identified 15 technologies for preparation of DPR
Technical audit involves the following:
• In technical audit the technologies and processes used and equipment details have
been studied.
• Compare the specific energy consumption of equipments of ceramic plants
• The capacity utilization to the total capacity installed has been studied
• Study of present technologies used in different types of ceramic industries used at
Morbi
• Study the availability of new technologies and local service providers at Morbi
• Discuss with the clients on the constraints of adopting the energy efficient
technologies such as energy efficient motors etc in their plants.
3.2 Observations Made During the Energy Use and Technology Studies Carried
Out In the Cluster
3.2.1 Manufacturing Process and Technology/Equipments Employed
The manufacturing processes followed in all types of industries are same as covered in
item 2.3.1 List of the major equipments employed is as follows:
a. Ball Mill/ Blunger
b. Agitators
c. Spray Dryer
Manual on Energy Conservation Measures in Ceramic Industry
23 of 96
d. Press
e. Vertical or Horizontal Dryer
f. Glaze Ball Mill and Glaze Line
g. Kiln
h. Sizing or Polishing in case of vitrified tiles Machine
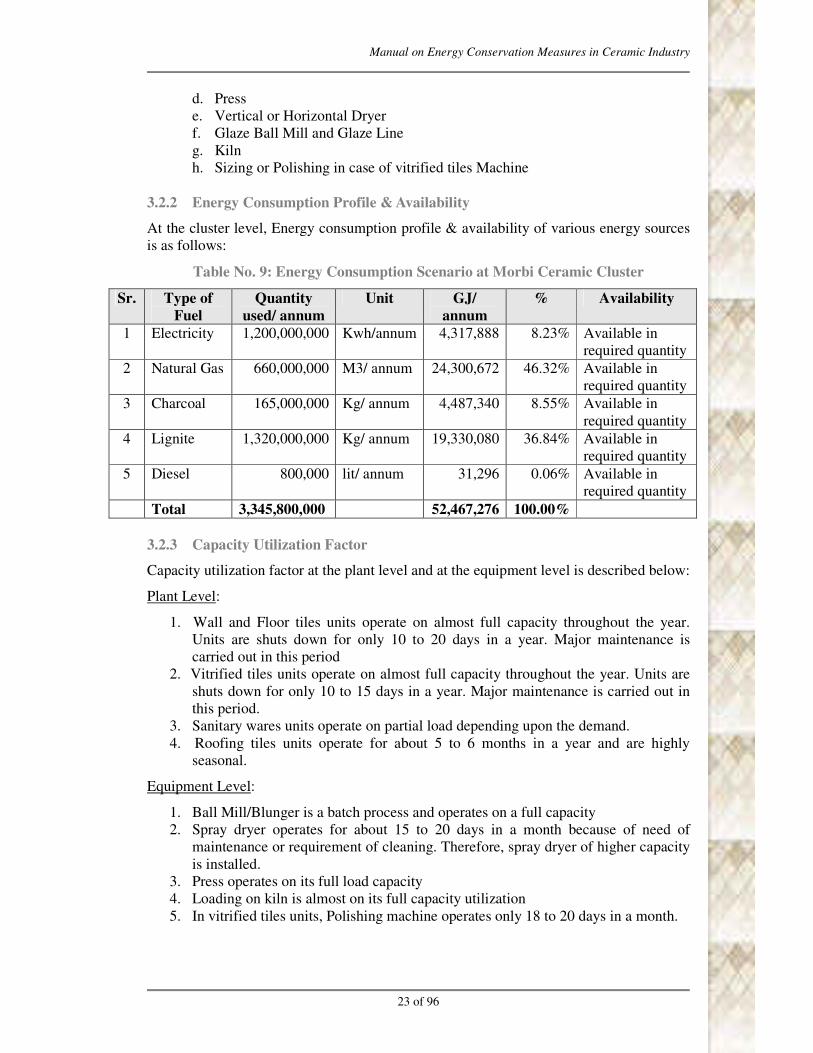
3.2.2 Energy Consumption Profile & Availability
At the cluster level, Energy consumption profile & availability of various energy sources
is as follows:
Table No. 9: Energy Consumption Scenario at Morbi Ceramic Cluster
Sr. Type of
Fuel
Quantity
used/ annum
Unit GJ/
annum
% Availability
1 Electricity 1,200,000,000 Kwh/annum 4,317,888 8.23% Available in
required quantity
2 Natural Gas 660,000,000 M3/ annum 24,300,672 46.32% Available in
required quantity
3 Charcoal 165,000,000 Kg/ annum 4,487,340 8.55% Available in
required quantity
4 Lignite 1,320,000,000 Kg/ annum 19,330,080 36.84% Available in
required quantity
5 Diesel 800,000 lit/ annum 31,296 0.06% Available in
required quantity
Total 3,345,800,000 52,467,276 100.00%
3.2.3 Capacity Utilization Factor
Capacity utilization factor at the plant level and at the equipment level is described below:
Plant Level:
1. Wall and Floor tiles units operate on almost full capacity throughout the year.
Units are shuts down for only 10 to 20 days in a year. Major maintenance is
carried out in this period
2. Vitrified tiles units operate on almost full capacity throughout the year. Units are
shuts down for only 10 to 15 days in a year. Major maintenance is carried out in
this period.
3. Sanitary wares units operate on partial load depending upon the demand.
4. Roofing tiles units operate for about 5 to 6 months in a year and are highly
seasonal.
Equipment Level:
1. Ball Mill/Blunger is a batch process and operates on a full capacity
2. Spray dryer operates for about 15 to 20 days in a month because of need of
maintenance or requirement of cleaning. Therefore, spray dryer of higher capacity
is installed.
3. Press operates on its full load capacity
4. Loading on kiln is almost on its full capacity utilization
5. In vitrified tiles units, Polishing machine operates only 18 to 20 days in a month.
Manual on Energy Conservation Measures in Ceramic Industry
24 of 96
3.2.4 Housekeeping Practices
During the energy use and technology study in the units, housekeeping and operational
practices that can make significant impact on overall energy consumption of the plant are
observed as follows:
1. Avoiding wastage while unloading from trucks/lorries: control spillages and
contamination in the stock yard – can save 1 to 2 % of raw material
2. Water addition in ball mill/Blunger during the grinding process is through a drum
or bucket – higher water addition can increase spray dryer energy consumption
significantly (1% to 3%)
3. Moisture content in the product of the spray dryer is very important and needs to
be regularly monitored – affects preparation of biscuit in the press, wastage of
biscuit and energy consumption in dryer and kiln
4. Temperature & Pressure in the kiln is properly monitored on the control panel –
affects overall quality of the tiles & sanitary ware
5. Speed of the blowers is controlled through variable frequency drives which are
monitored by the pressure in the kiln – affects air flow and thus thermal energy
consumption and also electrical energy consumption
6. In most of the ceramic industries small laboratory is provided to check the quality
of the received raw material and also to monitor various process parameters at
different stages during the production
Following points helps to develop best house keeping practices
1. Proper training and programs should be conducted on the benefits get by adopting
the housekeeping practices
2. Development of proper team in the unit itself taking care of all these house
keeping practices
3. Development of policies to maintain the same adopted in future also.
3.2.5 Availability of Data and Information
Energy consumption data for electricity and fuel are available however annual production
data is partially available.
3.2.6 Any Other Relevant Aspect
Implementation of energy saving technologies in ceramic industries at Morbi is possible
only through demonstration based approach. For example, initially in one or two units
installation of variable frequency drive (VFD) on kiln blowers was carried out due to
initiatives of VFD vendors and a few unit owners however as the success story spread,
within a very short time (almost less than a year), this technology is implemented in
almost all the ceramic units in Morbi.
3.3 Technology Gap Analysis and Implementation of Small Group Activities
This step was started with gathering specific energy consumption data and technologies
available and prevalent world wide in ceramic industry. Specific Energy Consumption
has been found to be as follows:

Manual on Energy Conservation Measures in Ceramic Industry
25 of 96
Table No. 10: Specific Energy Consumption in Ceramic Manufacturing
Sr. Country Electrical Specific
Energy
Consumption
(kWh/Ton)*
Thermal Specific
Energy
Consumption
(MKcal/Ton)*
1. India 210 1.34
2. China 259 1.05
3. Italy 139 1.16
4. Morbi 210 1.07
* Source of data - For China, Italy and India data, source is SIDBI booklet on Ceramic
Industries and that for Morbi from the Energy Audit study.
3.3.1 Technology Gap Analysis and Process Up-Gradation
Latest technologies available and the best practices that should be followed in ceramic
units to reduce the energy consumption are as follows:
A. Raw Material Processing
1. Purchase the right materials, it will save the energy and costs that would otherwise
have to be incurred to treat them in the unit
2. Raw material is transported to the processing areas by conveyers: do not let the
conveyor ON when there is no material to be transported.
3. Fit timer switches on all the grinding machines so that they automatically switch
off after processing of the raw material
B. Blunger/Ball Mill
It is the most important part of the entire tile manufacturing. The composition and
grinding of the raw material determines the quality of the final product. The grinding of
raw material is carried out by ball mills or blungers. In this process, in the ball mill as the
later on rotational speed of the mill can be brought down there is scope for installing
VFD. A few of the units have implemented this measure.
Dry Vs. Wet Grinding Process
In case of dry grinding process, there is no requirement of water addition during grinding
so the cost of fuel requirement for moisture removal in spray dryer is eliminated. But in
case of some of the raw materials or process, there is requirement of water for additive
mixing and proper grinding; therefore dry grinding process has not been applied in Morbi.
However in future, if dry grinding process is evolved by cluster focused research &
development it can bring in a revolution for the cluster.
Continuous Multistage Ball Mill versus Batch Ball Mill
In case of batch ball mill, once the raw material is fed, the grinding process starts in a
batch by rotating the ball mill at a constant speed for about 5 to 6 hours whereas in case
of continuous multistage ball mill, there are different stages and the speed of each stage is
adjusted according to the grinding requirement. However, the specific energy
consumption (kWh/MT) in case of ball mills at Morbi is found to be lesser than the data
available for Continuous Multistage Ball Mill.

Manual on Energy Conservation Measures in Ceramic Industry
26 of 96
Installation of VFD on ball mills or blungers
As the loading on ball mill or blunger varies with time, reducing the speed of the motor
through VFD in the later on period of the batch can result in reduction in electricity
consumption by 15% to 20%.
Ball Mill
Some of the tips to reduce the energy consumption in Ball Mill:
1. Always operate the ball mill at its critical loading point. The material loading of
the ball mill is a critical parameter in determining the energy consumption.
Specific Energy Consumption will increase if the ball mill is loaded below/above
the critical loading point.
2. Use grinding media (pebbles) in three different sizes for better and efficient
grinding of raw material.
3. Check the mesh size of the slurry - when it reaches the required value, switch off
ball mill/blunger. Regularly monitor batch time.
4. Don’t blend the clay two or three days in advance.
C. Spray Dryer
In a spray dryer, slurry containing moisture around 33% to 35 % (on weight basis) is
dried to form powder which contains moisture of 5% to 6%. Most of the ceramic units
use lignite as a fuel (in potrifier) to supply hot flue gases to spray dryer. A few of the
units use natural gas for spray drying.
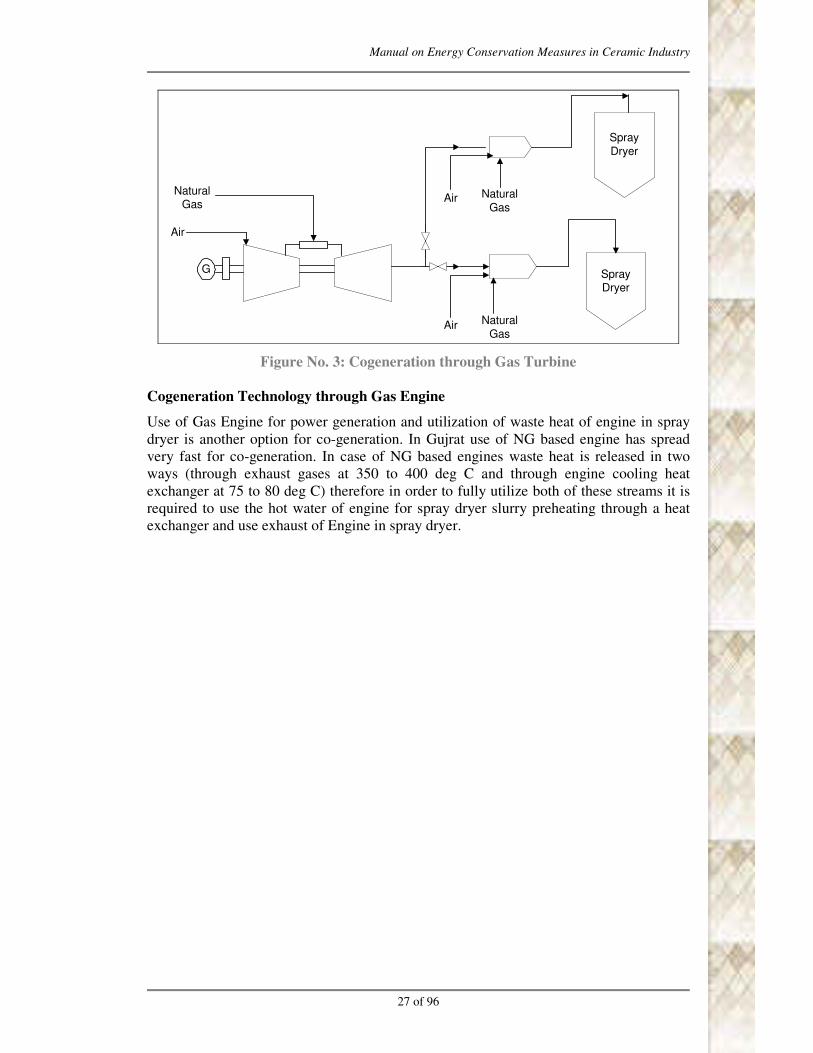
Cogeneration Technology through Gas Turbine
Use of Gas Turbine for power generation and utilization of waste heat of turbine in spray
dryer reduces plant’s total energy cost. In India, in many of the ceramic plants outside
Morbi cluster, this cogeneration technology is already in practice and offers very good
potential for reducing overall energy cost for units in Morbi. Some of the units in Morbi
has started considering this option for their units. Gas turbine suppliers are also started
focusing on Morbi ceramic cluster.
Variable Frequency Drive (VFD)
Manual on Energy Conservation Measures in Ceramic Industry
27 of 96
NaturalGas
G
Spray
Dryer
SprayDryer
Air
Air
Air
Natural
Gas
Natural
Gas
Figure No. 3: Cogeneration through Gas Turbine
Cogeneration Technology through Gas Engine
Use of Gas Engine for power generation and utilization of waste heat of engine in spray
dryer is another option for co-generation. In Gujrat use of NG based engine has spread
very fast for co-generation. In case of NG based engines waste heat is released in two
ways (through exhaust gases at 350 to 400 deg C and through engine cooling heat
exchanger at 75 to 80 deg C) therefore in order to fully utilize both of these streams it is
required to use the hot water of engine for spray dryer slurry preheating through a heat
exchanger and use exhaust of Engine in spray dryer.

Manual on Energy Conservation Measures in Ceramic Industry
28 of 96
Gas Engine(MW)
Natural
Gas
Air
G
ExhaustWaste Heat Natural
Gas
Air
NaturalGas
Air
Spray
Dryer
SprayDryer
Hot water
Heat Exchanger
Slurry Pump
to Spray Dryer
Preheated slurry
Figure No. 4: Cogeneration through Gas Engine
Overall savings on energy cost will be more in case of Gas Turbine as compared to that of
Gas Engine but the project cost is comparatively lesser with Gas engines.
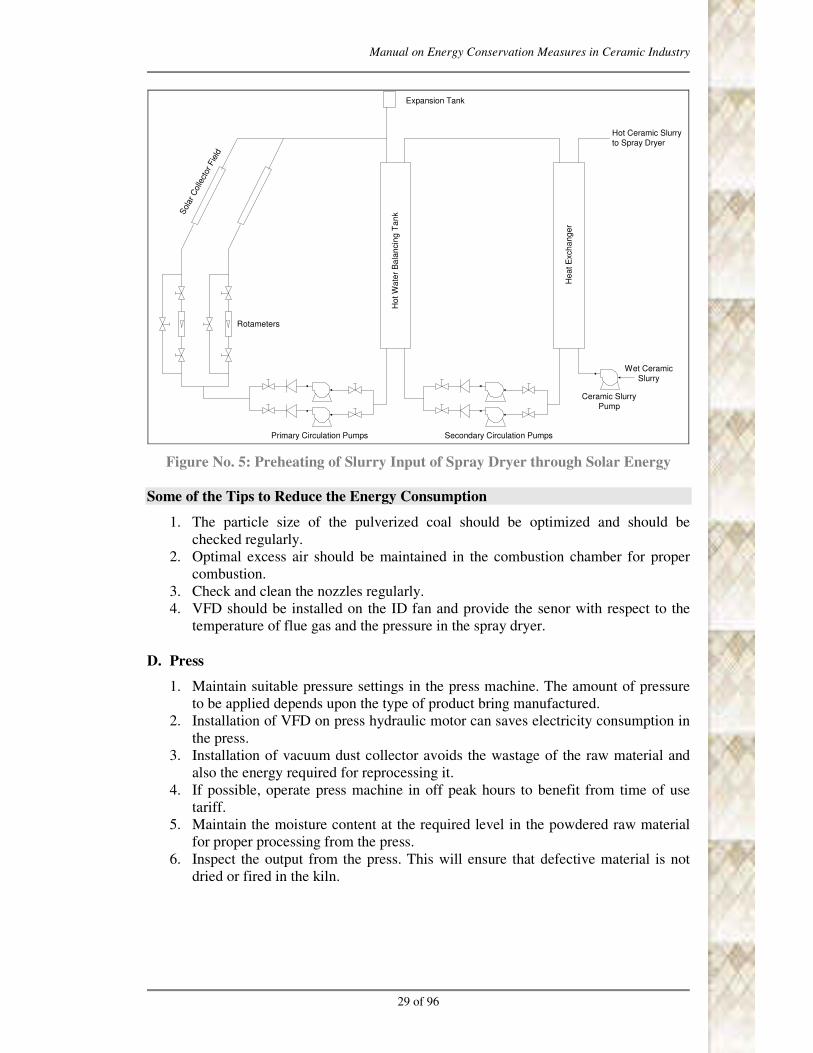
Use of solar heating system for spray dryer input slurry preheating
Utilization of solar energy for preheating of slurry input to spray dryer up to 60 o
C to 65 oC can result in significant saving in fuel consumption in the spray dryer. Hot water at a
temperature of about 80 oC to 85
oC can be generated through solar energy with the help
of flat plate solar collectors. Slurry going to the spray dryer can be preheated in a
specially designed heat exchanger. Availability of solar energy is very good in the region.
Manual on Energy Conservation Measures in Ceramic Industry
29 of 96
Expansion Tank
Sol
ar C
olle
ctor Fie
ld
Rotameters
Ho
t W
ate
r B
ala
ncin
g T
an
k
Primary Circulation Pumps Secondary Circulation Pumps
He
at E
xch
an
ge
r
Ceramic SlurryPump
Wet CeramicSlurry
Hot Ceramic Slurryto Spray Dryer
Figure No. 5: Preheating of Slurry Input of Spray Dryer through Solar Energy
Some of the Tips to Reduce the Energy Consumption
1. The particle size of the pulverized coal should be optimized and should be
checked regularly.
2. Optimal excess air should be maintained in the combustion chamber for proper
combustion.
3. Check and clean the nozzles regularly.
4. VFD should be installed on the ID fan and provide the senor with respect to the
temperature of flue gas and the pressure in the spray dryer.
D. Press
1. Maintain suitable pressure settings in the press machine. The amount of pressure
to be applied depends upon the type of product bring manufactured.
2. Installation of VFD on press hydraulic motor can saves electricity consumption in
the press.
3. Installation of vacuum dust collector avoids the wastage of the raw material and
also the energy required for reprocessing it.
4. If possible, operate press machine in off peak hours to benefit from time of use
tariff.
5. Maintain the moisture content at the required level in the powdered raw material
for proper processing from the press.
6. Inspect the output from the press. This will ensure that defective material is not
dried or fired in the kiln.
Manual on Energy Conservation Measures in Ceramic Industry
30 of 96
E. Dryer
1. In this equipment, moisture is removed from the biscuit tiles surface by
evaporation. The rate at which drying takes place depends on humidity,
temperature of the air and the moisture content in the biscuit.
2. Avoid use of smoke air of kiln in dryer as its contribution in drying is negligible.
3. The dryer should be insulated with heat insulation brick and ceramic wool to
prevent structural heat losses.
F. Glaze and Biscuit Preparation
1. Ball mills are used for preparation of Glaze material.
2. Installation of VFD on Glaze ball mill to reduce the electricity consumption needs
to be evaluated and applied case to case basis.
3. Glaze storage tanks should be covered to avoid dust falling on them.
4. After glazing on the biscuit tiles, biscuits should be carried safely to avoid
breakage.
5. Inspect the biscuit tiles and do not send defective ones for the second firing. This
will save energy.
G. Roller Kiln
In the kiln, raw biscuit is converted to the finished product. Kiln consumes most of the
thermal energy in ceramic industry. Already many measures are provided in the kiln
being used in Morbi for waste heat recovery; however following measures/technologies
can further improve kiln performance:
Use of hot air of cooling zone of kiln directly as a combustion air
Hot air from cooling zone of kiln has a temperature of about 250 oC to 300
oC. Use of this
hot air directly for combustion of fuel (NG or PG) can result in significant savings in fuel
consumption in the kiln.
Use of Smoke air (flue gas) of kiln for combustion air preheating
Smoke air of kiln is discharged into the atmosphere at a temperature of as high as 250 oC
in some of the units. Ceramic units are not utilizing the exhaust smoke air (flue gas) of
kiln for combustion air preheating because of the sulphur (SOx) content in it, which
corrodes waste heat recovery systems. This sulfur comes from the additives mixed in raw
materials in the tile production. To avoid this problem of corrosion during utilization of
the smoke air of kiln for preheating the combustion air through recuperator, material of
construction of recuperator can be changed to stainless steel based alloys which can bear
corrosive effect of sulphur in smoke air in a better way thus providing more life to the
recuperator. As the cost of the recuperator is not high and its payback period is within 1
year, these recuperators can easily be replaced after 4 to 5 years by a new one.
Use of energy efficient & high preheated air temperature burners
Use of high velocity energy efficient burner’s and high preheated air temperature burners
further improves kiln efficiency. Observed maximum preheated air temperature in the
kiln in Morbi cluster is 250 0C, where as current burner technology accepts air preheat
temperature upto 600 0C. This offers good opportunity for high temperature waste heat

Manual on Energy Conservation Measures in Ceramic Industry
31 of 96
recovery. Higher the combustion air temperature, lower will be the fuel consumption in
the kiln.
Use of Briquette Fired Hot Air Generator
Use of solid fuel (lignite/coal/indonasian coal/biomass) is cheaper as compare to use of
gaseous (Natural Gas, LPG) or liquid fuel (Kerosene/LDO/LPG). Therefore using these
solid fuels for generation of hot air at about 300 oC and used it as a combustion air in kiln,
dryer and spray dryer can result in reduction in energy cost. If biomass is used then it
reduces GHG emissions also.
Installation of VFD on Blowers of Kiln
Installation of VFD on all blowers of kiln has already helped many units in Morbi to save
electricity consumption in the blowers. However there are some units which have not
implemented this measure, they can implement it and get benefited. Here role of VFD is
to adjust speed of the blowers according to the requirement so as to maintain the required
temperature and pressure in the kiln.
Even if the VFDs are installed, it is necessary to optimize operating speed of the blowers
by standardizing the frequency and checking on regular basis that the VFDs are operating
at these set frequencies.
Maintain the required air to fuel ratio for proper combustion of fuel
Use of theoretical air required for combustion of fuel along with the recommended excess
air for that fuel results in saving in fuel consumption in the kiln. In the cluster, there is no
practice to measure the excess air (by measurement of %CO2 in flue gas or by
measurement of %O2 in the flue gas). It is important to start this practice.
Table No. 11: Theoretical Air Required and the Recommended Excess Air for
Proper Combustion of Fuels
Fuel Theoretical Kg of
Air/kg of Fuel
Recommended
Excess Air, %
Coal 10.8 30 % to 40%
Lignite 8.4 35 % to 40 %
Wood 5.8 20 % to 25 %
Furnace oil 13.9 12 % to 15 %
Natural Gas 17.34 5 % to 7 %
Insulation Improvement of Kiln Reduces The Fuel Consumption
Proper insulation of kiln reduces the fuel consumption in the kiln thereby reduces heat
loss through the kiln surface. Ideally surface temperatures should be maintained less than
60 deg C. However it has been found that the temperature levels are high and there is
scope for improving the insulation in most of the units. Units need to keep thermocouple
based instrument & infra read gun type portable temperature measuring devices and
check it themselves on status of the insulation. Both of these instruments are extremely
cost effective. it is further recommended that at least once in a year, the units must go for
a thermograph based survey of the insulation. Left had side is photograph where as the
right picture is its thermograph clearly identifies the hot spots where insulation needs to
be improved. Once the insulation work is carried out again thermograph needs to be taken

Manual on Energy Conservation Measures in Ceramic Industry
32 of 96
to check the quality of insulation repair. Such a holistic approach is required for
insulation improvement.
Figure No. 6: Thermal Image Showing the Surface Temperature of Kiln
Figure No. 7: Graph Showing the Quantification of Heat Loss through Kiln Surface
Some of the tips to reduce the energy consumption in the kiln by improving operating
practices is as follows:
1. 1% reduction of residual oxygen in the flue gas reduces the fuel consumption by
1%.
2. Every 20 oC rise in combustion air temperature will raise the thermal efficiency of
the kiln by 1%.
3. A 22 oC reduction in the flue gas temperature can reduce the fuel consumption by
1 %.
Manual on Energy Conservation Measures in Ceramic Industry
33 of 96
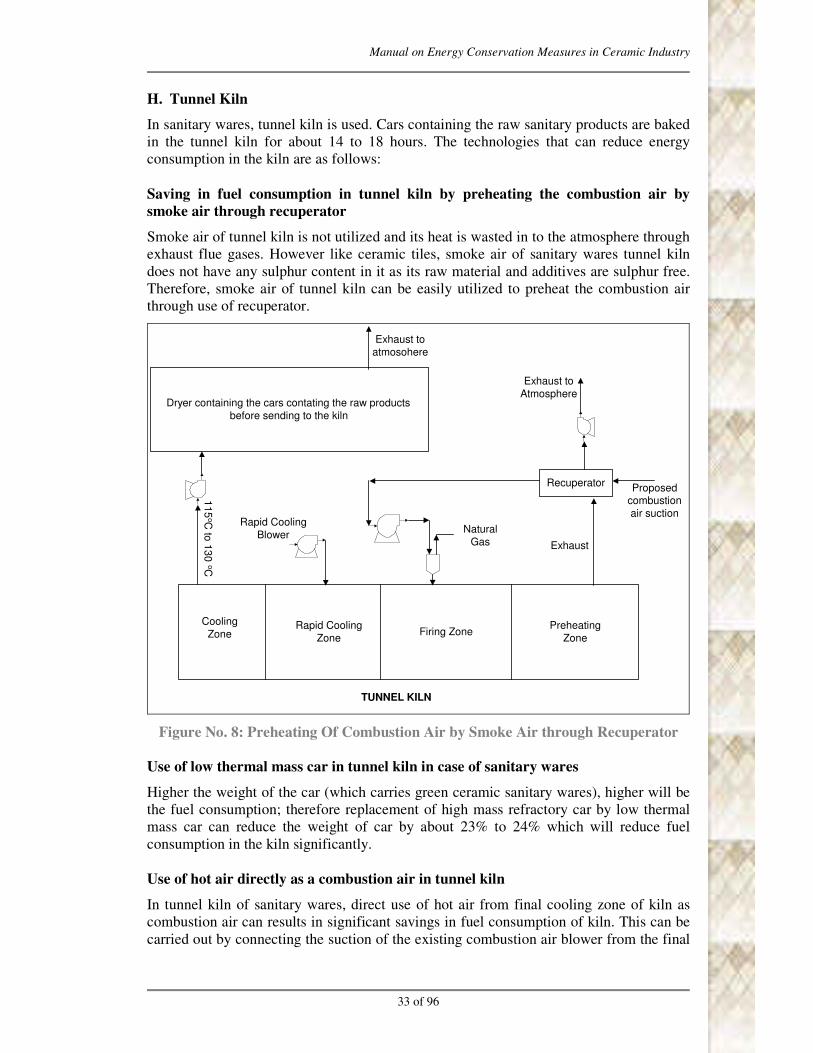
H. Tunnel Kiln
In sanitary wares, tunnel kiln is used. Cars containing the raw sanitary products are baked
in the tunnel kiln for about 14 to 18 hours. The technologies that can reduce energy
consumption in the kiln are as follows:
Saving in fuel consumption in tunnel kiln by preheating the combustion air by
smoke air through recuperator
Smoke air of tunnel kiln is not utilized and its heat is wasted in to the atmosphere through
exhaust flue gases. However like ceramic tiles, smoke air of sanitary wares tunnel kiln
does not have any sulphur content in it as its raw material and additives are sulphur free.
Therefore, smoke air of tunnel kiln can be easily utilized to preheat the combustion air
through use of recuperator.
TUNNEL KILN
Firing ZonePreheating
Zone
Rapid Cooling
Zone
Cooling
Zone
Rapid Cooling
Blower
11
5oC
to 1
30
oC
Dryer containing the cars contating the raw products
before sending to the kiln
Exhaust to
atmosohere
Natural
Gas Exhaust
Recuperator
Exhaust to
Atmosphere
Proposedcombustion
air suction
Figure No. 8: Preheating Of Combustion Air by Smoke Air through Recuperator
Use of low thermal mass car in tunnel kiln in case of sanitary wares
Higher the weight of the car (which carries green ceramic sanitary wares), higher will be
the fuel consumption; therefore replacement of high mass refractory car by low thermal
mass car can reduce the weight of car by about 23% to 24% which will reduce fuel
consumption in the kiln significantly.
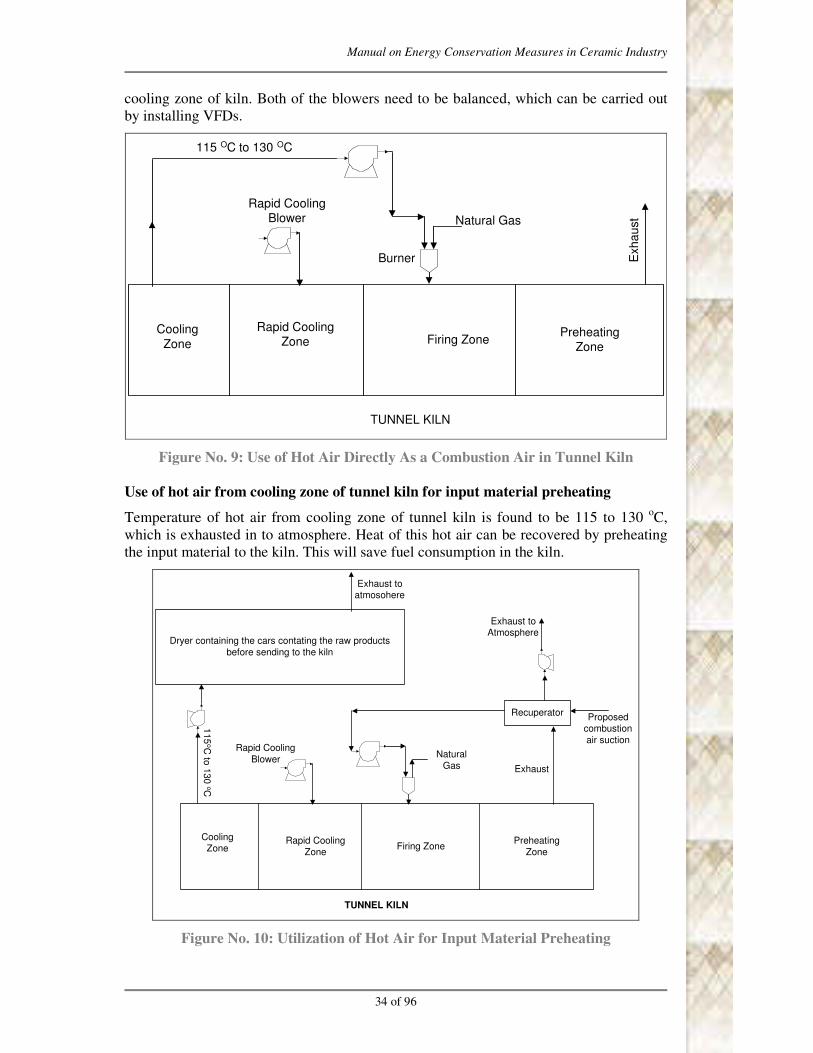
Use of hot air directly as a combustion air in tunnel kiln
In tunnel kiln of sanitary wares, direct use of hot air from final cooling zone of kiln as
combustion air can results in significant savings in fuel consumption of kiln. This can be
carried out by connecting the suction of the existing combustion air blower from the final
Manual on Energy Conservation Measures in Ceramic Industry
34 of 96
cooling zone of kiln. Both of the blowers need to be balanced, which can be carried out
by installing VFDs.
TUNNEL KILN
Firing ZonePreheating
Zone
Rapid CoolingZone
Cooling
Zone
Natural Gas
Exh
au
st
Rapid CoolingBlower
115 OC to 130 OC
Burner
Figure No. 9: Use of Hot Air Directly As a Combustion Air in Tunnel Kiln
Use of hot air from cooling zone of tunnel kiln for input material preheating
Temperature of hot air from cooling zone of tunnel kiln is found to be 115 to 130 oC,
which is exhausted in to atmosphere. Heat of this hot air can be recovered by preheating
the input material to the kiln. This will save fuel consumption in the kiln.
TUNNEL KILN
Firing ZonePreheating
Zone
Rapid Cooling
Zone
CoolingZone
Rapid Cooling
Blower
115
oC to
130 oC
Dryer containing the cars contating the raw products
before sending to the kiln
Exhaust toatmosohere
Natural
Gas Exhaust
Recuperator
Exhaust toAtmosphere
Proposedcombustion
air suction
Figure No. 10: Utilization of Hot Air for Input Material Preheating

Manual on Energy Conservation Measures in Ceramic Industry
35 of 96
I. Polishing Machines
Polishing machines are used in case of vitrified tiles only, however they consume about
40 to 50 % of total electricity of vitrified tile plant thus polishing machines are maximum
electricity consuming equipments in vitrified tiles units. Polishing machines operate for
18 to 20 days a month.
Some of the Tips to reduce the Energy Consumption in Polishing Machines:
1. Replacement of existing motors by energy efficient motors can save electricity
consumption significantly. The savings will occur because of two reasons first by
difference in design efficiency of standard efficiency motors and energy efficient
motors, which will be 1.5% to 2% but secondly due to low loading of existing
standard efficiency motors of polishing machines. Here due to flat nature of
efficiency curve of energy efficient motor savings could be 3% to 4% thus total
savings by installing energy efficient motors could be 4.5% to 6%.
2. Running the polishing machines in off peak hours, so that lower tariff of TOD
(Time of Day) saves the energy cost. Difference between maximum tariff and
minimum tariff is Rs. per kWh. As the capacity of polishing machines in most of
the units is 25 to 30% more, the polishing machines are not continuously utilized.
Therefore staggering of operation of polishing machines can be carried out based
on Time of Day tariff, which means more use of electricity during 10 PM to 6 AM
and less use during peak hours of 7 AM to 11 AM and 6 PM to 10 PM. As
switching ON & OFF will increase, it is suggested to implement staggered
operations along with installation of Maximum Demand Controller, so that MD
does not increase un-necessarily. This project will also help the grid to reduce the
load during peak hours.
J. Electrical distribution System
Electrical distribution system is an integral part of the ceramic industry. An efficient
electrical distribution system, proper utilization of electricity tariff benefits and proper
electrical demand management can reduce electrical energy cost significantly.
Electricity Tariff of PGVCL (Paschim Gujarat Vitran Company Limited):
At Morbi, there is high tension (HTP - I) supply in case of wall, floor and vitrified tiles
whereas in the sanitary wares they are using low tension (LTP - I or LTP - III) supply.
HTP - I (HT Tariff):
This tariff will be applicable for supply of electricity to HT consumers contracted for 100
kVA and above for regular power supply.

Manual on Energy Conservation Measures in Ceramic Industry
36 of 96
Demand Charges:
1. For billing demand upto contract demand.
(a) For first 500 kVA of billing demand Rs. 98/per kVA per month
(b) For next 500 kVA of billing demand Rs. 139/per kVA per month
(c) For next 1500 kVA of billing demand Rs. 208/per kVA per month
(d)
For billing demand in excess of 2500
kVA Rs. 237/per kVA per month
PLUS
2. Energy Charges for all HTPI consumers.
For entire consumption during the month
(a) Upto 1000 kVA contract demand 385 Paise per Unit
(b)
For 1001 kVA to 2500 kVA contract
demand 405 Paise per Unit
(c) Above 2500 kVA contract demand 415 Paise per Unit
Note: Wherever actual demand exceeds the contract demand, the actual demand shall be
considered for determining the applicable slab of energy charges.
PLUS
Time of Use Charges: These charges shall be levied on all HT consumers:
For energy consumption during the two
peak periods, viz., 07:00 Hrs to 11:00 Hrs
and 18:00 Hrs to 22:00 Hrs
75 Paise per Unit
Billing Demand: The billing demand shall be the highest of the following:
(a) Actual maximum demand established during the month
(b) Eighty-five percent of the contract demand
(c) One hundred kVA
Minimum Bills:
Payment of “demand charges” based on kVA of billing demand.

Manual on Energy Conservation Measures in Ceramic Industry
37 of 96
Lighting and NonIndustrial Loads:
The consumption of lights and fans and other nonindustrial loads of the
factory building as also the consumption of creche, laboratory, stores,
time keeper’s office, yards, watch and ward, first aid centres, and
dispensaries during a month registered at the main meter on HT side shall be charged at
the energy charges specified above.
Power Factor:
Power Factor Adjustment Charges:
(a) The power factor adjustment charges shall be levied at the rate of 1% on the total
amount of electricity bills for the month under the head “Demand Charges” and “Energy
Charges” for every 1% drop or part thereof in the average power factor during the month
below 90% upto 85%.
(b) In addition to the above clause, for every 1% drop or part thereof in average power
factor during the month below 85% at the rate of 2% on the total amount of electricity bill
for that month under the head “Demand Charges” and “Energy Charges”, will be charged.
Power Factor Rebate:
If the average Power factor of the consumer’s installation in any month is above 95% the
consumer will be entitled to a rebate at the rate of 0.5% (half percent) in excess of 95%
power factor on the total amount of electricity bill for that month under the head
“Demand charges” and “Energy charges” for every 1% rise or part thereof in the average
power factor during the month above 95%.
Meter Charges:
The meter charges per month are chargeable as prescribed under ‘GERC (Licensee’s
Power to Recover Expenditure incurred in providing supply and other Miscellaneous
Charges) Regulations, 2005 as in force from time to time.
Electricity Duty and Tax on Sale of Electricity:
Electricity Duty and tax on sales of electricity will be collected in accordance with the
rates prescribed by the Government from time to time. The consumer shall make separate
metering arrangement for segregation of energy consumption wherever necessary for the
purpose of levying electricity duty at different rate.
Maximum Demand and its Measurement:
The maximum demand in kW or kVA, as the case may be, shall mean an average
KW/KVA supplied during consecutive 15 or 30 minutes (as the case may be) period of
maximum use where such meter reading directly the maximum demand in KW/KVA
have been provided.

Manual on Energy Conservation Measures in Ceramic Industry
38 of 96
Contract Demand:
The contract demand shall mean the maximum KW/KVA for the supply, of which the
supplier undertakes to provide facilities from time to time.
Rebate for Supply at EHV:
On Energy charges: Rebate @
(a) If supply is availed at 33/66 kV 0.5%
(b) If supply is availed at 132 kV and above 1.0%
Concession for Use of Electricity during Night Hours:
For the consumer eligible for using supply at any time during 24 hours, entire
consumption shall be billed at the energy charges specified above. However, the energy
consumed during night hours of 10.00 PM to 06.00 AM next morning as is in excess of
one third of the total energy consumed during the month, shall be eligible for concession
at the rate of 75 Paise per unit. Appropriate meter (and time switch, if required) shall be
procured and installed by the consumer at his cost and sealed by the Distribution
Licensee.
Delayed Payment Charges:
No delayed payment charges if the bill is paid within ten days from the date of billing
(excluding the date of billing).
Delayed payment charges will be levied at the rate of 1.5% per month (upto the time of
permanent disconnection of supply) in case of all HT consumers except Agricultural
category and for the period from the date of permanent disconnection, the delayed
payment charges will be levied at the rate of 1.25%. Delayed payment charges will be
levied at the rate of 1% per month or part thereof for the Agriculture consumers from the
date of billing till the date of payment if the bill is paid after ten days from the date of
billing.
For Government dues, the delayed payment charges will be levied at the rate provided
under the relevant Electricity Duty Act.
RATE LTP - I
This tariff is applicable for aggregate motive power load not exceeding 125 BHP and
other than those specified in LFDII.
Fixed charges per month:
For an installation having the contracted load upto 10 BHP Rs. 22/per BHP
For installation having contracted load exceeding 10 BHP:
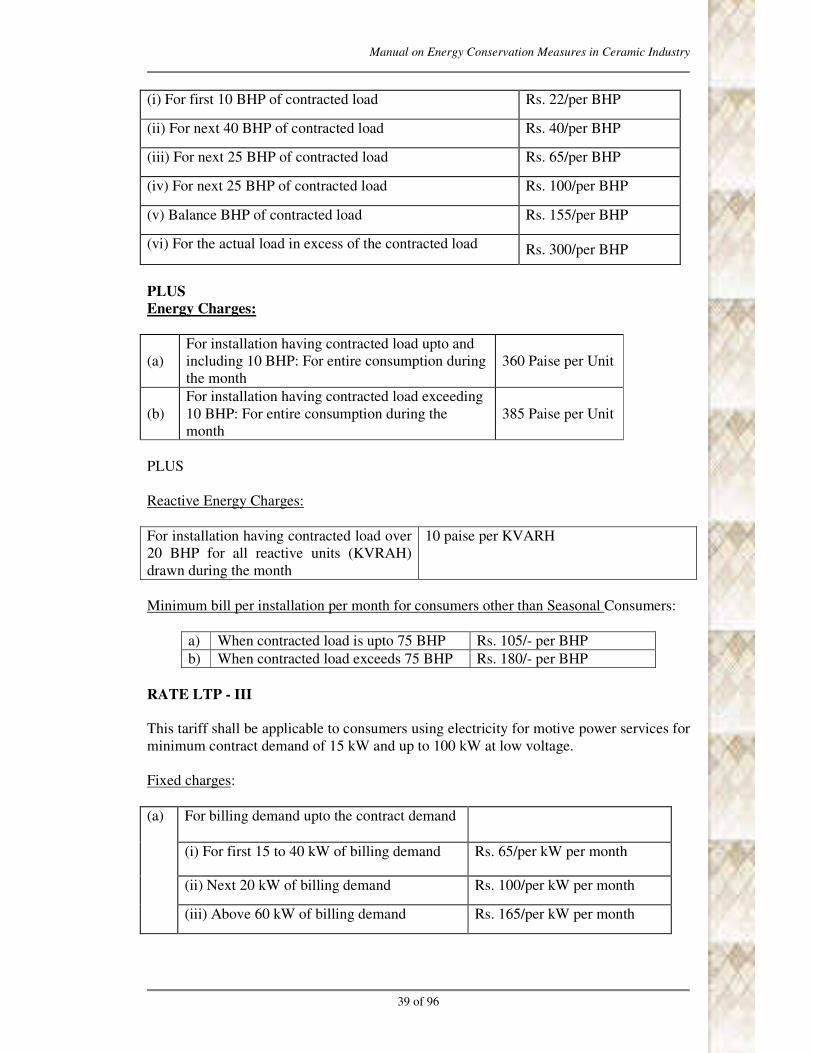
Manual on Energy Conservation Measures in Ceramic Industry
39 of 96
(i) For first 10 BHP of contracted load Rs. 22/per BHP
(ii) For next 40 BHP of contracted load Rs. 40/per BHP
(iii) For next 25 BHP of contracted load Rs. 65/per BHP
(iv) For next 25 BHP of contracted load Rs. 100/per BHP
(v) Balance BHP of contracted load Rs. 155/per BHP
(vi) For the actual load in excess of the contracted load Rs. 300/per BHP
PLUS
Energy Charges:
(a)
For installation having contracted load upto and
including 10 BHP: For entire consumption during
the month
360 Paise per Unit
(b)
For installation having contracted load exceeding
10 BHP: For entire consumption during the
month
385 Paise per Unit
PLUS
Reactive Energy Charges:
For installation having contracted load over
20 BHP for all reactive units (KVRAH)
drawn during the month
10 paise per KVARH
Minimum bill per installation per month for consumers other than Seasonal Consumers:
a) When contracted load is upto 75 BHP Rs. 105/- per BHP
b) When contracted load exceeds 75 BHP Rs. 180/- per BHP
RATE LTP - III
This tariff shall be applicable to consumers using electricity for motive power services for
minimum contract demand of 15 kW and up to 100 kW at low voltage.
Fixed charges:
(a) For billing demand upto the contract demand
(i) For first 15 to 40 kW of billing demand Rs. 65/per kW per month
(ii) Next 20 kW of billing demand Rs. 100/per kW per month
(iii) Above 60 kW of billing demand Rs. 165/per kW per month
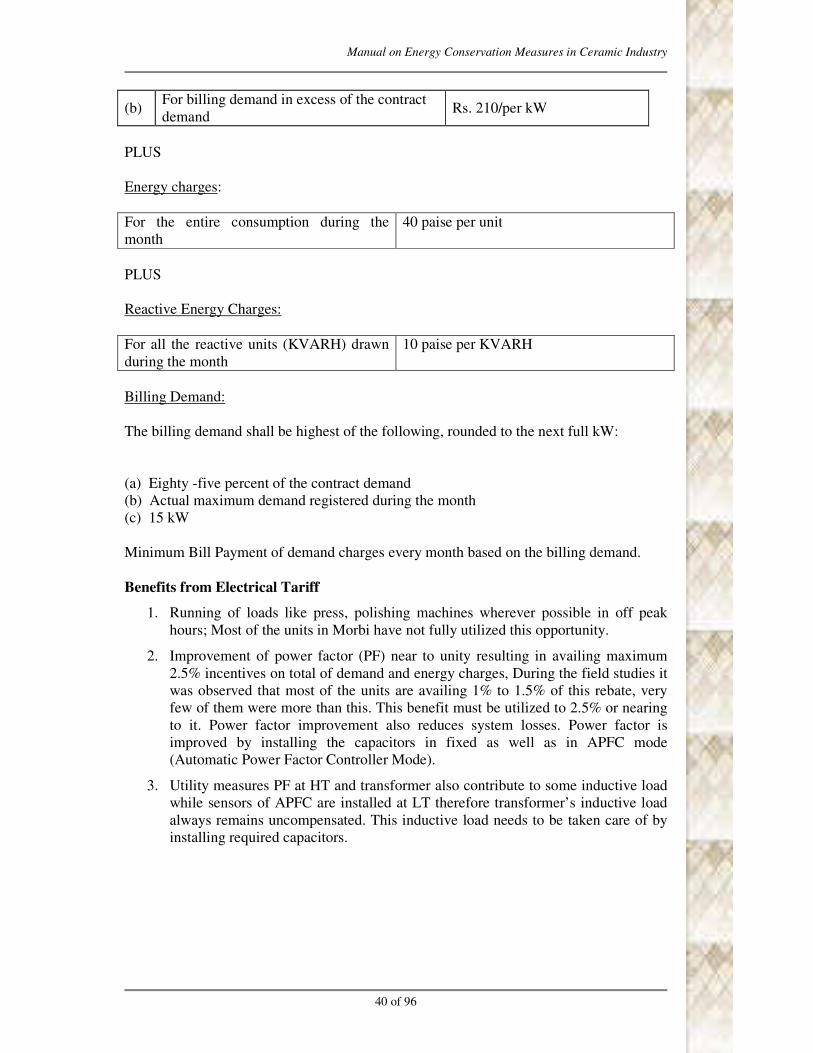
Manual on Energy Conservation Measures in Ceramic Industry
40 of 96
(b) For billing demand in excess of the contract
demand Rs. 210/per kW
PLUS
Energy charges:
For the entire consumption during the
month
40 paise per unit
PLUS
Reactive Energy Charges:
For all the reactive units (KVARH) drawn
during the month
10 paise per KVARH
Billing Demand:
The billing demand shall be highest of the following, rounded to the next full kW:
(a) Eighty -five percent of the contract demand
(b) Actual maximum demand registered during the month
(c) 15 kW
Minimum Bill Payment of demand charges every month based on the billing demand.
Benefits from Electrical Tariff
1. Running of loads like press, polishing machines wherever possible in off peak
hours; Most of the units in Morbi have not fully utilized this opportunity.
2. Improvement of power factor (PF) near to unity resulting in availing maximum
2.5% incentives on total of demand and energy charges, During the field studies it
was observed that most of the units are availing 1% to 1.5% of this rebate, very
few of them were more than this. This benefit must be utilized to 2.5% or nearing
to it. Power factor improvement also reduces system losses. Power factor is
improved by installing the capacitors in fixed as well as in APFC mode
(Automatic Power Factor Controller Mode).
3. Utility measures PF at HT and transformer also contribute to some inductive load
while sensors of APFC are installed at LT therefore transformer’s inductive load
always remains uncompensated. This inductive load needs to be taken care of by
installing required capacitors.

Manual on Energy Conservation Measures in Ceramic Industry
41 of 96
Table No. 12: kVAr required for Power Factor Correction
Desired Power Factor Original
Power
Factor 0.85 0.86 0.87 0.88 0.89 0.90 0.91 0.92 0.93 0.94 0.95 0.96 0.97 0.98 0.99 1.00
0.85 0.00 0.03 0.05 0.08 0.11 0.14 0.16 0.19 0.23 0.26 0.29 0.33 0.37 0.42 0.48 0.62
0.86 0.00 0.26 0.53 0.08 0.11 0.34 0.17 0.20 0.23 0.26 0.30 0.34 0.39 0.45 0.59
0.87 0.00 0.03 0.06 0.08 0.11 0.34 0.17 0.20 0.24 0.28 0.32 0.36 0.42 0.57
0.88 0.00 0.03 0.06 0.08 0.11 0.15 0.18 0.21 0.25 0.29 0.34 0.40 0.54
0.89 0.00 0.03 0.06 0.09 0.12 0.15 0.18 0.22 0.26 0.31 0.37 0.51
0.9 0.00 0.03 0.06 0.09 0.12 0.16 0.17 0.23 0.28 0.34 0.48
0.91 0.00 0.03 0.06 0.09 0.13 0.16 0.21 0.25 0.31 0.46
0.92 0.00 0.03 0.06 0.10 0.13 0.18 0.22 0.28 0.43
0.93 0.00 0.03 0.07 0.10 0.14 0.17 0.25 0.40
0.94 0.00 0.04 0.07 0.11 0.16 0.22 0.36
0.95 0.00 0.03 0.08 0.13 0.19 0.33
0.96 0.00 0.04 0.09 0.15 0.29
0.97 0.00 0.05 0.11 0.25
0.98 0.00 0.06 0.20
0.99 0.00 0.14
1 0.00
Following points can be helpful for energy savings in transformer:
1. Transformers can be switched off on holidays or periods of no load, if there is
separate lighting transformer.
2. Transformers should be always loaded to optimum level (20% to 60%).
Transformers should not be oversized or undersized.
3. Improvement of P.F. on LT side would reduce current and hence reduce copper
losses in transformer.
4. Amorphous core distribution transformers are more energy efficient than
transformers made with silicon iron cores. However these transformers are yet to
become commercially popular.
K. Electrical Utilities - Motors and DG Sets
Motors
Electrical energy consumption through motors is maximum in most of the industries
therefore ensuring that the motors are operating at maximum possible efficiency is
important.
Replacement with energy efficient motors to improve efficiency as well as reduce
under-loading
Replacing old re-winded motors with higher efficiency modern design motors will be a
good idea particularly after 3 to 4 re-windings. With every re-winding drop in motor
efficiency is expected. Following diagram explains standard & energy efficient motor’s
efficiency. Here it can be seen that at lower loads efficiency of energy efficient motor
does not drop as much as that of standard motor efficiency. Therefore at lower and
fluctuating load gain in efficiency is much higher than that at full load.

Manual on Energy Conservation Measures in Ceramic Industry
42 of 96
Figure No. 10: Standard Motor Vs Energy Efficient Motor
Installation of Variable Speed Drive
Incorporation of electronic speed controls for AC motors driving pumps/fans/compressors
requiring variation in throughput on a continuous basis or requiring throughput
significantly less than the design value, electronic adjustable speed drives or variable
frequency drives (VFDs) can typically save significant amount of energy. These drives
have already been applied in kiln blowers, however in other electrical loads such as
hydraulic press, compressor, agitator motors, pumps and other electrical motive load there
is potential for installation of VFDs to deliver energy savings.
Replacement of V belts by Energy Efficient Flat belts
Replacement of V-belts with flat belts or grooved V-belts can typically save 4% to 6% of
the transmitted energy. There is potential for these savings in ball mills & agitators.
Improved Maintenance Practices
It is important to develop preventive maintenance schedule and implement it
systematically. Improved maintenance practice ranges from the simplest task of using
clean hands during lubrication, and to the more complex task of replacing windings in a
manner, which results in no loss in efficiency. Therefore it is always paying to invest in
proper maintenance practices.
Replacement of Oversized Motors by Appropriate Size Motor
Many a times oversized motors are chosen and when installed they operate at lower %
loading and thus at lower efficiency. Therefore right sizing of motors is very important. If
existing motor is found to be oversized, it is required to evaluate its replacement by right
sized motor or possibilities of converting the motor from delta operation to star operation
as covered below. This conversion does not involve any capital investment. For replacing
Manual on Energy Conservation Measures in Ceramic Industry
43 of 96
the motor by right sized motor it is required to calculate the savings & pay back period
and if found suitable then only it should be changed.
Delta to star conversion of motors (with less than 50% loading)
If the motor is continuously running below 50% of its designed load, it is better to
reconfigure the motor from delta to star connection or install an auto delta star converter.
However this is to be carried out with full precaution by ensuring that the starting torque
requirement is not high and over load current settings are duly reduced otherwise motor
may burn. This measure can result into savings up to 5 to 8%.
Use of Motor Energy Savers / Soft starters
There are different types of Motor Energy Savers available in the market. However their
suitability and applicability for specific motor application in ceramic manufacturing needs
to be evaluated application by application. Only upon detail demonstration and
monitoring, if savings are achieved then only these equipments should be applied. To
avoid jerks while starting the motors, soft-starters are used which provide smooth start
operation. However Soft starters are not primarily meant for energy saving. Some of the
soft starters come with features of VFD; these may provide some savings also apart from
soft start.
Switch Off Motors When Not Required
This is most common sense based energy saving measure. Some times it is observed that
motors and its driven load keep running at no load, this is particularly observed in start
and close of batch operations. Such practices need to be avoided.
DG Sets
1. Diesel generator set are installed in almost all of the ceramic units for electrical
power backup. Tips to improve the performance of DG sets are highlighted below
2. Provide a energy (kWh) meter and keep a record of kWh generation and diesel
consumption for the period for which the DG operates or keep a daily record. DG
performance must be monitored in terms of kWh/Liter of Diesel. A good
condition DG and properly loaded DG is expected to deliver 3.5 kWh per liter of
HSD consumption.
3. Do not operate DGs too under loaded as oil consumption is more dependent on
hours of operation than their % loading. Therefore right DG sizing is equally
important.
4. At present electricity availability is better, however if it worsen then converting
existing engine to NG based operation or opting for a NG based engine must be
considered. The cost of electricity generation on NG will be very less as compared
to HSD.
Operation of DG Sets:
1. The operating temperature of engine should be kept within normal limits. Oil
temperature should not exceed 60-70 deg.C
2. Engines and alternator should be mounted and aligned properly to ensure
minimum vibration.
3. Prolonged overload should always be avoided

Manual on Energy Conservation Measures in Ceramic Industry
44 of 96
4. Unbalanced loads should be limited so that rated current is not exceeded in any
case.
5. Engine speed should be kept at the normal speed. Engine breathers should be kept
clean to ensure sufficient intake of air.
6. Check for leaks in the lubrication system and attend to them promptly
7. Change oil on condition basis and not on the thumb rule basis
L. Air Compressors
Air compressors are used in ceramic units to supply the compressed air to operate
pneumatic equipments From the below figure, it is clear that only 10% to 30% of input
energy to the compressor reaches to the point of end use and the balance 70% to 90% of
input energy gets wasted in the form of friction and noise.
Figure No. 11: Sankey Diagram for Energy Utilization in Compressors
Table No. 13: General Selection Criteria for Compressors
Capacity
(m3/hr)
Pressure
(bar)
Type of Compressor
From To From To
Root blower compressor single stage 100 30,000 0.1 1
Reciprocating
-Single / Two stage 100 12,000 0.8 12
-Multi stage 100 12,000 12.0 700
Screw
-Single 100 2,400 0.8 13
-Two stage 100 2,200 0.8 24
Centrifugal 600 300,000 0.1 450
Minimize Unload Power Consumption by Correctly Sizing the Compressor
If the installed compressor capacity is higher than the compressed air requirement in the
plant, the compressor often goes in unloading mode, where in it keeps consuming about
25% to 35% of loaded condition motor input power. However it does not deliver any
compressed air in this mode, so this energy is totally wasted. The compressor remains in

Manual on Energy Conservation Measures in Ceramic Industry
45 of 96
unload mode till the system pressure drops to load pressure. In case of reciprocating
compressors, unload power consumption is about 15% to 20% and in case of screw
compressor unload power consumption is about 30 to 35% of load power consumption.
Therefore energy saving can be achieved by minimizing the unload power consumption
which can be achieved by right sizing of the compressor while purchasing the compressor
or using VFD to de-rate the compressor. Thus even if a higher capacity compressor is
purchased by installing VFD it can be de-rated to deliver smaller capacity. Thus apart
from compressor efficiency, total energy consumption of the compressed air system also
depends on correct type & size of compressors.
Table No. 14: Specific Power Consumption for Reciprocating Compressor
Pressure
(Bar)
No. of
Stages
Specific power kW/170 m3/hr
(kW/100CFM)
1 1 6.29
2 1 9.64
3 1 13.04
4 2 14.57
7 2 18.34
8 2 19.16
10 2 21.74
15 2 26.22
Minimize Compressed Air Leakages
Quantity of air losses through small holes, cracks, leaky couplings, joints etc, can add up
to a very large value. With proper installation and maintenance, leakage losses should not
exceed 5% of the total capacity of the compressor.
Reduction in suction air temperature
As the suction air temperature goes up, power required to by the compressor to compress
the air goes up. Compressor inefficiency is dissipated in form of heat so if there is no
proper insulation the temperature in the compressed air room goes up and thus suction
temperature goes up further. This results in lower volumetric efficiency and higher power
consumption for the compressor. For an appropriate 4 oC rise in suction air temperature,
the power consumption increases by 1% for the same output. Hence it is recommended to
provide a separate suction duct from outside (open atmosphere) to the compressor
directly.
Table No. 15: Effect of Intake Air Temperature on Energy Consumption
Inlet
temp.
(oC)
Relative air delivery
(%) as Suction Air
Temperature Rises
Increase in Power Consumption with rise in
Suction Air Temperature with respect to 15.5
Deg C Suction Air Temperature (%)
15.5 100 Nil
21.1 98.1 1.3
26.6 96.3 2.5
32.2 94.1 4.0
37.7 92.8 5.0
43.3 91.2 5.8
Manual on Energy Conservation Measures in Ceramic Industry
46 of 96
Install Screw Compressors With In- Built Variable Frequency Drives for
Fluctuating Loads
1. Variable speed drives can be installed for all types of air compressors. However, it
is best suited for screw type air compressors. The advantages of installing VFD
for screw compressors are:
2. The compressors does not operate in load/unload mode, it always this saves the
unload power consumption.
3. As compressor does not go load/unload effective operating pressure is also
reduced, so the energy consumption also reduces.
4. Increase in frequency clearly indicates increase in compressed air consumption.
Install Trans-Vector Nozzles for Cleaning Hoses
The use of compressed air for cleaning applications is common in the industry. However
if proper nozzles are not used, compressed air consumption increases significantly. Here
use of transvector nozzles results in the atmospheric air getting sucked through the
circumferential holes provided thereby resulting in 30 to 40% of the atmospheric air is
utilization thus reducing the compressed air consumption by 30 to 40% in cleaning.
Install Electrical Equipments in Place of Pneumatic Equipments
Replace pneumatically operated equipments with suitable electrical operated equipments
as electrical equipments are more energy efficient and thus less power consuming as
compared to pneumatic tools. Compressor output is generally in the range of 30% (means
only 30% of electrical gets converted into compressed air rest all is wasted). Further the
efficiency of pneumatic tools is about 70%. Hence total efficiency of compressed system
becomes 21% (0.3 x 0.7 = 0.21 =21%). This efficiency is lower than efficiency of
electrical tools i.e. maximum overall efficiency of pneumatic system is 20% to 25%. If
pneumatic tools could be replaced with electrical tools operating efficiency of 70% to
80% can be achieved which means very high savings in electrical energy. Over past few
years many compressed air driven equipments have been replaced by electrical machines.
Some Of The Best Practices Leading to Energy Savings In Ceramic Units With No
Or Low Investments:
1. Installation of water monitoring system on ball mill/Blunger for monitoring of
water addition in raw material and also to measure the moisture of output product
of the spray dryer help in reduction in fuel consumption in spray dryer.
2. Install kWh meters section wise/equipment wise to measure the electricity
consumption on daily basis. This activity helps to identify the major energy
consuming areas and focus on them for energy saving. It also helps to monitor the
specific energy consumption equipment & process wise. Benchmarks get
developed and daily specific energy consumption gets monitored against these
benchmarks. If there is increased energy consumption in some of the areas, it gets
noticed quickly and therefore corrective action can be taken fast. Putting such a
system in place also helps in measuring and quantification of the savings achieved
if any saving measure is implemented in a particular section or equipment.
3. Install variable frequency drive (VFD) on screw type air compressors to save the
no load power consumption.

Manual on Energy Conservation Measures in Ceramic Industry
47 of 96
4. Install variable frequency drive on FD and SFD blowers of spray dryer and open
the throttle fully; this results in saving in electricity consumption in the blowers.
5. Install vacuum dust collector in press to reduce the raw material wastage and thus
avoid repetitive use of energy for processing of same raw material.
6. Periodical current measurements of the capacitors help in identification of the de-
rated capacitors; accordingly replacement of the de-rated capacitors by new ones
helps in maintaining power factor of plant at unity. Amount of PF rebate can vary
from Rs. 20,000 to Rs. 2,50,000 per month depending on the CD and actual PF,
therefore maintaining PF to unity must be achieved. This is in addition to
reduction in MD charges.
7. Proper insulation of kiln, spray dryer and hot air pipelines reduce the heat loss
which correspondingly reduces the fuel consumption.
8. The following are different ways to conserve the energy in pumping system:
• When actual operating conditions are widely different (head or flow variation
by more than 25% to 30%) than design conditions, replacements by
appropriately sized pumps must be considered
• Replacement with High Efficiency Pumps
• By improving the piping design to reduce Frictional Head Loss
• By reducing number of bends and valves in the piping system
• By avoiding throttling process to reduce the flow requirement
• By Trimming or replacing the impellers when capacity requirement is low
• By using Variable Speed Drives
• By using Energy Efficient Motors
Energy Efficient Technology Providers: Energy Efficient Technology Providers are as
follows:
Table No. 16: Energy Efficient Technology Providers
Sr. Energy Efficient
Technology Provider
Technologies Website
1. Sacmi Ball Mill, Spray Dryer,
Press, Kiln
www.sacmi.com
2. Modena Machinery
Co. Ltd
Ball Mill, Spray Dryer,
Kiln
www.modena.com.cn
3. KEDA Industrial Co.
Ltd.
Polishing Machine www.kedagroup.com
4. Foshan Henglitai
Machinery Co. Ltd
Press www.en.hlt.cc
5. Green Power
International Pvt. Ltd.,
Cogeneration through Gas
Engine
www.greenpowerinternation
al.com
6. Turbo Mach Pvt. Ltd. Cogeneration through Gas
Turbine
www.mysolar.cat.com
7. NRG Technologists
Pvt. Ltd.
Solar system for
preheating spray dryer
input slurry
www.nrgtechnologists.com
8. ABB, Siemens, Bharat
Bijli, Kirloskar and
Energy efficient motors www.elmomachines.com

Manual on Energy Conservation Measures in Ceramic Industry
48 of 96
Sr. Energy Efficient
Technology Provider
Technologies Website
National Electrical
Industry
9. Crystal Controls Variable frequency drives
and controls
-
10. Shiwkon Digitek Pvt.
Limited
Moisture measuring
instrument, Power meter,
ON - OFF system for
agitation motors, Flue gas
analyzer
www.shiwkon.com
11. Wesman Thermal
Engg. Processes Pvt.
Ltd
High velocity energy
efficient burners
www.wesman.com
12. Yajna Fuel Services Briquette fired hot air
generator
www.yajnafuelindia.com
13. Chemequip Recuperator -
14. Poonam Refractories Kiln Insulation -
3.3.2 Implementation of Small Group Activities
Why is Small Group Activities important?
Small Group Activities (SGA) are activities by group of employees at operator level.
They aim to solve problems that occur at the place taken care of by each employee and
put emphasis on participation and team work. Factories can apply small group activities
to many kinds of work along with normal work or other measures that are already
underway. The burden on employees will not increase because of small group activities.
They not only bring benefits to factories but also increase the knowledge and ability in
performing jobs of employees, improve communication among employees, increase
creativity, and make it possible to express their own proposal with less hesitation. As a
result, employees will start to think “This is our problem.” This SGA can be applied to
Energy Conservation, too, with successful results, as shown in Figure 13.
How is Small Group Activities related to Energy Conservation?
An excellent example of organizational structure that promotes energy management
emphasizing participation is that they form overlapping small groups as in figure 14. The
feature of this structure is that a small group for energy management is distributed to
various sections as in figure 15, which is a recipe for success of Total Energy
Management (TEM) and makes various communications and management of activities
more efficient and effective.

Manual on Energy Conservation Measures in Ceramic Industry
49 of 96
SGA
Recognize Problems that actually exist in a
work place
Gather Opinions for Energy Saving
Contribute to Energy Saving
Sustainable Energy
Apply to the
Management ofEnvironment
Figure No. 12: Relationship of SGA and energy saving
Small group activities for TEM are the activities in which employees of all levels in
production or management, starting from the top to the bottom, participate in order to
reduce loss related to their own job by improving their job. In order for the activities to
succeed, management of all levels must provide support in necessary training and
equipment, communication of policies, and the setting of problems to solve.
Small group activities for TEM�can be divided into 4 or 5 levels depending on the scale of
the organization. This division is in order to emphasize the fact that everyone must
improve in their job under the responsibility to each other. It also enables us to make
improvement without overlapping. The following example shows utilizing the existing
job-related organization as much as possible, as already mentioned in Part 2, 2.”Strategy
for Improving the Efficiency of Energy Usage further”, Step 2 Proper EC Organization
including Assignment of Energy Manager (page 12).

Manual on Energy Conservation Measures in Ceramic Industry
50 of 96
Figure No. 13: Example of Organizational Structure with Overlapping
Figure No. 14: Positioning of SGA in Main Job Structure
(1) Executives level
• Define the policy and target for Total Energy Management
• Follow-up and manage activities to make sure that activities are implemented
according to the policy
Field level small group
Group level TEM committee
Sub section level TEM committee
Section level TEM committee
Department level TEM committee
Company level TEM committee
Managing Director
Company Chairman
Department Manager
Section Manager
Supervisor
Leader
General staff
TEM Promotion committee
TEM Promotion committee
TEM Promotion committee
TEM Promotion committee
TEM Promotion committee
TEM Promotion committee
Department
Team committee
Section 2 Section 1
SG1 SG2 SG3 SG4 SG5 SG6 SG7
SMALL GROUP ACTIVITY

Manual on Energy Conservation Measures in Ceramic Industry
51 of 96
• Consider opinions and suggestions from the promotion office
• Consider reports from promotion committee from various levels
(2) Level of Total Energy Management promotion office
• Make sure that whole activities are done in the correct direction, without delay
and smoothly
• Find a suitable method that makes it possible to implement activities continuously
and without slowdown
• Listen to opinions and suggestions from small groups in order to use for
improving
• Provide advice for Total Energy Management to various groups
• Persons in charge of the office must be those with good personal relationship,
friendly, and with spirit of good service
(3) Medium level
• Define the policies of each department that are consistent with the policy of the
Total Energy Management�and the target of the company
• Define numerical targets to sub-groups apart from the target of the company as a
whole
• Follow-up the progress in order to provide to sub-groups
• Report the progress along with suggestions and opinions to upper level committee
periodically
(4) Workers/Operators level
• Implement small group activities with various themes and achieve target
• Report progress and problems encountered during implementation to upper level
committee periodically
• Ask for support, suggestions, and opinions from upper level committee
(5) Responsibility of Energy Conservation committee
• Gather and analyze information on costs related to energy every month
• Analyze and solve problems related to energy
• Find a method for energy conservation
• Prepare energy conservation plan
• Follow-up the result of implementing the plan
• Perform activities such as public relationship for encouraging employees to
participate
• Offer training to small group in each department
3. Steps of Small Group Activities for Energy Conservation
Small group activities for Energy Conservation can be done by using “10 Stages for
Success”, based on “PDCA Management Cycle”, as shown below and also in Figure No.
15:
• Plan: Make an efficient plan in order to improve operation
• Do: Implement according to the plan
• Check: Check if implementation was according to the plan

Manual on Energy Conservation Measures in Ceramic Industry
52 of 96
• Act: Judge what to improve, what to learn and what to do from what we have
checked
Please note that these stages are substantially the same as “Key Steps” explained earlier,
but put more stress on utilization of SGA. So readers could read and use either methods
up to their preference.
Figure No. 15: 10 Stages for Success
Stage 1: Define Executive’s Role
In promoting small group activities, support must be provided such as basic
environmental support. Therefore, executives must provide follow up support to
employees of their companies.
• Establish a special unit that provides support to small group activities
• Prepare a system for managing small group activities in the company
• Prepare annual plan for small group activities
• Prepare a venue for meeting, consultation, advice or suggestion
• Establish a system for giving rewards to high achieving employees
• Establish a reporting system starting from informing what to do until reporting of
the results
• Establish a fair system for evaluating results
• Establish a system for providing support and training to employees
Stage 2: Define Policy and Target
• Executives must announce a policy of supporting small group activities.
• Energy conservation committee must act as an advisor in order to set a numerical
Provide information
Plan Stage 1: Define executives’ role
Stage 2: Define policy and target
Do
Check
Action
Stage 4: Personnel training
Stage 5: Select appropriate activity
Stage 6: Evaluate feasibility of alternatives
Stage 7: Make energy conservation plan and raise
awareness
Stage 10: Implement repeatedly Establish operation standard
Stage 3: Set up energy conservation committee
Stage 9: Follow up and evaluate results
Stage 8: Implement plan
Analyze information and review the plan

Manual on Energy Conservation Measures in Ceramic Industry
53 of 96
target that is consistent with total energy management (TEM) policy and the target
of the organization. Specific targets must be set for each group.�
We can see that responsibilities in stages 1 and 2 are mainly those of executives and
committee. Responsibility of employees will become clearer from stage 3 and afterwards.
Stage 3: Set up Energy Conservation Committee
The principle of small group activities (SGA) is to divide into groups based on the scope
of responsibility. The size of the group will depend on the size of organization. However,
size of the group should not be too large. Usually a size of 5 to 10 persons is considered
appropriate. It is important to define responsibilities clearly so that every member of the
group can have their responsibility and participate in the activities.
Stage 4: Personnel Training
This stage will help employees to have more knowledge and understanding, have new
ideas, and have more belief in their own responsibility.
Stage 5: Select Appropriate Activity
In doing small group activities, each member must be able to think, express their own
ideas, and make decisions based on reality and by investigating electrical equipment,
machines, and office equipment that exist in the area of their responsibility. Items to
consider include size, number, where to use, situation of usage, current situation, and the
number of hours usage per day.
By this we can evaluate the current situation of energy usage. Also by judging if there are
more machines than needed, we can choose suitable activities and real problems for the
organization.
Stage 6: Evaluate feasibility of alternatives�(Analyze problems and decide on the
measures and activities in each point)
Each group will gather ideas on the reasons for the problems, obstacles, and how to solve
problems in order to decide on the problems, measures, and importance of activities and
thus evaluate on the feasibility of activities to do based on advice from department
manager. Basically, the following activities are not suitable for small group activities.
• Highly technical issues
• Issues that require a long time or many people to implement
We have identified the following problems through small group activities.
• Issues on material quality or production that influence energy usage
• Behavior on energy usage
• Efficiency of machines or equipment that uses energy
• Awareness toward environment and energy usage
• Safety costs for energy conservation
Stage 7: Make Energy Conservation Plan and Raise Awareness
Each group must prepare its activity plan. Generally, implementation for small group
activities takes 6 months to 1 year. Activities to be implemented should correspond to the
Manual on Energy Conservation Measures in Ceramic Industry
54 of 96
objectives of each group. Besides, it might help to listen to opinions of all organizations
in order to receive support from all other organizations.
Stage 8: Implement Plan�
Implement according to the plan of each group.
Stage 9: Follow Up and Evaluate Results
After implementing the plan, each member of small groups will follow up and evaluate
the result by analyzing result, search for strong and weak points of activities, find a way
to improve the activities and report on general achievement.
Stage 10: Implement Repeatedly
Energy conservation is an activity that must be implemented repeatedly. Therefore, it is
necessary to implement each activity repeated and make improvement to each activity. If
we are satisfied with the results, by achieving the objectives of activities, we should
provide rewards in order to give motivation for continuing the small group activities and
implement creative activities.
Dos and Don’ts in Energy Conservation
1. Don’t Emphasize the mistakes in the past. It is better to talk about the present.
2. Don’t Be worried about the theory or principles. Don’t spend too much time in
discussion or analysis of problems in meeting rooms.
3. Don’t Think that an activity can be done perfectly from the beginning.
It is necessary to do the job continuously by having experiences and judging by
ourselves.
4. Do Start with an activity that requires small amount of investment.
5. Do Raise awareness so that all employees understand the necessity and
importance of energy conservation and participate in it.
6. Do Start the activity now without postponing to tomorrow.
Tools that are Used Often for Small Group Activities for Energy Conservation
5S means 5 basic activities that are needed in order to keep order in working space by
emphasizing increasing efficiency and improving working environment of the workers. It
consists of Seiri (Arrangement), Seiton (Orderliness), Seiso (Cleaning), Seiketsu
(Cleanness), and Shitsuke (Discipline).
QCC (Quality control circle) means controlling quality through group activities. For
this, it is necessary to work hand in hand and achieve objective quality or customers’
request. With this, we can find weak points, find the cause of problems, gather ideas for
problem solving and systematically prepare quality and thus, solve problems such as
material loss, production costs, working hours, or productivity. This is also a very useful
tool to tackle with Energy Conservation problem. So many factories or institutions are
encouraged to utilize this tool.
Manual on Energy Conservation Measures in Ceramic Industry
55 of 96
3.4 Energy Conservation Measures Identified
3.4.1 Proposals for Energy Conservation & Technology Up-Gradation
3.4.1.1 Proposal Description Including Technology/Product Specifications, Benefits
of Implementation, Cost of Implementation, Monetary Savings, Simple
Payback Period and Issues/Barrier in Implementation for Each Proposal
Based on the findings of technology gap analysis & energy audits various energy
conservation measures are identified and grouped in following categories:
1. For vitrified tiles, wall tiles, floor tiles and sanitary wares
2. For vitrified tiles, wall tiles and floor tiles
3. For vitrified tiles
4. For Sanitary wares
1. For Vitrified Tiles, Wall Tiles, Floor Tiles And Sanitary Wares
A. Installation of Variable Frequency Drive (VFD) In Ball Mills and Blunger
Project Description and Benefits:
Ball mill/Blunger is a batch grinding process. As per the process requirement the motor
should run at full speed during the start of batch, however after a particular time the ball
mill or Blunger can be rotated at less speed (RPM). A few of the units have already
implemented this project successfully; however most of the units are yet to implement
this project. The speed of the motor can be reduced by installing variable frequency drive
on Ball Mill/Blunger motor and operating speed can be programmed based on time. This
will result in reduction in electricity consumption to the tune of 15% saving in electricity
consumption in ball mills and blunger. This concept is applicable to glaze preparation ball
mill in glaze section also.
Approximate One Time Investment: It varies from Rs.1,00,000 for small units to Rs.
50,00,000 for large units (per ceramic unit) depending upon their production capacity,
numbers of ball mills, blungers and their installed motor capacity.
Annual Savings: Varies from Rs. 37,000 for small units to Rs. 10,00,000 for large units
(per ceramic unit) depending upon their production capacity, numbers of ball mills,
blungers and their installed motor capacity.
Simple payback period: Varies from 10 to 40 months.
Payback period = Investment
Savings
Note: One case study on saving calculation by implementation of this project is given in
annexure - 1: Technology/ Equipment Assessment Summary (Point 1)
Status of Adaptation of This Technology: This technology is already in operation in a few
of the units in Morbi, its mass scale adaptation is yet to happen.
Issues/Barrier in implementation: There are no technological barriers as variable
frequency drives on kiln blowers and some other applications has already been
implemented in most of the ceramic units. Benefit of variable frequency drive is already
known to the users. However in case of ball mills the motor size is multiple times higher
Manual on Energy Conservation Measures in Ceramic Industry
56 of 96
than the blower motors, therefore investment is high and in comparison to blowers %
saving is less. No. of ball mills or blungers are also more, all are not in operation
simultaneously so the operating hours per ball mill is low. So return on investment is
comparatively lower than that for blowers. It is expected that this measure will pickup in
near future.
B. Installation of Variable Frequency Drive (VFD) in Motors of Agitation Section
Project Description and Benefit:
It is observed that the loading on agitator motors is in between 30% to 65%. Also the
speed of the motors is higher than required for most of the time during agitation process.
It is to be noted that agitation is a variable load process. Initially when the fresh charge
comes from Ball Mill/Blunger, loading on motor is in between 65 % to 72%. However
after some time as the raw material become uniform then the loading on motor decreases.
For most of the time motor keeps on rotating at higher speed than the required.
Installation of the variable frequency drive (VFD) on agitator motors can saves electricity
consumption in agitation section by 15 %.
Approximate One Time Investment: Varies from Rs. 80,000 to Rs. 16,00,000 for a single
ceramic unit depending upon the production capacity and size & number of agitator
motors.
Annual Savings: Varies from Rs. 20,000 to Rs. 2,50,000 for a single ceramic unit
depending upon the production capacity and size & number of agitator motors.
Simple payback period: Varies from 18 to 30 months.
Note: One case study on saving calculation by implementation of this project is given in
annexure - 1: Technology/ Equipment Assessment Summary (Point 2a)
Status of Adaptation of This Technology: At present, this measure is at proof of concept
level and being tried in a few of the units.
Issues/Barrier in implementation: Though this measure is techno-economically viable, but
over all saving potential is low as % energy consumption for agitation process itself is
low. There are no technological barriers as variable frequency drives on kiln blowers and
some other applications has already been implemented in most of the ceramic units. Thus
benefit of variable frequency drive is already known to the units. As the agitator motor
size is small, investment is also low. It is expected that this measure will pickup in near
future.
C. Replacement of Existing Standard Efficiency Motors by Energy Efficient Motors
in Agitation Section
Project Description and Benefit:
In agitation section, loading on motors is adequate at the start of the batch i.e. just after
addition of slurry in the agitation tank, however as the mixture becomes uniform, loading
on motor decreases to less than 50%. This reduction in motor loading decreases the motor
efficiency and thereby results in more electricity consumption. As the motors are standard
efficiency motors, at reduced load drop in efficiency is very high, therefore replacement
of the existing standard efficiency motors by energy efficient motors will result in
significant saving in electricity consumption of agitator motors. It is to be noted that

Manual on Energy Conservation Measures in Ceramic Industry
57 of 96
while energy efficient motors have better efficiency (1.5% to 3%) at full load but at
partial load (< 50%) this difference goes as high as 4% to 8% resulting in higher savings
at low load situations.
Approximate One Time Investment: It varies from Rs. 50,000 to Rs. 8,00,000 for a single
ceramic unit depending upon its production capacity and size & number of agitator
motors.
Annual Savings: Varies from Rs. 10,000 to Rs. 3,00,000 for a single ceramic unit
depending upon the production capacity and size & number of agitator motors.
Simple payback period: Varies from 6 to 40 months.
Note: One case study on saving calculation by implementation of this project is given in
annexure - 1: Technology/ Equipment Assessment Summary (Point 2b)
Status of Adaptation of This Technology: This technology is yet to start in the cluster, as
the awareness will improve through this project and more and more EE motor
manufacturers start taking interest in the cluster its adaptation will increase. Few
demonstrations are necessary so that units start accepting the technology. For new units, it
will be easier to adopt the technology as for them the incremental payback period for
additional investment in EE motor will have more attractive payback period. Therefore
new units are urged to install EE motors right since beginning specifically on the
equipments requiring motors of less than 50 HP (37kW) capacity.
Issues/Barrier in implementation: Awareness about the energy efficient motors need to be
improved. Vendors for EE motors are to be brought to the cluster. More demonstrations
(including demonstrations by third party) will certainly increase its adaptation. New units
are likely to take more interest.
D. Implementation of ON - OFF Controller (10 minutes ON and 5 minutes OFF) for
Agitation Motors
Project Description and Benefits:
In agitation section, agitators are provided in underground tanks to maintain the
uniformity of the slurry. These motors operate for about 24 hours in a day. Installation of
automatically ON - OFF system on the agitator motors do not effect the uniformity
(quality) of slurry but gives saving in electricity consumption in agitator motors. This
system automatically switches ON agitator motors for about 10 minutes and then switches
OFF for about 5 minutes. This means that in one hour agitator motors operate for about
40 minutes and remain switch off for about 20 minutes. This could result in
approximately 30% saving in electricity consumption of agitator motors.
Approximate One Time Investment: Varies from Rs. 5,000 for small units to Rs. 1,60,000
for large units for a single ceramic unit depending upon the production capacity and size
of a particular ceramic unit.
Annual Savings: Varies from Rs. 17,000 to Rs. 2,00,000 for a single ceramic unit
depending upon the production capacity and size of a particular ceramic industry.
Simple payback period: Varies from 3 to 13 months
Note: One case study on saving calculation by implementation of this project is given in
annexure - 1: Technology/ Equipment Assessment Summary (Point 2c)
Manual on Energy Conservation Measures in Ceramic Industry
58 of 96
Status of Adaptation of This Technology: This technology is already implemented and
working successfully in the cluster however mass scale adaptation is yet to happen.
Issues/Barrier in implementation: There are no issues as such. More awareness on such
automatic controls, mass scale demonstration will increase its adaptation. There is some
concern about its impact on the quality. Promotional approach by the LSPs can accelerate
the adaptation.
E. Improvement in Kiln Insulation
Project Description and Benefits: One of the heat losses in the kiln is due to the radiation
loss from the surface of the kiln which is minimized by improving the insulation in kiln,
spray dryer, pipes, recuperators and other hot surfaces. This reduces the surface
temperature and thereby reduces fuel consumption.
Approximate One Time Investment: Varies from Rs. 2,00,000 to Rs. 30,00,000 for a
single ceramic unit depending upon the production capacity and size of a particular
ceramic unit.
Annual Savings: Varies from Rs. 60,000 to Rs. 15,00,000 for a single ceramic unit
depending upon the production capacity and size of a particular ceramic unit.
Simple payback period: Varies from 20 to 36 months
Note: One case study on saving calculation by implementation of this project is given in
annexure - 1: Technology/ Equipment Assessment Summary (Point 3)
Status of Adaptation of This Technology: Kiln insulation improvement has already been
taken in many ceramic units. Mostly this activity is carried out during annual plant shut
down.
Issues/Barrier in implementation: Awareness about quantification of the ongoing losses
due to poor insulation will increase the adaptation. This was observed during the field
studies when the thermographs were shown to the units where detail energy audit has
been carried. As the units observed hot spots, their readiness to improve the insulation
increased. All these thermographs are also provided in the detail energy audit reports to
specifically drive implementation of this measure.
F. Power factor improvement to unity through installation of capacitors
Note: Electricity tariff structure at Gujarat is already covered in point J - Electrical
Distribution System under the heading of 3.3.1 - Technology Gap Analysis and Process
Up gradation
Project Description and Benefits:
Gujarat state electricity board provides the incentives for good power factor (PF > 0.95)
and penalty for bad PF (less than 0.9). For power factor maintained at unity, incentives of
2.5% on energy and demand charges are provided. Most of the units have scope for
improving this incentive by 0.5% to 1.5%. Power factor is improved by the installation of
capacitors and replacement of the de-rated existing capacitors.

Manual on Energy Conservation Measures in Ceramic Industry
59 of 96
Approximate One Time Investment: It varies from Rs. 5,000 to Rs. 5,49,000 for a single
ceramic unit depending upon present PF and operating load.
Annual Savings: It varies from Rs. 3,000 to Rs. 3,40,000 for a single ceramic unit
depending upon present PF, maximum demand & energy charges.
Simple payback period: Varies from 4 to 48 months
Note: One case study on saving calculation by implementation of this project is given in
annexure - 1: Technology/ Equipment Assessment Summary (Point 4)
Status of Adaptation of This Technology: Automatic Power Factor Controller (APFC)
technology is already implemented in many units, however understanding of its
functioning and the concept of PF, its impact on the bill and understanding on testing of
capacitors need to be improved. There is no monitoring of the results after the installation
of APFC. This is also due to non-trained man-power on the shop floor for this matter.
Issues/Barrier in implementation: Most of the unit owners are financially aware of this
tariff benefit however in many units there is no periodical checking of capacitors. More
training at shop floor level is necessary. Proper approach for monitoring of PF must be
developed and followed. This can be done by daily monitoring of PF and take corrective
actions accordingly.
G. Preheating of combustion air by smoke air through recuperator in ceramic tiles
industry
Project Description and Benefits:
It was observed that in ceramic kiln, exhaust smoke air (flue gas) of kiln having
temperature between 150ºC to 250ºC is not utilized due to presence of sulphur in smoke
air. Many of the ceramic units tried to utilize the smoke air heat but their experiments
failed due to corrosion. To avoid this problem right material of construction (high grade
stainless steel) for recuperator is necessary so that material has less impact due to the
sulphur. Also these recuperators are to be procured from experienced suppliers only. Cost
will be more but the equipment will survive for more periods (4 to 5 years). As the cost of
the recuperator is paid back faster then its life it still makes economical sense to install
such recuperators. Also one observation is that as spray dryer material sustains sulphur
content in the material then the recuperator can also work, the only important issue is that
one has to select proper material of construction to avoid corrosion.
Approximate One Time Investment: Varies from Rs. 2,50,000 to Rs. 24,00,000 for a
single ceramic unit depending upon the production capacity and size of a particular
ceramic unit.
Annual Savings: Varies from Rs. 2,00,000 to Rs. 40,00,000 for a single ceramic unit
depending upon the production capacity and size of a particular ceramic unit.
Simple payback period: Varies from 5 to 30 months
Note: One case study on saving calculation by implementation of this project is given in
annexure - 1: Technology/ Equipment Assessment Summary (Point 6)

Manual on Energy Conservation Measures in Ceramic Industry
60 of 96
Status of Adaptation of This Technology: It has been tried but has not worked in long run.
Proper recuperator designer and manufacturer needs to take the initiative and demonstrate
successful operation of this technology in at least one ceramic unit, others will follow
accordingly.
Issues/Barrier in implementation: Fear of corrosion needs to be removed by
demonstration.
2. For Vitrified Tiles, Wall Tiles And Floor Tiles
A. Preheating of input slurry of spray dryer through solar energy up to 60oC
Project Description and Benefits:
Availability of sunlight is good in Morbi. Utilization of the solar energy for spray dryer
slurry preheating up to 60 oC can saves fuel consumption in spray dryer significantly. Hot
water at a temperature of about 80 oC is generated through solar energy with the help of
solar flat plate collectors. Slurry going to the spray dryer is preheated through hot water
up to 60 oC in a heat exchanger. This does not remove moisture content in slurry; it only
preheats the slurry upto 60 oC. By preheating the slurry up to 60
oC will results in 2 to 3%
saving in fuel consumption in the spray dryer.
Approximate One Time Investment: Varies from Rs. 7,00,000 to Rs. 65,00,000 for a
single ceramic unit depending upon the production capacity, size of the unit, number and
capacity of the spray dryers and layout related issues.
Annual Savings: Varies from Rs. 50,000 to Rs. 21,00,000 for a single ceramic unit.
Simple payback period: Varies from 4 to 7 years
Note: One case study on saving calculation by implementation of this project is given in
annexure - 1: Technology/ Equipment Assessment Summary (Point 6)
Status of Adaptation of This Technology: At present this technology is not in use,
however there is very good potential for this technology. Once if this technology runs
successfully in one ceramic unit then will be definitely implemented in other units also.
Issues/Barrier in implementation: High investment, high payback period and no
demonstration.
B. Installation of Biomass/Briquette Fired Hot Air Generator Which Supplies Hot
Air for Kiln Firing, Dryer and Spray Dryer Firing
Project Description and Benefits: In case, where only natural gas is used in the plant and
no solid fuel is used and the hot air from the kilns is fully utilized in the dryer, energy cost
saving can be achieved by generation of hot air at about 300 oC from biomass/briquette
fired hot air generator and utilization of this hot air as a combustion air in kiln and spray
dryer. These energy cost saving are achieved only due to the price difference in the solid
fuel and the natural gas. Rs/Kcal of solid fuel is more economical than natural gas.
Approximate One Time Investment: Rs. 10,00,000 to Rs. 30,00,000 for a single ceramic
unit depending upon the plant capacity.
Manual on Energy Conservation Measures in Ceramic Industry
61 of 96
Annual Savings: Varies from Rs. 12,00,000 to 40,00,000 for a single ceramic unit
depending upon the plant capacity.
Simple payback period: Varies from 10 to 12 months
Note: One case study on saving calculation by implementation of this project is given in
annexure - 1: Technology/ Equipment Assessment Summary (Point 8)
Status of Adaptation of This Technology: Such approach is not in use in Morbi, however
the hot air generator is proven technology.
Issues/Barrier in implementation: Awareness about the technology is first necessity. More
experiments need to be carried out as a proof of concept for such a application.
3. For Vitrified Tiles
A. Installation of Natural Gas Turbine for Electricity Generation and Use of
Exhaust Flue Gas of Turbine in Spray Dryer
Project Description and Benefit: In ceramic units, natural gas is used in spray dryer as a
fuel and electricity is taken from the state grid. Gas Turbine based cogeneration
technology generates electricity for the plant where as the hot exhaust of the gas turbine is
used in spray dryer. Mostly there is no supplementary fuel requirement in the spray
dryer. This saves total spray dryer fuel cost. Over all energy cost of plant in co-generation
mode is lower than the present scenario. From total natural gas input to the gas turbine 20
% of the energy in natural gas is converted to electricity and remaining energy (80%)
goes in flue gas which is supplied to the spray dryer as its complete source of energy. One
unique observation about energy prices in Morbi – NG prices have come down over a
period of time where as electricity prices have gone up. If this trend goes on for more
period, feasibility for Gas Turbine will further improve.
Approximate One Time Investment: Rs.6,80,00,000 to Rs. 13,75,00,000 depending on the
size of the co-generation plant required.
Annual Savings: Rs. 2,56,00,000 to Rs. 6,07,00,000
Simple payback period: Varies from 31 to 37 months
Note: One case study on saving calculation by implementation of this project is given in
annexure - 1: Technology/ Equipment Assessment Summary (Point 9)
Status of Adaptation of This Technology: This technology is already implemented and
running successfully in other ceramic units out of Morbi Cluster. One of the unit in Morbi
is implementing this technology where as one more unit is also likely to start soon.
Issues/Barrier in implementation: High investment and high payback period. As the
cluster will see NG based co-generation in Morbi Cluster further installations will
automatically increase.

Manual on Energy Conservation Measures in Ceramic Industry
62 of 96
B. Installation of Natural Gas Engine for Electricity Generation and Use of Exhaust
Flue Gas of Engine in Spray Dryer
Project Description and Benefits: Use of Gas Engine is another option for adopting
cogeneration technology. About 40% of the input heat is utilized for electricity
generation, 30% of input heat is available in the exhaust which can be used in the spray
dryer and the remaining heat loss is from jacket cooling water which is to be utilized for
preheating slurry or combustion air through installation of radiator. This technology
reduces overall energy cost of plant.
Approximate Investment required: Rs. 4,60,00,000 to Rs. 8,00,00,000 depending on size
of the unit
Annual Savings: Rs. 1,57,00,000 to Rs. 3,06,00,000 depending on the electricity
requirement of the unit.
Simple payback period: Varies from 27 to 38 months
Note: One case study on saving calculation by implementation of this project is given in
annexure - 1: Technology/ Equipment Assessment Summary (Point 10)
Status of Adaptation of This Technology: This technology has already been implemented
in other units out of Morbi Cluster how ever in Morbi Cluster it is yet to start. In Morbi,
one of the unit has taken proposal from the technology supplier.
Issues/Barrier in implementation: High investment and high payback period. The units
want to see the demonstration first at Morbi cluster only.
C. Replacement of Standard Efficiency motors by Energy Efficient motors in
polishing machine in case of vitrified tiles
Project Description and Benefits: Polishing section is the major electricity consuming
section in vitrified tiles units. About 40 to 50 % of electricity out of total is consumed by
the polishing section. It was observed that the loading of the machines of polishing
section is less than 50 %. Efficiency of standard efficiency motors decreases significantly
with the decrease in loading of the induction motors. It is observed that the motors
installed on the polishing machines have rated efficiency of about 85% only. Therefore,
there is more scope of saving in electricity consumption by replacement of the existing
motors of the polishing machines by the energy efficient motors. New units can install
energy efficient motors from beginning because payback period for incremental cost is
usually small.
Approximate One Time Investment: Varies from Rs. 16,00,000 to Rs. 27,00,000 for a
single ceramic unit depending upon the production capacity, size and number of motors.
Annual Savings: Varies from Rs. 8,00,000 to 20,00,000 for a single ceramic unit
depending upon the production capacity, size and number of motors.
Simple payback period: Varies from 10 to 28 months
Note: One case study on saving calculation by implementation of this project is given in
annexure - 1: Technology/ Equipment Assessment Summary (Point 11)
Manual on Energy Conservation Measures in Ceramic Industry
63 of 96
Status of Adaptation of This Technology: At present EE motors are not yet adopted in the
cluster; however if the awareness is increased and results are properly demonstrated,
more units will adopt EE motors.
Issues/Barrier in implementation: Unawareness about the energy efficient motors and
their saving potential. Polishing machines are imported and motors come as a part of it.
Many times the user is dependent on the equipment supplier for the kind of motors that
come with the equipment. More demonstration cases will increase its implementation.
4. For Sanitary Wares
A. Installation of Low Thermal Mass Cars in Tunnel Kiln for Sanitary wares
Project Description and Benefit: It was observed that weight of the tunnel kiln car is more
which results in extra fuel consumption as material of the kiln car is also heated to same
product temperature. The kiln car consists of steel structure with wheels at the bottom. On
the structure of kiln car, refractory bricks are provided to form the support structure for
the sanitary wares. If replacement refractory bricks is carried out by porous blocks and
ceramic fiber material and also with similar other measures, weight of the kiln car can be
significantly reduced which will result in saving in fuel consumption. Weight of the kiln
car can be reduced by 23 to 24 %.
Approximate One Time Investment: Varies from Rs. 16,00,000 to 20,00,000 for a single
ceramic unit depending upon the production capacity and size of the tunnel kiln.
Annual Savings: Varies from Rs. 5,50,000 to 6,80,000 for a single ceramic unit.
Simple payback period: Varies from 7 to 32 months for a single ceramic unit
Note: One case study on saving calculation by implementation of this project is given in
annexure - 1: Technology/ Equipment Assessment Summary (Point 12)
Status of Adaptation of This Technology: This technology is already in use in some of the
units, whereas other units are following it and implementing this technology.
Issues/Barrier in implementation: Lack of awareness about the technology and resistance
to adopt the change even if it is known. More of training, demonstration and sharing the
results will enhance its adaptation.
B. Installation of recuperator in tunnel kiln thereby preheating combustion air
through smoke air
Project Description and Benefit: Smoke air of tunnel kiln is not utilized and is exhausted
in to the atmosphere. Like ceramic tiles, smoke air of sanitary wares tunnel kiln does not
have sulphur content. Therefore, smoke air of tunnel kiln can be easily utilized to preheat
the combustion air through recuperator.
Approximate One Time Investment: Varies from Rs. 89,000 to Rs. 5,30,000 for a single
ceramic unit depending on size and layout of the kiln.
Annual Savings: Varies from Rs. 50,000 to Rs. 4,50,000
Simple payback period: Varies from 7 to 14 months
Note: One case study on saving calculation by implementation of this project is given in
annexure - 1: Technology/ Equipment Assessment Summary (Point 13)

Manual on Energy Conservation Measures in Ceramic Industry
64 of 96
Status of Adaptation of This Technology: Presently this technology is not in use, once if
this technology runs successfully in one of the units then it will be definitely implemented
by other units also.
Issues/Barrier in implementation: Awareness among the units needs to be improved.
Efforts from LSPs need to be increased to convince the units. Most of the units want to
see the demonstration first and then there is willingness for implementation.
C. Use of hot air of cooling zone of tunnel kiln directly as a combustion air.
Project Description and Benefits:
In tunnel kiln of sanitary wares, direct use of hot air from final cooling zone of the kiln as
combustion air will result in saving in natural gas consumption in the tunnel kiln. This
can be carried out by just extending the suction of the existing combustion air blower to
the final cooling zone of kiln. It requires only the cost of the pipeline to extend the length
and the insulation.
Approximate One Time Investment: Varies from Rs. 50,000 to 60,000 for a single
ceramic unit depending upon size & layout of the kiln.
Annual Savings: Varies from Rs. 80,000 to 4,00,000 for a single ceramic unit depending
upon size of the kiln.
Simple payback period: Varies from 2 to 12 months
Note: One case study on saving calculation by implementation of this project is given in
annexure - 1: Technology/ Equipment Assessment Summary (Point 14)
Status of Adaptation of This Technology: This technology is already in operation in some
of the units. However it is to be promoted to be used in other units.
Issues/Barrier in implementation: Awareness among the units needs to be improved.
Efforts from LSPs need to be increased to convince the units. Most of the units want to
see the demonstration first and then there is willingness for implementation.
D. Use of hot air of final cooling of tunnel kiln for preheating the input material
Project Description and Benefit:
If smoke air is utilized to preheat the combustion air in tunnel kiln then the hot air from
the final cooling zone of tunnel kiln having temperature between 113ºC to 130ºC can be
utilized to preheat the input material of kiln by constructing on small chamber and
passing this hot air and material to be pre-heated in this chamber. This will result in
saving in fuel consumption in the tunnel kiln.
Approximate One Time Investment: Varies from Rs. 3,50,000 to Rs. 6,50,000 for a single
ceramic unit depending upon the production capacity and size of the tunnel kiln.
Annual Savings: Varies from Rs. 3,50,000 to Rs. 5,81,000 for a single ceramic unit
Simple payback period: Varies from 7 to 14 months
Note: One case study on saving calculation by implementation of this project is given in
annexure - 1: Technology/ Equipment Assessment Summary (Point 15)

Manual on Energy Conservation Measures in Ceramic Industry
65 of 96
Status of Adaptation of This Technology: At present this technology is not in use
however there is willingness to adopt this technology. Once this technology runs
successfully in one unit then other units will adopt it fast
Issues/Barrier in implementation: Want to see first the demonstration and then there is
readiness to implement the technology.
3.4.2 Availability of Technology in Local/National/International Market
Extensive survey has been carried out to identify availability of technology/ product in
local/national /international market. Scenario and the opportunities are explained to them
those who were not aware about the Morbi Cluster. Thereafter only those who have
shown interest to serve Morbi Cluster are included in the following lists. Details of the
international, national and local service providers are given in sections 3.3.1 and 3.4.3.
3.4.3 Availability of Local Service Providers Who Can Take Up the Proposals
LSPs who can take up above mentioned proposals are as follows:
Table No. 17: Details of the Vendors for Supplying the Identified Technologies
Sr. Technology Name of
Service
Provider
Address Contact Person
and No.
1. Variable Frequency
Drive for AC Motors
and capacitors including
APFC Panel for PF
improvement
Crystal
Controls
309, Abhishree
complex, Opp. Star
India Bazar, Nr.
Jodhpur Char Rasta,
satellite, Ahmedabad –
15
Mr. Dhanji
Ghinaiya -
09714714192,
079 – 26923306
2. Solar Heating System
for pre-heating the
slurry to spray dryer
NRG
Technologists
Pvt Ltd
989/6, GIDC
Makarpura Vadodara -
390 010, Gujarat State
Mr. Chaitanya
Yardi - 0265-
2642094,
2656167
3. Energy Efficient Motors ABB/National
Electrical
Industry
(NEI),
Hindustan
Motor
NEI - Vimla Complex,
second Floor, Nr. Old
Shardamandir Rly.
Crossing, Ahmedabad -
06
ABB - Ahmedabad
National
Electrical
Industry - Mr.
Anuj Patel -
09898084805
ABB- Mr. Dinesh
Mistry - 0265 -
2642141/42
4. Instrumentation such as
moisture measuring
instrument, ON - OFF
system, Power meter
etc.
Shiwkon
Digitek Pvt.
Limited
309 - Pushpam,
Opp.Seema Hall, 100
Feet, Shyamal - Anand
Nagar Road. Satellite,
Ahmedabad - 380 015
Mr. Hardik Patel
- 09825050706
5. Briquette fired hot air
generator
Yajna Fuel
Services
B – 15, Dattaviahar Co
– Operative Housing
Society,
Ground Floor, Shivaji
Nagar, B – Cabin,
Thane (W) – 400602
Mr. Mukund
Gharpure -
09969410594,
022 - 25424983

Manual on Energy Conservation Measures in Ceramic Industry
66 of 96
Sr. Technology Name of
Service
Provider
Address Contact Person
and No.
6. Gas Engine 1. Green
Power
Internation
al Pvt. Ltd.
E – 12/A, Sector – 63,
Noida – 201 301
(U.P.),
India
Mr. Ashish
Trikha - 0120-
4655 460 / 4655
455 / 458,
09717790676
2. Wartsila
India Limited
48, Neco Chambers,
Sector 11, C B D
Belapur, 400 614 Navi
Mumbai
022 -2757
5361/71
3. Cummins
Inc
7. Gas Turbine Turbo Mach
India Pvt.
Ltd.,
5 & 6, Papa Industrial
Estate, Suren Road,
Andheri (East),
Mumbai – 400093
Mr. Pradeep
Yadav -
09833491235
8. Energy Efficient
Burners, which can take
combustion air having
temperature 300 Deg C
and above
Wesman
Thermal
Engg.
Processes Pvt.
Ltd
B/702, Sagar Tech
Plaza,
Andheri-Kurla Road,
Saki Naka,
Mumbai 400 070
Mr. Frederick C
Pinto – 022-
28509521/22,
09324384381
9. Low thermal Mass car
of tunnel kiln, other
projects of sanitary ware
tunnel kiln
Payal Allien
Engineering
Morbi Mr. Hasmukh
Patel -
09427934644
10. Recuperator Chemequip
Industries
451/2 GIDC
Makarpura Industrial
Estate
Vadodara -390 010
Mr. Parthiv
Adeshra -
09824209898
11. Kiln insulation
improvement
Poonam
Refractories
Bazar Road, Post Box
No. 2, Wankaner-
363621 (Dist. Rajkot)
Mr. Ketan Mehta
- 09825224640
12. Ceramic fibre supplier
for tunnel kiln car
Orient
Refractory
220, Ambawadi,
GIDC, Wadhwan city,
Surendranagar
Mr. R.K.Jain -
09825355877
Table No. 18: Details of the Identified Technical Experts to Assist For
Implementation of Above Identified Projects in Ceramic Industry

Manual on Energy Conservation Measures in Ceramic Industry
67 of 96
Sr. Technology Name of
Service
Provider
Address Contact
person and
No.
1. Technical Expert to
provide the
guidance or design
for implementation
of identified
projects
Yajna Fuel
Services
B – 15, Dattaviahar Co –
OperativeHousing
Society,
Ground Floor, Shivaji
Nagar, B – Cabin,
Thane (W) – 400602
Mr. Mukund
Gharpure -
09969410594,
022 -
25424983
2. Roller Kiln Expert Perfect
Mechanical
System
8 A - National Highway,
Lakdhirpur Road, Morbi
Mr. Bakulbhai
-
09825230692
3. Tunnel Kiln Expert Sharma Kiln
Technology
Morbi Mr. Adir
Sharma -
09327039235
4. Ceramic Plant
Expert in operation
and maintenance
Individual
Consultant
Morbi Mr. Omesh
Gandhi -
09879417065
3.5 Identification of technologies/equipments for DPR preparation
3.5.1 Justification for Technologies Identified for DPR Preparation
Sr. List of technologies for DPR
Preparation
Justification for selection of technologies
1. Installation of variable frequency
drive (VFD) in Ball Mills and
Blunger resulting in saving in
electricity consumption in Ball
Mills and Blungers
This technology is already implemented in a
few units and savings have been achieved.
Units in Morbi are fully aware of energy
savings by installation of VFDs in kiln blower.
Its mass adaptation has already happened in
kiln blower case. Units have shown readiness
for its implementation. Further procurement
and implementation time is low.
2. Saving in Electricity Consumption in agitation section by following 3 measures:
Units must implement one of the technology, which ever is comfortable to them
2a Installation of variable frequency
drive (VFD) in motors of
agitation tanks resulting in saving
in electricity consumption of
agitation section.
Morbi Cluster is comfortable with VFDs and
its operation therefore only savings through this
measure needs to be convinced.
2b Replacement of existing standard
efficiency motors by energy
efficient motors of agitation tank
resulting in saving in electricity
consumption in agitation section
The cluster has not yet tasted energy efficient
(EE) motors and resulted energy savings.
Therefore it is important to begin with EE
motors. Here in agitators the motor size is
small (<10 kW), loading is varying (35% to
70%), running time is 24 hours so all the
conditions are perfectly suiting in favor of EE
motors. Some of the Industrialists have
indicated that they may not Implement this
technology in existing plant as the investment
has been already made but they will definitely

Manual on Energy Conservation Measures in Ceramic Industry
68 of 96
Sr. List of technologies for DPR
Preparation
Justification for selection of technologies
consider implementation of EE motors in new
plants. There are about 50 new plants coming
up at Morbi. Incremental payback for
installation of new EE motor is very less.
2c Implementation of ON - OFF
system (10 minutes ON and 5
minutes OFF) for agitation motors
results in saving in electricity
consumption of agitation section
This control is already in use in some of the
ceramic industries. Cost for implementation of
this technology is negligible as compared to the
savings achieved; therefore this control
mechanism could be picked up very fast for
implementation in Morbi ceramic cluster.
3. Improvement in kiln, spray dryer
and other hot surface insulation
resulting in saving in respective
fuel consumption
As a routine maintenance insulation levels must
be regularly checked. If timely corrective
measure is not taken then the losses will go up
over a period of time. So it is not an option.
This measure can be implemented during
annual shut down. For implementation of this
measure, creating the awareness is required.
Loss quantification due to poor insulation
needs to be explained by the LSP to the unit
owners then the unit owners will definitely be
going to implement insulation improvement as
a regular maintenance activity.
4. Monitory saving in electricity bill
due to increase in PF rebate and
MD charges reduction by power
factor improvement through
installation of capacitors & APFC
panel
This is the simplest and widely accepted
measure for energy cost reduction in all the
industries. Many of the units have installed
capacitors and APFC panel however due to
lack of technical understanding of PF,
monitoring of PF is not adequate. Many of the
unit owners did not know the amount of benefit
by power factor improvement. They just knew
that there is incentive provided by GEB but
how much is not known. After increase in
awareness, the understanding on PF is
improving how ever this measure has to be
taken as a specific measure till the results are
not achieved on sustained basis. Periodical
checking of the de-rated capacitors and their
replacement is must. Its not that the APFC is
installed and the job of PF management is fully
done.
5. Preheating of input slurry of spray
dryer through solar energy
resulting in saving in spray dryer
fuel consumption
This is the most feasible renewable energy
project for the cluster. Even though the cost of
implementation of this technology is high but
due to the subsidies available by MNRE for
implementation and possible CDM benefits
through POA or bundled CDM project, unit
owners may think to implement this project.

Manual on Energy Conservation Measures in Ceramic Industry
69 of 96
Sr. List of technologies for DPR
Preparation
Justification for selection of technologies
6. Use of exhaust smoke air of kiln
to preheat the combustion air in
kiln through recuperator thereby
resulting in saving in fuel
consumption in the kiln
Presently, unit owners do not think of using
this technology due to sulphur content and
moisture presence in flue gas as the
recuperators get corroded. But if right grade of
Stainless Steel is used for manufacturing the
recuperator and instead of fabricating it if it is
procured from the established and proven
supplier life of the recuperator can definitely be
increased. So the manner of implementing this
project needs to be changed. After creating the
awareness on how to implement this
technology so that the life of the recuperator
could be achieved for about 5 to 6 years and the
vendor keeping the cost within reach do that
lower payback period could be achieved – can
be the right conditions for acceptance of the
technology. After every 5 to 6 years the
recuperator could be replaced.
7. Installation of variable frequency
drive on hydraulic press motors
resulting in saving in electricity
consumption in press section
This technology is already implemented in
some of the ceramic units. If proper awareness
is created increased adaptation will occur. As
the savings are proved on the shop floor, more
units will implement the project.
8. Installation of briquette fired hot
air generator which supplies hot
air for kiln firing, dryer and spray
dryer firing
This is an interesting concept in which savings
will occur because of price difference in fuels.
This is the reason why most of units are using
solid fuel in spray dryer where as (because of
product quality issue) most of units use NG in
the kiln. Air which is required for combustion
can be pre-heated in hot air generator by using
solid fuel (as it is available at cheaper rate). If
proper awareness is created on this concept the
unit owners may find it interesting for
implementation.
9. Installation of Natural Gas
Turbine for Electricity Generation
and use of exhaust flue gas of
turbine in spray dryer resulting in
elimination of fuel in spray dryer
and reducing overall energy cost
Implementation of this technology may take
time as the investment is high also payback
period is high but overall saving potential is
very high. Units in Morbi have already started
exploring this option. It is expected that a few
installation of GT can occur in near future,
looking at these installations others will follows
soon.
10. Installation of Natural Gas Engine
for electricity generation and
using the exhaust flue gas in spray
dryer resulting saving in spray
dryer fuel cost
This option has comparatively less capital cost.
Many NG based cogeneration systems are
already operating in Gujarat in variety of
industries. Though technically GT suits more
for ceramic industry but looking at cost and
easier operational intricacies NG based co-

Manual on Energy Conservation Measures in Ceramic Industry
70 of 96
Sr. List of technologies for DPR
Preparation
Justification for selection of technologies
generation is also recommended for the cluster.
Any one or both picks up in the cluster its good
for the cluster.
11. Use of energy efficient motors for
polishing line results in saving in
electricity consumption in
polishing section.
The cluster has not yet tasted energy efficient
(EE) motors and resulted energy savings.
Therefore it is important to begin with EE
motors. Polishing motors in vitrified tile plants
consume 40% to 45% of electricity. Therefore
saving potential from this technology is very
high. Here Some of the Industrialists have
indicated that they may not be able to
Implement this technology in their existing
plants as the investment has been already made
but they will definitely consider
implementation of EE motors in new plants.
There are about 50 new plants coming up at
Morbi. Incremental payback for installation of
new EE motor is very less.
12. Installation of low thermal mass
cars in tunnel kiln for sanitary
wares resulting in saving in fuel
consumption in kiln
As this concept is already in use in some of the
sanitary wares units at Morbi itself, further
improvement in awareness can enhance the
adaptation. The unit owners are expected to
implement this measure after knowing the
savings and investment.
13. Installation of recuperator in
tunnel kiln thereby preheating
combustion air through smoke air
resulting in saving in fuel
consumption in kiln
It’s a proven measure, already in existence in
ceramic units outside Morbi. Once this
technology is implemented at one place or once
a unit gets convinced about the savings
achieved by this technology, its implementation
will start, which will be followed by others as
in this project investment is less.
14. Use of hot air of cooling zone of
tunnel kiln as combustion air
resulting in saving in fuel
consumption in kiln
This technology is already in use in some units.
Also it requires very less investment and the
savings achieved is large. Therefore, many of
the sanitary ware units will implement this
technology.
15. Use of hot air of final cooling of
tunnel kiln for preheating the
input material resulting in saving
in fuel consumption in kiln
This practice is already applied in some of the
vitrified tiles units. The same needs to be
brought to sanitary ware units. Once proper
awareness is created, saving potential and
investment required are understood, the units
will definitely implement this project.

Manual on Energy Conservation Measures in Ceramic Industry
71 of 96
3.6 ENVIRONMENTAL BENEFITS
Sr. List of technologies for DPR
Preparation
Environmental
Benefits
(reduction in
GHG emission
TCO2/year)
Reduction in
NOx, SOx,
1. Installation of variable frequency drive
(VFD) in Ball Mills and Blunger resulting
in saving in electricity consumption in the
ball mills and blungers
53,682 Nominal
2 Installation of variable frequency drive
(VFD) in motors of agitation system
resulting in saving in electricity
consumption of agitation section
8,890 Nominal
3 Replacement of existing motors by Energy
Efficient motors of agitation section
resulting in saving in electricity
consumption in agitation section
10,637 Nominal
4 Implementation of ON - OFF system (10
minutes ON and 5 minutes OFF) for
agitation motors resulting in saving in
electricity consumption in agitation
section
17,443 Nominal
5 Improvement in kiln and other thermal
insulation resulting in saving in fuel
consumption in kiln
58,749 Nominal
6 Saving in Rs. in electricity bill by power
factor improvement through installation of
capacitors & APFC panel
- NA
7 Preheating of input slurry of spray dryer
through solar energy resulting in saving in
spray dryer fuel consumption
75,940 Nominal
8 Use of exhaust smoke air of kiln to preheat
the combustion air in ceramic tiles kiln
through recuperator thereby resulting in
saving in fuel consumption in kiln
189,539 Nominal
9 Installation of variable frequency drive on
press hydraulic motors resulting in saving
in electricity consumption in press section
67,069 Nominal
10 Installation of briquette fired hot air
generator which supplies hot air for kiln
firing, dryer, spray dryer firing
62,500 NA
11 Installation of Natural Gas Turbine for
Electricity Generation and use of exhaust
flue gas of turbine in spray dryer resulting
in elimination of fuel in spray dryer
210,750 Nominal
12 Installation of Natural Gas Engine for
Electricity Generation and use of exhaust
200,000 Nominal
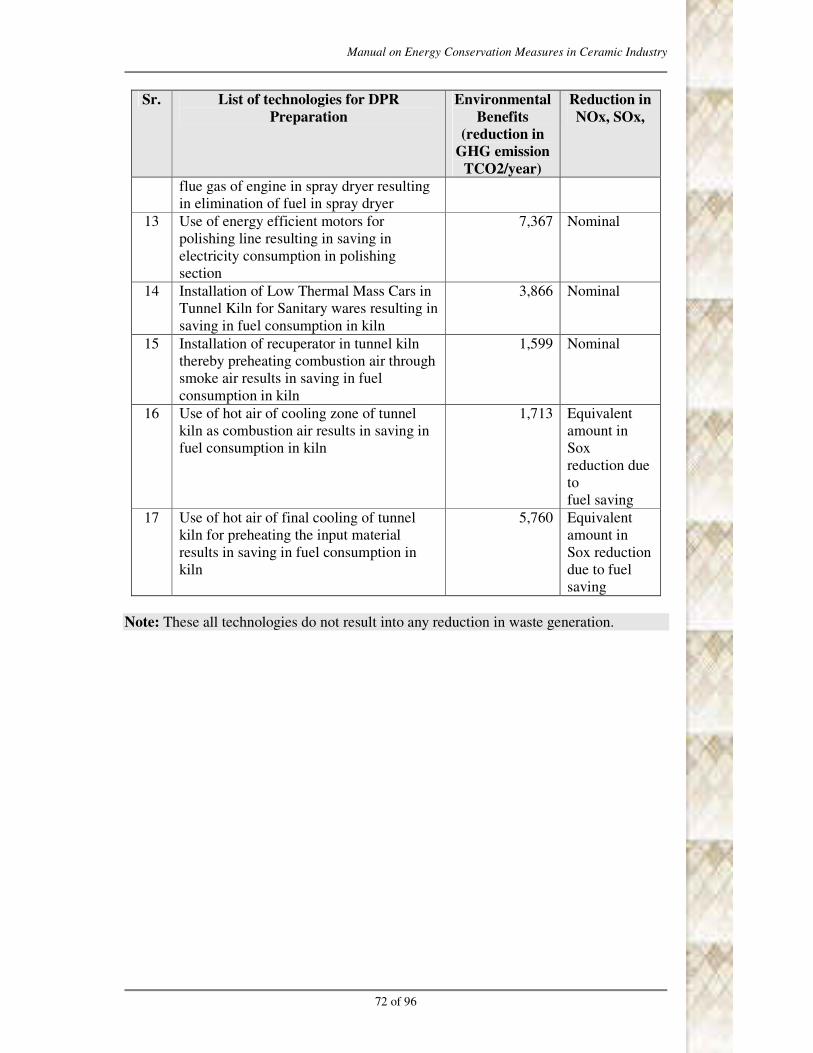
Manual on Energy Conservation Measures in Ceramic Industry
72 of 96
Sr. List of technologies for DPR
Preparation
Environmental
Benefits
(reduction in
GHG emission
TCO2/year)
Reduction in
NOx, SOx,
flue gas of engine in spray dryer resulting
in elimination of fuel in spray dryer
13 Use of energy efficient motors for
polishing line resulting in saving in
electricity consumption in polishing
section
7,367 Nominal
14 Installation of Low Thermal Mass Cars in
Tunnel Kiln for Sanitary wares resulting in
saving in fuel consumption in kiln
3,866 Nominal
15 Installation of recuperator in tunnel kiln
thereby preheating combustion air through
smoke air results in saving in fuel
consumption in kiln
1,599 Nominal
16 Use of hot air of cooling zone of tunnel
kiln as combustion air results in saving in
fuel consumption in kiln
1,713 Equivalent
amount in
Sox
reduction due
to
fuel saving
17 Use of hot air of final cooling of tunnel
kiln for preheating the input material
results in saving in fuel consumption in
kiln
5,760
Equivalent
amount in
Sox reduction
due to fuel
saving
Note: These all technologies do not result into any reduction in waste generation.
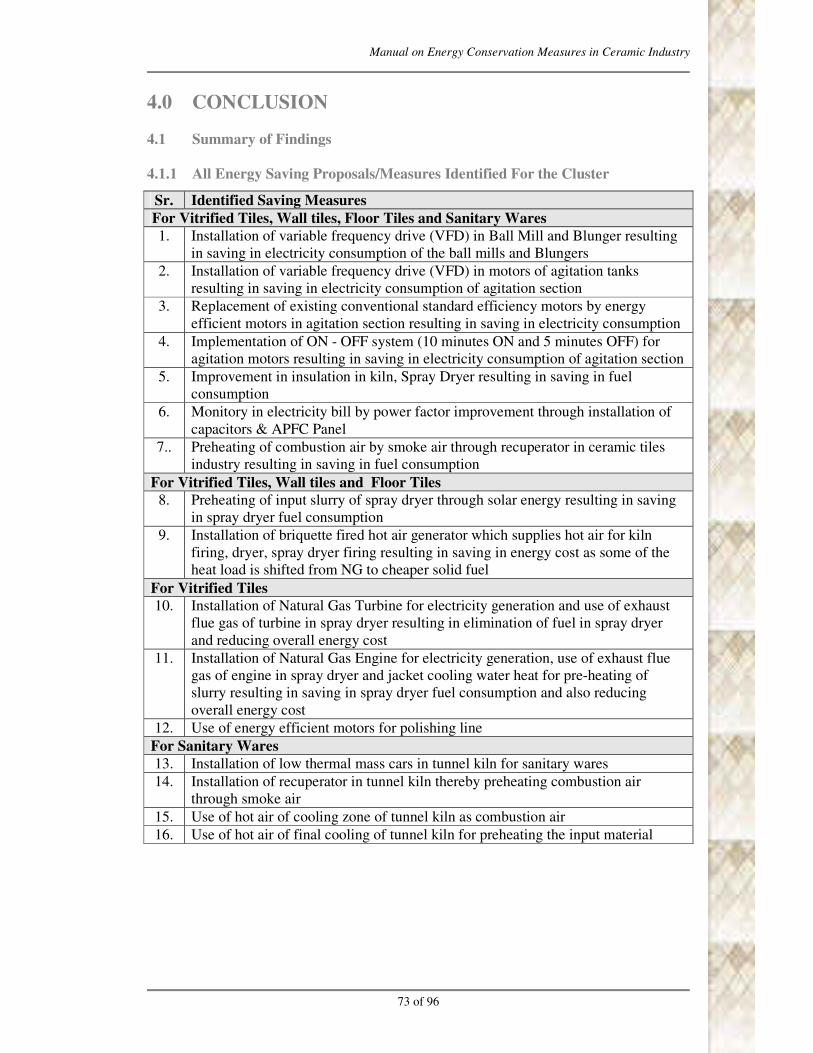
Manual on Energy Conservation Measures in Ceramic Industry
73 of 96
4.0 CONCLUSION
4.1 Summary of Findings
4.1.1 All Energy Saving Proposals/Measures Identified For the Cluster
Sr. Identified Saving Measures
For Vitrified Tiles, Wall tiles, Floor Tiles and Sanitary Wares
1. Installation of variable frequency drive (VFD) in Ball Mill and Blunger resulting
in saving in electricity consumption of the ball mills and Blungers
2. Installation of variable frequency drive (VFD) in motors of agitation tanks
resulting in saving in electricity consumption of agitation section
3. Replacement of existing conventional standard efficiency motors by energy
efficient motors in agitation section resulting in saving in electricity consumption
4. Implementation of ON - OFF system (10 minutes ON and 5 minutes OFF) for
agitation motors resulting in saving in electricity consumption of agitation section
5. Improvement in insulation in kiln, Spray Dryer resulting in saving in fuel
consumption
6. Monitory in electricity bill by power factor improvement through installation of
capacitors & APFC Panel
7.. Preheating of combustion air by smoke air through recuperator in ceramic tiles
industry resulting in saving in fuel consumption
For Vitrified Tiles, Wall tiles and Floor Tiles
8. Preheating of input slurry of spray dryer through solar energy resulting in saving
in spray dryer fuel consumption
9. Installation of briquette fired hot air generator which supplies hot air for kiln
firing, dryer, spray dryer firing resulting in saving in energy cost as some of the
heat load is shifted from NG to cheaper solid fuel
For Vitrified Tiles
10. Installation of Natural Gas Turbine for electricity generation and use of exhaust
flue gas of turbine in spray dryer resulting in elimination of fuel in spray dryer
and reducing overall energy cost
11. Installation of Natural Gas Engine for electricity generation, use of exhaust flue
gas of engine in spray dryer and jacket cooling water heat for pre-heating of
slurry resulting in saving in spray dryer fuel consumption and also reducing
overall energy cost
12. Use of energy efficient motors for polishing line
For Sanitary Wares
13. Installation of low thermal mass cars in tunnel kiln for sanitary wares
14. Installation of recuperator in tunnel kiln thereby preheating combustion air
through smoke air
15. Use of hot air of cooling zone of tunnel kiln as combustion air
16. Use of hot air of final cooling of tunnel kiln for preheating the input material
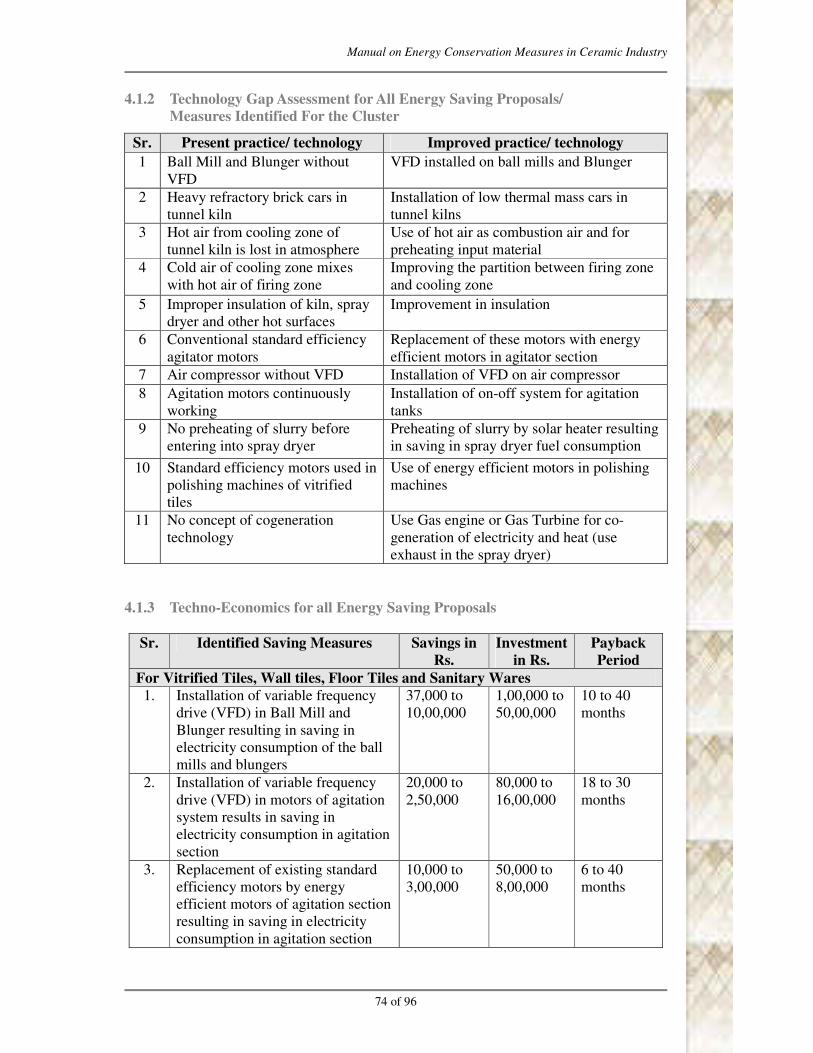
Manual on Energy Conservation Measures in Ceramic Industry
74 of 96
4.1.2 Technology Gap Assessment for All Energy Saving Proposals/
Measures Identified For the Cluster
Sr. Present practice/ technology Improved practice/ technology
1 Ball Mill and Blunger without
VFD
VFD installed on ball mills and Blunger
2 Heavy refractory brick cars in
tunnel kiln
Installation of low thermal mass cars in
tunnel kilns
3 Hot air from cooling zone of
tunnel kiln is lost in atmosphere
Use of hot air as combustion air and for
preheating input material
4 Cold air of cooling zone mixes
with hot air of firing zone
Improving the partition between firing zone
and cooling zone
5 Improper insulation of kiln, spray
dryer and other hot surfaces
Improvement in insulation
6 Conventional standard efficiency
agitator motors
Replacement of these motors with energy
efficient motors in agitator section
7 Air compressor without VFD Installation of VFD on air compressor
8 Agitation motors continuously
working
Installation of on-off system for agitation
tanks
9 No preheating of slurry before
entering into spray dryer
Preheating of slurry by solar heater resulting
in saving in spray dryer fuel consumption
10 Standard efficiency motors used in
polishing machines of vitrified
tiles
Use of energy efficient motors in polishing
machines
11 No concept of cogeneration
technology
Use Gas engine or Gas Turbine for co-
generation of electricity and heat (use
exhaust in the spray dryer)
4.1.3 Techno-Economics for all Energy Saving Proposals
Sr. Identified Saving Measures Savings in
Rs.
Investment
in Rs.
Payback
Period
For Vitrified Tiles, Wall tiles, Floor Tiles and Sanitary Wares
1. Installation of variable frequency
drive (VFD) in Ball Mill and
Blunger resulting in saving in
electricity consumption of the ball
mills and blungers
37,000 to
10,00,000
1,00,000 to
50,00,000
10 to 40
months
2. Installation of variable frequency
drive (VFD) in motors of agitation
system results in saving in
electricity consumption in agitation
section
20,000 to
2,50,000
80,000 to
16,00,000
18 to 30
months
3. Replacement of existing standard
efficiency motors by energy
efficient motors of agitation section
resulting in saving in electricity
consumption in agitation section
10,000 to
3,00,000
50,000 to
8,00,000
6 to 40
months

Manual on Energy Conservation Measures in Ceramic Industry
75 of 96
Sr. Identified Saving Measures Savings in
Rs.
Investment
in Rs.
Payback
Period
4. Implementation of ON - OFF
system (10 minutes ON and 5
minutes OFF) for agitation motors
resulting in saving in electricity
consumption of agitation section
17,000 to
2,00,000
5,000 to
1,60,000
3 to 13
months
5. Improvement in kiln, spray dryer &
other hot surfaces insulation
resulting in saving in fuel
consumption
60,000 to
15,00,000
2,00,000 to
30,00,000
20 to 36
months
6. Monitory saving in electricity bill
by power factor improvement
through installation of capacitors
3,000 to
3,40,000
5,000 to
5,49,000
4 to 48
months
For Vitrified Tiles, Wall tiles and Floor Tiles
7. Preheating of input slurry of spray
dryer through solar energy resulting
in saving in spray dryer fuel
consumption
50,000 to
21,00,000
7,00,000 to
65,00,000
4 to 7 years
8. Installation of briquette fired hot air
generator which supplies hot air for
kiln firing, dryer and spray dryer
firing
12,00,000 to
40,00,000
10,00,000
to
30,00,000
10 to 12
months
For Vitrified Tiles
9. Installation of Natural Gas Turbine
for Electricity Generation and use
of exhaust flue gas of turbine in
spray dryer resulting in elimination
of fuel in spray dryer finally
resulting in reduction in overall
energy bill
25600000 to
60700000
68000000
to
137500000
31 to 37
months
10. Installation of Natural Gas Engine
for Electricity Generation and use
of exhaust flue gas of engine in
spray dryer resulting in overall
reduction in energy bill
15700000 to
30600000
46000000
to
80000000
27 to 38
months
11. Use of energy efficient motor for
polishing line
8,00,000 to
20,00,000
16,00,000
to
27,00,000
10 to 28
months
12. Preheating of combustion air by
smoke air through recuperator in
ceramic tiles resulting in saving in
fuel consumption
2,00,000 to
40,00,000
2,50,000 to
24,00,000
5 to 30
months
For Sanitary Wares
13. Installation of low thermal mass
cars in tunnel kiln for sanitary
wares
5,50,000 to
6,80,000
16,00,000
to
20,00,000
7 to 32
months
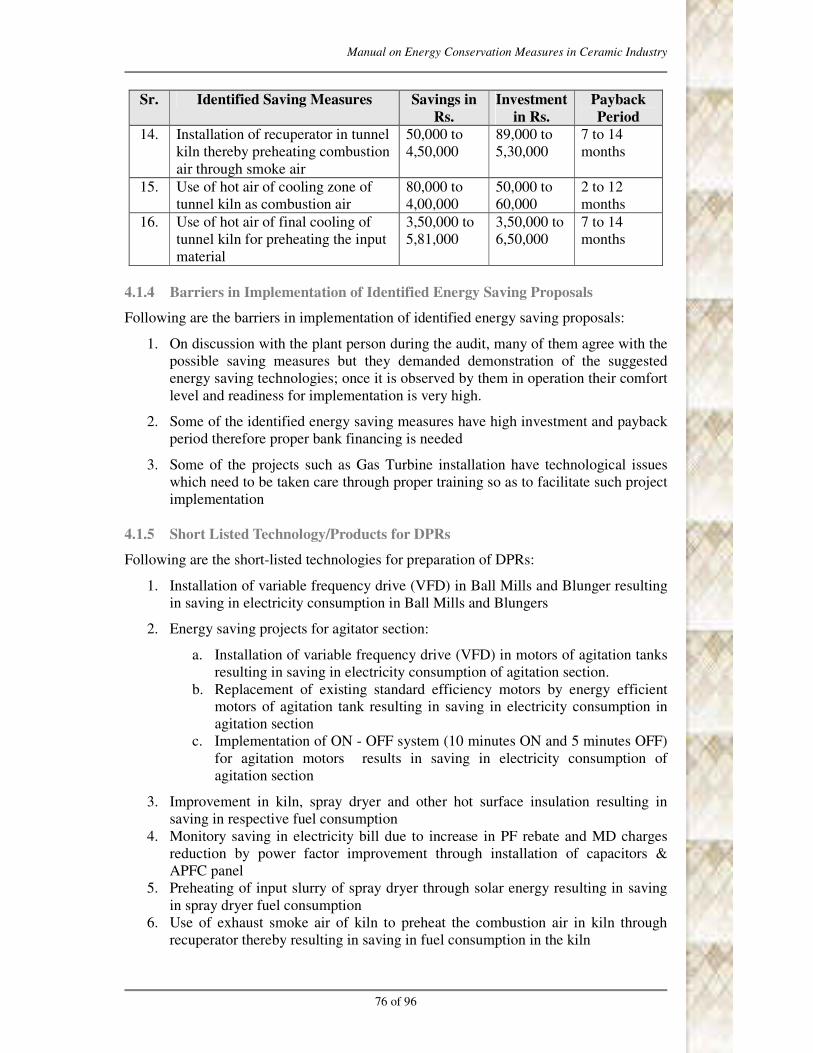
Manual on Energy Conservation Measures in Ceramic Industry
76 of 96
Sr. Identified Saving Measures Savings in
Rs.
Investment
in Rs.
Payback
Period
14. Installation of recuperator in tunnel
kiln thereby preheating combustion
air through smoke air
50,000 to
4,50,000
89,000 to
5,30,000
7 to 14
months
15. Use of hot air of cooling zone of
tunnel kiln as combustion air
80,000 to
4,00,000
50,000 to
60,000
2 to 12
months
16. Use of hot air of final cooling of
tunnel kiln for preheating the input
material
3,50,000 to
5,81,000
3,50,000 to
6,50,000
7 to 14
months
4.1.4 Barriers in Implementation of Identified Energy Saving Proposals
Following are the barriers in implementation of identified energy saving proposals:
1. On discussion with the plant person during the audit, many of them agree with the
possible saving measures but they demanded demonstration of the suggested
energy saving technologies; once it is observed by them in operation their comfort
level and readiness for implementation is very high.
2. Some of the identified energy saving measures have high investment and payback
period therefore proper bank financing is needed
3. Some of the projects such as Gas Turbine installation have technological issues
which need to be taken care through proper training so as to facilitate such project
implementation
4.1.5 Short Listed Technology/Products for DPRs
Following are the short-listed technologies for preparation of DPRs:
1. Installation of variable frequency drive (VFD) in Ball Mills and Blunger resulting
in saving in electricity consumption in Ball Mills and Blungers
2. Energy saving projects for agitator section:
a. Installation of variable frequency drive (VFD) in motors of agitation tanks
resulting in saving in electricity consumption of agitation section.
b. Replacement of existing standard efficiency motors by energy efficient
motors of agitation tank resulting in saving in electricity consumption in
agitation section
c. Implementation of ON - OFF system (10 minutes ON and 5 minutes OFF)
for agitation motors results in saving in electricity consumption of
agitation section
3. Improvement in kiln, spray dryer and other hot surface insulation resulting in
saving in respective fuel consumption
4. Monitory saving in electricity bill due to increase in PF rebate and MD charges
reduction by power factor improvement through installation of capacitors &
APFC panel
5. Preheating of input slurry of spray dryer through solar energy resulting in saving
in spray dryer fuel consumption
6. Use of exhaust smoke air of kiln to preheat the combustion air in kiln through
recuperator thereby resulting in saving in fuel consumption in the kiln
Manual on Energy Conservation Measures in Ceramic Industry
77 of 96
7. Installation of variable frequency drive on hydraulic press motors resulting in
saving in electricity consumption in press section
8. Installation of briquette fired hot air generator which supplies hot air for kiln
firing, dryer and spray dryer firing
9. Installation of Natural Gas Turbine for Electricity Generation and use of exhaust
flue gas of turbine in spray dryer resulting in elimination of fuel in spray dryer and
reducing overall energy cost
10. Installation of Natural Gas Engine for electricity generation and using the exhaust
flue gas in spray dryer resulting saving in spray dryer fuel cost
11. Use of energy efficient motors for polishing line results in saving in electricity
consumption in polishing section
12. Installation of low thermal mass cars in tunnel kiln for sanitary wares resulting in
saving in fuel consumption in kiln
13. Installation of recuperator in tunnel kiln thereby preheating combustion air
through smoke air resulting in saving in fuel consumption in kiln
14. Use of hot air of cooling zone of tunnel kiln as combustion air resulting in saving
in fuel consumption in kiln
15. Use of hot air of final cooling of tunnel kiln for preheating the input material
resulting in saving in fuel consumption in kiln
4.2 Summary of Level of Awareness on Energy Efficiency and Energy Efficient
Products in the Cluster
As compare to other SME units, at Morbi level of awareness on energy efficiency and
energy efficient products is much better. Many of the unit owners have visited the China
and Italy to see energy efficient equipments used in ceramic industries in operating
condition. Many foreign vendors also participate in the workshop held at Ahmedabad on
Indian ceramics every year to propagate their products and how it helps to save the
energy. This exhibition is attended by Morbi units. There is competitive atmosphere to
adopt energy efficiency and more productive technologies but the culture is ensuring the
result by observing the demonstration before taking a decision for executing energy
efficiency projects.
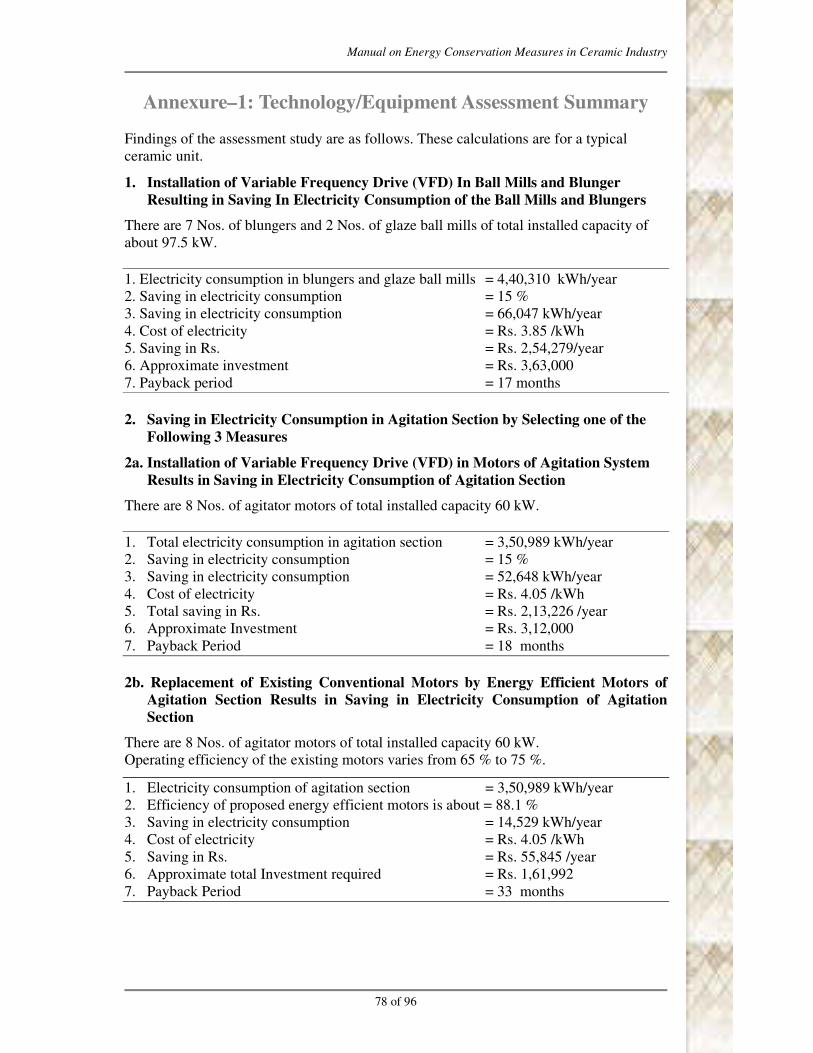
Manual on Energy Conservation Measures in Ceramic Industry
78 of 96
Annexure–1: Technology/Equipment Assessment Summary
Findings of the assessment study are as follows. These calculations are for a typical
ceramic unit.
1. Installation of Variable Frequency Drive (VFD) In Ball Mills and Blunger
Resulting in Saving In Electricity Consumption of the Ball Mills and Blungers
There are 7 Nos. of blungers and 2 Nos. of glaze ball mills of total installed capacity of
about 97.5 kW.
1. Electricity consumption in blungers and glaze ball mills = 4,40,310 kWh/year
2. Saving in electricity consumption = 15 %
3. Saving in electricity consumption = 66,047 kWh/year
4. Cost of electricity = Rs. 3.85 /kWh
5. Saving in Rs. = Rs. 2,54,279/year
6. Approximate investment = Rs. 3,63,000
7. Payback period = 17 months
2. Saving in Electricity Consumption in Agitation Section by Selecting one of the
Following 3 Measures
2a. Installation of Variable Frequency Drive (VFD) in Motors of Agitation System
Results in Saving in Electricity Consumption of Agitation Section
There are 8 Nos. of agitator motors of total installed capacity 60 kW.
1. Total electricity consumption in agitation section = 3,50,989 kWh/year
2. Saving in electricity consumption = 15 %
3. Saving in electricity consumption = 52,648 kWh/year
4. Cost of electricity = Rs. 4.05 /kWh
5. Total saving in Rs. = Rs. 2,13,226 /year
6. Approximate Investment = Rs. 3,12,000
7. Payback Period = 18 months
2b. Replacement of Existing Conventional Motors by Energy Efficient Motors of
Agitation Section Results in Saving in Electricity Consumption of Agitation
Section
There are 8 Nos. of agitator motors of total installed capacity 60 kW.
Operating efficiency of the existing motors varies from 65 % to 75 %.
1. Electricity consumption of agitation section = 3,50,989 kWh/year
2. Efficiency of proposed energy efficient motors is about = 88.1 %
3. Saving in electricity consumption = 14,529 kWh/year
4. Cost of electricity = Rs. 4.05 /kWh
5. Saving in Rs. = Rs. 55,845 /year
6. Approximate total Investment required = Rs. 1,61,992
7. Payback Period = 33 months
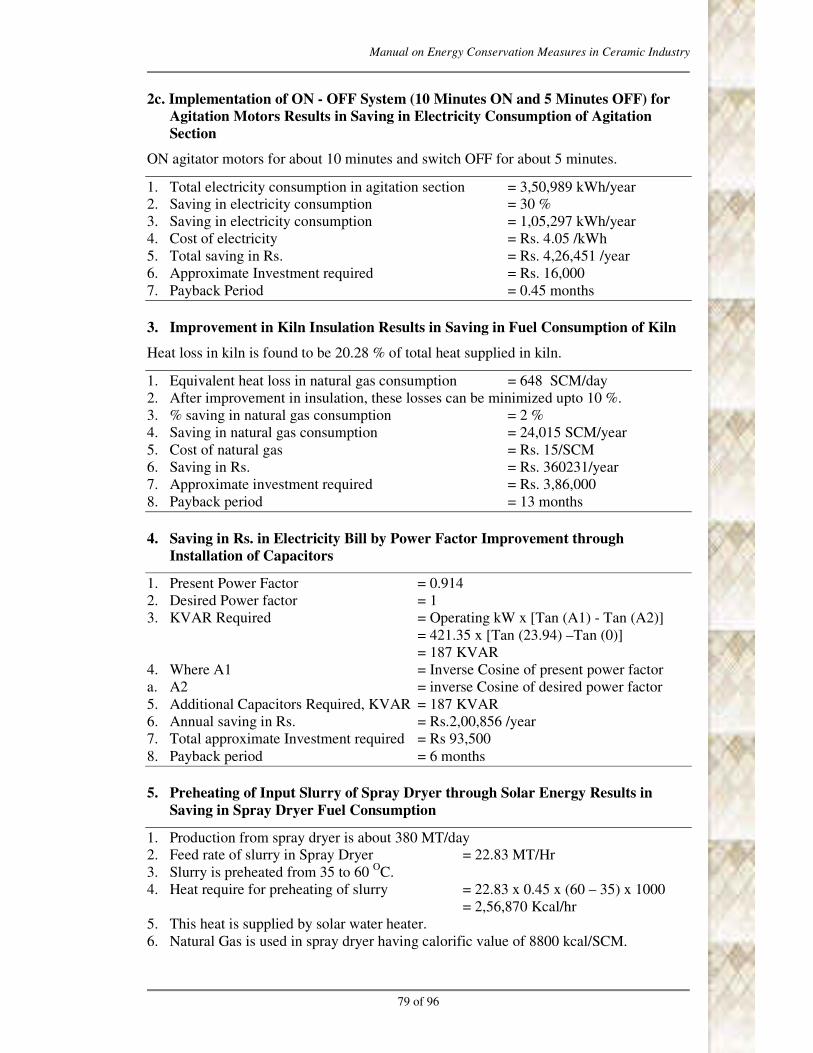
Manual on Energy Conservation Measures in Ceramic Industry
79 of 96
2c. Implementation of ON - OFF System (10 Minutes ON and 5 Minutes OFF) for
Agitation Motors Results in Saving in Electricity Consumption of Agitation
Section
ON agitator motors for about 10 minutes and switch OFF for about 5 minutes.
1. Total electricity consumption in agitation section = 3,50,989 kWh/year
2. Saving in electricity consumption = 30 %
3. Saving in electricity consumption = 1,05,297 kWh/year
4. Cost of electricity = Rs. 4.05 /kWh
5. Total saving in Rs. = Rs. 4,26,451 /year
6. Approximate Investment required = Rs. 16,000
7. Payback Period = 0.45 months
3. Improvement in Kiln Insulation Results in Saving in Fuel Consumption of Kiln
Heat loss in kiln is found to be 20.28 % of total heat supplied in kiln.
1. Equivalent heat loss in natural gas consumption = 648 SCM/day
2. After improvement in insulation, these losses can be minimized upto 10 %.
3. % saving in natural gas consumption = 2 %
4. Saving in natural gas consumption = 24,015 SCM/year
5. Cost of natural gas = Rs. 15/SCM
6. Saving in Rs. = Rs. 360231/year
7. Approximate investment required = Rs. 3,86,000
8. Payback period = 13 months
4. Saving in Rs. in Electricity Bill by Power Factor Improvement through
Installation of Capacitors
1. Present Power Factor = 0.914
2. Desired Power factor = 1
3. KVAR Required = Operating kW x [Tan (A1) - Tan (A2)]
= 421.35 x [Tan (23.94) –Tan (0)]
= 187 KVAR
4. Where A1 = Inverse Cosine of present power factor
a. A2 = inverse Cosine of desired power factor
5. Additional Capacitors Required, KVAR = 187 KVAR
6. Annual saving in Rs. = Rs.2,00,856 /year
7. Total approximate Investment required = Rs 93,500
8. Payback period = 6 months
5. Preheating of Input Slurry of Spray Dryer through Solar Energy Results in
Saving in Spray Dryer Fuel Consumption
1. Production from spray dryer is about 380 MT/day
2. Feed rate of slurry in Spray Dryer = 22.83 MT/Hr
3. Slurry is preheated from 35 to 60 OC.
4. Heat require for preheating of slurry = 22.83 x 0.45 x (60 – 35) x 1000
= 2,56,870 Kcal/hr
5. This heat is supplied by solar water heater.
6. Natural Gas is used in spray dryer having calorific value of 8800 kcal/SCM.
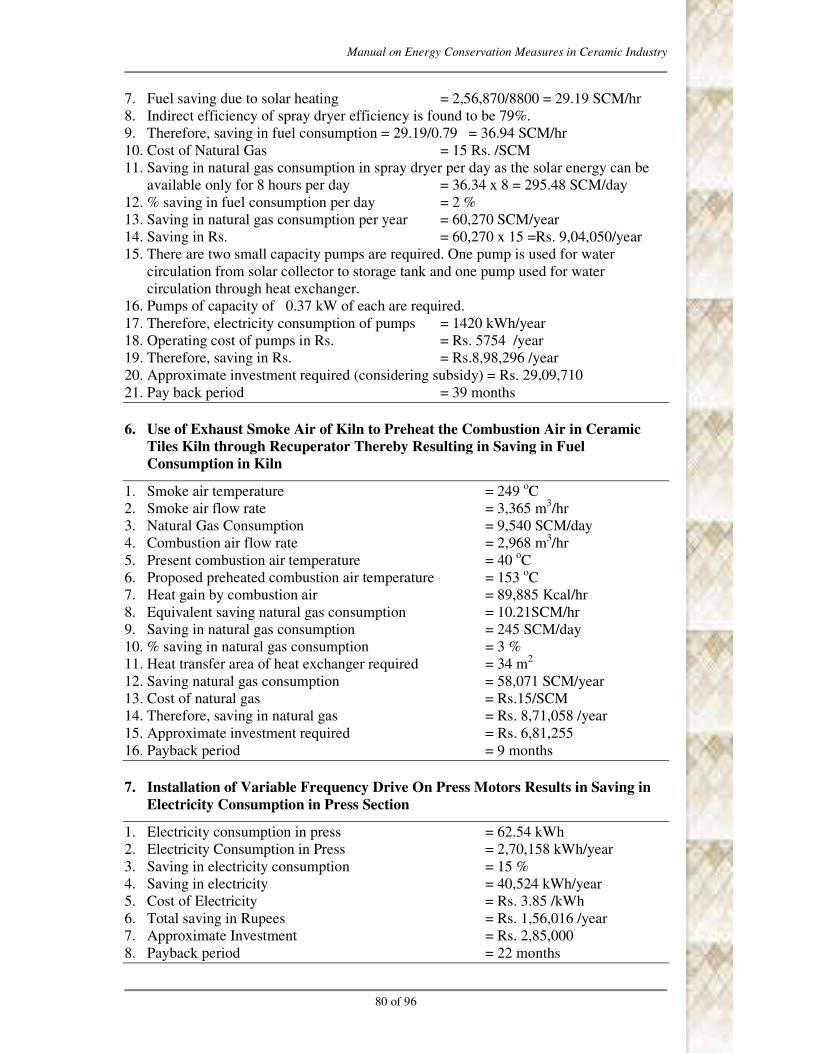
Manual on Energy Conservation Measures in Ceramic Industry
80 of 96
7. Fuel saving due to solar heating = 2,56,870/8800 = 29.19 SCM/hr
8. Indirect efficiency of spray dryer efficiency is found to be 79%.
9. Therefore, saving in fuel consumption = 29.19/0.79 = 36.94 SCM/hr
10. Cost of Natural Gas = 15 Rs. /SCM
11. Saving in natural gas consumption in spray dryer per day as the solar energy can be
available only for 8 hours per day = 36.34 x 8 = 295.48 SCM/day
12. % saving in fuel consumption per day = 2 %
13. Saving in natural gas consumption per year = 60,270 SCM/year
14. Saving in Rs. = 60,270 x 15 =Rs. 9,04,050/year
15. There are two small capacity pumps are required. One pump is used for water
circulation from solar collector to storage tank and one pump used for water
circulation through heat exchanger.
16. Pumps of capacity of 0.37 kW of each are required.
17. Therefore, electricity consumption of pumps = 1420 kWh/year
18. Operating cost of pumps in Rs. = Rs. 5754 /year
19. Therefore, saving in Rs. = Rs.8,98,296 /year
20. Approximate investment required (considering subsidy) = Rs. 29,09,710
21. Pay back period = 39 months
6. Use of Exhaust Smoke Air of Kiln to Preheat the Combustion Air in Ceramic
Tiles Kiln through Recuperator Thereby Resulting in Saving in Fuel
Consumption in Kiln
1. Smoke air temperature = 249 oC
2. Smoke air flow rate = 3,365 m3/hr
3. Natural Gas Consumption = 9,540 SCM/day
4. Combustion air flow rate = 2,968 m3/hr
5. Present combustion air temperature = 40 oC
6. Proposed preheated combustion air temperature = 153 oC
7. Heat gain by combustion air = 89,885 Kcal/hr
8. Equivalent saving natural gas consumption = 10.21SCM/hr
9. Saving in natural gas consumption = 245 SCM/day
10. % saving in natural gas consumption = 3 %
11. Heat transfer area of heat exchanger required = 34 m2
12. Saving natural gas consumption = 58,071 SCM/year
13. Cost of natural gas = Rs.15/SCM
14. Therefore, saving in natural gas = Rs. 8,71,058 /year
15. Approximate investment required = Rs. 6,81,255
16. Payback period = 9 months
7. Installation of Variable Frequency Drive On Press Motors Results in Saving in
Electricity Consumption in Press Section
1. Electricity consumption in press = 62.54 kWh
2. Electricity Consumption in Press = 2,70,158 kWh/year
3. Saving in electricity consumption = 15 %
4. Saving in electricity = 40,524 kWh/year
5. Cost of Electricity = Rs. 3.85 /kWh
6. Total saving in Rupees = Rs. 1,56,016 /year
7. Approximate Investment = Rs. 2,85,000
8. Payback period = 22 months
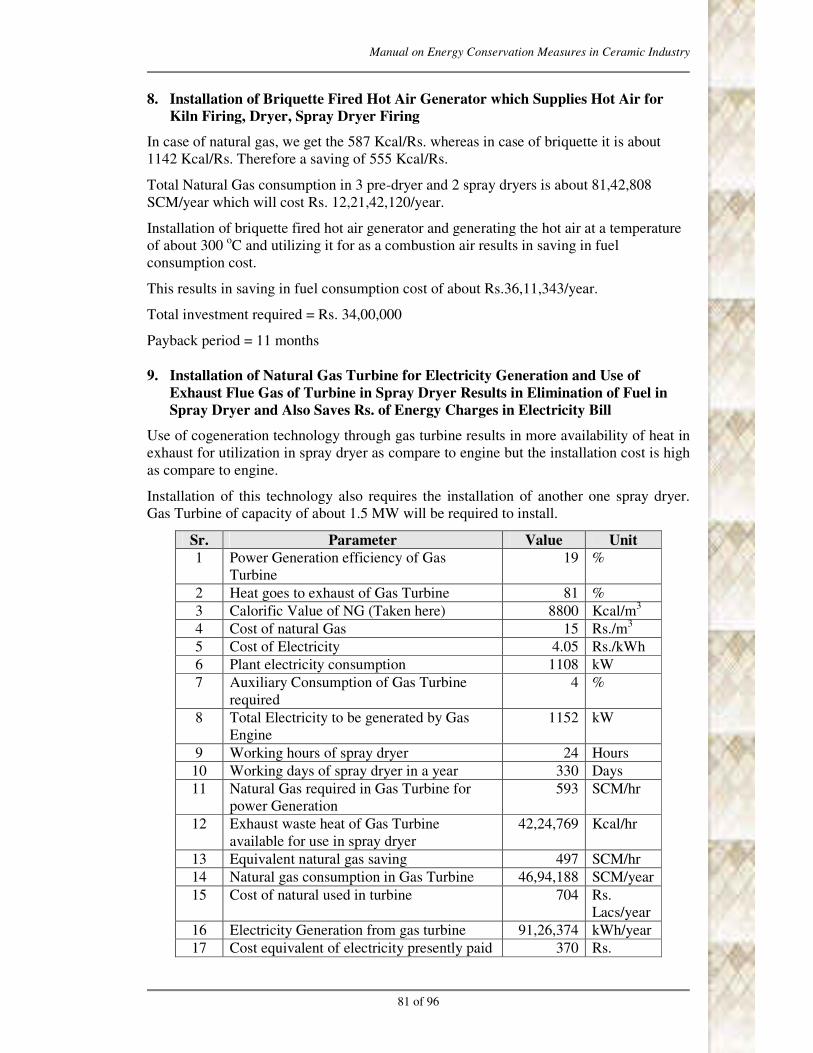
Manual on Energy Conservation Measures in Ceramic Industry
81 of 96
8. Installation of Briquette Fired Hot Air Generator which Supplies Hot Air for
Kiln Firing, Dryer, Spray Dryer Firing
In case of natural gas, we get the 587 Kcal/Rs. whereas in case of briquette it is about
1142 Kcal/Rs. Therefore a saving of 555 Kcal/Rs.
Total Natural Gas consumption in 3 pre-dryer and 2 spray dryers is about 81,42,808
SCM/year which will cost Rs. 12,21,42,120/year.
Installation of briquette fired hot air generator and generating the hot air at a temperature
of about 300 oC and utilizing it for as a combustion air results in saving in fuel
consumption cost.
This results in saving in fuel consumption cost of about Rs.36,11,343/year.
Total investment required = Rs. 34,00,000
Payback period = 11 months
9. Installation of Natural Gas Turbine for Electricity Generation and Use of
Exhaust Flue Gas of Turbine in Spray Dryer Results in Elimination of Fuel in
Spray Dryer and Also Saves Rs. of Energy Charges in Electricity Bill
Use of cogeneration technology through gas turbine results in more availability of heat in
exhaust for utilization in spray dryer as compare to engine but the installation cost is high
as compare to engine.
Installation of this technology also requires the installation of another one spray dryer.
Gas Turbine of capacity of about 1.5 MW will be required to install.
Sr. Parameter Value Unit
1 Power Generation efficiency of Gas
Turbine
19 %
2 Heat goes to exhaust of Gas Turbine 81 %
3 Calorific Value of NG (Taken here) 8800 Kcal/m3
4 Cost of natural Gas 15 Rs./m3
5 Cost of Electricity 4.05 Rs./kWh
6 Plant electricity consumption 1108 kW
7 Auxiliary Consumption of Gas Turbine
required
4 %
8 Total Electricity to be generated by Gas
Engine
1152 kW
9 Working hours of spray dryer 24 Hours
10 Working days of spray dryer in a year 330 Days
11 Natural Gas required in Gas Turbine for
power Generation
593 SCM/hr
12 Exhaust waste heat of Gas Turbine
available for use in spray dryer
42,24,769 Kcal/hr
13 Equivalent natural gas saving 497 SCM/hr
14 Natural gas consumption in Gas Turbine 46,94,188 SCM/year
15 Cost of natural used in turbine 704 Rs.
Lacs/year
16 Electricity Generation from gas turbine 91,26,374 kWh/year
17 Cost equivalent of electricity presently paid 370 Rs.

Manual on Energy Conservation Measures in Ceramic Industry
82 of 96
Sr. Parameter Value Unit
Lacs/year
18 Equivalent natural gas saving 3936491 SCM/year
19 Cost of natural gas saving 590 Rs.
Lacs/year
20. Saving in Rs. 256 Rs.
Lacs/year
21. Total approximate investment required 680 Rs. Lacs
22. Payback period 32 months
10. Installation of Natural Gas Engine for Electricity Generation and Use of Exhaust
Flue Gas of Engine in Spray Dryer Results in Elimination of Fuel in Spray Dryer
and Also Saves Rs. of Energy Charges in Electricity Bill.
Use of cogeneration technology reduces energy consumption cost of plant. Here, we
propose the natural gas fired gas engine of 1.36 MW. Exhaust heat of gas engine should
be used in spray dryer.
For installation of this technology, another spray will also require to be install because the
present spray dryer runs 15 - 20 days in a month and then require maintenance work.
After implementation of this technology, as one spray dryer is under maintenance then we
can run the second spray dryer. This will increase the production of the plant also.
Sr. Parameter Value Unit
1 Power Generation efficiency of Gas Engine 40 %
2 Heat goes to exhaust of Gas Engine 30 %
3 Heat loss due to jacket cooling 20 %
4 Calorific Value of NG (Taken here) 8800 Kcal/m3
5 Cost of natural Gas 15 Rs./m3
6 Cost of Electricity 4.05 Rs./kWh
7 Plant electricity consumption 1108 kW
8 Auxiliary Consumption of Gas engine
required
3 %
9 Total Electricity to be generated by Gas
Engine
1141 kW
10 Working hours of spray dryer 24 Hours
11 Working days of spray dryer in a year 330 Days
12 Natural Gas required in Gas Engine for
power Generation
279 SCM/hr
13 Exhaust waste heat of gas engine available
for use in spray dryer
736100 Kcal/hr
14 Equivalent natural gas saving 84 SCM/hr
15 Heat loss due to jacket cooling can be
recovered for preheating air
10 %
16 Heat of jacket cooling can be utilized for air
preheating
245367 Kcal/hr
17 Equivalent natural gas saving 28 SCM/hr
18 Total natural gas saving due to use of both
the heat sources
112 SCM/hr
19 Natural gas consumption in Gas Engine 22,08,299 SCM/year

Manual on Energy Conservation Measures in Ceramic Industry
83 of 96
Sr. Parameter Value Unit
20 Cost of natural used in engine 331 Rs.
Lacs/year
21 Electricity Generation from gas engine 87,75,360 kWh/year
22 Cost equivalent of electricity presently paid 355 Rs.
Lacs/year
23 Equivalent natural gas saving 8,83,320 SCM/year
24 Cost of natural gas saving 132 Rs.
Lacs/year
25. Saving in Rs. 157 Rs.
Lacs/year
26. Total approximate investment required 460 Rs. Lacs
27. Payback period 35 months
11. Use of Energy Efficient Motors for Polishing Line Results in Saving in
Electricity Consumption in Polishing Section
Polishing section is the major electricity consuming section in vitrified tiles industry.
About 40 - 50 % of electricity out of total is consumed by the polishing section.
During electrical measurements at the audit period, it was observed that the loading of the
machines of polishing section is less than 50 %. Efficiency of motors decreases with the
decreasing in loading of motors.
Also the motors installed on the polishing machines are of rated efficiency of about 85 %
only. Therefore, there is more scope of saving by replacement of the existing
conventional motors of the polishing machines by the energy efficient motors.
Sr.
No.
Equipment
Name
Connected
load, kW
Measured
Machine
kW
Electricity
Consumption,
kWh/year
Saving in
Electricity
Consumption,
kWh/year
1 Rough Grinding 96.56 46.2 199,584 70,042
2 Calibration 1 118.32 47.51 205,258 61,177
3 Calibration 2 118.32 33.28 143,798 38,986
4 Polishing 1 174.4 50.95 220,118 94,932
5 Polishing 2 174.4 100.4 433,728 117,387
6 Polishing 3 174.4 129.7 504,274 70,581
7 Sizing 114.72 93.06 402,048 49,803
TOTAL 971.12 501.1 2,108,808 502,908
1. Total electricity consumption of polishing section = 2108808 kWh/year
2. Saving in electricity consumption of polishing section = 5,02,908 kWh/year
3. Cost of electricity = Rs. 4.05 /kWh
4. Saving in Rs. = Rs.20,36,776/year
5. Approximate investment required = Rs.20,21,396
6. Payback Period = 12 months
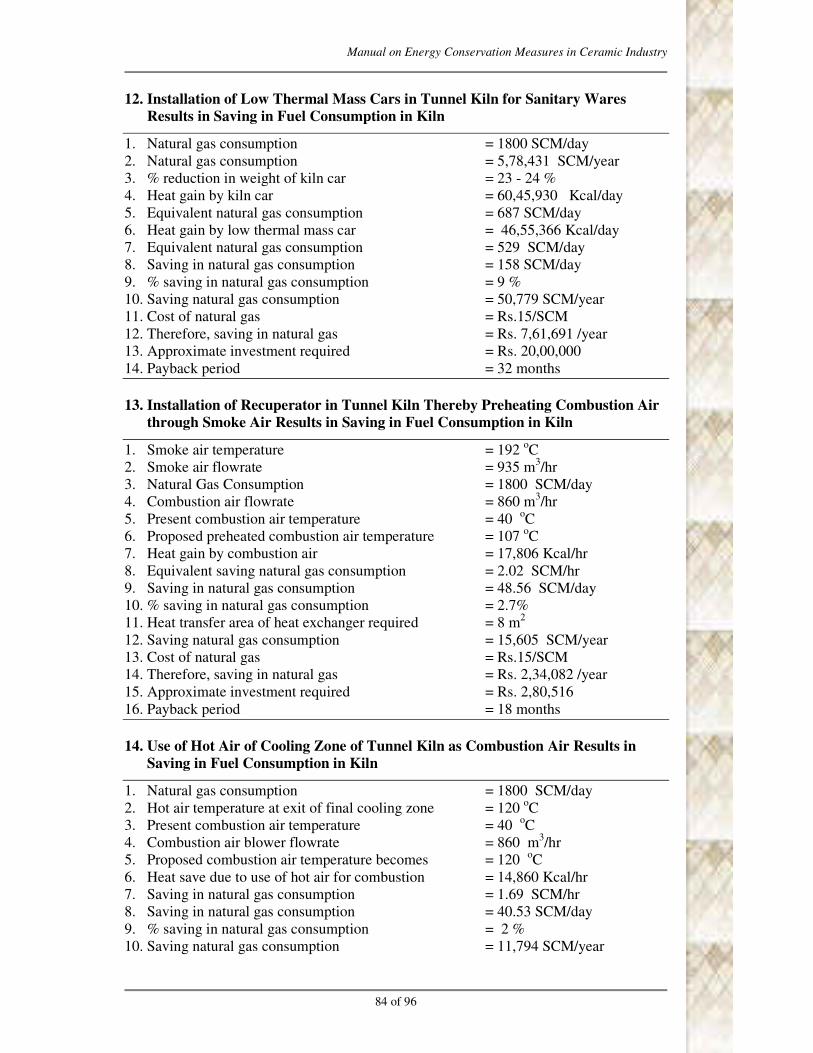
Manual on Energy Conservation Measures in Ceramic Industry
84 of 96
12. Installation of Low Thermal Mass Cars in Tunnel Kiln for Sanitary Wares
Results in Saving in Fuel Consumption in Kiln
1. Natural gas consumption = 1800 SCM/day
2. Natural gas consumption = 5,78,431 SCM/year
3. % reduction in weight of kiln car = 23 - 24 %
4. Heat gain by kiln car = 60,45,930 Kcal/day
5. Equivalent natural gas consumption = 687 SCM/day
6. Heat gain by low thermal mass car = 46,55,366 Kcal/day
7. Equivalent natural gas consumption = 529 SCM/day
8. Saving in natural gas consumption = 158 SCM/day
9. % saving in natural gas consumption = 9 %
10. Saving natural gas consumption = 50,779 SCM/year
11. Cost of natural gas = Rs.15/SCM
12. Therefore, saving in natural gas = Rs. 7,61,691 /year
13. Approximate investment required = Rs. 20,00,000
14. Payback period = 32 months
13. Installation of Recuperator in Tunnel Kiln Thereby Preheating Combustion Air
through Smoke Air Results in Saving in Fuel Consumption in Kiln
1. Smoke air temperature = 192 oC
2. Smoke air flowrate = 935 m3/hr
3. Natural Gas Consumption = 1800 SCM/day
4. Combustion air flowrate = 860 m3/hr
5. Present combustion air temperature = 40 oC
6. Proposed preheated combustion air temperature = 107 oC
7. Heat gain by combustion air = 17,806 Kcal/hr
8. Equivalent saving natural gas consumption = 2.02 SCM/hr
9. Saving in natural gas consumption = 48.56 SCM/day
10. % saving in natural gas consumption = 2.7%
11. Heat transfer area of heat exchanger required = 8 m2
12. Saving natural gas consumption = 15,605 SCM/year
13. Cost of natural gas = Rs.15/SCM
14. Therefore, saving in natural gas = Rs. 2,34,082 /year
15. Approximate investment required = Rs. 2,80,516
16. Payback period = 18 months
14. Use of Hot Air of Cooling Zone of Tunnel Kiln as Combustion Air Results in
Saving in Fuel Consumption in Kiln
1. Natural gas consumption = 1800 SCM/day
2. Hot air temperature at exit of final cooling zone = 120 oC
3. Present combustion air temperature = 40 oC
4. Combustion air blower flowrate = 860 m3/hr
5. Proposed combustion air temperature becomes = 120 oC
6. Heat save due to use of hot air for combustion = 14,860 Kcal/hr
7. Saving in natural gas consumption = 1.69 SCM/hr
8. Saving in natural gas consumption = 40.53 SCM/day
9. % saving in natural gas consumption = 2 %
10. Saving natural gas consumption = 11,794 SCM/year

Manual on Energy Conservation Measures in Ceramic Industry
85 of 96
11. Cost of natural gas = Rs.15/SCM
12. Therefore, saving in natural gas = Rs. 1,76,908 /year
13. Approximate investment required = Rs. 50,000
14. Payback period = 3 months
15. Use of Hot Air of Final Cooling of Tunnel Kiln for Preheating the Input Material
Results in Saving in Fuel Consumption in Kiln
1. Natural gas consumption = 1800 SCM/day
2. Hot air temperature at exit of final cooling zone = 120 oC
3. Rapid cooling air blower flow rate = 2826 m3/hr
4. Ambient temperature = 40 oC
5. Heat given by the hot air to the material = 48,833 Kcal/hr
6. Equivalent saving in natural gas consumption = 5.55 SCM/hr
7. Saving in natural gas consumption = 133 SCM/day
8. % saving in natural gas consumption = 7 %
9. Saving natural gas consumption = 38,755 SCM/year
10. Cost of natural gas = Rs.15/SCM
11. Therefore, saving in natural gas = Rs. 5,81,327 /year
12. Approximate investment required = Rs. 5,00,000
13. Payback period = 10 months
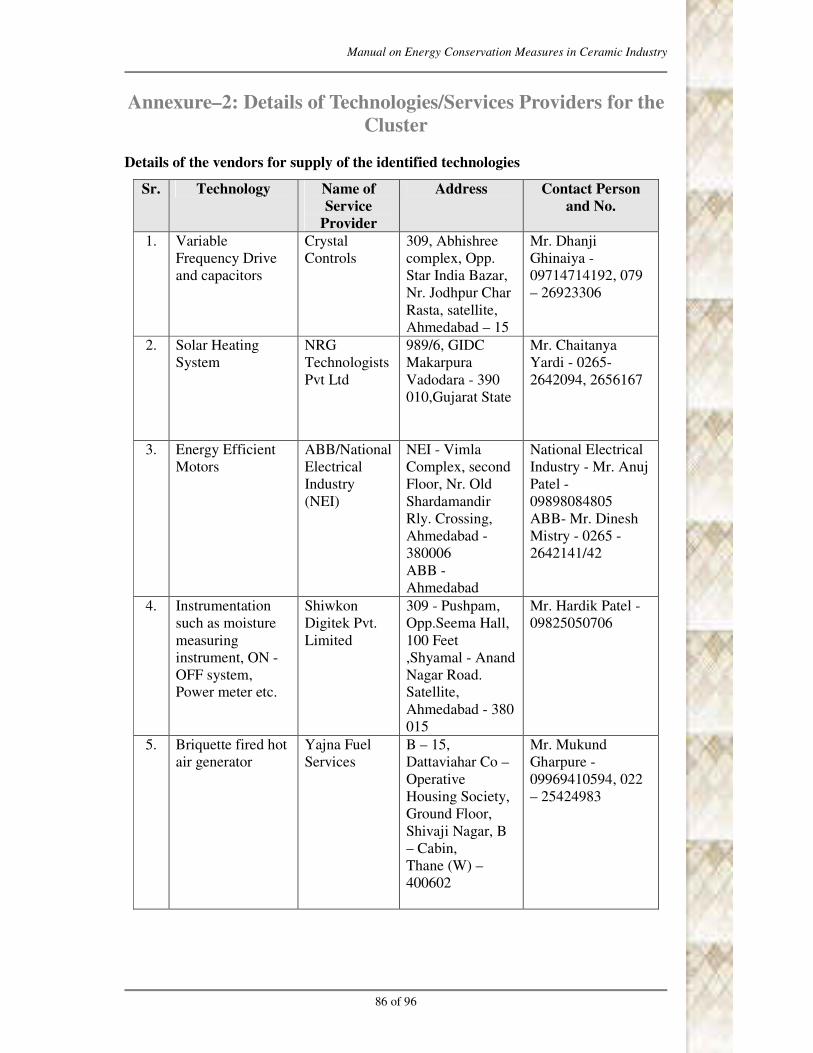
Manual on Energy Conservation Measures in Ceramic Industry
86 of 96
Annexure–2: Details of Technologies/Services Providers for the
Cluster
Details of the vendors for supply of the identified technologies
Sr. Technology Name of
Service
Provider
Address Contact Person
and No.
1. Variable
Frequency Drive
and capacitors
Crystal
Controls
309, Abhishree
complex, Opp.
Star India Bazar,
Nr. Jodhpur Char
Rasta, satellite,
Ahmedabad – 15
Mr. Dhanji
Ghinaiya -
09714714192, 079
– 26923306
2. Solar Heating
System
NRG
Technologists
Pvt Ltd
989/6, GIDC
Makarpura
Vadodara - 390
010,Gujarat State
Mr. Chaitanya
Yardi - 0265-
2642094, 2656167
3. Energy Efficient
Motors
ABB/National
Electrical
Industry
(NEI)
NEI - Vimla
Complex, second
Floor, Nr. Old
Shardamandir
Rly. Crossing,
Ahmedabad -
380006
ABB -
Ahmedabad
National Electrical
Industry - Mr. Anuj
Patel -
09898084805
ABB- Mr. Dinesh
Mistry - 0265 -
2642141/42
4. Instrumentation
such as moisture
measuring
instrument, ON -
OFF system,
Power meter etc.
Shiwkon
Digitek Pvt.
Limited
309 - Pushpam,
Opp.Seema Hall,
100 Feet
,Shyamal - Anand
Nagar Road.
Satellite,
Ahmedabad - 380
015
Mr. Hardik Patel -
09825050706
5. Briquette fired hot
air generator
Yajna Fuel
Services
B – 15,
Dattaviahar Co –
Operative
Housing Society,
Ground Floor,
Shivaji Nagar, B
– Cabin,
Thane (W) –
400602
Mr. Mukund
Gharpure -
09969410594, 022
– 25424983

Manual on Energy Conservation Measures in Ceramic Industry
87 of 96
Sr. Technology Name of
Service
Provider
Address Contact Person
and No.
6. Gas Engine Green Power
International
Pvt. Ltd.,
Wartsila India
Ltd.
Cummins
E – 12/A, Sector
– 63,
Noida – 201 301
(U.P.),
India
Mr. Ashish Trikha -
0120-4655 460 /
4655 455 / 458,
09717790676
7. Gas Turbine Turbo Mach
India Pvt. Ltd.
5 & 6, Papa
Industrial Estate,
Suren Road,
Andheri (East),
Mumbai - 400093
Mr. Pradeep Yadav
- 09833491235
8. Energy Efficient
Burners
Wesman
Thermal
Engg.
Processes Pvt.
Ltd
B/702, Sagar
Tech Plaza,
Andheri-Kurla
Road, Saki Naka,
Mumbai 400 070
Mr. Frederick C
Pinto - 0 2850
9521/22, 0
9324384381
9. Low thermal Mass
car of tunnel kiln,
other projects of
sanitary ware
tunnel kiln
Payal Allien
Engineering
Morbi Mr. Hasmukh Patel
- 09427934644
10. Recuperator Chemequip
Industries
451/2 GIDC
Makarpura
Industrial Estate
Vadodara -390
010
Mr. Parthiv
Adeshra -
09824209898
11. Kiln insulation
improvement
Poonam
Refractories
Bazar Road, Post
Box No. 2,
Wankaner-
363621 (Dist.
Rajkot)
Mr. Ketan Mehta -
09825224640
12. Ceramic fibre
supplier for tunnel
kiln car
Orient
Refractory
220, Ambawadi,
GIDC, Wadhwan
city,
Surendranagar
Mr. R.K.Jain -
09825355877

Manual on Energy Conservation Measures in Ceramic Industry
88 of 96
Details of the identified technical experts to assist for implementation of above
identified projects in ceramic industry
Sr. Technology Name of
Service
Provider
Address Contact Person
and No.
1. Technical Expert
to provide the
guidance or design
for
implementation of
identified projects
Yajna Fuel
Services
B – 15, Dattaviahar
Co –
OperativeHousing
Society,
Ground Floor,
Shivaji Nagar, B –
Cabin,
Thane (W) –
400602
Mr. Mukund
Gharpure -
09969410594,
022 - 25424983
2. Roller Kiln Expert Perf
,,ect
Mechanical
System
8 A - National
Highway,
Lakdhirpur Road,
Morbi
Mr. Bakulbhai -
09825230692
3. Tunnel Kiln
Expert
Sharma Kiln
Technology
Mr. Adir Sharma
- 09327039235
4. Ceramic Plant
Expert in
operation and
maintenance
Individual
Consultant
Morbi Mr. Omesh
Gandhi -
09879417065

Manual on Energy Conservation Measures in Ceramic Industry
89 of 96
Annexure–3: Financial Schemes Available with Local Banks
for Improving Energy Efficiency in the Cluster
There are 2 to 3 banks at Morbi providing loans to the required ceramic unit owners. As
such there is no such scheme specially for improving the energy efficiency in the cluster.
Government Fiscal Incentives for MSME Sectors
The Ministry of micro, Small and Medium Enterprises (MoMSME) provides support to
activities in MSME units. The schemes that are eligible for the ceramic industry are given
below.
1. Credit Linked Capital Subsidy Scheme (CLCSS)
Under this scheme, the Ministry of MSME is providing subsidy to upgrade technology
(Machinery/Plant equipments). Subsidy limit per unit is Rs. 15 lacs or 15% of investment
in eligible Machinery/ Plant equipments whichever is lower. For more details of the
scheme visit www.laghu-udyog.com/schemes/sccredit.htm
2. Credit Guarantee Fund Trust for MSE
This scheme will cover both term loan and working capital facility upto Rs.100 lacs.
Under this scheme, loan will be sanctioned without any collateral security or third party
guarantee. For more details of the scheme visit www.cgtmse.in
3. Market Development Assistance Scheme
To encourage MEME entrepreneurs to tap overseas market potential and represent India
in the overseas market, Government of India is reimbursing 75% of air fare by economy
class and 50% space rental charges of stalls for exhibition of their products in the
overseas trade fairs/ exhibitions. For more details of the scheme visit
www.fisme.org.in/MDA%20Faq.doc
4. Quality Up-Gradation/Environment Management Scheme
Under this scheme charges would be reimbursed for acquiring ISO - 9000/ISO -
14001/HACCP certifications to the extent of 75% of the expenditure (maximum to Rs.
75,000/- in each case). For more details of the various schemes visit http://msme.gov.in/
5. SIDBI Financing Scheme for Energy saving project in MSME Sector
To improve the energy efficiency levels in various MSME sectors, SIDBI is providing
loans to eligible projects under JICA line of credit at a nominal rate of interest of 9.5 -
10% p.a. For more details of the list of eligible projects under this line of credit visit:
www.sidbi.in
SIDBI Financing Scheme for Energy Saving Projects in MSME Sector under JICA
Line of Credit
The Japan International Cooperation Agency (JICA) has extended a line of credit to
SIDBI for financing Energy Saving projects in Micro, Small and Medium Enterprises
(MEMEs). This project is expected to encourage MSME units to undertake energy saving

Manual on Energy Conservation Measures in Ceramic Industry
90 of 96
investments in plant and machinery to reduce energy consumption, enhance energy
efficiency, reduce CO2 emissions, and improve the profitability of units in the long run.
Eligible Sub projects/ Energy Saving Equipment List under JICA Line of Credit
• ����������������������������������������� �������������������������������������������������������������������������� ���������������
• ����������� � � !������ ����������� ���"�� ����������� � � ���������� �����������#�����#���������������������$�
• %���������"&����������������������������������������������"������
• '���������� � � ����������� ����� �����(�� ������������ ������� ������� ����� ��� �������� ���������#�!�������������$����������� �����������������������������������$�
• )�����*����������&��������� �)*&����+����� ��� �������� ������ ����� ������� ������� ���������� ���� ����������� ��� ��#����� ����� ��������� !�� ���������� ������������#���� !�������!�������������$�
Eligible Criteria for Units (Direct Assistance)
• %�������� ������ ������ ����� ������������ ����,� ������ � � ����� ����������� ���� ���������������������
• -�+����� #���� !�� ��������� ��� ���� %������ ������� ������ #����� ��� ������!��� �� ���� �'*.'�#�!�����
• /������������������������������������������������� ��'*.'�
• -�+����� #����� ���� ������� ��� ��������� ������������� ���� ������ �������� ���� ���� ��������!��������������������$�
Parameter Norms
Minimum assistance Rs. 10 lakh
Minimum promoters contribution 25 % for existing units; 33 % for new units
Interest rate The project expenditure eligible for coverage
under the line will carry the following rate of
interest
Fixed rate: 9.5 to 10 5 per annum based on rating
Floating rate: 9.75 to 10.5 % per annum based on
rating
Upfront fee Non - refundable upfront fee of 1 % of
sanctioned loan plus applicable service tax
Repayment period Need based. Normally the repayment period
does not extend beyond seven years. However, a
longer repayment period of more than seven
years can be considered under the line, if
necessary.

Manual on Energy Conservation Measures in Ceramic Industry
91 of 96
List of Equipments which are Already Approved for Loan from JICA (SIDBI)
Sr. Registered Equipment/Technology
1 Ceramics Industry
1.1 Insulation for Kiln, Top Chamber & Furnace
1.2 Low thermal mass cars
1.3 Recuperator for kiln (hot air generation)
1.4 variable speed drive for circulation air fans in vertical dryer
1.5 Roller kiln (by replacing Tunnel kiln)
2 Ceramic Items (Insulator ceramics, electrical ceramics, porcelain,
Bone China ware, Stone ware, Earthen ware, Terra - cotta ceramic)
including Tiles
2.1 Ball mill with high alumina tile lining, high alumina balls of different
size (Raw material processing)
2.2 Isostatic Press, Fettling machine, Stacking equipment (Fabrication)
2.3 Fully automatic vertical copying Machine for Insulator (Fabrication)
2.4 Roller Head machine for cup & saucer (fabrication)
2.5 Pressure casting plant (Fabrication)
2.6 Humidity Driver Chamber (Drying)
2.7 Gas/Oil fired Roller Hearth Kiln (Firing Section)
3 Ceramics & Sanitary ware
3.1 Gas/Oil fired Tunnel Kiln (Firing Section)
3.2 Gas/Oil fired Shuttle Kiln (Firing section)
3.3 Automatic Tile Pressing Unit
3.4 Alumina Brick insulation for Electric Arc Furnace
3.5 Improved Insulation for Ring Chamber
3.6 Recuperator

Manual on Energy Conservation Measures in Ceramic Industry
92 of 96
Annexure–4: Name and Addresses of Units in the Cluster
(Audited)
Sr Company
name
Product
Manufa-
ctured
Address Contact
Person name
Contact No
1. Active
Ceramic Pvt.
Ltd.
Wall
Tiles
8A, National Highway,
Lakhdirpur road, Morbi
Mr. Bhavesh
Patel
9909035137
2. Airson
Ceramic
Industries
Floor
Tile
8-A,National
Highway,Opp.G.E.B.
Feeder Lalpar,Morbi-
363642
Mr.
Mahadevbhai
Ambani
9825224562
3. Akruti
Ceramic
Floor
Tiles
8A, National Highway,
Old Ghuntu road, Morbi
Mr. Ashok
Bhai
9825313935
4. Alfa gold
Suntop
Ceramic
Wall
Tiles
8A, National Highway,
Lakhdirpur road, Morbi
Mr.
Pranjivanbhai
9825530556
5. Antique
Granito Pvt.
Ltd.
Vitrified
Tiles
8A, National Highway,
Lakhdirpur road, Morbi
Mr. Paresh
Kundaria
9879310277
6. Apolo
Sanitary
ware
Sanitary 8A, National Highway,
Lalpar, Morbi
Mr. Kantibhai 9823492507
7. Apple Tiles
Pvt. Ltd.
Floor
Tile
8-A,National
Highway,Bandu
Nagar,Near 20 Nala,
Morbi-363642
Mr. Satish
Patel
9825258516
8. Arrow
ceramic
Wall
Tile
8-A,National
Highway,Jambudia,Mor
bi
Mr. Ashok
Bhai
9. Bell
Sanitary
Wares
Sanitary 8-A,National
Highway,Jambudia,Mor
bi-363642
Mr. Amit
Bhai
9825222810
10. Captain
Ceramic
Wall
Tiles
8A, National Highway,
Lalpar, Morbi
Mr. J. D.
Patel
9825255774
11. Delphi
Ceramics
Sanitary 8-A,National Highway,
Lakhdirpur
Road,Morbi-363642
Mr. Suresh
Patel
9879078068
12. Dolphin
Tiles
Wall
Tiles
8A, National Highway,
Jombudiya, Morbi
Mr.
Vinodbhai
9879492370
13. Excel
Ceramic Pvt.
Ltd.
Floor
Tile
Morbi-Wankaner
Highway,
Makanser,Tal-
Morbi,Dist-Rajkot
Mr. Suresh J
Patel
9825223476
14. Face
Ceramics
Wall
Tiles
8A, National Highway,
Lakdhirpur road, Morbi
Mr. Ramesh
Patel
9879511601

Manual on Energy Conservation Measures in Ceramic Industry
93 of 96
Sr Company
name
Product
Manufa-
ctured
Address Contact
Person name
Contact No
15. Favourite
Ceramic Pvt.
Ltd.
Wall
Tiles
8A, National Highway,
Lakhdirpur road, Morbi
Mr. Vijay
Patel
9898591857
16. Foton
Ceramic
Wall
Tiles
8A, National Highway,
Lakhdirpur road, Morbi
Mr.
Rajeshbhai
9825565009
17. Gangotri
Glaze Tiles
Pvt. Ltd.
Wall 8/A,National Highway
Dhuva-
363622,Ta.Wakaner,Dis
t:Rajkot
Mr. Pravin
Bhai C. Patel
9909902227
0
18. Gokul
Ceramic Pvt.
Ltd
Floor 8/A,National Highway
Dhuva-
363622,Ta.Wakaner,Dis
t:Rajkot
Mr. Pravin
Bhai C. Patel
9909902227
0
19. Jet Granito
Pvt Ltd
Vitrified 8-A,National
Highway,Matel Char
Rasta,Ta-
Wankaner,Dist.Rajkot
Mr. Chetan
Patel
9909012893
20. Keda
Ceramics
Floor
Tile
8-A,National Highway,
Paneli Road.opp.
Rataleshwar ,Morbi-
363642
Mr. Paresh
bhai Patel
21. Lexus
Ceramic
Wall
Tiles
8A, National Highway,
Lakhdirpur road, Morbi
Mr.
Nileshbhai
9825750960
22. Lorenzo
Vitrified
Tiles
Vitrified
Tiles
8A, National Highway,
Lalpar, Morbi
Mr. Ashok
Agravat
(Manager)
9909977787
23. Mark Glaze
Tiles Pvt.
Ltd.
Wall
Tiles
8A, National Highway,
Old Ghuntu road, Morbi
Mr. Dilip
Bhai (MD)
9825839562
24. Marshal
Ceramic
Wall
Tiles
8A, National Highway,
Old Ghuntu road, Morbi
Mr. Anilbhai 9825173064
25. Mega
Vitrified
Pvt. Ltd.
Vitrified
Tiles
8A, National Highway,
Old Ghuntu road, Morbi
Mr. Prakash
Bhai Patel
(Director)
9909955580
26. Metro
Ceramic
Wall
Tiles
8A, National Highway,
Lakhdirpur road, Morbi
Mr. Pratheesh 9925432000
27. Metrocity
Tiles Pvt.
Ltd.
Wall
Tiles
8A, National Highway,
Lakhdirpur road, Morbi
Mr. Pratheesh 9925432000
28. New Royal
Ceramic
Floor
Tiles
8A, National Highway,
Lakhdirpur road, Morbi
Mr. Vijaybhai 9879110983
29. Nobel
Industries
Sanitary 8A, National Highway,
Old Ghuntu road, Morbi
Mr.
Kailashbhai
9825394246
30. Novel
industries
Spray
dryer
8-A,National
Highway,Jambudia,Mor
bi-363642
Mr.
Mahendra
Patel
9825776504
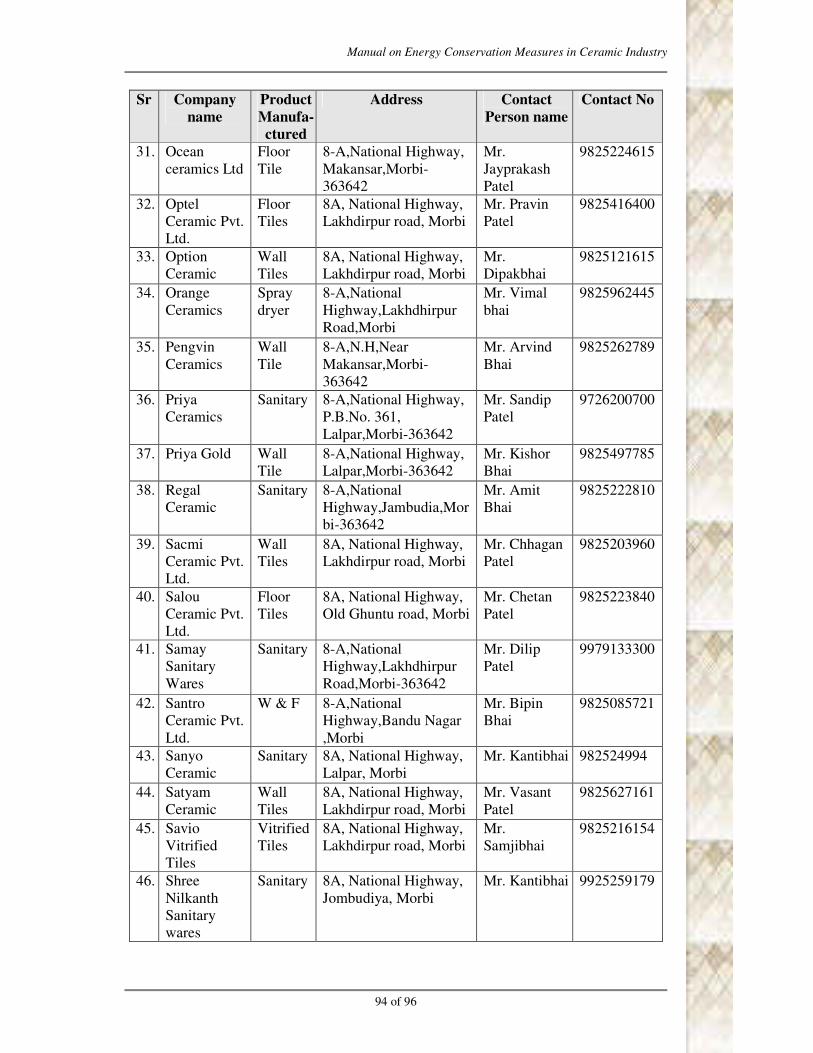
Manual on Energy Conservation Measures in Ceramic Industry
94 of 96
Sr Company
name
Product
Manufa-
ctured
Address Contact
Person name
Contact No
31. Ocean
ceramics Ltd
Floor
Tile
8-A,National Highway,
Makansar,Morbi-
363642
Mr.
Jayprakash
Patel
9825224615
32. Optel
Ceramic Pvt.
Ltd.
Floor
Tiles
8A, National Highway,
Lakhdirpur road, Morbi
Mr. Pravin
Patel
9825416400
33. Option
Ceramic
Wall
Tiles
8A, National Highway,
Lakhdirpur road, Morbi
Mr.
Dipakbhai
9825121615
34. Orange
Ceramics
Spray
dryer
8-A,National
Highway,Lakhdhirpur
Road,Morbi
Mr. Vimal
bhai
9825962445
35. Pengvin
Ceramics
Wall
Tile
8-A,N.H,Near
Makansar,Morbi-
363642
Mr. Arvind
Bhai
9825262789
36. Priya
Ceramics
Sanitary 8-A,National Highway,
P.B.No. 361,
Lalpar,Morbi-363642
Mr. Sandip
Patel
9726200700
37. Priya Gold Wall
Tile
8-A,National Highway,
Lalpar,Morbi-363642
Mr. Kishor
Bhai
9825497785
38. Regal
Ceramic
Sanitary 8-A,National
Highway,Jambudia,Mor
bi-363642
Mr. Amit
Bhai
9825222810
39. Sacmi
Ceramic Pvt.
Ltd.
Wall
Tiles
8A, National Highway,
Lakhdirpur road, Morbi
Mr. Chhagan
Patel
9825203960
40. Salou
Ceramic Pvt.
Ltd.
Floor
Tiles
8A, National Highway,
Old Ghuntu road, Morbi
Mr. Chetan
Patel
9825223840
41. Samay
Sanitary
Wares
Sanitary 8-A,National
Highway,Lakhdhirpur
Road,Morbi-363642
Mr. Dilip
Patel
9979133300
42. Santro
Ceramic Pvt.
Ltd.
W & F 8-A,National
Highway,Bandu Nagar
,Morbi
Mr. Bipin
Bhai
9825085721
43. Sanyo
Ceramic
Sanitary 8A, National Highway,
Lalpar, Morbi
Mr. Kantibhai 982524994
44. Satyam
Ceramic
Wall
Tiles
8A, National Highway,
Lakhdirpur road, Morbi
Mr. Vasant
Patel
9825627161
45. Savio
Vitrified
Tiles
Vitrified
Tiles
8A, National Highway,
Lakhdirpur road, Morbi
Mr.
Samjibhai
9825216154
46. Shree
Nilkanth
Sanitary
wares
Sanitary 8A, National Highway,
Jombudiya, Morbi
Mr. Kantibhai 9925259179
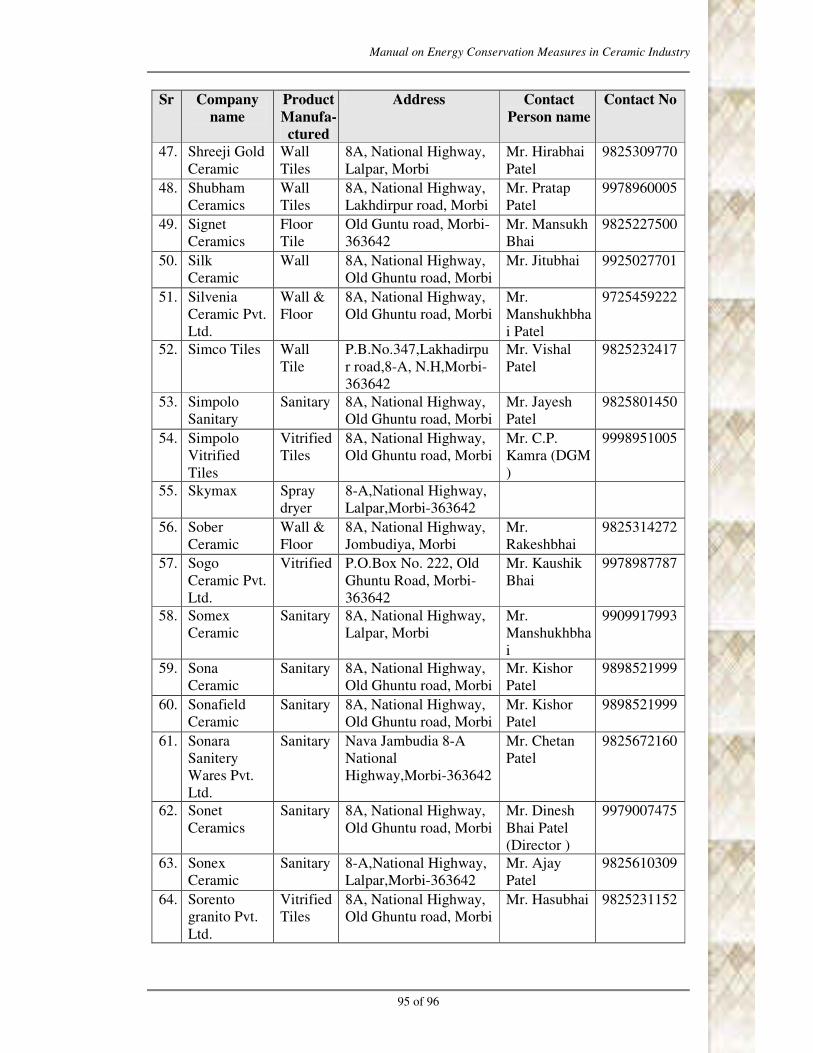
Manual on Energy Conservation Measures in Ceramic Industry
95 of 96
Sr Company
name
Product
Manufa-
ctured
Address Contact
Person name
Contact No
47. Shreeji Gold
Ceramic
Wall
Tiles
8A, National Highway,
Lalpar, Morbi
Mr. Hirabhai
Patel
9825309770
48. Shubham
Ceramics
Wall
Tiles
8A, National Highway,
Lakhdirpur road, Morbi
Mr. Pratap
Patel
9978960005
49. Signet
Ceramics
Floor
Tile
Old Guntu road, Morbi-
363642
Mr. Mansukh
Bhai
9825227500
50. Silk
Ceramic
Wall 8A, National Highway,
Old Ghuntu road, Morbi
Mr. Jitubhai 9925027701
51. Silvenia
Ceramic Pvt.
Ltd.
Wall &
Floor
8A, National Highway,
Old Ghuntu road, Morbi
Mr.
Manshukhbha
i Patel
9725459222
52. Simco Tiles Wall
Tile
P.B.No.347,Lakhadirpu
r road,8-A, N.H,Morbi-
363642
Mr. Vishal
Patel
9825232417
53. Simpolo
Sanitary
Sanitary 8A, National Highway,
Old Ghuntu road, Morbi
Mr. Jayesh
Patel
9825801450
54. Simpolo
Vitrified
Tiles
Vitrified
Tiles
8A, National Highway,
Old Ghuntu road, Morbi
Mr. C.P.
Kamra (DGM
)
9998951005
55. Skymax Spray
dryer
8-A,National Highway,
Lalpar,Morbi-363642
56. Sober
Ceramic
Wall &
Floor
8A, National Highway,
Jombudiya, Morbi
Mr.
Rakeshbhai
9825314272
57. Sogo
Ceramic Pvt.
Ltd.
Vitrified P.O.Box No. 222, Old
Ghuntu Road, Morbi-
363642
Mr. Kaushik
Bhai
9978987787
58. Somex
Ceramic
Sanitary 8A, National Highway,
Lalpar, Morbi
Mr.
Manshukhbha
i
9909917993
59. Sona
Ceramic
Sanitary 8A, National Highway,
Old Ghuntu road, Morbi
Mr. Kishor
Patel
9898521999
60. Sonafield
Ceramic
Sanitary 8A, National Highway,
Old Ghuntu road, Morbi
Mr. Kishor
Patel
9898521999
61. Sonara
Sanitery
Wares Pvt.
Ltd.
Sanitary Nava Jambudia 8-A
National
Highway,Morbi-363642
Mr. Chetan
Patel
9825672160
62. Sonet
Ceramics
Sanitary 8A, National Highway,
Old Ghuntu road, Morbi
Mr. Dinesh
Bhai Patel
(Director )
9979007475
63. Sonex
Ceramic
Sanitary 8-A,National Highway,
Lalpar,Morbi-363642
Mr. Ajay
Patel
9825610309
64. Sorento
granito Pvt.
Ltd.
Vitrified
Tiles
8A, National Highway,
Old Ghuntu road, Morbi
Mr. Hasubhai 9825231152

Manual on Energy Conservation Measures in Ceramic Industry
96 of 96
Sr Company
name
Product
Manufa-
ctured
Address Contact
Person name
Contact No
65. Soriso
Ceramics
Vitrified
Tiles
8A, National Highway,
Old Ghuntu road, Morbi
Mr. Raju
Patel
66. Starware
Ceramics
Wall
Tile
8-A,National
Highway,Jambudia,
P.B.No. 379,Morbi-
363642
Mr. Gopal
Patel
9825262848
67. Sunsilk
Ceramics
Sanitary 8/A,National Highway
,Jambudia ,Morbi
Mr. Denis
Patel
68. Surani
Ceramic
Wall
Tiles
8A, National Highway,
Lakhdirpur road, Morbi
Mr. Rasik
Patel
9825315023
69. Surya
Ceramic
Wall
Tiles
8A, National Highway,
Dhuva, Morbi
Mr. Jagdish
Bhai
70. Suzlon
Ceramics
Floor
Tiles
8A, National Highway,
Lakhdirpur road, Morbi
Mr. Hasubhai
Patel
(Director)
9825223247
71. Suzuki
Ceramic
Floor
Tiles
8A, National Highway,
Old Ghuntu road, Morbi
Mr. Himat
Bhai Patel
(MD )
9825672773
72. Swagat
Ceramic
Wall
Tiles
8A, National Highway,
Old Ghuntu road, Morbi
Mr.
Hiteshbhai
Patel
(Marketing
Manager)
9879633095
73. TipTop
Ceramics
Spray
dryer
Lakhdirpur Road,Bh.
Antique Ceramic,8-
A,National
Highway,Morbi
Mr. Dilip
Bhai
9978996496
74. Verona
Granito Pvt.
Ltd.
Vitrified 8-A,National
Highway,Makansar Tal
,Morbi
Mr. Jasmin 9825278576
75. Vraj
Ceramic Pvt.
Ltd.
Spray
dryer
mud
8/A,National Highway
Dhuva-
363622,Ta.Wakaner,Dis
t:Rajkot
Mr. Pravin
Bhai
Mr. C. Patel
9909922270
76. Vridavan
Ceramic Pvt
Ltd
Floor 8/A,National Highway
Dhuva-
363622,Ta.Wakaner,Dis
t:Rajkot
Mr. Pravin
Bhai
Mr. C. Patel
9909922270

Bureau of Energy Efficiency (BEE) (Ministry of Power, Government of India)
4th Floor, Sewa Bhawan, R. K. Puram, New Delhi – 110066
Ph.: +91 – 11 – 26179699 (5 Lines), Fax: +91 – 11 – 26178352
Websites: www.bee-india.nic.in, www.energymanagertraining.com