bullying among middle school and high school … · bullying among middle school and high school...
TRANSCRIPT
Weekly / Vol. 60 / No. 15 April 22, 2011
U.S. Department of Health and Human ServicesCenters for Disease Control and Prevention
Morbidity and Mortality Weekly Report
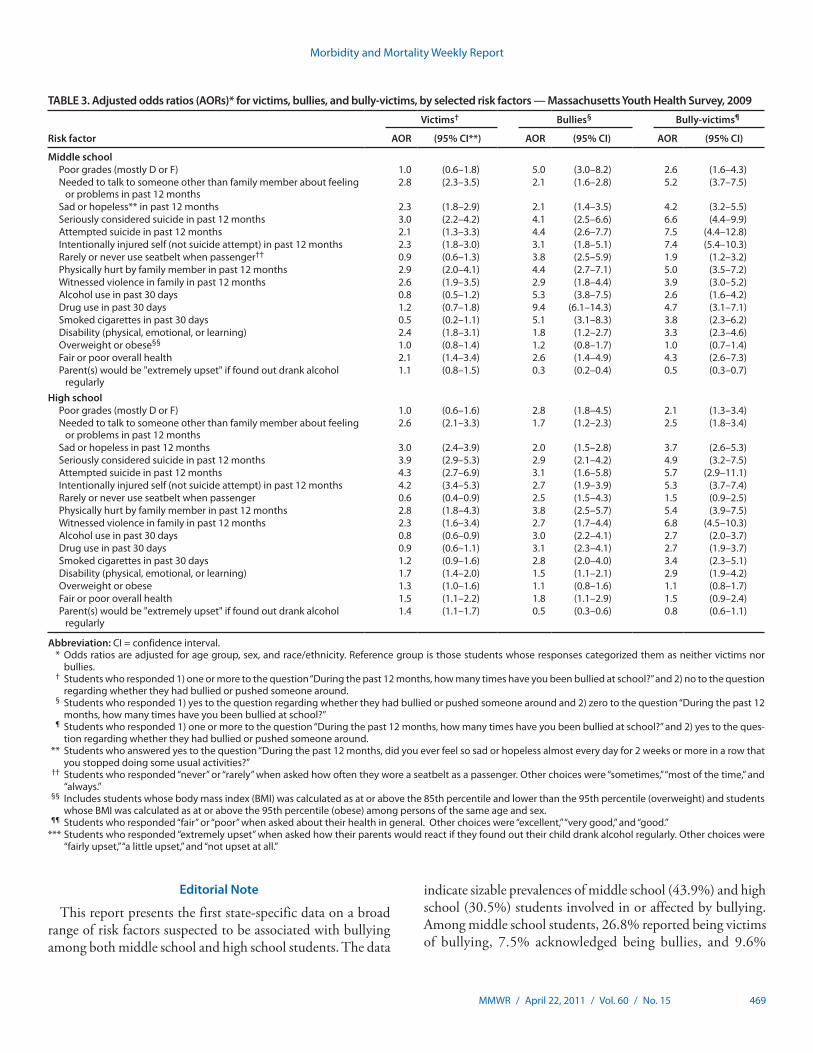
Multiple studies have documented the association between substance use, poor academic achievement, mental health problems, and bullying (1,2). A small but growing body of research suggests that family violence also is associated with bullying (3). To assess the association between family violence and other risk factors and being involved in or affected by bul-lying as a bully, victim, or bully-victim (those who reported being both bullies and victims of bullying), the Massachusetts Department of Public Health and CDC analyzed data from the 2009 Massachusetts Youth Health Survey. This report summarizes the results of that analysis, which showed signifi-cant differences in risk factors for persons in all three bullying categories, compared with persons who reported being neither bullies nor victims. The adjusted odds ratios (AORs) for middle school students for being physically hurt by a family member were 2.9 for victims, 4.4 for bullies, and 5.0 for bully-victims, and for witnessing violence in the family were 2.6, 2.9, and 3.9, respectively, after adjusting for potential differences by age group, sex, and race/ethnicity. For high school students, the AORs for being physically hurt by a family member were 2.8 for victims, 3.8 for bullies, and 5.4 for bully-victims, and for witnessing violence in the family were 2.3, 2.7, and 6.8, respectively. As schools and health departments continue to address the problem of bullying and its consequences, an understanding of the broad range of associated risk factors is important for creating successful prevention and intervention strategies that include involvement by families.
The Massachusetts Youth Health Survey is an anonymous, paper and pencil survey conducted every 2 years. The survey employs a two-stage cluster sample design. In the first stage, schools are randomly selected to participate. The probability of selection is proportional to the number of students enrolled. In the second sampling stage, classes are randomly selected for participation, and all students in those classes are invited to participate. In 2009, the survey was administered during January–June and completed during one class period in 138
public middle schools and high schools. Sample sizes were 2,859 students from middle schools and 2,948 students from high schools. Response rates among students were 90.6% and 87.2% for middle schools and high schools, respectively. Cooperation rates were 61.6% for middle schools and 76.5% for high schools. Overall response rates were 55.8% for middle school students and 66.7% for high school students. A weight was applied to each survey record to adjust for school non-response, student nonresponse, and distribution of students by grade, sex, and race/ethnicity.
Students were asked two questions related to bullying. The first question was “During the past 12 months, how many times have you been bullied at school (being bullied included being repeatedly teased, threatened, hit, kicked, or excluded by another student or group of students)?” Response catego-ries ranged from zero times to 12 or more times. Those who reported being bullied one or more times were categorized as victims. The second question, which immediately followed the first, consisted of two parts. Students were asked “Did you do any of the following in the past 12 months? a) bully or push someone around, and b) initiate or start a physical fight with someone.” Response options for the second question were yes or no for each part. Those who responded yes to part “a” were categorized as bullies. Responses to part “b” were not consid-ered in categorizing students as bullies because not enough information was available to determine whether or not initiat-ing a physical fight should be considered bullying.
Bullying Among Middle School and High School Students — Massachusetts, 2009
INSIDE472 State Smoke-Free Laws for Worksites, Restaurants,
and Bars — United States, 2000–2010476 Grand Rounds: The Opportunity for and Challenges
to Malaria Eradication481 Announcements
The MMWR series of publications is published by the Office of Surveillance, Epidemiology, and Laboratory Services, Centers for Disease Control and Prevention (CDC), U.S. Department of Health and Human Services, Atlanta, GA 30333.Suggested citation: Centers for Disease Control and Prevention. [Article title]. MMWR 2011;60:[inclusive page numbers].
Centers for Disease Control and PreventionThomas R. Frieden, MD, MPH, Director
Harold W. Jaffe, MD, MA, Associate Director for ScienceJames W. Stephens, PhD, Office of the Associate Director for Science
Stephen B. Thacker, MD, MSc, Deputy Director for Surveillance, Epidemiology, and Laboratory ServicesStephanie Zaza, MD, MPH, Director, Epidemiology and Analysis Program Office
MMWR Editorial and Production StaffRonald L. Moolenaar, MD, MPH, Editor, MMWR Series
John S. Moran, MD, MPH, Deputy Editor, MMWR SeriesRobert A. Gunn, MD, MPH, Associate Editor, MMWR Series
Teresa F. Rutledge, Managing Editor, MMWR SeriesDouglas W. Weatherwax, Lead Technical Writer-Editor
Donald G. Meadows, MA, Jude C. Rutledge, Writer-Editors
Martha F. Boyd, Lead Visual Information SpecialistMalbea A. LaPete, Julia C. Martinroe,Stephen R. Spriggs, Terraye M. Starr
Visual Information SpecialistsQuang M. Doan, MBA, Phyllis H. King
Information Technology SpecialistsMMWR Editorial Board
William L. Roper, MD, MPH, Chapel Hill, NC, ChairmanVirginia A. Caine, MD, Indianapolis, IN
Jonathan E. Fielding, MD, MPH, MBA, Los Angeles, CADavid W. Fleming, MD, Seattle, WA
William E. Halperin, MD, DrPH, MPH, Newark, NJKing K. Holmes, MD, PhD, Seattle, WADeborah Holtzman, PhD, Atlanta, GA
John K. Iglehart, Bethesda, MDDennis G. Maki, MD, Madison, WI
Patricia Quinlisk, MD, MPH, Des Moines, IAPatrick L. Remington, MD, MPH, Madison, WI
Barbara K. Rimer, DrPH, Chapel Hill, NCJohn V. Rullan, MD, MPH, San Juan, PR
William Schaffner, MD, Nashville, TNAnne Schuchat, MD, Atlanta, GA
Dixie E. Snider, MD, MPH, Atlanta, GAJohn W. Ward, MD, Atlanta, GA
Morbidity and Mortality Weekly Report
466 MMWR / April 22, 2011 / Vol. 60 / No. 15
Responses to the two bullying questions were combined to create four mutually exclusive categories: 1) bullies were those who responded that they were not bullied but acknowledged that they were bullies, 2) victims were those who responded that they had been bullied but were not bullies, 3) bully-victims were those who responded both that they had been bullied and that they were bullies, and 4) “neither” were those who responded that they had been neither bullied nor were bullies. Students with missing responses to the two bully questions were excluded from analysis (55 middle school students and 39 high school students).
The questionnaires for middle schools and high schools included identical questions regarding demographics and suspected risk factors such as poor grades, mental and physical health, suicidality, experiences with family violence, overweight or obesity, and alcohol, tobacco, and drug use. Percentages of bullies, victims, bully-victims, and neither were calculated for each risk factor (bivariate analysis). Statistically significant dif-ferences were determined by whether the weighted estimates had overlapping or nonoverlapping 95% confidence intervals (CIs). In addition, AORs were calculated, controlling for age group, sex, and race/ethnicity using logistic regression for each outcome of interest, with “neither” as the reference group (multivariate analysis). AORs were considered statistically significant if CIs did not contain 1.0.
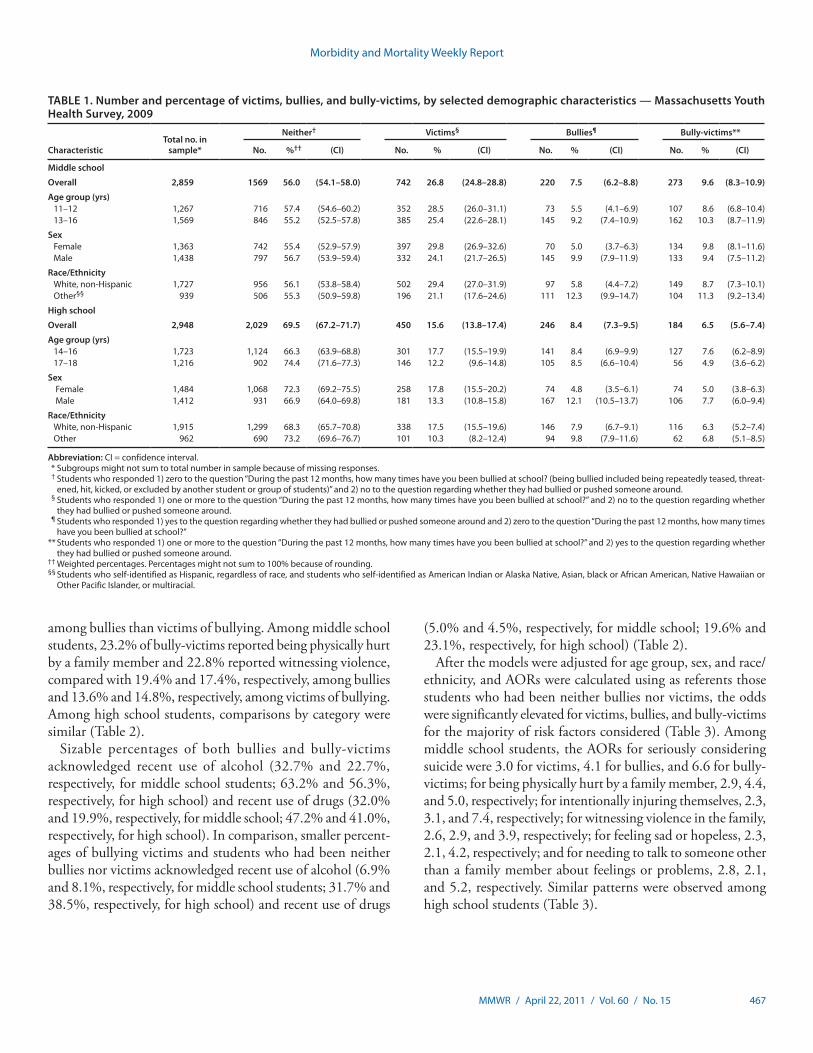
A greater percentage of middle school students (26.8%) than high school students (15.6%) were categorized as victims of bullying, and for both groups of students, the percentage of
victims was greater than the percentage of bullies (7.5% for middle school and 8.4% for high school) and bully-victims (9.6% for middle school and 6.5% for high school) (Table 1). A significantly smaller percentage of middle school students (56.0%) than high school students (69.5%) were categorized as neither bullies nor victims. Among both middle school and high school students, a greater percentage of males (9.9% for middle school and 12.1% for high school) than females (5.0% for middle school and 4.8% for high school) were categorized as bullies. However, a greater percentage of females (29.8% for middle school and 17.8% for high school) than males (24.1% for middle school and 13.3% for high school) were categorized as victims. No significant difference between males and females was observed in the percentage categorized as bully-victims, either in middle school or high school.
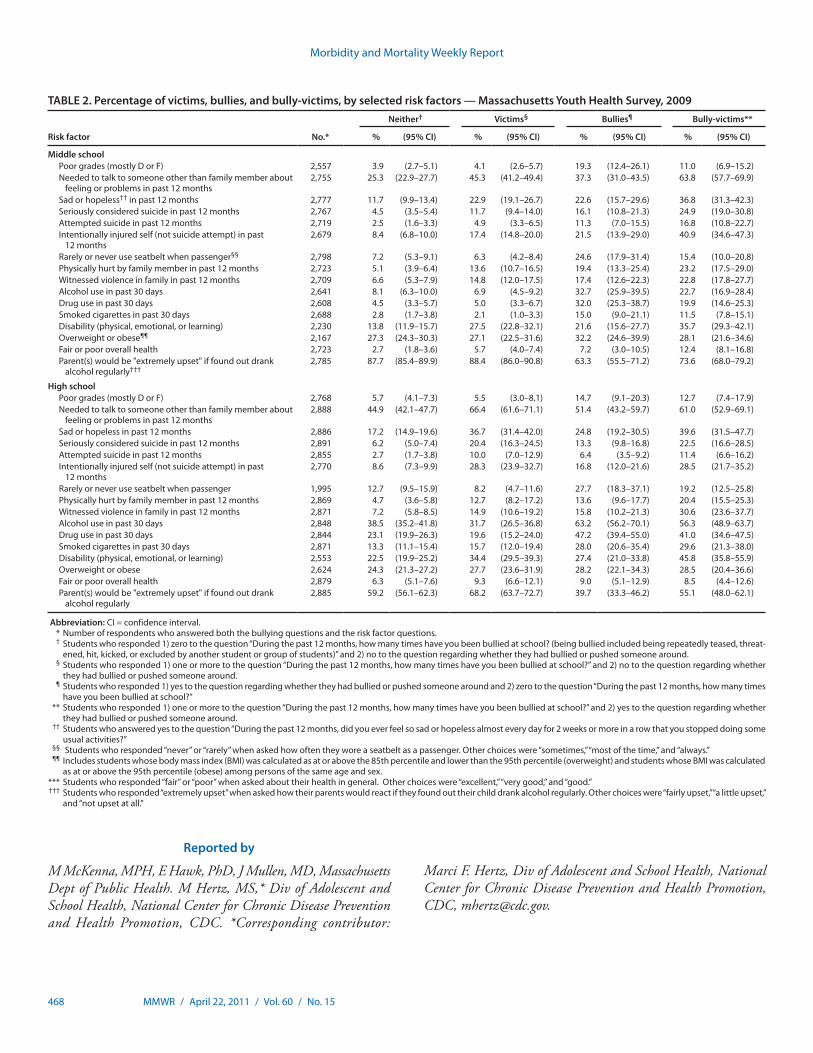
Compared with students who were neither bullies nor bul-lying victims, both middle and high school bully-victims were more than three times as likely to report seriously considering suicide (24.9% versus 4.5% for middle school; 22.5% versus 6.2% for high school), intentionally injuring themselves (40.9% versus 8.4% for middle school; 28.5% versus 8.6% for high school), being physically hurt by a family member (23.2% versus 5.1% for middle school; 20.4% versus 4.7% for high school), and witnessing violence in their family (22.8% versus 6.6% for middle school; 30.6% versus 7.2% for high school) (Table 2).
Exposure to violent family encounters was more common among bully-victims than among bullies, and more common
Morbidity and Mortality Weekly Report
MMWR / April 22, 2011 / Vol. 60 / No. 15 467
among bullies than victims of bullying. Among middle school students, 23.2% of bully-victims reported being physically hurt by a family member and 22.8% reported witnessing violence, compared with 19.4% and 17.4%, respectively, among bullies and 13.6% and 14.8%, respectively, among victims of bullying. Among high school students, comparisons by category were similar (Table 2).
Sizable percentages of both bullies and bully-victims acknowledged recent use of alcohol (32.7% and 22.7%, respectively, for middle school students; 63.2% and 56.3%, respectively, for high school) and recent use of drugs (32.0% and 19.9%, respectively, for middle school; 47.2% and 41.0%, respectively, for high school). In comparison, smaller percent-ages of bullying victims and students who had been neither bullies nor victims acknowledged recent use of alcohol (6.9% and 8.1%, respectively, for middle school students; 31.7% and 38.5%, respectively, for high school) and recent use of drugs
(5.0% and 4.5%, respectively, for middle school; 19.6% and 23.1%, respectively, for high school) (Table 2).
After the models were adjusted for age group, sex, and race/ethnicity, and AORs were calculated using as referents those students who had been neither bullies nor victims, the odds were significantly elevated for victims, bullies, and bully-victims for the majority of risk factors considered (Table 3). Among middle school students, the AORs for seriously considering suicide were 3.0 for victims, 4.1 for bullies, and 6.6 for bully-victims; for being physically hurt by a family member, 2.9, 4.4, and 5.0, respectively; for intentionally injuring themselves, 2.3, 3.1, and 7.4, respectively; for witnessing violence in the family, 2.6, 2.9, and 3.9, respectively; for feeling sad or hopeless, 2.3, 2.1, 4.2, respectively; and for needing to talk to someone other than a family member about feelings or problems, 2.8, 2.1, and 5.2, respectively. Similar patterns were observed among high school students (Table 3).
TABLE 1. Number and percentage of victims, bullies, and bully-victims, by selected demographic characteristics — Massachusetts Youth Health Survey, 2009
Characteristic Total no. in
sample*
Neither† Victims§ Bullies¶ Bully-victims**
No. %†† (CI) No. % (CI) No. % (CI) No. % (CI)
Middle school
Overall 2,859 1569 56.0 (54.1–58.0) 742 26.8 (24.8–28.8) 220 7.5 (6.2–8.8) 273 9.6 (8.3–10.9)
Age group (yrs)11–12 1,267 716 57.4 (54.6–60.2) 352 28.5 (26.0–31.1) 73 5.5 (4.1–6.9) 107 8.6 (6.8–10.4)13–16 1,569 846 55.2 (52.5–57.8) 385 25.4 (22.6–28.1) 145 9.2 (7.4–10.9) 162 10.3 (8.7–11.9)
Sex Female 1,363 742 55.4 (52.9–57.9) 397 29.8 (26.9–32.6) 70 5.0 (3.7–6.3) 134 9.8 (8.1–11.6)Male 1,438 797 56.7 (53.9–59.4) 332 24.1 (21.7–26.5) 145 9.9 (7.9–11.9) 133 9.4 (7.5–11.2)
Race/EthnicityWhite, non-Hispanic 1,727 956 56.1 (53.8–58.4) 502 29.4 (27.0–31.9) 97 5.8 (4.4–7.2) 149 8.7 (7.3–10.1)Other§§ 939 506 55.3 (50.9–59.8) 196 21.1 (17.6–24.6) 111 12.3 (9.9–14.7) 104 11.3 (9.2–13.4)
High school
Overall 2,948 2,029 69.5 (67.2–71.7) 450 15.6 (13.8–17.4) 246 8.4 (7.3–9.5) 184 6.5 (5.6–7.4)
Age group (yrs)14–16 1,723 1,124 66.3 (63.9–68.8) 301 17.7 (15.5–19.9) 141 8.4 (6.9–9.9) 127 7.6 (6.2–8.9)17–18 1,216 902 74.4 (71.6–77.3) 146 12.2 (9.6–14.8) 105 8.5 (6.6–10.4) 56 4.9 (3.6–6.2)
Sex Female 1,484 1,068 72.3 (69.2–75.5) 258 17.8 (15.5–20.2) 74 4.8 (3.5–6.1) 74 5.0 (3.8–6.3) Male 1,412 931 66.9 (64.0–69.8) 181 13.3 (10.8–15.8) 167 12.1 (10.5–13.7) 106 7.7 (6.0–9.4)
Race/EthnicityWhite, non-Hispanic 1,915 1,299 68.3 (65.7–70.8) 338 17.5 (15.5–19.6) 146 7.9 (6.7–9.1) 116 6.3 (5.2–7.4)Other 962 690 73.2 (69.6–76.7) 101 10.3 (8.2–12.4) 94 9.8 (7.9–11.6) 62 6.8 (5.1–8.5)
Abbreviation: CI = confidence interval. * Subgroups might not sum to total number in sample because of missing responses. † Students who responded 1) zero to the question “During the past 12 months, how many times have you been bullied at school? (being bullied included being repeatedly teased, threat-
ened, hit, kicked, or excluded by another student or group of students)” and 2) no to the question regarding whether they had bullied or pushed someone around. § Students who responded 1) one or more to the question “During the past 12 months, how many times have you been bullied at school?” and 2) no to the question regarding whether
they had bullied or pushed someone around. ¶ Students who responded 1) yes to the question regarding whether they had bullied or pushed someone around and 2) zero to the question “During the past 12 months, how many times
have you been bullied at school?” ** Students who responded 1) one or more to the question “During the past 12 months, how many times have you been bullied at school?” and 2) yes to the question regarding whether
they had bullied or pushed someone around. †† Weighted percentages. Percentages might not sum to 100% because of rounding. §§ Students who self-identified as Hispanic, regardless of race, and students who self-identified as American Indian or Alaska Native, Asian, black or African American, Native Hawaiian or
Other Pacific Islander, or multiracial.
Morbidity and Mortality Weekly Report
468 MMWR / April 22, 2011 / Vol. 60 / No. 15
Reported by
M McKenna, MPH, E Hawk, PhD, J Mullen, MD, Massachusetts Dept of Public Health. M Hertz, MS,* Div of Adolescent and School Health, National Center for Chronic Disease Prevention and Health Promotion, CDC. *Corresponding contributor:
TABLE 2. Percentage of victims, bullies, and bully-victims, by selected risk factors — Massachusetts Youth Health Survey, 2009
Risk factor No.*
Neither† Victims§ Bullies¶ Bully-victims**
% (95% CI) % (95% CI) % (95% CI) % (95% CI)
Middle schoolPoor grades (mostly D or F) 2,557 3.9 (2.7–5.1) 4.1 (2.6–5.7) 19.3 (12.4–26.1) 11.0 (6.9–15.2)Needed to talk to someone other than family member about
feeling or problems in past 12 months2,755 25.3 (22.9–27.7) 45.3 (41.2–49.4) 37.3 (31.0–43.5) 63.8 (57.7–69.9)
Sad or hopeless†† in past 12 months 2,777 11.7 (9.9–13.4) 22.9 (19.1–26.7) 22.6 (15.7–29.6) 36.8 (31.3–42.3)Seriously considered suicide in past 12 months 2,767 4.5 (3.5–5.4) 11.7 (9.4–14.0) 16.1 (10.8–21.3) 24.9 (19.0–30.8)Attempted suicide in past 12 months 2,719 2.5 (1.6–3.3) 4.9 (3.3–6.5) 11.3 (7.0–15.5) 16.8 (10.8–22.7)Intentionally injured self (not suicide attempt) in past
12 months2,679 8.4 (6.8–10.0) 17.4 (14.8–20.0) 21.5 (13.9–29.0) 40.9 (34.6–47.3)
Rarely or never use seatbelt when passenger§§ 2,798 7.2 (5.3–9.1) 6.3 (4.2–8.4) 24.6 (17.9–31.4) 15.4 (10.0–20.8)Physically hurt by family member in past 12 months 2,723 5.1 (3.9–6.4) 13.6 (10.7–16.5) 19.4 (13.3–25.4) 23.2 (17.5–29.0)Witnessed violence in family in past 12 months 2,709 6.6 (5.3–7.9) 14.8 (12.0–17.5) 17.4 (12.6–22.3) 22.8 (17.8–27.7)Alcohol use in past 30 days 2,641 8.1 (6.3–10.0) 6.9 (4.5–9.2) 32.7 (25.9–39.5) 22.7 (16.9–28.4)Drug use in past 30 days 2,608 4.5 (3.3–5.7) 5.0 (3.3–6.7) 32.0 (25.3–38.7) 19.9 (14.6–25.3)Smoked cigarettes in past 30 days 2,688 2.8 (1.7–3.8) 2.1 (1.0–3.3) 15.0 (9.0–21.1) 11.5 (7.8–15.1)Disability (physical, emotional, or learning) 2,230 13.8 (11.9–15.7) 27.5 (22.8–32.1) 21.6 (15.6–27.7) 35.7 (29.3–42.1)Overweight or obese¶¶ 2,167 27.3 (24.3–30.3) 27.1 (22.5–31.6) 32.2 (24.6–39.9) 28.1 (21.6–34.6)Fair or poor overall health 2,723 2.7 (1.8–3.6) 5.7 (4.0–7.4) 7.2 (3.0–10.5) 12.4 (8.1–16.8)Parent(s) would be "extremely upset" if found out drank
alcohol regularly†††2,785 87.7 (85.4–89.9) 88.4 (86.0–90.8) 63.3 (55.5–71.2) 73.6 (68.0–79.2)
High schoolPoor grades (mostly D or F) 2,768 5.7 (4.1–7.3) 5.5 (3.0–8.1) 14.7 (9.1–20.3) 12.7 (7.4–17.9)Needed to talk to someone other than family member about
feeling or problems in past 12 months2,888 44.9 (42.1–47.7) 66.4 (61.6–71.1) 51.4 (43.2–59.7) 61.0 (52.9–69.1)
Sad or hopeless in past 12 months 2,886 17.2 (14.9–19.6) 36.7 (31.4–42.0) 24.8 (19.2–30.5) 39.6 (31.5–47.7)Seriously considered suicide in past 12 months 2,891 6.2 (5.0–7.4) 20.4 (16.3–24.5) 13.3 (9.8–16.8) 22.5 (16.6–28.5)Attempted suicide in past 12 months 2,855 2.7 (1.7–3.8) 10.0 (7.0–12.9) 6.4 (3.5–9.2) 11.4 (6.6–16.2)Intentionally injured self (not suicide attempt) in past
12 months2,770 8.6 (7.3–9.9) 28.3 (23.9–32.7) 16.8 (12.0–21.6) 28.5 (21.7–35.2)
Rarely or never use seatbelt when passenger 1,995 12.7 (9.5–15.9) 8.2 (4.7–11.6) 27.7 (18.3–37.1) 19.2 (12.5–25.8)Physically hurt by family member in past 12 months 2,869 4.7 (3.6–5.8) 12.7 (8.2–17.2) 13.6 (9.6–17.7) 20.4 (15.5–25.3)Witnessed violence in family in past 12 months 2,871 7.2 (5.8–8.5) 14.9 (10.6–19.2) 15.8 (10.2–21.3) 30.6 (23.6–37.7)Alcohol use in past 30 days 2,848 38.5 (35.2–41.8) 31.7 (26.5–36.8) 63.2 (56.2–70.1) 56.3 (48.9–63.7)Drug use in past 30 days 2,844 23.1 (19.9–26.3) 19.6 (15.2–24.0) 47.2 (39.4–55.0) 41.0 (34.6–47.5)Smoked cigarettes in past 30 days 2,871 13.3 (11.1–15.4) 15.7 (12.0–19.4) 28.0 (20.6–35.4) 29.6 (21.3–38.0)Disability (physical, emotional, or learning) 2,553 22.5 (19.9–25.2) 34.4 (29.5–39.3) 27.4 (21.0–33.8) 45.8 (35.8–55.9)Overweight or obese 2,624 24.3 (21.3–27.2) 27.7 (23.6–31.9) 28.2 (22.1–34.3) 28.5 (20.4–36.6)Fair or poor overall health 2,879 6.3 (5.1–7.6) 9.3 (6.6–12.1) 9.0 (5.1–12.9) 8.5 (4.4–12.6)Parent(s) would be "extremely upset" if found out drank
alcohol regularly2,885 59.2 (56.1–62.3) 68.2 (63.7–72.7) 39.7 (33.3–46.2) 55.1 (48.0–62.1)
Abbreviation: CI = confidence interval. * Number of respondents who answered both the bullying questions and the risk factor questions. † Students who responded 1) zero to the question “During the past 12 months, how many times have you been bullied at school? (being bullied included being repeatedly teased, threat-
ened, hit, kicked, or excluded by another student or group of students)” and 2) no to the question regarding whether they had bullied or pushed someone around. § Students who responded 1) one or more to the question “During the past 12 months, how many times have you been bullied at school?” and 2) no to the question regarding whether
they had bullied or pushed someone around. ¶ Students who responded 1) yes to the question regarding whether they had bullied or pushed someone around and 2) zero to the question “During the past 12 months, how many times
have you been bullied at school?” ** Students who responded 1) one or more to the question “During the past 12 months, how many times have you been bullied at school?” and 2) yes to the question regarding whether
they had bullied or pushed someone around. †† Students who answered yes to the question “During the past 12 months, did you ever feel so sad or hopeless almost every day for 2 weeks or more in a row that you stopped doing some
usual activities?” §§ Students who responded “never” or “rarely” when asked how often they wore a seatbelt as a passenger. Other choices were “sometimes,” “most of the time,” and “always.” ¶¶ Includes students whose body mass index (BMI) was calculated as at or above the 85th percentile and lower than the 95th percentile (overweight) and students whose BMI was calculated
as at or above the 95th percentile (obese) among persons of the same age and sex. *** Students who responded “fair” or “poor” when asked about their health in general. Other choices were “excellent,” “very good,” and “good.” ††† Students who responded “extremely upset” when asked how their parents would react if they found out their child drank alcohol regularly. Other choices were “fairly upset,” “a little upset,”
and “not upset at all.”
Marci F. Hertz, Div of Adolescent and School Health, National Center for Chronic Disease Prevention and Health Promotion, CDC, [email protected].
Morbidity and Mortality Weekly Report
MMWR / April 22, 2011 / Vol. 60 / No. 15 469
Editorial Note
This report presents the first state-specific data on a broad range of risk factors suspected to be associated with bullying among both middle school and high school students. The data
indicate sizable prevalences of middle school (43.9%) and high school (30.5%) students involved in or affected by bullying. Among middle school students, 26.8% reported being victims of bullying, 7.5% acknowledged being bullies, and 9.6%
TABLE 3. Adjusted odds ratios (AORs)* for victims, bullies, and bully-victims, by selected risk factors — Massachusetts Youth Health Survey, 2009
Risk factor
Victims† Bullies§ Bully-victims¶
AOR (95% CI**) AOR (95% CI) AOR (95% CI)
Middle schoolPoor grades (mostly D or F) 1.0 (0.6–1.8) 5.0 (3.0–8.2) 2.6 (1.6–4.3)Needed to talk to someone other than family member about feeling
or problems in past 12 months2.8 (2.3–3.5) 2.1 (1.6–2.8) 5.2 (3.7–7.5)
Sad or hopeless** in past 12 months 2.3 (1.8–2.9) 2.1 (1.4–3.5) 4.2 (3.2–5.5)Seriously considered suicide in past 12 months 3.0 (2.2–4.2) 4.1 (2.5–6.6) 6.6 (4.4–9.9)Attempted suicide in past 12 months 2.1 (1.3–3.3) 4.4 (2.6–7.7) 7.5 (4.4–12.8)Intentionally injured self (not suicide attempt) in past 12 months 2.3 (1.8–3.0) 3.1 (1.8–5.1) 7.4 (5.4–10.3)Rarely or never use seatbelt when passenger†† 0.9 (0.6–1.3) 3.8 (2.5–5.9) 1.9 (1.2–3.2)Physically hurt by family member in past 12 months 2.9 (2.0–4.1) 4.4 (2.7–7.1) 5.0 (3.5–7.2)Witnessed violence in family in past 12 months 2.6 (1.9–3.5) 2.9 (1.8–4.4) 3.9 (3.0–5.2)Alcohol use in past 30 days 0.8 (0.5–1.2) 5.3 (3.8–7.5) 2.6 (1.6–4.2)Drug use in past 30 days 1.2 (0.7–1.8) 9.4 (6.1–14.3) 4.7 (3.1–7.1)Smoked cigarettes in past 30 days 0.5 (0.2–1.1) 5.1 (3.1–8.3) 3.8 (2.3–6.2)Disability (physical, emotional, or learning) 2.4 (1.8–3.1) 1.8 (1.2–2.7) 3.3 (2.3–4.6)Overweight or obese§§ 1.0 (0.8–1.4) 1.2 (0.8–1.7) 1.0 (0.7–1.4)Fair or poor overall health 2.1 (1.4–3.4) 2.6 (1.4–4.9) 4.3 (2.6–7.3)Parent(s) would be "extremely upset" if found out drank alcohol
regularly1.1 (0.8–1.5) 0.3 (0.2–0.4) 0.5 (0.3–0.7)
High schoolPoor grades (mostly D or F) 1.0 (0.6–1.6) 2.8 (1.8–4.5) 2.1 (1.3–3.4)Needed to talk to someone other than family member about feeling
or problems in past 12 months2.6 (2.1–3.3) 1.7 (1.2–2.3) 2.5 (1.8–3.4)
Sad or hopeless in past 12 months 3.0 (2.4–3.9) 2.0 (1.5–2.8) 3.7 (2.6–5.3)Seriously considered suicide in past 12 months 3.9 (2.9–5.3) 2.9 (2.1–4.2) 4.9 (3.2–7.5)Attempted suicide in past 12 months 4.3 (2.7–6.9) 3.1 (1.6–5.8) 5.7 (2.9–11.1)Intentionally injured self (not suicide attempt) in past 12 months 4.2 (3.4–5.3) 2.7 (1.9–3.9) 5.3 (3.7–7.4)Rarely or never use seatbelt when passenger 0.6 (0.4–0.9) 2.5 (1.5–4.3) 1.5 (0.9–2.5)Physically hurt by family member in past 12 months 2.8 (1.8–4.3) 3.8 (2.5–5.7) 5.4 (3.9–7.5)Witnessed violence in family in past 12 months 2.3 (1.6–3.4) 2.7 (1.7–4.4) 6.8 (4.5–10.3)Alcohol use in past 30 days 0.8 (0.6–0.9) 3.0 (2.2–4.1) 2.7 (2.0–3.7)Drug use in past 30 days 0.9 (0.6–1.1) 3.1 (2.3–4.1) 2.7 (1.9–3.7)Smoked cigarettes in past 30 days 1.2 (0.9–1.6) 2.8 (2.0–4.0) 3.4 (2.3–5.1)Disability (physical, emotional, or learning) 1.7 (1.4–2.0) 1.5 (1.1–2.1) 2.9 (1.9–4.2)Overweight or obese 1.3 (1.0–1.6) 1.1 (0.8–1.6) 1.1 (0.8–1.7)Fair or poor overall health 1.5 (1.1–2.2) 1.8 (1.1–2.9) 1.5 (0.9–2.4)Parent(s) would be "extremely upset" if found out drank alcohol
regularly1.4 (1.1–1.7) 0.5 (0.3–0.6) 0.8 (0.6–1.1)
Abbreviation: CI = confidence interval. * Odds ratios are adjusted for age group, sex, and race/ethnicity. Reference group is those students whose responses categorized them as neither victims nor
bullies. † Students who responded 1) one or more to the question “During the past 12 months, how many times have you been bullied at school?” and 2) no to the question
regarding whether they had bullied or pushed someone around. § Students who responded 1) yes to the question regarding whether they had bullied or pushed someone around and 2) zero to the question “During the past 12
months, how many times have you been bullied at school?” ¶ Students who responded 1) one or more to the question “During the past 12 months, how many times have you been bullied at school?” and 2) yes to the ques-
tion regarding whether they had bullied or pushed someone around. ** Students who answered yes to the question “During the past 12 months, did you ever feel so sad or hopeless almost every day for 2 weeks or more in a row that
you stopped doing some usual activities?” †† Students who responded “never” or “rarely” when asked how often they wore a seatbelt as a passenger. Other choices were “sometimes,” “most of the time,” and
“always.” §§ Includes students whose body mass index (BMI) was calculated as at or above the 85th percentile and lower than the 95th percentile (overweight) and students
whose BMI was calculated as at or above the 95th percentile (obese) among persons of the same age and sex. ¶¶ Students who responded “fair” or “poor” when asked about their health in general. Other choices were “excellent,” “very good,” and “good.” *** Students who responded “extremely upset” when asked how their parents would react if they found out their child drank alcohol regularly. Other choices were
“fairly upset,” “a little upset,” and “not upset at all.”
Morbidity and Mortality Weekly Report
470 MMWR / April 22, 2011 / Vol. 60 / No. 15
reported being bully-victims. Among high school students, 15.6% reported being victims of bullying, 8.4% acknowledged being bullies, and 6.5% reported being bully-victims.
Multivariate analysis suggested associations between violent family encounters (i.e., being physically hurt or witnessing violence by a family member) and being bullied, bullying, and being a bully-victim. Bully-victims were more likely to report violent family encounters than bullies, and bullies were more likely to report such encounters than victims. This find-ing expands upon previous documentation of an association between childhood exposure to family violence and subsequent mental health problems (e.g., anxiety and depression) (4) and involvement in general physical aggression, dating violence, and weapon-carrying (5). The results underscore the importance of primary bullying prevention programs and of comprehensive programs and strategies that involve families. Although evidence of bullying prevention programs changing behavior among U.S. students is mixed (6), several violence prevention programs and strategies, including some involving families, have demonstrated effectiveness in decreasing violent behavior.*
The results from this study are consistent with previous findings showing that 1) risks for both depression and suicide are higher among bullies and victims (7), 2) many risk fac-tors are more common among bully-victims than students categorized as bullies or victims (7–9), and 3) being a bully is associated with alcohol and drug use (2,9). These results dif-fer from those presented in some studies (2,8), which found males more likely to be bullies and victims. However, in this report, bullying victimization is defined broadly, encompass-ing physical, verbal, and relational bullying. Because relational bullying, such as social exclusion and spreading rumors, is more
prevalent among females (3), inclusion of this type of bullying might account for the difference.
The findings in this report are subject to at least five limi-tations. First, this was a cross-sectional study, and causality cannot be implied. Second, the relatively low overall response rate among middle school students (55.8%) might limit the generalizability of the data, although the sample included classes in 69 middle schools across the state, and no differences were observed by region, urban/rural classification, or student enrollment between schools that chose to participate and those that declined. In addition, the sample was limited to students attending public schools; some data have shown that students attending public schools are more likely than students attend-ing private schools to be bullied (10). Third, the definition of being bullied (i.e., being repeatedly teased, threatened, hit, kicked, or excluded by another student or group of students) was much more specific than the definition for bullying (i.e., bully or push someone around), which might account, at least in part, for the greater prevalence of victims than bullies and bully-victims. Fourth, all data were self-reported and subject to recall and social desirability bias. Finally, the sample was limited to students present on the day of survey administration. Those bullied are absent more frequently (9) and, therefore, less likely to be included in the sample.
Bullying is a pervasive public health problem requiring comprehensive solutions. Evidence suggests that classroom prevention programs alone in the United States often are unsuccessful in changing bullying behaviors (6). In May 2010, Massachusetts joined 44 other states with similar laws by enact-ing a comprehensive bullying prevention law that covers all types of bullying and requires all school districts to develop, adhere to, and update a plan to address bullying prevention and intervention in consultation with school staff members, families, and community members.
To assist schools in their efforts to implement comprehen-sive strategies to prevent bullying, other types of violence, and unintentional injuries, CDC developed School Health Guidelines to Prevent Unintentional Injuries and Violence. These guidelines include the following recommendations: 1) establish a social school environment that promotes safety; 2) provide access to health and mental health services; 3) inte-grate school, family, and community prevention efforts; and 4) provide training to enable staff members to promote safety and prevent violence effectively. Because bullying is associated with many other risk factors, including exposure to violence outside of the school setting, comprehensive strategies that encompass the school, family, and community are most likely to be effective. To assist schools and communities in their efforts to prevent youth violence, including bullying, CDC has launched the national initiative, Striving To Reduce Youth
What is already known on this topic?
Studies have documented associations between bullying and substance use, poor academic achievement, and mental health problems, and a limited number of studies have indicated an association with family violence.
What is added by this report?
The findings of increased risk for bullies, victims, and bully-victims of being physically hurt by a family member or witness-ing family violence underscore the association between bullying and events outside of the school.
What are the implications for public health practice?
A comprehensive approach that encompasses school officials, students, and their families is needed to prevent bullying among middle school and high school students.
* Center for the Study and Prevention of Violence. Blueprints for violence pre-vention. Boulder, CO: University of Colorado at Boulder. Available at http://www.colorado.edu/cspv/blueprints.
Morbidity and Mortality Weekly Report
MMWR / April 22, 2011 / Vol. 60 / No. 15 471
Violence Everywhere (STRYVE), which promotes increased awareness that youth violence can be prevented using strate-gies based on the best available evidence. Links to resources are available on the STRYVE website (http://www.cdc.gov/violenceprevention/stryve).
References 1. Gini G, Pozzoli T. Association between bullying and psychosomatic
problems: a meta-analysis. Pediatrics 2009;123:1059–65. 2. Nansel TR, Overpeck M, Pilla RS, Ruan WJ, Simons-Morton B,
Scheidt P. Bullying behaviors among US youth: prevalence and associa-tion with psychosocial adjustment. JAMA 2001;285:2094–100.
3. Cook CR, Williams KR, Guerra NG, Kim TE, Sadek S. Predictors of bullying and victimization in childhood and adolescence: a meta-analytic review. Sch Psychol Q 2010;25:65–83.
4. Johnson RM, Kotch JB, Catellier DJ, et al. Adverse behavioral and emotional outcomes from child abuse and witnessed violence. Child Maltreat 2002;7:179–86.
5. Duke NN, Pettingell SL, McMorris BJ, Borowsky IW. Adolescent violence perpetration: associations with multiple types of adverse child-hood experiences. Pediatrics 2010;125:e778–86.
6. Merrell KW, Gueldner BA, Ross SW, Isava DM. How effective are school bullying intervention programs? A meta-analysis of intervention research. Sch Psychol Q 2008;23:26–42.
7. Kaltiala-Heino R, Rimpelä M, Marttunen M, Rimpelä A, Rantanen P. Bullying, depression, and suicidal ideation in Finnish adolescents: school survey. BMJ 1999;319:348–51.
8. Haynie DL, Nansel T, Eitel P. Bullies, victims, and bully/victims: distinct groups of at-risk youth. Journal of Early Adolescence 2001;21:29–49.
9. Lyznicki JM, McCaffree MA, Robinowitz CB. Childhood bullying: implications for physicians. Am Fam Physician 2004;70:1723–30.
10. Robers S, Zhang J, Truman J. Indicators of school crime and safety: 2010. Washington, DC: US Department of Education, National Center for Education Statistics, and US Department of Justice, Bureau of Justice Statistics; 2010. Available at http://nces.ed.gov/programs/crimeindica-tors/crimeindicators2010. Accessed April 18, 2011.

Morbidity and Mortality Weekly Report
472 MMWR / April 22, 2011 / Vol. 60 / No. 15
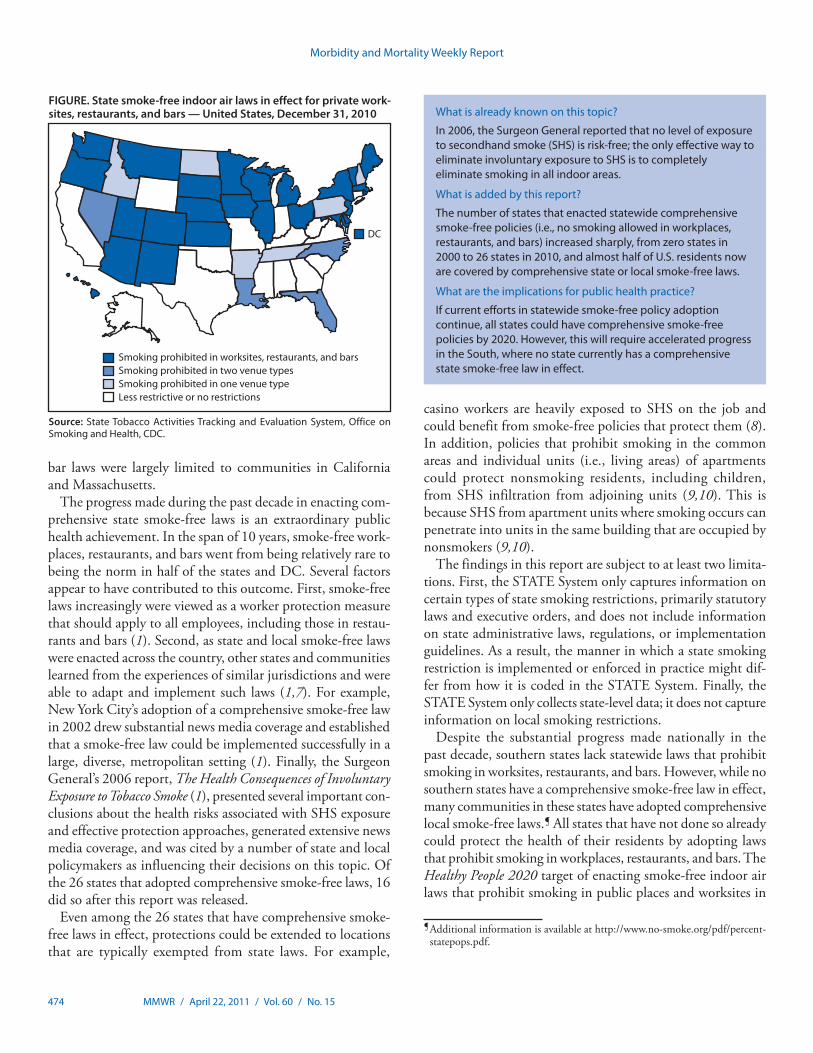
Secondhand smoke (SHS) exposure causes lung cancer and cardiovascular and respiratory diseases in nonsmoking adults and children, resulting in an estimated 46,000 heart disease deaths and 3,400 lung cancer deaths among U.S. nonsmoking adults each year (1). Smoke-free laws that prohibit smoking in all indoor areas of a venue fully protect nonsmokers from involuntary exposure to SHS indoors (1). A Healthy People 2010 objective (27-13) called for enacting laws eliminating smoking in public places and worksites in all 50 states and the District of Columbia (DC); because this objective was not met by 2010, it was retained for Healthy People 2020 (renumbered as TU-13). To assess progress toward meeting this objective, CDC reviewed state laws restricting smoking in effect as of December 31, 2010. This report summarizes the changes in state smoking restrictions for private-sector worksites, restaurants, and bars that occurred from December 31, 2000 to December 31, 2010. The number of states (including DC) with laws that prohibit smoking in indoor areas of worksites, restaurants, and bars increased from zero in 2000 to 26 in 2010. However, regional disparities remain in policy adoption, with no southern state having adopted a smoke-free law that prohibits smoking in all three venues. The Healthy People 2020 target on this topic is achievable if current activity in smoke-free policy adoption is sustained nationally and intensified in certain regions, particularly the South.
This report focuses on laws that completely prohibit smoking in private-sector worksites, restaurants, and bars. These three venues were selected because they are a major source of SHS exposure for nonsmoking employees and the public (1). CDC considers a state smoke-free law to be comprehensive if it pro-hibits smoking in these three venues. Some states have enacted laws with less stringent smoking restrictions (e.g., provisions restricting smoking to designated areas or to separately venti-lated areas); however, these laws are not effective in eliminating SHS exposure. The Surgeon General has concluded that the only way to fully protect nonsmokers from SHS exposure is to prohibit smoking in all indoor areas, and that separating smokers from nonsmokers, cleaning the air, and ventilating buildings cannot eliminate SHS exposure (1).
Data on state smoking restrictions for this report were obtained from CDC’s State Tobacco Activities Tracking and Evaluation (STATE) System database, which contains tobacco-related epidemiologic and economic data and information on state tobacco-related legislation.* State legislation is collected quarterly from an online legal research database of state laws
and is analyzed, coded, and entered into the STATE System. The STATE System contains information on state tobacco-related laws, including smoke-free policies, in effect since the fourth quarter of 1995. In addition to information on state smoking restrictions in worksites, restaurants, and bars, the STATE System contains information on state smoking restric-tions in other venues, including government worksites, com-mercial and home-based child care centers, multiunit housing, vehicles, hospitals, prisons, and hotels and motels.
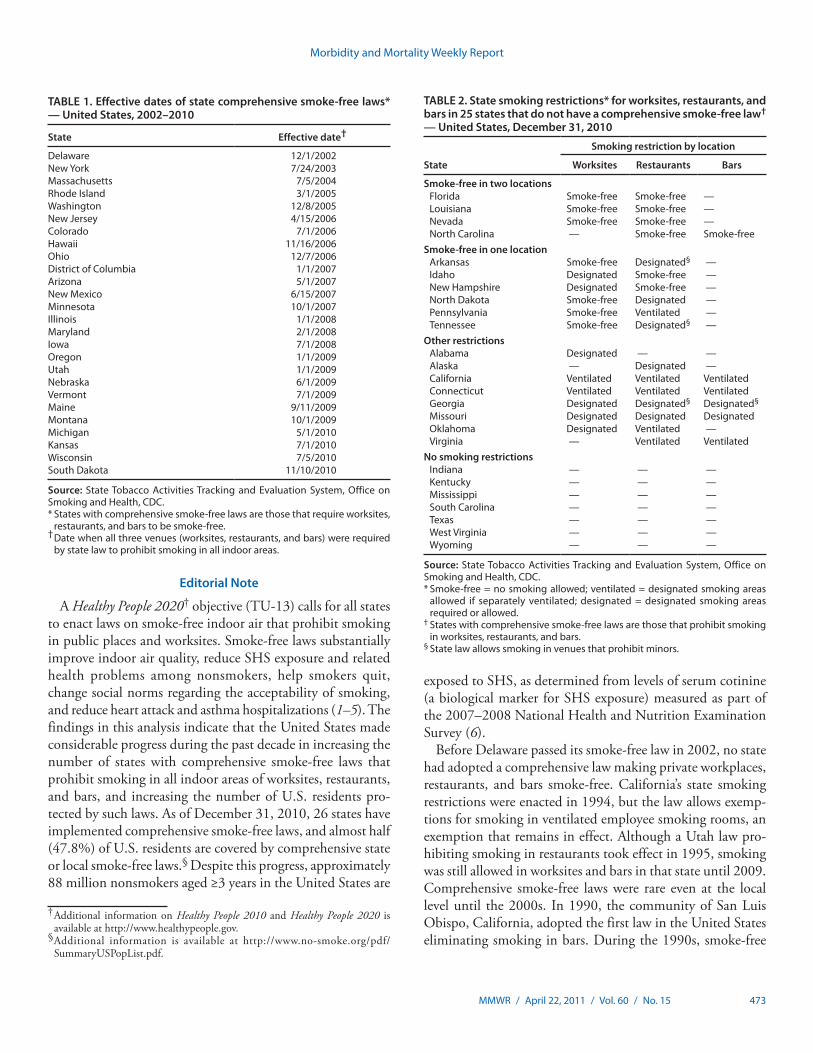
The number of states with comprehensive smoke-free laws in effect increased from zero on December 31, 2000, to 26 states on December 31, 2010 (Table 1). In 2002, Delaware became the first state to implement a comprehensive smoke-free law, followed by New York in 2003, Massachusetts in 2004, and Rhode Island and Washington in 2005. In 2006, comprehen-sive smoke-free laws went into effect in Colorado, Hawaii, New Jersey, and Ohio, followed by Arizona, DC, Minnesota, and New Mexico in 2007; Illinois, Iowa, and Maryland in 2008; Maine, Montana, Nebraska, Oregon, Utah, and Vermont in 2009; and Kansas, Michigan, South Dakota, and Wisconsin in 2010. The years listed are the years in which the laws took effect; in some cases the laws were enacted in a preceding year. Some state laws were expanded gradually or phased in; in these cases, the year provided is the year when the law first applied to all three of the settings considered in this study. Additionally, while most of these laws were enacted through the state legisla-tive process, Arizona, Ohio, South Dakota, and Washington enacted their laws through ballot measures.
As of December 31, 2010, in addition to the 26 states with comprehensive smoke-free laws, 10 states had enacted laws that prohibit smoking in one or two, but not all three, of the venues included in this study (Table 2). Additionally, eight states had passed less restrictive laws (e.g., laws allowing smoking in designated areas or areas with separate ventilation). Finally, seven states have no statewide smoking restrictions in place for private worksites, restaurants, or bars (Table 2). Of note, only three southern states (Florida, Louisiana, and North Carolina) have laws that prohibit smoking in any two of the three venues examined in this report, and no southern state has a comprehensive state smoke-free law in effect (Figure).
Reported by
M Tynan,* S Babb, MPH, A MacNeil, MPH, M Griffin, MPH, Office on Smoking and Health, National Center for Chronic Disease Prevention and Health Promotion, CDC. *Corresponding contribu-tor: Michael Tynan, CDC, 770-488-5286, [email protected].
State Smoke-Free Laws for Worksites, Restaurants, and Bars — United States, 2000–2010
* Additional information on the STATE System is available at http://www.cdc.gov/tobacco/statesystem.
Morbidity and Mortality Weekly Report
MMWR / April 22, 2011 / Vol. 60 / No. 15 473
Editorial Note
A Healthy People 2020† objective (TU-13) calls for all states to enact laws on smoke-free indoor air that prohibit smoking in public places and worksites. Smoke-free laws substantially improve indoor air quality, reduce SHS exposure and related health problems among nonsmokers, help smokers quit, change social norms regarding the acceptability of smoking, and reduce heart attack and asthma hospitalizations (1–5). The findings in this analysis indicate that the United States made considerable progress during the past decade in increasing the number of states with comprehensive smoke-free laws that prohibit smoking in all indoor areas of worksites, restaurants, and bars, and increasing the number of U.S. residents pro-tected by such laws. As of December 31, 2010, 26 states have implemented comprehensive smoke-free laws, and almost half (47.8%) of U.S. residents are covered by comprehensive state or local smoke-free laws.§ Despite this progress, approximately 88 million nonsmokers aged ≥3 years in the United States are
exposed to SHS, as determined from levels of serum cotinine (a biological marker for SHS exposure) measured as part of the 2007–2008 National Health and Nutrition Examination Survey (6).
Before Delaware passed its smoke-free law in 2002, no state had adopted a comprehensive law making private workplaces, restaurants, and bars smoke-free. California’s state smoking restrictions were enacted in 1994, but the law allows exemp-tions for smoking in ventilated employee smoking rooms, an exemption that remains in effect. Although a Utah law pro-hibiting smoking in restaurants took effect in 1995, smoking was still allowed in worksites and bars in that state until 2009. Comprehensive smoke-free laws were rare even at the local level until the 2000s. In 1990, the community of San Luis Obispo, California, adopted the first law in the United States eliminating smoking in bars. During the 1990s, smoke-free
TABLE 1. Effective dates of state comprehensive smoke-free laws* — United States, 2002–2010
State Effective date†
Delaware 12/1/2002New York 7/24/2003Massachusetts 7/5/2004Rhode Island 3/1/2005Washington 12/8/2005New Jersey 4/15/2006Colorado 7/1/2006Hawaii 11/16/2006Ohio 12/7/2006District of Columbia 1/1/2007Arizona 5/1/2007New Mexico 6/15/2007Minnesota 10/1/2007Illinois 1/1/2008Maryland 2/1/2008Iowa 7/1/2008Oregon 1/1/2009Utah 1/1/2009Nebraska 6/1/2009Vermont 7/1/2009Maine 9/11/2009Montana 10/1/2009Michigan 5/1/2010Kansas 7/1/2010Wisconsin 7/5/2010South Dakota 11/10/2010
Source: State Tobacco Activities Tracking and Evaluation System, Office on Smoking and Health, CDC. * States with comprehensive smoke-free laws are those that require worksites,
restaurants, and bars to be smoke-free. † Date when all three venues (worksites, restaurants, and bars) were required
by state law to prohibit smoking in all indoor areas.
TABLE 2. State smoking restrictions* for worksites, restaurants, and bars in 25 states that do not have a comprehensive smoke-free law† — United States, December 31, 2010
State
Smoking restriction by location
Worksites Restaurants Bars
Smoke-free in two locationsFlorida Smoke-free Smoke-free —Louisiana Smoke-free Smoke-free —Nevada Smoke-free Smoke-free —North Carolina — Smoke-free Smoke-free
Smoke-free in one locationArkansas Smoke-free Designated§ —Idaho Designated Smoke-free —New Hampshire Designated Smoke-free —North Dakota Smoke-free Designated —Pennsylvania Smoke-free Ventilated —Tennessee Smoke-free Designated§ —
Other restrictionsAlabama Designated — —Alaska — Designated —California Ventilated Ventilated VentilatedConnecticut Ventilated Ventilated VentilatedGeorgia Designated Designated§ Designated§
Missouri Designated Designated DesignatedOklahoma Designated Ventilated —Virginia — Ventilated Ventilated
No smoking restrictionsIndiana — — —Kentucky — — —Mississippi — — —South Carolina — — —Texas — — —West Virginia — — —Wyoming — — —
Source: State Tobacco Activities Tracking and Evaluation System, Office on Smoking and Health, CDC. * Smoke-free = no smoking allowed; ventilated = designated smoking areas
allowed if separately ventilated; designated = designated smoking areas required or allowed.
† States with comprehensive smoke-free laws are those that prohibit smoking in worksites, restaurants, and bars.
§ State law allows smoking in venues that prohibit minors.
† Additional information on Healthy People 2010 and Healthy People 2020 is available at http://www.healthypeople.gov.
§ Additional information is available at http://www.no-smoke.org/pdf/SummaryUSPopList.pdf.
Morbidity and Mortality Weekly Report
474 MMWR / April 22, 2011 / Vol. 60 / No. 15
bar laws were largely limited to communities in California and Massachusetts.
The progress made during the past decade in enacting com-prehensive state smoke-free laws is an extraordinary public health achievement. In the span of 10 years, smoke-free work-places, restaurants, and bars went from being relatively rare to being the norm in half of the states and DC. Several factors appear to have contributed to this outcome. First, smoke-free laws increasingly were viewed as a worker protection measure that should apply to all employees, including those in restau-rants and bars (1). Second, as state and local smoke-free laws were enacted across the country, other states and communities learned from the experiences of similar jurisdictions and were able to adapt and implement such laws (1,7). For example, New York City’s adoption of a comprehensive smoke-free law in 2002 drew substantial news media coverage and established that a smoke-free law could be implemented successfully in a large, diverse, metropolitan setting (1). Finally, the Surgeon General’s 2006 report, The Health Consequences of Involuntary Exposure to Tobacco Smoke (1), presented several important con-clusions about the health risks associated with SHS exposure and effective protection approaches, generated extensive news media coverage, and was cited by a number of state and local policymakers as influencing their decisions on this topic. Of the 26 states that adopted comprehensive smoke-free laws, 16 did so after this report was released.
Even among the 26 states that have comprehensive smoke-free laws in effect, protections could be extended to locations that are typically exempted from state laws. For example,
casino workers are heavily exposed to SHS on the job and could benefit from smoke-free policies that protect them (8). In addition, policies that prohibit smoking in the common areas and individual units (i.e., living areas) of apartments could protect nonsmoking residents, including children, from SHS infiltration from adjoining units (9,10). This is because SHS from apartment units where smoking occurs can penetrate into units in the same building that are occupied by nonsmokers (9,10).
The findings in this report are subject to at least two limita-tions. First, the STATE System only captures information on certain types of state smoking restrictions, primarily statutory laws and executive orders, and does not include information on state administrative laws, regulations, or implementation guidelines. As a result, the manner in which a state smoking restriction is implemented or enforced in practice might dif-fer from how it is coded in the STATE System. Finally, the STATE System only collects state-level data; it does not capture information on local smoking restrictions.
Despite the substantial progress made nationally in the past decade, southern states lack statewide laws that prohibit smoking in worksites, restaurants, and bars. However, while no southern states have a comprehensive smoke-free law in effect, many communities in these states have adopted comprehensive local smoke-free laws.¶ All states that have not done so already could protect the health of their residents by adopting laws that prohibit smoking in workplaces, restaurants, and bars. The Healthy People 2020 target of enacting smoke-free indoor air laws that prohibit smoking in public places and worksites in
What is already known on this topic?
In 2006, the Surgeon General reported that no level of exposure to secondhand smoke (SHS) is risk-free; the only effective way to eliminate involuntary exposure to SHS is to completely eliminate smoking in all indoor areas.
What is added by this report?
The number of states that enacted statewide comprehensive smoke-free policies (i.e., no smoking allowed in workplaces, restaurants, and bars) increased sharply, from zero states in 2000 to 26 states in 2010, and almost half of U.S. residents now are covered by comprehensive state or local smoke-free laws.
What are the implications for public health practice?
If current efforts in statewide smoke-free policy adoption continue, all states could have comprehensive smoke-free policies by 2020. However, this will require accelerated progress in the South, where no state currently has a comprehensive state smoke-free law in effect.
¶ Additional information is available at http://www.no-smoke.org/pdf/percent-statepops.pdf.
Source: State Tobacco Activities Tracking and Evaluation System, Office on Smoking and Health, CDC.
FIGURE. State smoke-free indoor air laws in effect for private work-sites, restaurants, and bars — United States, December 31, 2010
Smoking prohibited in worksites, restaurants, and barsSmoking prohibited in two venue typesSmoking prohibited in one venue typeLess restrictive or no restrictions
DC
Morbidity and Mortality Weekly Report
MMWR / April 22, 2011 / Vol. 60 / No. 15 475
all 50 states and DC can be achieved if such laws continue to be adopted at the current pace, and activities are intensified in southern states.
Acknowledgments
This report is based, in part, on contributions by R Patrick, JD, and B Ketterer, MayaTech Corporation, Silver Spring, Maryland.
References 1. US Department of Health and Human Services. The health consequences
of involuntary exposure to tobacco smoke: a report of the Surgeon General. Atlanta, GA: US Department of Health and Human Services, CDC; 2006. Available at http://www.surgeongeneral.gov/library/secondhandsmoke/report. Accessed April 14, 2011.
2. International Agency for Research on Cancer. Evaluating the effectiveness of smoke-free policies. Lyon, France: International Agency for Research on Cancer; 2009.
3. Institute of Medicine. Secondhand smoke exposure and cardiovascular effects: making sense of the evidence. Washington, DC: The National Academies Press; 2010.
4. Mackay D, Haw S, Ayres JG, Fischbacher C, Pell JP. Smoke-free legisla-tion and hospitalizations for childhood asthma. N Engl J Med 2010; 363:1139–45.
5. Herman PM, Walsh ME. Hospital admissions for acute myocardial infarction, angina, stroke, and asthma after implementation of Arizona’s comprehensive statewide smoking ban. Am J Public Health 2011; 101:491–6.
6. CDC. Vital Signs: Current cigarette smoking among adults aged ≥18 years—United States, 2009. MMWR 2010;59:1135–40.
7. Rogers EM, Peterson JC. Diffusion of clean indoor air ordinances in the southwestern United States. Health Educ Behav 2008;35:683.
8. CDC. Health hazard evaluation report: environmental and biological assessment of environmental tobacco smoke exposure among casino dealers, Las Vegas, Nevada. Cincinnati, OH: US Department of Health and Human Services, CDC, National Institute for Occupational Safety and Health; 2009. Available at http://www.cdc.gov/niosh/hhe/reports/pdfs/2005-0201-3080.pdf. Accessed April 14, 2011.
9. King BA, Travers MJ, Cummings KM, Mahoney MC, Hyland AJ. Secondhand smoke transfer in multiunit housing. Nicotine Tob Res 2010;12:1133–41.
10. Wilson KM, Klein JD, Blumkin AK, Gottlieb M, Winickoff JP. Tobacco-smoke exposure in children who live in multiunit housing. Pediatrics 2011;127:85–92.
Morbidity and Mortality Weekly Report
476 MMWR / April 22, 2011 / Vol. 60 / No. 15
The ProblemIn 2009, malaria, a disease transmitted by the bite of an
infective Anopheles mosquito, caused an estimated 225 mil-lion clinical cases and 781,000 deaths worldwide, of which more than 90% occurred in children aged <5 years in Africa (1). Approximately half of the world’s population, or 3 billion persons, are at risk for acquiring the illness. Malaria is trans-mitted most intensely in central and western Africa, where in some areas >40% of children aged <10 years are infected and residents can be bitten by more than one infective mosquito every day of the year (2).
Malaria in humans is caused mainly by four species of the intra-erythrocytic parasite Plasmodium, of which Plasmodium falciparum and P. vivax account for most morbidity worldwide. P. falciparum malaria is the most dangerous and can be fatal in 15%−20% of cases, even when appropriately treated. Death results from severe anemia, seizures and coma, acute respiratory distress syndrome, and other organ failures. P. falciparum also is the species in which resistance to multiple antimalarials has appeared over the past 50 years. The burden of P. falciparum includes placental infection that increases the risk for low birth weight and subsequent infant mortality or disability. In countries with a high incidence of malaria, economic growth during 1965–1990 was lower by 1.3% per year, compared with countries without high malaria incidence, even after adjusting for other factors (3).
Efforts to combat malaria encompass a continuum from control (reduction of malaria morbidity and mortality) to elimination (cessation of transmission in a defined geographic area) and eradication (global reduction of malaria incidence to zero). The global malaria eradication campaign of the mid-20th century eliminated malaria in 37 of 143 countries where malaria was endemic in 1950, and many other countries substantially decreased malaria incidence and deaths. However, the campaign did not eradicate malaria. Technical setbacks, implementation difficulties, and a paucity of research to find solutions limited success. In 1969, the 22nd World Health Assembly acknowledged the failure of the global eradication campaign, suspended it indefinitely, and consequently placed
new emphasis on improving malaria control to minimize the burden of disease. In the late 1980s and early 1990s, efforts to control malaria were hampered as a result of decreased funding and support and the spread of parasites resistant to antimalarial drugs.
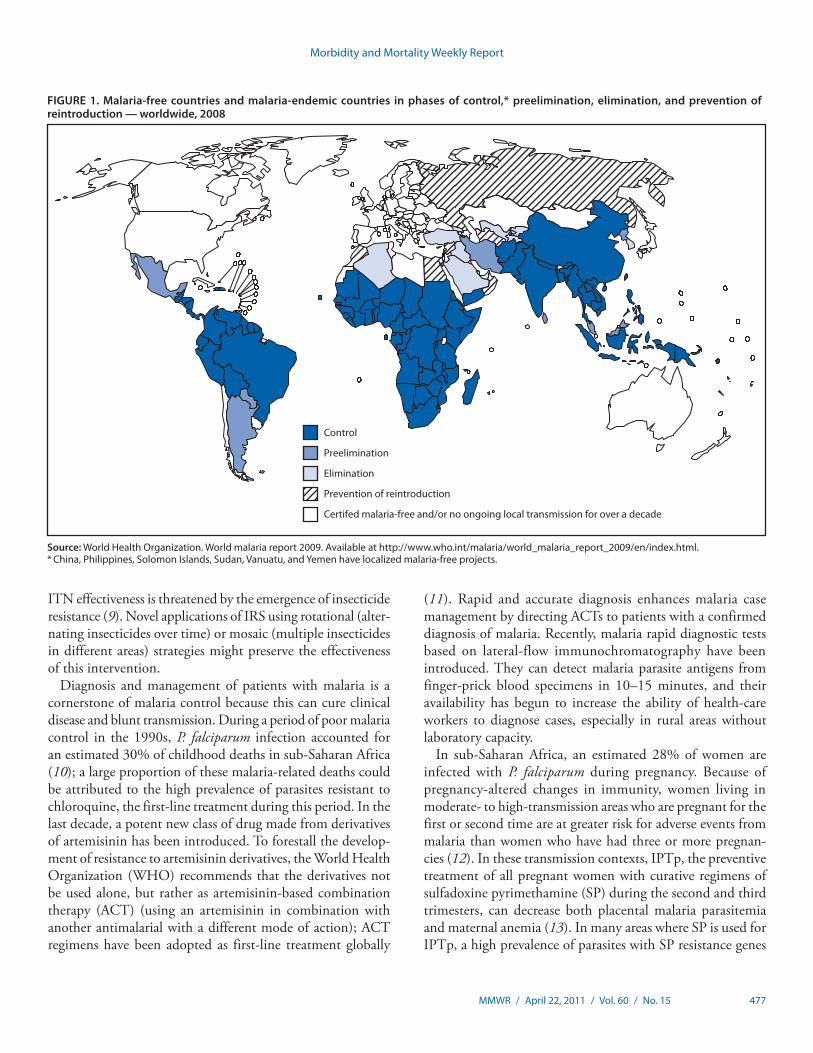
Today, malaria control in areas with high incidence is based on strategic implementation and scale-up of proven, cost-effective interventions. The aim is first to rapidly reduce malaria morbidity and mortality, particularly among high-risk groups such as children and pregnant women, followed by progressive reduction of transmission and elimination from malaria-endemic areas (Figure 1). Global eradication remains the ultimate long-term goal, although it is now approached with perhaps a greater appreciation of its challenges.
Currently Recommended Interventions for Malaria Control
Four proven interventions currently are being scaled up across sub-Saharan Africa: 1) long-lasting insecticide-treated mosquito nets (ITNs), 2) indoor residual spraying (IRS), 3) diagnosis and treatment of infected persons with artemisinin-based combination therapy (ACT), and 4) protection of women with intermittent preventive treatment during preg-nancy (IPTp).
ITNs, evaluated through field trials, have demonstrated a protective efficacy of 17% against all-cause childhood mortality in sub-Saharan Africa and could save up to 5.5 lives each year for every 1,000 children protected (4). Follow-up field trial data show that the child survival benefit from ITNs can last for up to 6 years (5). Additionally, expanding the availability of nets from target groups (pregnant women and children aged <5 years) to cover at least 65% of older children and adults provides some protection even for those without nets (e.g., by reducing mosquito survival and decreasing community para-sitemia) (6). These findings, and the availability of funding, led to a policy aimed at achieving universal coverage rather than a focus on vulnerable groups (7).
IRS is the application of insecticide to the interior walls of houses. Ideally, the insecticide will repel mosquitoes from entering houses and kill them when they rest on treated walls, thus reducing transmission from mosquitoes that bite and rest indoors. Field studies and program experience since the 1950s have demonstrated the effectiveness of IRS in reducing malaria in both stable and unstable (epidemic-prone) malaria transmission settings (8). Like ITNs, IRS is most effective when applied communitywide with high coverage rates. IRS and
Grand Rounds: The Opportunity for and Challenges to Malaria Eradication
This is another in a series of occasional MMWR reports titled CDC Grand Rounds. These reports are based on grand rounds presentations at CDC on high-profile issues in public health sci-ence, practice, and policy. Information about CDC Grand Rounds is available at http://www.cdc.gov/about/grand-rounds.
Morbidity and Mortality Weekly Report
MMWR / April 22, 2011 / Vol. 60 / No. 15 477
ITN effectiveness is threatened by the emergence of insecticide resistance (9). Novel applications of IRS using rotational (alter-nating insecticides over time) or mosaic (multiple insecticides in different areas) strategies might preserve the effectiveness of this intervention.
Diagnosis and management of patients with malaria is a cornerstone of malaria control because this can cure clinical disease and blunt transmission. During a period of poor malaria control in the 1990s, P. falciparum infection accounted for an estimated 30% of childhood deaths in sub-Saharan Africa (10); a large proportion of these malaria-related deaths could be attributed to the high prevalence of parasites resistant to chloroquine, the first-line treatment during this period. In the last decade, a potent new class of drug made from derivatives of artemisinin has been introduced. To forestall the develop-ment of resistance to artemisinin derivatives, the World Health Organization (WHO) recommends that the derivatives not be used alone, but rather as artemisinin-based combination therapy (ACT) (using an artemisinin in combination with another antimalarial with a different mode of action); ACT regimens have been adopted as first-line treatment globally
(11). Rapid and accurate diagnosis enhances malaria case management by directing ACTs to patients with a confirmed diagnosis of malaria. Recently, malaria rapid diagnostic tests based on lateral-flow immunochromatography have been introduced. They can detect malaria parasite antigens from finger-prick blood specimens in 10–15 minutes, and their availability has begun to increase the ability of health-care workers to diagnose cases, especially in rural areas without laboratory capacity.
In sub-Saharan Africa, an estimated 28% of women are infected with P. falciparum during pregnancy. Because of pregnancy-altered changes in immunity, women living in moderate- to high-transmission areas who are pregnant for the first or second time are at greater risk for adverse events from malaria than women who have had three or more pregnan-cies (12). In these transmission contexts, IPTp, the preventive treatment of all pregnant women with curative regimens of sulfadoxine pyrimethamine (SP) during the second and third trimesters, can decrease both placental malaria parasitemia and maternal anemia (13). In many areas where SP is used for IPTp, a high prevalence of parasites with SP resistance genes
FIGURE 1. Malaria-free countries and malaria-endemic countries in phases of control,* preelimination, elimination, and prevention of reintroduction — worldwide, 2008
Source: World Health Organization. World malaria report 2009. Available at http://www.who.int/malaria/world_malaria_report_2009/en/index.html.* China, Philippines, Solomon Islands, Sudan, Vanuatu, and Yemen have localized malaria-free projects.
Preelimination
Control
Elimination
Prevention of reintroduction
Certifed malaria-free and/or no ongoing local transmission for over a decade
Morbidity and Mortality Weekly Report
478 MMWR / April 22, 2011 / Vol. 60 / No. 15
and concomitant failures of SP monotherapy for clinical malaria treatment in children have been observed. Whether SP resistance might alter the effectiveness of SP for IPTp is unclear and underscores the need to continue monitoring its efficacy in curing P. falciparum infection in pregnant women and the need for support for research into new medications for IPTp.
Progress and Strategies Toward Malaria Eradication
Developments at the turn of the millennium gave rise to renewed optimism for malaria control. Global partnerships to coordinate work were established, notably the Roll Back Malaria (RBM) partnership (information available at http://www.rollbackmalaria.org). Unprecedented funding for program scale-up became available through donor mechanisms such as the Global Fund to Fight AIDS, Tuberculosis, and Malaria; the World Bank; and the U.S. President’s Malaria Initiative. Leaders in malaria-endemic countries committed to malaria control as a national priority through assent to RBM’s Abuja Declaration and adoption of UN Millennium Development Goals.
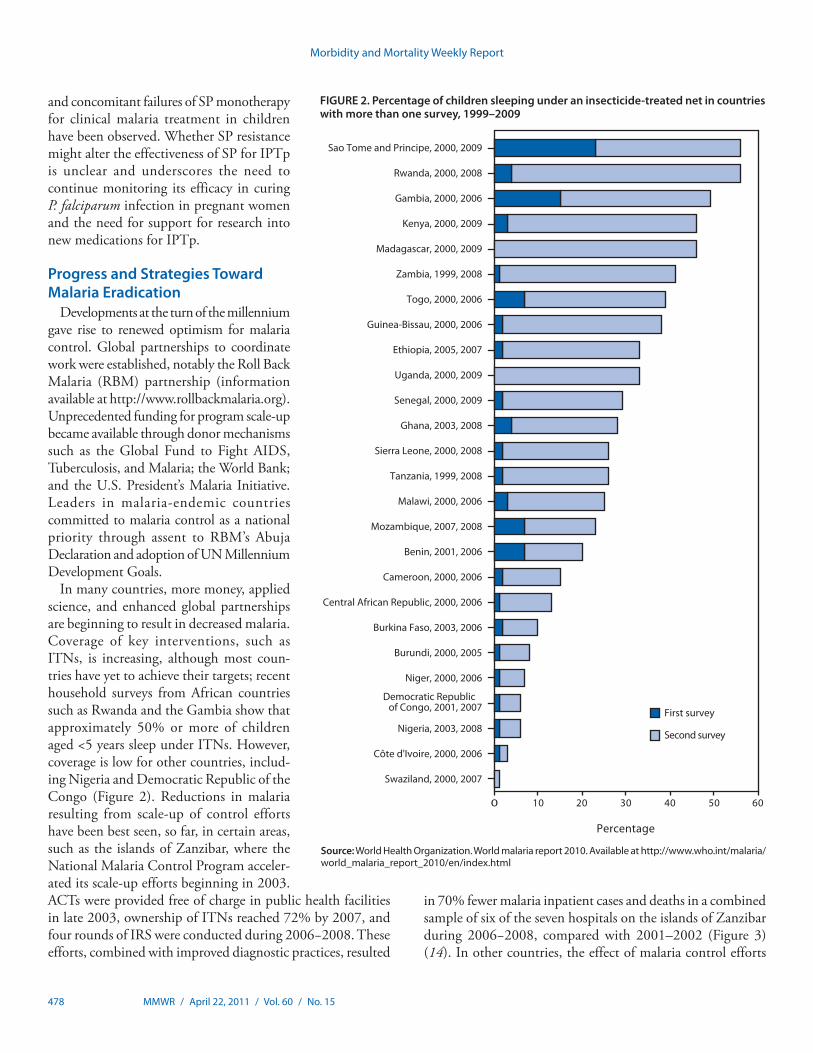
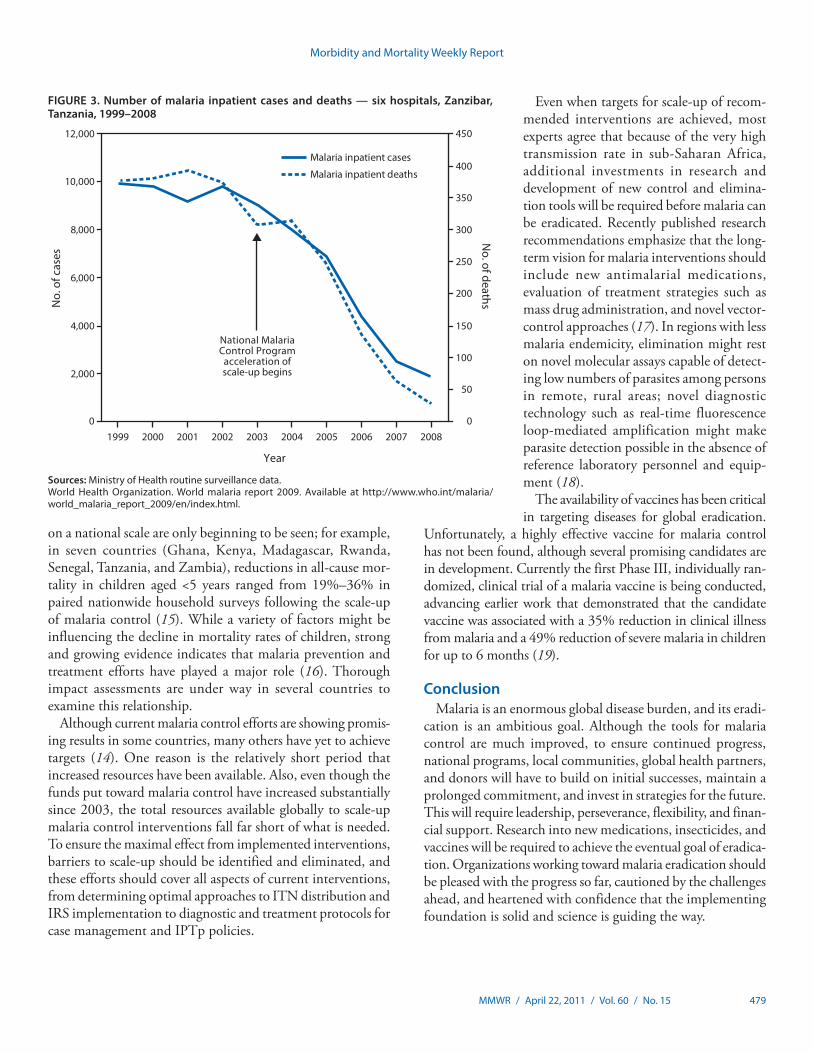
In many countries, more money, applied science, and enhanced global partnerships are beginning to result in decreased malaria. Coverage of key interventions, such as ITNs, is increasing, although most coun-tries have yet to achieve their targets; recent household surveys from African countries such as Rwanda and the Gambia show that approximately 50% or more of children aged <5 years sleep under ITNs. However, coverage is low for other countries, includ-ing Nigeria and Democratic Republic of the Congo (Figure 2). Reductions in malaria resulting from scale-up of control efforts have been best seen, so far, in certain areas, such as the islands of Zanzibar, where the National Malaria Control Program acceler-ated its scale-up efforts beginning in 2003. ACTs were provided free of charge in public health facilities in late 2003, ownership of ITNs reached 72% by 2007, and four rounds of IRS were conducted during 2006−2008. These efforts, combined with improved diagnostic practices, resulted
in 70% fewer malaria inpatient cases and deaths in a combined sample of six of the seven hospitals on the islands of Zanzibar during 2006−2008, compared with 2001–2002 (Figure 3) (14). In other countries, the effect of malaria control efforts
Source: World Health Organization. World malaria report 2010. Available at http://www.who.int/malaria/world_malaria_report_2010/en/index.html
FIGURE 2. Percentage of children sleeping under an insecticide-treated net in countries with more than one survey, 1999–2009
0 10 20 30 40 50 60
Swaziland, 2000, 2007
Côte d'Ivoire, 2000, 2006
Nigeria, 2003, 2008
Democratic Republic of Congo, 2001, 2007
Niger, 2000, 2006
Burundi, 2000, 2005
Uganda, 2000, 2009
Burkina Faso, 2003, 2006
Cameroon, 2000, 2006
Central African Republic, 2000, 2006
Benin, 2001, 2006
Mozambique, 2007, 2008
Malawi, 2000, 2006
Tanzania, 1999, 2008
Sierra Leone, 2000, 2008
Ghana, 2003, 2008
Senegal, 2000, 2009
Ethiopia, 2005, 2007
Togo, 2000, 2006
Guinea-Bissau, 2000, 2006
Zambia, 1999, 2008
Madagascar, 2000, 2009
Kenya, 2000, 2009
Gambia, 2000, 2006
Rwanda, 2000, 2008
Sao Tome and Principe, 2000, 2009
Percentage
Second survey
First survey
Morbidity and Mortality Weekly Report
MMWR / April 22, 2011 / Vol. 60 / No. 15 479
on a national scale are only beginning to be seen; for example, in seven countries (Ghana, Kenya, Madagascar, Rwanda, Senegal, Tanzania, and Zambia), reductions in all-cause mor-tality in children aged <5 years ranged from 19%–36% in paired nationwide household surveys following the scale-up of malaria control (15). While a variety of factors might be influencing the decline in mortality rates of children, strong and growing evidence indicates that malaria prevention and treatment efforts have played a major role (16). Thorough impact assessments are under way in several countries to examine this relationship.
Although current malaria control efforts are showing promis-ing results in some countries, many others have yet to achieve targets (14). One reason is the relatively short period that increased resources have been available. Also, even though the funds put toward malaria control have increased substantially since 2003, the total resources available globally to scale-up malaria control interventions fall far short of what is needed. To ensure the maximal effect from implemented interventions, barriers to scale-up should be identified and eliminated, and these efforts should cover all aspects of current interventions, from determining optimal approaches to ITN distribution and IRS implementation to diagnostic and treatment protocols for case management and IPTp policies.
Even when targets for scale-up of recom-mended interventions are achieved, most experts agree that because of the very high transmission rate in sub-Saharan Africa, additional investments in research and development of new control and elimina-tion tools will be required before malaria can be eradicated. Recently published research recommendations emphasize that the long-term vision for malaria interventions should include new antimalarial medications, evaluation of treatment strategies such as mass drug administration, and novel vector-control approaches (17). In regions with less malaria endemicity, elimination might rest on novel molecular assays capable of detect-ing low numbers of parasites among persons in remote, rural areas; novel diagnostic technology such as real-time fluorescence loop-mediated amplification might make parasite detection possible in the absence of reference laboratory personnel and equip-ment (18).
The availability of vaccines has been critical in targeting diseases for global eradication.
Unfortunately, a highly effective vaccine for malaria control has not been found, although several promising candidates are in development. Currently the first Phase III, individually ran-domized, clinical trial of a malaria vaccine is being conducted, advancing earlier work that demonstrated that the candidate vaccine was associated with a 35% reduction in clinical illness from malaria and a 49% reduction of severe malaria in children for up to 6 months (19).
ConclusionMalaria is an enormous global disease burden, and its eradi-
cation is an ambitious goal. Although the tools for malaria control are much improved, to ensure continued progress, national programs, local communities, global health partners, and donors will have to build on initial successes, maintain a prolonged commitment, and invest in strategies for the future. This will require leadership, perseverance, flexibility, and finan-cial support. Research into new medications, insecticides, and vaccines will be required to achieve the eventual goal of eradica-tion. Organizations working toward malaria eradication should be pleased with the progress so far, cautioned by the challenges ahead, and heartened with confidence that the implementing foundation is solid and science is guiding the way.
Sources: Ministry of Health routine surveillance data.World Health Organization. World malaria report 2009. Available at http://www.who.int/malaria/world_malaria_report_2009/en/index.html.
FIGURE 3. Number of malaria inpatient cases and deaths — six hospitals, Zanzibar, Tanzania, 1999–2008
0
2,000
4,000
6,000
8,000
10,000
12,000
No.
of c
ases
0
50
100
150
200
250
300
350
400
450
No. of deaths
Malaria inpatient cases
Malaria inpatient deaths
National MalariaControl Program
acceleration ofscale-up begins
200720062005200420032002200120001999 2008
Year
Morbidity and Mortality Weekly Report
480 MMWR / April 22, 2011 / Vol. 60 / No. 15
Reported by
KE Mace, PhD,* MF Lynch, MD, JR MacArthur, MD, SP Kachur, MD, L Slutsker, MD, Div of Parasitic Diseases and Malaria, Center for Global Health, CDC. RW Steketee, MD, Malaria Control and Evaluation Partnership in Africa, PATH, Seattle, Washington. T Popovic, MD, PhD, Office of the Director, CDC. *Corresponding contributor: Kimberly E. Mace, Div of Parasitic Diseases and Malaria, Center for Global Health, CDC, 770-488-7118, [email protected].
References 1. World Health Organization. World malaria report 2010. Geneva,
Switzerland: World Health Organization; 2010. Available at http://www.who.int/malaria/world_malaria_report_2010/en/index.html. Accessed April 18, 2011.
2. Hay SI, Guerra CA, Gething PW, et al. A world malaria map: Plasmodium falciparum endemicity in 2007. PLoS Med 2009;6(3):e1000048.
3. Gallup JL, Sachs JD. The economic burden of malaria. Am J Trop Med Hyg 2001;64(1–2 Suppl):85–96.
4. Lengeler C. Insecticide-treated bed nets and curtains for preventing malaria. Cochrane Database Syst Rev 2004;(2):CD000363.
5. Lindblade KA, Eisele TP, Gimnig JE, et al. Sustainability of reductions in malaria transmission and infant mortality in western Kenya with use of insecticide-treated bednets: 4 to 6 years of follow-up. JAMA 2004; 291:2571–80.
6. Killeen GF, Smith TA, Ferguson HM, et al. Preventing childhood malaria in Africa by protecting adults from mosquitoes with insecticide-treated nets. PLoS Med 2007;4:e229.
7. World Health Organization. Insecticide-treated mosquito nets: a WHO position statement. Geneva, Switzerland: World Health Organization, Global Malaria Programme; 2007. Available at http://www.who.int/entity/malaria/publications/atoz/itnspospaperfinal.pdf. Accessed April 18, 2011.
8. Pluess B, Tanser FC, Lengeler C, Sharp BL. Indoor residual spraying for preventing malaria. Cochrane Database Syst Rev 2010;(4):CD006657.
9. Ranson H, N’Guessan R, Lines J, Moiroux N, Nkuni Z, Corbel V. Pyrethroid resistance in African anopheline mosquitoes: what are the implications for malaria control? Trends Parasitol 2011;27:91–8.
10. Snow RW, Trape JF, Marsh K. The past, present and future of childhood malaria mortality in Africa. Trends Parasitol 2001;17:593–7.
11. World Health Organization. Guidelines for the treatment of malaria. 2nd ed. Geneva, Switzerland: World Health Organization; 2010. Available at http://www.who.int/malaria/publications/atoz/9789241547925/ en/index.html. Accessed April 18, 2011.
12. Steketee RW, Breman JG, Paluku KM, Moore M, Roy J, Ma-Disu M. Malaria infection in pregnant women in Zaire: the effects and the potential for intervention. Ann Trop Med Parasitol 1988;82:113–20.
13. ter Kuile FO, van Eijk AM, Filler SJ. Effect of sulfadoxine-pyrimethamine resistance on the efficacy of intermittent preventive therapy for malaria control during pregnancy: a systematic review. JAMA 2007;297:2603–16.
14. World Health Organization. World malaria report 2009. Geneva, Switzerland: World Health Organization; 2009. Available at http://www.who.int/malaria/world_malaria_report_2009/en/index.html. Accessed April 18, 2011.
15. United States Agency for International Development. President’s Malaria Initiative. Sustaining momentum against malaria: saving lives in Africa. Fourth annual report. Washington, DC: US Agency for International Development; 2010. Available at http://www.fighting malaria.gov/resources/reports/index.html. Accessed April 18, 2011.
16. Steketee RW, Campbell CC. Impact of national malaria control scale-up programmes in Africa: magnitude and attribution of effects. Malar J 2010;9:299.
17. Alonso PL, Brown G, Arevalo-Herrera M, et al. A research agenda to underpin malaria eradication. PLoS Med 2011;8:e1000406.
18. Lucchi NW, Demas A, Narayanan J, et al. Real-time fluorescence loop mediated isothermal amplification for the diagnosis of malaria. PLoS One 2010;5:e13733.
19. Alonso PL, Sacarlal J, Aponte JJ, et al. Efficacy of the RTS,S/AS02A vaccine against Plasmodium falciparum infection and disease in young African children: randomised controlled trial. Lancet 2004;364:1411–20.
Morbidity and Mortality Weekly Report
MMWR / April 22, 2011 / Vol. 60 / No. 15 481
World Malaria Day — April 25, 2011World Malaria Day is commemorated on April 25, the date
in 2000 when 44 African leaders met in Abuja, Nigeria, and signed the Abuja Declaration, committing their countries to cutting malaria deaths in half by 2010. In the decade since, increased funding and efforts have led to a scale-up of effec-tive malaria interventions in many countries. In 2009, malaria caused an estimated 781,000 deaths worldwide, down from an estimated 985,000 in 2000. In 32 of the 56 malaria-endemic countries outside Africa, the number of confirmed malaria cases declined more than 50%. By 2010, 11 countries and one area in the World Health Organization’s African Region showed a reduction of more than 50% in confirmed malaria cases or admissions and deaths (1).
The theme of World Malaria Day, “Achieving Progress and Impact,” highlights the successes worldwide and provides an opportunity to take stock of the current state of malaria globally and to consider how to achieve the U.N Secretary-General’s goal of near zero deaths by 2015. CDC contributes to these efforts through the President’s Malaria Initiative (PMI), a U.S. government interagency initiative to reduce malaria in 17 countries in sub-Saharan Africa and in the Greater Mekong subregion in Asia. PMI is led by the U.S. Agency for International Development (USAID) and is implemented by USAID and CDC, in collaboration with host ministries of health and local and international partners.
CDC also conducts multidisciplinary strategic and applied research globally to better understand malaria and develop safe, effective interventions that can lead to malaria’s elimination and eventual eradication. Additional information regarding CDC’s malaria activities is available at http://www.cdc.gov/malaria.
Reference1. World Health Organization. World malaria report 2010. Geneva,
Switzerland: World Health Organization; 2010. Available at http://www.who.int/malaria/world_malaria_report_2010/en/index.html. Accessed April 18, 2011.
National Infant Immunization Week — April 23–30, 2011
CDC observes the 17th annual National Infant Immunization Week (NIIW) during April 23–30, 2011. Local and state health departments, national immunization partners, health-care professionals, and community leaders from across the country will collaborate to highlight the achievements and benefits of immunization through community-wide activities and
events, including grand rounds and educational training for health-care professionals and parents, media briefings, and immunization clinics.
NIIW is now part of a broad global initiative that is held in conjunction with the Pan American Health Organization’s (PAHO) Vaccination Week in the Americas. Ten border states have partnered with PAHO and the United States-Mexico Border Health Commission to bring additional focus to infant immunization in the U.S.-Mexico border region. In addition, the World Health Organization’s European, Eastern Mediterranean, and African regions also are observing simulta-neous immunization weeks. In all, approximately 100 countries are expected to participate in the week-long campaign to call attention to the critical role that vaccination plays in safeguard-ing public health globally.
Currently, in the United States, CDC recommends that children aged ≤2 years receive vaccines to protect against 14 diseases (1). In September 2010, CDC announced that child-hood immunization rates for vaccines routinely recommended for children remain at or near record highs (2). Parental acceptance of routine childhood immunization is essential because high vaccination coverage results in decreased rates of vaccine-preventable diseases. Results from a recent survey of U.S. parents with children aged <6 years show that a majority of parents are confident or very confident in vaccine safety (79.0%) and believe that vaccines are important to children’s health (79.8%) (3). This same survey showed that health-care providers are parents’ most important source of information for making decisions regarding vaccination (81.7%). To help facilitate communication between health-care providers and parents about vaccines, vaccine safety, and vaccine-preventable diseases, CDC, the American Academy of Pediatrics, and the American Academy of Family Physicians have developed a series of educational materials called Provider Resources for Vaccine Conversations with Parents (available at http://www.cdc.gov/vaccines/conversations). These resources will be a focus of this week’s NIIW educational efforts. Additional information about NIIW is available at http://www.cdc.gov/vaccines/events/niiw.
References1. CDC. Recommended immunization schedules for persons aged 0 through
18 years—United States, 2011. MMWR 2011;60(5). 2. CDC. National, state, and local area vaccination coverage among children
aged 19–35 months—United States, 2009. MMWR 2010;59:1171–7.3. Kennedy A, Basket M, Sheedy K. Vaccine attitudes, concerns, and infor-
mation sources reported by parents of young children: results from the 2009 HealthStyles survey. Pediatrics 2011;127(Suppl 3):S1–8.
Announcements
Morbidity and Mortality Weekly Report
482 MMWR / April 22, 2011 / Vol. 60 / No. 15
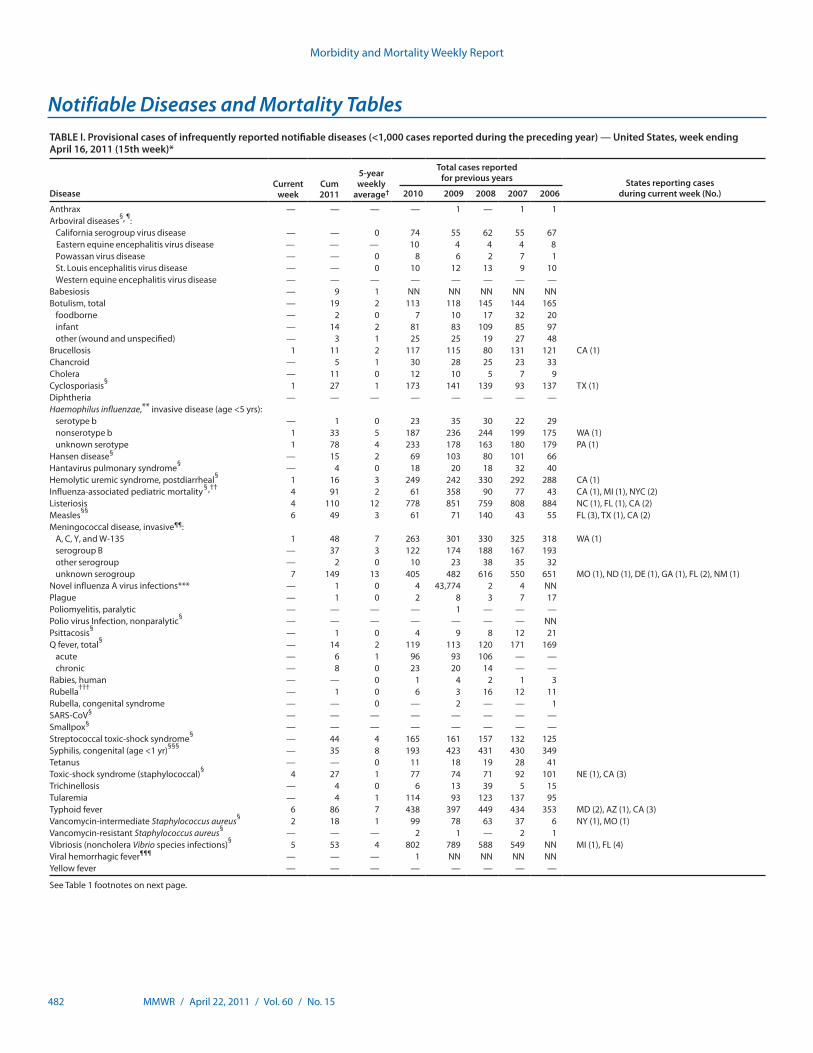
TABLE I. Provisional cases of infrequently reported notifiable diseases (<1,000 cases reported during the preceding year) — United States, week ending April 16, 2011 (15th week)*
DiseaseCurrent
weekCum 2011
5-year weekly
average†
Total cases reported for previous years States reporting cases
during current week (No.)2010 2009 2008 2007 2006
Anthrax — — — — 1 — 1 1Arboviral diseases§, ¶:
California serogroup virus disease — — 0 74 55 62 55 67Eastern equine encephalitis virus disease — — — 10 4 4 4 8Powassan virus disease — — 0 8 6 2 7 1St. Louis encephalitis virus disease — — 0 10 12 13 9 10Western equine encephalitis virus disease — — — — — — — —
Babesiosis — 9 1 NN NN NN NN NNBotulism, total — 19 2 113 118 145 144 165
foodborne — 2 0 7 10 17 32 20infant — 14 2 81 83 109 85 97other (wound and unspecified) — 3 1 25 25 19 27 48
Brucellosis 1 11 2 117 115 80 131 121 CA (1)Chancroid — 5 1 30 28 25 23 33Cholera — 11 0 12 10 5 7 9Cyclosporiasis§ 1 27 1 173 141 139 93 137 TX (1)Diphtheria — — — — — — — —Haemophilus influenzae,** invasive disease (age <5 yrs):
serotype b — 1 0 23 35 30 22 29nonserotype b 1 33 5 187 236 244 199 175 WA (1)unknown serotype 1 78 4 233 178 163 180 179 PA (1)
Hansen disease§ — 15 2 69 103 80 101 66Hantavirus pulmonary syndrome§ — 4 0 18 20 18 32 40Hemolytic uremic syndrome, postdiarrheal§ 1 16 3 249 242 330 292 288 CA (1)Influenza-associated pediatric mortality§,†† 4 91 2 61 358 90 77 43 CA (1), MI (1), NYC (2)Listeriosis 4 110 12 778 851 759 808 884 NC (1), FL (1), CA (2)Measles§§ 6 49 3 61 71 140 43 55 FL (3), TX (1), CA (2)Meningococcal disease, invasive¶¶:
A, C, Y, and W-135 1 48 7 263 301 330 325 318 WA (1)serogroup B — 37 3 122 174 188 167 193other serogroup — 2 0 10 23 38 35 32unknown serogroup 7 149 13 405 482 616 550 651 MO (1), ND (1), DE (1), GA (1), FL (2), NM (1)
Novel influenza A virus infections*** — 1 0 4 43,774 2 4 NNPlague — 1 0 2 8 3 7 17Poliomyelitis, paralytic — — — — 1 — — —Polio virus Infection, nonparalytic§ — — — — — — — NNPsittacosis§ — 1 0 4 9 8 12 21Q fever, total§ — 14 2 119 113 120 171 169
acute — 6 1 96 93 106 — —chronic — 8 0 23 20 14 — —
Rabies, human — — 0 1 4 2 1 3Rubella††† — 1 0 6 3 16 12 11Rubella, congenital syndrome — — 0 — 2 — — 1SARS-CoV§ — — — — — — — —Smallpox§ — — — — — — — —Streptococcal toxic-shock syndrome§ — 44 4 165 161 157 132 125Syphilis, congenital (age <1 yr)§§§ — 35 8 193 423 431 430 349Tetanus — — 0 11 18 19 28 41Toxic-shock syndrome (staphylococcal)§ 4 27 1 77 74 71 92 101 NE (1), CA (3)Trichinellosis — 4 0 6 13 39 5 15Tularemia — 4 1 114 93 123 137 95Typhoid fever 6 86 7 438 397 449 434 353 MD (2), AZ (1), CA (3)Vancomycin-intermediate Staphylococcus aureus§ 2 18 1 99 78 63 37 6 NY (1), MO (1)Vancomycin-resistant Staphylococcus aureus§ — — — 2 1 — 2 1Vibriosis (noncholera Vibrio species infections)§ 5 53 4 802 789 588 549 NN MI (1), FL (4)Viral hemorrhagic fever¶¶¶ — — — 1 NN NN NN NNYellow fever — — — — — — — —
See Table 1 footnotes on next page.
Notifiable Diseases and Mortality Tables

Morbidity and Mortality Weekly Report
MMWR / April 22, 2011 / Vol. 60 / No. 15 483
Notifiable Disease Data Team and 122 Cities Mortality Data Team Willie J. AndersonDeborah A. Adams Rosaline DharaWillie J. Anderson Pearl C. SharpMichael S. Wodajo Lenee Blanton
* Ratio of current 4-week total to mean of 15 4-week totals (from previous, comparable, and subsequent 4-week periods for the past 5 years). The point where the hatched area begins is based on the mean and two standard deviations of these 4-week totals.
FIGURE I. Selected notifiable disease reports, United States, comparison of provisional 4-week totals April 16, 2011, with historical data
820.06250.03125 1
Beyond historical limits
DISEASE
Ratio (Log scale)*
DECREASE INCREASECASES CURRENT
4 WEEKS
Hepatitis A, acute
Hepatitis B, acute
Hepatitis C, acute
Legionellosis
Measles
Mumps
Pertussis
Giardiasis
Meningococcal disease
717
54
87
44
86
15
33
7
467
0.25 0.50.125 4
TABLE I. (Continued) Provisional cases of infrequently reported notifiable diseases (<1,000 cases reported during the preceding year) — United States, week ending April 16, 2011 (15th week)*
—: No reported cases. N: Not reportable. NN: Not Nationally Notifiable. Cum: Cumulative year-to-date counts. * Case counts for reporting years 2010 and 2011 are provisional and subject to change. For further information on interpretation of these data, see http://www.cdc.gov/osels/ph_surveillance/
nndss/phs/files/ProvisionalNationa%20NotifiableDiseasesSurveillanceData20100927.pdf. † Calculated by summing the incidence counts for the current week, the 2 weeks preceding the current week, and the 2 weeks following the current week, for a total of 5 preceding years.
Additional information is available at http://www.cdc.gov/osels/ph_surveillance/nndss/phs/files/5yearweeklyaverage.pdf. § Not reportable in all states. Data from states where the condition is not reportable are excluded from this table except starting in 2007 for the arboviral diseases, STD data, TB data, and
influenza-associated pediatric mortality, and in 2003 for SARS-CoV. Reporting exceptions are available at http://www.cdc.gov/osels/ph_surveillance/nndss/phs/infdis.htm. ¶ Includes both neuroinvasive and nonneuroinvasive. Updated weekly from reports to the Division of Vector-Borne Infectious Diseases, National Center for Zoonotic, Vector-Borne, and
Enteric Diseases (ArboNET Surveillance). Data for West Nile virus are available in Table II. ** Data for H. influenzae (all ages, all serotypes) are available in Table II. †† Updated weekly from reports to the Influenza Division, National Center for Immunization and Respiratory Diseases. Since October 3, 2010, 95 influenza-associated pediatric deaths
occurring during the 2010-11 influenza season have been reported. §§ The six measles cases reported for the current week were imported. ¶¶ Data for meningococcal disease (all serogroups) are available in Table II. *** CDC discontinued reporting of individual confirmed and probable cases of 2009 pandemic influenza A (H1N1) virus infections on July 24, 2009. During 2009, four cases of human infection
with novel influenza A viruses, different from the 2009 pandemic influenza A (H1N1) strain, were reported to CDC. The four cases of novel influenza A virus infection reported to CDC during 2010, and the one case reported during 2011, were identified as swine influenza A (H3N2) virus and are unrelated to the 2009 pandemic influenza A (H1N1) virus. Total case counts for 2009 were provided by the Influenza Division, National Center for Immunization and Respiratory Diseases (NCIRD).
††† No rubella cases were reported for the current week. §§§ Updated weekly from reports to the Division of STD Prevention, National Center for HIV/AIDS, Viral Hepatitis, STD, and TB Prevention. ¶¶¶ There was one case of viral hemorrhagic fever reported during week 12 of 2010. The one case report was confirmed as lassa fever. See Table II for dengue hemorrhagic fever.
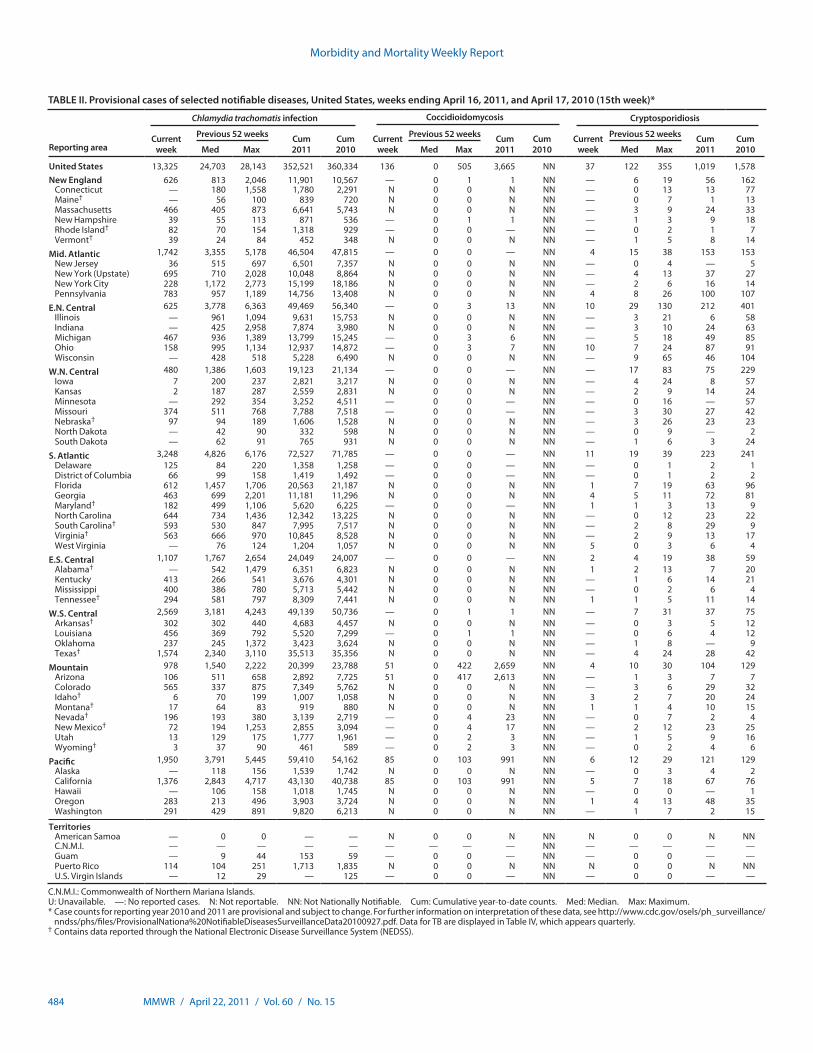
Morbidity and Mortality Weekly Report
484 MMWR / April 22, 2011 / Vol. 60 / No. 15
TABLE II. Provisional cases of selected notifiable diseases, United States, weeks ending April 16, 2011, and April 17, 2010 (15th week)*
Reporting area
Chlamydia trachomatis infection Coccidioidomycosis Cryptosporidiosis
Current week
Previous 52 weeks Cum 2011
Cum 2010
Current week
Previous 52 weeks Cum 2011
Cum 2010
Current week
Previous 52 weeks Cum 2011
Cum 2010Med Max Med Max Med Max
United States 13,325 24,703 28,143 352,521 360,334 136 0 505 3,665 NN 37 122 355 1,019 1,578New England 626 813 2,046 11,901 10,567 — 0 1 1 NN — 6 19 56 162
Connecticut — 180 1,558 1,780 2,291 N 0 0 N NN — 0 13 13 77Maine† — 56 100 839 720 N 0 0 N NN — 0 7 1 13Massachusetts 466 405 873 6,641 5,743 N 0 0 N NN — 3 9 24 33New Hampshire 39 55 113 871 536 — 0 1 1 NN — 1 3 9 18Rhode Island† 82 70 154 1,318 929 — 0 0 — NN — 0 2 1 7Vermont† 39 24 84 452 348 N 0 0 N NN — 1 5 8 14
Mid. Atlantic 1,742 3,355 5,178 46,504 47,815 — 0 0 — NN 4 15 38 153 153New Jersey 36 515 697 6,501 7,357 N 0 0 N NN — 0 4 — 5New York (Upstate) 695 710 2,028 10,048 8,864 N 0 0 N NN — 4 13 37 27New York City 228 1,172 2,773 15,199 18,186 N 0 0 N NN — 2 6 16 14Pennsylvania 783 957 1,189 14,756 13,408 N 0 0 N NN 4 8 26 100 107
E.N. Central 625 3,778 6,363 49,469 56,340 — 0 3 13 NN 10 29 130 212 401Illinois — 961 1,094 9,631 15,753 N 0 0 N NN — 3 21 6 58Indiana — 425 2,958 7,874 3,980 N 0 0 N NN — 3 10 24 63Michigan 467 936 1,389 13,799 15,245 — 0 3 6 NN — 5 18 49 85Ohio 158 995 1,134 12,937 14,872 — 0 3 7 NN 10 7 24 87 91Wisconsin — 428 518 5,228 6,490 N 0 0 N NN — 9 65 46 104
W.N. Central 480 1,386 1,603 19,123 21,134 — 0 0 — NN — 17 83 75 229Iowa 7 200 237 2,821 3,217 N 0 0 N NN — 4 24 8 57Kansas 2 187 287 2,559 2,831 N 0 0 N NN — 2 9 14 24Minnesota — 292 354 3,252 4,511 — 0 0 — NN — 0 16 — 57Missouri 374 511 768 7,788 7,518 — 0 0 — NN — 3 30 27 42Nebraska† 97 94 189 1,606 1,528 N 0 0 N NN — 3 26 23 23North Dakota — 42 90 332 598 N 0 0 N NN — 0 9 — 2South Dakota — 62 91 765 931 N 0 0 N NN — 1 6 3 24
S. Atlantic 3,248 4,826 6,176 72,527 71,785 — 0 0 — NN 11 19 39 223 241Delaware 125 84 220 1,358 1,258 — 0 0 — NN — 0 1 2 1District of Columbia 66 99 158 1,419 1,492 — 0 0 — NN — 0 1 2 2Florida 612 1,457 1,706 20,563 21,187 N 0 0 N NN 1 7 19 63 96Georgia 463 699 2,201 11,181 11,296 N 0 0 N NN 4 5 11 72 81Maryland† 182 499 1,106 5,620 6,225 — 0 0 — NN 1 1 3 13 9North Carolina 644 734 1,436 12,342 13,225 N 0 0 N NN — 0 12 23 22South Carolina† 593 530 847 7,995 7,517 N 0 0 N NN — 2 8 29 9Virginia† 563 666 970 10,845 8,528 N 0 0 N NN — 2 9 13 17West Virginia — 76 124 1,204 1,057 N 0 0 N NN 5 0 3 6 4
E.S. Central 1,107 1,767 2,654 24,049 24,007 — 0 0 — NN 2 4 19 38 59Alabama† — 542 1,479 6,351 6,823 N 0 0 N NN 1 2 13 7 20Kentucky 413 266 541 3,676 4,301 N 0 0 N NN — 1 6 14 21Mississippi 400 386 780 5,713 5,442 N 0 0 N NN — 0 2 6 4Tennessee† 294 581 797 8,309 7,441 N 0 0 N NN 1 1 5 11 14
W.S. Central 2,569 3,181 4,243 49,139 50,736 — 0 1 1 NN — 7 31 37 75Arkansas† 302 302 440 4,683 4,457 N 0 0 N NN — 0 3 5 12Louisiana 456 369 792 5,520 7,299 — 0 1 1 NN — 0 6 4 12Oklahoma 237 245 1,372 3,423 3,624 N 0 0 N NN — 1 8 — 9Texas† 1,574 2,340 3,110 35,513 35,356 N 0 0 N NN — 4 24 28 42
Mountain 978 1,540 2,222 20,399 23,788 51 0 422 2,659 NN 4 10 30 104 129Arizona 106 511 658 2,892 7,725 51 0 417 2,613 NN — 1 3 7 7Colorado 565 337 875 7,349 5,762 N 0 0 N NN — 3 6 29 32Idaho† 6 70 199 1,007 1,058 N 0 0 N NN 3 2 7 20 24Montana† 17 64 83 919 880 N 0 0 N NN 1 1 4 10 15Nevada† 196 193 380 3,139 2,719 — 0 4 23 NN — 0 7 2 4New Mexico† 72 194 1,253 2,855 3,094 — 0 4 17 NN — 2 12 23 25Utah 13 129 175 1,777 1,961 — 0 2 3 NN — 1 5 9 16Wyoming† 3 37 90 461 589 — 0 2 3 NN — 0 2 4 6
Pacific 1,950 3,791 5,445 59,410 54,162 85 0 103 991 NN 6 12 29 121 129Alaska — 118 156 1,539 1,742 N 0 0 N NN — 0 3 4 2California 1,376 2,843 4,717 43,130 40,738 85 0 103 991 NN 5 7 18 67 76Hawaii — 106 158 1,018 1,745 N 0 0 N NN — 0 0 — 1Oregon 283 213 496 3,903 3,724 N 0 0 N NN 1 4 13 48 35Washington 291 429 891 9,820 6,213 N 0 0 N NN — 1 7 2 15
TerritoriesAmerican Samoa — 0 0 — — N 0 0 N NN N 0 0 N NNC.N.M.I. — — — — — — — — — NN — — — — —Guam — 9 44 153 59 — 0 0 — NN — 0 0 — —Puerto Rico 114 104 251 1,713 1,835 N 0 0 N NN N 0 0 N NNU.S. Virgin Islands — 12 29 — 125 — 0 0 — NN — 0 0 — —
C.N.M.I.: Commonwealth of Northern Mariana Islands.U: Unavailable. —: No reported cases. N: Not reportable. NN: Not Nationally Notifiable. Cum: Cumulative year-to-date counts. Med: Median. Max: Maximum.* Case counts for reporting year 2010 and 2011 are provisional and subject to change. For further information on interpretation of these data, see http://www.cdc.gov/osels/ph_surveillance/
nndss/phs/files/ProvisionalNationa%20NotifiableDiseasesSurveillanceData20100927.pdf. Data for TB are displayed in Table IV, which appears quarterly.† Contains data reported through the National Electronic Disease Surveillance System (NEDSS).
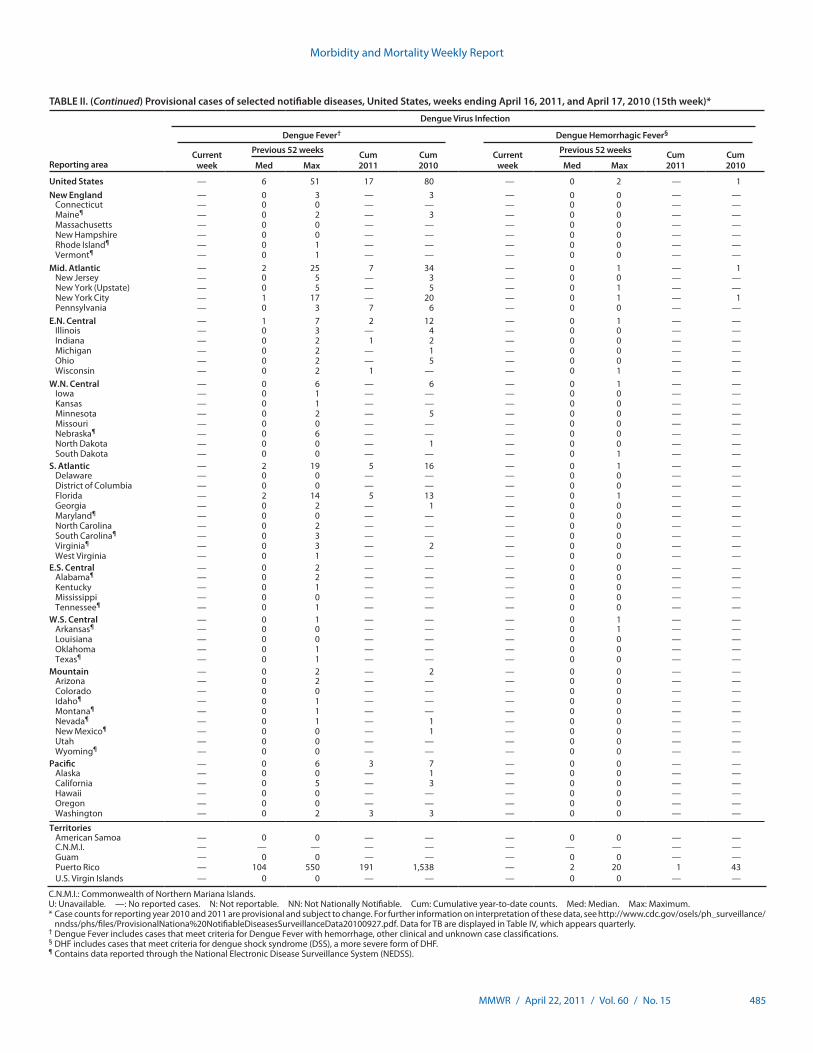
Morbidity and Mortality Weekly Report
MMWR / April 22, 2011 / Vol. 60 / No. 15 485
TABLE II. (Continued) Provisional cases of selected notifiable diseases, United States, weeks ending April 16, 2011, and April 17, 2010 (15th week)*
Reporting area
Dengue Virus Infection
Dengue Fever† Dengue Hemorrhagic Fever§
Current week
Previous 52 weeks Cum 2011
Cum 2010
Current week
Previous 52 weeks Cum 2011
Cum 2010Med Max Med Max
United States — 6 51 17 80 — 0 2 — 1New England — 0 3 — 3 — 0 0 — —
Connecticut — 0 0 — — — 0 0 — —Maine¶ — 0 2 — 3 — 0 0 — —Massachusetts — 0 0 — — — 0 0 — —New Hampshire — 0 0 — — — 0 0 — —Rhode Island¶ — 0 1 — — — 0 0 — —Vermont¶ — 0 1 — — — 0 0 — —
Mid. Atlantic — 2 25 7 34 — 0 1 — 1New Jersey — 0 5 — 3 — 0 0 — —New York (Upstate) — 0 5 — 5 — 0 1 — —New York City — 1 17 — 20 — 0 1 — 1Pennsylvania — 0 3 7 6 — 0 0 — —
E.N. Central — 1 7 2 12 — 0 1 — —Illinois — 0 3 — 4 — 0 0 — —Indiana — 0 2 1 2 — 0 0 — —Michigan — 0 2 — 1 — 0 0 — —Ohio — 0 2 — 5 — 0 0 — —Wisconsin — 0 2 1 — — 0 1 — —
W.N. Central — 0 6 — 6 — 0 1 — —Iowa — 0 1 — — — 0 0 — —Kansas — 0 1 — — — 0 0 — —Minnesota — 0 2 — 5 — 0 0 — —Missouri — 0 0 — — — 0 0 — —Nebraska¶ — 0 6 — — — 0 0 — —North Dakota — 0 0 — 1 — 0 0 — —South Dakota — 0 0 — — — 0 1 — —
S. Atlantic — 2 19 5 16 — 0 1 — —Delaware — 0 0 — — — 0 0 — —District of Columbia — 0 0 — — — 0 0 — —Florida — 2 14 5 13 — 0 1 — —Georgia — 0 2 — 1 — 0 0 — —Maryland¶ — 0 0 — — — 0 0 — —North Carolina — 0 2 — — — 0 0 — —South Carolina¶ — 0 3 — — — 0 0 — —Virginia¶ — 0 3 — 2 — 0 0 — —West Virginia — 0 1 — — — 0 0 — —
E.S. Central — 0 2 — — — 0 0 — —Alabama¶ — 0 2 — — — 0 0 — —Kentucky — 0 1 — — — 0 0 — —Mississippi — 0 0 — — — 0 0 — —Tennessee¶ — 0 1 — — — 0 0 — —
W.S. Central — 0 1 — — — 0 1 — —Arkansas¶ — 0 0 — — — 0 1 — —Louisiana — 0 0 — — — 0 0 — —Oklahoma — 0 1 — — — 0 0 — —Texas¶ — 0 1 — — — 0 0 — —
Mountain — 0 2 — 2 — 0 0 — —Arizona — 0 2 — — — 0 0 — —Colorado — 0 0 — — — 0 0 — —Idaho¶ — 0 1 — — — 0 0 — —Montana¶ — 0 1 — — — 0 0 — —Nevada¶ — 0 1 — 1 — 0 0 — —New Mexico¶ — 0 0 — 1 — 0 0 — —Utah — 0 0 — — — 0 0 — —Wyoming¶ — 0 0 — — — 0 0 — —
Pacific — 0 6 3 7 — 0 0 — —Alaska — 0 0 — 1 — 0 0 — —California — 0 5 — 3 — 0 0 — —Hawaii — 0 0 — — — 0 0 — —Oregon — 0 0 — — — 0 0 — —Washington — 0 2 3 3 — 0 0 — —
TerritoriesAmerican Samoa — 0 0 — — — 0 0 — —C.N.M.I. — — — — — — — — — —Guam — 0 0 — — — 0 0 — —Puerto Rico — 104 550 191 1,538 — 2 20 1 43U.S. Virgin Islands — 0 0 — — — 0 0 — —
C.N.M.I.: Commonwealth of Northern Mariana Islands.U: Unavailable. —: No reported cases. N: Not reportable. NN: Not Nationally Notifiable. Cum: Cumulative year-to-date counts. Med: Median. Max: Maximum.* Case counts for reporting year 2010 and 2011 are provisional and subject to change. For further information on interpretation of these data, see http://www.cdc.gov/osels/ph_surveillance/
nndss/phs/files/ProvisionalNationa%20NotifiableDiseasesSurveillanceData20100927.pdf. Data for TB are displayed in Table IV, which appears quarterly.† Dengue Fever includes cases that meet criteria for Dengue Fever with hemorrhage, other clinical and unknown case classifications.§ DHF includes cases that meet criteria for dengue shock syndrome (DSS), a more severe form of DHF.¶ Contains data reported through the National Electronic Disease Surveillance System (NEDSS).
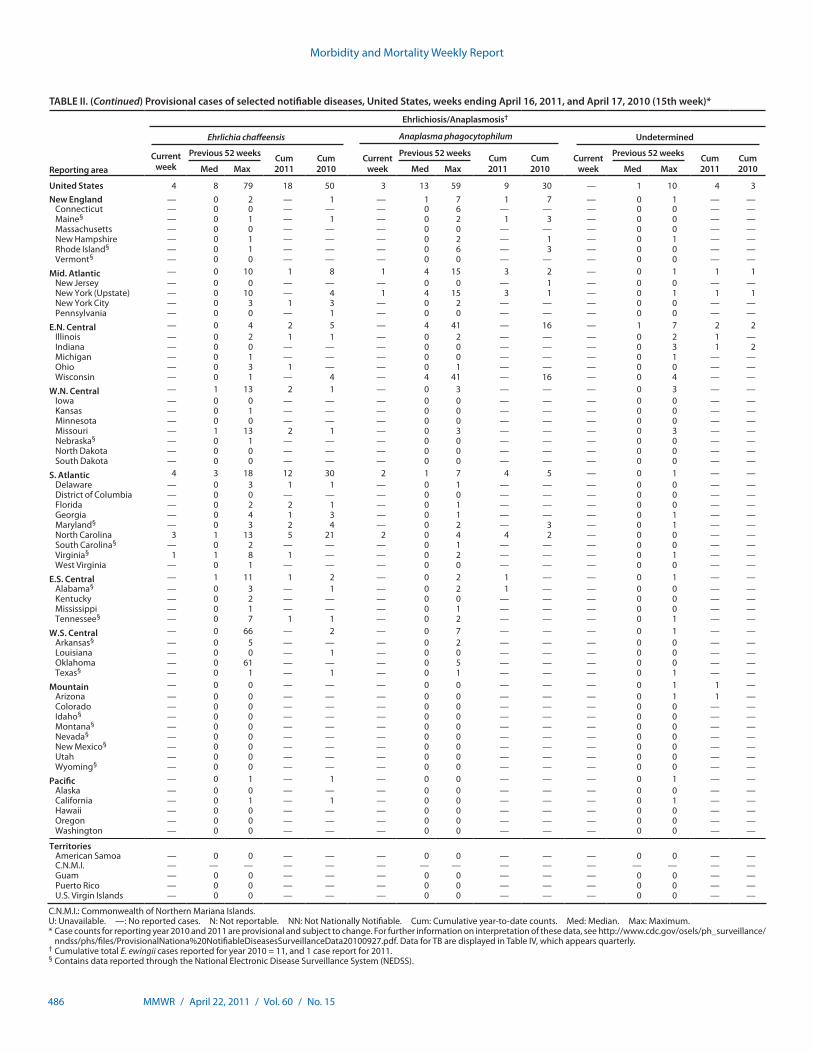
Morbidity and Mortality Weekly Report
486 MMWR / April 22, 2011 / Vol. 60 / No. 15
TABLE II. (Continued) Provisional cases of selected notifiable diseases, United States, weeks ending April 16, 2011, and April 17, 2010 (15th week)*
Reporting area
Ehrlichiosis/Anaplasmosis†
Ehrlichia chaffeensis Anaplasma phagocytophilum Undetermined
Current week
Previous 52 weeks Cum 2011
Cum 2010
Current week
Previous 52 weeks Cum 2011
Cum 2010
Current week
Previous 52 weeks Cum 2011
Cum 2010Med Max Med Max Med Max
United States 4 8 79 18 50 3 13 59 9 30 — 1 10 4 3New England — 0 2 — 1 — 1 7 1 7 — 0 1 — —
Connecticut — 0 0 — — — 0 6 — — — 0 0 — —Maine§ — 0 1 — 1 — 0 2 1 3 — 0 0 — —Massachusetts — 0 0 — — — 0 0 — — — 0 0 — —New Hampshire — 0 1 — — — 0 2 — 1 — 0 1 — —Rhode Island§ — 0 1 — — — 0 6 — 3 — 0 0 — —Vermont§ — 0 0 — — — 0 0 — — — 0 0 — —
Mid. Atlantic — 0 10 1 8 1 4 15 3 2 — 0 1 1 1New Jersey — 0 0 — — — 0 0 — 1 — 0 0 — —New York (Upstate) — 0 10 — 4 1 4 15 3 1 — 0 1 1 1New York City — 0 3 1 3 — 0 2 — — — 0 0 — —Pennsylvania — 0 0 — 1 — 0 0 — — — 0 0 — —
E.N. Central — 0 4 2 5 — 4 41 — 16 — 1 7 2 2Illinois — 0 2 1 1 — 0 2 — — — 0 2 1 —Indiana — 0 0 — — — 0 0 — — — 0 3 1 2Michigan — 0 1 — — — 0 0 — — — 0 1 — —Ohio — 0 3 1 — — 0 1 — — — 0 0 — —Wisconsin — 0 1 — 4 — 4 41 — 16 — 0 4 — —
W.N. Central — 1 13 2 1 — 0 3 — — — 0 3 — —Iowa — 0 0 — — — 0 0 — — — 0 0 — —Kansas — 0 1 — — — 0 0 — — — 0 0 — —Minnesota — 0 0 — — — 0 0 — — — 0 0 — —Missouri — 1 13 2 1 — 0 3 — — — 0 3 — —Nebraska§ — 0 1 — — — 0 0 — — — 0 0 — —North Dakota — 0 0 — — — 0 0 — — — 0 0 — —South Dakota — 0 0 — — — 0 0 — — — 0 0 — —
S. Atlantic 4 3 18 12 30 2 1 7 4 5 — 0 1 — —Delaware — 0 3 1 1 — 0 1 — — — 0 0 — —District of Columbia — 0 0 — — — 0 0 — — — 0 0 — —Florida — 0 2 2 1 — 0 1 — — — 0 0 — —Georgia — 0 4 1 3 — 0 1 — — — 0 1 — —Maryland§ — 0 3 2 4 — 0 2 — 3 — 0 1 — —North Carolina 3 1 13 5 21 2 0 4 4 2 — 0 0 — —South Carolina§ — 0 2 — — — 0 1 — — — 0 0 — —Virginia§ 1 1 8 1 — — 0 2 — — — 0 1 — —West Virginia — 0 1 — — — 0 0 — — — 0 0 — —
E.S. Central — 1 11 1 2 — 0 2 1 — — 0 1 — —Alabama§ — 0 3 — 1 — 0 2 1 — — 0 0 — —Kentucky — 0 2 — — — 0 0 — — — 0 0 — —Mississippi — 0 1 — — — 0 1 — — — 0 0 — —Tennessee§ — 0 7 1 1 — 0 2 — — — 0 1 — —
W.S. Central — 0 66 — 2 — 0 7 — — — 0 1 — —Arkansas§ — 0 5 — — — 0 2 — — — 0 0 — —Louisiana — 0 0 — 1 — 0 0 — — — 0 0 — —Oklahoma — 0 61 — — — 0 5 — — — 0 0 — —Texas§ — 0 1 — 1 — 0 1 — — — 0 1 — —
Mountain — 0 0 — — — 0 0 — — — 0 1 1 —Arizona — 0 0 — — — 0 0 — — — 0 1 1 —Colorado — 0 0 — — — 0 0 — — — 0 0 — —Idaho§ — 0 0 — — — 0 0 — — — 0 0 — —Montana§ — 0 0 — — — 0 0 — — — 0 0 — —Nevada§ — 0 0 — — — 0 0 — — — 0 0 — —New Mexico§ — 0 0 — — — 0 0 — — — 0 0 — —Utah — 0 0 — — — 0 0 — — — 0 0 — —Wyoming§ — 0 0 — — — 0 0 — — — 0 0 — —
Pacific — 0 1 — 1 — 0 0 — — — 0 1 — —Alaska — 0 0 — — — 0 0 — — — 0 0 — —California — 0 1 — 1 — 0 0 — — — 0 1 — —Hawaii — 0 0 — — — 0 0 — — — 0 0 — —Oregon — 0 0 — — — 0 0 — — — 0 0 — —Washington — 0 0 — — — 0 0 — — — 0 0 — —
TerritoriesAmerican Samoa — 0 0 — — — 0 0 — — — 0 0 — —C.N.M.I. — — — — — — — — — — — — — — —Guam — 0 0 — — — 0 0 — — — 0 0 — —Puerto Rico — 0 0 — — — 0 0 — — — 0 0 — —U.S. Virgin Islands — 0 0 — — — 0 0 — — — 0 0 — —
C.N.M.I.: Commonwealth of Northern Mariana Islands.U: Unavailable. —: No reported cases. N: Not reportable. NN: Not Nationally Notifiable. Cum: Cumulative year-to-date counts. Med: Median. Max: Maximum.* Case counts for reporting year 2010 and 2011 are provisional and subject to change. For further information on interpretation of these data, see http://www.cdc.gov/osels/ph_surveillance/
nndss/phs/files/ProvisionalNationa%20NotifiableDiseasesSurveillanceData20100927.pdf. Data for TB are displayed in Table IV, which appears quarterly.† Cumulative total E. ewingii cases reported for year 2010 = 11, and 1 case report for 2011.§ Contains data reported through the National Electronic Disease Surveillance System (NEDSS).
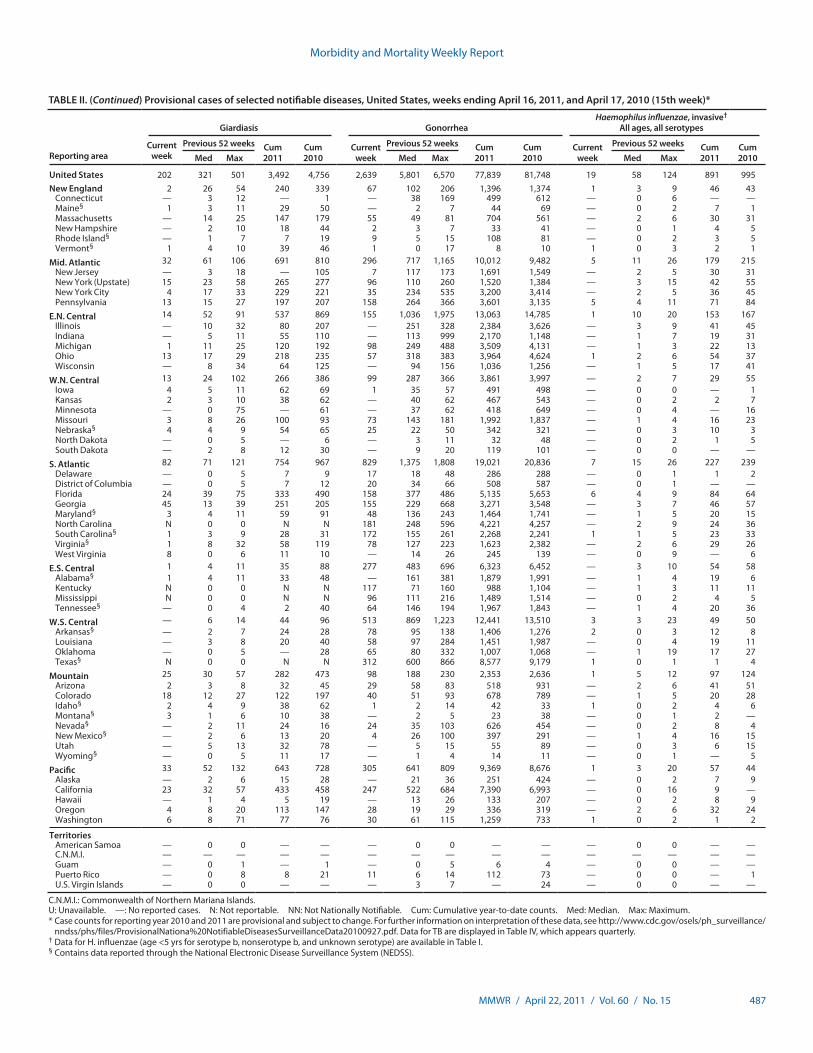
Morbidity and Mortality Weekly Report
MMWR / April 22, 2011 / Vol. 60 / No. 15 487
TABLE II. (Continued) Provisional cases of selected notifiable diseases, United States, weeks ending April 16, 2011, and April 17, 2010 (15th week)*
Reporting area
Giardiasis GonorrheaHaemophilus influenzae, invasive†
All ages, all serotypes
Current week
Previous 52 weeks Cum 2011
Cum 2010
Current week
Previous 52 weeks Cum 2011
Cum 2010
Current week
Previous 52 weeks Cum 2011
Cum 2010Med Max Med Max Med Max
United States 202 321 501 3,492 4,756 2,639 5,801 6,570 77,839 81,748 19 58 124 891 995New England 2 26 54 240 339 67 102 206 1,396 1,374 1 3 9 46 43
Connecticut — 3 12 — 1 — 38 169 499 612 — 0 6 — —Maine§ 1 3 11 29 50 — 2 7 44 69 — 0 2 7 1Massachusetts — 14 25 147 179 55 49 81 704 561 — 2 6 30 31New Hampshire — 2 10 18 44 2 3 7 33 41 — 0 1 4 5Rhode Island§ — 1 7 7 19 9 5 15 108 81 — 0 2 3 5Vermont§ 1 4 10 39 46 1 0 17 8 10 1 0 3 2 1
Mid. Atlantic 32 61 106 691 810 296 717 1,165 10,012 9,482 5 11 26 179 215New Jersey — 3 18 — 105 7 117 173 1,691 1,549 — 2 5 30 31New York (Upstate) 15 23 58 265 277 96 110 260 1,520 1,384 — 3 15 42 55New York City 4 17 33 229 221 35 234 535 3,200 3,414 — 2 5 36 45Pennsylvania 13 15 27 197 207 158 264 366 3,601 3,135 5 4 11 71 84
E.N. Central 14 52 91 537 869 155 1,036 1,975 13,063 14,785 1 10 20 153 167Illinois — 10 32 80 207 — 251 328 2,384 3,626 — 3 9 41 45Indiana — 5 11 55 110 — 113 999 2,170 1,148 — 1 7 19 31Michigan 1 11 25 120 192 98 249 488 3,509 4,131 — 1 3 22 13Ohio 13 17 29 218 235 57 318 383 3,964 4,624 1 2 6 54 37Wisconsin — 8 34 64 125 — 94 156 1,036 1,256 — 1 5 17 41
W.N. Central 13 24 102 266 386 99 287 366 3,861 3,997 — 2 7 29 55Iowa 4 5 11 62 69 1 35 57 491 498 — 0 0 — 1Kansas 2 3 10 38 62 — 40 62 467 543 — 0 2 2 7Minnesota — 0 75 — 61 — 37 62 418 649 — 0 4 — 16Missouri 3 8 26 100 93 73 143 181 1,992 1,837 — 1 4 16 23Nebraska§ 4 4 9 54 65 25 22 50 342 321 — 0 3 10 3North Dakota — 0 5 — 6 — 3 11 32 48 — 0 2 1 5South Dakota — 2 8 12 30 — 9 20 119 101 — 0 0 — —
S. Atlantic 82 71 121 754 967 829 1,375 1,808 19,021 20,836 7 15 26 227 239Delaware — 0 5 7 9 17 18 48 286 288 — 0 1 1 2District of Columbia — 0 5 7 12 20 34 66 508 587 — 0 1 — —Florida 24 39 75 333 490 158 377 486 5,135 5,653 6 4 9 84 64Georgia 45 13 39 251 205 155 229 668 3,271 3,548 — 3 7 46 57Maryland§ 3 4 11 59 91 48 136 243 1,464 1,741 — 1 5 20 15North Carolina N 0 0 N N 181 248 596 4,221 4,257 — 2 9 24 36South Carolina§ 1 3 9 28 31 172 155 261 2,268 2,241 1 1 5 23 33Virginia§ 1 8 32 58 119 78 127 223 1,623 2,382 — 2 6 29 26West Virginia 8 0 6 11 10 — 14 26 245 139 — 0 9 — 6
E.S. Central 1 4 11 35 88 277 483 696 6,323 6,452 — 3 10 54 58Alabama§ 1 4 11 33 48 — 161 381 1,879 1,991 — 1 4 19 6Kentucky N 0 0 N N 117 71 160 988 1,104 — 1 3 11 11Mississippi N 0 0 N N 96 111 216 1,489 1,514 — 0 2 4 5Tennessee§ — 0 4 2 40 64 146 194 1,967 1,843 — 1 4 20 36
W.S. Central — 6 14 44 96 513 869 1,223 12,441 13,510 3 3 23 49 50Arkansas§ — 2 7 24 28 78 95 138 1,406 1,276 2 0 3 12 8Louisiana — 3 8 20 40 58 97 284 1,451 1,987 — 0 4 19 11Oklahoma — 0 5 — 28 65 80 332 1,007 1,068 — 1 19 17 27Texas§ N 0 0 N N 312 600 866 8,577 9,179 1 0 1 1 4
Mountain 25 30 57 282 473 98 188 230 2,353 2,636 1 5 12 97 124Arizona 2 3 8 32 45 29 58 83 518 931 — 2 6 41 51Colorado 18 12 27 122 197 40 51 93 678 789 — 1 5 20 28Idaho§ 2 4 9 38 62 1 2 14 42 33 1 0 2 4 6Montana§ 3 1 6 10 38 — 2 5 23 38 — 0 1 2 —Nevada§ — 2 11 24 16 24 35 103 626 454 — 0 2 8 4New Mexico§ — 2 6 13 20 4 26 100 397 291 — 1 4 16 15Utah — 5 13 32 78 — 5 15 55 89 — 0 3 6 15Wyoming§ — 0 5 11 17 — 1 4 14 11 — 0 1 — 5
Pacific 33 52 132 643 728 305 641 809 9,369 8,676 1 3 20 57 44Alaska — 2 6 15 28 — 21 36 251 424 — 0 2 7 9California 23 32 57 433 458 247 522 684 7,390 6,993 — 0 16 9 —Hawaii — 1 4 5 19 — 13 26 133 207 — 0 2 8 9Oregon 4 8 20 113 147 28 19 29 336 319 — 2 6 32 24Washington 6 8 71 77 76 30 61 115 1,259 733 1 0 2 1 2
TerritoriesAmerican Samoa — 0 0 — — — 0 0 — — — 0 0 — —C.N.M.I. — — — — — — — — — — — — — — —Guam — 0 1 — 1 — 0 5 6 4 — 0 0 — —Puerto Rico — 0 8 8 21 11 6 14 112 73 — 0 0 — 1U.S. Virgin Islands — 0 0 — — — 3 7 — 24 — 0 0 — —
C.N.M.I.: Commonwealth of Northern Mariana Islands.U: Unavailable. —: No reported cases. N: Not reportable. NN: Not Nationally Notifiable. Cum: Cumulative year-to-date counts. Med: Median. Max: Maximum.* Case counts for reporting year 2010 and 2011 are provisional and subject to change. For further information on interpretation of these data, see http://www.cdc.gov/osels/ph_surveillance/
nndss/phs/files/ProvisionalNationa%20NotifiableDiseasesSurveillanceData20100927.pdf. Data for TB are displayed in Table IV, which appears quarterly.† Data for H. influenzae (age <5 yrs for serotype b, nonserotype b, and unknown serotype) are available in Table I.§ Contains data reported through the National Electronic Disease Surveillance System (NEDSS).
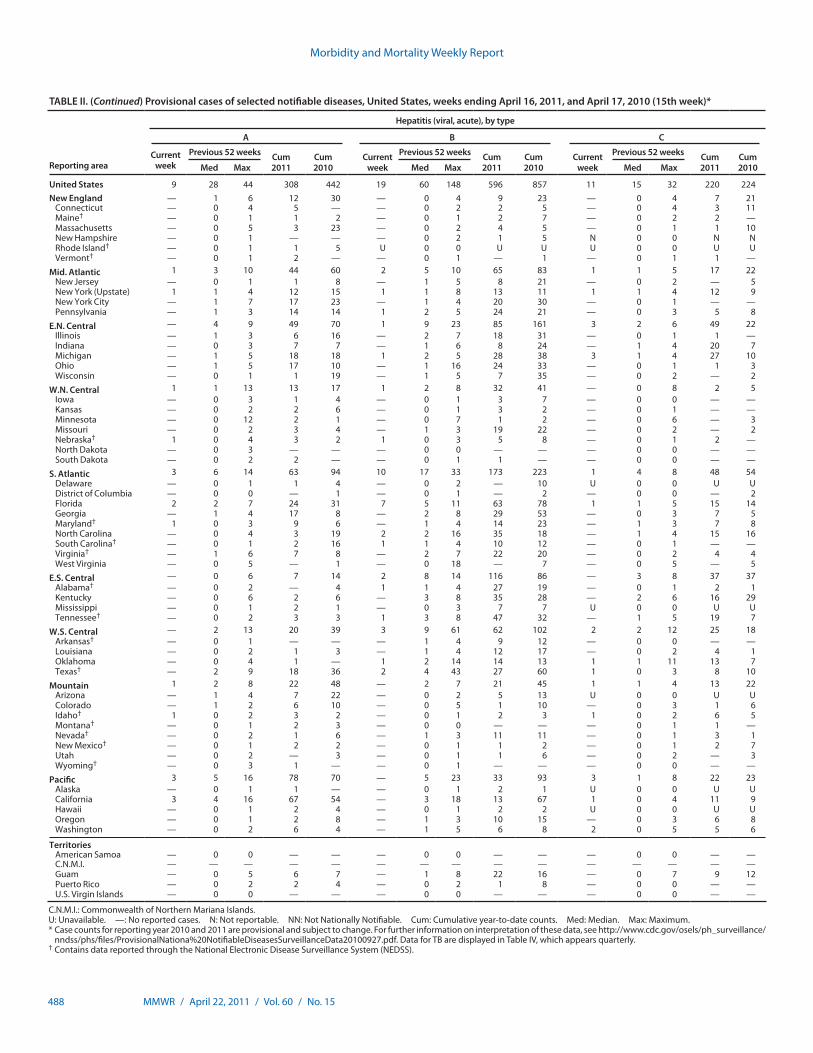
Morbidity and Mortality Weekly Report
488 MMWR / April 22, 2011 / Vol. 60 / No. 15
TABLE II. (Continued) Provisional cases of selected notifiable diseases, United States, weeks ending April 16, 2011, and April 17, 2010 (15th week)*
Hepatitis (viral, acute), by type
Reporting area
A B C
Current week
Previous 52 weeks Cum 2011
Cum 2010
Current week
Previous 52 weeks Cum 2011
Cum 2010
Current week
Previous 52 weeks Cum 2011
Cum 2010Med Max Med Max Med Max
United States 9 28 44 308 442 19 60 148 596 857 11 15 32 220 224New England — 1 6 12 30 — 0 4 9 23 — 0 4 7 21
Connecticut — 0 4 5 — — 0 2 2 5 — 0 4 3 11Maine† — 0 1 1 2 — 0 1 2 7 — 0 2 2 —Massachusetts — 0 5 3 23 — 0 2 4 5 — 0 1 1 10New Hampshire — 0 1 — — — 0 2 1 5 N 0 0 N NRhode Island† — 0 1 1 5 U 0 0 U U U 0 0 U UVermont† — 0 1 2 — — 0 1 — 1 — 0 1 1 —
Mid. Atlantic 1 3 10 44 60 2 5 10 65 83 1 1 5 17 22New Jersey — 0 1 1 8 — 1 5 8 21 — 0 2 — 5New York (Upstate) 1 1 4 12 15 1 1 8 13 11 1 1 4 12 9New York City — 1 7 17 23 — 1 4 20 30 — 0 1 — —Pennsylvania — 1 3 14 14 1 2 5 24 21 — 0 3 5 8
E.N. Central — 4 9 49 70 1 9 23 85 161 3 2 6 49 22Illinois — 1 3 6 16 — 2 7 18 31 — 0 1 1 —Indiana — 0 3 7 7 — 1 6 8 24 — 1 4 20 7Michigan — 1 5 18 18 1 2 5 28 38 3 1 4 27 10Ohio — 1 5 17 10 — 1 16 24 33 — 0 1 1 3Wisconsin — 0 1 1 19 — 1 5 7 35 — 0 2 — 2
W.N. Central 1 1 13 13 17 1 2 8 32 41 — 0 8 2 5Iowa — 0 3 1 4 — 0 1 3 7 — 0 0 — —Kansas — 0 2 2 6 — 0 1 3 2 — 0 1 — —Minnesota — 0 12 2 1 — 0 7 1 2 — 0 6 — 3Missouri — 0 2 3 4 — 1 3 19 22 — 0 2 — 2Nebraska† 1 0 4 3 2 1 0 3 5 8 — 0 1 2 —North Dakota — 0 3 — — — 0 0 — — — 0 0 — —South Dakota — 0 2 2 — — 0 1 1 — — 0 0 — —
S. Atlantic 3 6 14 63 94 10 17 33 173 223 1 4 8 48 54Delaware — 0 1 1 4 — 0 2 — 10 U 0 0 U UDistrict of Columbia — 0 0 — 1 — 0 1 — 2 — 0 0 — 2Florida 2 2 7 24 31 7 5 11 63 78 1 1 5 15 14Georgia — 1 4 17 8 — 2 8 29 53 — 0 3 7 5Maryland† 1 0 3 9 6 — 1 4 14 23 — 1 3 7 8North Carolina — 0 4 3 19 2 2 16 35 18 — 1 4 15 16South Carolina† — 0 1 2 16 1 1 4 10 12 — 0 1 — —Virginia† — 1 6 7 8 — 2 7 22 20 — 0 2 4 4West Virginia — 0 5 — 1 — 0 18 — 7 — 0 5 — 5
E.S. Central — 0 6 7 14 2 8 14 116 86 — 3 8 37 37Alabama† — 0 2 — 4 1 1 4 27 19 — 0 1 2 1Kentucky — 0 6 2 6 — 3 8 35 28 — 2 6 16 29Mississippi — 0 1 2 1 — 0 3 7 7 U 0 0 U UTennessee† — 0 2 3 3 1 3 8 47 32 — 1 5 19 7
W.S. Central — 2 13 20 39 3 9 61 62 102 2 2 12 25 18Arkansas† — 0 1 — — — 1 4 9 12 — 0 0 — —Louisiana — 0 2 1 3 — 1 4 12 17 — 0 2 4 1Oklahoma — 0 4 1 — 1 2 14 14 13 1 1 11 13 7Texas† — 2 9 18 36 2 4 43 27 60 1 0 3 8 10
Mountain 1 2 8 22 48 — 2 7 21 45 1 1 4 13 22Arizona — 1 4 7 22 — 0 2 5 13 U 0 0 U UColorado — 1 2 6 10 — 0 5 1 10 — 0 3 1 6Idaho† 1 0 2 3 2 — 0 1 2 3 1 0 2 6 5Montana† — 0 1 2 3 — 0 0 — — — 0 1 1 —Nevada† — 0 2 1 6 — 1 3 11 11 — 0 1 3 1New Mexico† — 0 1 2 2 — 0 1 1 2 — 0 1 2 7Utah — 0 2 — 3 — 0 1 1 6 — 0 2 — 3Wyoming† — 0 3 1 — — 0 1 — — — 0 0 — —
Pacific 3 5 16 78 70 — 5 23 33 93 3 1 8 22 23Alaska — 0 1 1 — — 0 1 2 1 U 0 0 U UCalifornia 3 4 16 67 54 — 3 18 13 67 1 0 4 11 9Hawaii — 0 1 2 4 — 0 1 2 2 U 0 0 U UOregon — 0 1 2 8 — 1 3 10 15 — 0 3 6 8Washington — 0 2 6 4 — 1 5 6 8 2 0 5 5 6
TerritoriesAmerican Samoa — 0 0 — — — 0 0 — — — 0 0 — —C.N.M.I. — — — — — — — — — — — — — — —Guam — 0 5 6 7 — 1 8 22 16 — 0 7 9 12Puerto Rico — 0 2 2 4 — 0 2 1 8 — 0 0 — —U.S. Virgin Islands — 0 0 — — — 0 0 — — — 0 0 — —
C.N.M.I.: Commonwealth of Northern Mariana Islands.U: Unavailable. —: No reported cases. N: Not reportable. NN: Not Nationally Notifiable. Cum: Cumulative year-to-date counts. Med: Median. Max: Maximum.* Case counts for reporting year 2010 and 2011 are provisional and subject to change. For further information on interpretation of these data, see http://www.cdc.gov/osels/ph_surveillance/
nndss/phs/files/ProvisionalNationa%20NotifiableDiseasesSurveillanceData20100927.pdf. Data for TB are displayed in Table IV, which appears quarterly.† Contains data reported through the National Electronic Disease Surveillance System (NEDSS).
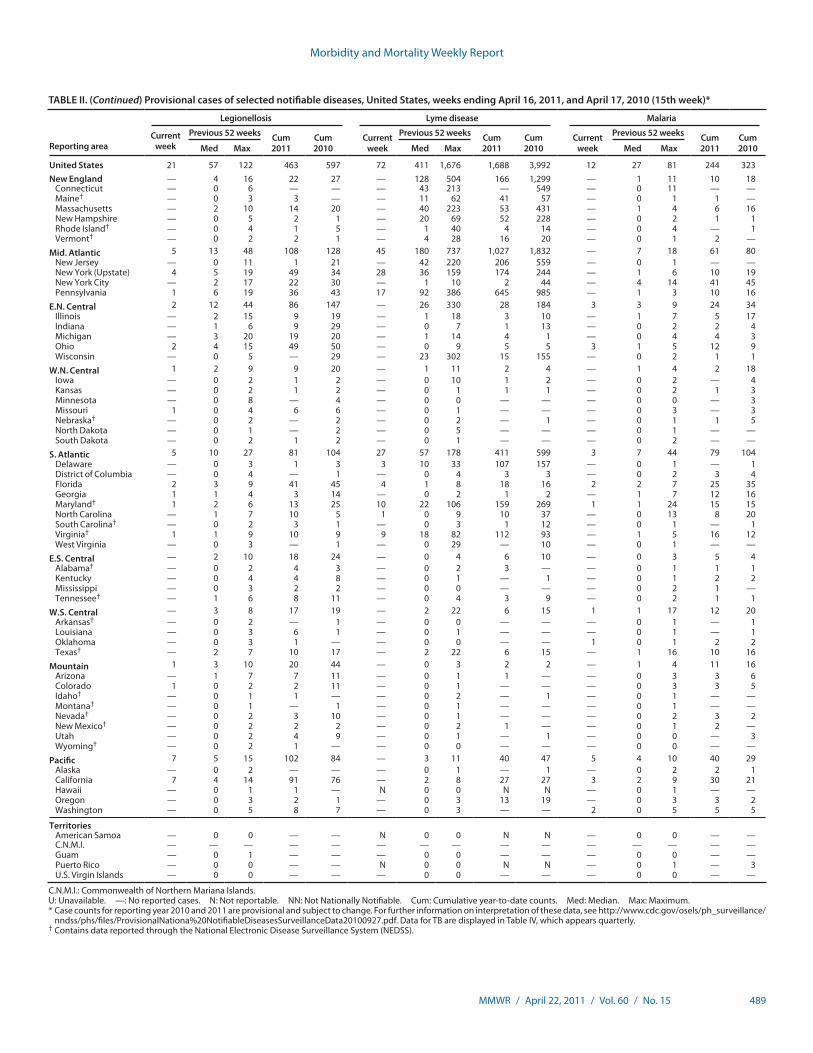
Morbidity and Mortality Weekly Report
MMWR / April 22, 2011 / Vol. 60 / No. 15 489
TABLE II. (Continued) Provisional cases of selected notifiable diseases, United States, weeks ending April 16, 2011, and April 17, 2010 (15th week)*
Reporting area
Legionellosis Lyme disease Malaria
Current week
Previous 52 weeks Cum 2011
Cum 2010
Current week
Previous 52 weeks Cum 2011
Cum 2010
Current week
Previous 52 weeks Cum 2011
Cum 2010Med Max Med Max Med Max
United States 21 57 122 463 597 72 411 1,676 1,688 3,992 12 27 81 244 323New England — 4 16 22 27 — 128 504 166 1,299 — 1 11 10 18
Connecticut — 0 6 — — — 43 213 — 549 — 0 11 — —Maine† — 0 3 3 — — 11 62 41 57 — 0 1 1 —Massachusetts — 2 10 14 20 — 40 223 53 431 — 1 4 6 16New Hampshire — 0 5 2 1 — 20 69 52 228 — 0 2 1 1Rhode Island† — 0 4 1 5 — 1 40 4 14 — 0 4 — 1Vermont† — 0 2 2 1 — 4 28 16 20 — 0 1 2 —
Mid. Atlantic 5 13 48 108 128 45 180 737 1,027 1,832 — 7 18 61 80New Jersey — 0 11 1 21 — 42 220 206 559 — 0 1 — —New York (Upstate) 4 5 19 49 34 28 36 159 174 244 — 1 6 10 19New York City — 2 17 22 30 — 1 10 2 44 — 4 14 41 45Pennsylvania 1 6 19 36 43 17 92 386 645 985 — 1 3 10 16
E.N. Central 2 12 44 86 147 — 26 330 28 184 3 3 9 24 34Illinois — 2 15 9 19 — 1 18 3 10 — 1 7 5 17Indiana — 1 6 9 29 — 0 7 1 13 — 0 2 2 4Michigan — 3 20 19 20 — 1 14 4 1 — 0 4 4 3Ohio 2 4 15 49 50 — 0 9 5 5 3 1 5 12 9Wisconsin — 0 5 — 29 — 23 302 15 155 — 0 2 1 1
W.N. Central 1 2 9 9 20 — 1 11 2 4 — 1 4 2 18Iowa — 0 2 1 2 — 0 10 1 2 — 0 2 — 4Kansas — 0 2 1 2 — 0 1 1 1 — 0 2 1 3Minnesota — 0 8 — 4 — 0 0 — — — 0 0 — 3Missouri 1 0 4 6 6 — 0 1 — — — 0 3 — 3Nebraska† — 0 2 — 2 — 0 2 — 1 — 0 1 1 5North Dakota — 0 1 — 2 — 0 5 — — — 0 1 — —South Dakota — 0 2 1 2 — 0 1 — — — 0 2 — —
S. Atlantic 5 10 27 81 104 27 57 178 411 599 3 7 44 79 104Delaware — 0 3 1 3 3 10 33 107 157 — 0 1 — 1District of Columbia — 0 4 — 1 — 0 4 3 3 — 0 2 3 4Florida 2 3 9 41 45 4 1 8 18 16 2 2 7 25 35Georgia 1 1 4 3 14 — 0 2 1 2 — 1 7 12 16Maryland† 1 2 6 13 25 10 22 106 159 269 1 1 24 15 15North Carolina — 1 7 10 5 1 0 9 10 37 — 0 13 8 20South Carolina† — 0 2 3 1 — 0 3 1 12 — 0 1 — 1Virginia† 1 1 9 10 9 9 18 82 112 93 — 1 5 16 12West Virginia — 0 3 — 1 — 0 29 — 10 — 0 1 — —
E.S. Central — 2 10 18 24 — 0 4 6 10 — 0 3 5 4Alabama† — 0 2 4 3 — 0 2 3 — — 0 1 1 1Kentucky — 0 4 4 8 — 0 1 — 1 — 0 1 2 2Mississippi — 0 3 2 2 — 0 0 — — — 0 2 1 —Tennessee† — 1 6 8 11 — 0 4 3 9 — 0 2 1 1
W.S. Central — 3 8 17 19 — 2 22 6 15 1 1 17 12 20Arkansas† — 0 2 — 1 — 0 0 — — — 0 1 — 1Louisiana — 0 3 6 1 — 0 1 — — — 0 1 — 1Oklahoma — 0 3 1 — — 0 0 — — 1 0 1 2 2Texas† — 2 7 10 17 — 2 22 6 15 — 1 16 10 16
Mountain 1 3 10 20 44 — 0 3 2 2 — 1 4 11 16Arizona — 1 7 7 11 — 0 1 1 — — 0 3 3 6Colorado 1 0 2 2 11 — 0 1 — — — 0 3 3 5Idaho† — 0 1 1 — — 0 2 — 1 — 0 1 — —Montana† — 0 1 — 1 — 0 1 — — — 0 1 — —Nevada† — 0 2 3 10 — 0 1 — — — 0 2 3 2New Mexico† — 0 2 2 2 — 0 2 1 — — 0 1 2 —Utah — 0 2 4 9 — 0 1 — 1 — 0 0 — 3Wyoming† — 0 2 1 — — 0 0 — — — 0 0 — —
Pacific 7 5 15 102 84 — 3 11 40 47 5 4 10 40 29Alaska — 0 2 — — — 0 1 — 1 — 0 2 2 1California 7 4 14 91 76 — 2 8 27 27 3 2 9 30 21Hawaii — 0 1 1 — N 0 0 N N — 0 1 — —Oregon — 0 3 2 1 — 0 3 13 19 — 0 3 3 2Washington — 0 5 8 7 — 0 3 — — 2 0 5 5 5
TerritoriesAmerican Samoa — 0 0 — — N 0 0 N N — 0 0 — —C.N.M.I. — — — — — — — — — — — — — — —Guam — 0 1 — — — 0 0 — — — 0 0 — —Puerto Rico — 0 0 — — N 0 0 N N — 0 1 — 3U.S. Virgin Islands — 0 0 — — — 0 0 — — — 0 0 — —
C.N.M.I.: Commonwealth of Northern Mariana Islands.U: Unavailable. —: No reported cases. N: Not reportable. NN: Not Nationally Notifiable. Cum: Cumulative year-to-date counts. Med: Median. Max: Maximum.* Case counts for reporting year 2010 and 2011 are provisional and subject to change. For further information on interpretation of these data, see http://www.cdc.gov/osels/ph_surveillance/
nndss/phs/files/ProvisionalNationa%20NotifiableDiseasesSurveillanceData20100927.pdf. Data for TB are displayed in Table IV, which appears quarterly.† Contains data reported through the National Electronic Disease Surveillance System (NEDSS).
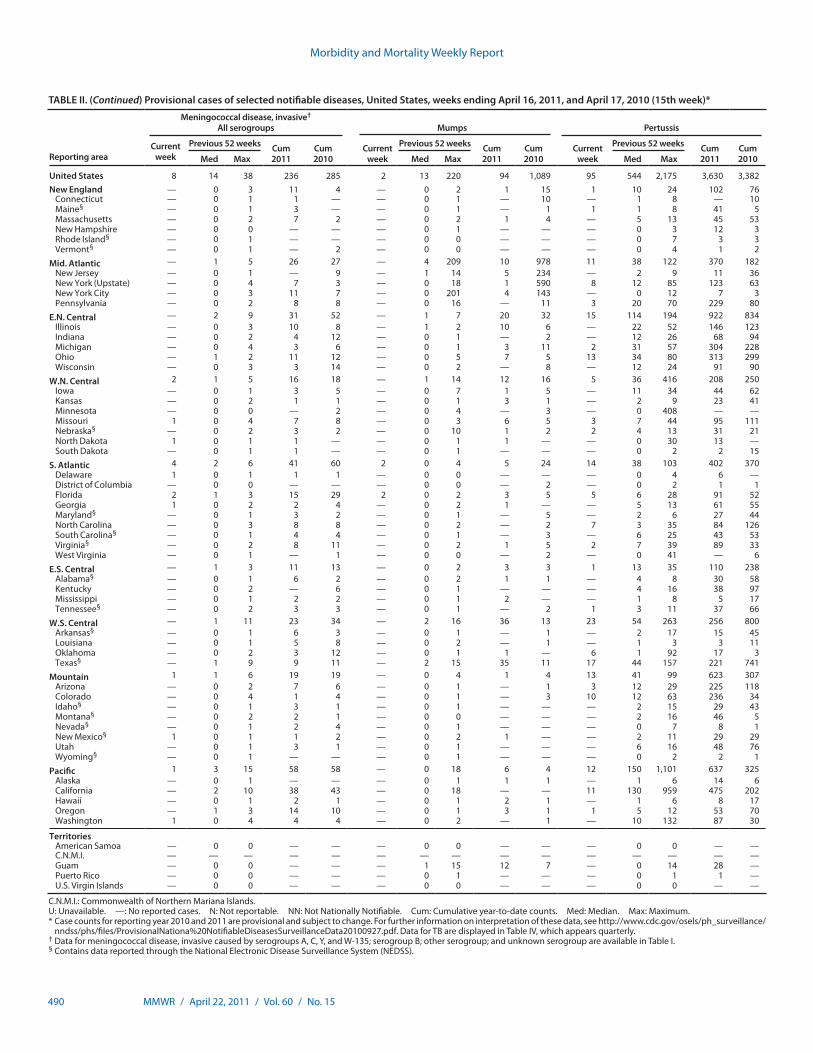
Morbidity and Mortality Weekly Report
490 MMWR / April 22, 2011 / Vol. 60 / No. 15
TABLE II. (Continued) Provisional cases of selected notifiable diseases, United States, weeks ending April 16, 2011, and April 17, 2010 (15th week)*
Reporting area
Meningococcal disease, invasive† All serogroups Mumps Pertussis
Current week
Previous 52 weeks Cum 2011
Cum 2010
Current week
Previous 52 weeks Cum 2011
Cum 2010
Current week
Previous 52 weeks Cum 2011
Cum 2010Med Max Med Max Med Max
United States 8 14 38 236 285 2 13 220 94 1,089 95 544 2,175 3,630 3,382New England — 0 3 11 4 — 0 2 1 15 1 10 24 102 76
Connecticut — 0 1 1 — — 0 1 — 10 — 1 8 — 10Maine§ — 0 1 3 — — 0 1 — 1 1 1 8 41 5Massachusetts — 0 2 7 2 — 0 2 1 4 — 5 13 45 53New Hampshire — 0 0 — — — 0 1 — — — 0 3 12 3Rhode Island§ — 0 1 — — — 0 0 — — — 0 7 3 3Vermont§ — 0 1 — 2 — 0 0 — — — 0 4 1 2
Mid. Atlantic — 1 5 26 27 — 4 209 10 978 11 38 122 370 182New Jersey — 0 1 — 9 — 1 14 5 234 — 2 9 11 36New York (Upstate) — 0 4 7 3 — 0 18 1 590 8 12 85 123 63New York City — 0 3 11 7 — 0 201 4 143 — 0 12 7 3Pennsylvania — 0 2 8 8 — 0 16 — 11 3 20 70 229 80
E.N. Central — 2 9 31 52 — 1 7 20 32 15 114 194 922 834Illinois — 0 3 10 8 — 1 2 10 6 — 22 52 146 123Indiana — 0 2 4 12 — 0 1 — 2 — 12 26 68 94Michigan — 0 4 3 6 — 0 1 3 11 2 31 57 304 228Ohio — 1 2 11 12 — 0 5 7 5 13 34 80 313 299Wisconsin — 0 3 3 14 — 0 2 — 8 — 12 24 91 90
W.N. Central 2 1 5 16 18 — 1 14 12 16 5 36 416 208 250Iowa — 0 1 3 5 — 0 7 1 5 — 11 34 44 62Kansas — 0 2 1 1 — 0 1 3 1 — 2 9 23 41Minnesota — 0 0 — 2 — 0 4 — 3 — 0 408 — —Missouri 1 0 4 7 8 — 0 3 6 5 3 7 44 95 111Nebraska§ — 0 2 3 2 — 0 10 1 2 2 4 13 31 21North Dakota 1 0 1 1 — — 0 1 1 — — 0 30 13 —South Dakota — 0 1 1 — — 0 1 — — — 0 2 2 15
S. Atlantic 4 2 6 41 60 2 0 4 5 24 14 38 103 402 370Delaware 1 0 1 1 1 — 0 0 — — — 0 4 6 —District of Columbia — 0 0 — — — 0 0 — 2 — 0 2 1 1Florida 2 1 3 15 29 2 0 2 3 5 5 6 28 91 52Georgia 1 0 2 2 4 — 0 2 1 — — 5 13 61 55Maryland§ — 0 1 3 2 — 0 1 — 5 — 2 6 27 44North Carolina — 0 3 8 8 — 0 2 — 2 7 3 35 84 126South Carolina§ — 0 1 4 4 — 0 1 — 3 — 6 25 43 53Virginia§ — 0 2 8 11 — 0 2 1 5 2 7 39 89 33West Virginia — 0 1 — 1 — 0 0 — 2 — 0 41 — 6
E.S. Central — 1 3 11 13 — 0 2 3 3 1 13 35 110 238Alabama§ — 0 1 6 2 — 0 2 1 1 — 4 8 30 58Kentucky — 0 2 — 6 — 0 1 — — — 4 16 38 97Mississippi — 0 1 2 2 — 0 1 2 — — 1 8 5 17Tennessee§ — 0 2 3 3 — 0 1 — 2 1 3 11 37 66
W.S. Central — 1 11 23 34 — 2 16 36 13 23 54 263 256 800Arkansas§ — 0 1 6 3 — 0 1 — 1 — 2 17 15 45Louisiana — 0 1 5 8 — 0 2 — 1 — 1 3 3 11Oklahoma — 0 2 3 12 — 0 1 1 — 6 1 92 17 3Texas§ — 1 9 9 11 — 2 15 35 11 17 44 157 221 741
Mountain 1 1 6 19 19 — 0 4 1 4 13 41 99 623 307Arizona — 0 2 7 6 — 0 1 — 1 3 12 29 225 118Colorado — 0 4 1 4 — 0 1 — 3 10 12 63 236 34Idaho§ — 0 1 3 1 — 0 1 — — — 2 15 29 43Montana§ — 0 2 2 1 — 0 0 — — — 2 16 46 5Nevada§ — 0 1 2 4 — 0 1 — — — 0 7 8 1New Mexico§ 1 0 1 1 2 — 0 2 1 — — 2 11 29 29Utah — 0 1 3 1 — 0 1 — — — 6 16 48 76Wyoming§ — 0 1 — — — 0 1 — — — 0 2 2 1
Pacific 1 3 15 58 58 — 0 18 6 4 12 150 1,101 637 325Alaska — 0 1 — — — 0 1 1 1 — 1 6 14 6California — 2 10 38 43 — 0 18 — — 11 130 959 475 202Hawaii — 0 1 2 1 — 0 1 2 1 — 1 6 8 17Oregon — 1 3 14 10 — 0 1 3 1 1 5 12 53 70Washington 1 0 4 4 4 — 0 2 — 1 — 10 132 87 30
TerritoriesAmerican Samoa — 0 0 — — — 0 0 — — — 0 0 — —C.N.M.I. — — — — — — — — — — — — — — —Guam — 0 0 — — — 1 15 12 7 — 0 14 28 —Puerto Rico — 0 0 — — — 0 1 — — — 0 1 1 —U.S. Virgin Islands — 0 0 — — — 0 0 — — — 0 0 — —
C.N.M.I.: Commonwealth of Northern Mariana Islands.U: Unavailable. —: No reported cases. N: Not reportable. NN: Not Nationally Notifiable. Cum: Cumulative year-to-date counts. Med: Median. Max: Maximum.* Case counts for reporting year 2010 and 2011 are provisional and subject to change. For further information on interpretation of these data, see http://www.cdc.gov/osels/ph_surveillance/
nndss/phs/files/ProvisionalNationa%20NotifiableDiseasesSurveillanceData20100927.pdf. Data for TB are displayed in Table IV, which appears quarterly.† Data for meningococcal disease, invasive caused by serogroups A, C, Y, and W-135; serogroup B; other serogroup; and unknown serogroup are available in Table I.§ Contains data reported through the National Electronic Disease Surveillance System (NEDSS).
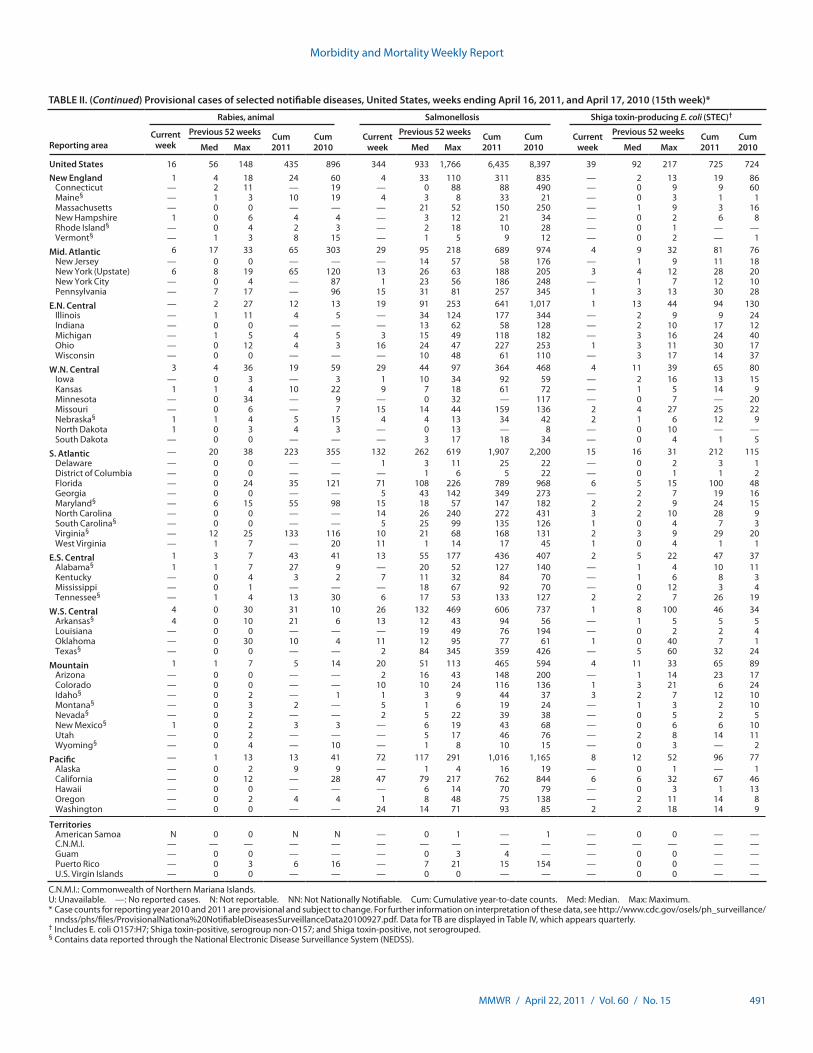
Morbidity and Mortality Weekly Report
MMWR / April 22, 2011 / Vol. 60 / No. 15 491
TABLE II. (Continued) Provisional cases of selected notifiable diseases, United States, weeks ending April 16, 2011, and April 17, 2010 (15th week)*
Reporting area
Rabies, animal Salmonellosis Shiga toxin-producing E. coli (STEC)†
Current week
Previous 52 weeks Cum 2011
Cum 2010
Current week
Previous 52 weeks Cum 2011
Cum 2010
Current week
Previous 52 weeks Cum 2011
Cum 2010Med Max Med Max Med Max
United States 16 56 148 435 896 344 933 1,766 6,435 8,397 39 92 217 725 724New England 1 4 18 24 60 4 33 110 311 835 — 2 13 19 86
Connecticut — 2 11 — 19 — 0 88 88 490 — 0 9 9 60Maine§ — 1 3 10 19 4 3 8 33 21 — 0 3 1 1Massachusetts — 0 0 — — — 21 52 150 250 — 1 9 3 16New Hampshire 1 0 6 4 4 — 3 12 21 34 — 0 2 6 8Rhode Island§ — 0 4 2 3 — 2 18 10 28 — 0 1 — —Vermont§ — 1 3 8 15 — 1 5 9 12 — 0 2 — 1
Mid. Atlantic 6 17 33 65 303 29 95 218 689 974 4 9 32 81 76New Jersey — 0 0 — — — 14 57 58 176 — 1 9 11 18New York (Upstate) 6 8 19 65 120 13 26 63 188 205 3 4 12 28 20New York City — 0 4 — 87 1 23 56 186 248 — 1 7 12 10Pennsylvania — 7 17 — 96 15 31 81 257 345 1 3 13 30 28
E.N. Central — 2 27 12 13 19 91 253 641 1,017 1 13 44 94 130Illinois — 1 11 4 5 — 34 124 177 344 — 2 9 9 24Indiana — 0 0 — — — 13 62 58 128 — 2 10 17 12Michigan — 1 5 4 5 3 15 49 118 182 — 3 16 24 40Ohio — 0 12 4 3 16 24 47 227 253 1 3 11 30 17Wisconsin — 0 0 — — — 10 48 61 110 — 3 17 14 37
W.N. Central 3 4 36 19 59 29 44 97 364 468 4 11 39 65 80Iowa — 0 3 — 3 1 10 34 92 59 — 2 16 13 15Kansas 1 1 4 10 22 9 7 18 61 72 — 1 5 14 9Minnesota — 0 34 — 9 — 0 32 — 117 — 0 7 — 20Missouri — 0 6 — 7 15 14 44 159 136 2 4 27 25 22Nebraska§ 1 1 4 5 15 4 4 13 34 42 2 1 6 12 9North Dakota 1 0 3 4 3 — 0 13 — 8 — 0 10 — —South Dakota — 0 0 — — — 3 17 18 34 — 0 4 1 5
S. Atlantic — 20 38 223 355 132 262 619 1,907 2,200 15 16 31 212 115Delaware — 0 0 — — 1 3 11 25 22 — 0 2 3 1District of Columbia — 0 0 — — — 1 6 5 22 — 0 1 1 2Florida — 0 24 35 121 71 108 226 789 968 6 5 15 100 48Georgia — 0 0 — — 5 43 142 349 273 — 2 7 19 16Maryland§ — 6 15 55 98 15 18 57 147 182 2 2 9 24 15North Carolina — 0 0 — — 14 26 240 272 431 3 2 10 28 9South Carolina§ — 0 0 — — 5 25 99 135 126 1 0 4 7 3Virginia§ — 12 25 133 116 10 21 68 168 131 2 3 9 29 20West Virginia — 1 7 — 20 11 1 14 17 45 1 0 4 1 1
E.S. Central 1 3 7 43 41 13 55 177 436 407 2 5 22 47 37Alabama§ 1 1 7 27 9 — 20 52 127 140 — 1 4 10 11Kentucky — 0 4 3 2 7 11 32 84 70 — 1 6 8 3Mississippi — 0 1 — — — 18 67 92 70 — 0 12 3 4Tennessee§ — 1 4 13 30 6 17 53 133 127 2 2 7 26 19
W.S. Central 4 0 30 31 10 26 132 469 606 737 1 8 100 46 34Arkansas§ 4 0 10 21 6 13 12 43 94 56 — 1 5 5 5Louisiana — 0 0 — — — 19 49 76 194 — 0 2 2 4Oklahoma — 0 30 10 4 11 12 95 77 61 1 0 40 7 1Texas§ — 0 0 — — 2 84 345 359 426 — 5 60 32 24
Mountain 1 1 7 5 14 20 51 113 465 594 4 11 33 65 89Arizona — 0 0 — — 2 16 43 148 200 — 1 14 23 17Colorado — 0 0 — — 10 10 24 116 136 1 3 21 6 24Idaho§ — 0 2 — 1 1 3 9 44 37 3 2 7 12 10Montana§ — 0 3 2 — 5 1 6 19 24 — 1 3 2 10Nevada§ — 0 2 — — 2 5 22 39 38 — 0 5 2 5New Mexico§ 1 0 2 3 3 — 6 19 43 68 — 0 6 6 10Utah — 0 2 — — — 5 17 46 76 — 2 8 14 11Wyoming§ — 0 4 — 10 — 1 8 10 15 — 0 3 — 2
Pacific — 1 13 13 41 72 117 291 1,016 1,165 8 12 52 96 77Alaska — 0 2 9 9 — 1 4 16 19 — 0 1 — 1California — 0 12 — 28 47 79 217 762 844 6 6 32 67 46Hawaii — 0 0 — — — 6 14 70 79 — 0 3 1 13Oregon — 0 2 4 4 1 8 48 75 138 — 2 11 14 8Washington — 0 0 — — 24 14 71 93 85 2 2 18 14 9
TerritoriesAmerican Samoa N 0 0 N N — 0 1 — 1 — 0 0 — —C.N.M.I. — — — — — — — — — — — — — — —Guam — 0 0 — — — 0 3 4 — — 0 0 — —Puerto Rico — 0 3 6 16 — 7 21 15 154 — 0 0 — —U.S. Virgin Islands — 0 0 — — — 0 0 — — — 0 0 — —
C.N.M.I.: Commonwealth of Northern Mariana Islands.U: Unavailable. —: No reported cases. N: Not reportable. NN: Not Nationally Notifiable. Cum: Cumulative year-to-date counts. Med: Median. Max: Maximum.* Case counts for reporting year 2010 and 2011 are provisional and subject to change. For further information on interpretation of these data, see http://www.cdc.gov/osels/ph_surveillance/
nndss/phs/files/ProvisionalNationa%20NotifiableDiseasesSurveillanceData20100927.pdf. Data for TB are displayed in Table IV, which appears quarterly.† Includes E. coli O157:H7; Shiga toxin-positive, serogroup non-O157; and Shiga toxin-positive, not serogrouped.§ Contains data reported through the National Electronic Disease Surveillance System (NEDSS).
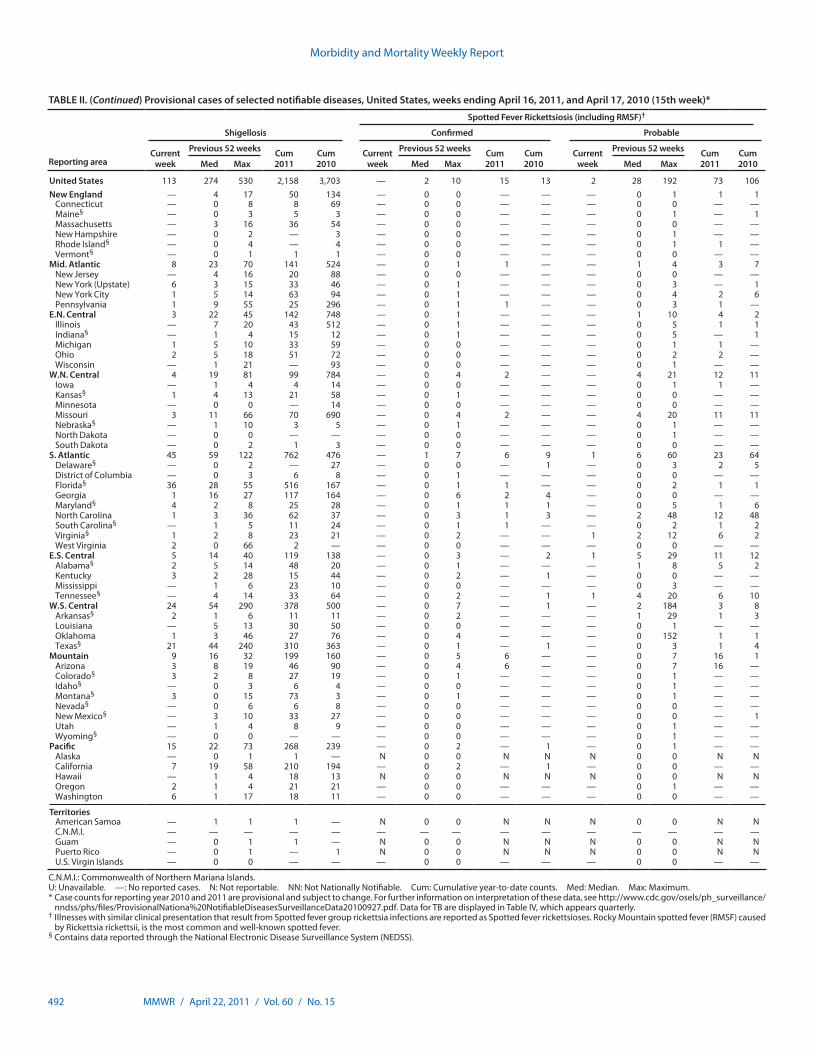
Morbidity and Mortality Weekly Report
492 MMWR / April 22, 2011 / Vol. 60 / No. 15
TABLE II. (Continued) Provisional cases of selected notifiable diseases, United States, weeks ending April 16, 2011, and April 17, 2010 (15th week)*
Spotted Fever Rickettsiosis (including RMSF)†
Reporting area
Shigellosis Confirmed Probable
Current week
Previous 52 weeks Cum 2011
Cum 2010
Current week
Previous 52 weeks Cum 2011
Cum 2010
Current week
Previous 52 weeks Cum 2011
Cum 2010Med Max Med Max Med Max
United States 113 274 530 2,158 3,703 — 2 10 15 13 2 28 192 73 106New England — 4 17 50 134 — 0 0 — — — 0 1 1 1
Connecticut — 0 8 8 69 — 0 0 — — — 0 0 — —Maine§ — 0 3 5 3 — 0 0 — — — 0 1 — 1Massachusetts — 3 16 36 54 — 0 0 — — — 0 0 — —New Hampshire — 0 2 — 3 — 0 0 — — — 0 1 — —Rhode Island§ — 0 4 — 4 — 0 0 — — — 0 1 1 —Vermont§ — 0 1 1 1 — 0 0 — — — 0 0 — —
Mid. Atlantic 8 23 70 141 524 — 0 1 1 — — 1 4 3 7New Jersey — 4 16 20 88 — 0 0 — — — 0 0 — —New York (Upstate) 6 3 15 33 46 — 0 1 — — — 0 3 — 1New York City 1 5 14 63 94 — 0 1 — — — 0 4 2 6Pennsylvania 1 9 55 25 296 — 0 1 1 — — 0 3 1 —
E.N. Central 3 22 45 142 748 — 0 1 — — — 1 10 4 2Illinois — 7 20 43 512 — 0 1 — — — 0 5 1 1Indiana§ — 1 4 15 12 — 0 1 — — — 0 5 — 1Michigan 1 5 10 33 59 — 0 0 — — — 0 1 1 —Ohio 2 5 18 51 72 — 0 0 — — — 0 2 2 —Wisconsin — 1 21 — 93 — 0 0 — — — 0 1 — —
W.N. Central 4 19 81 99 784 — 0 4 2 — — 4 21 12 11Iowa — 1 4 4 14 — 0 0 — — — 0 1 1 —Kansas§ 1 4 13 21 58 — 0 1 — — — 0 0 — —Minnesota — 0 0 — 14 — 0 0 — — — 0 0 — —Missouri 3 11 66 70 690 — 0 4 2 — — 4 20 11 11Nebraska§ — 1 10 3 5 — 0 1 — — — 0 1 — —North Dakota — 0 0 — — — 0 0 — — — 0 1 — —South Dakota — 0 2 1 3 — 0 0 — — — 0 0 — —
S. Atlantic 45 59 122 762 476 — 1 7 6 9 1 6 60 23 64Delaware§ — 0 2 — 27 — 0 0 — 1 — 0 3 2 5District of Columbia — 0 3 6 8 — 0 1 — — — 0 0 — —Florida§ 36 28 55 516 167 — 0 1 1 — — 0 2 1 1Georgia 1 16 27 117 164 — 0 6 2 4 — 0 0 — —Maryland§ 4 2 8 25 28 — 0 1 1 1 — 0 5 1 6North Carolina 1 3 36 62 37 — 0 3 1 3 — 2 48 12 48South Carolina§ — 1 5 11 24 — 0 1 1 — — 0 2 1 2Virginia§ 1 2 8 23 21 — 0 2 — — 1 2 12 6 2West Virginia 2 0 66 2 — — 0 0 — — — 0 0 — —
E.S. Central 5 14 40 119 138 — 0 3 — 2 1 5 29 11 12Alabama§ 2 5 14 48 20 — 0 1 — — — 1 8 5 2Kentucky 3 2 28 15 44 — 0 2 — 1 — 0 0 — —Mississippi — 1 6 23 10 — 0 0 — — — 0 3 — —Tennessee§ — 4 14 33 64 — 0 2 — 1 1 4 20 6 10
W.S. Central 24 54 290 378 500 — 0 7 — 1 — 2 184 3 8Arkansas§ 2 1 6 11 11 — 0 2 — — — 1 29 1 3Louisiana — 5 13 30 50 — 0 0 — — — 0 1 — —Oklahoma 1 3 46 27 76 — 0 4 — — — 0 152 1 1Texas§ 21 44 240 310 363 — 0 1 — 1 — 0 3 1 4
Mountain 9 16 32 199 160 — 0 5 6 — — 0 7 16 1Arizona 3 8 19 46 90 — 0 4 6 — — 0 7 16 —Colorado§ 3 2 8 27 19 — 0 1 — — — 0 1 — —Idaho§ — 0 3 6 4 — 0 0 — — — 0 1 — —Montana§ 3 0 15 73 3 — 0 1 — — — 0 1 — —Nevada§ — 0 6 6 8 — 0 0 — — — 0 0 — —New Mexico§ — 3 10 33 27 — 0 0 — — — 0 0 — 1Utah — 1 4 8 9 — 0 0 — — — 0 1 — —Wyoming§ — 0 0 — — — 0 0 — — — 0 1 — —
Pacific 15 22 73 268 239 — 0 2 — 1 — 0 1 — —Alaska — 0 1 1 — N 0 0 N N N 0 0 N NCalifornia 7 19 58 210 194 — 0 2 — 1 — 0 0 — —Hawaii — 1 4 18 13 N 0 0 N N N 0 0 N NOregon 2 1 4 21 21 — 0 0 — — — 0 1 — —Washington 6 1 17 18 11 — 0 0 — — — 0 0 — —
TerritoriesAmerican Samoa — 1 1 1 — N 0 0 N N N 0 0 N NC.N.M.I. — — — — — — — — — — — — — — —Guam — 0 1 1 — N 0 0 N N N 0 0 N NPuerto Rico — 0 1 — 1 N 0 0 N N N 0 0 N NU.S. Virgin Islands — 0 0 — — — 0 0 — — — 0 0 — —
C.N.M.I.: Commonwealth of Northern Mariana Islands.U: Unavailable. —: No reported cases. N: Not reportable. NN: Not Nationally Notifiable. Cum: Cumulative year-to-date counts. Med: Median. Max: Maximum.* Case counts for reporting year 2010 and 2011 are provisional and subject to change. For further information on interpretation of these data, see http://www.cdc.gov/osels/ph_surveillance/
nndss/phs/files/ProvisionalNationa%20NotifiableDiseasesSurveillanceData20100927.pdf. Data for TB are displayed in Table IV, which appears quarterly.† Illnesses with similar clinical presentation that result from Spotted fever group rickettsia infections are reported as Spotted fever rickettsioses. Rocky Mountain spotted fever (RMSF) caused
by Rickettsia rickettsii, is the most common and well-known spotted fever.§ Contains data reported through the National Electronic Disease Surveillance System (NEDSS).
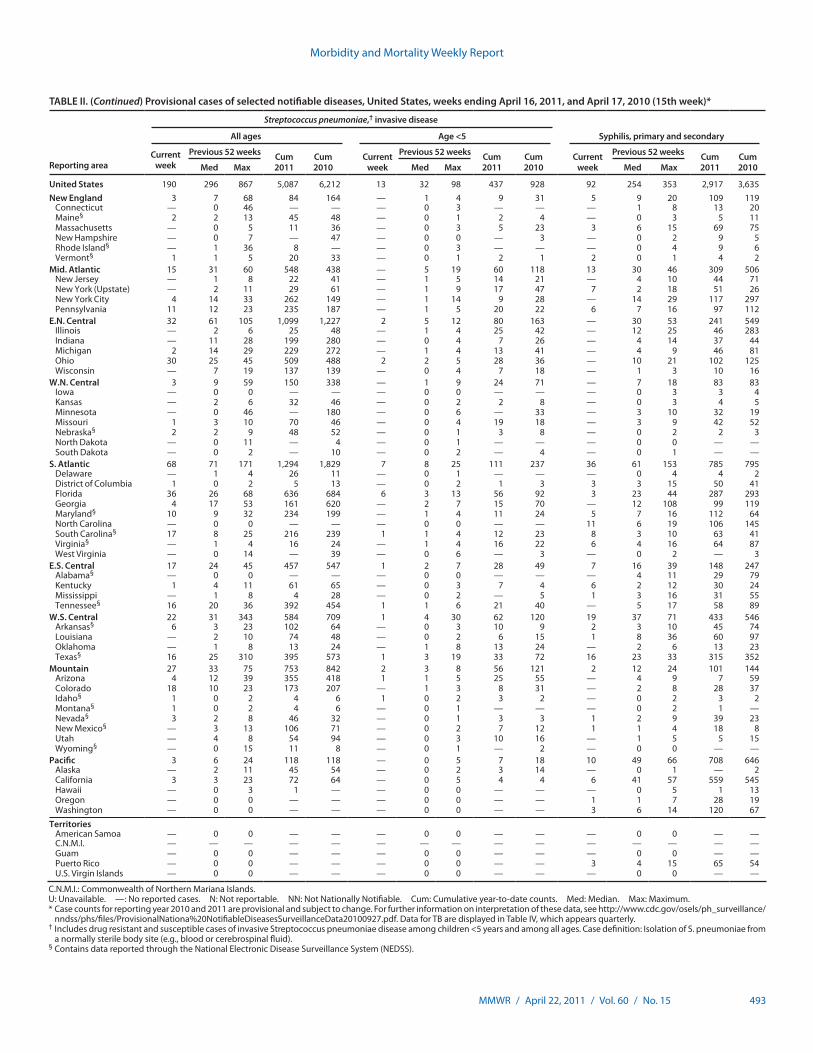
Morbidity and Mortality Weekly Report
MMWR / April 22, 2011 / Vol. 60 / No. 15 493
TABLE II. (Continued) Provisional cases of selected notifiable diseases, United States, weeks ending April 16, 2011, and April 17, 2010 (15th week)*
Streptococcus pneumoniae,† invasive disease
Reporting area
All ages Age <5 Syphilis, primary and secondary
Current week
Previous 52 weeks Cum 2011
Cum 2010
Current week
Previous 52 weeks Cum 2011
Cum 2010
Current week
Previous 52 weeks Cum 2011
Cum 2010Med Max Med Max Med Max
United States 190 296 867 5,087 6,212 13 32 98 437 928 92 254 353 2,917 3,635New England 3 7 68 84 164 — 1 4 9 31 5 9 20 109 119
Connecticut — 0 46 — — — 0 3 — — — 1 8 13 20Maine§ 2 2 13 45 48 — 0 1 2 4 — 0 3 5 11Massachusetts — 0 5 11 36 — 0 3 5 23 3 6 15 69 75New Hampshire — 0 7 — 47 — 0 0 — 3 — 0 2 9 5Rhode Island§ — 1 36 8 — — 0 3 — — — 0 4 9 6Vermont§ 1 1 5 20 33 — 0 1 2 1 2 0 1 4 2
Mid. Atlantic 15 31 60 548 438 — 5 19 60 118 13 30 46 309 506New Jersey — 1 8 22 41 — 1 5 14 21 — 4 10 44 71New York (Upstate) — 2 11 29 61 — 1 9 17 47 7 2 18 51 26New York City 4 14 33 262 149 — 1 14 9 28 — 14 29 117 297Pennsylvania 11 12 23 235 187 — 1 5 20 22 6 7 16 97 112
E.N. Central 32 61 105 1,099 1,227 2 5 12 80 163 — 30 53 241 549Illinois — 2 6 25 48 — 1 4 25 42 — 12 25 46 283Indiana — 11 28 199 280 — 0 4 7 26 — 4 14 37 44Michigan 2 14 29 229 272 — 1 4 13 41 — 4 9 46 81Ohio 30 25 45 509 488 2 2 5 28 36 — 10 21 102 125Wisconsin — 7 19 137 139 — 0 4 7 18 — 1 3 10 16
W.N. Central 3 9 59 150 338 — 1 9 24 71 — 7 18 83 83Iowa — 0 0 — — — 0 0 — — — 0 3 3 4Kansas — 2 6 32 46 — 0 2 2 8 — 0 3 4 5Minnesota — 0 46 — 180 — 0 6 — 33 — 3 10 32 19Missouri 1 3 10 70 46 — 0 4 19 18 — 3 9 42 52Nebraska§ 2 2 9 48 52 — 0 1 3 8 — 0 2 2 3North Dakota — 0 11 — 4 — 0 1 — — — 0 0 — —South Dakota — 0 2 — 10 — 0 2 — 4 — 0 1 — —
S. Atlantic 68 71 171 1,294 1,829 7 8 25 111 237 36 61 153 785 795Delaware — 1 4 26 11 — 0 1 — — — 0 4 4 2District of Columbia 1 0 2 5 13 — 0 2 1 3 3 3 15 50 41Florida 36 26 68 636 684 6 3 13 56 92 3 23 44 287 293Georgia 4 17 53 161 620 — 2 7 15 70 — 12 108 99 119Maryland§ 10 9 32 234 199 — 1 4 11 24 5 7 16 112 64North Carolina — 0 0 — — — 0 0 — — 11 6 19 106 145South Carolina§ 17 8 25 216 239 1 1 4 12 23 8 3 10 63 41Virginia§ — 1 4 16 24 — 1 4 16 22 6 4 16 64 87West Virginia — 0 14 — 39 — 0 6 — 3 — 0 2 — 3
E.S. Central 17 24 45 457 547 1 2 7 28 49 7 16 39 148 247Alabama§ — 0 0 — — — 0 0 — — — 4 11 29 79Kentucky 1 4 11 61 65 — 0 3 7 4 6 2 12 30 24Mississippi — 1 8 4 28 — 0 2 — 5 1 3 16 31 55Tennessee§ 16 20 36 392 454 1 1 6 21 40 — 5 17 58 89
W.S. Central 22 31 343 584 709 1 4 30 62 120 19 37 71 433 546Arkansas§ 6 3 23 102 64 — 0 3 10 9 2 3 10 45 74Louisiana — 2 10 74 48 — 0 2 6 15 1 8 36 60 97Oklahoma — 1 8 13 24 — 1 8 13 24 — 2 6 13 23Texas§ 16 25 310 395 573 1 3 19 33 72 16 23 33 315 352
Mountain 27 33 75 753 842 2 3 8 56 121 2 12 24 101 144Arizona 4 12 39 355 418 1 1 5 25 55 — 4 9 7 59Colorado 18 10 23 173 207 — 1 3 8 31 — 2 8 28 37Idaho§ 1 0 2 4 6 1 0 2 3 2 — 0 2 3 2Montana§ 1 0 2 4 6 — 0 1 — — — 0 2 1 —Nevada§ 3 2 8 46 32 — 0 1 3 3 1 2 9 39 23New Mexico§ — 3 13 106 71 — 0 2 7 12 1 1 4 18 8Utah — 4 8 54 94 — 0 3 10 16 — 1 5 5 15Wyoming§ — 0 15 11 8 — 0 1 — 2 — 0 0 — —
Pacific 3 6 24 118 118 — 0 5 7 18 10 49 66 708 646Alaska — 2 11 45 54 — 0 2 3 14 — 0 1 — 2California 3 3 23 72 64 — 0 5 4 4 6 41 57 559 545Hawaii — 0 3 1 — — 0 0 — — — 0 5 1 13Oregon — 0 0 — — — 0 0 — — 1 1 7 28 19Washington — 0 0 — — — 0 0 — — 3 6 14 120 67
TerritoriesAmerican Samoa — 0 0 — — — 0 0 — — — 0 0 — —C.N.M.I. — — — — — — — — — — — — — — —Guam — 0 0 — — — 0 0 — — — 0 0 — —Puerto Rico — 0 0 — — — 0 0 — — 3 4 15 65 54U.S. Virgin Islands — 0 0 — — — 0 0 — — — 0 0 — —
C.N.M.I.: Commonwealth of Northern Mariana Islands.U: Unavailable. —: No reported cases. N: Not reportable. NN: Not Nationally Notifiable. Cum: Cumulative year-to-date counts. Med: Median. Max: Maximum.* Case counts for reporting year 2010 and 2011 are provisional and subject to change. For further information on interpretation of these data, see http://www.cdc.gov/osels/ph_surveillance/
nndss/phs/files/ProvisionalNationa%20NotifiableDiseasesSurveillanceData20100927.pdf. Data for TB are displayed in Table IV, which appears quarterly.† Includes drug resistant and susceptible cases of invasive Streptococcus pneumoniae disease among children <5 years and among all ages. Case definition: Isolation of S. pneumoniae from
a normally sterile body site (e.g., blood or cerebrospinal fluid).§ Contains data reported through the National Electronic Disease Surveillance System (NEDSS).
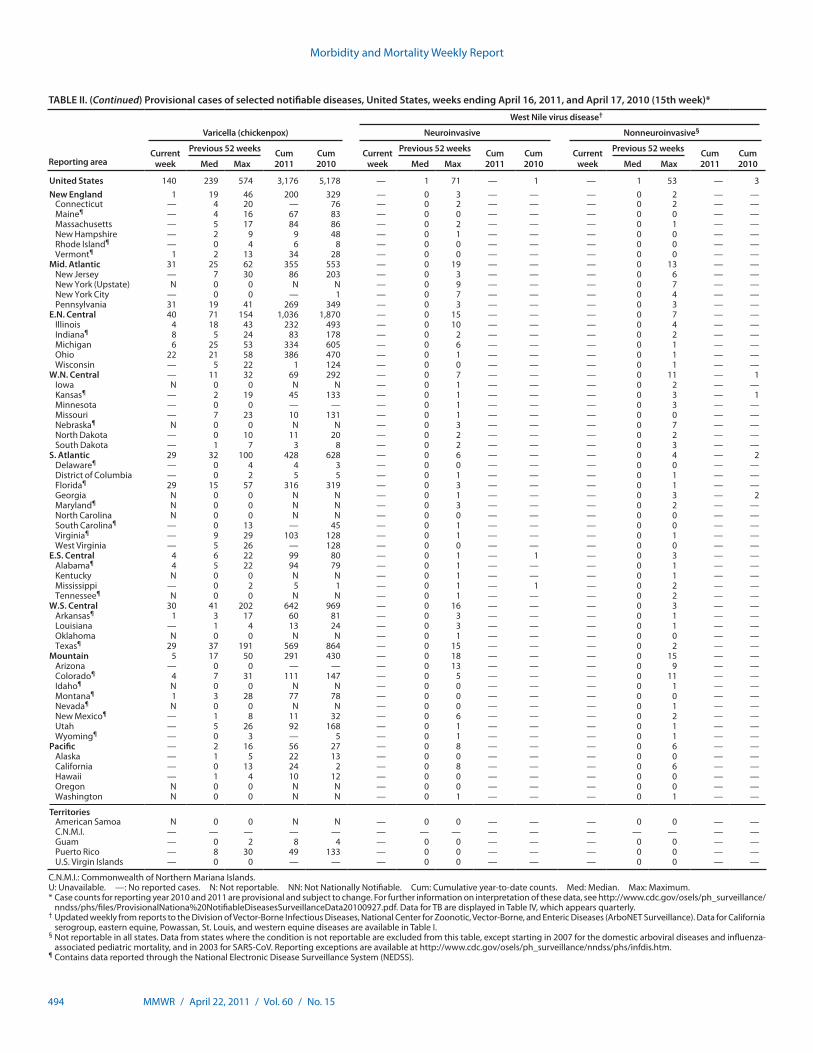
Morbidity and Mortality Weekly Report
494 MMWR / April 22, 2011 / Vol. 60 / No. 15
TABLE II. (Continued) Provisional cases of selected notifiable diseases, United States, weeks ending April 16, 2011, and April 17, 2010 (15th week)*
West Nile virus disease†
Reporting area
Varicella (chickenpox) Neuroinvasive Nonneuroinvasive§
Current week
Previous 52 weeks Cum 2011
Cum 2010
Current week
Previous 52 weeks Cum 2011
Cum 2010
Current week
Previous 52 weeks Cum 2011
Cum 2010Med Max Med Max Med Max
United States 140 239 574 3,176 5,178 — 1 71 — 1 — 1 53 — 3New England 1 19 46 200 329 — 0 3 — — — 0 2 — —
Connecticut — 4 20 — 76 — 0 2 — — — 0 2 — —Maine¶ — 4 16 67 83 — 0 0 — — — 0 0 — —Massachusetts — 5 17 84 86 — 0 2 — — — 0 1 — —New Hampshire — 2 9 9 48 — 0 1 — — — 0 0 — —Rhode Island¶ — 0 4 6 8 — 0 0 — — — 0 0 — —Vermont¶ 1 2 13 34 28 — 0 0 — — — 0 0 — —
Mid. Atlantic 31 25 62 355 553 — 0 19 — — — 0 13 — —New Jersey — 7 30 86 203 — 0 3 — — — 0 6 — —New York (Upstate) N 0 0 N N — 0 9 — — — 0 7 — —New York City — 0 0 — 1 — 0 7 — — — 0 4 — —Pennsylvania 31 19 41 269 349 — 0 3 — — — 0 3 — —
E.N. Central 40 71 154 1,036 1,870 — 0 15 — — — 0 7 — —Illinois 4 18 43 232 493 — 0 10 — — — 0 4 — —Indiana¶ 8 5 24 83 178 — 0 2 — — — 0 2 — —Michigan 6 25 53 334 605 — 0 6 — — — 0 1 — —Ohio 22 21 58 386 470 — 0 1 — — — 0 1 — —Wisconsin — 5 22 1 124 — 0 0 — — — 0 1 — —
W.N. Central — 11 32 69 292 — 0 7 — — — 0 11 — 1Iowa N 0 0 N N — 0 1 — — — 0 2 — —Kansas¶ — 2 19 45 133 — 0 1 — — — 0 3 — 1Minnesota — 0 0 — — — 0 1 — — — 0 3 — —Missouri — 7 23 10 131 — 0 1 — — — 0 0 — —Nebraska¶ N 0 0 N N — 0 3 — — — 0 7 — —North Dakota — 0 10 11 20 — 0 2 — — — 0 2 — —South Dakota — 1 7 3 8 — 0 2 — — — 0 3 — —
S. Atlantic 29 32 100 428 628 — 0 6 — — — 0 4 — 2Delaware¶ — 0 4 4 3 — 0 0 — — — 0 0 — —District of Columbia — 0 2 5 5 — 0 1 — — — 0 1 — —Florida¶ 29 15 57 316 319 — 0 3 — — — 0 1 — —Georgia N 0 0 N N — 0 1 — — — 0 3 — 2Maryland¶ N 0 0 N N — 0 3 — — — 0 2 — —North Carolina N 0 0 N N — 0 0 — — — 0 0 — —South Carolina¶ — 0 13 — 45 — 0 1 — — — 0 0 — —Virginia¶ — 9 29 103 128 — 0 1 — — — 0 1 — —West Virginia — 5 26 — 128 — 0 0 — — — 0 0 — —
E.S. Central 4 6 22 99 80 — 0 1 — 1 — 0 3 — —Alabama¶ 4 5 22 94 79 — 0 1 — — — 0 1 — —Kentucky N 0 0 N N — 0 1 — — — 0 1 — —Mississippi — 0 2 5 1 — 0 1 — 1 — 0 2 — —Tennessee¶ N 0 0 N N — 0 1 — — — 0 2 — —
W.S. Central 30 41 202 642 969 — 0 16 — — — 0 3 — —Arkansas¶ 1 3 17 60 81 — 0 3 — — — 0 1 — —Louisiana — 1 4 13 24 — 0 3 — — — 0 1 — —Oklahoma N 0 0 N N — 0 1 — — — 0 0 — —Texas¶ 29 37 191 569 864 — 0 15 — — — 0 2 — —
Mountain 5 17 50 291 430 — 0 18 — — — 0 15 — —Arizona — 0 0 — — — 0 13 — — — 0 9 — —Colorado¶ 4 7 31 111 147 — 0 5 — — — 0 11 — —Idaho¶ N 0 0 N N — 0 0 — — — 0 1 — —Montana¶ 1 3 28 77 78 — 0 0 — — — 0 0 — —Nevada¶ N 0 0 N N — 0 0 — — — 0 1 — —New Mexico¶ — 1 8 11 32 — 0 6 — — — 0 2 — —Utah — 5 26 92 168 — 0 1 — — — 0 1 — —Wyoming¶ — 0 3 — 5 — 0 1 — — — 0 1 — —
Pacific — 2 16 56 27 — 0 8 — — — 0 6 — —Alaska — 1 5 22 13 — 0 0 — — — 0 0 — —California — 0 13 24 2 — 0 8 — — — 0 6 — —Hawaii — 1 4 10 12 — 0 0 — — — 0 0 — —Oregon N 0 0 N N — 0 0 — — — 0 0 — —Washington N 0 0 N N — 0 1 — — — 0 1 — —
TerritoriesAmerican Samoa N 0 0 N N — 0 0 — — — 0 0 — —C.N.M.I. — — — — — — — — — — — — — — —Guam — 0 2 8 4 — 0 0 — — — 0 0 — —Puerto Rico — 8 30 49 133 — 0 0 — — — 0 0 — —U.S. Virgin Islands — 0 0 — — — 0 0 — — — 0 0 — —
C.N.M.I.: Commonwealth of Northern Mariana Islands.U: Unavailable. —: No reported cases. N: Not reportable. NN: Not Nationally Notifiable. Cum: Cumulative year-to-date counts. Med: Median. Max: Maximum.* Case counts for reporting year 2010 and 2011 are provisional and subject to change. For further information on interpretation of these data, see http://www.cdc.gov/osels/ph_surveillance/
nndss/phs/files/ProvisionalNationa%20NotifiableDiseasesSurveillanceData20100927.pdf. Data for TB are displayed in Table IV, which appears quarterly.† Updated weekly from reports to the Division of Vector-Borne Infectious Diseases, National Center for Zoonotic, Vector-Borne, and Enteric Diseases (ArboNET Surveillance). Data for California
serogroup, eastern equine, Powassan, St. Louis, and western equine diseases are available in Table I.§ Not reportable in all states. Data from states where the condition is not reportable are excluded from this table, except starting in 2007 for the domestic arboviral diseases and influenza-
associated pediatric mortality, and in 2003 for SARS-CoV. Reporting exceptions are available at http://www.cdc.gov/osels/ph_surveillance/nndss/phs/infdis.htm.¶ Contains data reported through the National Electronic Disease Surveillance System (NEDSS).
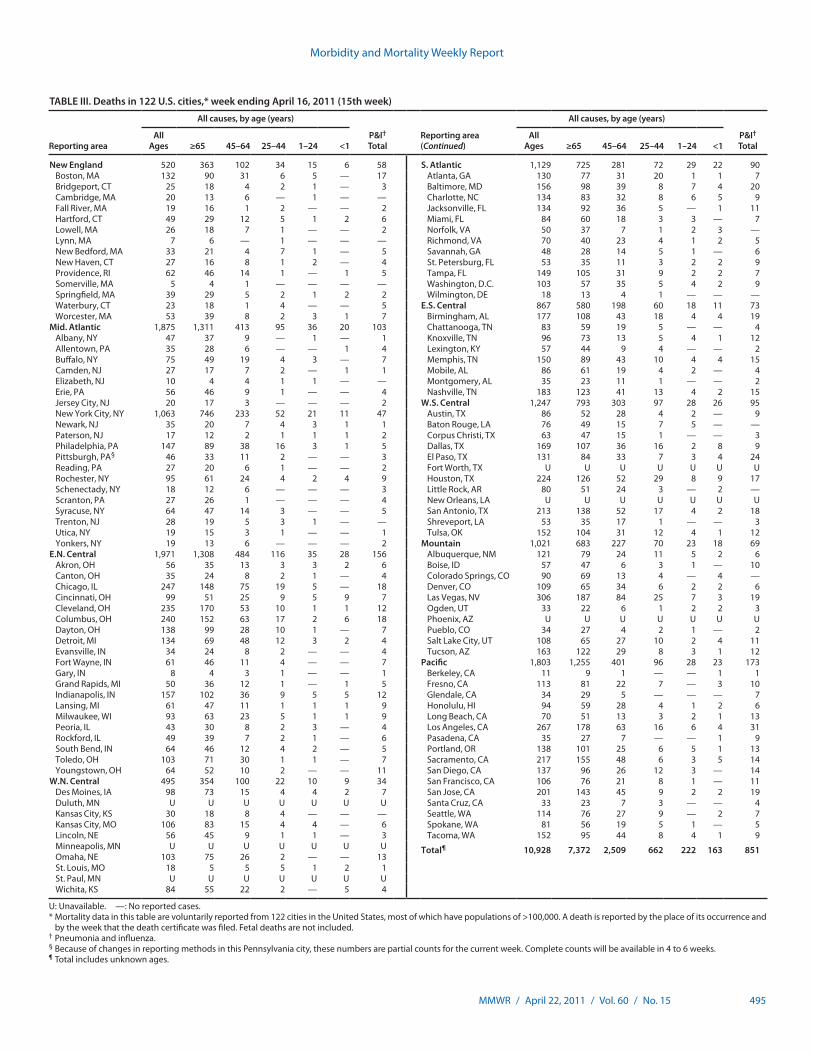
Morbidity and Mortality Weekly Report
MMWR / April 22, 2011 / Vol. 60 / No. 15 495
TABLE III. Deaths in 122 U.S. cities,* week ending April 16, 2011 (15th week)
Reporting area
All causes, by age (years)
P&I† Total
Reporting area (Continued)
All causes, by age (years)
P&I† Total
All Ages ≥65 45–64 25–44 1–24 <1
All Ages ≥65 45–64 25–44 1–24 <1
New England 520 363 102 34 15 6 58 S. Atlantic 1,129 725 281 72 29 22 90Boston, MA 132 90 31 6 5 — 17 Atlanta, GA 130 77 31 20 1 1 7Bridgeport, CT 25 18 4 2 1 — 3 Baltimore, MD 156 98 39 8 7 4 20Cambridge, MA 20 13 6 — 1 — — Charlotte, NC 134 83 32 8 6 5 9Fall River, MA 19 16 1 2 — — 2 Jacksonville, FL 134 92 36 5 — 1 11Hartford, CT 49 29 12 5 1 2 6 Miami, FL 84 60 18 3 3 — 7Lowell, MA 26 18 7 1 — — 2 Norfolk, VA 50 37 7 1 2 3 —Lynn, MA 7 6 — 1 — — — Richmond, VA 70 40 23 4 1 2 5New Bedford, MA 33 21 4 7 1 — 5 Savannah, GA 48 28 14 5 1 — 6New Haven, CT 27 16 8 1 2 — 4 St. Petersburg, FL 53 35 11 3 2 2 9Providence, RI 62 46 14 1 — 1 5 Tampa, FL 149 105 31 9 2 2 7Somerville, MA 5 4 1 — — — — Washington, D.C. 103 57 35 5 4 2 9Springfield, MA 39 29 5 2 1 2 2 Wilmington, DE 18 13 4 1 — — —Waterbury, CT 23 18 1 4 — — 5 E.S. Central 867 580 198 60 18 11 73Worcester, MA 53 39 8 2 3 1 7 Birmingham, AL 177 108 43 18 4 4 19
Mid. Atlantic 1,875 1,311 413 95 36 20 103 Chattanooga, TN 83 59 19 5 — — 4Albany, NY 47 37 9 — 1 — 1 Knoxville, TN 96 73 13 5 4 1 12Allentown, PA 35 28 6 — — 1 4 Lexington, KY 57 44 9 4 — — 2Buffalo, NY 75 49 19 4 3 — 7 Memphis, TN 150 89 43 10 4 4 15Camden, NJ 27 17 7 2 — 1 1 Mobile, AL 86 61 19 4 2 — 4Elizabeth, NJ 10 4 4 1 1 — — Montgomery, AL 35 23 11 1 — — 2Erie, PA 56 46 9 1 — — 4 Nashville, TN 183 123 41 13 4 2 15Jersey City, NJ 20 17 3 — — — 2 W.S. Central 1,247 793 303 97 28 26 95New York City, NY 1,063 746 233 52 21 11 47 Austin, TX 86 52 28 4 2 — 9Newark, NJ 35 20 7 4 3 1 1 Baton Rouge, LA 76 49 15 7 5 — —Paterson, NJ 17 12 2 1 1 1 2 Corpus Christi, TX 63 47 15 1 — — 3Philadelphia, PA 147 89 38 16 3 1 5 Dallas, TX 169 107 36 16 2 8 9Pittsburgh, PA§ 46 33 11 2 — — 3 El Paso, TX 131 84 33 7 3 4 24Reading, PA 27 20 6 1 — — 2 Fort Worth, TX U U U U U U URochester, NY 95 61 24 4 2 4 9 Houston, TX 224 126 52 29 8 9 17Schenectady, NY 18 12 6 — — — 3 Little Rock, AR 80 51 24 3 — 2 —Scranton, PA 27 26 1 — — — 4 New Orleans, LA U U U U U U USyracuse, NY 64 47 14 3 — — 5 San Antonio, TX 213 138 52 17 4 2 18Trenton, NJ 28 19 5 3 1 — — Shreveport, LA 53 35 17 1 — — 3Utica, NY 19 15 3 1 — — 1 Tulsa, OK 152 104 31 12 4 1 12Yonkers, NY 19 13 6 — — — 2 Mountain 1,021 683 227 70 23 18 69
E.N. Central 1,971 1,308 484 116 35 28 156 Albuquerque, NM 121 79 24 11 5 2 6Akron, OH 56 35 13 3 3 2 6 Boise, ID 57 47 6 3 1 — 10Canton, OH 35 24 8 2 1 — 4 Colorado Springs, CO 90 69 13 4 — 4 —Chicago, IL 247 148 75 19 5 — 18 Denver, CO 109 65 34 6 2 2 6Cincinnati, OH 99 51 25 9 5 9 7 Las Vegas, NV 306 187 84 25 7 3 19Cleveland, OH 235 170 53 10 1 1 12 Ogden, UT 33 22 6 1 2 2 3Columbus, OH 240 152 63 17 2 6 18 Phoenix, AZ U U U U U U UDayton, OH 138 99 28 10 1 — 7 Pueblo, CO 34 27 4 2 1 — 2Detroit, MI 134 69 48 12 3 2 4 Salt Lake City, UT 108 65 27 10 2 4 11Evansville, IN 34 24 8 2 — — 4 Tucson, AZ 163 122 29 8 3 1 12Fort Wayne, IN 61 46 11 4 — — 7 Pacific 1,803 1,255 401 96 28 23 173Gary, IN 8 4 3 1 — — 1 Berkeley, CA 11 9 1 — — 1 1Grand Rapids, MI 50 36 12 1 — 1 5 Fresno, CA 113 81 22 7 — 3 10Indianapolis, IN 157 102 36 9 5 5 12 Glendale, CA 34 29 5 — — — 7Lansing, MI 61 47 11 1 1 1 9 Honolulu, HI 94 59 28 4 1 2 6Milwaukee, WI 93 63 23 5 1 1 9 Long Beach, CA 70 51 13 3 2 1 13Peoria, IL 43 30 8 2 3 — 4 Los Angeles, CA 267 178 63 16 6 4 31Rockford, IL 49 39 7 2 1 — 6 Pasadena, CA 35 27 7 — — 1 9South Bend, IN 64 46 12 4 2 — 5 Portland, OR 138 101 25 6 5 1 13Toledo, OH 103 71 30 1 1 — 7 Sacramento, CA 217 155 48 6 3 5 14Youngstown, OH 64 52 10 2 — — 11 San Diego, CA 137 96 26 12 3 — 14
W.N. Central 495 354 100 22 10 9 34 San Francisco, CA 106 76 21 8 1 — 11Des Moines, IA 98 73 15 4 4 2 7 San Jose, CA 201 143 45 9 2 2 19Duluth, MN U U U U U U U Santa Cruz, CA 33 23 7 3 — — 4Kansas City, KS 30 18 8 4 — — — Seattle, WA 114 76 27 9 — 2 7Kansas City, MO 106 83 15 4 4 — 6 Spokane, WA 81 56 19 5 1 — 5Lincoln, NE 56 45 9 1 1 — 3 Tacoma, WA 152 95 44 8 4 1 9Minneapolis, MN U U U U U U U Total¶ 10,928 7,372 2,509 662 222 163 851Omaha, NE 103 75 26 2 — — 13St. Louis, MO 18 5 5 5 1 2 1St. Paul, MN U U U U U U UWichita, KS 84 55 22 2 — 5 4
U: Unavailable. —: No reported cases.* Mortality data in this table are voluntarily reported from 122 cities in the United States, most of which have populations of >100,000. A death is reported by the place of its occurrence and
by the week that the death certificate was filed. Fetal deaths are not included.† Pneumonia and influenza.§ Because of changes in reporting methods in this Pennsylvania city, these numbers are partial counts for the current week. Complete counts will be available in 4 to 6 weeks.¶ Total includes unknown ages.
U.S. Government Printing Office: 2011-723-011/21043 Region IV ISSN: 0149-2195
The Morbidity and Mortality Weekly Report (MMWR) Series is prepared by the Centers for Disease Control and Prevention (CDC) and is available free of charge in electronic format. To receive an electronic copy each week, visit MMWR’s free subscription page at http://www.cdc.gov/mmwr/mmwrsubscribe.html. Paper copy subscriptions are available through the Superintendent of Documents, U.S. Government Printing Office, Washington, DC 20402; telephone 202-512-1800.
Data presented by the Notifiable Disease Data Team and 122 Cities Mortality Data Team in the weekly MMWR are provisional, based on weekly reports to CDC by state health departments. Address all inquiries about the MMWR Series, including material to be considered for publication, to Editor, MMWR Series, Mailstop E-90, CDC, 1600 Clifton Rd., N.E., Atlanta, GA 30333 or to [email protected].
All material in the MMWR Series is in the public domain and may be used and reprinted without permission; citation as to source, however, is appreciated.
Use of trade names and commercial sources is for identification only and does not imply endorsement by the U.S. Department of Health and Human Services.
References to non-CDC sites on the Internet are provided as a service to MMWR readers and do not constitute or imply endorsement of these organiza-tions or their programs by CDC or the U.S. Department of Health and Human Services. CDC is not responsible for the content of these sites. URL addresses listed in MMWR were current as of the date of publication.
Morbidity and Mortality Weekly Report