bulgaria exporter guide exporter guide - bulgaria gain publications/exporter guide... · post:...
TRANSCRIPT
THIS REPORT CONTAINS ASSESSMENTS OF COMMODITY AND TRADE ISSUES MADE BY
USDA STAFF AND NOT NECESSARILY STATEMENTS OF OFFICIAL U.S. GOVERNMENT
POLICY
Date:
GAIN Report Number:
Approved By:
Prepared By:
Report Highlights:
Bulgaria, a newly developing market economy, is easily affected by world market fluctuations. From
2010 to 2013, the economic growth rate slowed due to the global recession but U.S. exports to Bulgaria
has steadily increased since then. Political changes in Bulgaria in 2014 led to more stable relations with
EU member partners. Trade is expected to move upwards as a result. Bulgaria is broadly recognized as
an excellent gateway into the wider EU market for agricultural products. The Bulgarian market is not
yet well explored by U.S. agricultural suppliers. U.S. agricultural exports to Bulgaria in 2014 totaled
almost U.S. $70 million, according to Intrastat statistical data provided by the Bulgarian National
Alexander Todorov,
Marketing Assistant
Russell J. Nicely,
Agricultural Attaché
Exporter Guide - Bulgaria
Exporter Guide
Bulgaria
BU1544
12/23/2015
Required Report - public distribution

Statistical Institute. Over the last five years such U.S. exports have ranged from U.S. $18 to $74 million.
U.S.
Post:
Executive Summary:
I. Market Overview
General Economy
Bulgaria is a new and developing market economy, with gradually decreasing government involvement
in foreign investment and trade. For comparison, at the beginning of the transition to a market economy
in 1989, the share of private sector employees was essentially zero percent, and at the end of 2014
nearly 75% of the workforce is in the private sector. The Bulgarian economy enjoyed growth above 6%
in the period 2000-2008. The economy slowed down in 2011, with GDP growth of 1.8%, and only
0.8% for 2012. Foreign direct investments declined slightly from the average 3% of GDP for the last
four years, reaching U.S. $ 1.56 billion (2.8% of GDP) in 2014. About 40% of foreign direct
investments are channeled to real estate, 14% to financial intermediation, 9% to energy sector, and the
rest is shared among construction building, trade, the service sector, and other sectors (source:
Bulgarian National Bank). Exports generate about 52% of the GDP and are the main engine for the
country’s economic development. The biggest shares of exports are in industrial supplies, consumer
goods, fuels, and lubricants. However, this dependence on exports and foreign investments also makes
the domestic economy vulnerable to global demand fluctuations. For example, in 2009, the economy
suffered almost a 5% decline in economic growth due to the global economic recession.
That decline has its origins mainly in reduced foreign investments in the real estate sector. Before the
global recession, Bulgarian GDP was growing at a rate of about 5-6% each year. According to the
Bulgarian National Statistical Institute (NSI), the economy grew by 1.3-1.6% in 2013-2014. According
to seasonally adjusted data, GDP growth rate for the third quarter of 2015 is 2.9% as compared to the
same period in 2014.
The trend of the annual unemployment rate in Bulgaria over the period 2005-2008 was steadily
downward, decreasing from 10.1% in 2005 to 5.6% in 2008. However, due to negative impacts of the
economic crisis, unemployment rates in the country increased to 11.3%, 12.3%, and 13% in 2011,
2012, and 2013 respectively. In 2014 the unemployment rate decreased slightly to reach 11.4% (source:
NSI).
The Bulgarian economy is going through a fundamental restructuring during the transition to a full
market-oriented economy. In 1989 Bulgaria’s leading trade partner was the Soviet Union. About 65%
of Bulgarian exports were directed to the USSR and 53% of Bulgarian imports from the USSR. Today
the major trade partner of Bulgaria is the EU. With the size of the export flows for trade in goods, there
Sofia
was also a wide variation between Member States in the balance of these two flows. In 2014 sixteen
Member States have negative trade in goods balances - i.e. they import more goods by value from EU
partners than they export. Bulgaria also has a negative trade in goods balance of about U.S. $5.4 billion,
which is U.S. $0.6 more than in 2013.
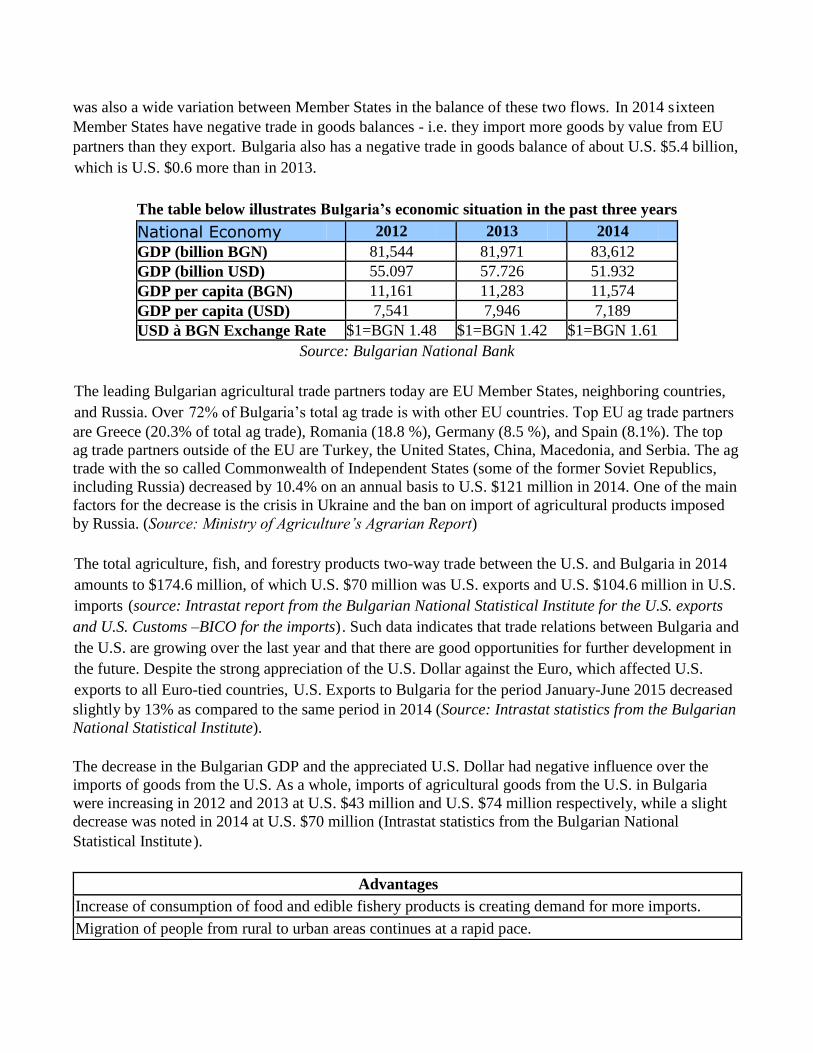
The table below illustrates Bulgaria’s economic situation in the past three years
National Economy 2012 2013 2014
GDP (billion BGN) 81,544 81,971 83,612
GDP (billion USD) 55.097 57.726 51.932
GDP per capita (BGN) 11,161 11,283 11,574
GDP per capita (USD) 7,541 7,946 7,189
USD à BGN Exchange Rate $1=BGN 1.48 $1=BGN 1.42 $1=BGN 1.61
Source: Bulgarian National Bank
The leading Bulgarian agricultural trade partners today are EU Member States, neighboring countries,
and Russia. Over 72% of Bulgaria’s total ag trade is with other EU countries. Top EU ag trade partners
are Greece (20.3% of total ag trade), Romania (18.8 %), Germany (8.5 %), and Spain (8.1%). The top
ag trade partners outside of the EU are Turkey, the United States, China, Macedonia, and Serbia. The ag
trade with the so called Commonwealth of Independent States (some of the former Soviet Republics,
including Russia) decreased by 10.4% on an annual basis to U.S. $121 million in 2014. One of the main
factors for the decrease is the crisis in Ukraine and the ban on import of agricultural products imposed
by Russia. (Source: Ministry of Agriculture’s Agrarian Report)
The total agriculture, fish, and forestry products two-way trade between the U.S. and Bulgaria in 2014
amounts to $174.6 million, of which U.S. $70 million was U.S. exports and U.S. $104.6 million in U.S.
imports (source: Intrastat report from the Bulgarian National Statistical Institute for the U.S. exports
and U.S. Customs –BICO for the imports). Such data indicates that trade relations between Bulgaria and
the U.S. are growing over the last year and that there are good opportunities for further development in
the future. Despite the strong appreciation of the U.S. Dollar against the Euro, which affected U.S.
exports to all Euro-tied countries, U.S. Exports to Bulgaria for the period January-June 2015 decreased
slightly by 13% as compared to the same period in 2014 (Source: Intrastat statistics from the Bulgarian
National Statistical Institute).
The decrease in the Bulgarian GDP and the appreciated U.S. Dollar had negative influence over the
imports of goods from the U.S. As a whole, imports of agricultural goods from the U.S. in Bulgaria
were increasing in 2012 and 2013 at U.S. $43 million and U.S. $74 million respectively, while a slight
decrease was noted in 2014 at U.S. $70 million (Intrastat statistics from the Bulgarian National
Statistical Institute).
Advantages
Increase of consumption of food and edible fishery products is creating demand for more imports.
Migration of people from rural to urban areas continues at a rapid pace.
Bulgarian market is accessible by sea.
Growing food processing industry is looking for new imported food ingredients.
Efficient domestic distribution network.
Marketing costs to increase consumer awareness are low.
Challenges
Bulgarian membership in the European Union puts U.S. exporters in a less favorable position than
EU member states because of duties.
Bulgarian domestic producers are receiving European funding to upgrade production efficiency and
product quality.
Bulgarian farmers increase agricultural production, reducing demand for imports in the country.
Fluctuations in the exchange rate and current appreciation of the U.S. dollar puts U.S. exporters at a
disadvantage compared with exporters of the EU. Bulgarian Lev (BGN) has a fixed exchange rate
against the Euro (EURO 1 = BGN 1.95583)
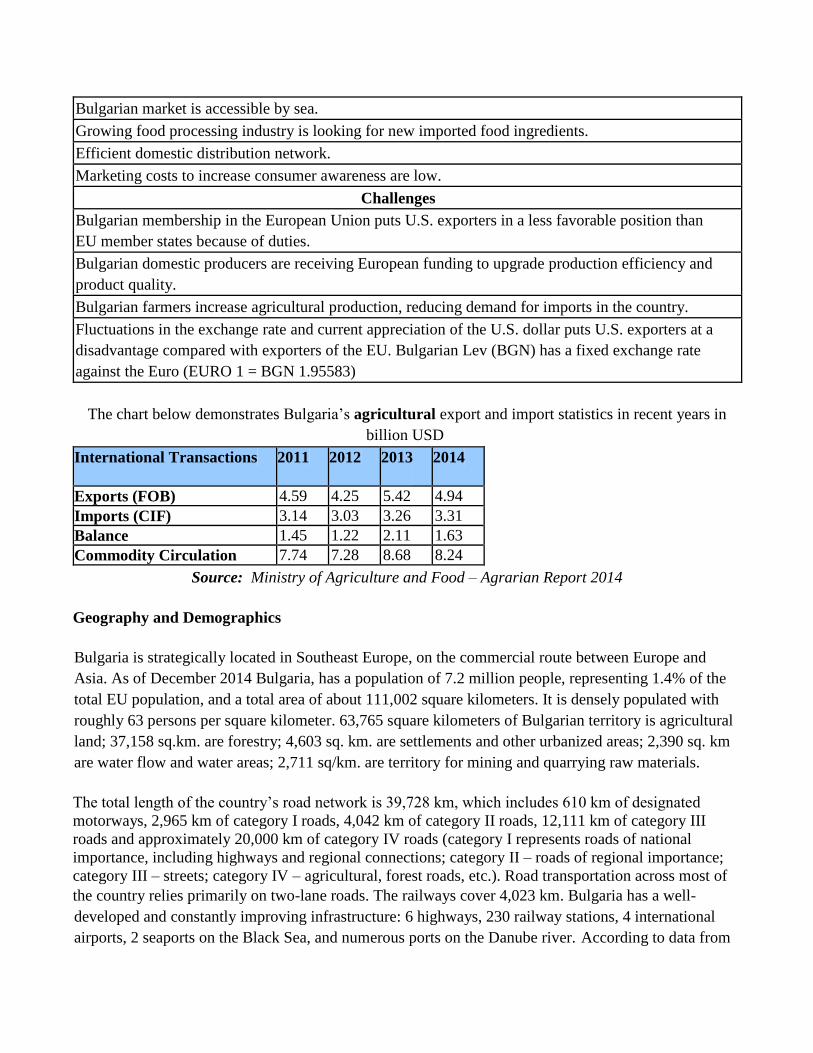
The chart below demonstrates Bulgaria’s agricultural export and import statistics in recent years in
billion USD
International Transactions 2011 2012 2013
2014
Exports (FOB) 4.59 4.25 5.42 4.94
Imports (CIF) 3.14 3.03 3.26 3.31
Balance 1.45 1.22 2.11 1.63
Commodity Circulation 7.74 7.28 8.68 8.24
Source: Ministry of Agriculture and Food – Agrarian Report 2014
Geography and Demographics
Bulgaria is strategically located in Southeast Europe, on the commercial route between Europe and
Asia. As of December 2014 Bulgaria, has a population of 7.2 million people, representing 1.4% of the
total EU population, and a total area of about 111,002 square kilometers. It is densely populated with
roughly 63 persons per square kilometer. 63,765 square kilometers of Bulgarian territory is agricultural
land; 37,158 sq.km. are forestry; 4,603 sq. km. are settlements and other urbanized areas; 2,390 sq. km
are water flow and water areas; 2,711 sq/km. are territory for mining and quarrying raw materials.
The total length of the country’s road network is 39,728 km, which includes 610 km of designated
motorways, 2,965 km of category I roads, 4,042 km of category II roads, 12,111 km of category III
roads and approximately 20,000 km of category IV roads (category I represents roads of national
importance, including highways and regional connections; category II – roads of regional importance;
category III – streets; category IV – agricultural, forest roads, etc.). Road transportation across most of
the country relies primarily on two-lane roads. The railways cover 4,023 km. Bulgaria has a well-
developed and constantly improving infrastructure: 6 highways, 230 railway stations, 4 international
airports, 2 seaports on the Black Sea, and numerous ports on the Danube river. According to data from
the Ministry of Regional Development and Public Works, priority road infrastructure projects in
Bulgaria until 2020 include construction of total 1,370 km of motorways (Trakia, Hemus, Maritsa,
Struma, Black Sea, Lulin, Sofia-Kalotina, and Veliko Tarnovo - Ruse motorways) and
construction/rehabilitation of 914 km of speedways, two new bridges over the Danube river in Silistra
and Nikopol, and the construction of the Shipka Tunnel. Five Pan-European corridors cross the country,
linking Northern Europe with the Middle East and North Africa.
Both sea and river routes – the Black Sea and the Danube River – offer reliable shipping transportation
to and from the country. Bulgaria has 15 Black Sea and 13 Danube River ports for public transport with
national importance consisting of a total of 84 and 74 wharves, respectively. The ports with regional
importance for public transport are 9 on the Black Sea coast and 21 on the banks of the Danube River.
The largest Bulgarian seaports are Burgas and Varna on the Black Sea coast. Varna mainly handles
containers, grain and bulk goods, while Burgas mainly deals with crude oil and some bulk commodities.
A ferry connection from Varna to Odessa (Ukraine), Kavkaz (Russia) and Poti (Georgia) facilitate the
transport of goods between the countries.
The Danube River is navigable during most of the year and supports inland water transport. With the
Rhine-Main-Danube canal in use since 1992, Bulgaria has access to large European ports on the North
Sea. The main Bulgarian ports on the Danube River are Ruse, Lom and Vidin.
Sofia is Bulgaria’s capital with a population of over 1.3 million people. Sofia is situated in
Southwestern Bulgaria. The second and third largest cities in Bulgaria are Plovdiv in Central South
Bulgaria, with a population of about 342,000 people, and Varna on the west coast of the Black Sea,
with a population of approximately 336,000 people (2014 year – source: NSI).
As of December 31, 2014, 5.27 million (73.1%) of total population resided in urban areas and 1. 94
million (26.9%) in rural ones. The Bulgarian population has been decreasing recently. At the end of
2014 senior citizens above working age (65 years and over) made up over 24% of the Bulgarian
population, a figure which will continue to grow as birth rates are low and life expectancies increase.
Health care and medicine are currently in high demand with the senior population in Bulgaria.
Expenses for senior health care will increase in the future. The number of population of working age as
of December 31, 2014 was 4.4 million persons (61.1%) of the total population. The traditional model of
nuclear family (married with two children) is gradually being replaced by a model of cohabitation with
one child. Birth rate in 2014 has increased a little to 0.94%, from 0.92% in 2013.
In Bulgaria there is a significant difference in the consumer behavior of young working people and
elderly retirees. Young workers earn higher incomes and have greater consumption. Young people are
buying better quality products, visiting restaurants, going on holidays and engaging on other activities.
In contrast, older pensioners receive lower pensions and limit themselves to the most pressing needs of
the day. The average annual salary in Bulgaria is about $ 6,170 (BGN 9,933 – source Bulgarian
National Bank), while the average annual pension is about $2,519 (BGN 4,056). This shows that young
people have more than two times the purchasing power of pensioners. It has been noted that the number
of population over working age in the country is 1.44 million people (20%), which equals to almost one
fourth of the population. There are significant differences between big cities and small towns and
villages. In major cities employment is high, incomes too, and young people are aiming for them. In
contrast, in small towns and villages unemployment is high, incomes are low, and consumption has
shrunk, with many of the food and beverages being produced by people themselves.
In Bulgaria only 3% of the people define their income as high, and 40% as average. The remaining 57%
define it as low.
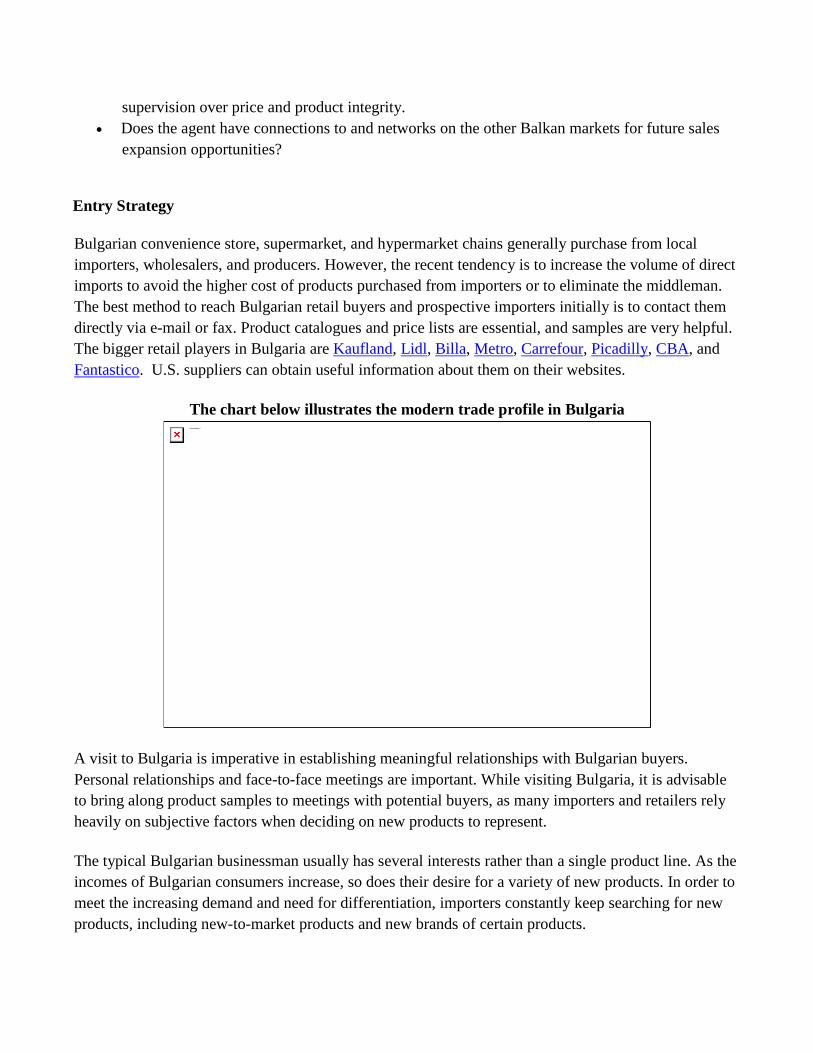
The chart below illustrates the average demographics in recent years
Bulgarian Demographics
2012 2013 2014
Birth Rate (%) 0.95 0.92 0.94
Death Rate (%) 1.5 1.44 1.51
Age Structure 0 – 14 yrs (%) 14.4 14.6 14.8
Age Structure 15–64 yrs (%) 61.8 61.7 61.1
Age Structure 65+ yrs ( %) 23.8 23.7 24.1
Source: Bulgarian National Statistical Institute
II. Exporter Business Tips
Import Agents
Except for major importers with their own offices in Bulgaria, the appointment of an effective import
agent is an important decision. Invaluable background information can be provided by representatives
from the Foreign Agricultural Service (FAS) of the U.S. Department of Agriculture (USDA) office in
Sofia: http://bulgaria.usembassy.gov/fas.html, the U.S. Embassy, or representatives of commodity or
trade associations such as the American Chamber of Commerce in Bulgaria. See their website at
http://www.amcham.bg for a full list of U.S. Producer Association offices located in Bulgaria.
Although factors will vary from case to case, key issues to be considered include:
What is the extent of the agent’s network of distributors, owned or leased storage capacity, and
owned or leased transportation arrangements? In particular, does the agent have strong contacts
with the responsible purchasing officers in the target sales channels?
Does the agent have a high proportion of direct-to-market channels or are they heavily
dependent on multiple distribution levels?
Is the agent developing -value-added communications and promotions or are they dependent on
price discounts as major sales tool?
Does the agent have complementary product lines? Although cases vary, exclusivity can
provide better incentives to the agent and can help the exporter to maintain improved
supervision over price and product integrity.
Does the agent have connections to and networks on the other Balkan markets for future sales
expansion opportunities?
Entry Strategy
Bulgarian convenience store, supermarket, and hypermarket chains generally purchase from local
importers, wholesalers, and producers. However, the recent tendency is to increase the volume of direct
imports to avoid the higher cost of products purchased from importers or to eliminate the middleman.
The best method to reach Bulgarian retail buyers and prospective importers initially is to contact them
directly via e-mail or fax. Product catalogues and price lists are essential, and samples are very helpful.
The bigger retail players in Bulgaria are Kaufland, Lidl, Billa, Metro, Carrefour, Picadilly, CBA, and
Fantastico. U.S. suppliers can obtain useful information about them on their websites.
The chart below illustrates the modern trade profile in Bulgaria
A visit to Bulgaria is imperative in establishing meaningful relationships with Bulgarian buyers.
Personal relationships and face-to-face meetings are important. While visiting Bulgaria, it is advisable
to bring along product samples to meetings with potential buyers, as many importers and retailers rely
heavily on subjective factors when deciding on new products to represent.
The typical Bulgarian businessman usually has several interests rather than a single product line. As the
incomes of Bulgarian consumers increase, so does their desire for a variety of new products. In order to
meet the increasing demand and need for differentiation, importers constantly keep searching for new
products, including new-to-market products and new brands of certain products.
On the other hand, many importers follow the customary Bulgarian pattern of collecting basic
information (samples, catalogues, prices, supply schedules, etc.) initially for consideration. A trial order
to test the market response might then be placed after further contact. Importers generally specialize in
a certain product category, and often join with other importers to consolidate shipments for lower
overall risks and costs.
Sales and Marketing
Although sales and marketing techniques in Bulgaria are in a process of evolution and development,
there remains a high reliance on price discounts in promotional strategies. To minimize reliance on
discounting strategies, U.S. food and beverage suppliers, particularly those in the higher value added
categories, may benefit by focusing on market education and sales training to develop brand recognition
and consumer preference.
Consumer concerns for personal and family health means that foods and beverages believed to provide
specific health or nutritional benefits can and often do earn a retail premium above what the market
normally bears. Bulgarian consumers tend to be less concerned about cost when shopping for products
believed to provide health benefits and may alter purchasing habits in order to include these foods and
beverages in their diets. Bakery products, confectioneries, soups, oils and fats, and a wide range of
nutritional supplements are just a few examples of product categories for which marketing strategies
based on nutritional and health messages have proven to be highly successful. Consumers in Bulgaria
are often bombarded by sensational news about food safety which is causing increased concern and
skepticism. This may provide opportunities for U.S. companies to promote brand value through an
emphasis on natural products and food safety benefits.
Bulgarian Business Customs
Bulgarian businessmen are often refreshingly direct and informal in their business approach and do not
have strict business rituals found in other countries. However, there are some local customs that are
well worth observing. Greetings and gifts to mark major feasts such as Christmas, New Year’s Day, and
Orthodox Easter are common. These holidays are key sales periods, similar to Thanksgiving and
Christmas in the United States. American companies should consider advanced timing of introducing
new products to coincide with these busy holiday gift giving seasons. For example, baking companies
will purchase ingredients as early as February or March for Easter cake sales during the Easter holiday
period, which falls around April or May, depending on the Orthodox calendar.
Although agents and purchasing managers are always searching for new products, they are also very
thorough in their evaluations of products. They prefer to see product samples whenever possible and
will often place small trial shipments to test the market response.
One of the most popular leisure time activities in Bulgaria involves eating and drinking. Even first
meetings may often be over lunch or dinner. In Bulgaria, with food and drink entertainment is not only
a basic tool to influence business relationships, but also considered essential to building friendships that
can enhance mutual understanding. Eating and drinking are important parts of Bulgarian culture and
every type of local cuisine is available on the market. More and more different ethnic foods are
becoming popular every day, but Bulgarian cuisine is generally preferred. Local businessmen are
always very gracious and will invite trade contacts to dinner and drinking toasts can usually be
expected, although the high alcohol “rakia” (grape brandy) is reserved for special occasions. However,
it is more and more common to drink red wine with meals and a light amount of toasting each other is
important in developing trust and long-term relationships. The most popular toast in Bulgaria is
“Nazdrave!” and corresponds to the English “Cheers!”. When congratulated with “Nazdrave!” one is
supposed just to taste one’s drink, and not to empty his glass on single gulp.
Language Barrier
Speaking Bulgarian is not essential in order to do business in the country. Many people speak English,
and translators are not hard to find. However, written materials such as company presentations, product
brochures etc. will be far more helpful if translated into Bulgarian.
Many Bulgarians strive to send their children to the finest universities in the United States and Western
Europe. Therefore, a large percentage of Bulgarian residents speak good English, mostly the youth,
who attend English lessons and obtain different language certificates. The American University in
Bulgaria (AUBG) provides very good scientific knowledge and practical skills to its students, who
often progress successfully through their careers. Many foreign investors prefer AUBG graduates for
business contacts.
Food Standards and Regulations
Bulgarian food standards and regulations are harmonized with those of the EU. Phytosanitary and vet
control is applied to imported and exported goods with plant and animal origin. Legislation is
harmonized with the EU concerning the food safety and marketing standards. For each stage of the food
chain from the plant and animal products to the final customer there are EU harmonized requirements
for working conditions and hygiene. The local food industry has introduced the HACCP system as well
in a number of facilities.
U.S. companies are advised to observe strict product labeling requirements, which require that any
health or nutritional claim be first assessed and approved by the Bulgarian Food Safety Agency and
Ministry of Agriculture and food and then added to the prescriptions on product package. The label
must also be translated into Bulgarian. It should contain the type of product, its name, the names of the
manufacturer and importer, the full content of the product, shelf life and others. The country introduced
some specific requirements for labeling of certain products. For example, if a dairy product contains
vegetable oil its label may not contain the word "dairy product" and must be labeled indicating
"Imitation Product Containing Milk". Additionally, cheese containing vegetable oils cannot be offered
as cheese, but should be indicated as product containing vegetable oil. In shops, mandatory coloring of
the labels was introduced – labels of dairy products containing vegetable oils must be white.
For more information on labeling requirements and food standards, especially for recently imposed
requirements for organic food products, please refer to the Foreign Agricultural Service (FAS) of the
U.S. Department of Agriculture (USDA) U.S. Embassy Sofia.
Additional information can be found on the web pages of the European Food Safety Agency (EFSA) or
the Bulgarian Food Safety Agency (BFSA).
III. Market Sector Structure and Trends
Food Imports
Agriculture makes up 5.2% of Bulgaria’s GDP. Land in Bulgaria is most commonly measured by the
unit Decare (daa), as 10 daa = 1 Hectare. Domestically, Bulgaria produces wheat, barley, corn,
sunflower, tobacco, rapeseed, fresh vegetables, fruits, and grapes. Bulgaria exports cereals, tobacco and
oil seeds and imports meat, vegetables, fruits, sugar, fish and coffee. Bulgaria is a relatively small
market for U.S. agricultural exports. The agricultural trade balance with the world in 2014 is $1.63
billion, as compared to $2.11 billion in 2013, which represents a decrease of 22.7%.
Imports from the United States: According to the BICO U.S. Census Bureau Trade Data the U.S. food
products exports to Bulgaria amounted for almost $44 million in 2014, which represents an increase of
16% as compared to 2013. The share of U.S. consumer-oriented agricultural foods exports are
estimated at $14.8 million (up 14.7%), exports of bulk commodities are at about $9.6 million (down
12.3%), ag related products at $8.7 million (up 3.6%), and intermediate products are at $10.7 million
(more than 100% increase). (Source: BICO U.S. Census Bureau Trade Data; Intrastat data not
included). This data indicates that stable trade relations between the two countries are continuously
developing and market demand for U.S. agricultural exports is increasing. According to the Intrastat
report from the Bulgarian National Statistical Institute the U.S. exports volumes to Bulgaria are much
higher than the reported in the BICO database, topping at nearly $70 million in 2014, which represents
almost a 60% difference.
Bulgaria’s admission to the EU reflected negatively on fruit product imports from the U.S.A. Import
duties are levied on the U.S. products, unlike the duty-free EU products, meaning that the U.S.
exporters are at a cost disadvantage in comparison with the EU companies. However, imports of some
products are duty-free for EU non-member states which allows the U.S. to export them successfully to
Bulgaria. Since 1997 U.S. poultry meat effectively has been prohibited from entering the European
Union (and Bulgaria) due to the U.S. use of pathogen reduction treatments (PRTs), which are approved
by the U.S. federal government and are routinely applied in U.S. poultry plants for added hygienic
insurance.
Food Processing Sector
The food industry in Bulgaria accounts for 14% of the country’s industrial production. The following
products have good sales potential on the Bulgarian market: distilled spirits, tree nuts dried fruits, wine,
snack/cereal foods, seafood products, pulses, beef, prepared food, and soft drinks/juices.
Prior to CY 2014 there was a visible shift in trade and consumption trends within certain product groups
toward more expensive, higher-quality products, including distilled spirits, snack foods, tree nuts,
seafood, and soft drinks. The trend has remained stable despite Europe’s economic and financial
turmoil. U.S. agricultural exports to Bulgaria in several product categories, such as distilled spirits, tree
nuts and dried fruits, pulses, and peanuts, reached record high levels after stable increases the past few
years. It is expected that the volume of the exports of these and other products will remain stable in
2015 despite the appreciation of the U.S. Dollar against the Euro in the last months.
The food production sector accounts for about 14% of total industrial production in the country,
contributing about 14% of total value added in industry. The sector provides employment to 80,400
people (15% of all employees in manufacturing). In 2014 the Bulgarian food industry was valued at
about $4.8 billion, $4.2 billion of which was the share of the domestic market, with the remainder
exported. In 2014 there was a slight increase in producers’ prices of about 3%.
For more comprehensive information about the Bulgarian food processing sector, please refer to FAS
Sofia’s latest Food Processing Ingredients report.
Food Retail Sector
Currently the number of modern grocery outlets in Bulgaria stands at nearly 3,900, which represents
about 11% of total grocery retail outlets. The leading top 50 retailers currently hold a combined market
share of 46% which is likely to reach 55% in 2016. The remaining 54% is held by almost 31,000
traditional grocery stores throughout the country. A prerequisite for this is the concentration of
population in large cities. Retail chains in Bulgaria are constantly expanding their networks, and are
among the largest investors in the country.
Table 1. Top 10 Retailers and Number of Outlets

According to the Bulgarian Association for Modern Trade (BAMT), in 2013 the retail market was
estimated at 10.3 billion leva (U.S. $7.47 billion) and at 10.15 billion leva in 2014.
For more comprehensive information about the Bulgarian retail market, please refer to FAS Sofia’s
latest Retail Market Update report.
HRI Food Service Sector
The Hospitality, Restaurant, and Institutional food (HRI) sector in Bulgaria is a relatively new industry
which emerged after the privatization and market reforms in the mid-1990s that developed after 2000.
This is still a young industry with no long professional traditions, especially in the area of high value
services. The sector developed dynamically in the period 2007-2012 in parallel with the economic
growth of that period. The development of tourism and of shopping malls considerably contributed to
the growth.
Bulgaria has 35,776 HRI outlets. The industry employs 137,000 people with a turnover of 3.6 billion
leva (U.S. $2.12 billion) in 2014 (source: Euromonitor). Since 2000, the number of outlets grew by 20%
starting from 29,700. Higher purchasing generated growth and expansion in the industry for the period
2000-2008. The number of outlets is the highest in the South West part of the country, followed by the
South East and South Central regions.
The diagram below indicates product flow in the HRI sector for the U.S. exporters.
For more comprehensive information about the Bulgarian Hospitality, Restaurant, and Institutional food
service industry, please refer to FAS Sofia’s latest HRI report here.
Organic Foods Sector
Since Bulgaria’s accession to the EU in 2007, the interest in organic farming has grown considerably.
The driver behind this interest is improved export demand, mainly to the EU market, as well as good
production subsidies, and favorable governmental policy. However, as of today, the land under organic
farming is 0.8% of all utilized agricultural land and organic food sales are below 1.0% of total food
sales due to the low purchasing power of local consumers. Over 90% of local organic products are
exported while over 80% of organic products on the market come from imports. Despite the numerous
challenges, the prospects for organic farming are good, especially if the local market for organic
foods develops and stimulates sustainable consumer demand.
More information about the organic food sector in Bulgaria can be found in the Organic Food Market
and Organic Sector Update GAIN report issued by FAS Sofia.
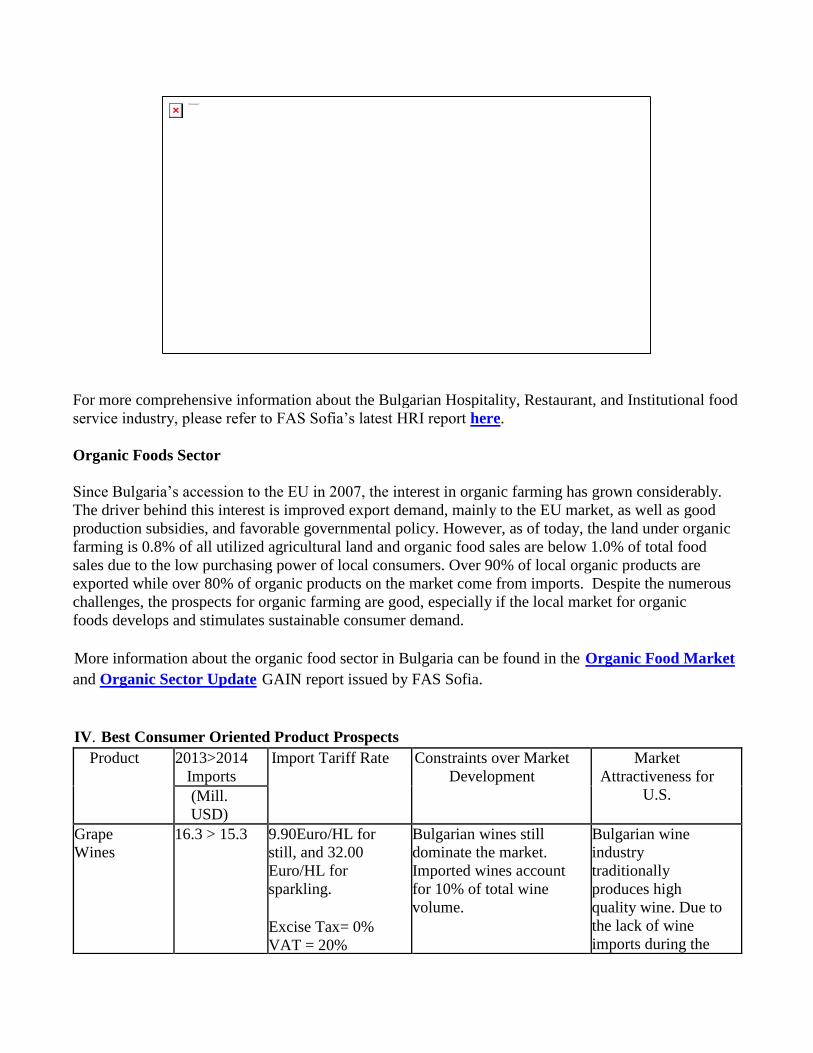
IV. Best Consumer Oriented Product Prospects
Product 2013>2014
Imports Import Tariff Rate Constraints over Market
Development Market
Attractiveness for
U.S. (Mill.
USD)
Grape
Wines 16.3 > 15.3 9.90Euro/HL for
still, and 32.00
Euro/HL for
sparkling.
Excise Tax= 0% VAT = 20%
Bulgarian wines still
dominate the market.
Imported wines account
for 10% of total wine
volume.
Bulgarian wine
industry
traditionally
produces high
quality wine. Due to
the lack of wine
imports during the
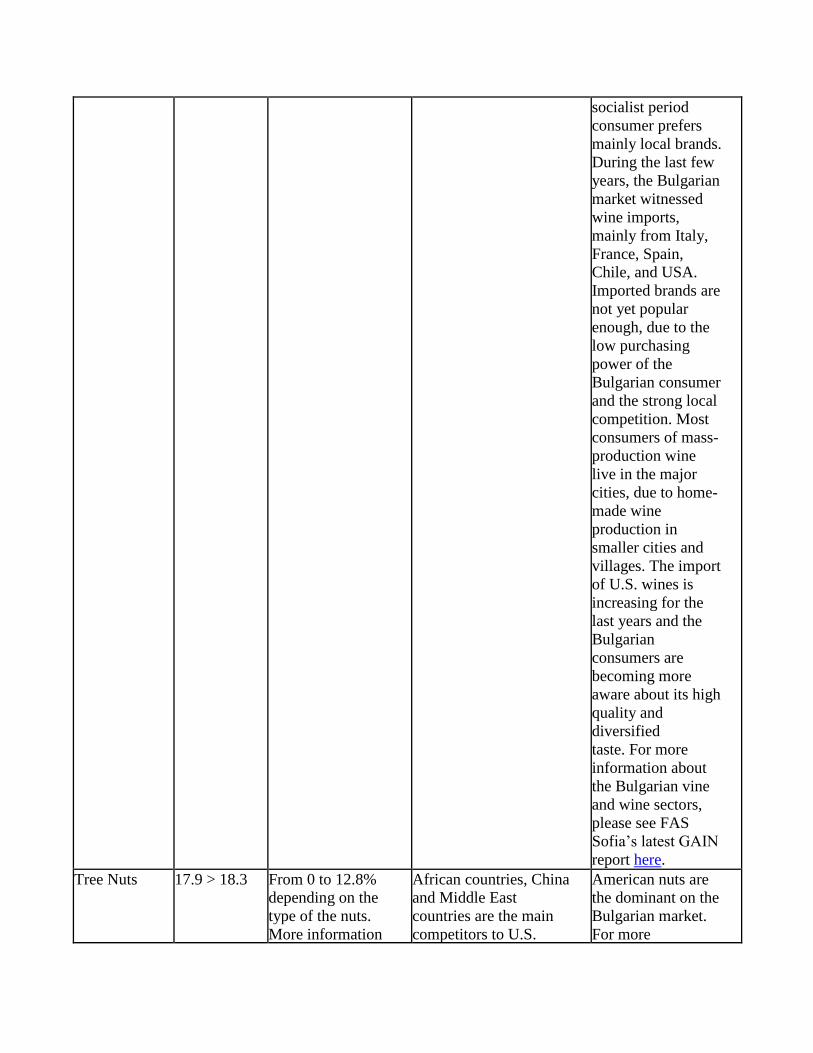
socialist period
consumer prefers
mainly local brands.
During the last few
years, the Bulgarian
market witnessed
wine imports,
mainly from Italy,
France, Spain,
Chile, and USA.
Imported brands are
not yet popular
enough, due to the
low purchasing
power of the
Bulgarian consumer
and the strong local
competition. Most
consumers of mass-
production wine
live in the major
cities, due to home-
made wine
production in
smaller cities and
villages. The import
of U.S. wines is
increasing for the
last years and the
Bulgarian
consumers are
becoming more
aware about its high
quality and
diversified
taste. For more
information about
the Bulgarian vine
and wine sectors,
please see FAS
Sofia’s latest GAIN
report here.
Tree Nuts 17.9 > 18.3 From 0 to 12.8%
depending on the
type of the nuts.
More information
African countries, China
and Middle East
countries are the main
competitors to U.S.
American nuts are
the dominant on the
Bulgarian market.
For more
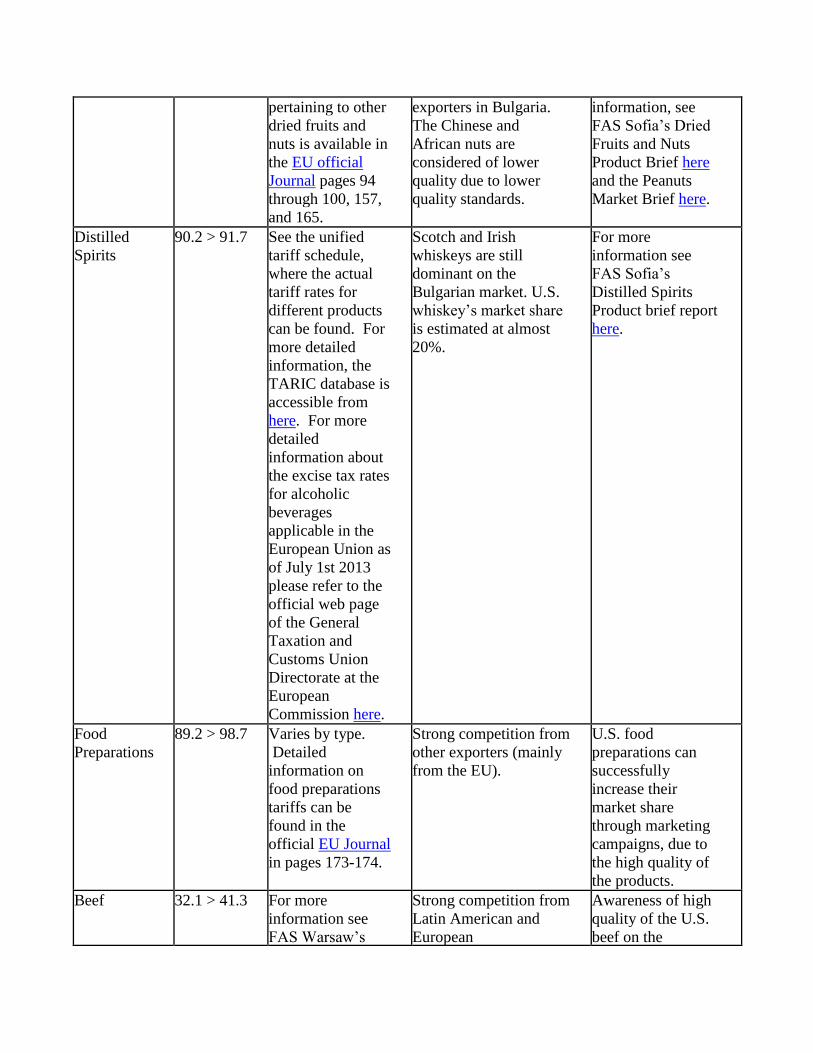
pertaining to other
dried fruits and
nuts is available in
the EU official
Journal pages 94
through 100, 157,
and 165.
exporters in Bulgaria.
The Chinese and
African nuts are
considered of lower
quality due to lower
quality standards.
information, see
FAS Sofia’s Dried
Fruits and Nuts
Product Brief here
and the Peanuts
Market Brief here.
Distilled
Spirits 90.2 > 91.7 See the unified
tariff schedule,
where the actual
tariff rates for
different products
can be found. For
more detailed
information, the
TARIC database is
accessible from
here. For more
detailed
information about
the excise tax rates
for alcoholic
beverages
applicable in the
European Union as
of July 1st 2013
please refer to the
official web page
of the General
Taxation and
Customs Union
Directorate at the
European
Commission here.
Scotch and Irish
whiskeys are still
dominant on the
Bulgarian market. U.S.
whiskey’s market share
is estimated at almost
20%.
For more
information see
FAS Sofia’s
Distilled Spirits
Product brief report
here.
Food
Preparations 89.2 > 98.7 Varies by type.
Detailed
information on
food preparations
tariffs can be
found in the
official EU Journal
in pages 173-174.
Strong competition from
other exporters (mainly
from the EU).
U.S. food
preparations can
successfully
increase their
market share
through marketing
campaigns, due to
the high quality of
the products.
Beef 32.1 > 41.3 For more
information see
FAS Warsaw’s
Strong competition from
Latin American and
European
Awareness of high
quality of the U.S.
beef on the
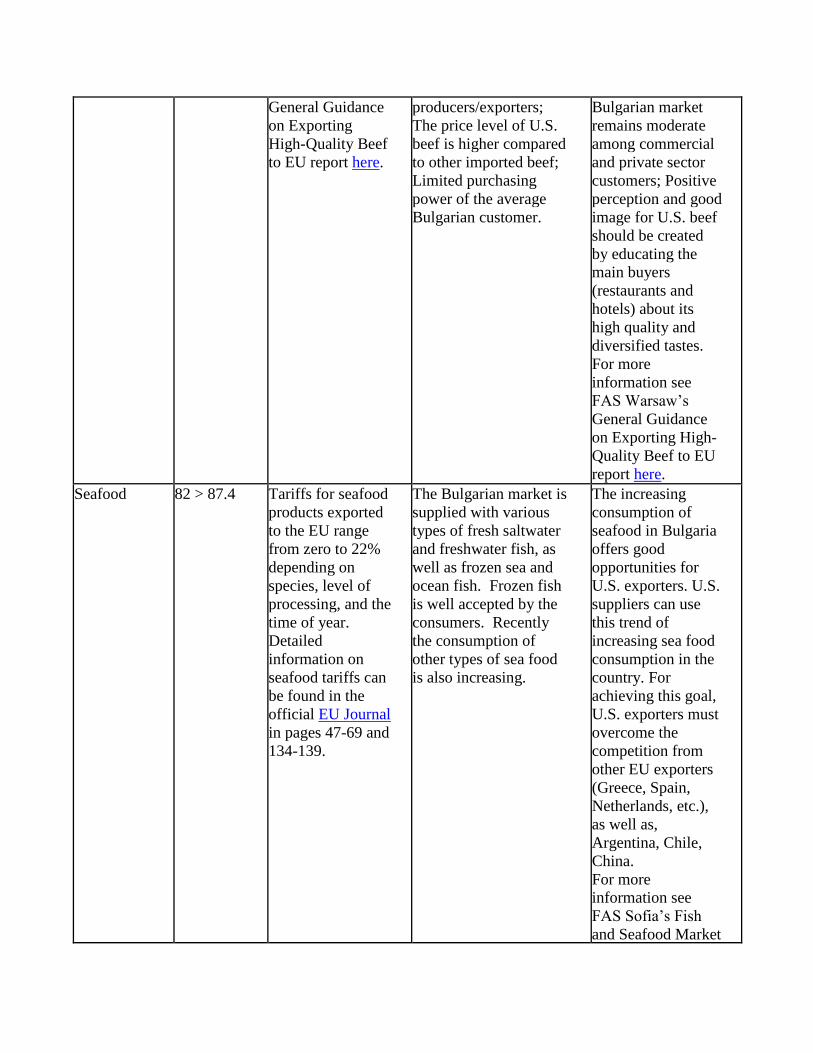
General Guidance
on Exporting
High-Quality Beef
to EU report here.
producers/exporters;
The price level of U.S.
beef is higher compared
to other imported beef;
Limited purchasing
power of the average
Bulgarian customer.
Bulgarian market
remains moderate
among commercial
and private sector
customers; Positive
perception and good
image for U.S. beef
should be created
by educating the
main buyers
(restaurants and
hotels) about its
high quality and
diversified tastes. For more
information see
FAS Warsaw’s
General Guidance
on Exporting High-
Quality Beef to EU
report here.
Seafood 82 > 87.4 Tariffs for seafood
products exported
to the EU range
from zero to 22%
depending on
species, level of
processing, and the
time of year.
Detailed
information on
seafood tariffs can
be found in the
official EU Journal
in pages 47-69 and
134-139.
The Bulgarian market is
supplied with various
types of fresh saltwater
and freshwater fish, as
well as frozen sea and
ocean fish. Frozen fish
is well accepted by the
consumers. Recently
the consumption of
other types of sea food
is also increasing.
The increasing
consumption of
seafood in Bulgaria
offers good
opportunities for
U.S. exporters. U.S.
suppliers can use
this trend of
increasing sea food
consumption in the
country. For
achieving this goal,
U.S. exporters must
overcome the
competition from
other EU exporters
(Greece, Spain,
Netherlands, etc.),
as well as,
Argentina, Chile,
China. For more
information see
FAS Sofia’s Fish
and Seafood Market
Brief report here.
Source: Global Trade Atlas; FAS Sofia researches; National Statistical Institute
V. Key Contacts and Further Information
American Institutions in Bulgaria
Foreign Agricultural Service (FAS) of the U.S. Department of Agriculture (USDA)
U.S. Embassy
16 Kozyak Str., Sofia 1408, Bulgaria
Tel: (359) 2-939-5774 Fax: (359) 2-939-5744
E-mail: [email protected] Website: http://bulgaria.usembassy.gov/fas.html
United States Department of Agriculture, Foreign Agricultural Services
U.S. Department of Agriculture, Washington, D.C. 20250
E-mail: [email protected] Website: http://www.fas.usda.gov
Bulgarian Central Authority Agencies
Ministry of Agriculture and Food
Blvd. Hristo Botev 55 Sofia 1040 Bulgaria
Tel: (359) 2-985-11858; Fax: (359) 2-981-7955
Website: http://www.mzh.government.bg
Ministry of Health
Sqr. Sveta Nedelya 5, Sofia 1000, Bulgaria
Tel: (359) 2-981-0111
E-mail: [email protected] Website: http://mh.government.bg
Direction Public Health
Tel: (359) 2-9301-252
E-mail: [email protected]
Bulgarian Food Safety Agency
Bul. Pencho Slaveikov 15A, Sofia 1606, Bulgaria
Tel: (359) 2-915-98-20 Fax: (359) 2-954-9593
E-mail: [email protected]
Website: http://www.babh.government.bg/en/
Bulgaria Customs Agency, Ministry of Finance
Str. Rakovski 47, Sofia 1202, Bulgaria
Tel: (359) 2-9594-210 Fax: (359) 2-9859-4528
E-mail : [email protected] Website : http://customs.bg
Ministry of Economy, Energy and tourism
Str. Slavyanska 8, Sofia 1000, Bulgaria
Tel: (359) 2-940-71 Fax: (359) 2-987-2190
E-mail : [email protected] Website: http://www.mi.government.bg
Major Bulgarian Trade Associations
American Chamber of Commerce in Bulgaria
Business Park Sofia, bld. 2, fl. 6. Sofia 1766 Bulgaria
Tel: (359) 2-9742 Fax: (359) 2-9742-741
E-mail: [email protected] Website: http://www.amcham.bg
Bulgarian Chamber of Commerce and Industry
Str. Iskar 9, Sofia 1058 Bulgaria
Tel: (359) 2-811-740 Fax: (359) 2-987-3209
E-mail: [email protected] Website: http://www.bcci.bg
Bulgarian Industrial Association
Str. Alabin 16-20, Sofia 1000 Bulgaria
Tel: (359) 2-932-0911 Fax: (359) 2-987-2604
E-mail: [email protected] Website: http://www.bia-bg.bg
Association of Producers, Importers and Traders of Spirits
NDK Prono fl. 15 offices 8&9, Sofia 1414 Bulgaria
Tel: (359) 2-963-1254 Fax: (359) 2-963-1254
E-mail: [email protected] Website: http://www.apitsd.bg
Bulgarian Association of Dairy Processors
Zh.K. Lagera bl. 44 vh. A Sofia 1612 Bulgaria
Tel: (359) 2-953-2723 Fax: (359) 2-952-3265
E-mail: [email protected] Website: http://www.milkbg.org
Association of Meat Processors in Bulgaria
Shipchenski Prohod Blvd. 240 ent. A floor 3, Sofia Bulgaria
Address for correspondence Post Box 61 AMB Sofia 1111 Bulgaria
Tel: (359) 2-971-2671 Fax: (359) 2-973-3069
E-mail: [email protected] Website: http://www.amb.amb99.com
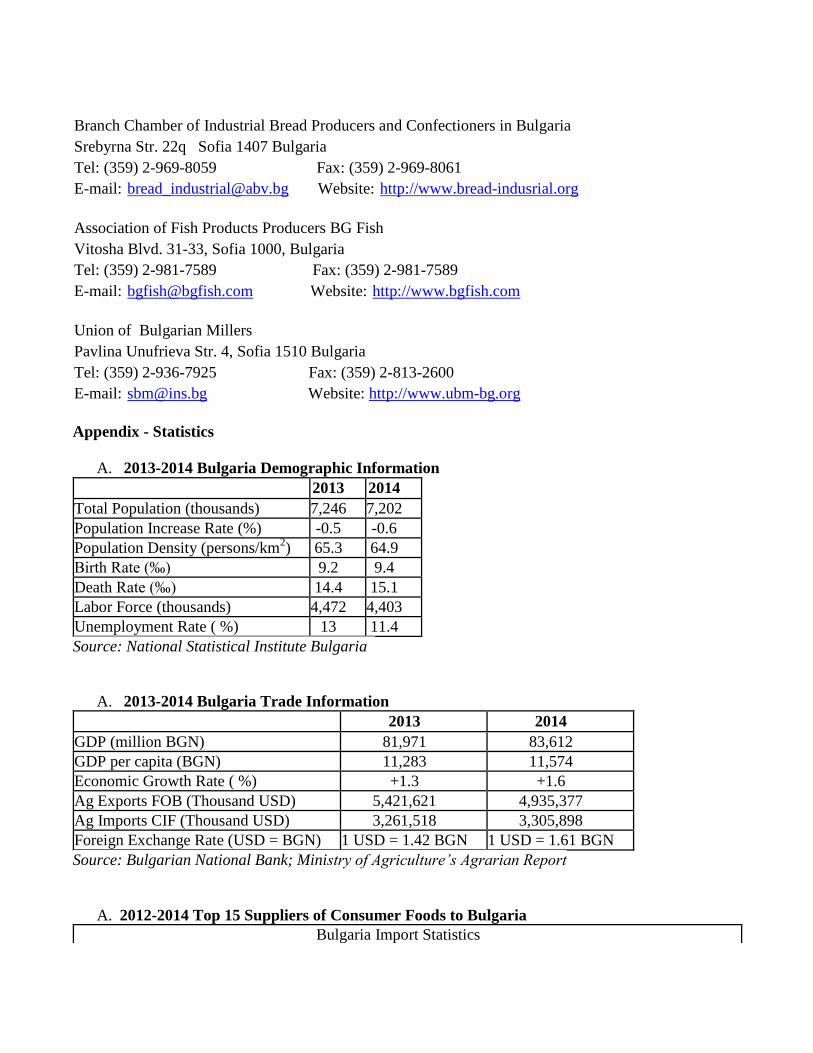
Branch Chamber of Industrial Bread Producers and Confectioners in Bulgaria
Srebyrna Str. 22q Sofia 1407 Bulgaria
Tel: (359) 2-969-8059 Fax: (359) 2-969-8061
E-mail: [email protected] Website: http://www.bread-indusrial.org
Association of Fish Products Producers BG Fish
Vitosha Blvd. 31-33, Sofia 1000, Bulgaria
Tel: (359) 2-981-7589 Fax: (359) 2-981-7589
E-mail: [email protected] Website: http://www.bgfish.com
Union of Bulgarian Millers
Pavlina Unufrieva Str. 4, Sofia 1510 Bulgaria
Tel: (359) 2-936-7925 Fax: (359) 2-813-2600
E-mail: [email protected] Website: http://www.ubm-bg.org
Appendix - Statistics
A. 2013-2014 Bulgaria Demographic Information
2013 2014
Total Population (thousands) 7,246 7,202
Population Increase Rate (%) -0.5 -0.6
Population Density (persons/km2) 65.3 64.9
Birth Rate (‰) 9.2 9.4
Death Rate (‰) 14.4 15.1
Labor Force (thousands) 4,472 4,403
Unemployment Rate ( %) 13 11.4
Source: National Statistical Institute Bulgaria
A. 2013-2014 Bulgaria Trade Information
2013 2014
GDP (million BGN) 81,971 83,612
GDP per capita (BGN) 11,283 11,574
Economic Growth Rate ( %) +1.3 +1.6
Ag Exports FOB (Thousand USD) 5,421,621 4,935,377
Ag Imports CIF (Thousand USD) 3,261,518 3,305,898
Foreign Exchange Rate (USD = BGN) 1 USD = 1.42 BGN 1 USD = 1.61 BGN
Source: Bulgarian National Bank; Ministry of Agriculture’s Agrarian Report
A. 2012-2014 Top 15 Suppliers of Consumer Foods to Bulgaria
Bulgaria Import Statistics
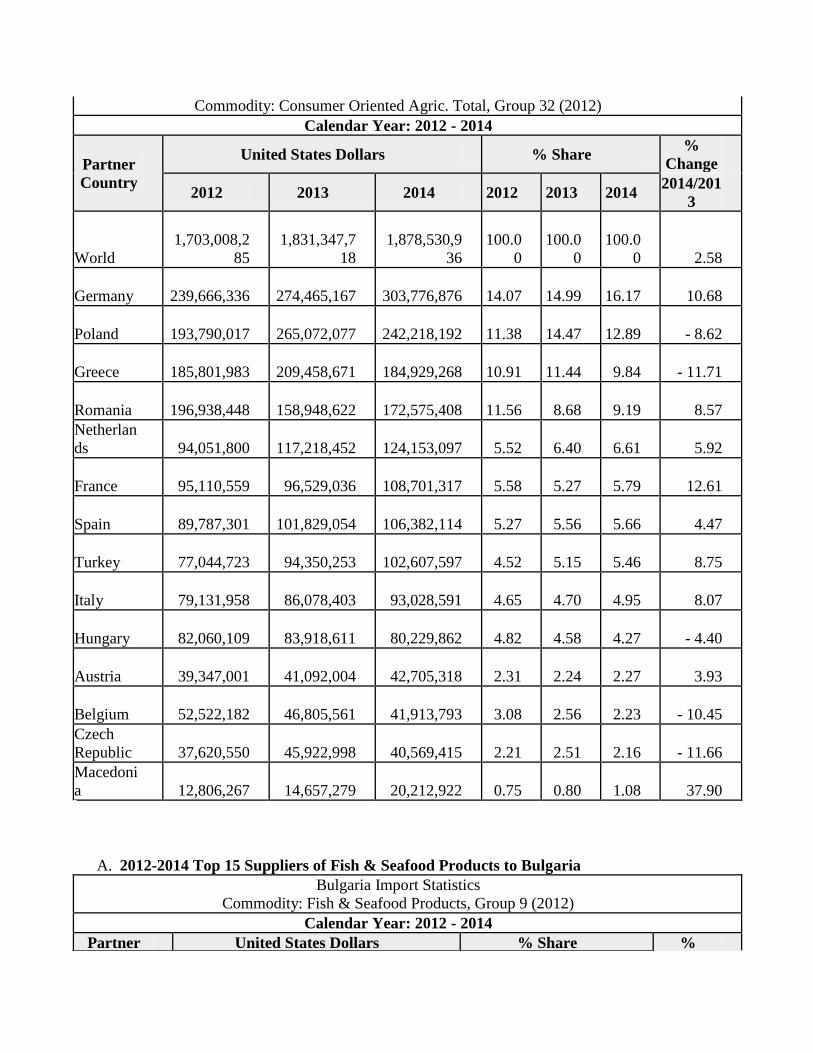
Commodity: Consumer Oriented Agric. Total, Group 32 (2012)
Calendar Year: 2012 - 2014
Partner
Country
United States Dollars % Share %
Change
2012 2013 2014 2012 2013 2014 2014/201
3
World 1,703,008,2
85 1,831,347,7
18 1,878,530,9
36
100.0
0
100.0
0
100.0
0 2.58
Germany
239,666,336
274,465,167
303,776,876
14.07
14.99
16.17 10.68
Poland
193,790,017
265,072,077
242,218,192
11.38
14.47
12.89 - 8.62
Greece
185,801,983
209,458,671
184,929,268
10.91
11.44 9.84 - 11.71
Romania
196,938,448
158,948,622
172,575,408
11.56 8.68 9.19 8.57
Netherlan
ds
94,051,800
117,218,452
124,153,097 5.52 6.40 6.61 5.92
France
95,110,559
96,529,036
108,701,317 5.58 5.27 5.79 12.61
Spain
89,787,301
101,829,054
106,382,114 5.27 5.56 5.66 4.47
Turkey
77,044,723
94,350,253
102,607,597 4.52 5.15 5.46 8.75
Italy
79,131,958
86,078,403
93,028,591 4.65 4.70 4.95 8.07
Hungary
82,060,109
83,918,611
80,229,862 4.82 4.58 4.27 - 4.40
Austria
39,347,001
41,092,004
42,705,318 2.31 2.24 2.27 3.93
Belgium
52,522,182
46,805,561
41,913,793 3.08 2.56 2.23 - 10.45
Czech
Republic
37,620,550
45,922,998
40,569,415 2.21 2.51 2.16 - 11.66
Macedoni
a
12,806,267
14,657,279
20,212,922 0.75 0.80 1.08 37.90
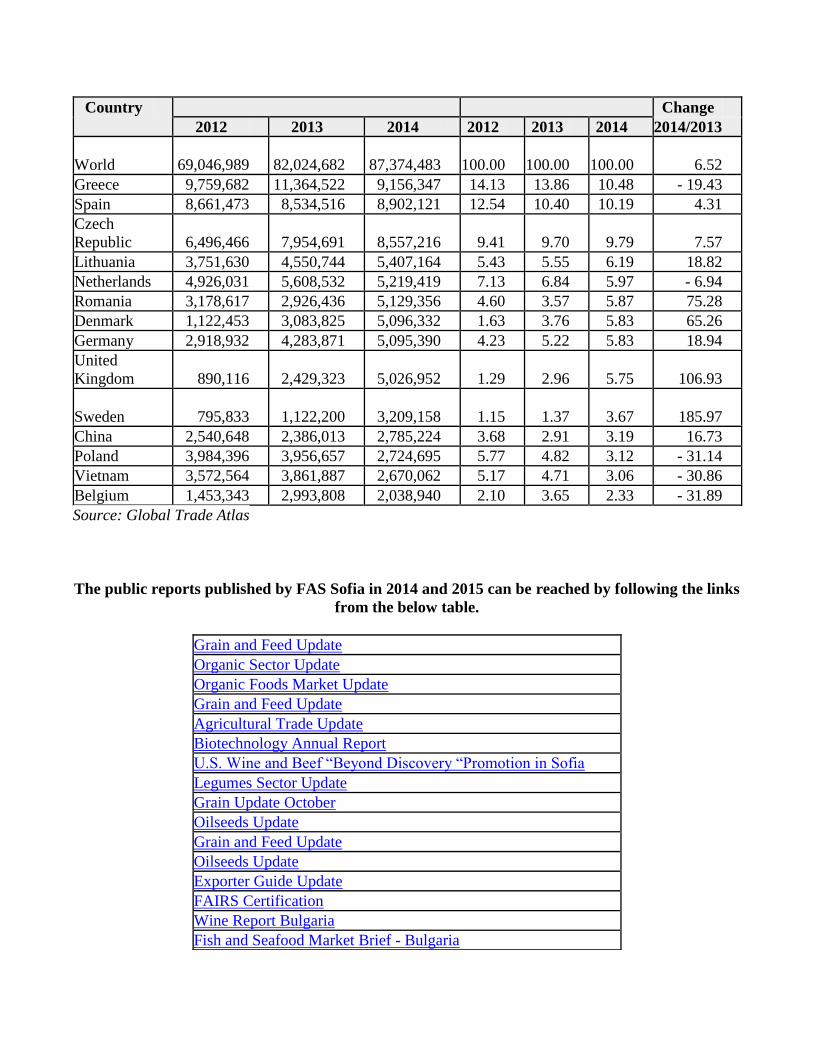
A. 2012-2014 Top 15 Suppliers of Fish & Seafood Products to Bulgaria
Bulgaria Import Statistics Commodity: Fish & Seafood Products, Group 9 (2012)
Calendar Year: 2012 - 2014
Partner United States Dollars % Share %
Country Change
2012 2013 2014 2012 2013 2014 2014/2013
World 69,046,989 82,024,682 87,374,483
100.00
100.00
100.00 6.52
Greece 9,759,682 11,364,522 9,156,347 14.13 13.86 10.48 - 19.43
Spain 8,661,473 8,534,516 8,902,121 12.54 10.40 10.19 4.31
Czech
Republic 6,496,466 7,954,691 8,557,216 9.41 9.70 9.79 7.57
Lithuania 3,751,630 4,550,744 5,407,164 5.43 5.55 6.19 18.82
Netherlands 4,926,031 5,608,532 5,219,419 7.13 6.84 5.97 - 6.94
Romania 3,178,617 2,926,436 5,129,356 4.60 3.57 5.87 75.28
Denmark 1,122,453 3,083,825 5,096,332 1.63 3.76 5.83 65.26
Germany 2,918,932 4,283,871 5,095,390 4.23 5.22 5.83 18.94
United
Kingdom
890,116 2,429,323 5,026,952 1.29 2.96 5.75 106.93
Sweden
795,833 1,122,200 3,209,158 1.15 1.37 3.67 185.97
China 2,540,648 2,386,013 2,785,224 3.68 2.91 3.19 16.73
Poland 3,984,396 3,956,657 2,724,695 5.77 4.82 3.12 - 31.14
Vietnam 3,572,564 3,861,887 2,670,062 5.17 4.71 3.06 - 30.86
Belgium 1,453,343 2,993,808 2,038,940 2.10 3.65 2.33 - 31.89
Source: Global Trade Atlas
The public reports published by FAS Sofia in 2014 and 2015 can be reached by following the links
from the below table.
Grain and Feed Update
Organic Sector Update
Organic Foods Market Update
Grain and Feed Update
Agricultural Trade Update
Biotechnology Annual Report
U.S. Wine and Beef “Beyond Discovery “Promotion in Sofia
Legumes Sector Update
Grain Update October
Oilseeds Update
Grain and Feed Update
Oilseeds Update
Exporter Guide Update
FAIRS Certification
Wine Report Bulgaria
Fish and Seafood Market Brief - Bulgaria
Oilseeds Update
Grain and Feed Update
Wine Sector Update
Fresh Deciduous Fruit Sector Update
Retail Market Update
Food Safety Agency Change
Dairy Generics Market Update
Tree Nuts Market Update
Sunflower Market Diversifaction
Popcorn Market Update
Biotechnology Annual
Food Processing Ingredients Bulgaria
Stone Fruit Annual
Biofuels
Poultry Sector Update
Red Meat Sector Update
Spirits of America Promotion
Grain and Feed Update
Oilseeds and Products Update
Looming Public Health Tax Threatens Food Trade
New Regulation about Food Destined for Children Iinstitutions
FAS Sofia Assists to Promote U.S. Whiskey
Hotel, Restaurant, and Institutional Food Service (HRI)
End of Report
Author Defined: