building science ii
TRANSCRIPT

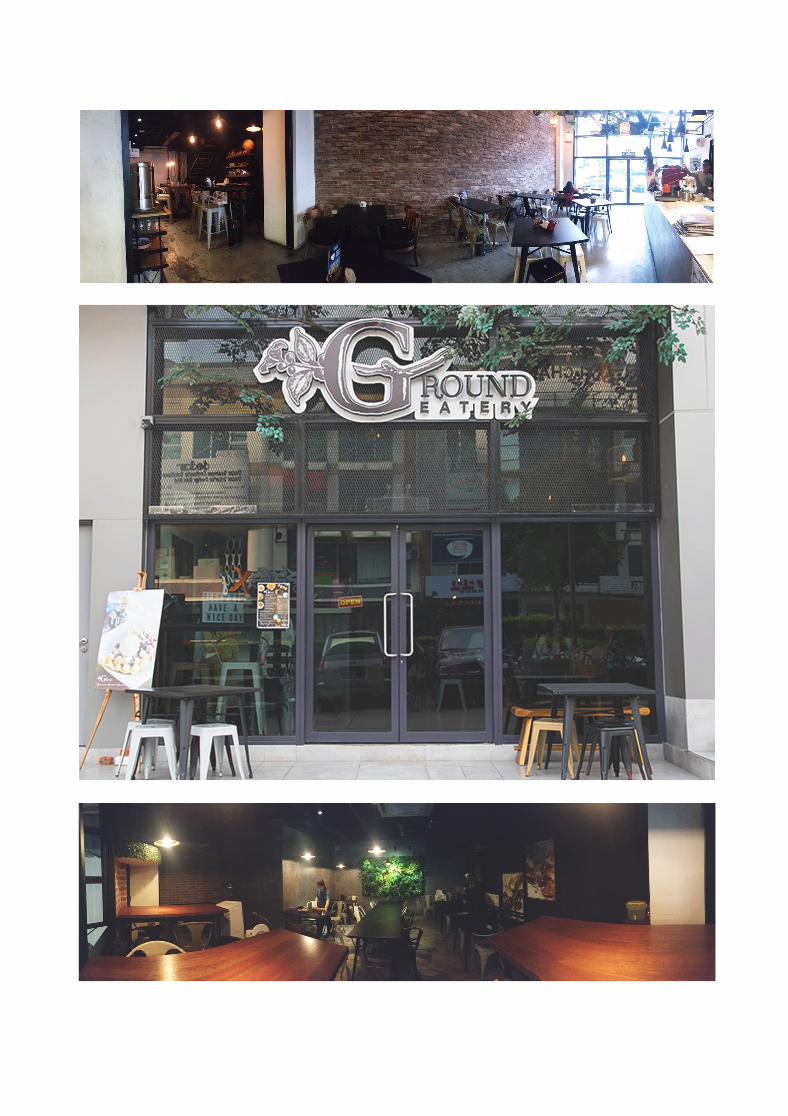

Table of Contents
1.0 Introduction
1.1 Abstract 1
1.2 Aims and Objectives 2
1.3 Reason of Choice 3
1.4 Methodology 4
2.0 Lighting Study 5
2.1 Introduction to Lighting 6
2.2 Lighting Precedent Studies 7 – 12
2.3 Ground Eatery Lighting 13
2.4 Zone A Data Collection and Analysis 21 – 28
2.5 Zone B Data Collection and Analysis 29 – 35
2.6 Zone C Data Collection and Analysis 36 - 43
2.7 Zone D Data Collection and Analysis 44 - 50
2.8 Zone E Data Collection and Analysis 51 - 56
3.0 Acoustic Study 57
3.1 Introduction to Acoustics 58
3.2 Acoustic Precedent Studies 59 – 65
3.3 Ground Eatery Acoustics 66 – 72
3.4 Reverberation Time 73
3.4.1 Zone 1 74 – 80
3.4.2 Zone 2 81 - 85
3.4.3 Zone 3 86 - 91
3.5 Sound Pressure Level 92
3.5.1 Zone 1 92 - 93
3.5.2 Zone 2 94 - 95
3.5.3 Zone 3 96 - 97
3.6 Sound Transmission Loss 98
3.6.1 Zone 1 99
3.6.2 Zone 2 100
3.6.3 Zone 3 101
4.0 Reference 102


1.0 Introduction
1.1 Abstract
Lighting Design is a primary element in architecture design and interior architecture. Most of the successful
buildings are have good lighting design to enhance the poetic feeling and ambiance. For example, church
of light design by Tadao Ando who manipulate light to create the feeling he want to present to user.
Therefore, lighting design is an important role to make a place even better.
Acoustic Design is an element which concerned with control of sound in spaces especially enclosed
spaces. The requirement of acoustic design based on the functional spaces whether it is a cinema, lecture
theatre, restaurant and cafe. Different function of place need different acoustical requirement. A good
acoustic design eliminates the noise and undesired sound to provide a better environment to the user. For
example, Massry Art Center, the ceiling and wall is made of curved wood this is to provide better the
acoustic experience.
In a group of five, we have chosen the Ground Eatery Cafe as our case study. This report contains of our
observation, data collection and analysis of lighting and acoustic performance of Ground Eatery Cafe.
1

1.2 Aims and Objectives
The aim and the objective are as following:
-To understand the lighting and acoustic characteristics within a place.
-To critically report and analyse the lighting and acoustic of the space.
-To suggest another way to improve the lighting and acoustic qualities of that place.
-To able produce a complete documentation on analysis of lighting and acoustic of the place.
This project aims to helps us have a basic understanding of lighting and acoustic design within a place. To
have a better understanding and analysis about the how lighting and acoustic design influence the specific
space and the user experience of that place. In next assignment, these knowledge will help us to get a
better lighting and acoustic design for our design studio project.
2

1.3 Reason of Choice
Located in tower 4 & 5 PFCC, Jalan Puteri 1/2 Puchong New Village, Selangor, Malaysia. This cafe
sometimes is used to hold small events and function such as the company gathering. This café is
interesting because it have its own design concept. We choose this building as a place to study is because
the location that is strategic, and has a lot of potential in term of our studies. It’s located right beside the
road, the natural light would play an important role in this café during day but how the street light influence
this café. We want to study the glass curtain wall of the café how to influence luminous in this café. How the
manipulate the lighting in term to separate the atmosphere in different area. How the use materials they
use to create ambiance in certain area and how to reduce the sound come from the bar area. Therefore,
we decided to study this building for our lighting and acoustic assignment.
3

1.4 Methodology
Sequence of working
1.Precedent studies
Select a precedent study on lighting and acoustic that similar to our case study that we choose.
Study and analyze the criteria of lighting and acoustic design how influence the ambiance and environment.
Evaluate the lighting and acoustic design on the case study based on the precedent study.
2. Site Visit
Emails and call the chosen places and select a date go to site visit. Bring paper, Lux meter and sound
meter go to site and drafted the basic plan of site based on the measurement. This is because the owner
can’t provide the proper digital drawing to us.
3. Data Collection
Using the Lux meter and sound meter that we borrowed from the lecturer to collect the lighting and acoustic
data. The lighting analysis reading is recorded at two different position 1 meter and 1.5meter height. The
acoustic level reading were recorded using a sound meter. All reading collected according to the gridline.
4. Preparation of drawing
Using the AutoCAD to produce a proper plan with gridline of 1.5m x 1.5m to fill in all the data that we
collected.
5. Tabulation of data and Diagramming
We use Sketchup to prepare our light and sound contour diagram. We also use the axonometric drawing to
do the diagram which are better understanding and clearly.
6. Analysis
The collected data are then further calculated and analyzed, conclusions are derived from the analysis
4
2.1 Introduction to Lighting
2.1.1 Brief Literature Review
Light is defined as the electromagnetic radiation with wavelengths between 380 and 750nm which is
visible to the human eye. Electromagnetic radiation, such as light, is generated by changes in vibration
of electrically charged particles. Lighting assist human to gain vision by using the human eye that has
an ability to get information through light enter the eye. Light illuminates a certain area. There are two
types of lighting which are natural lighting and artificial lighting. Natural lighting comes from the source
of the sun. Artificial lighting comes from man-made and instrument that produce light.
2.1.2 Architectural Lighting
Light is the most important factor in the appreciation and understanding of Architecture. The
relationship between light and architecture is grounded in the principles of physics. It is about energy
and matter but in this particular case it also implies an emotional effect on people. The quality of lighting
in a space defines its character and creates impressions. The human eye perceives its form through
the incidence and reflection of light and in that way acquires information about the ambiance in a given
place. Visual impressions are interpreted in our brains and put in context to create emotions that move
us to take particular actions. On the other hand, light, heat, air movement and comfort are the key
factor in determine a building’s energy consumption.
6

2.3 Ground Eatery Lighting
2.3.1 Natural Lighting
Ground Eatery sits in a shoplot unit in Bandar Puteri, therefore it only has 2 facades, the front
facade facing east whilst the back facing west. But the most prominent area that receives light is
the front facade which is a full faced curtain glass which illuminates the interior inside. The facade
receives most daylight from 8am in the morning until the midday which the overhang above
shades the Sun above. In the evenings after 4pm, the cafe’s interior brightness reduces
dramatically as there are no openings at the back for light to penetrate in.
Section Cut of Ground Eatery Cafe Shading of facade across the day
13

2.3.2 Artificial Lighting
Ground Eatery at its peak hour (12pm-2pm). We observed that customers usually likes to sit at the
front part of the cafe due to more brightness from natural daylight. Ground Eatery heavily depends
on artificial lighting in its back area as it is not lit with natural light
Ground Eatery’s warm lights with dim and dull background material gives the atmosphere of dining
underground. It’s lighting concept are vintage lamps and down lights which gives the feeling of
coziness inside. Diners find this place romantic at night as it is quite dim especially at the rear end
without the presence of reflected daylight from the ceiling, wall and floor.
Front Part with plenty of Daylight in the morning till noon Back Part is dim with heavy reliance with artificial light
14

2.3.3 Tabulation of Data
The cafe is categorized to 5 zones according to lighting condition and compartmentation. Lumen values
are then recorded and analysed specifically with the surrounding materials and their reflectance.
Overview of Ground Eatery Cafe
15

Ground Floor Daytime 12-3pm Lux Value
16

Ground Floor Nightime 6-9pm Lux Value
17

First Floor Daytime 12-3pm Lux Value
18

First Floor Nightime 12-3pm Lux Value
19

Ground Eatery Light Contour Diagram
Light Contour Diagram generated from Light up Analytic Software
12-3pm
6-9pm
Observation
The front of the cafe has more contrasting illumination effect than the back area. This is due to the
presence of full faced curtain glass which allows day light to penetrate and lit up the front part.
During daytime, the Lux value we tabulated at the front is far more higher than the lux value at the
back and first floor. During night time, the Lux value at the front drops drastically without the
reliance on daylight, however the back area and first floor’s Lux value and lighting atmosphere as a
whole is not greatly affected, promising a consistency in Cafe’s ambiance throughout the day.
20

2.2 Precedent Studies
2.2.1 Introduction
Café Giacometti of École polytechnique fédérale de Lausanne (EPFL) University in Switzerland
Figure xx Interior view of the café
The purpose of this case study is to understand the effects of lighting especially daylight in a building
and potentially produce a conclusion between the relationship of daylight and spatial comfort level. This café
was chosen due to its similarities with our current case study building which is also another café known as
the Ground Eatery Café. Besides its similarities as a café, the precedent also provides ample daylight due to
the use of curtain walls in its façade, much like the one in Ground Eatery.
The café is situated on the first floor of the campus where it receives both direct and indirect lighting. In the
southwest corner of the café, is a large unshaded window that allows sunlight into the space while the rest
being illuminated by indirect light. Its operating hours are from 8 AM to 4 or 6 PM depending on the days of
the week while the customers are a mix of students and campus employees. With this, a study had been
carried out to identify the relationship between the light-syntax zones present in the café and the spatial
qualities which were determined by the users.
7

2.2.2 Methodology
Analysis was carried out using daylight simulations. The luminance images were provided by using
a program known as Desktop Radiance to simulate unique lighting conditions for example direct light on
tables which brings a difference to spatial quality. As for the averaging aspect, the data collected over the
months of May and June was segmented into 3 sections; 8AM to 12PM , 12PM to 4PM and 4PM to 8PM.
Figure xx Average simulated illuminance through the months of May and June in specified hours.
Zones in red were proposed window lighting.
The Figure shows the different maximum and minimum illuminance in the central part of the café and the
small secluded area in the southwest corner. The observation is as followed :
(A) 8AM to 12PM - Area closest to the eastern glazing peaks at almost 3000 lux and drops to close to
1000 lux near the counter while the unshaded window on the south reaches 7000 lux. Near the wall reads
only 500 lux.
(B) 12PM to 4PM - Maximum in the central area is close to 2000 lux with 6500 lux near the window
(C) 4PM to 8PM - Maximum in the central area is close to 800 lux with 1500 near the window.
From the results, it was obvious that while the maximum and minimum illuminance widely varies throughout
the day, the overall pattern of illuminance are still quite similar. However, these variations are distinct
between the area adjacent to the shaded glazing (largest part of the café) and the area adjacent to the
unshaded glazing (secluded area in the bottom corner). A section cut through the center of each glazing
during morning hours forms the graph below.
8
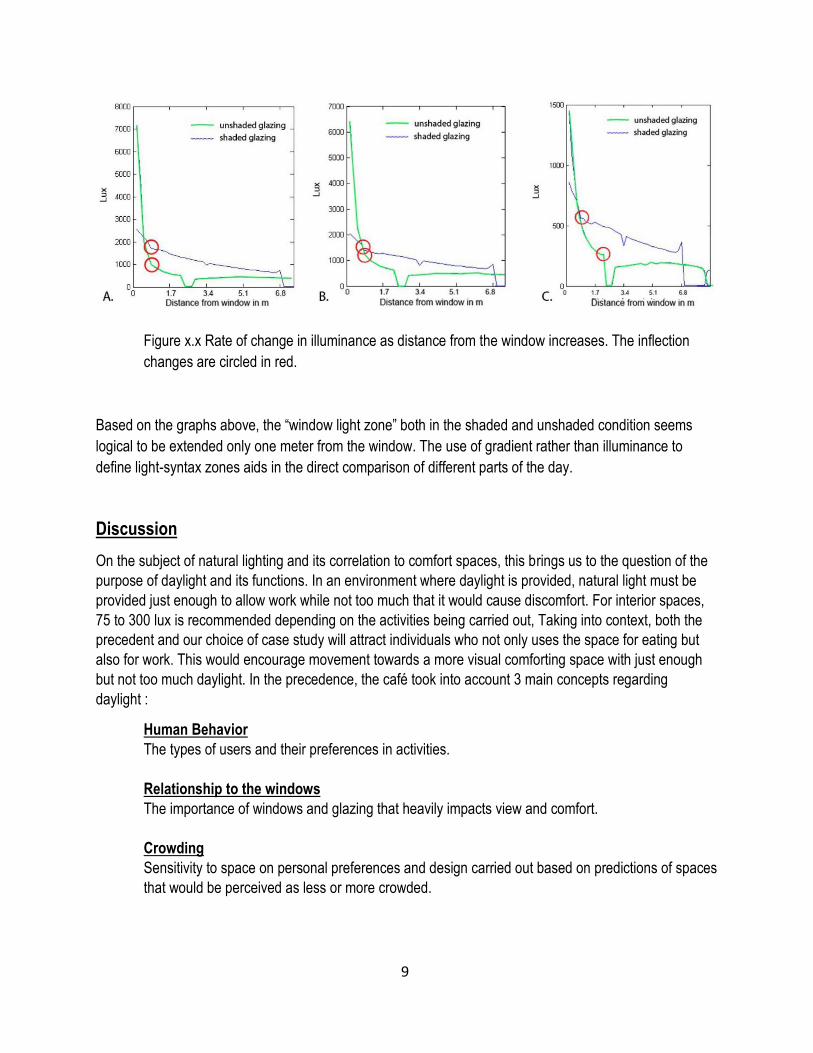
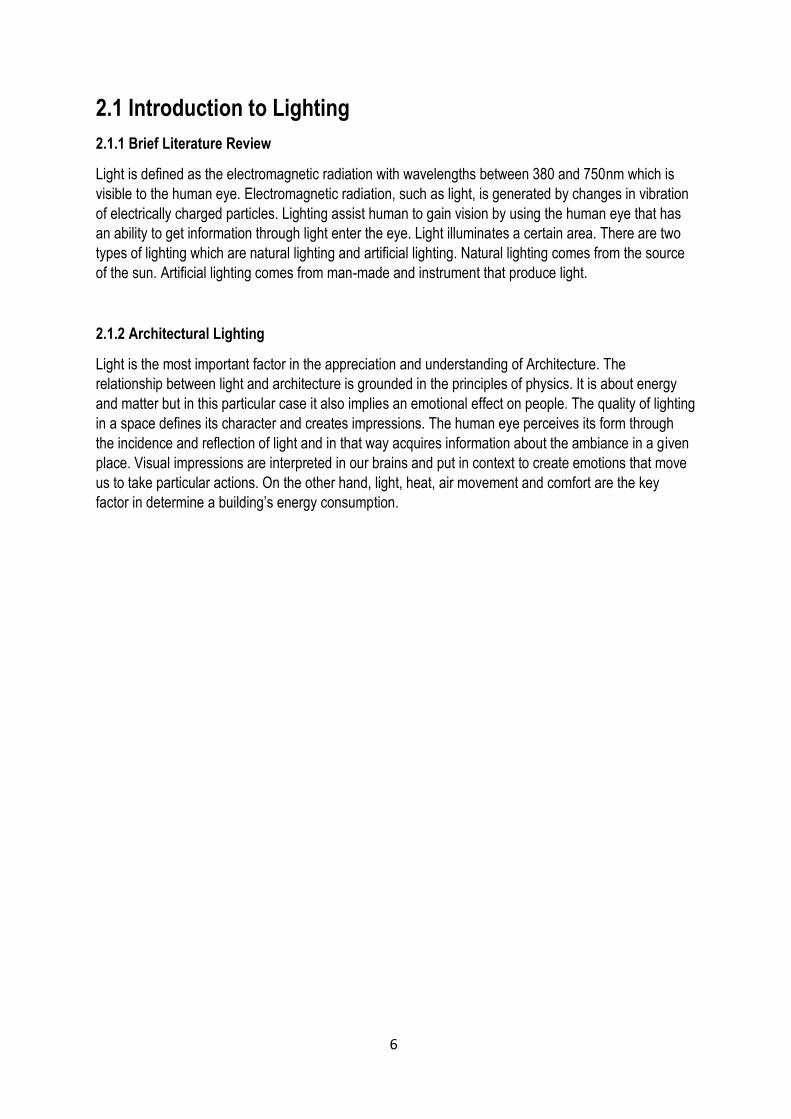
Figure x.x Rate of change in illuminance as distance from the window increases. The inflection
changes are circled in red.
Based on the graphs above, the “window light zone” both in the shaded and unshaded condition seems
logical to be extended only one meter from the window. The use of gradient rather than illuminance to
define light-syntax zones aids in the direct comparison of different parts of the day.
Discussion
On the subject of natural lighting and its correlation to comfort spaces, this brings us to the question of the
purpose of daylight and its functions. In an environment where daylight is provided, natural light must be
provided just enough to allow work while not too much that it would cause discomfort. For interior spaces,
75 to 300 lux is recommended depending on the activities being carried out, Taking into context, both the
precedent and our choice of case study will attract individuals who not only uses the space for eating but
also for work. This would encourage movement towards a more visual comforting space with just enough
but not too much daylight. In the precedence, the café took into account 3 main concepts regarding
daylight :
Human Behavior
The types of users and their preferences in activities.
Relationship to the windows
The importance of windows and glazing that heavily impacts view and comfort.
Crowding
Sensitivity to space on personal preferences and design carried out based on predictions of spaces
that would be perceived as less or more crowded.
9

Figure xx Sample days showing the three different light conditions and their corresponding sky type.
The above light condition is then tabulated and correlated with the occupancy rate , ORtot where
ORtot = total 5-minute timesteps occupied during observation/total 5-minute timesteps observed.
Independent Variables Possible Values Dependent Variables Possible Values
Light condition Diffuse, direct, changing Seat occupancy Empty or Filled
Spatial zone Central, junction,
secluded
Scheduling Morning, midday,
afternoon
Figure x.x Independent and dependent variables in observation experiment.
Results
The highest occupancy rate observed was 0.3157, where a seat was occupied for 21hours, 50 minutes of
the 73 observed, and the lowest being 0.0012 which was occupied for 5 minutes of the total observed.
10
Figure x.x Occupancy heat map for the periods A, B and C.
Overall, the more popular seats were found in the northeast corner near the window and also in the southwest corner facing
away from the window. Generally, seats that are closer to the glazed wall on the east were more occupied compared to those by
the aisle next to the food counter and the path to the outside door. In the morning, southwest area of the café was less favored
as compared to the large central space while the small group of seats in the southeast corner remains unpopular. During midday,
small changes were seen as more people were moving closer to the east window. Lastly in the afternoon, the aisle seats were
completely deserted while the secluded area more favored. Occupants tend to move towards regions of higher illuminance
however those spaces were also correlated to private spaces. This brings to question if occupants seek more light or privacy.
A B
C
11

Figure x.x Workflow of the entire study done in the precedent
Conclusion
The precedent has brought an understanding to the correlation of occupancy and seat choice in daylit
public spaces. Using the illuminance profile and the observation of users a conclusion was achieved where
users tend to gather at spaces with ample daylight. However, this result may not be accurate as the impact
of light overlaps with private spaces as well which might bring uncertainty to the final result. Users are not
certain to want more light as they do a private space. Nevertheless, this precedent is still helpful and
applicable in the study of our own choice of café as daylight also plays an important role in the Ground
Eatery Café. This will aid us in finding a correlation between user comfort and illuminance value.
12
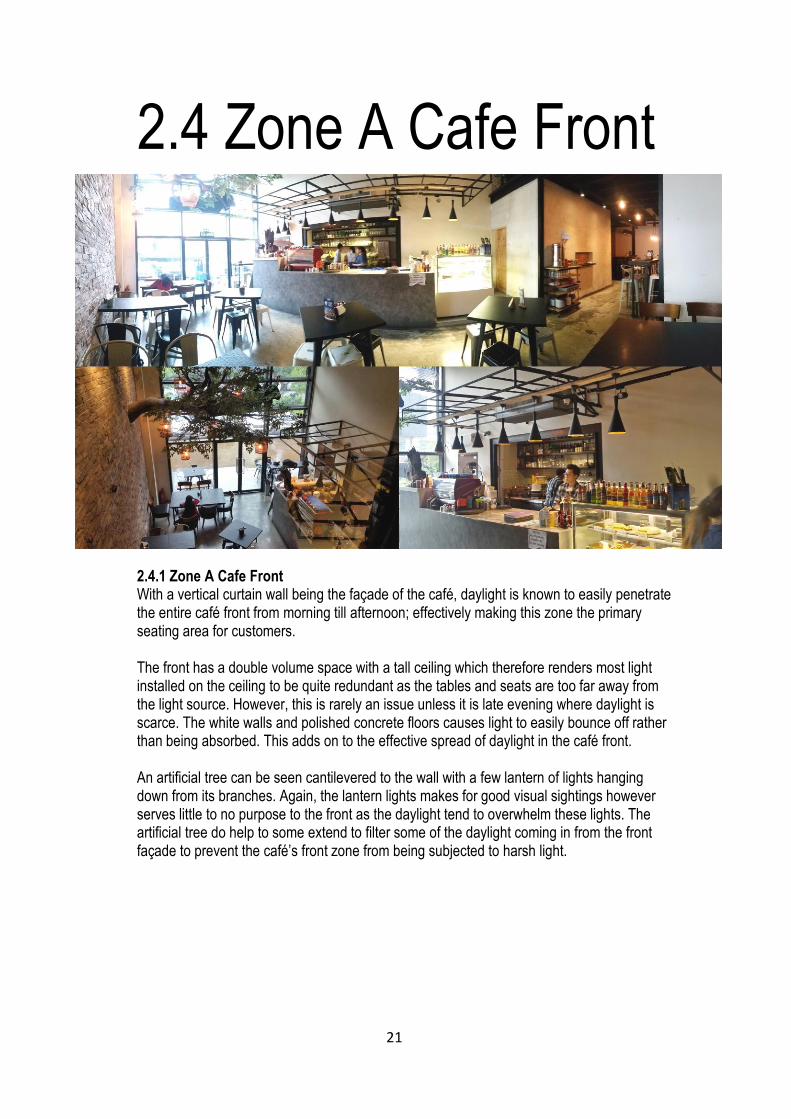
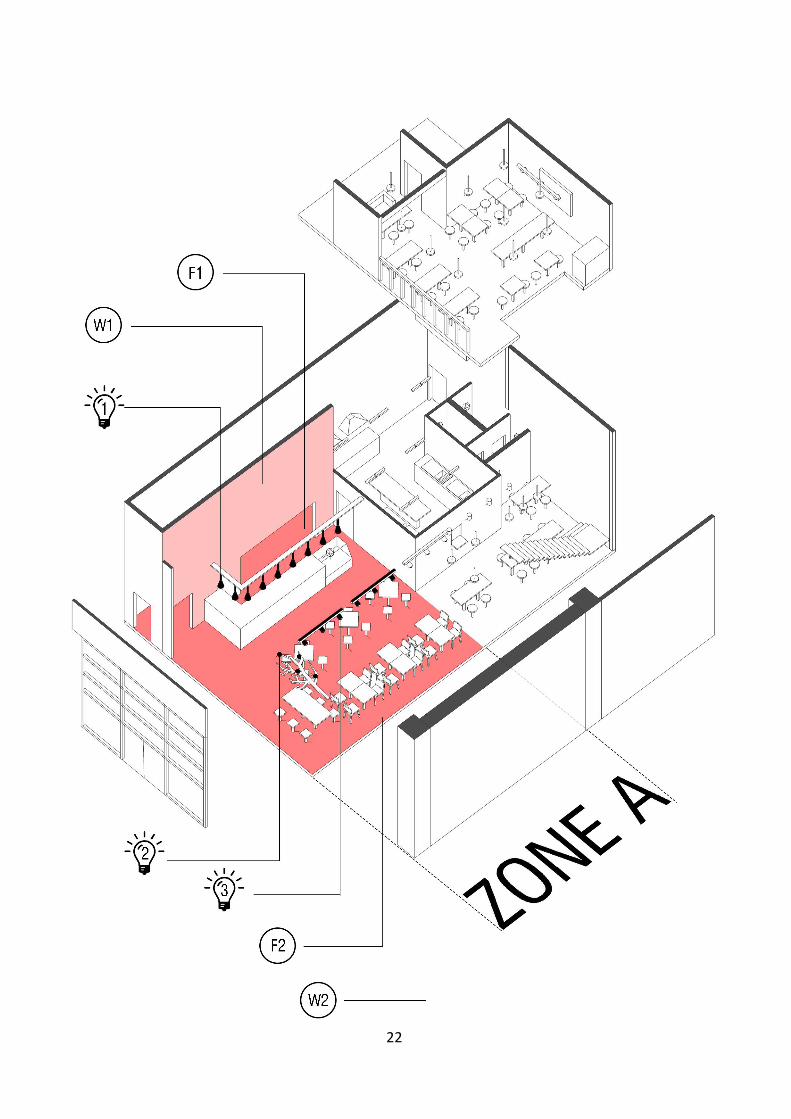
2.4.1 Zone A Cafe FrontWith a vertical curtain wall being the façade of the café, daylight is known to easily penetratethe entire café front from morning till afternoon; effectively making this zone the primaryseating area for customers.
The front has a double volume space with a tall ceiling which therefore renders most lightinstalled on the ceiling to be quite redundant as the tables and seats are too far away fromthe light source. However, this is rarely an issue unless it is late evening where daylight isscarce. The white walls and polished concrete floors causes light to easily bounce off ratherthan being absorbed. This adds on to the effective spread of daylight in the café front.
An artificial tree can be seen cantilevered to the wall with a few lantern of lights hangingdown from its branches. Again, the lantern lights makes for good visual sightings howeverserves little to no purpose to the front as the daylight tend to overwhelm these lights. Theartificial tree do help to some extend to filter some of the daylight coming in from the frontfaçade to prevent the café’s front zone from being subjected to harsh light.
2.4 Zone A Cafe Front
21
22

2.4.2 Zone A Lighting Specification
2.4.3 Zone A Materiality
23

2.4.4 Zone A Light Contour Diagram
12-3pmDue to the curtain wall façade,the front café receives strongdaylight during this period oftime.
6-8pmAs the sky gets darker, the frontzone of the café gets heavilyimpacted. The space is stillslightly illuminated with warmlighting but becomes darker asit gets closer to the counter.
Light Contour Diagram from Light up Analytic Software
24

2.4.5 Light Analysis Calculation
Zone A: Front Area
Daylight Factor
Time Weather Luminance at 1mheight
Average Luminance at 1.5mheight
Average
12-3pm Clear Sky 15-1113 564 30-1483 756.5
6-8pm Cloudy 15-412 213.5 30-367 198.5Table 1 indicates the lux reading of front area
Average Lux Reading 12-3pm 6-8pm
1m 564 213.5
1.5m 756.5 198.5
Average Lux Value 660.25 206Table 2 indicates the average lux value of front area
Illuminance Example
120,000 lux Brightest sunlight
110,000 lux Bright sunlight
20,000 lux Shade illuminated by entire clear blue sky, midday
1000-2000 lux Typical overcast day, midday
400 lux Sunrise or Sunset on a clear sky (Ambient illumination)
<200 lux Extreme of darkest storm clouds, midday
40 lux Fully overcast, sunset/ sunrise
<1 lux Extreme of darkest storm cloud, sunset and sunrise
Date and Time 25th September 2016
Average lux value reading (E internal) 564 - 213.5 = 350.5
25

Daylight Factor Calculation Formula D = x 100%
Standard direct sunlight (E external) 20,000 lux
Calculation D = x 100%
= 1.75%
Discussion
Zone Daylight Factor, % Distribution
Very Bright >6 Very bright with thermal & glare problem
Bright 3-6 Good
Average 1-3 Fair
Dark 0-1 Poor
The average lux value during 12-3pm is 660.25 lux, whereas during 6-8pm the average lux value is 206 lux. It isa great change in lux.
According to table provided in MS1525, the 1.75% daylight factor of front area is categorised under the averagezone. This is due to the daylight illuminating the space is only through the glass façade, and the interior paintespecially on the ceiling and structural steel is black in colour which has a low reflectance value to maximise thedaylight received. Therefore, it relies on some artificial lightings during daytime.
Lumen Method
Utilization FactorCeiling (%) 70 50 30Wall (%) 50 30 10 50 30 10 50 30 10Floor (%) 30 10 30 10 30 10 30 10 30 10 30 10 30 10 30 10 30 10RoomIndex
0.60 .27 .26 .22 .22 .19 .19 .26 .24 .22 .21 .19 .18 .26 .25 .21 .21 .19 .180.80 .33 .31 .28 .27 .23 .23 .32 .30 .27 .26 .24 .23 .31 .30 .27 .26 .23 .231.00 .38 .36 .32 .30 .28 .28 .36 .35 .32 .31 .29 .27 .35 .34 .31 .30 .28 .271.25 .43 .40 .37 .35 .33 .32 .41 .39 .36 .35 .33 .32 .39 .37 .35 .34 .32 .311.50 .47 .43 .41 .39 .37 .35 .44 .42 .40 .37 .36 .35 .42 .40 .39 .37 .36 .352.00 .52 .47 .47 .44 .43 .41 .49 .46 .45 .43 .42 .40 .47 .45 .44 .42 .41 .402.50 .56 .50 .51 .47 .48 .44 .53 .49 .49 .46 .46 .44 .50 .48 .47 .45 .45 .433.00 .59 .52 .55 .49 .51 .47 .55 .52 .52 .48 .49 .46 .52 .50 .50 .48 .47 .464.00 .62 .55 .59 .52 .56 .51 .58 .53 .56 .52 .53 .50 .55 .52 .53 .51 .51 .495.00 .64 .56 .62 .55 .59 .53 .60 .55 .58 .53 .56 .52 .57 .54 .55 .52 .52 .51
E internalE external
350.520000
26
)( WLHmWLK
64.0)1.94.8(8.6
1.94.8
K
99.1)1.94.8(2.2
1.94.8
K
AMFUFFNnE
43.5144.762.3931
44.768.021.0260091
E
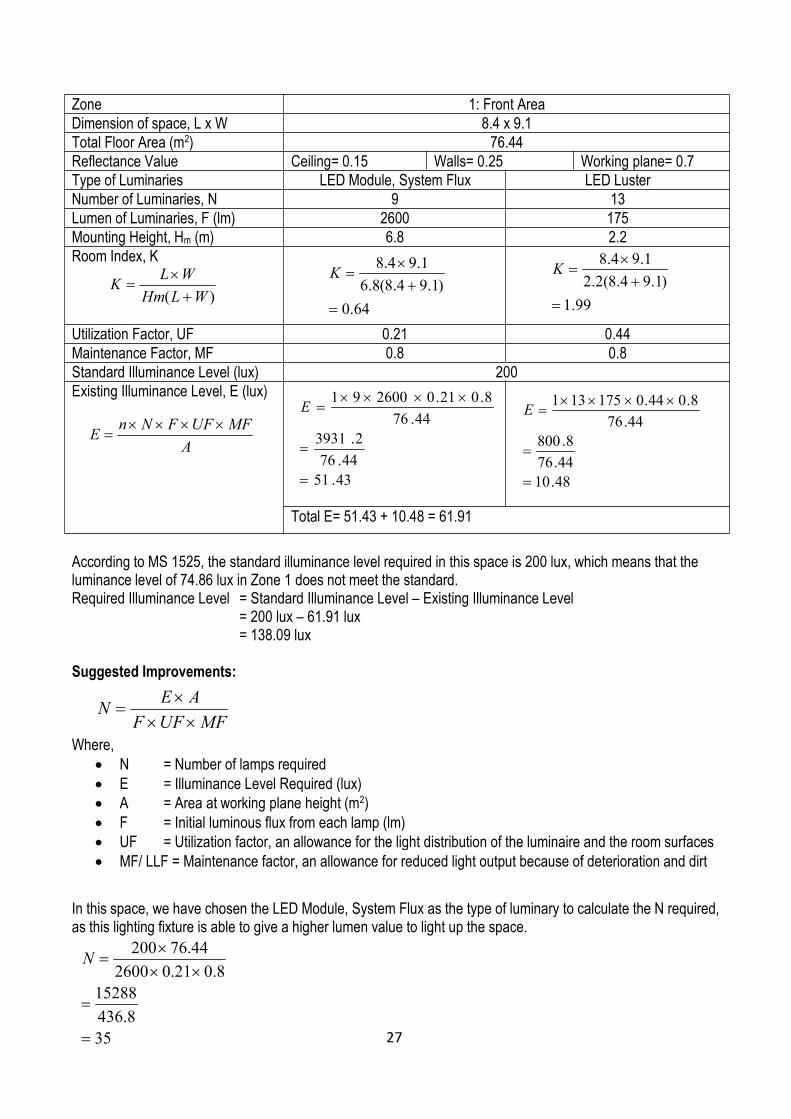
Zone 1: Front AreaDimension of space, L x W 8.4 x 9.1Total Floor Area (m2) 76.44Reflectance Value Ceiling= 0.15 Walls= 0.25 Working plane= 0.7Type of Luminaries LED Module, System Flux LED LusterNumber of Luminaries, N 9 13Lumen of Luminaries, F (lm) 2600 175Mounting Height, Hm (m) 6.8 2.2Room Index, K
Utilization Factor, UF 0.21 0.44Maintenance Factor, MF 0.8 0.8Standard Illuminance Level (lux) 200Existing Illuminance Level, E (lux)
Total E= 51.43 + 10.48 = 61.91
According to MS 1525, the standard illuminance level required in this space is 200 lux, which means that theluminance level of 74.86 lux in Zone 1 does not meet the standard.Required Illuminance Level = Standard Illuminance Level – Existing Illuminance Level
= 200 lux – 61.91 lux= 138.09 lux
Suggested Improvements:
Where, N = Number of lamps required E = Illuminance Level Required (lux) A = Area at working plane height (m2) F = Initial luminous flux from each lamp (lm) UF = Utilization factor, an allowance for the light distribution of the luminaire and the room surfaces MF/ LLF = Maintenance factor, an allowance for reduced light output because of deterioration and dirt
In this space, we have chosen the LED Module, System Flux as the type of luminary to calculate the N required,as this lighting fixture is able to give a higher lumen value to light up the space.
48.1044.768.800
44.768.044.0175131
E
MFUFFAEN
358.436
152888.021.02600
44.76200
N
27

Therefore, to meet the standard illuminance level required in this zone, 24 (35-9) more LED Module, SystemFluxes are required.
Smax = 1.0 x HmWhere,
Smax = Maximum horizontal spacing between fittings Hm = Mounted height of fitting above the working plane
Smax = 6.8m, therefore, in this space we have set the spacing between the luminaries, S to be 1.5m.First spacing from the wall will be half of the S, which is 1.5m/ 2 = 0.75m
R = N/ Number of spacing line in S= 26/ 6= 4.33= 5
Conclusion:Total number of luminaries required in this space to meet the standard illuminance level required is 35 with thespacing between them as shown in calculation and diagram above.
Whereas the spacing on R is9.1m/ 5= 1.82m
Smax = 1.0 x Hm= 1.0 x 6.8= 6.8m
The first spacing line from the wall is halfof the R which is1.82m/ 2= 0.91m
28

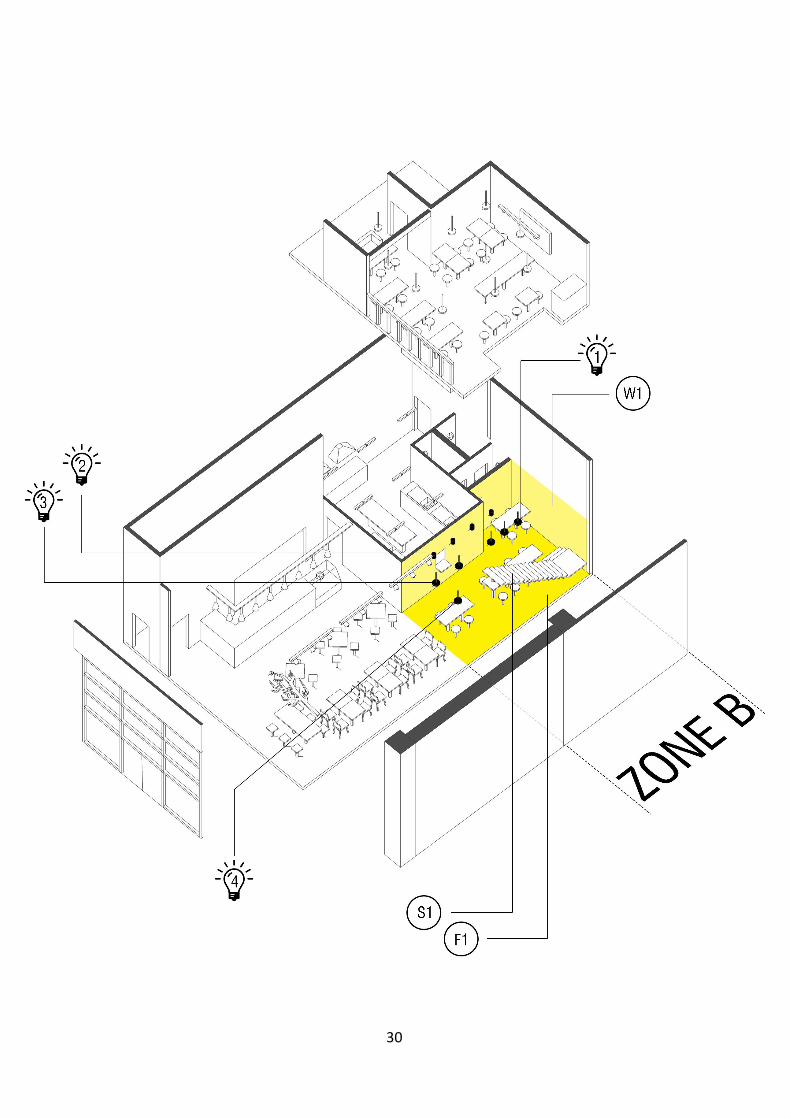
2.5 Zone B Cafe Back
2.5.1 Zone B Café BackThe café back has a shorter ceiling height compared to the double volume front. As themain source of light comes from the front façade, the back suffers a little as it becomesshaded. However, due to the low ceiling, lights installed proofs to be useful as it illuminatesthe space at the back.
While the space do have some natural lighting coming in during mornings and earlyafternoons, the space becomes quite dim towards the evening. The lightning producedartificially are quite warm and appears to be quite effective throughout the entire day.
The stairway to the upper floor is located at the side, mounted to a wall painted black. Thiscontributes to the dim atmosphere of the space which tends to hide the stairs from view.
29
30

2.5.2 Zone B Lighting Specification
2.5.3 Zone B Materiality
31

2.5.4 Zone B Light Contour Diagram
12-3pmSome daylight from the front façadespills to the back due to the level ofintensity during the early afternoon.The rest of the space is artificiallyilluminated.
6-8pmNot much difference compared to thelighting gradient in the afternoon.However, the front daylight can beseen to be less effective during thishour while the spaces continues to beartificially illuminated.
Light Contour Diagram from Light up Analytic Software
32

2.5.5 Light Analysis Calculation
Zone B: Back Area
Daylight Factor
Time Weather Luminance at 1mheight
Average Luminance at 1.5mheight
Average
12-3pm Clear Sky 16-256 136 20-352 186
6-8pm Cloudy 2-259 130.5 13-342 177.5Table 1 indicates the lux reading of back area
Average Lux Reading 12-3pm 6-8pm
1m 136 130.5
1.5m 186 177.5
Average Lux Value 161 154Table 2 indicates the average lux value of back area
Illuminance Example
120,000 lux Brightest sunlight
110,000 lux Bright sunlight
20,000 lux Shade illuminated by entire clear blue sky, midday
1000-2000 lux Typical overcast day, midday
400 lux Sunrise or Sunset on a clear sky (Ambient illumination)
<200 lux Extreme of darkest storm clouds, midday
40 lux Fully overcast, sunset/ sunrise
<1 lux Extreme of darkest storm cloud, sunset and sunrise
33
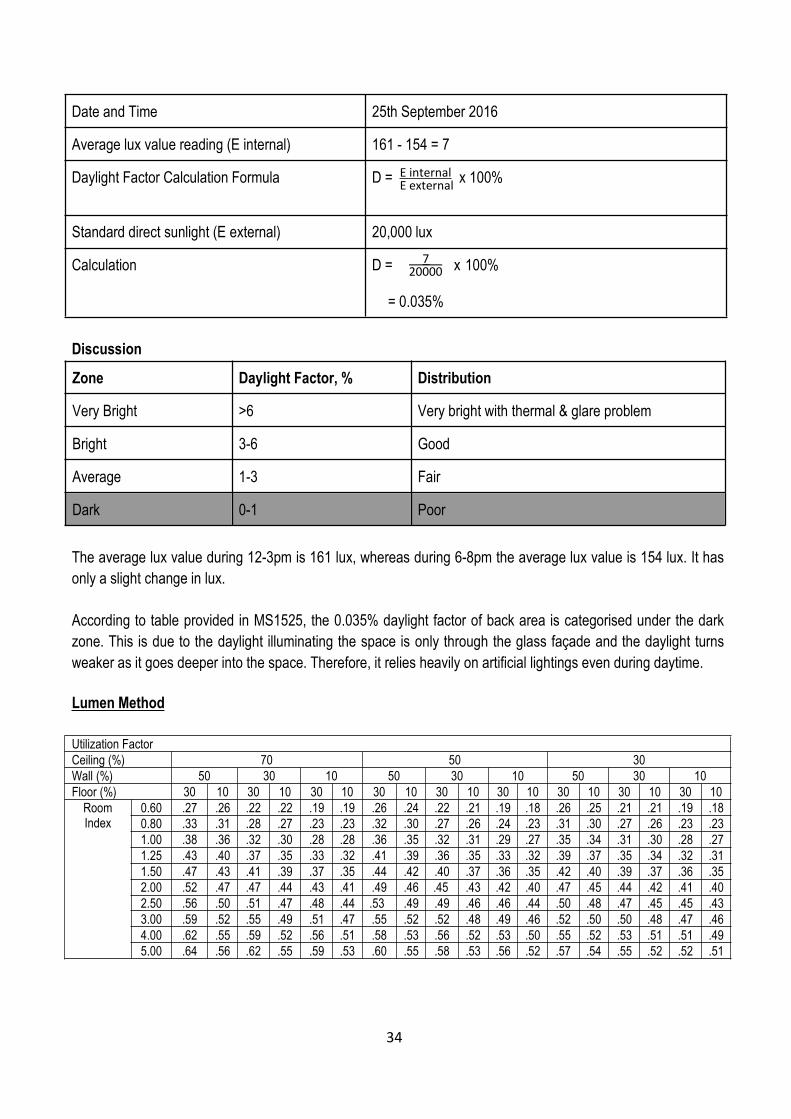
Date and Time 25th September 2016
Average lux value reading (E internal) 161 - 154 = 7
Daylight Factor Calculation Formula D = x 100%
Standard direct sunlight (E external) 20,000 lux
Calculation D = x 100%
= 0.035%
Discussion
Zone Daylight Factor, % Distribution
Very Bright >6 Very bright with thermal & glare problem
Bright 3-6 Good
Average 1-3 Fair
Dark 0-1 Poor
The average lux value during 12-3pm is 161 lux, whereas during 6-8pm the average lux value is 154 lux. It hasonly a slight change in lux.
According to table provided in MS1525, the 0.035% daylight factor of back area is categorised under the darkzone. This is due to the daylight illuminating the space is only through the glass façade and the daylight turnsweaker as it goes deeper into the space. Therefore, it relies heavily on artificial lightings even during daytime.
Lumen Method
Utilization FactorCeiling (%) 70 50 30Wall (%) 50 30 10 50 30 10 50 30 10Floor (%) 30 10 30 10 30 10 30 10 30 10 30 10 30 10 30 10 30 10RoomIndex
0.60 .27 .26 .22 .22 .19 .19 .26 .24 .22 .21 .19 .18 .26 .25 .21 .21 .19 .180.80 .33 .31 .28 .27 .23 .23 .32 .30 .27 .26 .24 .23 .31 .30 .27 .26 .23 .231.00 .38 .36 .32 .30 .28 .28 .36 .35 .32 .31 .29 .27 .35 .34 .31 .30 .28 .271.25 .43 .40 .37 .35 .33 .32 .41 .39 .36 .35 .33 .32 .39 .37 .35 .34 .32 .311.50 .47 .43 .41 .39 .37 .35 .44 .42 .40 .37 .36 .35 .42 .40 .39 .37 .36 .352.00 .52 .47 .47 .44 .43 .41 .49 .46 .45 .43 .42 .40 .47 .45 .44 .42 .41 .402.50 .56 .50 .51 .47 .48 .44 .53 .49 .49 .46 .46 .44 .50 .48 .47 .45 .45 .433.00 .59 .52 .55 .49 .51 .47 .55 .52 .52 .48 .49 .46 .52 .50 .50 .48 .47 .464.00 .62 .55 .59 .52 .56 .51 .58 .53 .56 .52 .53 .50 .55 .52 .53 .51 .51 .495.00 .64 .56 .62 .55 .59 .53 .60 .55 .58 .53 .56 .52 .57 .54 .55 .52 .52 .51
E internalE external
720000
34

)( WLHmWLK
AMFUFFNnE
79.0)4.24.6(8.2
4.34.6
K
69.0)1.94.8(2.3
4.34.6
K
59.19076.212.4147
76.218.027.0320061
E
Zone 2: Back AreaDimension of space, L x W 6.4 x 3.4Total Floor Area (m2) 21.76Reflectance Value Ceiling= 0.15 Walls= 0.25 Working plane= 0.7Type of Luminaries OEM Edison Vintage Light Bulb Tornado Spiral Energy Saving BlubNumber of Luminaries, N 6 4Lumen of Luminaries, F (lm) 3200 500Mounting Height, Hm (m) 2.8 3.2Room Index, K
Utilization Factor, UF 0.27 0.21Maintenance Factor, MF 0.8 0.8Standard Illuminance Level (lux) 200Existing Illuminance Level, E (lux)
Total E= 190.59 + 15.44 = 206.03
Conclusion:According to MS 1525, the standard illuminance level required in this space is 200 lux, which means that theluminance level of 206.03 lux in Zone 2 meets the standard.
44.1576.21
33676.21
8.021.050041
E
35

2.6 Zone C Kitchen
2.6.1 Zone C KitchenThe kitchen is not subjected to any natural lighting therefore it is completely illuminated byartificial lighting. The light used for this space is a clear LED lighting of 25w and 1250 lumen.With the reflective properties of the materials such as the tables and other equipmentalongside the porcelain tile walls, light gets bounced around the room which makes for avery bright space.
36

37
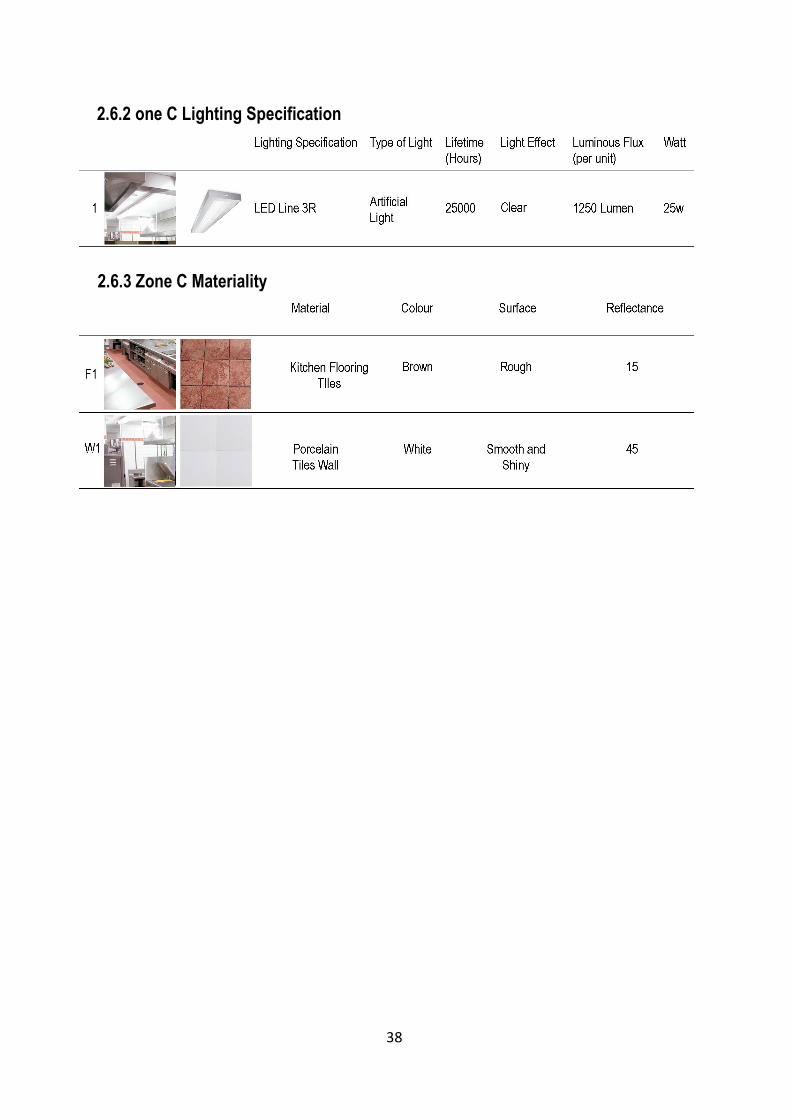
2.6.2 one C Lighting Specification
2.6.3 Zone C Materiality
38

2.6.4 Zone C Light Contour Diagram
12-3pmThe space is well lit throughout theentire time.
6-8pmThere are close to no difference inlighting due to the use of artificiallighting as the main source of lightingin the space.
Light Contour Diagram from Light up Analytic Software
39

2.6.5 Light Analysis Calculation
Zone 4: Kitchen
Daylight Factor
Time Weather Luminance at 1mheight
Average Luminance at1.5m height
Average
12-3pm Clear Sky 12-394 203 17-540 278.5
6-8pm Cloudy 12-275 143.5 17-325 171Table 1 indicates the lux reading of kitchen
Average Lux Reading 12-3pm 6-8pm
1m 203 143.5
1.5m 278.5 171
Average Lux Value 240.75 157.25Table 2 indicates the average lux value of kitchen
Illuminance Example
120,000 lux Brightest sunlight
110,000 lux Bright sunlight
20,000 lux Shade illuminated by entire clear blue sky, midday
1000-2000 lux Typical overcast day, midday
400 lux Sunrise or Sunset on a clear sky (Ambient illumination)
<200 lux Extreme of darkest storm clouds, midday
40 lux Fully overcast, sunset/ sunrise
<1 lux Extreme of darkest storm cloud, sunset and sunrise
40

Date and Time 25th September 2016
Average lux value reading (E internal) 240.75 - 157.25 = 83.5
Daylight Factor Calculation Formula D = x 100%
Standard direct sunlight (E external) 20,000 lux
Calculation D = x 100%
= 0.418%
Discussion
Zone Daylight Factor, % Distribution
Very Bright >6 Very bright with thermal & glare problem
Bright 3-6 Good
Average 1-3 Fair
Dark 0-1 Poor
The average lux value during 12-3pm is 240.75 lux, whereas during 6-8pm the average lux value is 157.25 lux.It has a change of 83.5 lux.
According to table provided in MS1525, the 0.418% daylight factor of kitchen area is categorised under the darkzone. This is due to it is an enclosed space. Therefore, it relies entirely on artificial lightings to lighten up thespace throughout the time.
Lumen Method
Utilization FactorCeiling (%) 70 50 30Wall (%) 50 30 10 50 30 10 50 30 10Floor (%) 30 10 30 10 30 10 30 10 30 10 30 10 30 10 30 10 30 10RoomIndex
0.60 .27 .26 .22 .22 .19 .19 .26 .24 .22 .21 .19 .18 .26 .25 .21 .21 .19 .180.80 .33 .31 .28 .27 .23 .23 .32 .30 .27 .26 .24 .23 .31 .30 .27 .26 .23 .231.00 .38 .36 .32 .30 .28 .28 .36 .35 .32 .31 .29 .27 .35 .34 .31 .30 .28 .271.25 .43 .40 .37 .35 .33 .32 .41 .39 .36 .35 .33 .32 .39 .37 .35 .34 .32 .311.50 .47 .43 .41 .39 .37 .35 .44 .42 .40 .37 .36 .35 .42 .40 .39 .37 .36 .352.00 .52 .47 .47 .44 .43 .41 .49 .46 .45 .43 .42 .40 .47 .45 .44 .42 .41 .402.50 .56 .50 .51 .47 .48 .44 .53 .49 .49 .46 .46 .44 .50 .48 .47 .45 .45 .433.00 .59 .52 .55 .49 .51 .47 .55 .52 .52 .48 .49 .46 .52 .50 .50 .48 .47 .464.00 .62 .55 .59 .52 .56 .51 .58 .53 .56 .52 .53 .50 .55 .52 .53 .51 .51 .495.00 .64 .56 .62 .55 .59 .53 .60 .55 .58 .53 .56 .52 .57 .54 .55 .52 .52 .51
83.520000
E internalE external
41

)( WLHmWLK
AMFUFFNnE
Zone 4: KitchenDimension of space, L x W 4.08 x 6.05 + 2.28 x 2.25Total Floor Area (m2) 24.68 + 5.13Reflectance Value Ceiling= 0.5 Walls= 0.5 Working plane= 0.45Type of Luminaries Fluorescent TubeNumber of Luminaries, N 6 + 1Lumen of Luminaries, F (lm) 1100Mounting Height, Hm (m) 2.3Room Index, K
Utilization Factor, UF 0.36 0.26Maintenance Factor, MF 0.8Standard Illuminance Level (lux) 200Existing Illuminance Level, E (lux)
Total E= 77.02 + 44.6 = 121.6
According to MS 1525, the standard illuminance level required in this space is 150 lux, which means that theluminance level of 121.6 lux in Zone 4 does not meet the standard.Required Illuminance Level = Standard Illuminance Level – Existing Illuminance Level
= 150 lux – 121.6 lux= 28.38 lux
Suggested Improvements:
Where, N = Number of lamps required E = Illuminance Level Required (lux) A = Area at working plane height (m2) F = Initial luminous flux from each lamp (lm) UF = Utilization factor, an allowance for the light distribution of the luminaire and the room surfaces MF/ LLF = Maintenance factor, an allowance for reduced light output because of deterioration and dirt
In this space, we have chosen the Old Filament Lamp as the type of luminary to calculate the N required, as thislighting fixture is required to light up the space before entering individual toilet space.
MFUFFAEN
06.1)05.608.4(3.2
05.608.4
K
49.0)25.228.2(3.2
25.228.2
K
02.7768.248.1900
68.248.036.0110061
E
6.4413.58.288
13.58.026.0110011
E
42
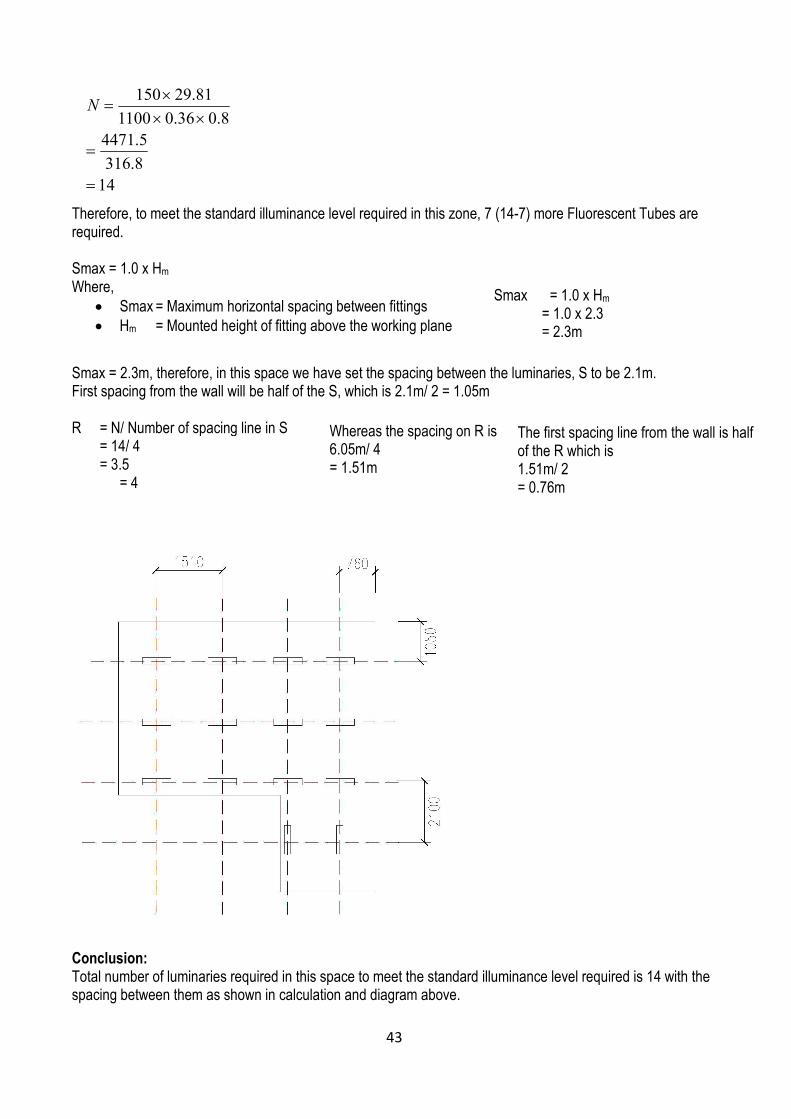
Therefore, to meet the standard illuminance level required in this zone, 7 (14-7) more Fluorescent Tubes arerequired.
Smax = 1.0 x HmWhere,
Smax = Maximum horizontal spacing between fittings Hm = Mounted height of fitting above the working plane
Smax = 2.3m, therefore, in this space we have set the spacing between the luminaries, S to be 2.1m.First spacing from the wall will be half of the S, which is 2.1m/ 2 = 1.05m
R = N/ Number of spacing line in S= 14/ 4= 3.5
= 4
Conclusion:Total number of luminaries required in this space to meet the standard illuminance level required is 14 with thespacing between them as shown in calculation and diagram above.
Whereas the spacing on R is6.05m/ 4= 1.51m
Smax = 1.0 x Hm= 1.0 x 2.3= 2.3m
The first spacing line from the wall is halfof the R which is1.51m/ 2= 0.76m
148.3165.4471
8.036.0110081.29150
N
43

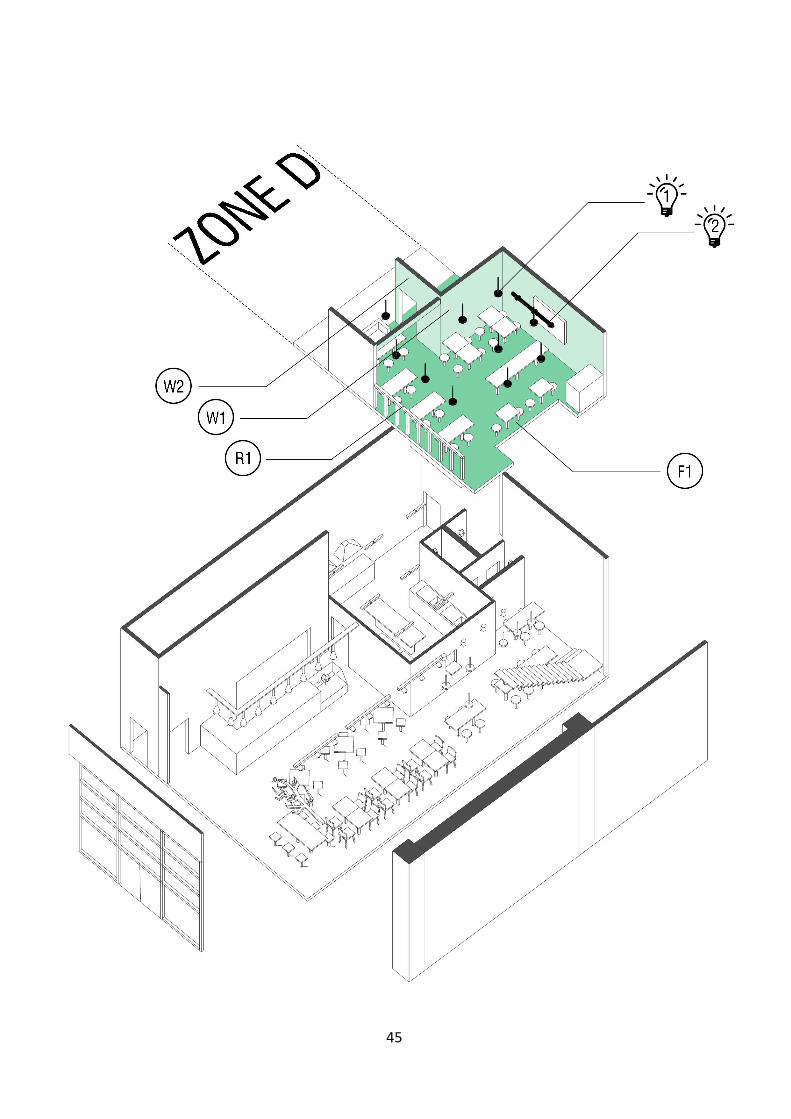
2.7.1 Zone D First FloorThe first floor is situated above the kitchen and the back zone of the café where the stairs islocated. The windows which are parallel with the front façade are the only source of naturaldaylight that the space experiences. However, due to the height of the floor, natural lightingrarely finds its way in to the upper area.
The walls on the upper floor are all painted in black. This caused the space to be darker dueto the lack of light being reflected. To compensate, the spaces uses warm artificial lightingswhich were positioned above each table. However, the space is still heavily affected by thelack of natural lighting and the use of material and color on the walls.
This sets a different mood to the zone above as compared to the zone below. The gloomstate of the space adds a more retro vibe to the space which is not the same for the zonesfound below.
2.7 Zone D First Floor
44
45

2.7.2 Zone D Lighting Specification
2.7.3 Zone D Materiality
46

2.7.4 Light Contour Diagram
12-3pmThe lighting remains quite constant inthis area as it is mainly lit by artificiallighting. The foliage on the back panelwere lit with brighter warm lightswhich gave it a brighter light gradientas compared to the rest of the zonespace.
6-8pmThere is not much difference in thelight gradient during the evening dueto the main source of light beingartificial lighting.
Light Contour Diagram from Light up Analytic Software
47

2.7.5 Light Analysis
Zone 5: First Floor
Daylight Factor
Time Weather Luminance at 1mheight
Average Luminance at1.5m height
Average
12-3pm Clear Sky 32-555 293.5 45-600 322.5
6-8pm Cloudy 10-541 275.5 13-593 303Table 1 indicates the lux reading of first floor
Average Lux Reading 12-3pm 6-8pm
1m 293.5 275.5
1.5m 322.5 303
Average Lux Value 308 289.3Table 2 indicates the average lux value of first floor
Illuminance Example
120,000 lux Brightest sunlight
110,000 lux Bright sunlight
20,000 lux Shade illuminated by entire clear blue sky, midday
1000-2000 lux Typical overcast day, midday
400 lux Sunrise or Sunset on a clear sky (Ambient illumination)
<200 lux Extreme of darkest storm clouds, midday
40 lux Fully overcast, sunset/ sunrise
<1 lux Extreme of darkest storm cloud, sunset and sunrise
Date and Time 25th September 2016
Average lux value reading (E internal) 308 - 289.3= 18.7
48

Daylight Factor Calculation Formula D = x 100%
Standard direct sunlight (E external) 20,000 lux
Calculation D = x 100%
= 0.094%
Discussion
Zone Daylight Factor, % Distribution
Very Bright >6 Very bright with thermal & glare problem
Bright 3-6 Good
Average 1-3 Fair
Dark 0-1 Poor
The average lux value during 12-3pm is 308 lux, whereas during 6-8pm the average lux value is 289.3 lux, andthere is only a slight change in lux.
According to table provided in MS1525, the 0.094% daylight factor of first floor is categorised under the darkzone. This is due to the only daylight source is coming from the front glass, and even though first floor has thesimilarity as a mezzanine floor, it is still not able to catch the sunlight due to its depth in the café. Therefore, itrelies on some artificial lightings during daytime and night time as well.
Lumen Method
Utilization FactorCeiling (%) 70 50 30Wall (%) 50 30 10 50 30 10 50 30 10Floor (%) 30 10 30 10 30 10 30 10 30 10 30 10 30 10 30 10 30 10RoomIndex
0.60 .27 .26 .22 .22 .19 .19 .26 .24 .22 .21 .19 .18 .26 .25 .21 .21 .19 .180.80 .33 .31 .28 .27 .23 .23 .32 .30 .27 .26 .24 .23 .31 .30 .27 .26 .23 .231.00 .38 .36 .32 .30 .28 .28 .36 .35 .32 .31 .29 .27 .35 .34 .31 .30 .28 .271.25 .43 .40 .37 .35 .33 .32 .41 .39 .36 .35 .33 .32 .39 .37 .35 .34 .32 .311.50 .47 .43 .41 .39 .37 .35 .44 .42 .40 .37 .36 .35 .42 .40 .39 .37 .36 .352.00 .52 .47 .47 .44 .43 .41 .49 .46 .45 .43 .42 .40 .47 .45 .44 .42 .41 .402.50 .56 .50 .51 .47 .48 .44 .53 .49 .49 .46 .46 .44 .50 .48 .47 .45 .45 .433.00 .59 .52 .55 .49 .51 .47 .55 .52 .52 .48 .49 .46 .52 .50 .50 .48 .47 .464.00 .62 .55 .59 .52 .56 .51 .58 .53 .56 .52 .53 .50 .55 .52 .53 .51 .51 .495.00 .64 .56 .62 .55 .59 .53 .60 .55 .58 .53 .56 .52 .57 .54 .55 .52 .52 .51
E internalE external
350.520000
49

)( WLHmWLK
AMFUFFNnE
34.1)85.73.6(6.2
85.73.6
K
25.1)85.73.6(8.2
85.73.6
K
6.147455.498.7300
455.498.021.0260091
E
Zone 1: Front AreaDimension of space, L x W 6.3 x 7.85Total Floor Area (m2) 49.455Reflectance Value Ceiling= 0.15 Walls= 0.35 Working plane= 0.25Type of Luminaries LED Module, System Flux OEM Edison Vintage Light BulbNumber of Luminaries, N 9 4Lumen of Luminaries, F (lm) 2600 3200Mounting Height, Hm (m) 2.6 2.8Room Index, K
Utilization Factor, UF 0.39 0.35Maintenance Factor, MF 0.8 0.8Standard Illuminance Level (lux) 200Existing Illuminance Level, E (lux)
Total E= 147.6 + 72.47 = 220.1
ConclusionAccording to MS 1525, the standard illuminance level required in this space is 200 lux, which means that theluminance level of 220.1 lux in Zone 5 has met the standard.
47.72455.49
3584455.49
8.035.0320041
E
50

2.8 Zone E Toilet
51

2.8.1 Zone E Lighting Specification
2.8.2 Zone EMateriality
52

2.8.3 Light Analysis
Zone 3: Toilet
Daylight Factor
Time Weather Luminance at 1mheight
Average Luminance at1.5m height
Average
12-3pm Clear Sky 12-50 31 12-34 23
6-8pm Cloudy 12-50 31 10-27 18.5Table 1 indicates the lux reading of toilet
Average Lux Reading 12-3pm 6-8pm
1m 31 31
1.5m 23 18.5
Average Lux Value 27 24.8Table 2 indicates the average lux value of toilet
Illuminance Example
120,000 lux Brightest sunlight
110,000 lux Bright sunlight
20,000 lux Shade illuminated by entire clear blue sky, midday
1000-2000 lux Typical overcast day, midday
400 lux Sunrise or Sunset on a clear sky (Ambient illumination)
<200 lux Extreme of darkest storm clouds, midday
40 lux Fully overcast, sunset/ sunrise
<1 lux Extreme of darkest storm cloud, sunset and sunrise
Date and Time 25th September 2016
Average lux value reading (E internal) 27 - 24.8= 2.2
53

Daylight Factor Calculation Formula D = x 100%
Standard direct sunlight (E external) 20,000 lux
Calculation D = x 100%
= 0.011%
Discussion
Zone Daylight Factor, % Distribution
Very Bright >6 Very bright with thermal & glare problem
Bright 3-6 Good
Average 1-3 Fair
Dark 0-1 Poor
The average lux value during 12-3pm is 27 lux, whereas during 6-8pm the average lux value is 24.8 lux. It hasonly a slight change in lux.
According to table provided in MS1525, the 0.011% daylight factor of toilet area is categorised under the darkzone. This is due to it is an enclosed space. Therefore, it relies entirely on artificial lightings to lighten up thespace throughout the time.
Lumen Method
Utilization FactorCeiling (%) 70 50 30Wall (%) 50 30 10 50 30 10 50 30 10Floor (%) 30 10 30 10 30 10 30 10 30 10 30 10 30 10 30 10 30 10RoomIndex
0.60 .27 .26 .22 .22 .19 .19 .26 .24 .22 .21 .19 .18 .26 .25 .21 .21 .19 .180.80 .33 .31 .28 .27 .23 .23 .32 .30 .27 .26 .24 .23 .31 .30 .27 .26 .23 .231.00 .38 .36 .32 .30 .28 .28 .36 .35 .32 .31 .29 .27 .35 .34 .31 .30 .28 .271.25 .43 .40 .37 .35 .33 .32 .41 .39 .36 .35 .33 .32 .39 .37 .35 .34 .32 .311.50 .47 .43 .41 .39 .37 .35 .44 .42 .40 .37 .36 .35 .42 .40 .39 .37 .36 .352.00 .52 .47 .47 .44 .43 .41 .49 .46 .45 .43 .42 .40 .47 .45 .44 .42 .41 .402.50 .56 .50 .51 .47 .48 .44 .53 .49 .49 .46 .46 .44 .50 .48 .47 .45 .45 .433.00 .59 .52 .55 .49 .51 .47 .55 .52 .52 .48 .49 .46 .52 .50 .50 .48 .47 .464.00 .62 .55 .59 .52 .56 .51 .58 .53 .56 .52 .53 .50 .55 .52 .53 .51 .51 .495.00 .64 .56 .62 .55 .59 .53 .60 .55 .58 .53 .56 .52 .57 .54 .55 .52 .52 .51
E internalE external
2.220000
54

)( WLHmWLK
45.0)18.205.3(8.2
18.205.3
K
64.0)18.205.3(0.2
18.205.3
K
AMFUFFNnE
43.5144.762.3931
44.768.021.0260091
E
Zone 3: ToiletDimension of space, L x W 3.05 x 2.18Total Floor Area (m2) 6.65Reflectance Value Ceiling= 0.15 Walls= 0.45 Working plane= 0.45Type of Luminaries Old Filament Lamp LuxSpace PoENumber of Luminaries, N 1 2Lumen of Luminaries, F (lm) 560 2400Mounting Height, Hm (m) 2.8 3.0Room Index, K
Utilization Factor, UF 0.26 0.26Maintenance Factor, MF 0.8 0.8Standard Illuminance Level (lux) 200Existing Illuminance Level, E (lux)
Total E= 17.52 + 150.14 = 167.66
According to MS 1525, the standard illuminance level required in this space is 200 lux, which means that theluminance level of 167.66 lux in Zone 3 does not meet the standard.Required Illuminance Level = Standard Illuminance Level – Existing Illuminance Level
= 200 lux – 167.66 lux= 32.34 lux
Suggested Improvements:
Where, N = Number of lamps required E = Illuminance Level Required (lux) A = Area at working plane height (m2) F = Initial luminous flux from each lamp (lm) UF = Utilization factor, an allowance for the light distribution of the luminaire and the room surfaces MF/ LLF = Maintenance factor, an allowance for reduced light output because of deterioration and dirt
In this space, we have chosen the Old Filament Lamp as the type of luminary to calculate the N required, as thislighting fixture is required to light up the space before entering individual toilet space.
48.1044.768.800
44.768.044.0175131
E
MFUFFAEN
1048.116
13308.026.0560
65.6200
N
55

Therefore, to meet the standard illuminance level required in this zone, 9 (10-1) more Old Filament Lamps arerequired.
Smax = 1.0 x HmWhere,
Smax = Maximum horizontal spacing between fittings Hm = Mounted height of fitting above the working plane
Smax = 2.8m, therefore, in this space we have set the spacingbetween the luminaries, S to be 1.1m.First spacing from the wall will be half of the S, which is 1.1m/ 2 = 0.55m
R = N/ Number of spacing line in S= 10/ 2= 5
Conclusion:Total number of luminaries required in this space to meet the standard illuminance level required is 10 with thespacing between them as shown in calculation and diagram above.
Whereas the spacing on R is2.18m/ 5= 0.436m
Smax = 1.0 x Hm= 1.0 x 2.8= 2.8m
The first spacing line from the wall is halfof the R which is0.436m/ 2= 0.218m

56

3.0 Introduction to Acoustic
3.1 Literature Review
Acoustic is defined as the scientific study of sound which includes the effect of reflection, refraction,
absorption, diffraction and interference. A sound wave is a longitudinal wave where particles of the
medium are temporarily displaced in a direction parallel to energy traveling and then return to their
original position. The vibration in a medium produces alternative waves of relatively dense and sparse
particles which are termed as compression and rarefaction respectively. The unwanted or painful sound
is called as noise. The high production machine in all the industrial sectors and high speed vehicles
produces enormous noise. The three elements of noise systems are noise source, noise path and
noise receiver. The reduction of first two elements will control the noise and minimize the sensitivity to
high noise level by the third component which reduces the noise level. Treatment of the noise path is
the simplest and therefore the most common approach to noise problem.
3.2 Architecture and Acoustic
The acoustics in the built environment is normally evaluated on Noise curves and reverberation time
(RT). By employing sound absorption materials as wall and ceiling cladding, the desired NC and RTs
are achieved. The sound absorption materials are rated with sound absorption coefficient, Noise
reduction coefficient (NRC) and sound transmission coefficient (STC). The absorption and transmission
loss are dependent on fiber size, volume of fiber, porosity, air flow resistance, thickness, density,
compression and placement/position of materials. Fiber size, porosity, thickness and density are the
major factors for sound absorption. Sound absorption is inversely proportional to the diameter/width of
the fiber. The sound absorption are commonly measured in three methods 1) reverberation room
method, 2) impedance tube method and 3) Tone burst method. Impedance tube method is widely used
to acoustically rate the materials.
58

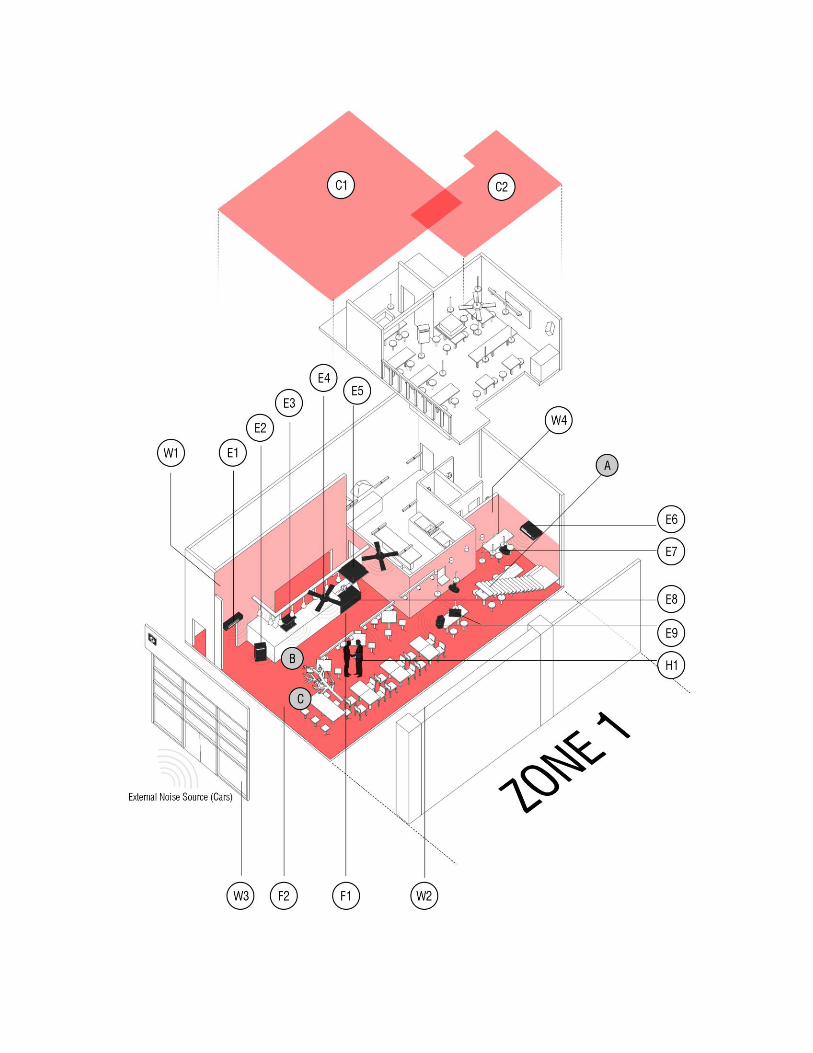
3.4 Ground Eatery Acoustics
3.4.1 External Noise Source
Vehicles
Ground Eatery Cafe locates at the adjacent roadside of Jalan Puteri. Jalan Puteri is one of the
main road with major congestion during peak hours and lunch time. Thereby contributing a lot of
noise. The area is also flooded with restaurants and banks therefore making the place very dense
with pedestrians and working adults around. However Ground Eatery sits comfortably at 5m
beside the major road, increasing the sound traveling distance hence reducing the noise. There is
also a plant barrier which act as a partial sound absorber which helps in aiding reduction of
background sounds. When we are inside the Cafe, we could hardly hear any noise from the car,
another reason to this is also due to the thick curtain glass wall that reflects sound amazingly,
making the atmosphere inside quiet and calm.
66
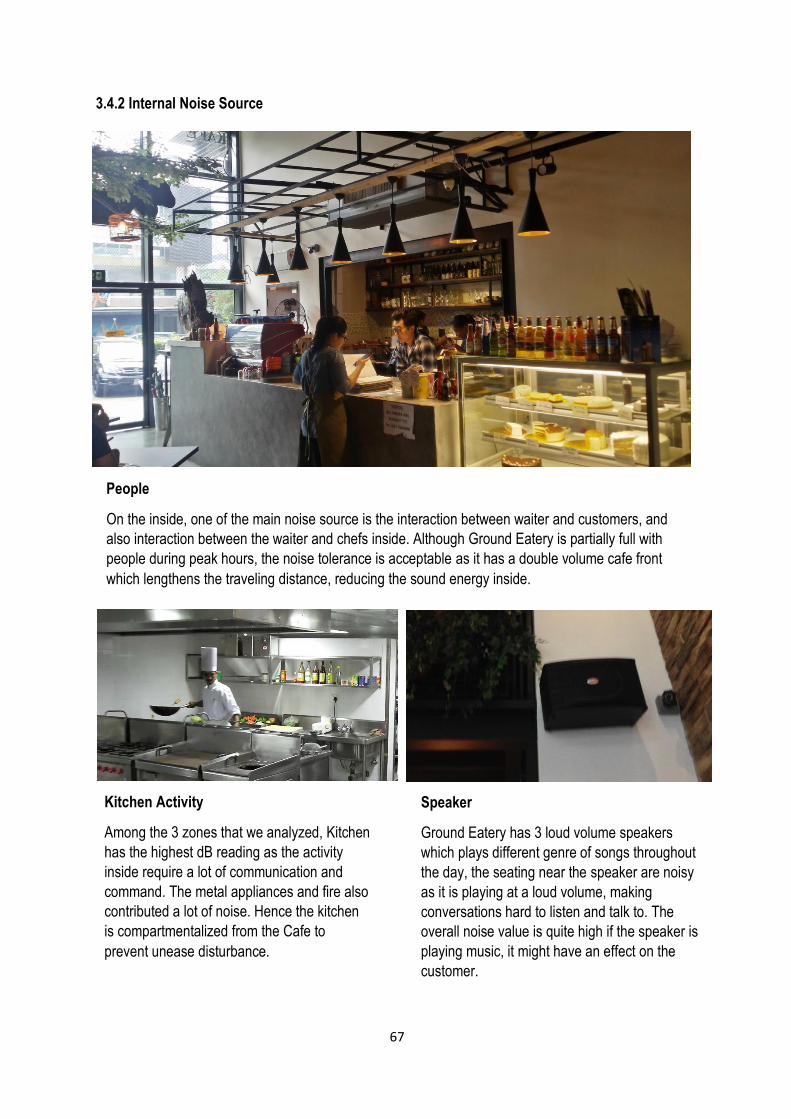
3.4.2 Internal Noise Source
People
On the inside, one of the main noise source is the interaction between waiter and customers, and
also interaction between the waiter and chefs inside. Although Ground Eatery is partially full with
people during peak hours, the noise tolerance is acceptable as it has a double volume cafe front
which lengthens the traveling distance, reducing the sound energy inside.
Kitchen Activity
Among the 3 zones that we analyzed, Kitchen
has the highest dB reading as the activity
inside require a lot of communication and
command. The metal appliances and fire also
contributed a lot of noise. Hence the kitchen
is compartmentalized from the Cafe to
prevent unease disturbance.
Speaker
Ground Eatery has 3 loud volume speakers
which plays different genre of songs throughout
the day, the seating near the speaker are noisy
as it is playing at a loud volume, making
conversations hard to listen and talk to. The
overall noise value is quite high if the speaker is
playing music, it might have an effect on the
customer.
67

3.4.3 Tabulation of Data
68
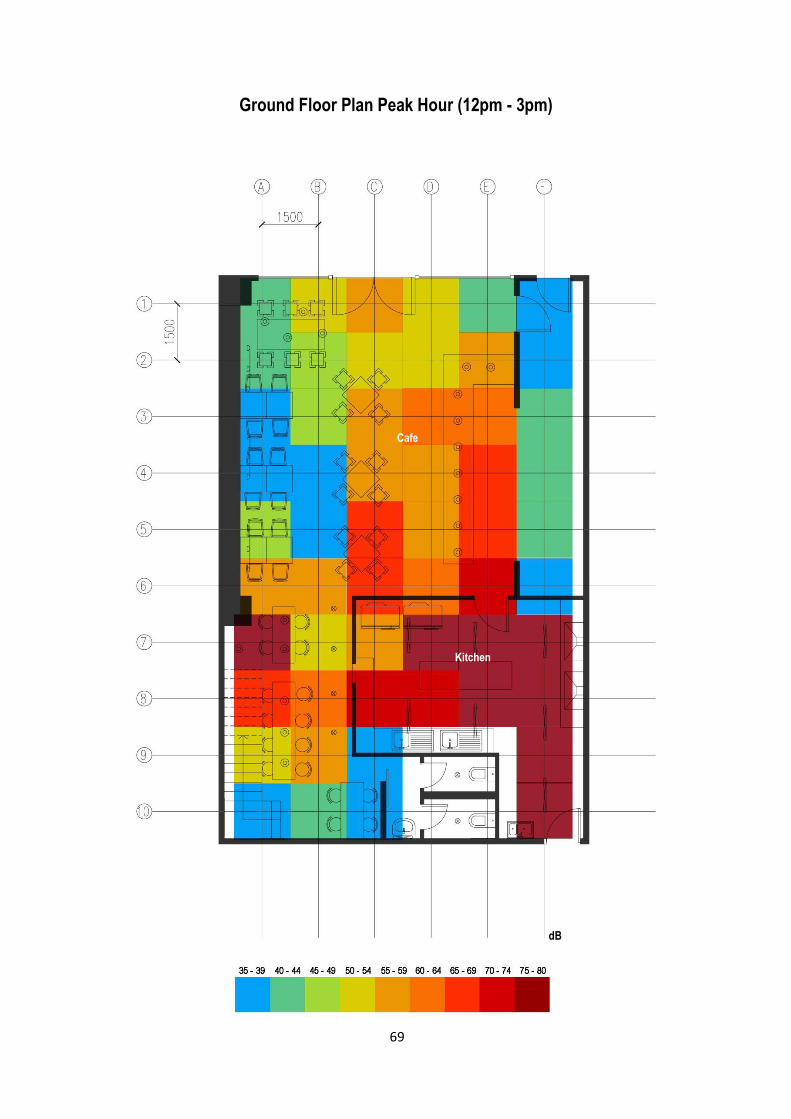
Ground Floor Plan Peak Hour (12pm - 3pm)
dB
Kitchen
Cafe
69
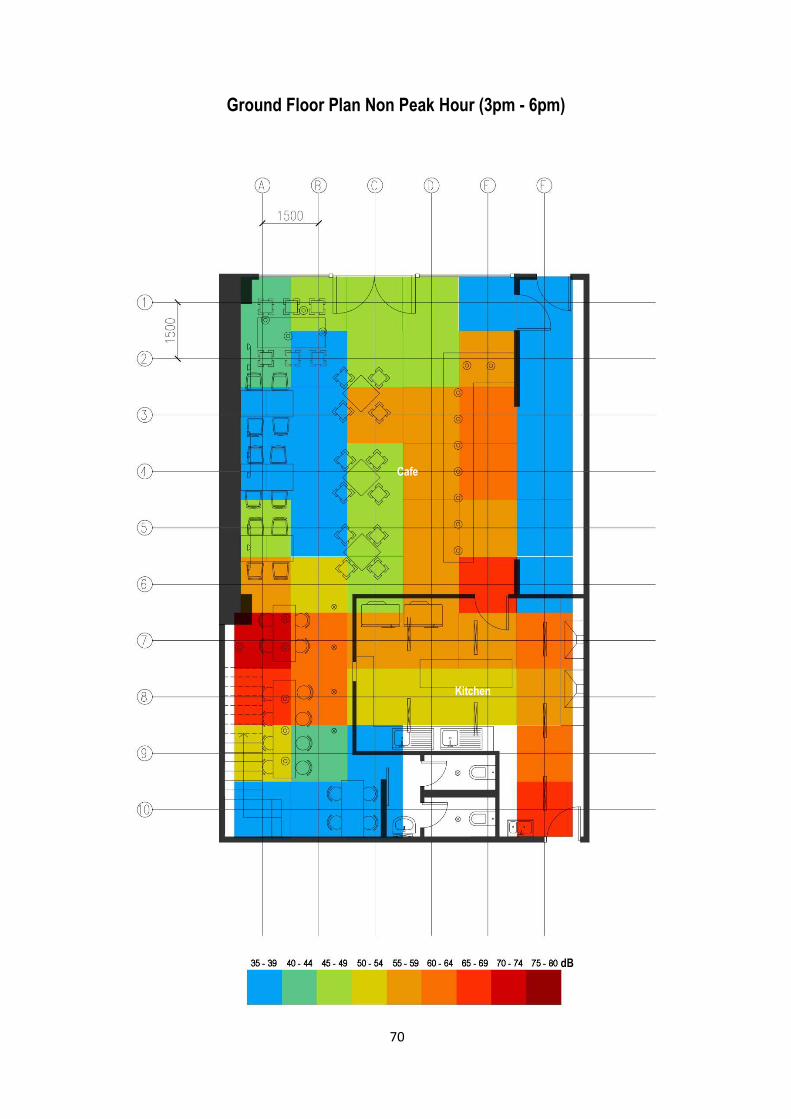
Ground Floor Plan Non Peak Hour (3pm - 6pm)
dB
Cafe
Kitchen
70

First Floor Plan Peak Hour (12pm - 3pm)
dB
Cafe
71

First Floor Plan Non Peak Hour (3pm - 6pm)
dB
72
3.3Precedent Studies
3.3.1Introduction
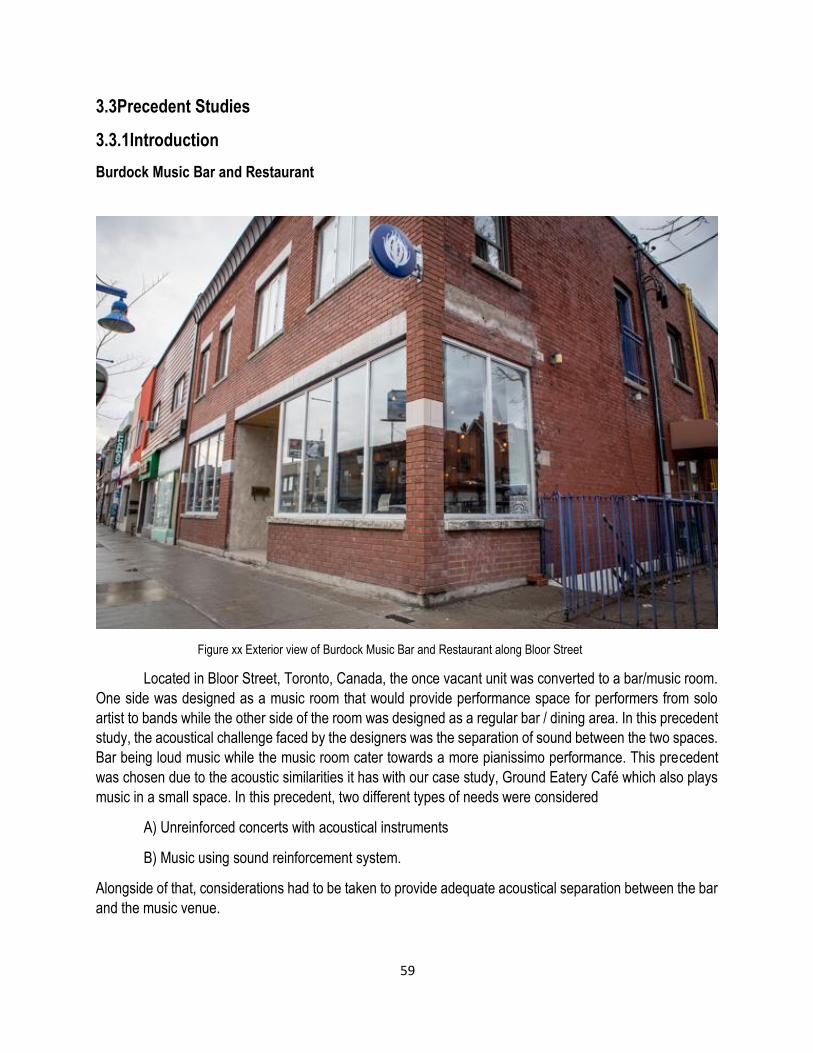
Burdock Music Bar and Restaurant
Figure xx Exterior view of Burdock Music Bar and Restaurant along Bloor Street
Located in Bloor Street, Toronto, Canada, the once vacant unit was converted to a bar/music room.
One side was designed as a music room that would provide performance space for performers from solo
artist to bands while the other side of the room was designed as a regular bar / dining area. In this precedent
study, the acoustical challenge faced by the designers was the separation of sound between the two spaces.
Bar being loud music while the music room cater towards a more pianissimo performance. This precedent
was chosen due to the acoustic similarities it has with our case study, Ground Eatery Café which also plays
music in a small space. In this precedent, two different types of needs were considered
A) Unreinforced concerts with acoustical instruments
B) Music using sound reinforcement system.
Alongside of that, considerations had to be taken to provide adequate acoustical separation between the bar
and the music venue.
59

3.3.2 Methodology
| Large window | Sound lock doors | Music venue | Bar | Stage | Microbrewery |
Figure xx Floor plan of the music venue/bar
The stage area is at the north end of the long and narrow building with the musicians on an elevated platform.
With that in mind, the interior acoustical design on the western side of the building has to cater to sound that
needs amplification.
(a) (b) (c)
Figure xx Diffuser design options (a) Polycylindrical diffusers , (b) 2D random pattern diffuser, (c) Pyramidal diffuser
Due to the narrow and long nature of the space, diffusers were needed to propagate and assist in the
diffusivity of the sound. Heavy valour drapes were also required to be installed over the south window and
behind the stage to prevent echoes from the window and to also add acoustical absorption to the room when
sound amplification is used.
60

Two walls were assembled to separate the music venue and the bar which each being two layers of
drywall about 5/8 inch thick on separate metal studs. The air-gap between the studs were filled with batt
insulation. Besides the walls, the ceiling also has to be in some-way sound proof to separate the spaces from
the apartment above. A membrane system consisting of a 3-layer gypsum board with each layer’s taping
staggered from the adjacent layers while connected to the main slab through resilient hangars were used.
Figure xx Membrane Ceiling details.
By using Baltic birch board for the floating floor used for the stage, diffusers to assist in diffusing the sound,
double dry-walls to separate both venue spaces as well as a membrane ceiling system to separate acoustics
in apartment floors, a music catered space was designed. The space is to not only be separated and sound
proofed to other spaces but to also be able to propagate sound from speakers and sub-woofers in the axis
of the narrow room.
Figure xx The built music room. (a) East wall diffuser, (b) West wall diffuser, (c)
Stage speakers , and (d) Music room looking north.
61

3.3.3 Results
To find out if the acoustic design of the bar-restaurant was successful, 3 sets of measurements were
conducted
(a). Noise reduction between the bar-restaurant and the music room
(b) Ambient measurement within the music room
(c) Impulse response measurements within the music room.
The music venue has to be successful in its separation between the spaces (a) through the separating walls,
(b) through the double doors and (c) through the ceiling. To test this, 3 different sounds were played through
the speaker system at a high 90 to 95dBA level. The sound sequence were then measured in two locations
inside the bar-restaurant as well as at two locations inside the music room as shown in figure below.
Figure xx Noise reduction between bar-restaurant and music room (a) Northside, (b) South side
62

From the Figure xx it is shown that between ASTC ( Apparent Sound Transmission Class) 45 to ASTC 50
noise transmission loss has been provided by the acoustical preparation. The Northern portion provides a
higher transmission loss value compared to the southern portion of the separation. However, while the walls
and ceiling performed as per its design, the sound lock door caused problems due to it being warped as well
as the large window which faces the streets therefore bringing in some traffic noise. Design goals could have
been attained if not for those 2 minor problems.
As for the ambient sound, the background levels were measured inside the music room at the same locations.
Results shown in the figure below:
Figure xx HVAC system sound levels inside the music room
The HVAC (Heating, ventilation and air-conditioning) system was designed with silencers to prevent the
surrounding sound levels from being more than NC-35 ( NC: Noise Criterion Contour). Along the northern
side near the stage, the graph indicates the sound level to be less than or equal to NC-35. However, the
southern portion had a reading of NC-35 and NC-40. This was due to the return air grille due to the high flow
speed. Again, the southern portion of the room performs weaker than the northen side.
63
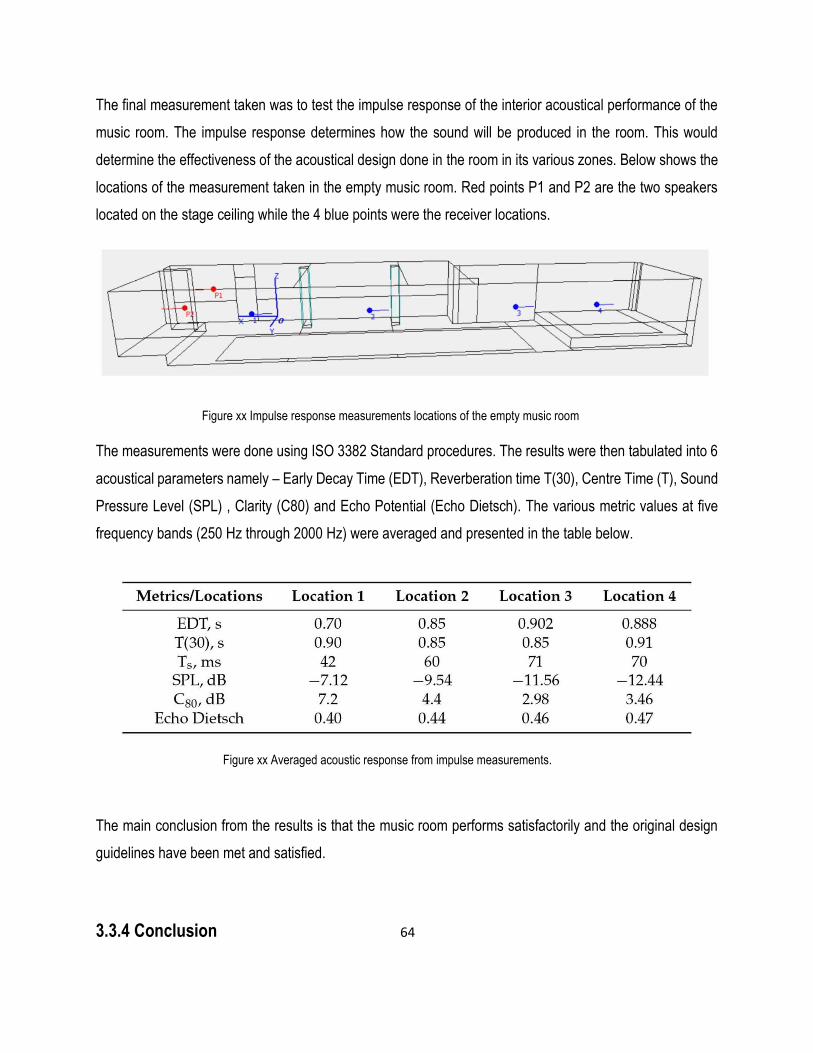
The final measurement taken was to test the impulse response of the interior acoustical performance of the
music room. The impulse response determines how the sound will be produced in the room. This would
determine the effectiveness of the acoustical design done in the room in its various zones. Below shows the
locations of the measurement taken in the empty music room. Red points P1 and P2 are the two speakers
located on the stage ceiling while the 4 blue points were the receiver locations.
Figure xx Impulse response measurements locations of the empty music room
The measurements were done using ISO 3382 Standard procedures. The results were then tabulated into 6
acoustical parameters namely – Early Decay Time (EDT), Reverberation time T(30), Centre Time (T), Sound
Pressure Level (SPL) , Clarity (C80) and Echo Potential (Echo Dietsch). The various metric values at five
frequency bands (250 Hz through 2000 Hz) were averaged and presented in the table below.
Figure xx Averaged acoustic response from impulse measurements.
The main conclusion from the results is that the music room performs satisfactorily and the original design
guidelines have been met and satisfied.
3.3.4 Conclusion 64

Through the various test and measurements, results have shown that the acoustical design done in the
bar/music venue was realized from its concept and managed to meet its original requirements which was to
provide an acoustical separation between 2 spaces. From this precedent study on successful use of acoustic
design in a building, we can further understand the design approaches that can be taken and should be taken
in our case study building if it were to require similar solutions.
The use of diffusers, floating floors, ceiling membranes and drywall filled with batt insulation in the music
venue managed to form a venue that separates both loud and soft music on 2 different sides of the room
while performing well in the aspect of noise reduction, ambient sound levels and the impulse response. While
there are a few problems which caused the results to be slightly skewed, these problems can be easily
addressed by means of replacement.
In relation to our case study; the Ground Eatery Café, speakers were used in the café which would affect the
acoustic design of the building. By understanding and studying this precedent, we now have the means to
further improve the acoustic experience of our case study.
65


Acoustic Analysis
Reverberation Time
Reverberation Time(RT) at 125Hz, 500Hz, 2000Hz
The reverberation time of space refer to the time taken for sound energy to dissipate. Reverberation Time used to
calculate and determine how well a space can function for it intended to use. A reverbaeration is occurred when
a sound is reflected. Different material has different material has different acoustic absorption coefficient in different
frequiences. Table below show the total sound absorption at 125Hz, 500Hz and 2000Hz.
A = S1a1 + S2a2 + S3a3 + … Snan
S = Surface area of material
A = Absorption Coeffiecient of Material
RT = 𝑇 𝑥 𝑉
𝐴
T = Reverberation Time in seconds = 0.16
V = Volume of Space
A = Total Room Absorption
73

125Hz (Zone 1)
Building Element Surface Material Area (m2) Absorption Coefficient SA
Ceiling Concrete Ceiling 45.0 0.01 0.45
Wooden Mezzanine Floor 14.0 0.15 2.1
Floor Polished Concrete Flooring 45.0 0.01 0.45
Porcelain Tile Flooring 22.5 0.01 0.225
Wall Concrete Wall 40.0 0.01 0.4
Brick Wall 75.4 0.02 15.08
Glass Wall 27.0 0.15 4.05
Plaster Concrete Wall 38.0 0.04 1.52
Furniture
Concrete Counter 8.4 0.01 0.084
Wooden Staircase 3.0 0.15 0.45
Wooden Furniture 19.2 0.15 2.88
Air 22.7 0.01 0.227
Total Material Absorption Value 27.916
Human 8 0.18 per person 1.44
Total Absorption (Peak Hour) 29.356
Human 3 0.18 per person 0.54
Total Absorption (Non-Peak Hour) 28.456
Peak Hour
RT = 0.16 𝑥 𝑉
𝐴
= 0.16 𝑥 517
29.356
= 2.61s
Non - Peak Hour
RT = 0.16 𝑥 𝑉
𝐴
The Reverberation Time for Zone 1 in 125Hz of
absorption is 2.61s and 2.91s during peak and non-peak
hour respectively. This has exceeded the standard
comfort of reverberation time for café, which is less than
1.0s.
77

= 0.16 𝑥 517
28.456
= 2.91s
500Hz (Zone 1)
Building Element Surface Material Area (m2) Absorption Coefficient SA
Ceiling Concrete Ceiling 45.0 0.02 0.90
Wooden Mezzanine Floor 14.0 0.10 1.40
Floor Polished Concrete Flooring 45.0 0.02 0.90
Porcelain Tile Flooring 22.5 0.01 0.225
Wall Concrete Wall 40.0 0.02 0.80
Brick Wall 75.4 0.02 15.08
Glass Wall 27.0 0.03 0.81
Plaster Concrete Wall 38.0 0.06 2.28
Furniture
Concrete Counter 8.4 0.02 0.168
Wooden Staircase 3.0 0.10 0.30
Wooden Furniture 19.2 0.15 2.88
Air 22.7 0.01 0.227
Total Material Absorption Value 25.97
Human 8 0.46 per person 3.68
Total Absorption (Peak Hour) 29.65
Human 3 0.46 per person 1.38
Total Absorption (Non-Peak Hour) 27.35
Peak Hour
RT = 0.16 𝑥 𝑉
𝐴
78

= 0.16 𝑥 517
29.65
= 2.78s
Non - Peak Hour
RT = 0.16 𝑥 𝑉
𝐴
= 0.16 𝑥 517
27.35
= 3.02s
2000Hz (Zone 1)
Building Element Surface Material Area (m2) Absorption Coefficient SA
Ceiling Concrete Ceiling 45.0 0.05 2.25
Wooden Mezzanine Floor 14.0 0.06 0.84
Floor Polished Concrete Flooring 45.0 0.02 0.9
Porcelain Tile Flooring 22.5 0.04 0.9
Wall Concrete Wall 40.0 0.05 2.0
Brick Wall 75.4 0.02 15.08
Glass Wall 27.0 0.03 0.81
Plaster Concrete Wall 38.0 0.04 1.52
Furniture
Concrete Counter 8.4 0.05 0.42
Wooden Staircase 3.0 0.06 0.18
Wooden Furniture 19.2 0.10 1.92
Air 22.7 0.01 0.227
Total Material Absorption Value 27.09
Human 8 0.51 per person 4.08
Total Absorption (Peak Hour) 31.17
79
The Reverberation Time for Zone 1 in 500Hz of
absorption is 2.78s and 3.02s during peak and non-peak
hour respectively. This has exceeded the standard
comfort of reverberation time for café, which is less than
1.0s.

Human 3 0.51 per person 1.53
Total Absorption (Non-Peak Hour) 28.62
Peak Hour
RT = 0.16 𝑥 𝑉
𝐴
= 0.16 𝑥 517
31.17
= 2.65s
Non - Peak Hour
RT = 0.16 𝑥 𝑉
𝐴
= 0.16 𝑥 517
28.62
= 2.89s
The Reverberation Time for Zone 1 in 2000Hz of
absorption is 2.65s and 2.89s during peak and non-peak
hour respectively. This has exceeded the standard
comfort of reverberation time for café, which is less than
1.0s.
80

125Hz (Zone 2)
Building Element Surface Material Area (m2) Absorption Coefficient SA
Ceiling Concrete Ceiling 29.6 0.01 0.296
Floor Kitchen Floor Tiles 29.6 0.01 0.296
Wall Plaster Wall 58.5 0.04 2.34
Furniture Metallic Kitchen Appliances 11.5 0.1 1.15
Door Solid Timber Door 1.8 0.14 0.252
Total Material Absorption Value 4.334
Human 4 0.18 per person 0.72
Total Absorption (Peak Hour) 5.054
Human 0 0.46 per person 0.0
Total Absorption (Non-Peak Hour) 4,334
Peak Hour
RT = 0.16 𝑥 𝑉
𝐴
= 0.16 𝑥 107
5.054
= 3.38s
Non - Peak Hour
RT = 0.16 𝑥 𝑉
𝐴
= 0.16 𝑥 107
4.334
= 3.95s
The Reverberation Time for Zone 2 in 125Hz of
absorption is 3.38s and 3.95s during peak and non-peak
hour respectively. This has exceeded the standard
comfort of reverberation time for café, which is less than
1.0s.
83
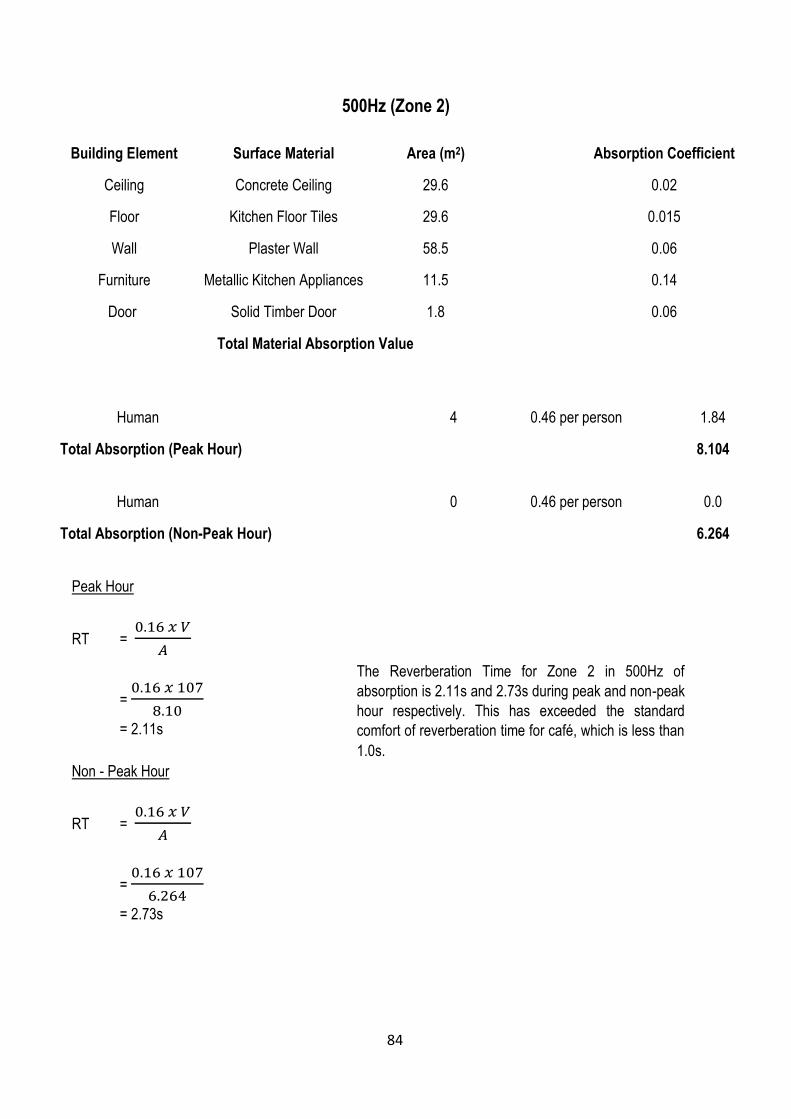
500Hz (Zone 2)
Building Element Surface Material Area (m2) Absorption Coefficient SA
Ceiling Concrete Ceiling 29.6 0.02 0.592
Floor Kitchen Floor Tiles 29.6 0.015 0.444
Wall Plaster Wall 58.5 0.06 3.51
Furniture Metallic Kitchen Appliances 11.5 0.14 1.61
Door Solid Timber Door 1.8 0.06 0.108
Total Material Absorption Value 6.264
Human 4 0.46 per person 1.84
Total Absorption (Peak Hour) 8.104
Human 0 0.46 per person 0.0
Total Absorption (Non-Peak Hour) 6.264
Peak Hour
RT = 0.16 𝑥 𝑉
𝐴
= 0.16 𝑥 107
8.10
= 2.11s
Non - Peak Hour
RT = 0.16 𝑥 𝑉
𝐴
= 0.16 𝑥 107
6.264
= 2.73s
The Reverberation Time for Zone 2 in 500Hz of
absorption is 2.11s and 2.73s during peak and non-peak
hour respectively. This has exceeded the standard
comfort of reverberation time for café, which is less than
1.0s.
84

2000Hz (Zone 2)
Building Element Surface Material Area (m2) Absorption Coefficient SA
Ceiling Concrete Ceiling 29.6 0.05 1.48
Floor Kitchen Floor Tiles 29.6 0.02 0.592
Wall Plaster Wall 58.5 0.04 2.34
Furniture Metallic Kitchen Appliances 11.5 0.10 1.15
Door Solid Timber Door 1.8 0.10 0.18
Total Material Absorption Value 5.742
Human 4 0.51 per person 2.04
Total Absorption (Peak Hour) 7.782
Human 0 0.46 per person 0.0
Total Absorption (Non-Peak Hour) 5.742
Peak Hour
RT = 0.16 𝑥 𝑉
𝐴
= 0.16 𝑥 107
7.782
= 2.19s
Non - Peak Hour
RT = 0.16 𝑥 𝑉
𝐴
= 0.16 𝑥 107
5.742
= 2.98s
The Reverberation Time for Zone 2 in 2000Hz of
absorption is 2.19s and 2.98s during peak and non-peak
hour respectively. This has exceeded the standard
comfort of reverberation time for café, which is less than
1.0s.
85
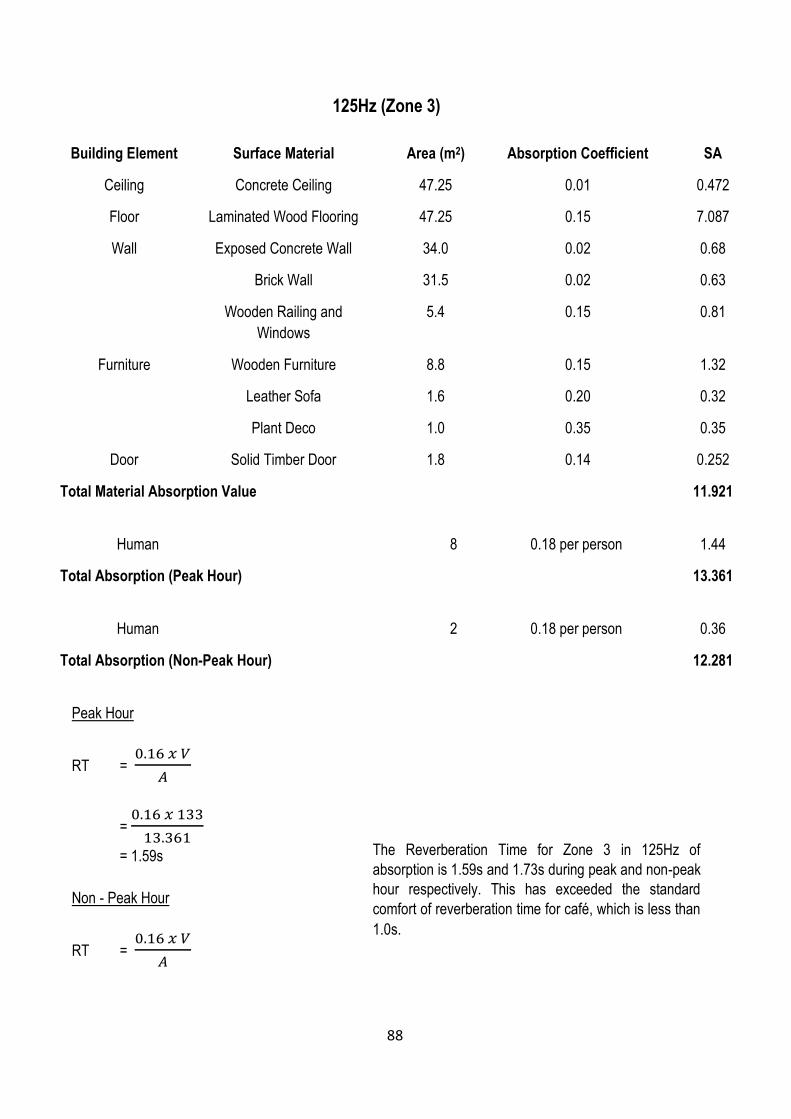
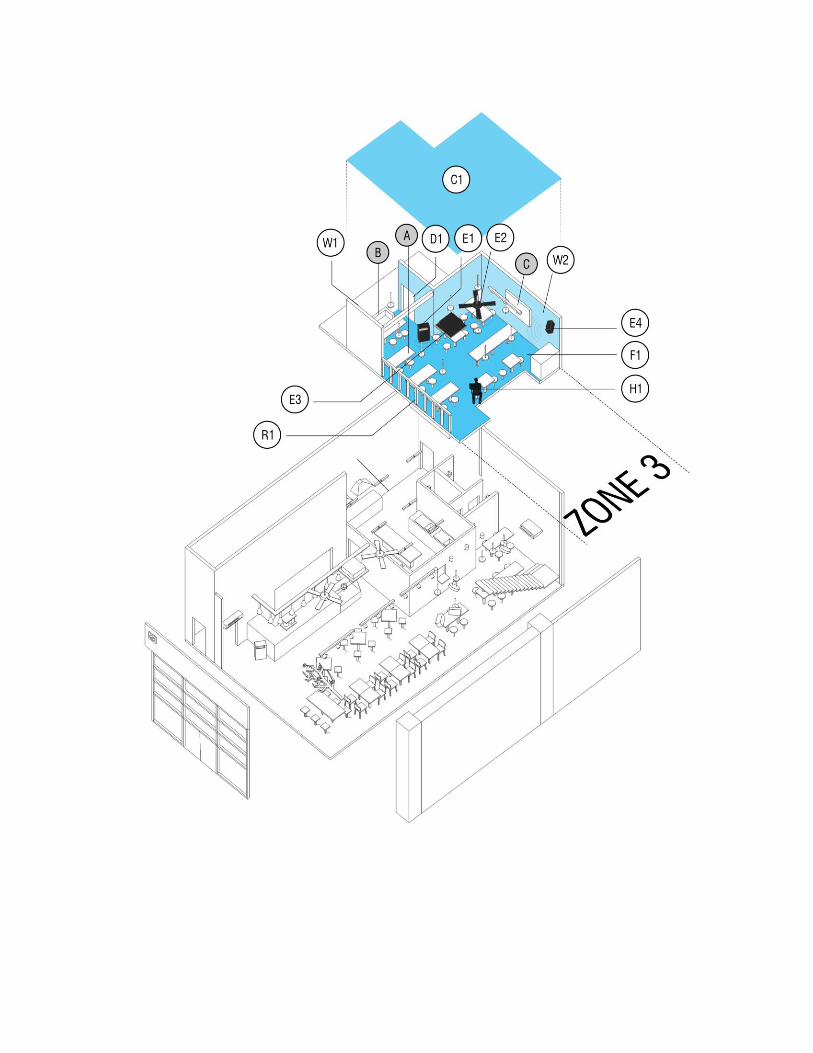
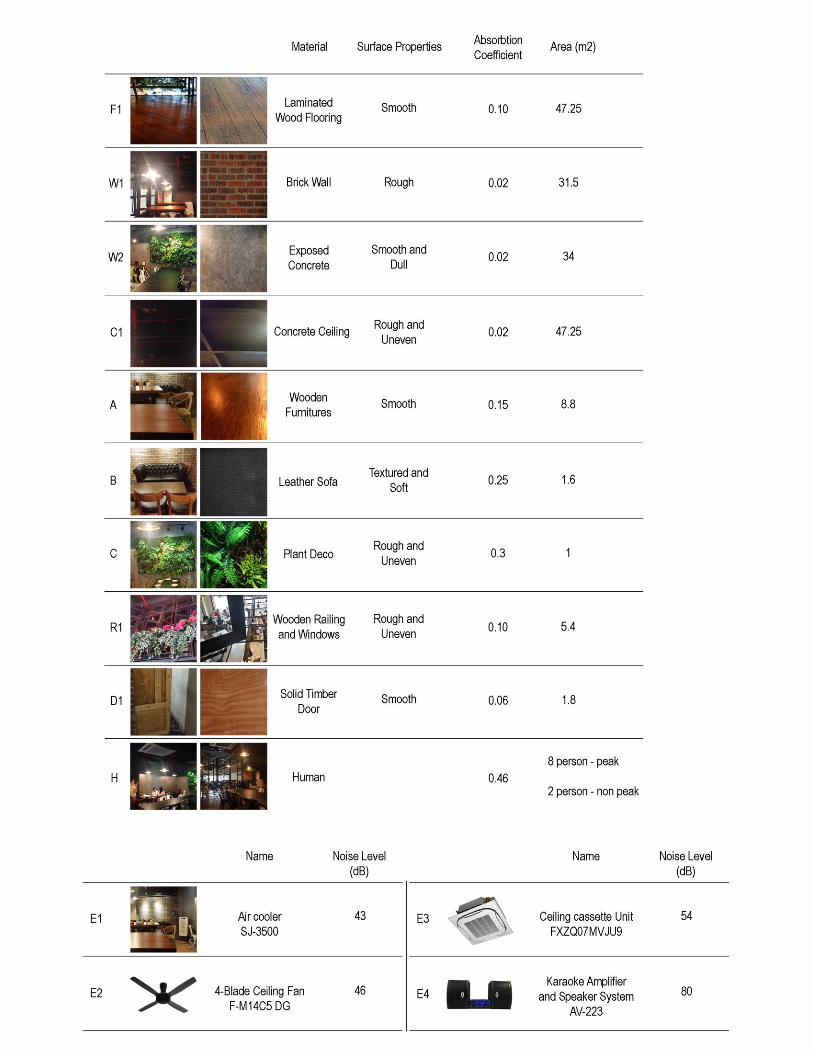
125Hz (Zone 3)
Building Element Surface Material Area (m2) Absorption Coefficient SA
Ceiling Concrete Ceiling 47.25 0.01 0.472
Floor Laminated Wood Flooring 47.25 0.15 7.087
Wall Exposed Concrete Wall 34.0 0.02 0.68
Brick Wall 31.5 0.02 0.63
Wooden Railing and
Windows
5.4 0.15 0.81
Furniture
Wooden Furniture 8.8 0.15 1.32
Leather Sofa 1.6 0.20 0.32
Plant Deco 1.0 0.35 0.35
Door Solid Timber Door 1.8 0.14 0.252
Total Material Absorption Value 11.921
Human 8 0.18 per person 1.44
Total Absorption (Peak Hour) 13.361
Human 2 0.18 per person 0.36
Total Absorption (Non-Peak Hour) 12.281
Peak Hour
RT = 0.16 𝑥 𝑉
𝐴
= 0.16 𝑥 133
13.361
= 1.59s
Non - Peak Hour
RT = 0.16 𝑥 𝑉
𝐴
The Reverberation Time for Zone 3 in 125Hz of
absorption is 1.59s and 1.73s during peak and non-peak
hour respectively. This has exceeded the standard
comfort of reverberation time for café, which is less than
1.0s.
88

= 0.16 𝑥 133
12.281
= 1.73s
500Hz (Zone 3)
Building Element Surface Material Area (m2) Absorption Coefficient SA
Ceiling Concrete Ceiling 47.25 0.02 0.945
Floor Laminated Wood Flooring 47.25 0.10 4.725
Wall Exposed Concrete Wall 34.0 0.02 0.68
Brick Wall 31.5 0.02 0.63
Wooden Railing and
Windows
5.4 0.10 0.54
Furniture
Wooden Furniture 8.8 0.15 1.32
Leather Sofa 1.6 0.25 0.4
Plant Deco 1.0 0.3 0.3
Door Solid Timber Door 1.8 0.06 0.108
Total Material Absorption Value 9.648
Human 8 0.46 per person 3.68
Total Absorption (Peak Hour) 13.328
Human 2 0.46 per person 0.92
Total Absorption (Non-Peak Hour) 10.568
Peak Hour
RT = 0.16 𝑥 𝑉
𝐴
= 0.16 𝑥 133
13.328
= 1.59s
Non - Peak Hour
89
The Reverberation Time for Zone 3 in 500Hz of
absorption is 1.59s and 2.01s during peak and non-peak
hour respectively. This has exceeded the standard
comfort of reverberation time for café, which is less than
1.0s.

RT = 0.16 𝑥 𝑉
𝐴
= 0.16 𝑥 133
10.568
= 2.01s
2000Hz (Zone 3)
Building Element Surface Material Area (m2) Absorption Coefficient SA
Ceiling Concrete Ceiling 47.25 0.05 2.363
Floor Laminated Wood Flooring 47.25 0.06 2.835
Wall Exposed Concrete Wall 34.0 0.04 1.36
Brick Wall 31.5 0.02 0.63
Wooden Railing and
Windows
5.4 0.06 0.324
Furniture
Wooden Furniture 8.8 0.10 0.88
Leather Sofa 1.6 0.2 0.32
Plant Deco 1.0 0.3 0.3
Door Solid Timber Door 1.8 0.10 0.18
Total Material Absorption Value 9.192
Human 8 0.51 per person 4.08
Total Absorption (Peak Hour) 13.272
Human 2 0.51 per person 1.02
Total Absorption (Non-Peak Hour) 10.212
Peak Hour
RT = 0.16 𝑥 𝑉
𝐴
= 0.16 𝑥 133
13.272
The Reverberation Time for Zone 3 in 2000Hz of
absorption is 1.60s and 2.08s during peak and non-peak
hour respectively. This has exceeded the standard
comfort of reverberation time for café, which is less than
1.0s.
90

= 1.60s
Non - Peak Hour
RT = 0.16 𝑥 𝑉
𝐴
= 0.16 𝑥 133
10.212
= 2.08s
91
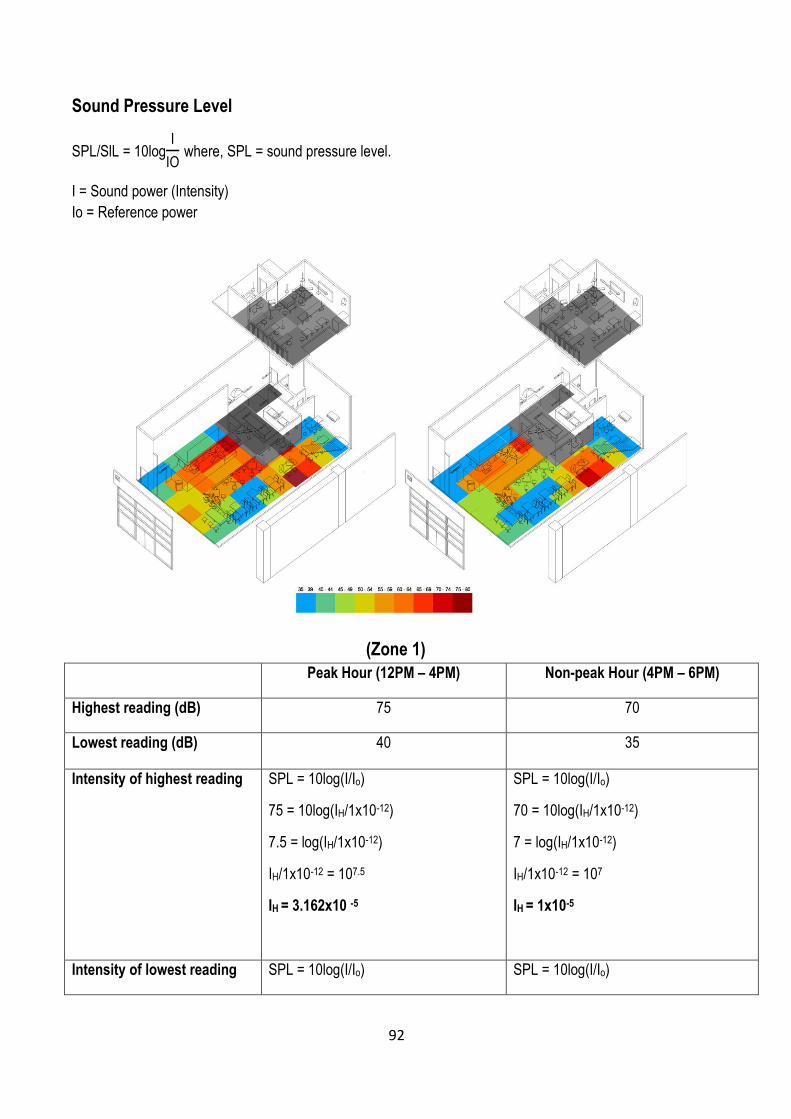
Sound Pressure Level
SPL/SlL = 10logI
IO where, SPL = sound pressure level.
I = Sound power (Intensity)
Io = Reference power
(Zone 1)
Peak Hour (12PM – 4PM) Non-peak Hour (4PM – 6PM)
Highest reading (dB) 75 70
Lowest reading (dB) 40 35
Intensity of highest reading SPL = 10log(I/Io)
75 = 10log(IH/1x10-12)
7.5 = log(IH/1x10-12)
IH/1x10-12 = 107.5
IH = 3.162x10 -5
SPL = 10log(I/Io)
70 = 10log(IH/1x10-12)
7 = log(IH/1x10-12)
IH/1x10-12 = 107
IH = 1x10⁻⁵
Intensity of lowest reading SPL = 10log(I/Io) SPL = 10log(I/Io)
92

40 = 10log(IL/1x10-12)
4.0 = log(IL/1x10-12)
IL/1x10-12 = 104
IL = 1 x 10⁻⁸
35 = 10log(IL/1x10-12)
3.5 = log(IL/1x10-12)
IL/1x10-12 = 103.5
IL = 3.162 x 10⁻⁹
Total intensity T = 3.162 x 10⁻⁵ + 1x 10-8
= 3.163 x 10⁻⁵
T = 1x10⁻⁵ + 3.162 x 10-9
= 1.00 x 10⁻⁵
Sound pressure level SPL = 10log(I/Io)
SPL = 10log(3.163x10⁻⁵/1x10-12)
SPL = 75.58dB
SPL = 10log(I/Io)
SPL = 10log(1.00x10⁻⁵/1x10-12)
SPL = 70dB
The sound intensity level data calculated have show during peak hour is 75.58dB and non-peak hour is only
70dB. The sound intensity level between peak hour and non- peak hour is no much different is because zone 1
is near the outside area and bar area much influence by this two factor.
93

(Zone 2)
Peak Hour (12PM – 4PM) Non-peak Hour (4PM – 6PM)
Highest reading (dB) 79 69
Lowest reading (dB) 72 52
Intensity of highest reading SPL = 10log(I/Io)
79 = 10log(IH/1x10-12)
7.9 = log(IH/1x10-12)
IH/1x10-12 = 107.9
IH = 7.943 x 10⁻⁵
SPL = 10log(I/Io)
69 = 10log(IH/1x10-12)
6.9 = log(IH/1x10-12)
IH/1x10-12 = 106.9
IH = 7.943 x 10⁻⁶
Intensity of lowest reading SPL = 10log(I/Io)
72 = 10log(IL/1x10-12)
7.2 = log(IL/1x10-12)
IL/1x10-12 = 107.2
IL = 1.584 x 10⁻⁵
SPL = 10log(I/Io)
52 = 10log(IL/1x10-12)
5.2 = log(IL/1x10-12)
IL/1x10-12 = 105.2
IL = 1.584 x 10⁻⁷
94
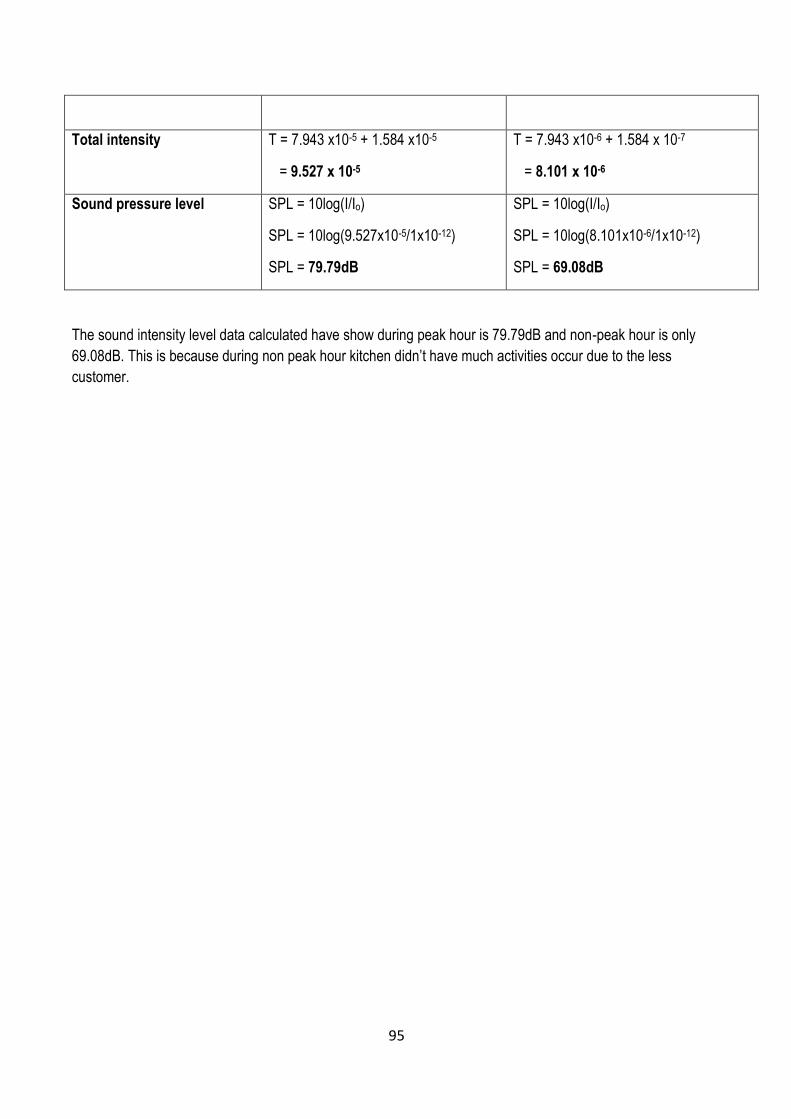
Total intensity T = 7.943 x10⁻⁵ + 1.584 x10-5
= 9.527 x 10⁻⁵
T = 7.943 x10⁻⁶ + 1.584 x 10-7
= 8.101 x 10⁻⁶
Sound pressure level SPL = 10log(I/Io)
SPL = 10log(9.527x10⁻⁵/1x10-12)
SPL = 79.79dB
SPL = 10log(I/Io)
SPL = 10log(8.101x10⁻⁶/1x10-12)
SPL = 69.08dB
The sound intensity level data calculated have show during peak hour is 79.79dB and non-peak hour is only
69.08dB. This is because during non peak hour kitchen didn’t have much activities occur due to the less
customer.
95

(Zone 3)
Peak Hour (12PM – 4PM) Non-peak Hour (4PM – 6PM)
Highest reading (dB) 70 55
Lowest reading (dB) 35 35
Intensity of highest reading SPL = 10log(I/Io)
70 = 10log(IL/1x10-12)
7 = log(IL/1x10-12)
IL/1x10-12 = 107
IL = 1x10⁻⁵
SPL = 10log(I/Io)
55 = 10log(IH/1x10-12)
5.5 = log(IH/1x10-12)
IH/1x10-12 = 105.5
IH = 3.162 x 10⁻⁷
Intensity of lowest reading SPL = 10log(I/Io)
35 = 10log(IL/1x10-12)
3.5 = log(IL/1x10-12)
IL/1x10-12 = 103.5
SPL = 10log(I/Io)
35 = 10log(IL/1x10-12)
3.5 = log(IL/1x10-12)
IL/1x10-12 = 103.5
96
IL = 3.162 x 10⁻⁹
IL = 3.162 x 10⁻⁹
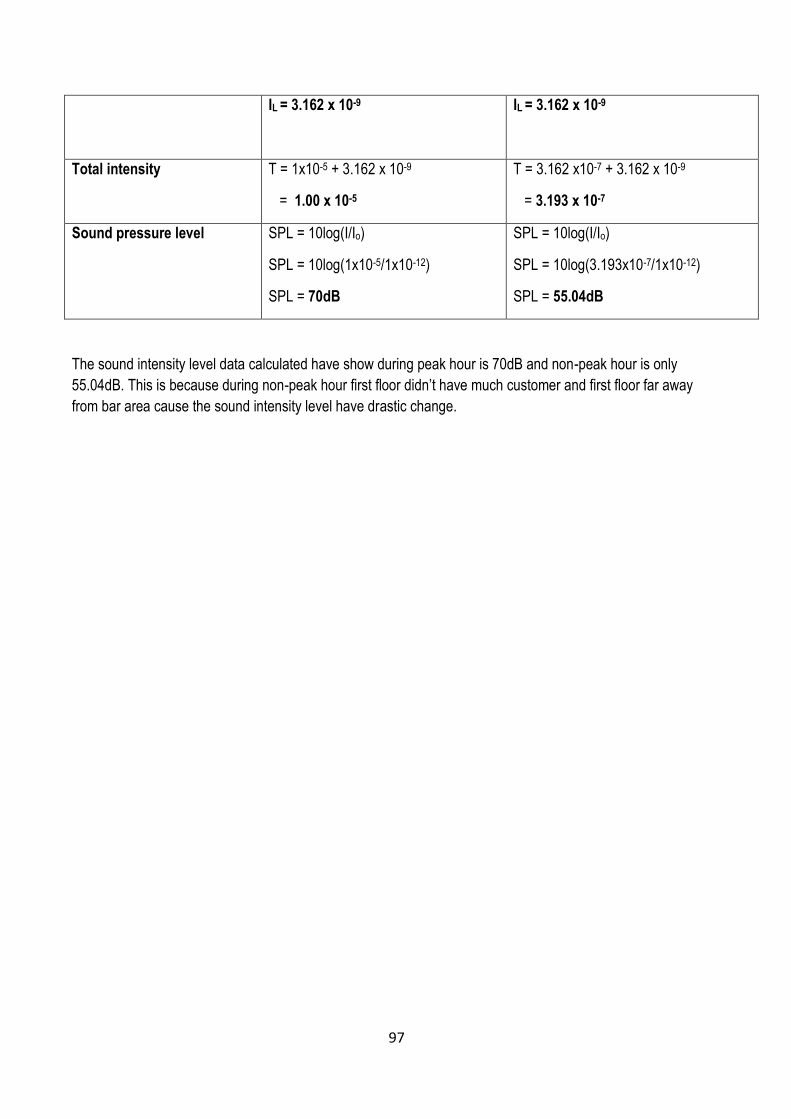
Total intensity T = 1x10⁻⁵ + 3.162 x 10-9
= 1.00 x 10⁻⁵
T = 3.162 x10⁻⁷ + 3.162 x 10-9
= 3.193 x 10⁻⁷
Sound pressure level SPL = 10log(I/Io)
SPL = 10log(1x10⁻⁵/1x10-12)
SPL = 70dB
SPL = 10log(I/Io)
SPL = 10log(3.193x10⁻⁷/1x10-12)
SPL = 55.04dB
The sound intensity level data calculated have show during peak hour is 70dB and non-peak hour is only
55.04dB. This is because during non-peak hour first floor didn’t have much customer and first floor far away
from bar area cause the sound intensity level have drastic change.
97
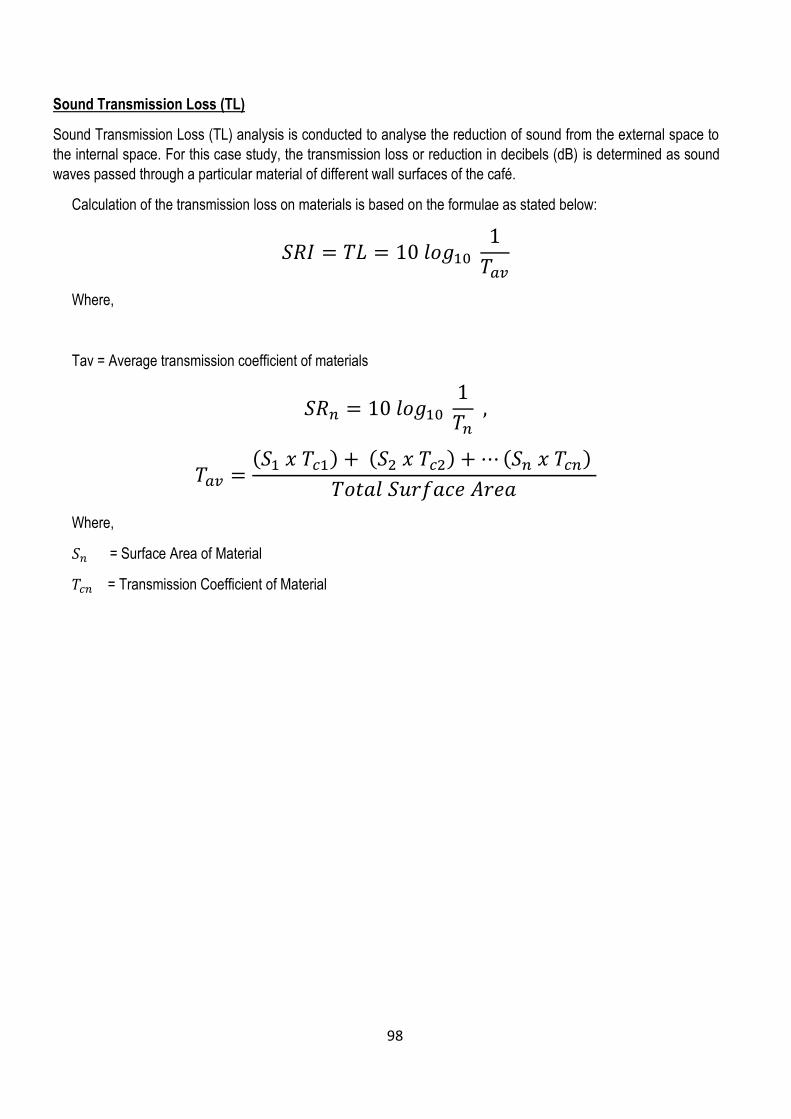
Sound Transmission Loss (TL)
Sound Transmission Loss (TL) analysis is conducted to analyse the reduction of sound from the external space to
the internal space. For this case study, the transmission loss or reduction in decibels (dB) is determined as sound
waves passed through a particular material of different wall surfaces of the café.
Calculation of the transmission loss on materials is based on the formulae as stated below:
𝑆𝑅𝐼 = 𝑇𝐿 = 10 𝑙𝑜𝑔10 1
𝑇𝑎𝑣
Where,
Tav = Average transmission coefficient of materials
𝑆𝑅𝑛 = 10 𝑙𝑜𝑔10 1
𝑇𝑛 ,
𝑇𝑎𝑣 =(𝑆1 𝑥 𝑇𝑐1) + (𝑆2 𝑥 𝑇𝑐2) + ⋯ (𝑆𝑛 𝑥 𝑇𝑐𝑛)
𝑇𝑜𝑡𝑎𝑙 𝑆𝑢𝑟𝑓𝑎𝑐𝑒 𝐴𝑟𝑒𝑎
Where,
𝑆𝑛 = Surface Area of Material
𝑇𝑐𝑛 = Transmission Coefficient of Material
98
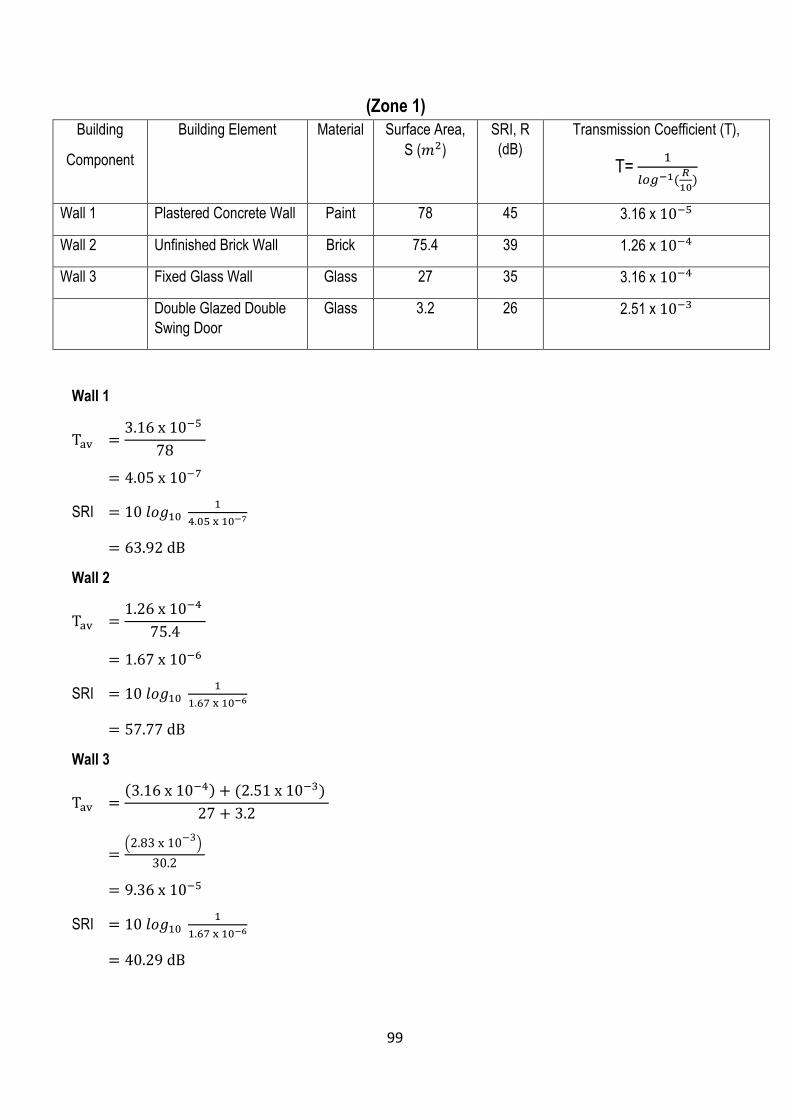
(Zone 1)
Building
Component
Building Element Material Surface Area,
S (𝑚2)
SRI, R
(dB)
Transmission Coefficient (T),
T= 1
𝑙𝑜𝑔−1(𝑅
10)
Wall 1 Plastered Concrete Wall Paint 78 45 3.16 x 10⁻⁵
Wall 2 Unfinished Brick Wall Brick 75.4 39 1.26 x 10⁻⁴
Wall 3 Fixed Glass Wall Glass 27 35 3.16 x 10⁻⁴
Double Glazed Double
Swing Door
Glass 3.2 26 2.51 x 10⁻³
Wall 1
Tav =3.16 x 10⁻⁵
78
= 4.05 x 10⁻⁷
SRI = 10 𝑙𝑜𝑔10 1
4.05 x 10−7
= 63.92 dB
Wall 2
Tav =1.26 x 10⁻⁴
75.4
= 1.67 x 10⁻⁶
SRI = 10 𝑙𝑜𝑔10 1
1.67 x 10−6
= 57.77 dB
Wall 3
Tav =(3.16 x 10⁻⁴) + (2.51 x 10⁻³)
27 + 3.2
=(2.83 x 10⁻³
)
30.2
= 9.36 x 10⁻⁵
SRI = 10 𝑙𝑜𝑔10 1
1.67 x 10−6
= 40.29 dB
99

(Zone 2)
Building
Component
Building Element Material Surface Area,
S (𝑚2)
SRI, R
(dB)
Transmission Coefficient (T),
T= 1
𝑙𝑜𝑔−1(𝑅
10)
Wall 1 Plastered Concrete Wall Paint 58.5 45 3.16 x 10⁻⁵
Wall 1
Tav =3.16 x 10⁻⁵
58.5
= 5.41 x 10⁻⁷
SRI = 10 𝑙𝑜𝑔10 1
5.41 x 10−7
= 62.67 dB
100
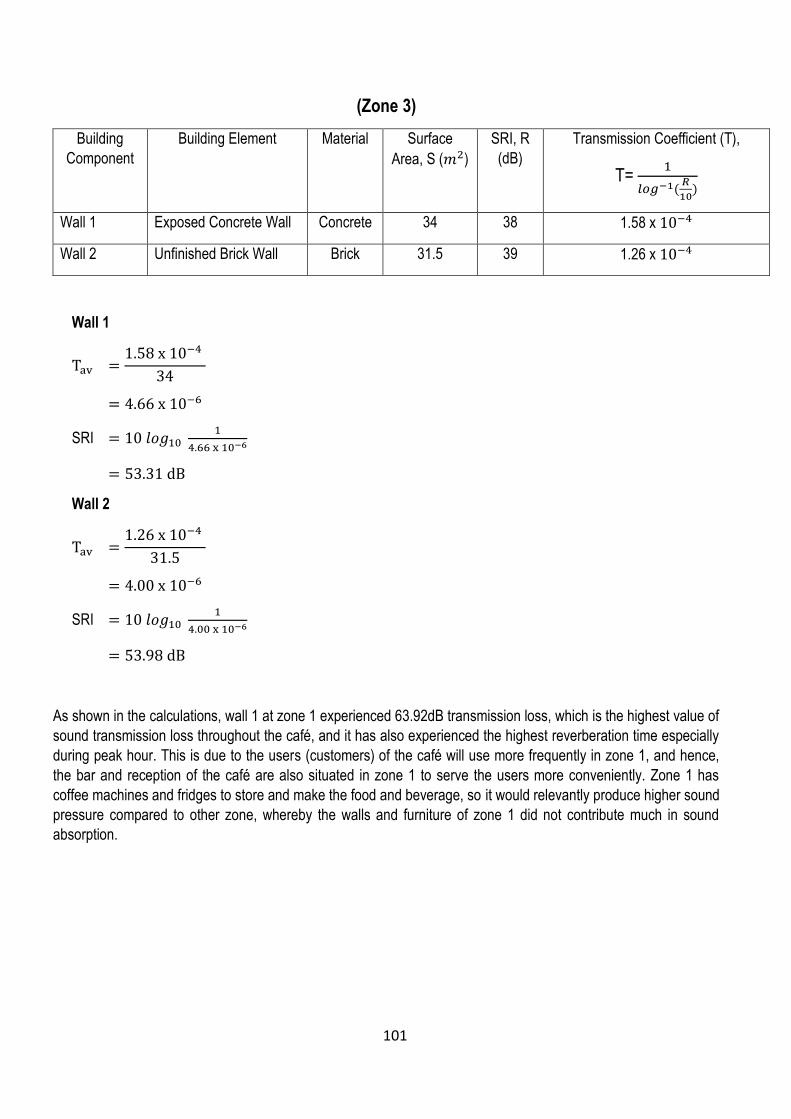
(Zone 3)
Building
Component
Building Element Material Surface
Area, S (𝑚2)
SRI, R
(dB)
Transmission Coefficient (T),
T= 1
𝑙𝑜𝑔−1(𝑅
10)
Wall 1 Exposed Concrete Wall Concrete 34 38 1.58 x 10⁻⁴
Wall 2 Unfinished Brick Wall Brick 31.5 39 1.26 x 10⁻⁴
Wall 1
Tav =1.58 x 10⁻⁴
34
= 4.66 x 10⁻⁶
SRI = 10 𝑙𝑜𝑔10 1
4.66 x 10−6
= 53.31 dB
Wall 2
Tav =1.26 x 10⁻⁴
31.5
= 4.00 x 10⁻⁶
SRI = 10 𝑙𝑜𝑔10 1
4.00 x 10−6
= 53.98 dB
As shown in the calculations, wall 1 at zone 1 experienced 63.92dB transmission loss, which is the highest value of
sound transmission loss throughout the café, and it has also experienced the highest reverberation time especially
during peak hour. This is due to the users (customers) of the café will use more frequently in zone 1, and hence,
the bar and reception of the café are also situated in zone 1 to serve the users more conveniently. Zone 1 has
coffee machines and fridges to store and make the food and beverage, so it would relevantly produce higher sound
pressure compared to other zone, whereby the walls and furniture of zone 1 did not contribute much in sound
absorption.
101

Reference
1. Cavanough, William J. & Wikes, Joseph A. (1998). Architectural Acoustics: Principles and Practice.
New
York, Wiley and Sons.
2. Madan, M., Johnson, J. & Jorge, R. (1999). Architectural Acoustics: Principles and Design. USA,
Prentice-Hall, Inc.
3.Ginn.M. 1978 Architectural Acoustics. Retrieved November 5, 2016, from
https://www.bksv.com/media/doc/bn1329.pdf
4. McMullan, R. 1991. Noise Control in Buildings. Oxford. BSP Professional Books.
5.Edwards.L & Torcellini.P(2016). A Literature Review of the Effects of Natural Light on Building
Occupants. Retrieved November 4, 2016, from http://www.nrel.gov/docs/fy02osti/30769.pdf
6. Fontenelle.C.V .The importance of lighting to the experience of architecture. (2008).
Retrieved November 5, 2016, from https://www.kth.se/polopoly_fs/1.176688!/Menu/general/column-
content/attachment/1 Ciro Fontenelle -Lighting_in_architecture.pdf
7.Schiler, M. (1992). Simplified Design of Building Lighting. New York: John Wiley & Sons.
8. McMullan, R. 1998. Environmental Science in Buildings. 4th. ed. Basingstoke: McMillan.