building outstanding - ip group plc/media/files/i/ip-group-v2/documents/investor... · ip group plc...
TRANSCRIPT

23002-04 Proof 8a 01-04-14
Annual Report and Accounts for the year ended 31 December 2013Stock Code: IPO
IP G
rou
p p
lc An
nu
al Re
po
rt and
Acco
un
ts 20
13
Buildingoutstandingbusinesses

For further information within
this document
Additional information online at:
www.ipgroupplc.com
23002-04 Proof 8a 01-04-14
Welcome to IP Group
IP Group plc develops intellectual property-based businesses
IP Group’s purpose is to systematically help create, build and support outstanding intellectual property-based businesses in order to provide attractive returns for our shareholders and other stakeholders.We provide our portfolio companies with financial capital from our balance sheet and also from funds that we manage on behalf of others. Critically, in addition to financial capital, we provide a range of support services to our portfolio companies, including executive search and recruitment, corporate finance and capital raising, legal, accounting, company secretarial, strategic expertise and consultancy.
We pioneered the concept of a long-term partnership model with universities and have arrangements covering a number of the UK’s leading research-intensive universities, as well as initial partnerships in the US.
Our strategic objectives
• To build and maintain a pipeline of compelling intellectual property-based opportunities
• To develop these opportunities into a diversified portfolio of robust businesses
• To grow our assets and those we manage on behalf of third parties
• To deliver attractive financial returns from our assets
Investor website
We maintain a corporate website at www.ipgroupplc.com containing a wide variety of information of interest to institutional and private investors, including latest news, press releases, annual reports and further information on our portfolio companies.
Getting around the report
Disclaimer: This Annual Report and Accounts may contain forward-looking statements. These statements reflect the Board’s current view, are subject to a number of material risks and uncertainties and could change in the future. Factors that could cause or contribute to such changes include, but are not limited to, the general economic climate and market conditions, as well as specific factors relating to the financial or commercial prospects or performance of individual companies within the Group’s portfolio. Further details can be found in the Risk management section on pages 32 to 37.
Throughout this Annual Report and Accounts, the Group’s holdings in portfolio companies reflect the undiluted beneficial equity interest excluding debt, unless otherwise explicitly stated.
23002-04 Proof 8a 01-04-14
Stock Code: IPO www.ipgroupplc.com 01
Stra
teg
ic R
epo
rt O
verv
iew
Strategic Report
Overview
Highlights 01
Chairman’s statement 02
Our Business & Strategy
Business model 04
Marketplace 06
Our portfolio at a glance 08
Strategy 10
Our Performance
Operational review 12
Portfolio review 14
Financial review 27
Key performance indicators 30
Risk Management 32
Our Governance
Overview
Board of Directors 38
Corporate governance 40
Sustainability 50
Committee Reports
Directors’ Remuneration Report 53
Report of the Audit Committee 71
Other Statutory
Directors’ report 74
Statement of Directors’ Responsibilities 76
Our Financials
Independent auditor’s report 77
Group Primary Statements
Consolidated statement of comprehensive income 80
Consolidated statement of financial position 81
Consolidated statement of cash flows 82
Consolidated statement of changes in equity 83
Group Notes
Notes to the consolidated financial statements 84
Company Statements
Company balance sheet 108
Notes to the financial statements 109
Company information 112
What’s inside
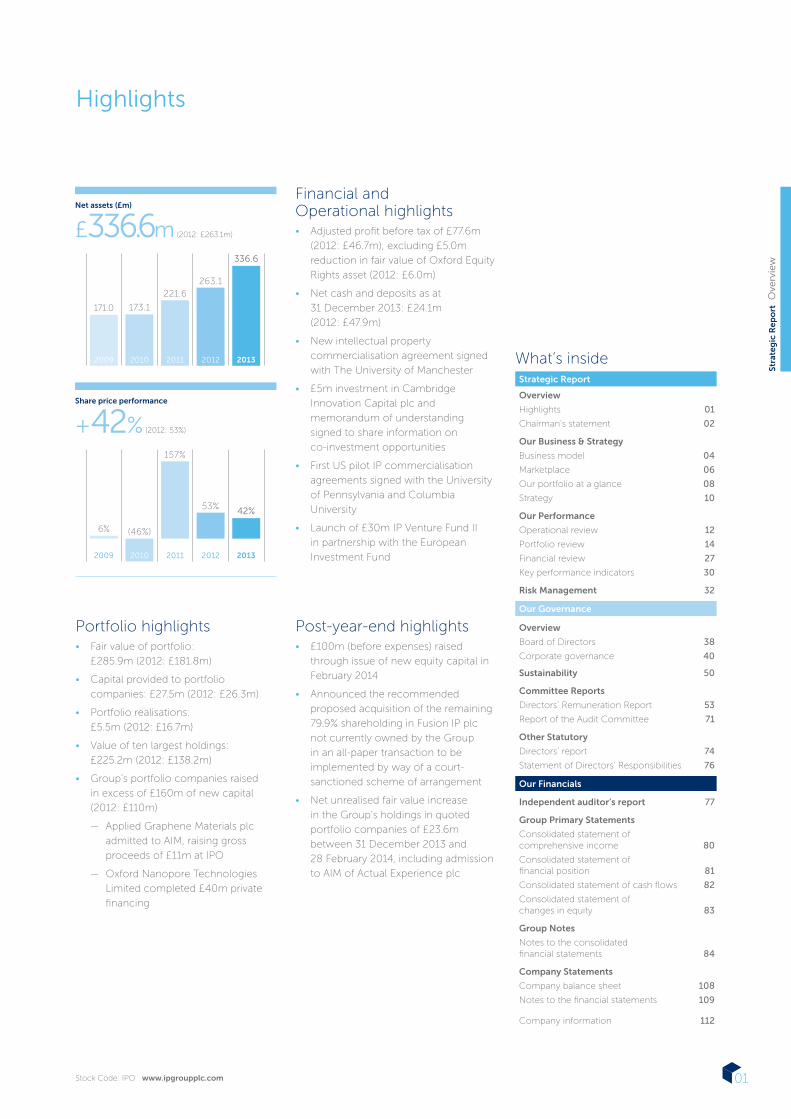
Highlights
Portfolio highlights• Fair value of portfolio:
£285.9m (2012: £181.8m)
• Capital provided to portfolio
companies: £27.5m (2012: £26.3m)
• Portfolio realisations:
£5.5m (2012: £16.7m)
• Value of ten largest holdings:
£225.2m (2012: £138.2m)
• Group’s portfolio companies raised
in excess of £160m of new capital
(2012: £110m)
— Applied Graphene Materials plc
admitted to AIM, raising gross
proceeds of £11m at IPO
— Oxford Nanopore Technologies
Limited completed £40m private
financing
Post-year-end highlights• £100m (before expenses) raised
through issue of new equity capital in
February 2014
• Announced the recommended
proposed acquisition of the remaining
79.9% shareholding in Fusion IP plc
not currently owned by the Group
in an all-paper transaction to be
implemented by way of a court-
sanctioned scheme of arrangement
• Net unrealised fair value increase
in the Group’s holdings in quoted
portfolio companies of £23.6m
between 31 December 2013 and
28 February 2014, including admission
to AIM of Actual Experience plc
Net assets (£m)
£336.6m (2012: £263.1m)
2013
336.6
2012
263.1
2011
221.6
2010
173.1
2009
171.0
Share price performance
+42% (2012: 53%)
2013
42%
2012
53%
2011
157%
2010
(46%)
2009
6%
Financial and Operational highlights• Adjusted profit before tax of £77.6m
(2012: £46.7m), excluding £5.0m
reduction in fair value of Oxford Equity
Rights asset (2012: £6.0m)
• Net cash and deposits as at
31 December 2013: £24.1m
(2012: £47.9m)
• New intellectual property
commercialisation agreement signed
with The University of Manchester
• £5m investment in Cambridge
Innovation Capital plc and
memorandum of understanding
signed to share information on
co-investment opportunities
• First US pilot IP commercialisation
agreements signed with the University
of Pennsylvania and Columbia
University
• Launch of £30m IP Venture Fund II
in partnership with the European
Investment Fund

23002-04 Proof 8a 01-04-14
Stra
teg
ic R
ep
ort
Ove
rvie
w
IP Group plc Annual Report and Accounts for the year ended 31 December 201302
Chairman’s statement
The Group’s financial performance
in 2013 was the strongest since its
formation in 2001. The overall value of
our holdings in portfolio companies has
significantly increased and this has led to
net assets, excluding intangibles and the
Oxford Equity Rights asset, increasing to
£315.5m (2012: £236.6m), representing
33% growth. In income terms, the Group
recorded an adjusted profit before tax of
£77.6m excluding the £5.0m reduction
in the value of the Oxford Equity Rights
asset (2012: £46.7m profit; £6.0m
reduction). Whilst both 2012 and 2013
have seen a very positive performance,
it remains important for our shareholders
to note that, due to the long-term
nature of the Group’s business, profits
and especially cash realisations can vary
significantly from year to year.
The Group has continued to support its
portfolio companies by both providing
capital from its balance sheet and
managed funds, and assisting them in
sourcing further capital from a variety
of sources. There continues to be a
comparatively low number of investors
seeking to deploy significant capital
into early-stage technology business
although the environment has been more
favourable in recent times, particularly
in the public markets. Looking at the
AIM market, for example, capital raised
through primary and secondary issues
increased by nearly 25% in 2013 to
£3.9bn, although this remains significantly
below the £16bn levels seen in 2006
and 2007. Our portfolio companies fared
well in this regard, raising approximately
£160m of capital during the year (2012:
£110m). We were also pleased to
announce the launch of our £30m IP
Venture Fund II in partnership with the
EIF which will provide additional capital
for the development of our new spin-out
companies.
I am pleased to report that 2013 has been a year of strong performance for IP Group which has resulted in a significant increase in the value of the Group’s portfolio and its net assets.
Building on this success we also made two significant announcements in early 2014. First we completed an equity capital raise that, due to significant demand from new and existing shareholders, was increased in size to £100m (before expenses) and, second, we reached agreement on the terms of a recommended offer to acquire the remaining 79.9% of Fusion IP plc not already owned by the Group. The latter is subject to a scheme of arrangement and we anticipate that the transaction will complete in late March, creating a business with an enlarged specialised team, access to IP from 15 of the UK’s, and two of the US’s, top research universities, a portfolio with a value in excess of £300m and approximately £140m of cash.Dr Bruce Smith Chairman
A successful year: our strongest ever set of results

23002-04 Proof 8a 01-04-14
Stock Code: IPO www.ipgroupplc.com 03
Stra
teg
ic R
epo
rt O
verv
iew
Another important element of the
Group’s model is its access to world-class
commercialisable intellectual property
through the formation of long-term
relationships across a wide pool of
research institutions. Having announced
our new proof of concept partnership
with the University of Manchester in
early 2013, we were pleased to be able
to announce the expansion of this
relationship in January 2014 to include
graphene projects and the extension
of its term to 2019. During the year we
also agreed to take an 8% equity holding
in Cambridge Innovation Capital plc
(“CIC”) as part of its £50m fundraising.
CIC will support the growth of innovative
businesses in the “Cambridge Cluster”
and, through our memorandum of
understanding, we have agreed to
share information on co-investment
opportunities in this region. It should
also be noted that the Group’s original
contract with Oxford’s Department of
Chemistry expires at the end of 2015
although our access to innovation
from Oxford’s Institute for Biomedical
Engineering runs until 2023. Outside of
the UK, we announced two exciting new
relationships with East Coast Ivy League
universities in the US, Columbia University
and The University of Pennsylvania. We
look forward to working with academics
and staff from our new partners, as well
as with those universities with whom we
already have significant track records, to
identify backable commercial IP.
The Group’s Board has seen three
changes since my 2012 statement. Firstly,
I am very pleased to be able to welcome
Professor Lynn Gladden to the Board.
Professor Gladden, currently Pro-Vice-
Chancellor for Research for the University
of Cambridge, has an impeccable track
record in academia as well as extensive
experience in industry, a combination
highly relevant to the Group’s business
model. Secondly, as previously
announced, during the year Dr Alison
Fielding and Professor Graham Richards
stepped down from the Group’s Board,
in the case of Dr Fielding for personal
reasons and in the case of Professor
Richards because the length of his tenure
as a non-executive director meant that he
was no longer regarded as independent
from a governance perspective. I am
pleased to report that Dr Fielding and
Professor Richards both remain with the
Group on a part-time basis in roles that
are enabling the Group to continue to
leverage their significant expertise.
The Group’s success in the last twelve
months would have been impossible
without the contributions of many
people and, as always, I am proud of and
thankful for these efforts. I would also
like to formally note my thanks to the
Group’s stakeholders, particularly for the
overwhelming support from shareholders
for the Group’s capital raising that we
completed in February. I would also
like to extend a warm welcome to the
staff from Fusion IP plc, who, assuming
our recommended offer completes as
anticipated in March 2014, will all be
offered positions within the IP Group
team. David Baynes, Fusion IP’s CEO,
and Doug Liversidge, its Chairman, are
proposed additions to the Group’s Board
upon completion as executive director
and non-executive director respectively.
We look forward to working together
effectively to identify and develop the
most exciting spin-outs from across all of
our partner universities.
The sector in which the Group operates,
namely IP commercialisation, appears
to be gaining further attention with a
number of new entrants being seen in
the market in 2013. Several companies
or funds raised capital with the explicit
intention of seeking to develop spin-out
companies from universities in the UK, as
well as in the US and other countries. I
believe that this asset class will continue
to develop and no doubt the Group will
support spin-out companies alongside
some of these new entrants; as may
be the case under the memorandum
of understanding that we have with
Cambridge Innovation Capital plc,
alongside our 8% equity holding. I also
believe that the Group’s track record and
expertise in its field, coupled with its long-
term university partnerships and strong
balance sheet, leaves it well placed to
continue to generate significant value for
shareholders over the long term.
Dr Bruce SmithChairman3 March 2014
“I am very impressed
with IP Group’s business
model from an investee company
perspective. IP Group offers Ceres
Power its support across the board.
As well as access to the investment
community and its long-term view
on the business, what is great is its
team in London. They have fields
of expertise that small companies
don’t have, they understand
the business and offer advice,
knowledge and support whilst
allowing the management team to
deliver.“
Richard Preston, Finance Director Ceres Power Holdings plc
Testimonial:
Business Building
23002-04 Proof 8a 01-04-14
IP Group plc Annual Report and Accounts for the year ended 31 December 201304
Stra
teg
ic R
ep
ort
Ou
r B
usi
ness
& S
trat
eg
y
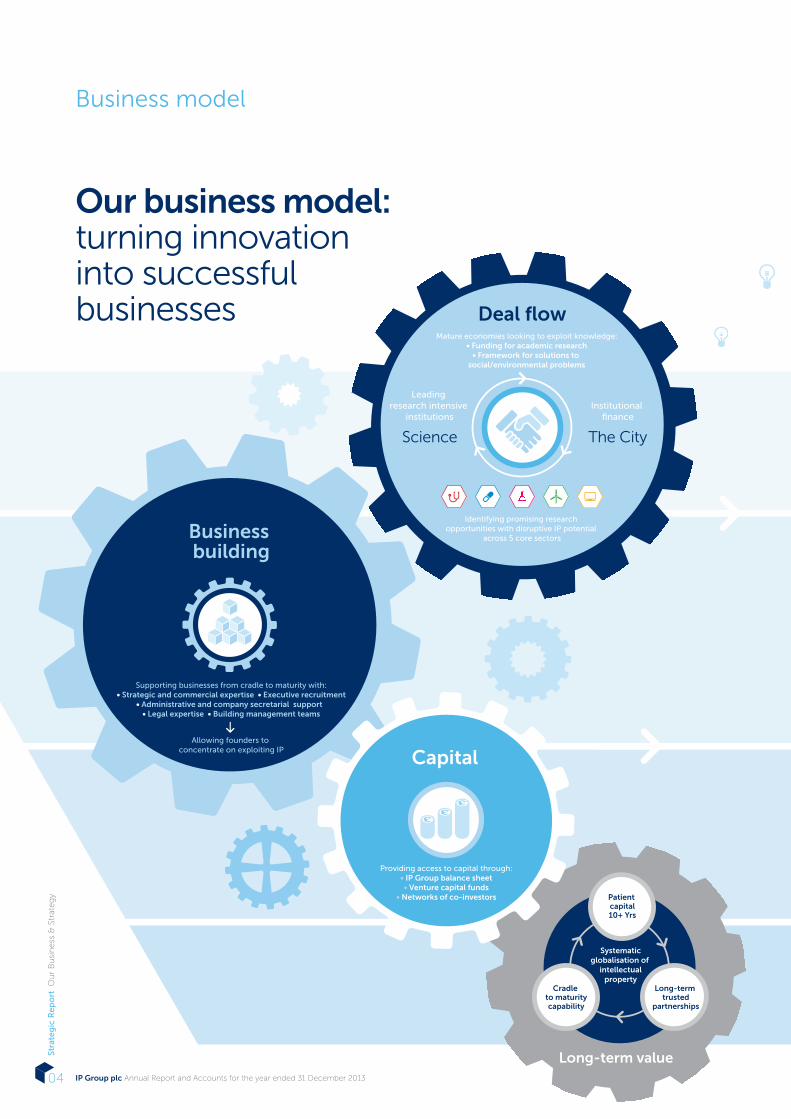
Business model
The CityScience
Leading research intensive
institutions
Deal flow
Identifying promising research opportunities with disruptive IP potential
across 5 core sectors
Institutional finance
Mature economies looking to exploit knowledge:• Funding for academic research
• Framework for solutions to social/environmental problems
Long-term value
Patient capital10+ Yrs
Long-term trusted
partnerships
Systematicglobalisation of
intellectualproperty
Cradle to maturitycapability
Supporting businesses from cradle to maturity with:• Strategic and commercial expertise • Executive recruitment
• Administrative and company secretarial support • Legal expertise • Building management teams
Allowing founders to concentrate on exploiting IP
Business building
Providing access to capital through:• IP Group balance sheet• Venture capital funds
• Networks of co-investors
Capital
Our business model: turning innovation into successful businesses

23002-04 Proof 8a 01-04-14
Stock Code: IPO www.ipgroupplc.com 05
Stra
teg
ic R
epo
rt O
ur
Bu
sin
ess
& S
trat
eg
y
Deal flow– pipeline of potentially disruptive commercialisable intellectual property
An important aspect of IP Group’s strategy is its ability to access a wide range of leading scientific research. This has been
achieved primarily through long-term partner relationships with a number of leading research universities in the UK. Recently the
Group announced that it had expanded its access to intellectual property beyond the UK to the US. The Group’s specialist in-
house sourcing team works with our partners, as well as academics from other universities and research institutions, to identify
and pursue compelling opportunities arising from these institutions and to create and build businesses around this research.
Capital– access to sources of capital to finance businesses as they develop
IP Group provides long-term capital for the development of its portfolio companies from its own balance sheet. In addition, IP Group
has an FCA-regulated venture capital fund management subsidiary, Top Technology Ventures (“TTV”), which specialises in providing
funding for early stage technology businesses. TTV currently manages three funds: IP Venture Fund (“IPVF”), IP Venture Fund II L.P.
(“IPVFII”) and the Finance for Business North East Technology Fund (“NETF”) which, subject to investment guidelines, can provide
further additional sources of capital to the Group’s portfolio companies. In addition, TTV and the Group work with a wide network of
co-investors that can provide further capital alongside the Group.
Read our testimonial on page 28
Business Building– a rigorous and systematic approach to opportunity appraisal, development and business building
During the early stages of an opportunity’s development, members of the Group’s team work closely with its founders to help shape
its strategic direction, often taking an interim management role until such time as the business reaches a sufficient stage of maturity
and has the resources to recruit a full external leadership team.
IP Group utilises its in-house executive search consultancy, IP Exec, to recruit experienced and high-calibre individuals to lead
its developing businesses alongside founders and the Group team members, who continue to provide strategic guidance in an
executive or non-executive capacity. Further, IP Group, through its in-house division, IP Impact, has developed a series of innovative
programmes that, by working with the CEOs and boards of portfolio companies, seek to help accelerate company growth.
The Group also provides operational, legal, business and company secretarial support to its companies with a view to minimising the
most common administrative factors that can contribute to early-stage company failure.
Read our testimonials on pages 03 and 13
Long-term value– systematic commercialisation of intellectual property
IP Group seeks to form, or assist in the formation of, spin-out companies based on scientific innovation, to take a significant minority
equity stake in those spin-out companies and then to grow the value of that equity over time through taking an active role in spin-
out company development. IP Group’s approach has been to build significant minority equity stakes across a diversified portfolio of
companies designed to achieve strong equity returns over the medium to long term.

23002-04 Proof 8a 01-04-14
IP Group plc Annual Report and Accounts for the year ended 31 December 201306
Stra
teg
ic R
ep
ort
Ou
r B
usi
ness
& S
trat
eg
y
Marketplace
Current economic climateAlthough there are some signs of
recovery in parts of the global economy,
the overall environment remains
uncertain and volatile. We have seen only
low levels of GDP growth in Eurozone
countries and sustained recovery is not
yet assured. However, all of the six largest
Eurozone economies recorded quarterly
expansions in the final quarter of 2013
for the first time in three years and the
UK economy is forecast to grow faster
than any other major European economy
in 2014. Good growth is also expected
in the US where an increasing number
of the Group’s underlying portfolio
companies operate.
University research landscapeAn important aspect of IP Group’s
strategy is an ability to access a wide
range of leading scientific research. This
has been achieved primarily through
long-term partner relationships with a
number of leading research universities
in the UK and other collaborative
arrangements.
The UK has long held a leading position
in the global research landscape. It is
home to some of the oldest and most
prestigious learned societies in the
sciences and has produced a number of
the outstanding scientific breakthroughs
of the last millennium. As a research
nation, the UK continues to “punch
above its weight” as most recently set
out in a 2013 report prepared for the UK’s
Department of Business, Innovation and
Skills (“BIS”). A summary of some of the
key data from this report is set out in the
table above right, which highlights the
UK’s global pedigree, with 16% of the
world’s most highly cited publications
being generated by a nation with less
than 1% of the world’s total population
and only 4% of the world’s researchers.
MeasureUK % of
totalWorld-
ranking
Number of
researchers3.9% 6
Scientific
publications6.4% 3
Cited publications 11.6% 3
Highly cited
publications15.9% 2
Source: Report “International Comparative Performance of the UK Research Base – 2013”
The most recent Research Assessments
Exercise (the “RAE”), undertaken in 2008,
analysed the quality of research carried
out in UK research institutions. The RAE
ranked each university by reference to
the number of Category A researchers
at such universities (broadly defined as
someone who devotes the majority of his
or her time to research) and measured
the overall quality of the research
emanating from each of these
The landscape: IP Group offers more than traditional venture capital
2001 IP Group established
Agreement with Chemistry Department, University of Oxford
2002 Signs agreement with University of Southampton
Signs agreement with University of Leeds
2003 IP Group floats on AIM
Signs agreement with King’s College, London
Signs agreement with CNAP, University of York
2004 Acquires 19.9% stake in Techtran
Acquires Top Technology Ventures
Synairgen plc floats on AIM
OHM plc floats on AIM
Summit plc floats on AIM
2005 Acquires Techtran in full
Signs agreement with University of Bristol
Proximagen plc & Getech Group plc float on AIM
2006 IP Group joins Official List of LSE from AIM; raises c. £17m
Signs agreements with universities of Surrey, Glasgow, Bath, York & QMUL
Velocys plc, Avacta Group plc, Evocutis plc float on AIM
Launch of IP Venture Fund
2007 Modern Water plc floats on AIM
Oxford Advanced Surfaces Group plc floats on AIM
Tracsis plc floats on AIM
Green Chemicals plc floats on PLUS Markets (now ISDX)
£112m £335m £898mMARKET CAPITALISATION AIM admission
O�cial List admissionDate of report

23002-04 Proof 8a 01-04-14
Stock Code: IPO www.ipgroupplc.com 07
Stra
teg
ic R
epo
rt O
ur
Bu
sin
ess
& S
trat
eg
yinstitutions. Through its partnerships
and other collaborative relationships,
the Group has access to opportunities
based on intellectual property generated
at 15 of the UK’s highest-ranked research
universities.
Outside of the UK, the Group has pilot
agreements with two of the eight Ivy
League universities in the north-eastern
United States.
IP Group’s approach to commercialisationTo understand IP Group’s business model,
it is important to differentiate it from
the more traditional approach to the
provision of “venture” capital to early-
stage businesses, which has tended to
have been provided through fixed-life
(typically ten year duration) funds to
start-up businesses with existing
management teams.
In contrast, IP Group offers far more
to its businesses than just capital,
with a much greater involvement in
providing its companies with access to
early-stage business-building expertise,
interim executive support, technical and
commercial networks and senior team
recruitment and development. The Group
also provides operational, legal, business
and company secretarial support to its
companies with a view to minimising the
most common administrative factors that
can contribute to early-stage company
failure. Further, the majority of capital
provided by IP Group is not structured
through fixed-life funds.
The 2012 British Venture Capital
Association (“BVCA”) performance survey
highlighted that the average return for
post-dot com bubble (2002 onwards)
traditionally structured venture funds was
3.6% IRR (% p.a.). The median Total Value
To Paid In Capital (“TVPI”) ratio for 2002
onwards venture funds was 0.79× (i.e.
the total value generated by the fund is
79% of capital paid in) with the top decile
performance being 1.61×.
In contrast, the broadly equivalent
measure for a gross TVPI ratio for the
Group as at 31 December 2013 was 2.7×
capital invested, suggesting the Group’s
differentiated approach can generate
above average returns.
Competitive landscapeThere are, however, a number of other
companies and organisations seeking to
commercialise intellectual property and/
or provide capital to spin-out companies
from universities and research intensive
institutions in the UK. Since the Kay
Review in 2012 and the government’s
response to it highlighted the importance
of supporting innovative business over the
longer term, the number of organisations
operating in this sector has increased and
it is considered that this trend is likely to
continue.
A number of businesses and funds
operate in a similar space to the Group by
providing capital and/or support services
to early-stage businesses, and a wide
variety of business models can be seen.
It is not uncommon for such companies
to act in a collaborative manner through
syndication of investment. However, there
are also occasions when a competitive
approach is taken to achieving an
interest in a particular company and its
technology. Accordingly, the Group can
face competition of this nature from
a wide variety of categories of entity,
including:
• specialist traditional venture capital
investors;
• large private institutional investors;
• privately managed schemes based on
government funding;
• private individuals, both acting
individually or collectively as groups
such as business angels networks or
through beneficial tax mechanisms
such as SEIS, EIS and VCTs; and
• direct public funding, for example
the EU level JEREMIE fund and other
national and local schemes.
In addition, certain universities and other
research intensive institutions may in
future become increasingly proactive
themselves at seeking to raise private
sector funding to support their in-house
technology commercialisation activities.
2008 Acquires 19% stake in Fusion IP plc
2009Proximagen plc raises £50m
Oxford Nanopore Ltd raises £10m
2010 Wins mandate to manage ‘North East Technology Fund’
Ilika plc floats on AIM
Tissue Regenix Group plc floats on AIM
2011 Expands relationship with Oxford University via Technikos
Completes £55m fundraising
2012 Retroscreen Virology Group plc floats on AIM
Trade sale of Proximagen plc for up to £357m
Revolymer plc floats on AIM
2013 Signs agreement with University of Manchester; pilot deals in the US with Penn & Columbia
Investment in Cambridge Innovation Capital plc
AGM plc floats on AIM
Launch of IP Venture Fund II
2014 Completes £100m fundraising
Acquisition of Fusion IP plc
£112m £335m £898mMARKET CAPITALISATION AIM admission
O�cial List admissionDate of report
Ten years of growth as a listed company

23002-04 Proof 8a 01-04-14
IP Group plc Annual Report and Accounts for the year ended 31 December 201308
Stra
teg
ic R
ep
ort
Ou
r B
usi
ness
& S
trat
eg
y
Our portfolio at a glance
Our portfolio: continuing to develop and mature
Product pipelineIncubation projects
Seed businesses
Post-seed private businesses
Post-seed quoted businesses
Healthcare
Number of companies
18 (2012: 17)
Fair value
£175.8m (2012: £107.3m)
— Major contributors to significant net
increase in fair value were Oxford
Nanopore (£33.3m), Retroscreen
(£16.1m) and Tissue Regenix (£9.4m)
— Oxford Nanopore announced a
heavily oversubscribed MinION
Access Programme and a £40m gross
financing
— Retroscreen raised £25.5m gross new
capital and announced that it expects
to approximately double revenues to
£27m in 2013
— Tissue Regenix announced a positive
trial of DermaPure™ for chronic wounds
Energy & Renewables
Number of companies
15 (2012: 14)
Fair value
£36.1m (2012: £30.3m)
— Limited net fair value increase;
primarily Ceres Power (£2.1m) and
Getech (£3.3m)
— Ceres Power announced Phil
Caldwell as CEO and a commercial
and technical partnership with South
Korea’s KD Navien
— Getech highlighted increased
revenues (£8.0m) and profits (£2.2m)
for year to 31 July 2013
— Modern Water increased its presence
in China through a distribution
agreement and strategic contracts
Chemicals & Materials
Number of companies
16 (2012: 14)
Fair value
£32.7m (2012: £18.0m)
— Major contributors to net fair value
gain included Applied Graphene
Materials plc’s AIM IPO and
subsequent price increase (£12.2m)
— Revolymer announced nicotine gum
developments but the departure of its
CEO in early 2014
— Xeros completed £10m gross placing
to fund commercial and domestic
laundry opportunity development

23002-04 Proof 8a 01-04-14
Stock Code: IPO www.ipgroupplc.com 09
Stra
teg
ic R
epo
rt O
ur
Bu
sin
ess
& S
trat
eg
y
IT & Communications
Number of companies
11 (2012: 12)
Fair value
£15.4m (2012: £10.4m)
— Actual Experience (£3.3m) and Tracsis
(£1.1m) contributed to modest overall
net gain
— Tracsis acquired Sky High plc and saw
a 25% revenue increase to £10.8m to
31 July 2013
Biotech
Number of companies
9 (2012: 8)
Fair value
£6.1m (2012: £5.6m)
— Limited portfolio company holdings
in biotech sector following £15.1m
Proximagen cash exit in 2012
— Subsidiary Modern Biosciences
developing family of compounds
acting against exciting novel
immunology target
Multiple Sectors
Number of companies
3 (2012: 2)
Fair value
£19.8m (2012: £10.2m)
— Balance of Fusion IP plc not owned
by Group to be acquired via a
recommended takeover, pending OFT
clearance and court sanction
— New strategic holding in Cambridge
Innovation Capital plc with MoU to
share co-investment opportunities

23002-04 Proof 8a 01-04-14
IP Group plc Annual Report and Accounts for the year ended 31 December 201310
Stra
teg
ic R
ep
ort
Ou
r B
usi
ness
& S
trat
eg
y
Strategy
Our strategy: systematically building businesses
Our strategic aims What we did in 2013
IdentifyTo build and maintain a pipeline of compelling intellectual property-based opportunities
DevelopTo develop intellectual property based opportunities into a diversified portfolio of robust businesses
GrowTo grow the value of our assets and those we manage on behalf of third parties
DeliverTo deliver attractive financial returns from our assets
— Provided initial capital to nine technology companies (2012: 11)
— Expanded pipeline through commercialisation agreement
with University of Manchester (including graphene projects
in 2014)
— Expanded pipeline through commercialisation agreements in
US, with University of Pennsylvania and Columbia University
— Strategic investment in CIC and MoU to share early-stage
company opportunities
— Net portfolio fair value increased to £285.9m, a net fair value
gain of £82.4m
— Portfolio increased to 72 companies
— Board representation on more than 75% of companies
by number
— IP Impact programmes run internally and externally
— Continued to provide other spin-out support services
including IP Exec, business support, corporate finance and
legal advice to portfolio companies
— Net portfolio fair value gains of £82.4m
— Deployed capital of £27.5m to portfolio (2012: £26.3m)
— Portfolio stands at 72 companies with a combined total value
in excess of £1.7bn
— Raised £30m IP Venture Fund II, to invest alongside the
Group
— Total funds under management of approximately £100m
— Net portfolio fair value gains of £82.4m
— Proceeds from sale of equity and debt of £5.5m
— Strong share price performance in 2013 with an increase in
excess of 40%

23002-04 Proof 8a 01-04-14
Stock Code: IPO www.ipgroupplc.com 11
Stra
teg
ic R
epo
rt O
ur
Bu
sin
ess
& S
trat
eg
y
Objectives for 2014 Link to KPIs
— Maintain similar level of new opportunities
— Integrate Fusion IP’s partner university relationships into the Group
— Further expansion into the US via pilot projects – identify first US based
incubation opportunities
— Identify opportunities to deploy an increased level of capital into the Group’s
biotech division
— Complete Fusion acquisition, integrate staff into the Group and begin to deepen
our sector expertise
— Seek to maintain approach of direct IP Group representation on spin-out
company boards
— Continue to develop and deploy IP Impact
— Continue to provide “add-on” services such as IP Exec, business support,
corporate finance advice
— £100m capital raising in early 2014 will facilitate increased rate of capital
deployed in 2014, primarily into maturing portfolio
— Assist, directly or indirectly, portfolio companies to access public and private
markets to raise development capital
— Continue to monitor opportunities for additional capital or funds under
management
— Seek to continue net long-term increase in portfolio value and net assets
— Where appropriate, generate cash realisations from portfolio
— Generate attractive performance in Group’s managed funds
— Number of new portfolio companies
— Cash, cash equivalents and deposits
Read more on pages 30 and 31
— Purchase of equity and
debt investments
— Change in fair value of equity and
debt investments
— Cash, cash equivalents and deposits
Read more on pages 30 and 31
— Total equity
— Change in fair value of equity and
debt investments
— Cash, cash equivalents and deposits
Read more on pages 30 and 31
— Total equity
— Profit/(loss) attributable to
equity holders
— Proceeds from sale of
equity investments
— IP Group share price performance
Read more on pages 30 and 31
IP Group’s purpose is to systematically help create, build and support outstanding intellectual property-based businesses in order to provide attractive returns for our shareholders and other stakeholders. The key elements of our strategy are as follows:

23002-04 Proof 8a 01-04-14
IP Group plc Annual Report and Accounts for the year ended 31 December 201312
Stra
teg
ic R
ep
ort
Ou
r P
erf
orm
ance
Since the period end, in January
2014, we were pleased to announce
a recommended all-paper acquisition
of Fusion IP plc, a business with which
we have enjoyed a strong working
relationship since taking a 20% stake in
2009. The recommended acquisition
is highly complementary to IP Group’s
core business and will give the combined
entity greater breadth of coverage,
enabling the Group to access a wider
pool of intellectual property as well as
improve our service offering to existing
and potential research institutions both in
the UK and internationally. In addition, our
shareholders gave a strong endorsement
of our business model and progress to
date through their support of an equity
raise of £100m, before expenses, that will
enable us to continue to back our most
promising portfolio companies. Access to
finance for our portfolio companies was
further complemented in 2013 through
the raising of a new £30m fund with
the European Investment Fund (“EIF”),
IP Venture Fund II, a successor to IP
Venture Fund.
Throughout 2013, the Group continued to
execute its core strategy of building high-
quality businesses based on intellectual
property. This has resulted in the fair
value of the Group’s portfolio increasing
to £285.9m (2012: £181.8m) across
72 companies, with many companies
continuing to mature, increase revenues,
and achieve commercial and technical
milestones. Highlights included: Oxford
Nanopore Technologies Limited
(“Oxford Nanopore”) completing a
£40m financing and launching a heavily
oversubscribed access program to allow
researchers to begin using its nanopore
sequencing technology; Durham
Graphene Sciences Limited rebranding
to Applied Graphene Materials plc
During 2013 the Group has continued to build on the strong foundations laid in previous years and has utilised its people and cash resources to continue to support the development of its portfolio.
For the second successive year the Group deployed over £25m of balance sheet capital into its portfolio companies and saw the fair value of its portfolio increase significantly. The Group’s access to intellectual property opportunities in the UK was expanded through a new partnership with the University of Manchester and a strategic investment in Cambridge Innovation Capital plc, while the Group took its first measured steps internationally through two new pilot relationships with the University of Pennsylvania and Columbia University.Alan Aubrey Chief Executive Officer
A successful year: executing our core strategy
Operational review

23002-04 Proof 8a 01-04-14
Stock Code: IPO www.ipgroupplc.com 13
Stra
teg
ic R
epo
rt O
ur
Perf
orm
ance
(“Applied Graphene”) and completing an
AIM market IPO and concurrent £11m
placing; and Retroscreen Virology Group
plc (“Retroscreen”) continuing to grow
its revenues and guiding the market in
December to expect FY2013 revenues
in excess of £27m (almost double the
£14m achieved in 2012). There were
few significant reductions in fair value
or write-offs within the portfolio. Further
detailed analysis is provided in the
portfolio review.
The Group’s active involvement in the
development of its spin-out companies
is an integral part of the implementation
of its strategy. To that end, the Group has
expanded IP Exec, the Group’s specialist
in-house executive search function which
assists portfolio companies in recruiting
experienced and able leadership. In
addition, following the completion of the
acquisition of Fusion IP, its existing highly
skilled team will augment the Group’s
core business.
As noted opposite, in addition to
increasing its access to UK university-
produced research through its
relationships with the University of
Manchester and CIC, the Group
announced in December that it had
signed IP commercialisation agreements
with the University of Pennsylvania, the
UPstart company formation programme
run by its Center for Technology Transfer,
and with Columbia Technology Ventures,
the technology transfer office of
Columbia University. These partnerships,
which have an initial pilot phase of 18
months, will focus on identifying early-
stage, proof of principle opportunities
based on intellectual property developed
at those universities. The Group will
seek to identify its first opportunities for
development from these universities
during the course of 2014.
In order to support the current portfolio
as well as future spin-outs from its
university partners, the Group recognises
the importance of being able to provide
long-term ‘patient’ capital to its portfolio
companies. The successful completion
of the Group’s £100m placing in February
2014 will ensure that the Group has
the ability to continue to back its most
promising portfolio companies with
both capital and people. Top Technology
Ventures Limited (“TTV”), the Group’s
FCA-regulated subsidiary, now manages
three venture capital funds with total
assets under management now in excess
of £100m. IPVFII was established in May
2013 in partnership with the EIF, one of
the leading venture capital investors in
Europe. The fund comprises £30m of
capital with a £20m contribution from
the EIF and a £10m contribution from the
Group. NETF, now entering its fifth year
of investing, has to date provided capital
to 55 developing technology companies
in north-east England. Finally, IPVF, whose
investing period ended in 2012, continues
to deploy its remaining capital to support
its existing portfolio.
OutlookWhilst macroeconomic sentiment in the
UK is improving, funding for higher risk,
early-stage businesses continues to be
constrained and trading circumstances
for many small businesses remain
difficult. Nonetheless, the Directors
believe that the UK continues to produce
a wealth of potentially world-class IP
from its universities and other research
intensive institutions and consider that the
Group has an increasingly strengthened
position given its track record, strong
cash position and available funds under
management.
The Group continues to expand its
access to leading scientific innovation,
both in the UK and abroad, by broadening
and deepening its arrangements with
its existing university partners and other
research intensive institutions, and by
entering into collaborations with new
partners. These arrangements continue
to provide opportunities for the Group to
back early-stage projects and companies
based on potentially high-impact
technologies. The Board is confident
that this flow of opportunities, coupled
with the Group’s increased ability to
invest larger sums more frequently in its
portfolio companies as a result of the
Capital Raising, will continue to drive the
Group’s growth. The Board is excited at
the prospect of the acquisition of Fusion
IP plc which it considers represents an
opportunity to create a stronger UK
commercialisation company with greater
critical mass. Accordingly, the Board
remains confident in the prospects for the
Group.
“It is common for
institutional investors
to claim that they ‘add value’ to
their portfolio companies. However
IP Group has done exactly this,
in a very fundamental and value
accretive way since our early days.
It is not unreasonable to say that
the company would not be where
it is today without their consistent
support and guidance.”
Dave Page, CEO Actual Experience plc
“IP Group has a strong sense of
commitment to the business in
which they invest, positioning
themselves as partners in your
company and are in it ‘for the long
run’…They have stood shoulder to
shoulder with us as we grew and
matured, offering both financial and
professional support at each stage
of the company’s development.”
Kym Denny, CEO Retroscreen Virology Group plc
Testimonial:
Business Building

23002-04 Proof 8a 01-04-14
IP Group plc Annual Report and Accounts for the year ended 31 December 201314
Stra
teg
ic R
ep
ort
Ou
r P
erf
orm
ance
Incubation opportunities
Seed businesses
Post-seed private businesses
Post-seed quoted businesses
8
20
26
18
The Group’s ten largest portfolio companies account for almost 79% of the total portfolio value (2012: 76%)
Portfolio review
Our portfolio: continuing to develop and mature
OverviewAt 31 December 2013 the value of the
Group’s portfolio had increased to
£285.9m, from £181.8m in 2012, as a
result of the net investment and fair value
movements set out below. The portfolio
comprised holdings in 72 companies,
compared with 67 at 31 December 2012.
During the year to 31 December 2013,
the Group provided pre-seed, seed and
post-seed capital totalling approximately
£27.5m to its portfolio companies,
including a £5m investment into
Cambridge Innovation Capital plc. This
rate of deployment is largely consistent
with the £26.3m provided in 2012 and
is in line with commitments made at
the time of the Group’s 2011 placing.
The directors believe that the Group’s
ability to utilise its increased capital to
maintain its equity interest in its most
promising companies has contributed to
the significant fair value increase in the
portfolio during the year of £82.4m
(2012: £38.0m).
The Group has broadly maintained
the level of capital deployed into new
spin-out opportunities, with initial capital
being deployed by the Group into nine
companies during the year (2012: 11)
and the Group received stakes in two
additional companies. One company was
sold during the period, whilst a further
five companies were closed or fully
provided against with a total historic cost
of £11.2m. The total cost of all closed
or fully provided companies now stands
at approximately £17m, representing
approximately 14% of the total capital
deployed to date by the Group into its
portfolio.
Portfolio by stage
Healthcare
Energy & Renewables
Chemicals & Materials
IT & Communications
Biotech
Multiple sectors
175.8
36.1
32.7
15.4
6.1
19.8
Healthcare
Energy & Renewables
Chemicals & Materials
IT & Communications
Biotech
Multiple sectors
18
15
16
11
9
3Portfolio by number
Portfolio by fair value (£m)

23002-04 Proof 8a 01-04-14
Stock Code: IPO www.ipgroupplc.com 15
Stra
teg
ic R
epo
rt O
ur
Perf
orm
ance
Fair value of portfolio
£285.9m (2012: £181.8m)
Investment in portfolio
£27.5m (2012: £26.3m)
Number of portfolio companies
72 (2012: 67)
Realisations from portfolio
£5.5m (2012: £16.7m)
Number of new portfolio companies
9 (2012: 11)
The Group’s ten largest portfolio
companies by value, accounting for
almost 79% of the total portfolio value
(2012: 76%), have seen significant
developments during the year. Applied
Graphene Materials plc, a spin-out from
Durham University which has developed
a proprietary process for the manufacture
of high purity graphene nanoplatelets,
completed an AIM market IPO and
concurrent £11m placing to scale up
capacity of its plant to eight tonnes per
annum over the next 18 months, for
investment in technical and business
development, commercial partnerships
and to extend the applications capability.
During the year, cash proceeds from
the realisation of investments decreased
to £5.5m (2012: £16.7m). The proceeds
predominantly arose from partial exits
of the Group’s holdings in AIM-quoted
Tracsis plc and Velocys plc, whilst the
prior year was primarily driven by the
disposal of Proximagen plc for £15.4m.
Performance summaryA summary of the gains and losses across
the portfolio is as follows: 2013
£m2012
£m
Unrealised gains on
the revaluation of
investments 90.3 64.5
Unrealised losses on
the revaluation of
investments (7.9) (26.5)
Net fair value gains 82.4 38.0
(Loss)/profit on
disposals of equity
investments (0.2) 11.8
Change in fair value
of Limited Partnership
interests 0.8 0.4
Net portfolio gains 83.0 50.2
The most significant contributors to
unrealised gains on the revaluation of
investments comprised Oxford Nanopore
(£33.3m), Retroscreen (£16.1m) and
Applied Graphene (£12.2m). The major
contributors to the unrealised losses
on the revaluation of investments were
Modern Water (£1.6m), Oxford Advanced
Surfaces (£1.5m) and Encos (£1.1m).
The Group’s holdings in companies
quoted on either AIM or ISDX saw a net
unrealised fair value increase of £46.1m
while the Group’s holdings in unquoted
companies experienced a net fair value
increase of £36.3m. The Group believes
that the increasing maturity and technical
and commercial progress of many of
its underlying portfolio businesses, both
quoted and unquoted, contributed to the
significant increases in fair value during
the year. The share price performance of
the Group’s quoted portfolio companies
has continued to be positive during
the first two months of 2014, with the
portfolio having seen a £23.6m net
unrealised fair value increase from the
year end to 28 February 2014.
Overview
23002-04 Proof 8a 01-04-14
IP Group plc Annual Report and Accounts for the year ended 31 December 201316
Stra
teg
ic R
ep
ort
Ou
r P
erf
orm
ance
Portfolio reviewcontinued
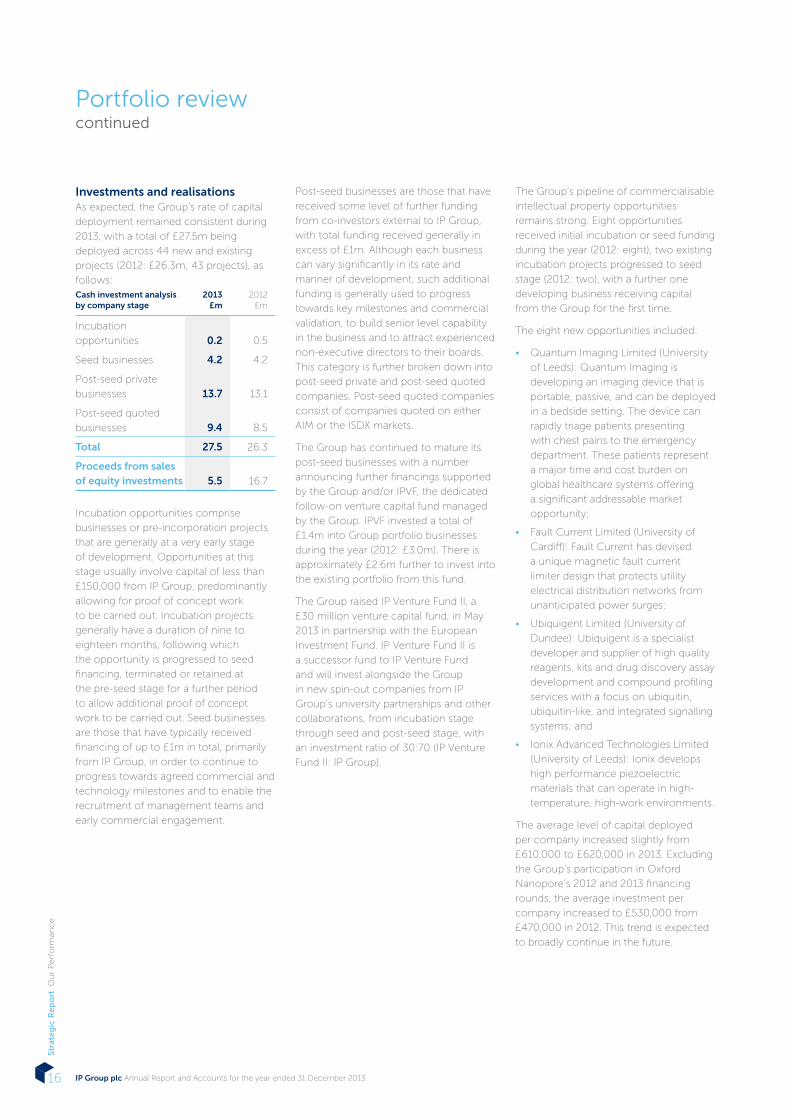
Investments and realisationsAs expected, the Group’s rate of capital
deployment remained consistent during
2013, with a total of £27.5m being
deployed across 44 new and existing
projects (2012: £26.3m; 43 projects), as
follows: Cash investment analysis by company stage
2013 £m
2012 £m
Incubation
opportunities 0.2 0.5
Seed businesses 4.2 4.2
Post-seed private
businesses 13.7 13.1
Post-seed quoted
businesses 9.4 8.5
Total 27.5 26.3
Proceeds from sales of equity investments 5.5 16.7
Incubation opportunities comprise
businesses or pre-incorporation projects
that are generally at a very early stage
of development. Opportunities at this
stage usually involve capital of less than
£150,000 from IP Group, predominantly
allowing for proof of concept work
to be carried out. Incubation projects
generally have a duration of nine to
eighteen months, following which
the opportunity is progressed to seed
financing, terminated or retained at
the pre-seed stage for a further period
to allow additional proof of concept
work to be carried out. Seed businesses
are those that have typically received
financing of up to £1m in total, primarily
from IP Group, in order to continue to
progress towards agreed commercial and
technology milestones and to enable the
recruitment of management teams and
early commercial engagement.
Post-seed businesses are those that have
received some level of further funding
from co-investors external to IP Group,
with total funding received generally in
excess of £1m. Although each business
can vary significantly in its rate and
manner of development, such additional
funding is generally used to progress
towards key milestones and commercial
validation, to build senior level capability
in the business and to attract experienced
non-executive directors to their boards.
This category is further broken down into
post-seed private and post-seed quoted
companies. Post-seed quoted companies
consist of companies quoted on either
AIM or the ISDX markets.
The Group has continued to mature its
post-seed businesses with a number
announcing further financings supported
by the Group and/or IPVF, the dedicated
follow-on venture capital fund managed
by the Group. IPVF invested a total of
£1.4m into Group portfolio businesses
during the year (2012: £3.0m). There is
approximately £2.6m further to invest into
the existing portfolio from this fund.
The Group raised IP Venture Fund II, a
£30 million venture capital fund, in May
2013 in partnership with the European
Investment Fund. IP Venture Fund II is
a successor fund to IP Venture Fund
and will invest alongside the Group
in new spin-out companies from IP
Group’s university partnerships and other
collaborations, from incubation stage
through seed and post-seed stage, with
an investment ratio of 30:70 (IP Venture
Fund II: IP Group).
The Group’s pipeline of commercialisable
intellectual property opportunities
remains strong. Eight opportunities
received initial incubation or seed funding
during the year (2012: eight), two existing
incubation projects progressed to seed
stage (2012: two), with a further one
developing business receiving capital
from the Group for the first time.
The eight new opportunities included:
• Quantum Imaging Limited (University
of Leeds): Quantum Imaging is
developing an imaging device that is
portable, passive, and can be deployed
in a bedside setting. The device can
rapidly triage patients presenting
with chest pains to the emergency
department. These patients represent
a major time and cost burden on
global healthcare systems offering
a significant addressable market
opportunity;
• Fault Current Limited (University of
Cardiff): Fault Current has devised
a unique magnetic fault current
limiter design that protects utility
electrical distribution networks from
unanticipated power surges;
• Ubiquigent Limited (University of
Dundee): Ubiquigent is a specialist
developer and supplier of high quality
reagents, kits and drug discovery assay
development and compound profiling
services with a focus on ubiquitin,
ubiquitin-like, and integrated signalling
systems; and
• Ionix Advanced Technologies Limited
(University of Leeds): Ionix develops
high performance piezoelectric
materials that can operate in high-
temperature, high-work environments.
The average level of capital deployed
per company increased slightly from
£610,000 to £620,000 in 2013. Excluding
the Group’s participation in Oxford
Nanopore’s 2012 and 2013 financing
rounds, the average investment per
company increased to £530,000 from
£470,000 in 2012. This trend is expected
to broadly continue in the future.

The Group’s pipeline remains strong. Eight opportunities received initial incubation or seed funding during the year (2012: 8)
23002-04 Proof 8a 01-04-14
Stock Code: IPO www.ipgroupplc.com 17
Stra
teg
ic R
epo
rt O
ur
Perf
orm
ance
Portfolio analysis — by stage of company maturityAt 31 December 2013, the Group’s portfolio fair value of £285.9m was distributed across stages of company maturity as follows:
As at 31 December 2013 As at 31 December 2012
Fair value Number Fair value Number
Company stage £m % % £m % %
Incubation opportunities 0.1 — 8 11% 0.5 — 8 12%
Seed businesses 11.3 4% 20 28% 9.9 5% 17 25%
Post-seed private businesses 139.4 49% 26 36% 86.8 48% 26 39%
Post-seed quoted businesses 135.1 47% 18 25% 84.6 47% 16 24%
All portfolio businesses 285.9 100% 72 100% 181.8 100% 67 100%
Of the 72 companies in the Group’s portfolio, 79% (2012: 76%) of the fair value resides in the ten most valuable companies and the
Group’s holdings in these businesses are valued at a total of £225.2m (2012: £138.2m).
Portfolio analysis — by sectorThe Group funds spin-out companies based on a wide variety of innovative and potentially disruptive commercialisable intellectual
property emerging from leading research intensive institutions and does not limit itself to funding companies from particular areas of
science. For reporting purposes only, the Group categorises its portfolio companies into five broad “technology” sectors, as depicted
in the following table:
As at 31 December 2013 As at 31 December 2012
Fair value Number Fair value Number
Sector £m % % £m % %
Healthcare 175.8 62% 18 25% 107.3 59% 17 25%
Energy & Renewables 36.1 13% 15 21% 31.0 17% 14 21%
Chemicals & Materials 32.7 11% 16 22% 18.0 10% 14 21%
IT & Communications 15.4 5% 11 15% 9.7 5% 12 18%
Biotech 6.1 2% 9 13% 5.6 3% 8 12%
Multiple sectors 19.8 7% 3 4% 10.2 6% 2 3%
285.9 100% 72 100% 181.8 100% 67 100%
As can be seen from the table, the Group’s portfolio by number of companies is well diversified across five main sectors. By fair
value, however, the portfolio is currently more concentrated in the healthcare sector, largely as a result of the relative valuation of the
Group’s holding in Oxford Nanopore, Retroscreen and Tissue Regenix Group plc.
A more detailed analysis of each sector is set out on the following pages.

23002-04 Proof 8a 01-04-14
IP Group plc Annual Report and Accounts for the year ended 31 December 201318
Stra
teg
ic R
ep
ort
Ou
r P
erf
orm
ance
Portfolio reviewcontinued
Healthcare
The Group’s portfolio of healthcare, or
“medtech”, companies saw the most
significant increase in fair value during
the period. The major contributors to this
increase were Oxford Nanopore (£33.3m)
as a result of its further £40m fundraising
being completed at a premium to its
previous financing round, Retroscreen
(£16.1m) which experienced strong share
price performance following its £25.5m
placing and Tissue Regenix Group plc
(£9.4m) whose share price performed
positively during the year following
announcement of the publication of full
trial results detailing the effectiveness
of DermaPure™ in healing treatment-
resistant chronic wounds and the
production of dCELL® dermis in the
United States.
In January 2014, Oxford Nanopore
Technologies Limited (“Oxford
Nanopore”), a spin-out company from
the University of Oxford that specialises
in nanopore-based electronic molecular
analysis systems, announced that its
MinION Access Programme (“MAP”)
had been “heavily oversubscribed”
following its launch in November.
The MAP is a substantial but initially
controlled programme designed to
give life science researchers access to
nanopore sequencing technology at no
risk and minimal cost. The programme
will be conducted in cycles with the
first cycle taking place over a six week
period comprising “a configuration
phase (installation of hardware and
software), burn-in phase (test experiments
using control samples provided by
Oxford Nanopore) and the user’s own
experiments”. In October 2013, Oxford
Nanopore announced it had raised £40m
in new funding via a private placement of
ordinary shares, bringing the total funds
raised by Oxford Nanopore since its
foundation to £145m.
Retroscreen Virology Group plc
(“Retroscreen”), a spin-out from Queen
Mary University of London, that has
pioneered the commercialisation of the
Viral Challenge Model which enables
research into viral infection and enables
pharmaceutical companies to accelerate
and reduce the cost of bringing antiviral
therapeutics and vaccines to market,
announced in July that had it raised
£25.5m before expenses, with the
Group stakeat 31 Dec
2013(i)
Fair value of Group
holding at 31 Dec
2012
Year to 31 December 2013 Fair value of Group
holding at 31 Dec
2013
Net investment/ (divestment)
Fair value movement
Company name Description % £m £m £m £m
Oxford Nanopore
Technologies Limited
Single-molecule detection. 1st
application in 3rd generation DNA
sequencing (“$1000 genome”)
19.6% 66.5 4.5 33.3 104.3
Retroscreen Virology Group plcViral challenge and ‘virometrics’
specialist (“conquering viral disease”)18.3% 12.4 1.1 16.1 29.6
Tissue Regenix Group plcRegenerative dCELL® soft tissue body
parts13.8% 11.3 — 9.4 20.7
Avacta Group plcReagents, arrays and instruments for
human and animal healthcare27.6% 9.9 0.9 1.4 12.2
Other companies 7.2 1.9 (0.1) 9.0
Total 107.3 8.4 60.1 175.8
(i) Stake represents undiluted beneficial equity interest excluding debt.

23002-04 Proof 8a 01-04-14
Stock Code: IPO www.ipgroupplc.com 19
Stra
teg
ic R
epo
rt O
ur
Perf
orm
ance
Number of companies
18 (2012: 17)
Fair value
£175.8m (2012: £107.3m)
Case study: Healthcare
OxehealthStage: Seed
Monitoring ‘vital signs’ (heart rate etc.) remotely Oxehealth is a software developer spun out from the University of Oxford’s
Institute of Biomedical Engineering. Its technology enables a digital camera,
tablet or phone to monitor the vital signs (heart rate, respiratory rate and
oxygen saturation) of an individual, without the need for physical contact or
expensive proprietary equipment. Oxehealth recently appointed Warren East,
the former ARM CEO, board member of Rolls Royce, De La Rue, Dyson and
BT, to its Advisory Board.
Read more online at www.ipgroupplc.com/portfolio
Group, together with its managed funds,
contributing £1.5m of the placing. In
December, Retroscreen announced
that it expects to report revenues for
the year ended 31 December 2013
in excess of £27.0m (31 December
2012: £14.4m), significantly ahead of
market expectations. The company also
continues to achieve improvements to
gross margin and profitability.
Avacta Group plc (“Avacta”), which
develops reagents, arrays and instruments
for human and animal healthcare,
announced in July 2013 that it had
raised gross proceeds of £4.7m primarily
to develop its Affimer technology, of
which the Group, together with its
managed funds, contributed £1.0m.
Avacta subsequently announced its first
licence deal for Affimers with Blueberry
Therapeutics, a private UK biotechnology
company.
23002-04 Proof 8a 01-04-14
IP Group plc Annual Report and Accounts for the year ended 31 December 201320
Stra
teg
ic R
ep
ort
Ou
r P
erf
orm
ance
Portfolio reviewcontinued
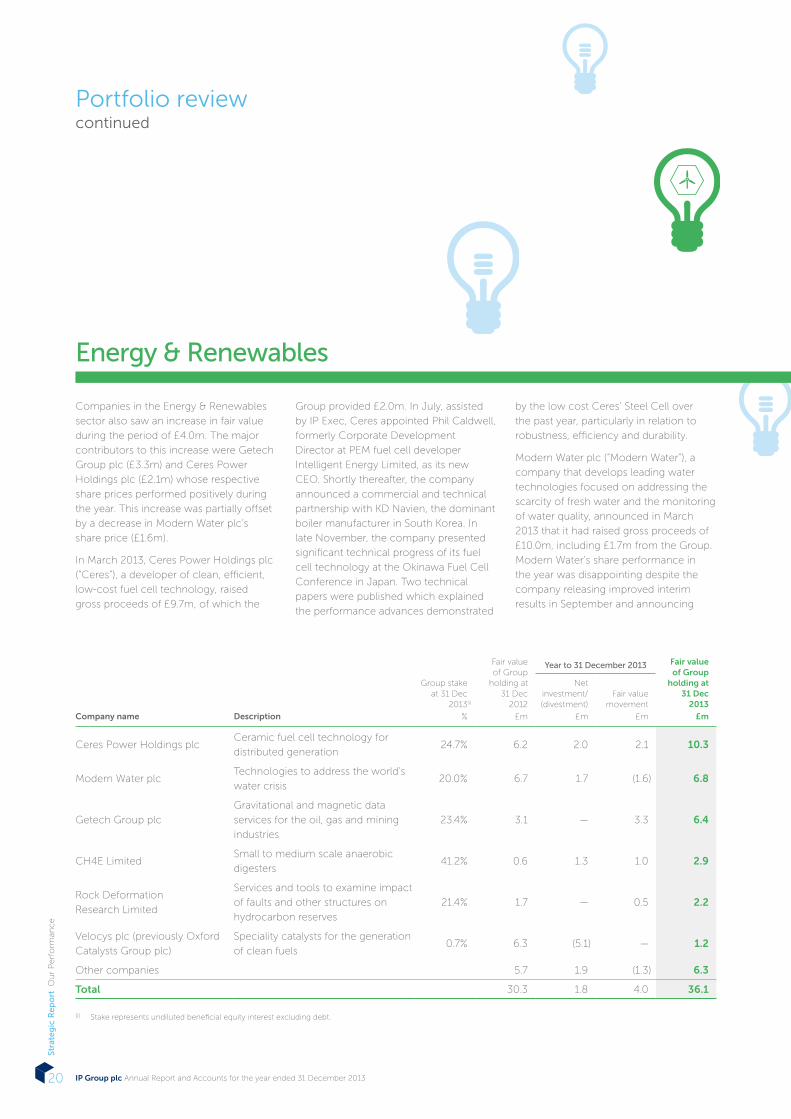
Companies in the Energy & Renewables
sector also saw an increase in fair value
during the period of £4.0m. The major
contributors to this increase were Getech
Group plc (£3.3m) and Ceres Power
Holdings plc (£2.1m) whose respective
share prices performed positively during
the year. This increase was partially offset
by a decrease in Modern Water plc’s
share price (£1.6m).
In March 2013, Ceres Power Holdings plc
(“Ceres”), a developer of clean, efficient,
low-cost fuel cell technology, raised
gross proceeds of £9.7m, of which the
Group provided £2.0m. In July, assisted
by IP Exec, Ceres appointed Phil Caldwell,
formerly Corporate Development
Director at PEM fuel cell developer
Intelligent Energy Limited, as its new
CEO. Shortly thereafter, the company
announced a commercial and technical
partnership with KD Navien, the dominant
boiler manufacturer in South Korea. In
late November, the company presented
significant technical progress of its fuel
cell technology at the Okinawa Fuel Cell
Conference in Japan. Two technical
papers were published which explained
the performance advances demonstrated
by the low cost Ceres’ Steel Cell over
the past year, particularly in relation to
robustness, efficiency and durability.
Modern Water plc (“Modern Water”), a
company that develops leading water
technologies focused on addressing the
scarcity of fresh water and the monitoring
of water quality, announced in March
2013 that it had raised gross proceeds of
£10.0m, including £1.7m from the Group.
Modern Water’s share performance in
the year was disappointing despite the
company releasing improved interim
results in September and announcing
Energy & Renewables
Group stake at 31 Dec
2013(i)
Fair value of Group
holding at 31 Dec
2012
Year to 31 December 2013 Fair value of Group
holding at 31 Dec
2013
Net investment/ (divestment)
Fair value movement
Company name Description % £m £m £m £m
Ceres Power Holdings plc Ceramic fuel cell technology for
distributed generation24.7% 6.2 2.0 2.1 10.3
Modern Water plcTechnologies to address the world’s
water crisis20.0% 6.7 1.7 (1.6) 6.8
Getech Group plc
Gravitational and magnetic data
services for the oil, gas and mining
industries
23.4% 3.1 — 3.3 6.4
CH4E LimitedSmall to medium scale anaerobic
digesters41.2% 0.6 1.3 1.0 2.9
Rock Deformation
Research Limited
Services and tools to examine impact
of faults and other structures on
hydrocarbon reserves
21.4% 1.7 — 0.5 2.2
Velocys plc (previously Oxford
Catalysts Group plc)
Speciality catalysts for the generation
of clean fuels0.7% 6.3 (5.1) — 1.2
Other companies 5.7 1.9 (1.3) 6.3
Total 30.3 1.8 4.0 36.1
(i) Stake represents undiluted beneficial equity interest excluding debt.

23002-04 Proof 8a 01-04-14
Stock Code: IPO www.ipgroupplc.com 21
Stra
teg
ic R
epo
rt O
ur
Perf
orm
ance
Number of companies
15 (2012: 14)
Fair value
£36.1m (2012: £30.3m)
Technologies for the production of fresh water and monitoring of water qualityModern Water supplies world-leading technologies for the production of fresh
water and monitoring of water quality and recently announced key contracts
during a UK Government trade mission to China, led by the UK Prime Minister,
David Cameron. Mr Cameron said: “Modern Water is an excellent example
of a small British business taking world-leading technology to China and
securing significant deals - all part of Britain succeeding in the global race.”
Read more online at www.ipgroupplc.com/portfolio
Case study: Energy & Renewables
Modern WaterStage: Post-seed quoted
the signing of an exclusive distribution
agreement, opening a new office and
signing a number of new strategic
contracts in China.
Getech Group plc (“Getech”), the
geoscience services business specialising
in the provision of data, studies and
services to the oil, gas and mining
exploration sectors, announced its results
for the twelve months ended 31 July
2013 in October. The highlights included
revenue for the year increasing by 25%
to £8.0m (2012: £6.4m) and profit before
tax increasing by 83% to £2.2m (2012:
£1.2m). Following on from this significant
improvement in financial performance,
the company’s share price increased
105% during 2013, with the fair value
of the Group’s holding in the company
increasing £3.3m. Getech’s share price
has experienced some downward
pressure in early 2014 following a H1
trading update indicating a reduction in
profit compared to the prior half year.

23002-04 Proof 8a 01-04-14
IP Group plc Annual Report and Accounts for the year ended 31 December 201322
Stra
teg
ic R
ep
ort
Ou
r P
erf
orm
ance
Portfolio reviewcontinued
The unrealised fair value gain seen by
the Chemicals & Materials portfolio
was largely as a result of an increase in
Applied Graphene’s share price since its
admission to AIM and Xeros Limited’s
further £10.0m fundraising being
completed at a premium to its previous
financing round.
Applied Graphene Materials plc
(“Applied Graphene”), a spin-out
from Durham University which has
developed a proprietary process for the
manufacture of high purity graphene
nanoplatelets, completed its AIM IPO
and £11.0m placing in November.
Applied Graphene will utilise the funding
to scale up production and accelerate
its collaboration agreements with nine
commercial partners, which range
from feasibility assessments to detailed
research investigating uses of graphene in
various application areas.
Revolymer plc (“Revolymer”), a University
of Bristol spin-out that has developed
a broad portfolio of polymer-based IP
which it is now applying to improve the
performance of a variety of consumer
products, announced in November
2013 that it had filed for marketing
authorisation in Europe of its proprietary
nicotine gum products by submitting an
application to the MHRA. If approved, this
will permit the marketing of Revolymer’s
2mg and 4mg strength nicotine gum in
the UK, Ireland, Poland and Spain. On
27 January 2014, the company
announced the departure of its CEO
and is currently taking steps to identify a
successor.
In March 2013, Xeros Limited (“Xeros”), the
developer of a patented polymer bead
cleaning system, successfully completed
a £10.0m fundraising from new and
existing investors, including £1.3m from
the Group and its managed funds. The
funding is being used to accelerate
the roll-out of the Xeros commercial
laundry cleaning system and to finalise
Group stake at 31 Dec
2013(i)
Fair value of Group
holding at 31 Dec
2012
Year to 31 December 2013 Fair value of Group
holding at 31 Dec
2013
Net investment/ (divestment)
Fair value movement
Company name Description % £m £m £m £m
Applied Graphene Materials plcProducer of speciality
graphene materials 20.4% 0.7 2.0 12.2 14.9
Revolymer plcNovel polymers, e.g. “removable
chewing gum”10.4% 4.0 — (0.1) 3.9
Xeros Limited“Virtually waterless” washing
machines14.6% 1.4 0.9 0.9 3.2
Surrey Nanosystems LimitedLow temperature carbon
nanotube growth21.0% 2.3 — — 2.3
Other companies 9.6 0.9 (2.1) 8.4
Total 18.0 3.8 10.9 32.7
(i) Stake represents undiluted beneficial equity interest excluding debt.
Chemicals & Materials

23002-04 Proof 8a 01-04-14
Stock Code: IPO www.ipgroupplc.com 23
Stra
teg
ic R
epo
rt O
ur
Perf
orm
ance
Number of companies
16 (2012: 14)
Fair value
£32.7m (2012: £18.0m)
Cutting edge technology in the developing graphene marketApplied Graphene Materials (“AGM”) is a spin-out from Durham University
which has developed a proprietary process for the manufacture of high purity
graphene nanoplatelets. Since its isolation in 2004, graphene has attracted
significant interest and been dubbed ‘the wonder material’ given its unsurpassed
electrical, thermal and mechanical properties. AGM listed on the AIM market of
the London Stock Exchange in November 2013, having raised £11m.
Read more online at www.ipgroupplc.com/portfolio
Case study: Chemicals & Materials
Applied Graphene MaterialsStage: Post-seed quoted
the development of a household
system as an alternative to conventional
domestic washing machines. In May
2013, Xeros announced that it had
partnered with the chemical company
BASF to jointly develop polymer beads
based on engineering plastics that will
increase the cleaning power in laundry
applications. This long-term agreement
reflects the mutual commitment of
the two companies to maximise the
commercialisation of the Xeros cleaning
system and protect the environment
by conserving water and energy. In
February 2014, Xeros announced its
intention to float on the AIM market
and raise funds to allow it to accelerate
roll-out in commercial laundry and to
fund the research and development
process through to commercialisation in
other identified applications, not least in
domestic laundry.

23002-04 Proof 8a 01-04-14
IP Group plc Annual Report and Accounts for the year ended 31 December 201324
Stra
teg
ic R
ep
ort
Ou
r P
erf
orm
ance
Portfolio reviewcontinued
At 31 December 2013, the Group’s
portfolio of holdings in IT &
Communications companies was valued
at £15.4m (2012: £10.4m) and recorded
a fair value gain of £4.2m (2012: £2.5m),
the majority of which was due to Actual
Experience plc’s fundraising being
completed at a premium to its previous
financing round and the performance of
Tracsis plc’s share price.
Tracsis plc (“Tracsis”), a leading
provider of operational planning
software to passenger transport
industries, announced in March 2013 a
recommended cash offer for the entire
issued share capital of AIM-quoted Sky
High plc, the largest provider of traffic
analysis and surveys within the UK, and in
April won Small Cap Company of the Year
at the 2013 Small Cap Awards. In October
2013, Tracsis released its final results for
the year ended 31 July 2013, highlighting
increases in revenues of 25% to £10.8m
(2012: £8.7m), an expanded geographic
footprint and the successful launch of
new software products.
In November 2013, Actual Experience
plc (“Actual Experience”), a spin-out
from Queen Mary London, successfully
completed a £4m financing round. Funds
raised will be used to support Actual
Experience’s continued expansion and
internationalisation, increase resource
dedicated to supporting channel partners
and further improve its capacity to
IT & Communications
Group stake at 31 Dec
2013(i)
Fair value of Group
holding at 31 Dec
2012
Year to 31 December 2013 Fair value of Group
holding at 31 Dec
2013
Net investment/ (divestment)
Fair value movement
Company name Description % £m £m £m £m
Tracsis plcResource optimisation software for
the transport industry10.9% 5.0 (0.6) 1.1 5.5
Actual Experience plc(ii)Optimising the human experience of
networked applications30.1% 1.2 0.2 3.3 4.7
Arkivum Limited Digital preservation and management 45.3% 1.9 0.1 — 2.0
Other companies 2.3 1.1 (0.2) 3.2
Total 10.4 0.8 4.2 15.4
(i) Stake represents undiluted beneficial equity interest excluding debt.
(ii) Actual Experience Limited prior to its AIM IPO on 13 February 2014.

23002-04 Proof 8a 01-04-14
Stock Code: IPO www.ipgroupplc.com 25
Stra
teg
ic R
epo
rt O
ur
Perf
orm
ance
Number of companies
11 (2012: 12)
Fair value
£15.4m (2012: £10.4m)
Improving the actual computing experience for end usersActual Experience’s technology enables the measurement of the digital
world as users experience it, enabling customers to measure and improve
the performance of the business applications that they provide to their staff
and their own clients, reducing costs while improving the experience of the
user. A spin-out from Queen Mary University of London, shares in Actual
Experience listed on the AIM market of the London Stock Exchange in
February, valuing it at £15.6m at the introduction price.
Read more online at www.ipgroupplc.com/portfolio
Case study: IT & Communications
Actual ExperienceStage: Post-seed private business
service its blue chip customer base,
which currently includes Accenture (UK)
Limited, Cisco systems Inc., Deutsche
Post AG and Verizon Business Inc.
Actual Experience Analytics are used
by businesses to quantify and improve
the actual ‘human experience’ of key
IT applications for their customers
and users. Following the period end in
February 2014, Actual Experience’s shares
were admitted to trading on AIM, with
strong share price performance since
listing resulting in a fair value increase in
the Group’s holding as at 28 February
2014 of £11.6m.
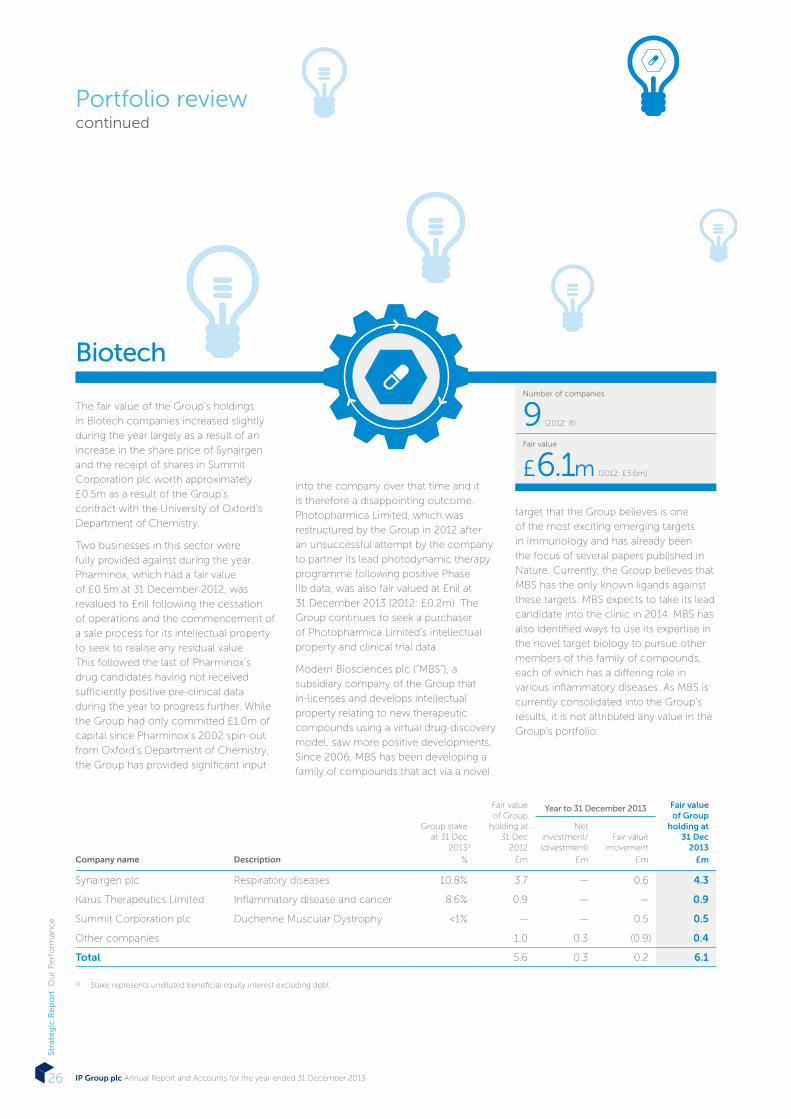
23002-04 Proof 8a 01-04-14
IP Group plc Annual Report and Accounts for the year ended 31 December 201326
Stra
teg
ic R
ep
ort
Ou
r P
erf
orm
ance
Number of companies
9 (2012: 8)
Fair value
£6.1m (2012: £5.6m)
Portfolio reviewcontinued
Group stake at 31 Dec
2013(i)
Fair value of Group
holding at 31 Dec
2012
Year to 31 December 2013 Fair value of Group
holding at 31 Dec
2013
Net investment/ (divestment)
Fair value movement
Company name Description % £m £m £m £m
Synairgen plc Respiratory diseases 10.8% 3.7 — 0.6 4.3
Karus Therapeutics Limited Inflammatory disease and cancer 8.6% 0.9 — — 0.9
Summit Corporation plc Duchenne Muscular Dystrophy <1% — — 0.5 0.5
Other companies 1.0 0.3 (0.9) 0.4
Total 5.6 0.3 0.2 6.1
(i) Stake represents undiluted beneficial equity interest excluding debt.
The fair value of the Group’s holdings
in Biotech companies increased slightly
during the year largely as a result of an
increase in the share price of Synairgen
and the receipt of shares in Summit
Corporation plc worth approximately
£0.5m as a result of the Group’s
contract with the University of Oxford’s
Department of Chemistry.
Two businesses in this sector were
fully provided against during the year.
Pharminox, which had a fair value
of £0.5m at 31 December 2012, was
revalued to £nil following the cessation
of operations and the commencement of
a sale process for its intellectual property
to seek to realise any residual value.
This followed the last of Pharminox’s
drug candidates having not received
sufficiently positive pre-clinical data
during the year to progress further. While
the Group had only committed £1.0m of
capital since Pharminox’s 2002 spin-out
from Oxford’s Department of Chemistry,
the Group has provided significant input
into the company over that time and it
is therefore a disappointing outcome.
Photopharmica Limited, which was
restructured by the Group in 2012 after
an unsuccessful attempt by the company
to partner its lead photodynamic therapy
programme following positive Phase
IIb data, was also fair valued at £nil at
31 December 2013 (2012: £0.2m). The
Group continues to seek a purchaser
of Photopharmica Limited’s intellectual
property and clinical trial data.
Modern Biosciences plc (“MBS”), a
subsidiary company of the Group that
in-licenses and develops intellectual
property relating to new therapeutic
compounds using a virtual drug-discovery
model, saw more positive developments.
Since 2006, MBS has been developing a
family of compounds that act via a novel
target that the Group believes is one
of the most exciting emerging targets
in immunology and has already been
the focus of several papers published in
Nature. Currently, the Group believes that
MBS has the only known ligands against
these targets. MBS expects to take its lead
candidate into the clinic in 2014. MBS has
also identified ways to use its expertise in
the novel target biology to pursue other
members of this family of compounds,
each of which has a differing role in
various inflammatory diseases. As MBS is
currently consolidated into the Group’s
results, it is not attributed any value in the
Group’s portfolio.
Biotech
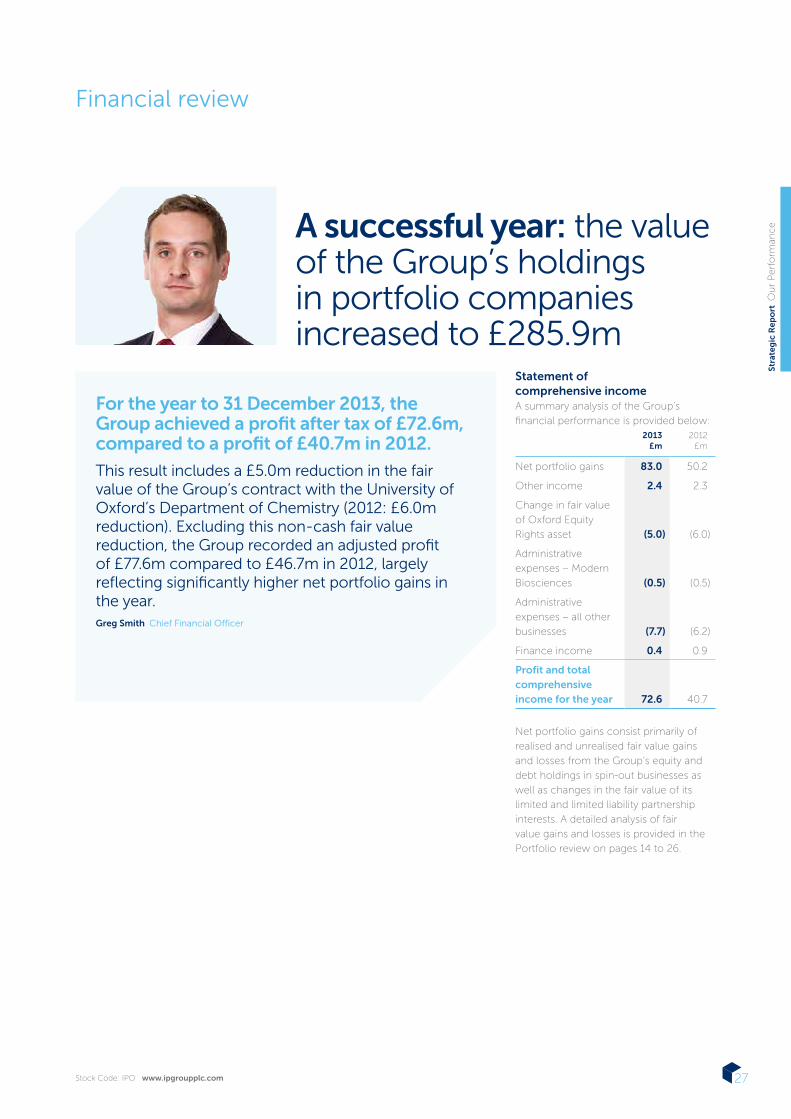
23002-04 Proof 8a 01-04-14
Stock Code: IPO www.ipgroupplc.com 27
Stra
teg
ic R
epo
rt O
ur
Perf
orm
ance
Financial review
Statement of comprehensive incomeA summary analysis of the Group’s
financial performance is provided below:2013
£m2012 £m
Net portfolio gains 83.0 50.2
Other income 2.4 2.3
Change in fair value
of Oxford Equity
Rights asset (5.0) (6.0)
Administrative
expenses – Modern
Biosciences (0.5) (0.5)
Administrative
expenses – all other
businesses (7.7) (6.2)
Finance income 0.4 0.9
Profit and total comprehensive income for the year 72.6 40.7
Net portfolio gains consist primarily of
realised and unrealised fair value gains
and losses from the Group’s equity and
debt holdings in spin-out businesses as
well as changes in the fair value of its
limited and limited liability partnership
interests. A detailed analysis of fair
value gains and losses is provided in the
Portfolio review on pages 14 to 26.
For the year to 31 December 2013, the Group achieved a profit after tax of £72.6m, compared to a profit of £40.7m in 2012.
This result includes a £5.0m reduction in the fair value of the Group’s contract with the University of Oxford’s Department of Chemistry (2012: £6.0m reduction). Excluding this non-cash fair value reduction, the Group recorded an adjusted profit of £77.6m compared to £46.7m in 2012, largely reflecting significantly higher net portfolio gains in the year.Greg Smith Chief Financial Officer
A successful year: the value of the Group’s holdings in portfolio companies increased to £285.9m

23002-04 Proof 8a 01-04-14
IP Group plc Annual Report and Accounts for the year ended 31 December 201328
Stra
teg
ic R
ep
ort
Ou
r P
erf
orm
ance
Financial reviewcontinued
Other income for the year increased
slightly to £2.4m (2012: £2.3m) as an
increase in dividend income from Getech
and Tracsis was largely offset by a lower
level of venture capital fund management
fees. This reduction occurred as IP Venture
Fund continued in its post “investment
period” run-off. However, this too was
offset by the Group raising a successor
fund, IP Venture Fund II, in May 2013. The
Group continues to receive management
fees and has the potential to generate
performance fees from successful
investment performance of both IP
Venture Fund and the NETF, whose
“investment period” is currently anticipated
to continue until the end of 2014.
The Group continued to allocate limited
capital to the evaluation and development
of certain early-stage therapeutic
programmes, including through its
subsidiary Modern Biosciences plc
(“MBS”). These development costs were
expensed to the income statement as
they were incurred. In November 2012,
the Group announced that MBS had been
awarded a grant of up to £1.6m by the UK
Government-backed Biomedical Catalyst.
The award is providing support for MBS’s
lead anti-inflammatory programme,
OsteoRx. The Group intends to continue
developing a small number of early-stage
therapeutic assets.
The Group’s administrative expenses,
excluding those relating to MBS,
increased during the period to £7.7m
(2012: £6.2m), predominantly due to
higher staff costs, and included an
IFRS 2 share-based payments charge
totalling £0.9m (2012: £0.8m) relating to
the Group’s Long-Term Incentive Plan
awards. This non-cash charge reflects
the fair value of services received from
employees, measured by reference to the
fair value of the share-based payments at
the date of award, but has no net impact
on the Group’s total equity or “net assets”.
In April 2013, the 2010 LTIP awards
partially vested with 9,495,195 shares,
representing 81% of the original award,
being issued to the relevant members
of the Company’s staff as a result of the
Group’s strong three-year share price
performance and an increase in “hard”
net assets. Further detail is included in
the Directors’ Remuneration Report on
pages 53 to 70. The 2011 and 2012 LTIP
awards are subject to vesting conditions
until 2014 and 2015 and charges
relating to these awards will continue
to be recognised in the statement of
comprehensive income until this time.
The 2011 LTIP award will ordinarily vest
on or after 31 March 2014 and, based on
the results presented in this report, 100%
of the 2011 awards are anticipated to vest
during 2014.
As a result of the Group’s decreased
average cash balances during the year,
the Group’s interest receivable during the
period fell to £0.4m (2012: £0.9m). It is
expected that the Group’s future finance
income will continue to fluctuate broadly
in line with cash held on balance sheet
and future interest rate changes.
Statement of financial positionThe Group ended the period with net
assets attributable to shareholders of
£337.0m, representing an increase of
£73.9m from the position at 1 January
2013 (£263.1m). As described above,
the most significant contributor to
the increase in net assets during the
period was the performance of the
Group’s portfolio of holdings in spin-
out companies. “Hard” net assets, i.e.
those excluding intangible assets and
the Oxford Equity Rights asset, totalled
£315.5m at 31 December 2013 (2012:
£236.6m).
The Group finished 2013 with cash and
deposits of £24.1m (2012: £47.9m) and
a diversified portfolio of equity and debt
investments in 72 private and publicly
listed technology companies
(2012: 67). On 14 February 2014 the
Group announced its further equity
capital raise of £100m of cash before
expenses.
The value of the Group’s holdings
in portfolio companies increased to
£285.9m at year end (2012: £181.8m)
after net unrealised fair value gains of
£82.4m and net investment of £22.0m
(2012: £38.0m net unrealised fair value
gain; £9.6m net investment). The Portfolio
review on pages 14 to 26 contains a
detailed description of the Group’s
portfolio of equity and debt investments
including key developments and
movements during the year.
The Group’s statement of financial
position includes goodwill of £18.4m
(2012: £18.4m) and an equity rights
asset of £2.9m (2012: £7.9m). The
goodwill balances arose as a result of
the Group’s historical acquisitions of
Techtran Group (university partnership
business, £16.3m; 2012: £16.3m) and Top
Technology Ventures (venture capital
fund management business, £2.1m; 2012:
£2.1m). The equity rights asset represents
amounts paid to the University of Oxford
in 2000 and 2001 giving the Group the
right to receive 50% of the university’s
entitlement to equity in any spin-out
company and of any licensing income
emanating from the University of Oxford’s
Department of Chemistry until 2015.
As highlighted in 2012, the date of
expiry (November 2015) of the contract
underpinning the Oxford Equity Rights
Asset draws closer, and the value to the
Group of the corresponding asset under
IFRS reduces. The asset value will have
been written off by way of fair value
reduction or impairment through the
statement of comprehensive income by
the expiry date. Based on the directors’
calculations, and as described more
fully in note 14 to the Group’s financial
statements, the fair value of the contract
at 31 December 2013 has reduced by
£5.0m (2012: £6.0m).
“IP Group has great
links to the City. They
know the small cap investment
community and have put us in
touch with various funds who are
now investors. As a shareholder
themselves, they have been very
supportive and patient, following
their money several times. The IP
Group team genuinely understands
how a real trading business works
which is markedly different from
other small cap funds.”
John McArthur, CEO Tracsis plc
Testimonial:
Capital

23002-04 Proof 8a 01-04-14
Stock Code: IPO www.ipgroupplc.com 29
Stra
teg
ic R
epo
rt O
ur
Perf
orm
ance
Due to the nature of its activities, the
Group has limited current assets or
current liabilities other than its cash and
short-term deposit balances, which are
considered in more detail below.
Cash, cash equivalents and short-term deposits (“Cash”)The principal constituents of the
movement in Cash during the year are
summarised as follows:2013
£m2012 £m
Net cash used in
operating activities
(excluding cash flows
from deposits) (1.9) (2.6)
Net cash used in
investing activities (21.9) (10.0)
Issued share capital — —
Movement during period (23.8) (12.6)
At 31 December 2013, the Group’s
Cash totalled £24.1m, a decrease of
£23.8m from a total of £47.9m at
31 December 2012 predominantly due
to net investment in the Group’s spin-out
companies.
The Group’s net cash used in investing
activities increased during 2013, reflecting
both an increase in investments (2013:
£27.5m; 2012: £26.3m) and a decrease in
realisations (2013: £5.5m; 2012: £16.7m).
As described in more detail in the
Portfolio review on pages 14 to 26, the
Group allocated a total of £27.5m across
44 portfolio companies during the period
(2012: £26.3m; 43 companies).
A further £0.2m was committed to IP
Venture Fund (2012: £0.4m), which in
turn invested £1.4m across six portfolio
companies (2012: £3.0m; 15 companies)
and realised £1.8m from one partial
disposal. Overall, net cash used in
investing activities totalled £21.9m
(2012: £10.0m).
Primarily as a result of a £1.1m increase
in trade and other payables, which was
partially offset by higher administrative
costs during the period, cash used in
operating activities decreased to £1.9m
(2012: £2.6m).
It remains the Group’s policy to place
cash which is surplus to near-term
working capital requirements on short-
term and overnight deposits with financial
institutions that meet the Group’s
treasury policy criteria and in low-risk
treasury funds rated “AA” or above. The
Group’s treasury policy is described in
detail in note 2 to the Group financial
statements alongside details of the credit
ratings of the Group’s cash and deposit
counterparties.
At 31 December 2013, the Group
recognises £1.3m of loans (2012: £nil)
from the limited partners of IPVFII, a
fund raised during the period which is
consolidated into the Group’s year-end
figures. These loans are only repayable
upon IPVFII generating sufficient returns
to repay the limited partners. Whilst the
Group continued to have no borrowings,
it may in the future consider introducing a
modest level of gearing into the business
if this is considered to be in the best
interests of the Group.
During the period, the Group
incorporated a new subsidiary, IP Group
Inc., in Delaware, USA in order to support
the development of US-based intellectual
property commercialisation opportunities.
The Group holds a total of £0.1m
(2012: £nil) in US dollars.
TaxationSince the Group’s activities are mainly
trading in nature, the directors continue
to believe that the Group qualifies for
the Substantial Shareholdings Exemption
(“SSE”) on chargeable gains arising on
the disposal of qualifying holdings and,
as such, the Group has continued not
to recognise a provision for deferred
taxation in respect of uplifts in value
on those equity stakes which meet
the qualifying criteria. The Group’s
unrecognised deferred tax assets and
liabilities are set out in note 9 to the
financial statements.
Total equity (“net assets”) (£m)
£336.6m (2012: £263.1m)
2013
336.6
2012
263.1
2011
221.6
2010
173.1
2009
171.0
Profit/(loss) attributable to equity holders (£m)
£72.6m (2012: £40.7m)
2013
72.6
2012
40.7
2011
(5.5)
2010
1.8
2009
(6.1)
Cash, cash equivalents and deposits (£m)
£24.1m (2012: £47.9m)
2013
24.1
2012
47.9
2011
60.5
2010
21.5
2009
28.1

Measuring our performance: focusing on delivery against our strategy
23002-04 Proof 8a 01-04-14
IP Group plc Annual Report and Accounts for the year ended 31 December 201330
Stra
teg
ic R
ep
ort
Ou
r P
erf
orm
ance
Key performance indicators
KPI Further description 2013 performance Strategic element Risks potentially impacting KPILink to performance related director remuneration
Total equity (“net assets”) The value of the Group’s assets less the value of
its liabilities, including minority interest
£336.6m (2012: £263.1m)
To grow the value of our assets (and
those we manage on behalf of third
parties) and deliver attractive financial
returns from these assets.
1 2 5 • LTIP 2011
• LTIP 2012
• 2013 annual incentive
Profit/(loss) attributable to equity holders
Profit/(loss) after tax for the year, attributable to
owners of the parent
£72.6m (2012: £40.7m)
Portfolio fair value movement has the
most material impact on this figure
which also reflects corporate expenses.
Measures the development of portfolio
companies and return on our assets.
1 2 5 • 2013 annual incentive
Number of new portfolio companies The number of portfolio companies that received
initial capital from the Group during the year
9 (2012: 11)
Build and maintain a pipeline of IP-based
opportunities and develop these into
robust businesses.
3 4 • N/A
Purchase of equity and debt investments
The total level of capital deployed from the
Group’s balance sheet into portfolio companies
during the year
£27.5m (2012: £26.3m)
Build and maintain a pipeline of IP-based
opportunities and develop these into
robust businesses.
2 3 4 • N/A
Change in fair value of equity and debt investments
Movement in the value of holdings in the
portfolio due to share price movements or
impairments in value
£82.4m (2012: £38.0m)
To develop IP-based businesses and
grow their value1 2 • N/A
Proceeds from sale of equity investments
The total amount received from the disposal of
interests in portfolio companies
£5.5m (2012: £16.7m)
Cash from proceeds can be used for
re-deployment into the portfolio or for
new opportunities
1 5 • N/A
Cash, cash equivalents and deposits The total amount of cash and short-term deposits
held on the Group’s balance sheet at year end
£24.1m (2012: £47.9m)
Cash is required to enable the Group to
provide capital to compelling intellectual
IP-based opportunities
1 5 • N/A
IP Group share price performance (% change)
Movement in the value of the Group’s shares
during the year under assessment
42% (2012: 53%)
To provide attractive returns for our
shareholders1 2 3 4 5 • LTIP 2011
• LTIP 2012
• 2013 annual incentive

23002-04 Proof 8a 01-04-14
Stock Code: IPO www.ipgroupplc.com 31
Stra
teg
ic R
epo
rt O
ur
Perf
orm
ance
KPI Further description 2013 performance Strategic element Risks potentially impacting KPILink to performance related director remuneration
Total equity (“net assets”) The value of the Group’s assets less the value of
its liabilities, including minority interest
£336.6m (2012: £263.1m)
To grow the value of our assets (and
those we manage on behalf of third
parties) and deliver attractive financial
returns from these assets.
1 2 5 • LTIP 2011
• LTIP 2012
• 2013 annual incentive
Profit/(loss) attributable to equity holders
Profit/(loss) after tax for the year, attributable to
owners of the parent
£72.6m (2012: £40.7m)
Portfolio fair value movement has the
most material impact on this figure
which also reflects corporate expenses.
Measures the development of portfolio
companies and return on our assets.
1 2 5 • 2013 annual incentive
Number of new portfolio companies The number of portfolio companies that received
initial capital from the Group during the year
9 (2012: 11)
Build and maintain a pipeline of IP-based
opportunities and develop these into
robust businesses.
3 4 • N/A
Purchase of equity and debt investments
The total level of capital deployed from the
Group’s balance sheet into portfolio companies
during the year
£27.5m (2012: £26.3m)
Build and maintain a pipeline of IP-based
opportunities and develop these into
robust businesses.
2 3 4 • N/A
Change in fair value of equity and debt investments
Movement in the value of holdings in the
portfolio due to share price movements or
impairments in value
£82.4m (2012: £38.0m)
To develop IP-based businesses and
grow their value1 2 • N/A
Proceeds from sale of equity investments
The total amount received from the disposal of
interests in portfolio companies
£5.5m (2012: £16.7m)
Cash from proceeds can be used for
re-deployment into the portfolio or for
new opportunities
1 5 • N/A
Cash, cash equivalents and deposits The total amount of cash and short-term deposits
held on the Group’s balance sheet at year end
£24.1m (2012: £47.9m)
Cash is required to enable the Group to
provide capital to compelling intellectual
IP-based opportunities
1 5 • N/A
IP Group share price performance (% change)
Movement in the value of the Group’s shares
during the year under assessment
42% (2012: 53%)
To provide attractive returns for our
shareholders1 2 3 4 5 • LTIP 2011
• LTIP 2012
• 2013 annual incentive
For more information on our strategy see pages 10 and 11
For more information on our risk management see pages 32 to 37
For more information on directors’ remuneration see pages 53 to 70

23002-04 Proof 8a 01-04-14
IP Group plc Annual Report and Accounts for the year ended 31 December 201332
Stra
teg
ic R
ep
ort
Ris
k M
anag
em
en
t
Risk management
Strong and effective risk management is central to how the Directors run the business and supports the achievement of the Group’s strategic objectives. The Board believes that ongoing consideration and regular updates to the risk management framework enables the effective balancing of risk and reward.
Managing risk: our framework for balancing risk and reward
Ongoing process to evaluate and update the risk management framework, to consider the level of risk appetite for each risk and the operating effectiveness of each ‘line of defence’.
Financial and non-financial risks are recorded in the Group’s risk register. Risks are analysed for likelihood and potential impact.
Required actions are agreed and assigned, and deadlines are set.
Risk assessments are monitored regularly by the Audit Committee and overseen by the Board.
RiskFramework
Develop and communicate strategy and
objectives
Mitigate risk
Identify and assess risks
Review and monitor
success of actions
The framework for evaluating risk is:

23002-04 Proof 8a 01-04-14
Stock Code: IPO www.ipgroupplc.com 33
Stra
teg
ic R
epo
rt R
isk
Man
agem
en
t
‘Levels of defence’ applied by the Group:
Strategic
Operational
External
Board (1)
Executive management (5)
Independent assurance (8)
Audit Committee (2) Remuneration Committee (3) Nomination committee (4)
Investment committee (6) Legal Compliance (7)
1. The Board has overall responsibility
for the Group’s risk management and
internal controls, sets the ‘tone from
the top’, sets the strategic objectives,
defines the risk appetite and monitors
the risk exposure. The whistleblowing
policy encourages disclosures to be
addressed to the Board Chairman and/
or any other Non-executive Director.
2. The Audit Committee oversees the
effectiveness of the internal control
function and risk management
systems within the Group.
3. The Remuneration Committee
ensures the appropriate incentivisation
of Executive directors and staff.
4. The Nomination Committee ensures
that the Board has the appropriate
balance of skills and knowledge
required to assess and address risk,
and that appropriate succession plans
are in place.
5. Executive management identify, assess
and manage the risks identified.
6. The Investment Committee reviews
the merits of each investment
proposal and ensures that investment
decisions are aligned with the Group’s
strategic objectives and within the
acceptable risk limits.
7. The compliance function ensures that
all regulated activity undertaken is
within the regulated boundaries and
permissions.
8. Independent assurance is provided by
the independent auditors and various
external consultants and advisers.
External consultants and advisers
support management and the Board
through ad hoc consulting activities,
as required.
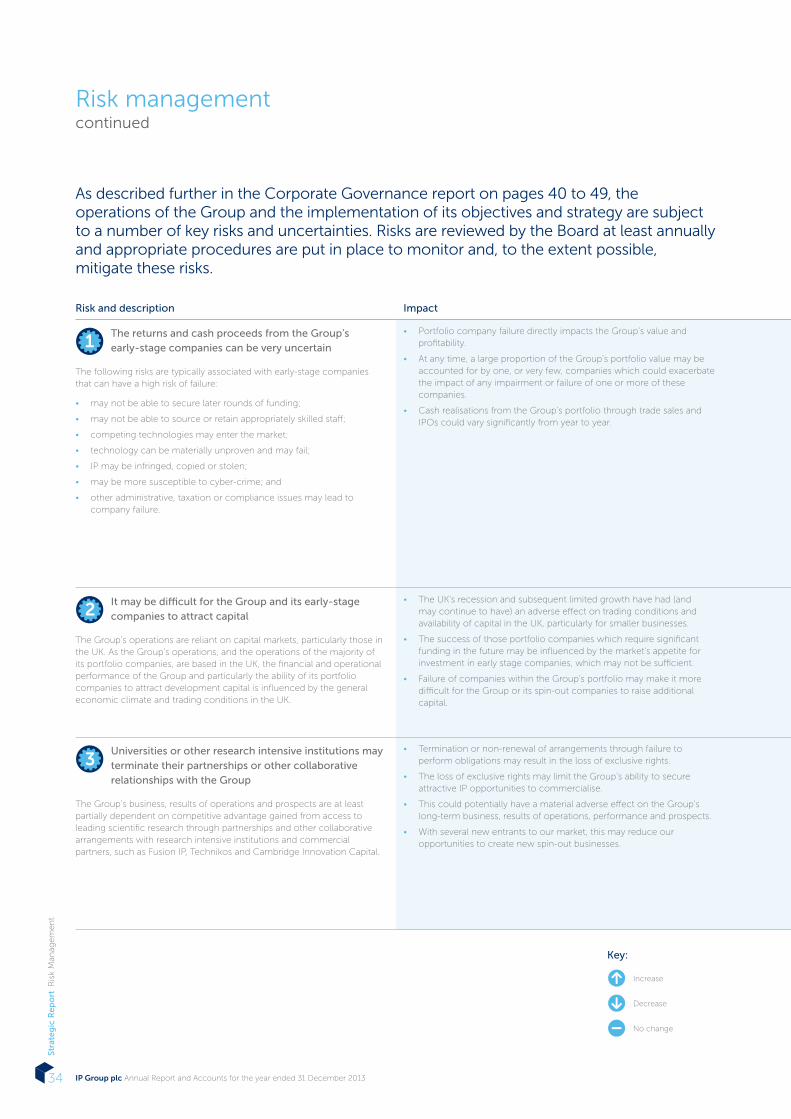
23002-04 Proof 8a 01-04-14
IP Group plc Annual Report and Accounts for the year ended 31 December 201334
Stra
teg
ic R
ep
ort
Ris
k M
anag
em
en
t
Risk managementcontinued
As described further in the Corporate Governance report on pages 40 to 49, the operations of the Group and the implementation of its objectives and strategy are subject to a number of key risks and uncertainties. Risks are reviewed by the Board at least annually and appropriate procedures are put in place to monitor and, to the extent possible, mitigate these risks.
Risk and description Impact Mitigation Risk trend Progress during the year KPI
1The returns and cash proceeds from the Group’s early-stage companies can be very uncertain
The following risks are typically associated with early-stage companies that can have a high risk of failure:
• may not be able to secure later rounds of funding;
• may not be able to source or retain appropriately skilled staff;
• competing technologies may enter the market;
• technology can be materially unproven and may fail;
• IP may be infringed, copied or stolen;
• may be more susceptible to cyber-crime; and
• other administrative, taxation or compliance issues may lead to company failure.
• Portfolio company failure directly impacts the Group’s value and profitability.
• At any time, a large proportion of the Group’s portfolio value may be accounted for by one, or very few, companies which could exacerbate the impact of any impairment or failure of one or more of these companies.
• Cash realisations from the Group’s portfolio through trade sales and IPOs could vary significantly from year to year.
• The Group’s staff have significant experience in sourcing, developing and growing early-stage technology companies to significant value, including systematic opportunity evaluation and business building methodologies.
• Members of the Group’s senior team often serve as non-executive directors or advisers to portfolio companies to help identify and remedy critical issues promptly.
• Support on operational, legal and company secretarial matters is offered to minimise failures due to common administrative factors.
• The Group has spin-out company holdings across different sectors to reduce the impact of a single company failure or sector demise.
• The Group maintains significant cash balances and seeks to employ a capital efficient process deploying low levels of initial capital to enable identification and mitigation of potential failures at the earliest possible stage.
• The Group broadly maintained its rate of capital deployment into its portfolio in the year
• Significant increase in portfolio value driven by progress across a number of portfolio companies.
• Some signs of increased liquidity and shareholder risk appetite observed on AIM.
• Change in fair value of equity and debt investments.
• Purchase of equity and debt investments.
• Proceeds from the sale of equity investments.
2It may be difficult for the Group and its early-stage companies to attract capital
The Group’s operations are reliant on capital markets, particularly those in the UK. As the Group’s operations, and the operations of the majority of its portfolio companies, are based in the UK, the financial and operational performance of the Group and particularly the ability of its portfolio companies to attract development capital is influenced by the general economic climate and trading conditions in the UK.
• The UK’s recession and subsequent limited growth have had (and may continue to have) an adverse effect on trading conditions and availability of capital in the UK, particularly for smaller businesses.
• The success of those portfolio companies which require significant funding in the future may be influenced by the market’s appetite for investment in early stage companies, which may not be sufficient.
• Failure of companies within the Group’s portfolio may make it more difficult for the Group or its spin-out companies to raise additional capital.
• The Group has significant balance sheet and managed funds capital to deploy in attractive portfolio opportunities.
• The Group operates a corporate finance function which carries out fundraising mandates for portfolio companies.
• The Group maintains close relationships with a wide variety of co-investors that focus on companies at differing stages of development.
• Some strengthening of economic outlook and increased liquidity/risk appetite in the equity capital markets, albeit from a low base.
• The Group raised £100m in February 2014, of which the majority is intended to be deployed into the portfolio.
• Change in fair value of equity and debt investments.
• Total equity (“net assets”).
• Profit/loss attributable to equity holders.
3Universities or other research intensive institutions may terminate their partnerships or other collaborative relationships with the Group
The Group’s business, results of operations and prospects are at least partially dependent on competitive advantage gained from access to leading scientific research through partnerships and other collaborative arrangements with research intensive institutions and commercial partners, such as Fusion IP, Technikos and Cambridge Innovation Capital.
• Termination or non-renewal of arrangements through failure to perform obligations may result in the loss of exclusive rights.
• The loss of exclusive rights may limit the Group’s ability to secure attractive IP opportunities to commercialise.
• This could potentially have a material adverse effect on the Group’s long-term business, results of operations, performance and prospects.
• With several new entrants to our market, this may reduce our opportunities to create new spin-out businesses.
• The Group continues to consider and, where appropriate, enter into new and innovative partnerships and collaborations with research institutions.
• The Group has been able to source opportunities through non-exclusive relationships and other sources.
• Members of the Group’s senior team work closely with partner institutions to ensure that each commercial relationship is mutually beneficial and productive.
• The Group’s track record in IP commercialisation may make the Group a partner of choice for other institutions, acting as a barrier to entry to competitors.
• PoP agreement signed with University of Manchester.
• Pilot agreements signed with two Ivy League US universities.
• Oxford Chemistry contract due to expire in November 2015.
• Full access to Fusion IP university partners anticipated assuming completion of full acquisition.
• Number of new portfolio companies.
Key:
Increase
Decrease
No change

23002-04 Proof 8a 01-04-14
Stock Code: IPO www.ipgroupplc.com 35
Stra
teg
ic R
epo
rt R
isk
Man
agem
en
t
Risk and description Impact Mitigation Risk trend Progress during the year KPI
1The returns and cash proceeds from the Group’s early-stage companies can be very uncertain
The following risks are typically associated with early-stage companies that can have a high risk of failure:
• may not be able to secure later rounds of funding;
• may not be able to source or retain appropriately skilled staff;
• competing technologies may enter the market;
• technology can be materially unproven and may fail;
• IP may be infringed, copied or stolen;
• may be more susceptible to cyber-crime; and
• other administrative, taxation or compliance issues may lead to company failure.
• Portfolio company failure directly impacts the Group’s value and profitability.
• At any time, a large proportion of the Group’s portfolio value may be accounted for by one, or very few, companies which could exacerbate the impact of any impairment or failure of one or more of these companies.
• Cash realisations from the Group’s portfolio through trade sales and IPOs could vary significantly from year to year.
• The Group’s staff have significant experience in sourcing, developing and growing early-stage technology companies to significant value, including systematic opportunity evaluation and business building methodologies.
• Members of the Group’s senior team often serve as non-executive directors or advisers to portfolio companies to help identify and remedy critical issues promptly.
• Support on operational, legal and company secretarial matters is offered to minimise failures due to common administrative factors.
• The Group has spin-out company holdings across different sectors to reduce the impact of a single company failure or sector demise.
• The Group maintains significant cash balances and seeks to employ a capital efficient process deploying low levels of initial capital to enable identification and mitigation of potential failures at the earliest possible stage.
• The Group broadly maintained its rate of capital deployment into its portfolio in the year
• Significant increase in portfolio value driven by progress across a number of portfolio companies.
• Some signs of increased liquidity and shareholder risk appetite observed on AIM.
• Change in fair value of equity and debt investments.
• Purchase of equity and debt investments.
• Proceeds from the sale of equity investments.
2It may be difficult for the Group and its early-stage companies to attract capital
The Group’s operations are reliant on capital markets, particularly those in the UK. As the Group’s operations, and the operations of the majority of its portfolio companies, are based in the UK, the financial and operational performance of the Group and particularly the ability of its portfolio companies to attract development capital is influenced by the general economic climate and trading conditions in the UK.
• The UK’s recession and subsequent limited growth have had (and may continue to have) an adverse effect on trading conditions and availability of capital in the UK, particularly for smaller businesses.
• The success of those portfolio companies which require significant funding in the future may be influenced by the market’s appetite for investment in early stage companies, which may not be sufficient.
• Failure of companies within the Group’s portfolio may make it more difficult for the Group or its spin-out companies to raise additional capital.
• The Group has significant balance sheet and managed funds capital to deploy in attractive portfolio opportunities.
• The Group operates a corporate finance function which carries out fundraising mandates for portfolio companies.
• The Group maintains close relationships with a wide variety of co-investors that focus on companies at differing stages of development.
• Some strengthening of economic outlook and increased liquidity/risk appetite in the equity capital markets, albeit from a low base.
• The Group raised £100m in February 2014, of which the majority is intended to be deployed into the portfolio.
• Change in fair value of equity and debt investments.
• Total equity (“net assets”).
• Profit/loss attributable to equity holders.
3Universities or other research intensive institutions may terminate their partnerships or other collaborative relationships with the Group
The Group’s business, results of operations and prospects are at least partially dependent on competitive advantage gained from access to leading scientific research through partnerships and other collaborative arrangements with research intensive institutions and commercial partners, such as Fusion IP, Technikos and Cambridge Innovation Capital.
• Termination or non-renewal of arrangements through failure to perform obligations may result in the loss of exclusive rights.
• The loss of exclusive rights may limit the Group’s ability to secure attractive IP opportunities to commercialise.
• This could potentially have a material adverse effect on the Group’s long-term business, results of operations, performance and prospects.
• With several new entrants to our market, this may reduce our opportunities to create new spin-out businesses.
• The Group continues to consider and, where appropriate, enter into new and innovative partnerships and collaborations with research institutions.
• The Group has been able to source opportunities through non-exclusive relationships and other sources.
• Members of the Group’s senior team work closely with partner institutions to ensure that each commercial relationship is mutually beneficial and productive.
• The Group’s track record in IP commercialisation may make the Group a partner of choice for other institutions, acting as a barrier to entry to competitors.
• PoP agreement signed with University of Manchester.
• Pilot agreements signed with two Ivy League US universities.
• Oxford Chemistry contract due to expire in November 2015.
• Full access to Fusion IP university partners anticipated assuming completion of full acquisition.
• Number of new portfolio companies.
Were more than one of the risks to occur together, the overall impact on the Group may be compounded. A summary of the key risks affecting the Group and the steps taken to manage these is set out as follows:
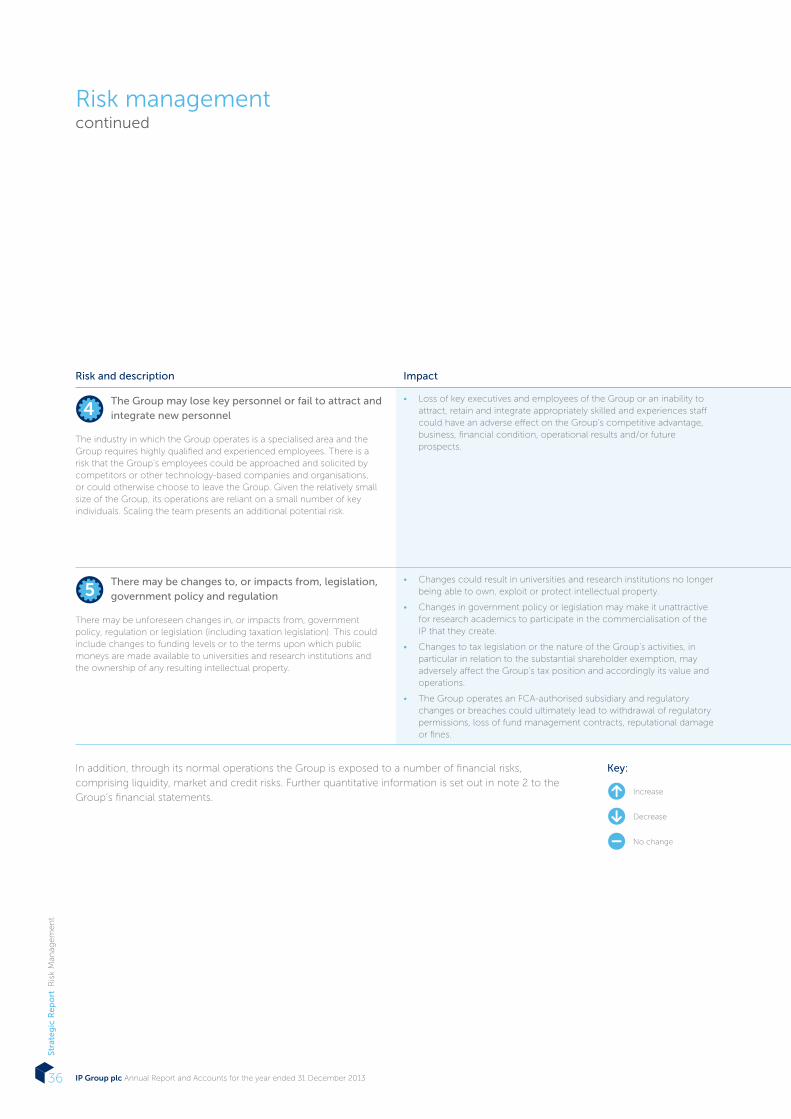
23002-04 Proof 8a 01-04-14
IP Group plc Annual Report and Accounts for the year ended 31 December 201336
Stra
teg
ic R
ep
ort
Ris
k M
anag
em
en
t
Risk managementcontinued
Risk and description Impact Mitigation Risk trend Progress during the year KPI
4The Group may lose key personnel or fail to attract and integrate new personnel
The industry in which the Group operates is a specialised area and the Group requires highly qualified and experienced employees. There is a risk that the Group’s employees could be approached and solicited by competitors or other technology-based companies and organisations, or could otherwise choose to leave the Group. Given the relatively small size of the Group, its operations are reliant on a small number of key individuals. Scaling the team presents an additional potential risk.
• Loss of key executives and employees of the Group or an inability to attract, retain and integrate appropriately skilled and experiences staff could have an adverse effect on the Group’s competitive advantage, business, financial condition, operational results and/or future prospects.
• Senior team succession plans are in place and updated regularly.
• The Group carries out regular market comparisons for staff and executive remuneration.
• The Group seeks to offer a balanced incentive package comprising a mix of salary, benefits, performance-based long-term incentives and benefits such as flexible working or salary sacrifice arrangements.
• The long-term incentives for all senior staff are in the form of shares in the Group and all executives are shareholders in the business.
• The Group encourages staff development and inclusion through coaching and mentoring.
• The Group undertook a full remuneration and incentivisation review in 2013 and continues to dedicate resource to this.
• The Group is anticipated to increase the breadth and depth of its staff as a result of the Fusion IP acquisition (subject to completion)
• Total equity (“net assets”)
• IP Group share price performance
5There may be changes to, or impacts from, legislation, government policy and regulation
There may be unforeseen changes in, or impacts from, government policy, regulation or legislation (including taxation legislation). This could include changes to funding levels or to the terms upon which public moneys are made available to universities and research institutions and the ownership of any resulting intellectual property.
• Changes could result in universities and research institutions no longer being able to own, exploit or protect intellectual property.
• Changes in government policy or legislation may make it unattractive for research academics to participate in the commercialisation of the IP that they create.
• Changes to tax legislation or the nature of the Group’s activities, in particular in relation to the substantial shareholder exemption, may adversely affect the Group’s tax position and accordingly its value and operations.
• The Group operates an FCA-authorised subsidiary and regulatory changes or breaches could ultimately lead to withdrawal of regulatory permissions, loss of fund management contracts, reputational damage or fines.
• University partners are incentivised to protect their IP for exploitation as the partnership agreements share returns between universities, academic founders and the Group.
• The Group’s university partners also maintain close links with the government to manage their position with respect to future legislative changes.
• The Group utilises professional advisers as appropriate to support its monitoring of, and response to changes in, tax or other legislation.
• The Group has internal policies and procedures to ensure its compliance with applicable FCA regulations and these are subject to external review.
• Ongoing focus on regulatory compliance including third party reviews.
• No apparent reduction in governmental support of research and intellectual property focused businesses.
• Total equity (“net assets”).
• IP Group share price performance.
Key:
Increase
Decrease
No change
In addition, through its normal operations the Group is exposed to a number of financial risks,
comprising liquidity, market and credit risks. Further quantitative information is set out in note 2 to the
Group’s financial statements.

23002-04 Proof 8a 01-04-14
Stock Code: IPO www.ipgroupplc.com 37
Stra
teg
ic R
epo
rt R
isk
Man
agem
en
t
Risk and description Impact Mitigation Risk trend Progress during the year KPI
4The Group may lose key personnel or fail to attract and integrate new personnel
The industry in which the Group operates is a specialised area and the Group requires highly qualified and experienced employees. There is a risk that the Group’s employees could be approached and solicited by competitors or other technology-based companies and organisations, or could otherwise choose to leave the Group. Given the relatively small size of the Group, its operations are reliant on a small number of key individuals. Scaling the team presents an additional potential risk.
• Loss of key executives and employees of the Group or an inability to attract, retain and integrate appropriately skilled and experiences staff could have an adverse effect on the Group’s competitive advantage, business, financial condition, operational results and/or future prospects.
• Senior team succession plans are in place and updated regularly.
• The Group carries out regular market comparisons for staff and executive remuneration.
• The Group seeks to offer a balanced incentive package comprising a mix of salary, benefits, performance-based long-term incentives and benefits such as flexible working or salary sacrifice arrangements.
• The long-term incentives for all senior staff are in the form of shares in the Group and all executives are shareholders in the business.
• The Group encourages staff development and inclusion through coaching and mentoring.
• The Group undertook a full remuneration and incentivisation review in 2013 and continues to dedicate resource to this.
• The Group is anticipated to increase the breadth and depth of its staff as a result of the Fusion IP acquisition (subject to completion)
• Total equity (“net assets”)
• IP Group share price performance
5There may be changes to, or impacts from, legislation, government policy and regulation
There may be unforeseen changes in, or impacts from, government policy, regulation or legislation (including taxation legislation). This could include changes to funding levels or to the terms upon which public moneys are made available to universities and research institutions and the ownership of any resulting intellectual property.
• Changes could result in universities and research institutions no longer being able to own, exploit or protect intellectual property.
• Changes in government policy or legislation may make it unattractive for research academics to participate in the commercialisation of the IP that they create.
• Changes to tax legislation or the nature of the Group’s activities, in particular in relation to the substantial shareholder exemption, may adversely affect the Group’s tax position and accordingly its value and operations.
• The Group operates an FCA-authorised subsidiary and regulatory changes or breaches could ultimately lead to withdrawal of regulatory permissions, loss of fund management contracts, reputational damage or fines.
• University partners are incentivised to protect their IP for exploitation as the partnership agreements share returns between universities, academic founders and the Group.
• The Group’s university partners also maintain close links with the government to manage their position with respect to future legislative changes.
• The Group utilises professional advisers as appropriate to support its monitoring of, and response to changes in, tax or other legislation.
• The Group has internal policies and procedures to ensure its compliance with applicable FCA regulations and these are subject to external review.
• Ongoing focus on regulatory compliance including third party reviews.
• No apparent reduction in governmental support of research and intellectual property focused businesses.
• Total equity (“net assets”).
• IP Group share price performance.
The Strategic Report, as set out on pages 01 to 37, has been approved by the Board.
ON BEHALF OF THE BOARD
Bruce Smith Chairman3 March 2014
Board approval

23002-04 Proof 8a 01-04-14
IP Group plc Annual Report and Accounts for the year ended 31 December 201338
Ou
r G
ove
rnan
ce O
verv
iew
Dr Bruce Smith, CBENon-executive Chairman
Alan AubreyChief Executive Officer
Greg SmithChief Financial Officer
Mike TownendChief Investment Officer
Charles WinwardManaging Director, TTV
Effective date of current letter of appointment3 September 20071
Age74
IndependentN/A2
Tenure11 years
Term of office3 years, with 3 months’ notice
Re-election to Board Annually at AGM
Experience Founder of Smith System Engineering Ltd. Fellow of Royal Academy of Engineering, Institution of Engineering and Technology and Institute of Physics, Domus Fellow of St. Catherine’s College, Oxford
Current external appointments3
Chairman of the Council of Smith Institute for Industrial Mathematics and System Engineering
Committee membershipsNomination (chair)
N
Effective date of current service contract20 January 2005
Age52
IndependentNo
Tenure9 years
Term of officePermanent, 6 months’ notice
Re-election to Board Annually at AGM
Experience Founder of Techtran Group, 7 years as partner at KPMG, FCA 20+ years
Current external appointments3
NED Department of Business, Innovation and Skills, Non-executive chairman Proactis Holdings plc
Committee membershipsNone
Effective date of current service contract2 June 2011
Age35
IndependentNo
Tenure2 years
Term of officePermanent, 6 months’ notice
Re-election to Board Annually at AGM
Experience KPMG background, 10+ yrs ACA
Current external appointments3
None
Committee membershipsNone
Effective date of current service contract5 March 2007
Age51
IndependentNo
Tenure7 years
Term of officePermanent, 6 months’ notice
Re-election to Board Annually at AGM
Experience 17+ years equity capital markets experience at Lehman Brothers and Donaldson, Lufkin and Jenrette
Current external appointments3
None
Committee membershipsNone
Effective date of current service contract14 October 2011
Age44
IndependentNo
Tenure2 years
Term of officePermanent, 6 months’ notice
Re-election to Board Annually at AGM
Experience 7 years VP Technology at JP Morgan, CFA Charterholder, MBA Berkeley
Current external appointments3
None
Committee membershipsNone
Board of Directors
1. Refers to current appointment. Dr Smith was first appointed to the Group’s Board on 4 September 2003.
2. Dr Smith was considered by the Board to be independent on appointment.
3. Excludes appointments to group portfolio company boards.

23002-04 Proof 8a 01-04-14
Stock Code: IPO www.ipgroupplc.com 39
Ou
r G
ove
rnan
ce O
verv
iew
Mike HumphreySenior Independent Director
Francis CarpenterNon-executive Director
Jonathan BrooksNon-executive Director
Professor Lynn Gladden, CBENon-executive Director
Effective date of current letter of appointment14 October 2011
Age62
IndependentYes
Tenure2 years
Term of office3 years, with 3 months’ notice
Re-election to Board Annually at AGM
Experience Formerly 40+ years at Croda plc including 13 years as CEO
Current external appointments3
None
Committee membershipsNomination, Audit and Remuneration
N A A R
Effective date of current letter of appointment3 April 2008
Age71
IndependentYes
Tenure5 years
Term of office3 years, with 3 months’ notice
Re-election to Board Annually at AGM
Experience Formerly CEO European Investment Fund and Secretary General of European Investment Bank
Current external appointments3
17 Capital LLP supervisory board
iVCi investment committee
Committee membershipsNomination, Audit and Remuneration (chair)
N A A R
Effective date of current letter of appointment31 August 2011
Age57
IndependentYes
Tenure2 years
Term of office3 years, with 3 months’ notice
Re-election to Board Annually at AGM
Experience Formerly CFO ARM Holdings plc, 20+ years technology sector experience, FCMA
Current external appointments3
Audit committee chairman Aveva plc
Chairman Xyratex (NASDAQ)
Committee membershipsNomination, Audit (chair) and Remuneration
N A A R
Effective date of current letter of appointment26 March 2014
Age52
IndependentYes
Tenure< 1 year
Term of office3 years, with 3 months’ notice
Re-election to Board Annually at AGM
Experience Fellow of the Royal Society, Royal Academy of Engineering, Institution of Chemical Engineers, Royal Society of Chemistry and Institute of Physics
Current external appointments3
Pro-Vice-Chancellor for Research, University of Cambridge. Shell Professor of Chemical Engineering. Director, Cambridge Enterprise Ltd
Committee membershipsNomination, Audit and Remuneration
N A A R
A R
N
A
Key:
Nomination Committee
Audit Committee
Remuneration Committee

23002-04 Proof 8a 01-04-14
IP Group plc Annual Report and Accounts for the year ended 31 December 201340
Ou
r G
ove
rnan
ce O
verv
iew
Corporate Governance
Compliance with the UK Corporate Governance CodeThe Directors are committed to a high
standard of corporate governance and
to compliance with the best practice of
the UK Corporate Governance Code (the
“Code”) which was issued by the Financial
Reporting Council in 2010 and revised
in September 2012. During the twelve
months ended 31 December 2013, the
Directors consider that the Company has
been in compliance with the provisions
set out in the Code with the following
exception: the requirement under the
Code (Section B.1.2) for at least half
the Board, excluding the Chairman, to
comprise Non-executive Directors was
not met during the year. The Nomination
Committee has met on a number of
occasions throughout the year to debate
this specific issue, amongst others, one
of the outcomes of which has led to the
appointment of Professor Lynn Gladden
as an additional independent Non-
executive Director with effect from
26 March 2014. The Company will
accordingly be compliant with Section
B.1.2 of the Code with effect from
Professor Gladden’s appointment.
Further explanation as to how the
provisions set out in the Code have
been applied by the Company is set
out in the following statement, the
Directors’ Remuneration Report, the Audit
Committee Report and the Strategic
Report. The Company’s auditor, BDO
LLP, is required to review whether the
above statement reflects the Company’s
compliance with the provisions of the
Code specified for its review by the
Listing Rules of the UK Listing Authority
and to report if it does not reflect such
compliance; no such report has been
made.
2013 has been a year of strong performance for IP Group which has been reflected in a significant increase in the value of the Group’s portfolio and its net assets.
The Board remains focused on the execution of the Group’s strategy, working with its partners to develop outstanding intellectual property-based businesses, and, in doing so, it continues to recognise the importance of a strong focus on corporate governance. Corporate governance at IP Group is more than just compliance with rules and regulations. It is an integral part of all of our activities, especially those of the Board and its committees.
During 2013 and in early 2014, the Board has seen a number of changes to its composition and I am pleased to report that, following Professor Lynn Gladden’s recent appointment, we are now compliant with the provisions of the Code. Professor Gladden’s appointment strengthens the Board’s diversity amongst a range of measures and her knowledge of both science and business is highly relevant to the IP Group model and will be of huge value to the Group as we continue to expand and grow. Succession planning, both at Board level and in other key areas of the business, will continue to remain an area of focus for the Board as we move through 2014.
The Board is accountable to the Company’s shareholders for good governance and this report, together with the Reports of the Remuneration, Nomination and Audit Committees of the Board describes our detailed approach to corporate governance and further information on the key developments in these areas during the year.
I look forward to being able to discuss these matters with our shareholders at the Group’s forthcoming AGM or indeed at any other
point during the year.
Dr Bruce Smith Chairman
A successful year: addressing Board diversity

23002-04 Proof 8a 01-04-14
Stock Code: IPO www.ipgroupplc.com 41
Ou
r G
ove
rnan
ce O
verv
iew
The BoardRole and responsibilities of the Board The Board is responsible to shareholders
for the overall management of the Group
as a whole, providing entrepreneurial
leadership within a framework of
controls for assessing and managing risk;
defining, challenging and interrogating
the Group’s strategic aims and direction;
maintaining the policy and decision-
making framework in which such
strategic aims are implemented; ensuring
that the necessary financial and human
resources are in place to meet strategic
aims; monitoring performance against
key financial and non-financial indicators;
succession planning; overseeing the
system of risk management; setting
values and standards in governance
matters and monitoring policies and
performance on corporate social
responsibility. The directors are also
responsible for ensuring that obligations
to shareholders and other stakeholders
are understood and met and a satisfactory
dialogue with shareholders is maintained.
All directors are equally accountable
to the Company’s shareholders for the
proper stewardship of its affairs and the
long-term success of the Group.
The responsibility of the directors
is collective, taking into account
their respective roles as Executive
Directors and Non-executive
Directors. The Executive Directors
are directly responsible for running
the business operations and the Non-
executive Directors are responsible for
constructively challenging proposals on
strategy, scrutinising the performance
of management, determining levels
of remuneration and for succession
planning for the Executive Directors. The
Non-executive Directors must also satisfy
themselves on the integrity of financial
information and that financial controls
and systems of risk management are
robust.
The Board reviews strategic issues on
a regular basis and exercises control
over the performance of the Group
by agreeing budgetary targets and
monitoring performance against
those targets. The Board has overall
responsibility for the Group’s system of
internal controls and risk management,
as described on pages 32 to 37. Any
decisions made by the Board on policies
and strategy to be adopted by the Group
or changes to current policies and
strategy are made following presentations
by the Executive Directors and a detailed
process of review and challenge by
the Board. Once made, the Executive
Directors are fully empowered to
implement those decisions.
Except for a formal schedule of matters
which are reserved for decision and
approval by the Board, the Board has
delegated the day-to-day management
of the Group to the Chief Executive
Officer who is supported by the Executive
Directors and other members of the
senior management team. The schedule
of matters reserved for Board decision
and approval are those significant to the
Group as a whole due to their strategic,
financial or reputational implications.
This schedule is reviewed and updated
regularly and currently includes those
matters set out in the box overleaf.
Chief Executive
Remuneration Committee
Nomination Committee
AuditCommittee Board
SeniorManagement
Team

23002-04 Proof 8a 01-04-14
IP Group plc Annual Report and Accounts for the year ended 31 December 201342
Ou
r G
ove
rnan
ce O
verv
iew
Corporate Governancecontinued
The Board delegates specific
responsibilities to certain committees
that assist the Board in carrying out
its functions and ensure independent
oversight of internal control and risk
management. The three principal Board
committees (Audit, Remuneration and
Nomination) play an essential role
in supporting the Board in fulfilling
its responsibilities and ensuring that
the highest standards of corporate
governance are maintained throughout
the Group. Each committee has its own
terms of reference which set out the
specific matters for which delegated
authority has been given by the Board.
New terms of reference for each of the
committees which are fully compliant
with the provisions of the Code and
which reflect both best practice and
the recommendations arising from the
external evaluation process undergone
by the Board and its committees in early
2013 were adopted by the Board during
2013. These will be reviewed annually
on an ongoing basis and updated where
necessary. All of these are available on
request from the Company Secretary
or within the Corporate Governance
section of the Group’s website at
www.ipgroupplc.com.
Matters Reserved for the Board
Include:
• Approval of the annual report, half-year results statement and the
quarterly interim management statements, accounting policies and
procedures or any matter having a material impact on future financial
performance of the Group.
• Strategic acquisitions by the Group.
• Major portfolio capital allocation decisions, being those in excess of
£2.5m per investment.
• The entry into by the Group of strategic partnerships and collaborations
with universities and other research institutions.
• Major disposals from the Group’s portfolio.
• Approval and monitoring of the Group’s strategic plans and approval of
the annual budget.
• Considering and, where appropriate, approving directors’ conflicts of
interest.
• Approving Board appointments and removals and approving policies
relating to directors’ remuneration.
• Approval of terms of reference and membership of Board committees.
• Approval, subject to shareholder approval, of the appointment and
remuneration of the auditors.
• Approval of all circulars, prospectuses and other documents issued to
shareholders governed by the FCA’s Listing Rules, Disclosure Rules or
Transparency Rules or the City Code on Takeovers and Mergers.
• Changes to the Group’s capital structure, the issue of any securities and
material borrowing of the Group.
• The division of responsibility between the Chairman and the Chief
Executive Officer.
• Major changes in employee share schemes.
• Litigation.
Available from the Company
Secretary or on our
Corporate Website
www.ipgroupplc.com
Board Committees The terms of reference of each Committee establish its responsibilities. Available from the Company
Secretary or on our
Corporate Website
www.ipgroupplc.com
Executive Directors and Management Team
Day-to-day decisions are delegated to the Executive Directors and
management via established procedures for approving decisions within
business functions.

23002-04 Proof 8a 01-04-14
Stock Code: IPO www.ipgroupplc.com 43
Ou
r G
ove
rnan
ce O
verv
iew
Board size and compositionAs at 31 December 2013, there were eight
Directors on the Board: the Chairman,
four Executive Directors and three
Non-executive Directors. Professor Lynn
Gladden was appointed as an additional
independent Non-Executive Director
with effect from 26 March 2014. The
biographies of all of these directors are
provided on pages 38 and 39. During
the year, Dr Alison Fielding and Professor
Graham Richards stepped down from
the Board, in the case of Alison Fielding
for personal reasons and in the case of
Professor Graham Richards because
of the length of his tenure as a Non-
executive Director meant that he was no
longer regarded as independent from
a governance perspective. Both have
remained with the Group on a part-
time basis in roles which has enabled
the Group to continue to leverage their
significant expertise.
The Company’s policy relating to
the terms of appointment and the
remuneration of both Executive and
Non-executive Directors is detailed in
the Directors’ Remuneration Report on
pages 53 to 70.
The size and composition of the Board
is regularly reviewed by the Board, and in
particular the Nomination Committee, to
ensure there is an appropriate and diverse
mix of skills and experience on the Board.
The Company’s Articles of Association
require all directors to submit themselves
for re-election by the shareholders at
the Company’s Annual General Meeting
following their first appointment and
thereafter at each Annual General
Meeting in respect of which they have
held office for the two preceding Annual
General Meetings and did not retire
at either of them. In addition, each
director who has held office with the
Company for a continuous period of
nine years or more must retire and offer
themselves up for re-election at every
Annual General Meeting. However, in
accordance with the Code, all directors
(other than Professor Lynn Gladden who
has been appointed since the last general
meeting of the Company held on 12
February 2014) will submit themselves
for annual re-election by shareholders
at the Annual General Meeting of the
Company to be held on 13 May 2014 (the
“2014 AGM”). The Board recommends
to shareholders the reappointment of
all directors retiring at the meeting and
offering themselves for re-election on the
basis that the independent performance
reviews demonstrated that they are all
effective directors of the Company and
continue to display the appropriate level
of commitment in their respective roles.
New directors may be appointed by the
Board, but their appointment is subject
to election by shareholders at the first
opportunity after their appointment as
is the case with Professor Lynn Gladden
who will seek election at the 2014 AGM.
DiversityThe Board is committed to a culture
that attracts and retains talented people
to deliver outstanding performance
and further enhance the success of the
Company. In that culture, diversity across
a range of criteria is valued, primarily
in relation to skills, knowledge and
experience and also in other criteria such
as gender and ethnicity. The Company
will give careful consideration to issues
of overall Board balance and diversity in
making new appointments to the Board
and, in identifying suitable candidates,
the Nomination Committee will seek
candidates from different genders and
a range of backgrounds, with the final
decision being based on merit against
objective criteria. The Company has one
female director on its Board and will aim
to maintain female representation on
the Board at least at this current level
and give due consideration to increasing
the level if appropriate candidates are
available when Board vacancies arise. In
addition, the revised terms of reference
of the Nomination Committee which
were adopted during the year include
a requirement for the Committee to
consider diversity, including gender, in
evaluating the composition of the Board
and in identifying suitable candidates for
Board appointments. A breakdown of
employee diversity showing the number
of persons who were Directors of the
Company and senior managers at the
date of this report can be found on
page 52.
Board compositionAs at date of report including unconditional appointments
Board tenure
Executive
40-5 years
5Non-Executive
55-10 years
3
Male
810+ years
1Female
1

23002-04 Proof 8a 01-04-14
IP Group plc Annual Report and Accounts for the year ended 31 December 201344
Ou
r G
ove
rnan
ce O
verv
iew
Corporate Governancecontinued
Non-executive DirectorsThe Non-executive Directors provide
a wide range of skills and experience
to the Group. They bring their own
senior level of experience in each of
their own fields, robust opinions and an
independent judgement on issues of
strategy, performance, risk and people
through their contribution and are well
placed to constructively challenge
and scrutinise the performance of
management at Board and Committee
meetings. The Code sets out the
circumstances that should be relevant to
the Board in determining whether each
Non-executive Director is independent.
The Board considers Non-executive
Director independence on an annual
basis as part of each Non-executive
Director’s performance evaluation.
Having undertaken this review and with
due regard to provision B.1.1 of the
Code, the Board has concluded this year
that all of the Non-executive Directors
are considered by the Board to be
independent of management and free of
any relationship or circumstance which
could materially influence or interfere
with, or affect, or appear to affect, the
exercise of their independent judgement.
In a limited number of cases, the
Chairman has, in the past, made
de minimis investments in spin-out
companies formed under the Group’s
university partnerships. Such investments
were made on arm’s length terms,
on comparable terms to other third
party angel investors participating in
the same financing rounds and always
represented minority participations
in the relevant financing rounds. The
Board does not therefore consider that
such legacy personal investments act
in any way to influence the Chairman’s
oversight of the Board. In any event, all
of the Chairman’s potential conflicts of
interest are disclosed at the beginning
of each Board meeting and he may be
required by the Board to abstain from
the deliberations by the Board and/or
voting on a particular matter. Details of
these investments are set out in note 24
to the financial statements. The Board’s
policy prohibits personal investments by
the Non-executive Directors in any of the
Group’s portfolio companies, whether
new or existing.
Non-executive Directors are required
to obtain the approval of the
Chairman before taking on any further
appointments and the Chairman requires
the approval of the Board before adding
to his commitments. In all cases, the
directors must ensure that their external
appointments do not involve excessive
time commitment or cause a conflict of
interest.
The roles of Chairman and Chief ExecutiveBruce Smith is the Chairman. The
division of responsibilities between the
Chairman and the Chief Executive Officer
is clearly established, set out in writing
and agreed by the Board. The Chairman
is responsible for the leadership and
conduct of the Board, the conduct of
the Group’s affairs and strategy and for
ensuring effective communication with
shareholders. The Chairman facilitates
the full and effective contribution of
Non-executive Directors at Board and
Committee meetings, ensures that they
are kept well informed and ensures a
constructive relationship between the
Executive Directors and Non-executive
Directors. The Chairman also ensures
that the membership of the Board is
appropriate to the needs of the business
and that the Board committees carry
out their duties, including reporting back
to the Board either orally or in writing
following their meetings at the next Board
meeting, depending on its proximity to
the meeting of the relevant committee.
The role of the Chief Executive is to
lead the delivery of the strategy and the
executive management of the Group
and its operating businesses. He is
responsible, amongst other things, for
the development and implementation
of strategy and processes which enable
the Group to meet the requirements
of shareholders, for delivering the
operating plans and budgets for the
Group’s businesses, monitoring business
performance against key performance
indicators (KPIs) and reporting on these
to the Board and for providing the
appropriate environment to recruit,
engage, retain and develop the high
quality personnel needed to deliver the
Group’s strategy.
Senior Independent DirectorMike Humphrey was the Senior
Independent Director throughout
2013. A key responsibility of the Senior
Independent Director is to be available to
shareholders in the event that they may
feel it inappropriate to relay views through
the Chairman or Chief Executive. In
addition, the Senior Independent Director
serves as an intermediary between the
rest of the Board and the Chairman
where necessary and takes the lead
when the Non-executive Directors assess
the Chairman’s performance and when
the appointment of a new Chairman
is considered. Further, the Senior
Independent Director will lead the Board
in their deliberations on any matters on
which the Chairman is conflicted.
Board supportThe Company Secretary is responsible to
the Board for ensuring Board procedures
are followed, applicable rules and
regulations are complied with and that
the Board is advised on governance
matters and relevant regulatory
matters. All directors have access to
the impartial advice and services of the
Company Secretary. There is also an
agreed procedure for directors to take
independent professional advice at the
Company’s expense. In accordance with
the Company’s Articles of Association,
directors have been granted an indemnity
issued by the Company to the extent
permitted by law in respect of liabilities
incurred as a result of their office.
The indemnity would not provide any
coverage where a director is proved to
have acted fraudulently or dishonestly.
The Company has also arranged
appropriate insurance cover in respect
of legal action against its directors and
officers.
Board meetings and decisionsThe Board meets regularly during the
year, as well as on an ad hoc basis as
required by business need. The Board
had seven scheduled Board meetings
in 2013. In addition to these scheduled
Board meetings, the Board also had a day
together in July 2013 devoted entirely to
the Group’s strategic objectives, which
provided an opportunity for all Directors
and particularly the Non-executive
Directors to ensure the Group’s strategy
is on course, to discuss medium and

23002-04 Proof 8a 01-04-14
Stock Code: IPO www.ipgroupplc.com 45
Ou
r G
ove
rnan
ce O
verv
iew
Alan Aubrey
Mike Townend
Greg Smith
Charles Winward
Francis Carpenter
Jonathan Brooks
Mike Humphrey
Graham Richards
Alison Fielding
Bruce Smith
longer term strategic objectives and
the key drivers underpinning these, to
review the Group’s KPIs and to analyse
and challenge its objectives. Further, in
connection with the proposed acquisition
of Fusion IP plc and the Group’s £100m
capital raising, three conference calls of
the Board were held through November
and December 2013 to discuss the
merits and terms of the transaction and
to give the Board approval for the Group
to proceed. All of the directors were
present for each of these calls, despite
them being called on relatively short
notice. The Chairman and Non-executive
Directors also met without the presence
of the Executive Directors twice during
the year.
The schedule of Board and Committee
meetings each year is, so far as is
possible, determined before the
commencement of that year and all
Directors or, if appropriate, all Committee
members are expected to attend each
meeting. Supplementary meetings of the
Board and/or the Committees are held
as and when necessary. Each member
of the Board receives in advance of each
scheduled meeting detailed Board packs,
which include an agenda based upon
the schedule of matters reserved for its
approval and appropriate reports and
briefing papers. If a director is unable
to attend a meeting due to exceptional
circumstances, he or she will still receive
the supporting papers and will usually
discuss any matters he or she wishes to
raise with the Chairman in advance of the
meeting. The Chairman, Chief Executive,
Chief Financial Officer and Company
Secretary work together to ensure that
the Directors receive relevant information
to enable them to discharge their duties
and that such information is accurate,
timely and clear. This information
includes monthly management accounts
containing analysis of performance
against budget and other forecasts.
Additional information is provided as
appropriate or if requested. At each
meeting, the Board receives information,
reports and presentations from the Chief
Executive, the other Executive Directors
and, by invitation, other members of
senior management as required. This
ensures that all Directors are aware
of, and are in a position to monitor
effectively, the overall performance
of the Group, its development and
implementation of strategy and its
management of risk.
Board and committee attendanceThe following table shows the attendance of directors at meetings of the Board, Audit, Remuneration and Nomination Committees
during the year:
1. Bruce Smith was unable to attend the December Board meeting as a result of a knee operation.
2. Greg Smith was on paternity leave at the time of the May Board meeting.
3. Alison Fielding stepped down from the Board due to personal reasons with effect from 30 June 2013.
4. Graham Richards retired from the Board with effect from 14 May 2013.
Board calls
Audit Committee
Remuneration Committee
NominationCommittee
Scheduled Board Meetings
Key:
Attended
Unattended

23002-04 Proof 8a 01-04-14
IP Group plc Annual Report and Accounts for the year ended 31 December 201346
Ou
r G
ove
rnan
ce O
verv
iew
Corporate Governancecontinued
Any matter requiring a decision by
the Board is supported by a paper
analysing the relevant aspects of the
proposal including costs, benefits,
potential risks involved and proposed
executive management action and
recommendation.
The majority of Board meetings are held
at the Group’s offices in London, which
gives members of the Group’s client
service team the opportunity to formally
present to the Board on new spin-out
opportunities or early-stage portfolio
companies on which they are working.
This assists the Board in gaining a deeper
understanding of the breadth, stage of
development and diversity of the Group’s
portfolio. The Board also aims to have
at least one of its scheduled meetings
or its annual strategy day at either the
Company’s offices in Leeds, Oxford or
Newcastle or at the location of one of
the Group’s partner universities in order
to encourage further interaction with the
Group’s stakeholders. Meetings between
the Chairman and Non-executive
Directors, both with and without the
presence of the Chief Executive, are also
held as the need arises.
Directors’ conflicts of interestEach director has a statutory duty under
the Companies Act 2006 (the “CA 2006”)
to avoid a situation in which he has or
can have a direct or indirect interest
that conflicts or may potentially conflict
with the interests of the Company. This
duty is in addition to the continuing duty
that a director owes to the Company to
disclose to the Board any transaction
or arrangement under consideration by
the Company in which he is interested.
The Company’s Articles of Association
permit the Board to authorise conflicts or
potential conflicts of interest. The Board
has established procedures for managing
and, where appropriate, authorising any
such conflicts or potential conflicts of
interest. It is a recurring agenda item at
all Board meetings and this gives the
directors the opportunity to raise at the
beginning of every Board meeting any
actual of potential conflict of interests
that they may have on the matters to be
discussed, or to update the Board on any
change to a previous conflict of interest
already declared. In deciding whether
to authorise any conflict, the directors
must have regard to their general duties
under the CA 2006 and their overriding
obligation to act in a way they consider, in
good faith, will be most likely to promote
the Company’s success. In addition, the
directors are able to impose limits or
conditions when giving authorisation
to a conflict or potential conflict of
interest if they think this is appropriate.
The authorisation of any conflict matter,
and the terms of any authorisation, may
be reviewed by the Board at any time.
The Board believes that the procedures
established to deal with conflicts of
interest are operating effectively.
Induction, awareness and developmentA comprehensive induction process is in
place for new directors. The programme
is tailored to the needs of each individual
director and agreed with him or her
so that he or she can gain a better
understanding of the Group and its
businesses. This will generally include an
overview of the Group and its businesses,
structure, functions and strategic aims;
site visits to the Group’s head office
in London and to one or more of its
nationwide offices in Leeds, Oxford and
Newcastle; and site visits to a number
of the Group’s portfolio companies,
including one or more within the Group’s
top ten holdings (by value), which will
include meeting with such companies’
management and a presentation from
them on their businesses. In addition,
the Company facilitates sessions as
appropriate with the Group’s advisers, in
particular its sponsor Numis Securities
Limited, as well as with appropriate
governances specialists, to ensure that
any new directors are fully aware of
and understand their responsibilities
and obligations as a director of a FTSE
350 company and of the governance
framework within which they must
operate.
In order to ensure that directors continue
to further their understanding of the
issues facing the Group, the Chairman
and Non-executive Directors are
encouraged to continue to visit the
Group’s offices other than the main
corporate office in London, its portfolio
companies and its partner universities.
In addition, at least one of the Group’s
Board meetings or its strategy day will
be off-site to facilitate this through 2014
and, as detailed above, the Board is also
exposed to the early-stage opportunities
in which the Group has invested through
presentations at Board meetings by
relevant members of the Group’s staff.
It is also intended that, through 2014,
other function heads (such as the head
of IP Exec, IP Impact, Communications
and Business Support) will present
to the Board to enhance the Board’s
awareness of how the Group operates
on a day-to-day basis and how such
functions operate so as to assist in the
execution of the Group’s core strategy of
systematically helping create, build and
support outstanding intellectual property-
based businesses.
Strong governance: a comprehensive induction process is in place for new directors
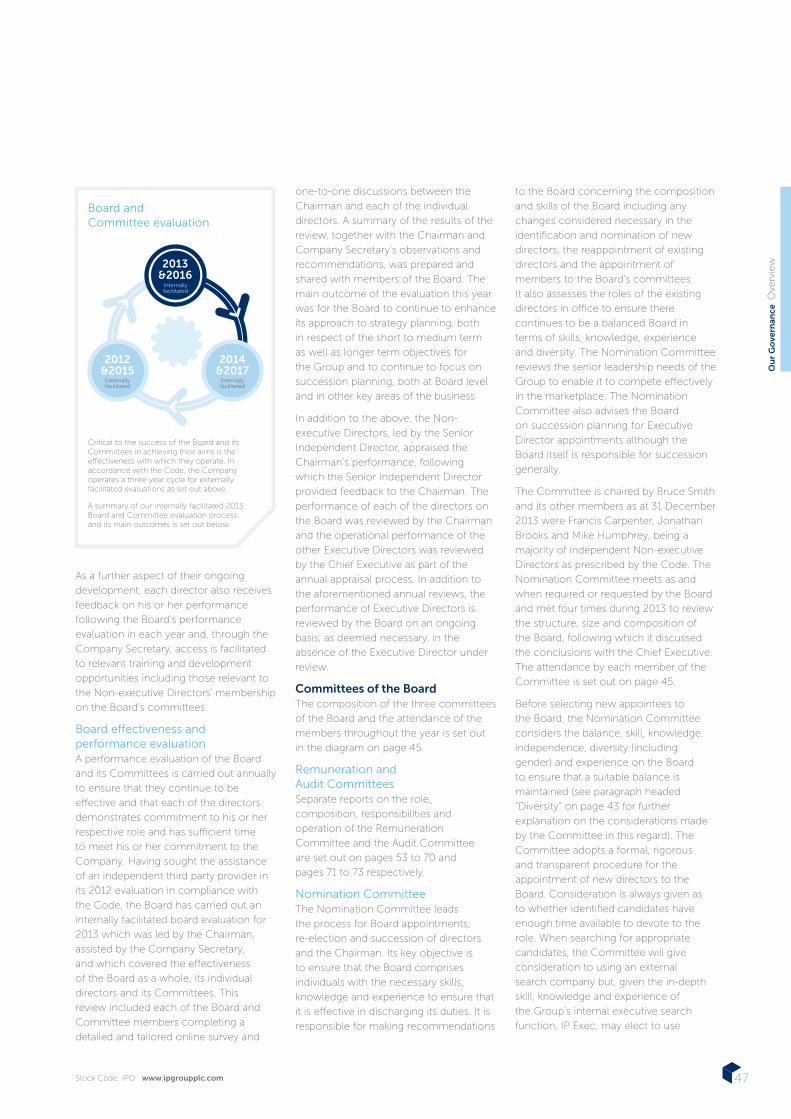
23002-04 Proof 8a 01-04-14
Stock Code: IPO www.ipgroupplc.com 47
Ou
r G
ove
rnan
ce O
verv
iew
As a further aspect of their ongoing
development, each director also receives
feedback on his or her performance
following the Board’s performance
evaluation in each year and, through the
Company Secretary, access is facilitated
to relevant training and development
opportunities including those relevant to
the Non-executive Directors’ membership
on the Board’s committees.
Board effectiveness and performance evaluationA performance evaluation of the Board
and its Committees is carried out annually
to ensure that they continue to be
effective and that each of the directors
demonstrates commitment to his or her
respective role and has sufficient time
to meet his or her commitment to the
Company. Having sought the assistance
of an independent third party provider in
its 2012 evaluation in compliance with
the Code, the Board has carried out an
internally facilitated board evaluation for
2013 which was led by the Chairman,
assisted by the Company Secretary,
and which covered the effectiveness
of the Board as a whole, its individual
directors and its Committees. This
review included each of the Board and
Committee members completing a
detailed and tailored online survey and
one-to-one discussions between the
Chairman and each of the individual
directors. A summary of the results of the
review, together with the Chairman and
Company Secretary’s observations and
recommendations, was prepared and
shared with members of the Board. The
main outcome of the evaluation this year
was for the Board to continue to enhance
its approach to strategy planning, both
in respect of the short to medium term
as well as longer term objectives for
the Group and to continue to focus on
succession planning, both at Board level
and in other key areas of the business
In addition to the above, the Non-
executive Directors, led by the Senior
Independent Director, appraised the
Chairman’s performance, following
which the Senior Independent Director
provided feedback to the Chairman. The
performance of each of the directors on
the Board was reviewed by the Chairman
and the operational performance of the
other Executive Directors was reviewed
by the Chief Executive as part of the
annual appraisal process. In addition to
the aforementioned annual reviews, the
performance of Executive Directors is
reviewed by the Board on an ongoing
basis, as deemed necessary, in the
absence of the Executive Director under
review.
Committees of the BoardThe composition of the three committees
of the Board and the attendance of the
members throughout the year is set out
in the diagram on page 45.
Remuneration and Audit CommitteesSeparate reports on the role,
composition, responsibilities and
operation of the Remuneration
Committee and the Audit Committee
are set out on pages 53 to 70 and
pages 71 to 73 respectively.
Nomination CommitteeThe Nomination Committee leads
the process for Board appointments,
re-election and succession of directors
and the Chairman. Its key objective is
to ensure that the Board comprises
individuals with the necessary skills,
knowledge and experience to ensure that
it is effective in discharging its duties. It is
responsible for making recommendations
to the Board concerning the composition
and skills of the Board including any
changes considered necessary in the
identification and nomination of new
directors, the reappointment of existing
directors and the appointment of
members to the Board’s committees.
It also assesses the roles of the existing
directors in office to ensure there
continues to be a balanced Board in
terms of skills, knowledge, experience
and diversity. The Nomination Committee
reviews the senior leadership needs of the
Group to enable it to compete effectively
in the marketplace. The Nomination
Committee also advises the Board
on succession planning for Executive
Director appointments although the
Board itself is responsible for succession
generally.
The Committee is chaired by Bruce Smith
and its other members as at 31 December
2013 were Francis Carpenter, Jonathan
Brooks and Mike Humphrey, being a
majority of independent Non-executive
Directors as prescribed by the Code. The
Nomination Committee meets as and
when required or requested by the Board
and met four times during 2013 to review
the structure, size and composition of
the Board, following which it discussed
the conclusions with the Chief Executive.
The attendance by each member of the
Committee is set out on page 45.
Before selecting new appointees to
the Board, the Nomination Committee
considers the balance, skill, knowledge,
independence, diversity (including
gender) and experience on the Board
to ensure that a suitable balance is
maintained (see paragraph headed
“Diversity” on page 43 for further
explanation on the considerations made
by the Committee in this regard). The
Committee adopts a formal, rigorous
and transparent procedure for the
appointment of new directors to the
Board. Consideration is always given as
to whether identified candidates have
enough time available to devote to the
role. When searching for appropriate
candidates, the Committee will give
consideration to using an external
search company but, given the in-depth
skill, knowledge and experience of
the Group’s internal executive search
function, IP Exec, may elect to use
Board and Committee evaluation
Critical to the success of the Board and its Committees in achieving their aims is the effectiveness with which they operate. In accordance with the Code, the Company operates a three-year cycle for externally facilitated evaluations as set out above.
A summary of our internally facilitated 2013 Board and Committee evaluation process and its main outcomes is set out below.
2014&2017
Internallyfacilitated
2012&2015
Externallyfacilitated
2013&2016
Internallyfacilitated

23002-04 Proof 8a 01-04-14
IP Group plc Annual Report and Accounts for the year ended 31 December 201348
Ou
r G
ove
rnan
ce O
verv
iew
Corporate Governancecontinued
this function and will also consider
candidates who are proposed by existing
Board members or employees of the
Group. When the Committee has found
a suitable candidate, the Chairman of
the Committee will make a proposal to
the whole Board and the appointment
is the responsibility of the whole Board
following recommendation from the
Committee.
During the year, Professor Graham
Richards retired as a Non-executive
Director with effect from the Company’s
2013 Annual General Meeting. The Board
as a whole debated the criteria for an
additional Non-executive Director to fill
the vacancy left by Professor Richards
and it was agreed that the key criterion for
the role was for the individual to possess
outstanding academic credentials.
The Nomination Committee gave due
consideration to using the services of
an external search agency but, for the
reasons identified above, elected to use
the Group’s in-house resource, IP Exec,
to source and then shortlist candidates
together with the Chief Executive and
the Chairman of the Committee. The
Nomination Committee members
each interviewed the candidates who
had been shortlisted, the outcome of
which was a recommendation from
the Chairman of the Committee to the
Board for the appointment of Professor
Lynn Gladden CBE as an additional
Non-executive Director of the Company
on the basis that she met the criteria
required, including having sufficient time
to discharge the requirements of the
role. Professor Gladden was formally
appointed as a Non-executive Director
with effect from 26 March 2014.
In the year ahead, the Nomination
Committee will continue to assess the
Board’s size and composition and how it
may be enhanced.
Internal controlThe Board fully recognises the
importance of the guidance contained in
Internal Control: Guidance for Directors
on the Code (“Turnbull’). The Group’s
internal controls, which were Group-
wide, were in place during the whole of
2013 and were reviewed by the Board
of Directors and were considered to be
effective throughout the year ended
31 December 2013.
The Board is responsible for establishing
and monitoring internal control systems
and for reviewing the effectiveness
of these systems. The Board views
the effective operation of a rigorous
system of internal control as critical to
the success of the Group; however,
it recognises that such systems can
provide only reasonable and not absolute
assurance against material misstatement
or loss. The key elements of the Group’s
internal control system, all of which
have been in place during the financial
year and up to the date these financial
statements were approved, are as follows:
Control environment and proceduresThe Group has a clear organisational
structure with defined responsibilities and
accountabilities. It adopts the highest
values surrounding quality, integrity and
ethics, and these values are documented
and communicated clearly throughout
the whole organisation.
Detailed written policies and procedures
have been established covering key
operating and compliance risk areas.
These are reviewed and updated at
least annually by the Board. The Board
considers that the controls have
been effective for the year ended
31 December 2013.
Identification and evaluation of risksThe Board actively identifies and evaluates
the risks inherent in the business, and
ensures that appropriate controls and
procedures are in place to manage these
risks. Specifically, all decisions relating
to strategic partnerships and other
collaborations and acquisitions entered
into by the Group are reserved for the
Board’s review and approval. The Board
formally reviews the performance of the
Group’s university partnerships and other
strategic collaborations and relationships
and equity investments on a quarterly
basis, although performance of specific
investments may be reviewed more
frequently if deemed appropriate. The
Board maintains an up to date Register
of Risks setting out mitigations in place in
each case. The key risks and uncertainties
faced by the Group, as well as the
relevant mitigations, are set out on pages
34 to 37.
Information and financial reporting systemsThe Group evaluates and manages
significant risks associated with the
process for preparing consolidated
accounts by having in place systems
and controls that ensure adequate
accounting records are maintained and
transactions are recorded accurately and
fairly to permit the preparation of financial
statements in accordance with IFRS. The
Board approves the annual operating
budgets and each month receives details
of actual performance measured against
the budget.
Principal risks and uncertaintiesThe operations of the Group and the
implementation of its objectives and
strategy are subject to a number of key
risks and uncertainties. Risks are formally
reviewed by the Board at least annually
and appropriate procedures are put
in place to monitor and, to the extent
possible, mitigate these risks. Were more
than one of the risks to occur together,
the overall impact on the Group may be
compounded. A summary of the key risks
affecting the Group and the steps taken
to manage these is set out on pages
32 to 37.
Relations with stakeholdersThe Company is committed to a
continuous dialogue with shareholders as
it believes that it is essential to ensure a
greater understanding of and confidence
amongst its shareholders in the medium
and longer term strategy of the Group
and in the Board’s ability to oversee its
implementation. It is the responsibility
of the Board as a whole to ensure that
a satisfactory dialogue does take place.
The Board’s primary shareholder contact
is through the Chairman, Chief Executive
Officer, Chief Investment Officer and
the Chief Financial Officer. The Board’s
primary contact with the limited partners
and advisory boards of its managed funds
is through the Managing Director of Top
Technology and the Chief Executive
Officer. The Senior Independent Director
and other directors, as appropriate,
make themselves available for contact
with major shareholders and other
stakeholders in order to understand their
issues and concerns. Where considered
appropriate, major institutional
shareholders are consulted on significant

23002-04 Proof 8a 01-04-14
Stock Code: IPO www.ipgroupplc.com 49
Ou
r G
ove
rnan
ce O
verv
iew
changes to the structure of the Executive
Directors’ remuneration; as described
further in the Remuneration Report, the
Remuneration Committee undertook a
detailed consultation exercise with the
Group’s top ten shareholders through
2013 on the proposed changes to the
remuneration of the Executive Directors.
The Company uses the Annual
General Meeting as an opportunity to
communicate with its shareholders.
Notice of the Annual General Meeting,
which will be held at 2.00pm on
13 May 2014 at IP Group plc, 24 Cornhill,
London, EC3V 3ND, is enclosed with this
report. In line with the Code, the Notice
of AGM will be sent to shareholders at
least 20 working days before the meeting.
Details of the resolutions and the
explanatory notes thereto are included
with the Notice. To ensure compliance
with the Code, the Board proposes
separate resolutions for each issue and
proxy forms allow shareholders who are
unable to attend the AGM to vote for or
against or to withhold their vote on each
resolution. The results of all proxy voting
is published on the Group’s website
after the meeting and at the meeting
itself to those shareholders who attend.
Shareholders who attend the AGM will
have the opportunity to ask questions and
all directors are expected to be available
to take questions.
The Group’s website www.ipgroupplc.com
is the primary source of information on the
Group. The website includes an overview
of the activities of the Group, details
of its portfolio companies and its key
university partnerships and other strategic
collaborators, and details of all recent
Group and portfolio announcements.
Political expenditureAlthough it is the Board’s policy not to
incur political expenditure or otherwise
make cash contributions to political
parties and it has no intention of
changing that policy, the CA 2006 is
very broadly drafted in this area and the
Board is concerned that it may include
activities such as funding conferences
or supporting certain bodies involved
in policy review and law reform.
Accordingly, at the AGM held on 14
May 2013, the shareholders passed a
resolution on a precautionary basis to
authorise the Group to incur political
expenditure (as defined in Section 365 of
CA 2006) not exceeding £50,000 in total
at any time from 14 May 2013 up to the
conclusion of the 2014 AGM. The Board
intends to seek renewed authority for
the Group to incur political expenditure
of not more than £50,000 in total at
the Company’s AGM, to be held on 13
May 2014, which they might otherwise
be prohibited from making or incurring
under the terms of CA 2006.
Going concernThe Directors confirm that they have
a reasonable expectation that the
Group will have adequate resources to
continue in operational existence for
the foreseeable future and accordingly
they continue to adopt the going
concern basis in preparing the financial
statements.
ON BEHALF OF THE BOARD
Dr Bruce SmithChairman3 March 2014
Alan AubreyChief Executive Officer
23002-04 Proof 8a 01-04-14
IP Group plc Annual Report and Accounts for the year ended 31 December 201350
Ou
r G
ove
rnan
ce S
ust
ain
abili
ty
Sustainability
Our commitment to the environment and sustainabilityHaving fewer than 40 employees
operating out of four main locations, we
consider the direct environmental impact
of the Group as relatively low. However,
we firmly recognise our responsibility
to ensure that our business operates
in an environmentally responsible and
sustainable manner. While the Board as
a whole has primary responsibility for
environmental issues, it has allocated
day-to-day responsibility for the review
of environmental and social issues to the
Chief Financial Officer, Greg Smith.
This section includes our mandatory
reporting of greenhouse gas emissions,
as well as wider details on the Group’s
environmental impact. The reporting
period for emissions and waste
production is the same as the Group’s
fiscal year.
Organisation boundary and scope of emissionsWe have reported on all of the emission
sources required under the Companies
Act 2006 (Strategic Report and Directors’
Reports) Regulations 2013. These sources
fall within our consolidated financial
statement. An operational control
approach has been used in order to
define our organisation boundary and
determine the emissions for which
the Group is responsible and are to be
included in the scope 1 and 2 emissions.
Though this excludes any emissions
from our investment portfolio of spin-out
companies, management believes this
approach best captures the emissions for
which the Group is directly responsible
and has control over. We also report on
a number of scope 3 emissions (such as
commuting or business travel), where the
Group has no control or is not directly
responsible, but it is recognised that these
arise as an immediate by-product of IP
Group’s operating activities.
The table opposite details the breakdown
of the Group’s greenhouse gas emissions
split by scope, as well as the Group’s
production of waste. The Group’s scope1
emissions primarily consist of natural
gas used for heating, while all scope2
emissions are from the purchase of
electricity (2013: 168.7MWh). The scope3
emissions opposite include emissions
due to business travel, the commuting of
employees and the use of couriers. The
proportions of these emissions can be
seen in the chart overleaf.
The emissions and waste production
reported opposite excludes IPG’s new
US operations. Given the early stage and
current scale of the US operations, these
are considered immaterial to the Group.
MethodologyAs was the case in 2012, the Group again
employed the services of a specialist
adviser, Verco, to evaluate and quantify
GHG emissions and the waste production
associated with the Group’s operations.
The follow methodology was applied by
Verco in the preparation and presentation
of this data:
• use of the Greenhouse Gas Protocol
published by the World Business
Council for Sustainable Development
and the World Resources Institute (the
“WBCSD/WRI GHG Protocol”);
• application of Defra emission factors
to the Group’s activities to calculate
GHG emissions;
• inclusion of all the applicable Kyoto
gases, expressed in carbon dioxide
equivalents, or CO2e; and
• presentation of gross emissions as
the Group does not purchase carbon
credits (or equivalents).
Intensity ratioAs well as reporting the absolute
emissions, the Group’s GHG emissions
are reported opposite on the metrics of
tonnes of CO2e per employee and per
square metre of office space, these being
the most appropriate metrics given that
the majority of emissions result from the
operation of the Group’s offices and the
day-to-day activities of the employees.
Target and baselinesGiven the comparatively low GHG impact
of the Group’s operations, the Group’s
objective is to maintain or reduce its GHG
per person and per square metre of office
space each year and will report each year
whether it has been successful in this
regard.
Policy statement
IP Group aims to conduct its business in a socially responsible manner, to contribute to the communities in which it operates and to respect the needs of its employees and all of its stakeholders.
The Group is committed to growing the business while ensuring a safe environment for employees as well as minimising the overall impact on the environment.
IP Group endeavours to conduct its business in accordance with established best practice, to be a responsible employer and to adopt values and standards designed to help guide staff in their conduct and business relationships.Greg Smith Chief Financial Officer
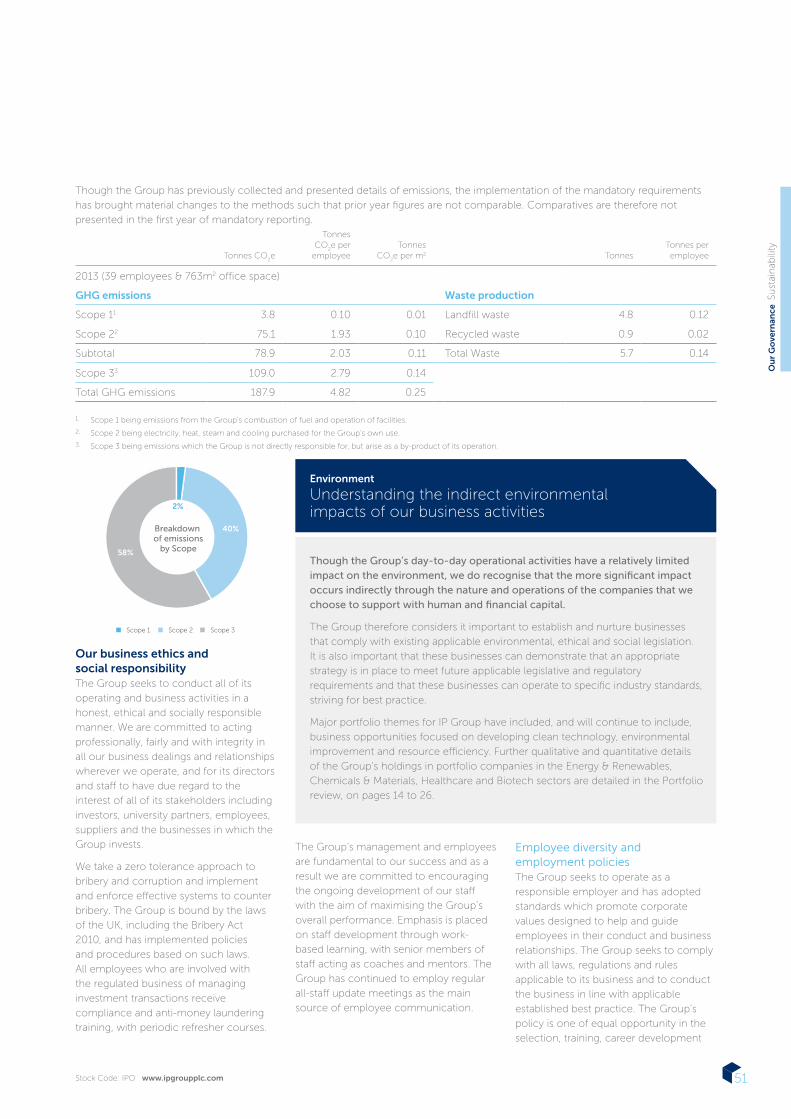
23002-04 Proof 8a 01-04-14
Stock Code: IPO www.ipgroupplc.com 51
Ou
r G
ove
rnan
ce S
ust
ain
abili
ty
Our business ethics and social responsibilityThe Group seeks to conduct all of its
operating and business activities in a
honest, ethical and socially responsible
manner. We are committed to acting
professionally, fairly and with integrity in
all our business dealings and relationships
wherever we operate, and for its directors
and staff to have due regard to the
interest of all of its stakeholders including
investors, university partners, employees,
suppliers and the businesses in which the
Group invests.
We take a zero tolerance approach to
bribery and corruption and implement
and enforce effective systems to counter
bribery. The Group is bound by the laws
of the UK, including the Bribery Act
2010, and has implemented policies
and procedures based on such laws.
All employees who are involved with
the regulated business of managing
investment transactions receive
compliance and anti-money laundering
training, with periodic refresher courses.
The Group’s management and employees
are fundamental to our success and as a
result we are committed to encouraging
the ongoing development of our staff
with the aim of maximising the Group’s
overall performance. Emphasis is placed
on staff development through work-
based learning, with senior members of
staff acting as coaches and mentors. The
Group has continued to employ regular
all-staff update meetings as the main
source of employee communication.
Employee diversity and employment policiesThe Group seeks to operate as a
responsible employer and has adopted
standards which promote corporate
values designed to help and guide
employees in their conduct and business
relationships. The Group seeks to comply
with all laws, regulations and rules
applicable to its business and to conduct
the business in line with applicable
established best practice. The Group’s
policy is one of equal opportunity in the
selection, training, career development
Though the Group has previously collected and presented details of emissions, the implementation of the mandatory requirements
has brought material changes to the methods such that prior year figures are not comparable. Comparatives are therefore not
presented in the first year of mandatory reporting.
Tonnes CO2e
Tonnes CO
2e per
employeeTonnes
CO2e per m2 Tonnes
Tonnes per employee
2013 (39 employees & 763m2 office space)
GHG emissions Waste production
Scope 11 3.8 0.10 0.01 Landfill waste 4.8 0.12
Scope 22 75.1 1.93 0.10 Recycled waste 0.9 0.02
Subtotal 78.9 2.03 0.11 Total Waste 5.7 0.14
Scope 33 109.0 2.79 0.14
Total GHG emissions 187.9 4.82 0.25
1. Scope 1 being emissions from the Group’s combustion of fuel and operation of facilities.
2. Scope 2 being electricity, heat, steam and cooling purchased for the Group’s own use.
3. Scope 3 being emissions which the Group is not directly responsible for, but arise as a by-product of its operation.
2%
40%
58%
Scope 1 Scope 2 Scope 3
Breakdown of emissions
by Scope
Though the Group’s day-to-day operational activities have a relatively limited impact on the environment, we do recognise that the more significant impact occurs indirectly through the nature and operations of the companies that we choose to support with human and financial capital.
The Group therefore considers it important to establish and nurture businesses
that comply with existing applicable environmental, ethical and social legislation.
It is also important that these businesses can demonstrate that an appropriate
strategy is in place to meet future applicable legislative and regulatory
requirements and that these businesses can operate to specific industry standards,
striving for best practice.
Major portfolio themes for IP Group have included, and will continue to include,
business opportunities focused on developing clean technology, environmental
improvement and resource efficiency. Further qualitative and quantitative details
of the Group’s holdings in portfolio companies in the Energy & Renewables,
Chemicals & Materials, Healthcare and Biotech sectors are detailed in the Portfolio
review, on pages 14 to 26.
Environment
Understanding the indirect environmental impacts of our business activities

23002-04 Proof 8a 01-04-14
IP Group plc Annual Report and Accounts for the year ended 31 December 201352
Ou
r G
ove
rnan
ce S
ust
ain
abili
ty
Sustainabilitycontinued
and promotion of employees, regardless
of age, gender, sexual orientation, ethnic
origin, religion and whether disabled
or otherwise. For the year ended
31 December 2013 the Group employed
an average of 35 employees and
four Non-executive Directors, and a
breakdown off staff by gender can
be seen in the table below. IP Group
supports the rights of all people as set out
in the UN Universal Declaration of Human
Rights and ensures that all transactions
the Group enters into uphold these
principles.
Breakdown of staff by gender as at date of reportTotal Staff: 38 (exc. NEDs) Female Male
Staff 53% 47%
Executives and
Senior Management 36% 64%
Board of Directors 11% 89%
Promotion of health and safety at work
is an essential responsibility of staff and
management at all levels. The Chief
Executive has overall responsibility for
the implementation of the Group’s health
and safety policies and procedures. The
primary purpose of the Group’s health
and safety policy, which can be located
through the link below, is to enable all
members of the Group’s staff to go
about their everyday business at work
in the expectation that they can do so
safely and without risk to their health.
During the year to 31 December 2013, no
reportable accidents occurred under UK
Health and Safety regulations.
Copies of the Group’s policies in relation
to equal opportunities and diversity,
health and safety and anti-corruption
and bribery can be found on the Group’s
website, www.ipgroupplc.com/csr/
company-policies.
IP Group and its members of staff have a long history of supporting charities and remain committed to making charitable donations.
The Group aims to donate 1% of
the previous year’s realised profits
to one or more charities which
have a particular relevance to IP
Group’s activities or to members
of our team.
The Group’s three chosen
charities during 2013 were
Macmillan Cancer Support, a
charity providing practical, medical
and financial support for those
affected by cancer, Dyslexia
Action, which provides help and
support to those with dyslexia and
other specific learning difficulties,
and Imagineering, which works
to introduce young people
of 8-16 years to the exciting
world of engineering, science
and technology through fun,
hands-on activities and personal
involvement. Further details of
the activities of these charities are
set out on the Group’s website
at www.ipgroupplc.com/csr/
community.
Members of IP Group staff
raised a total of £10,065 through
“donate a day” salary sacrifice and
sponsorship of the Group’s 2013
Great Glen Way challenge. In line
with its stated policy, the Group
made charitable donations of
£15,000 during 2013 (2012: £nil).
Community investment
Our employees are encouraged to consider social issues and the Group is supportive of employees pursuing roles with charitable organisations.
Total Staff (38)
Board of Directors (9)
Executives and Senior Management (11)
Female
53%
Female
11%
Male
47%
Male
89%
Female
36%Male
64%
Total Staff excludes NEDs

23002-04 Proof 8a 01-04-14
Stock Code: IPO www.ipgroupplc.com 53
Ou
r G
ove
rnan
ce C
om
mitt
ee R
ep
ort
s
Directors’ Remuneration Report Remuneration Statement
Evolution of our remuneration frameworkDuring the year, the Committee
considered how the Group’s remuneration
and incentive structures should evolve
to enable the Group to continue to
attract and retain management and staff
of the highest quality, whilst retaining
an appropriate level of entrepreneurial
culture, and also remaining in accordance
with best practice for a FTSE 250 listed
business. This resulted in a number of
changes for 2013, as set out below.
IP Group is a business experiencing
substantial growth and its market
capitalisation has increased from
approximately £80m in January 2011 to
approximately £900m at the date of this
report. As a result the Committee believes
it is important to keep remuneration
arrangements under regular review
to ensure they continue to evolve to
support the strategy and circumstances
of the business. We consulted our major
shareholders on the changes in 2013
and would intend to do so for any future
changes.
Incentive mix for 2013The Committee determined that it would
reduce the proportion of total reward
potential arising from the Group’s LTIP and
introduce a new annual incentive scheme
while broadly maintaining the overall
incentive opportunity. The Committee
considers that this is most appropriately
aligned with the Group’s current strategy
of sourcing and developing technology-
based businesses and seeking to generate
long term value through the growth in
value of the Group’s holdings in such
businesses, while being mindful of the
Group’s financial performance in each
twelve month period.
As outlined earlier in this Annual Report, for the second consecutive year, the Group’s performance has been strong, with progress across many of the Group’s portfolio businesses contributing to a significant increase in net assets and a reported profit before tax of more than £70m, the highest since the Group’s formation in 2001. The Group’s share price increased by around 40% during the year, from 119.9p to 169.8p, representing an increase in market capitalisation of more than £180m.Francis Carpenter Chairman of the Remuneration Committee
On behalf of your Board, I am pleased to present our Directors’ Remuneration Report (“DRR”) for the year ended 31 December 2013. Shareholders will be invited to approve both our Remuneration Policy and the Annual Remuneration Report at the Group’s AGM to be held on 13 May 2014.
23002-04 Proof 8a 01-04-14
IP Group plc Annual Report and Accounts for the year ended 31 December 201354
Ou
r G
ove
rnan
ce C
om
mitt
ee R
ep
ort
s
Directors’ Remuneration Report Remuneration Statement continued
Shareholding guidelineIn line with best practice, the Committee
introduced a formal shareholding
policy which requires the CEO to hold
shares equivalent to 2× salary and all
other executive directors to hold shares
equivalent to 1.5× salary (see page 67).
LTIP post-vesting holding periodFurther, the Committee determined that
from the 2013 LTIP awards onwards
any awards that vest, net of any tax and
NICs liabilities, will be subject to a further
holding period. To transition into this new
framework, the holding period will be
one year in respect of the 2013 LTIP and
two years for subsequent awards. During
the holding period, the Committee can
claw back shares in the case of intended
fraud or misconduct by a participant
that contributes to an error in financial
information that materially affects the
Company’s value.
Granting of 2013 LTIP awardsThe Committee’s intention had been
to implement the new incentive
framework following its consultation
with shareholders in the first half of 2013.
However, as a result of the corporate
activity during the second half of the year
(culminating in the Group’s recommended
offer for Fusion IP plc and a capital raising
in early 2014), there was no appropriate
opportunity to grant the agreed 2013 LTIP
awards during the year. The Committee
has therefore determined that the 2013
LTIP awards will be granted at the same
time as the 2014 LTIP awards. The 2013
LTIP awards will have a face value on grant
of 100% of salary and will vest in March
2017, subject to performance over the
2013-2015 performance period. Vested
shares will then be subject to an additional
one year holding period.
Executive directors’ base salariesGiven the recent substantial growth in size
and scope of the business, the Committee
recognises that the directors’ salaries are
considerably below market levels, even
taking into account our historic approach
of targeting salaries within a “corridor” of
lower quartile to median of the relevant
benchmark. During 2013, salary increases
for the executive directors were in the
range 5% to 20% (as communicated in
consultation with major shareholders).
For 2014, the CEO and CIO will receive
increase of 2.5% in line with the wider
business. The other two executive
directors will receive increases of 12% and
16%, reflecting continued progression
towards market positioning having joined
the Board relatively recently. Salaries for
2014 are shown on page 66.
Incentives throughout the businessTo further encourage share ownership
throughout the Group we are seeking
approval for a sharesave scheme at the
forthcoming AGM. All staff, including
executive directors, will be eligible to
participate in the scheme.
Performance outturns for 2013Against the backdrop of strong Group
performance and further alignment of
the long and short term incentives with
the Group’s strategy as outlined above,
the Committee considers that the
remuneration for the executive directors
for the year appropriately reflects the
Group’s performance over the year
as well as the most recent three-year
period. The long-term incentive awards
granted in 2011 will vest in full, with the
Group having achieved in excess of the
upper performance targets for both
“hard” NAV growth and TSR (cumulative
15% annual growth in both measures),
as well as significantly outperforming
the index which acts as an underpin to
these criteria. Further, the Group’s annual
financial performance was such that the
upper 22.5% return on hard net assets
was exceeded and as a result the full
annual incentive pool was available for
allocation by the Committee.
New format Directors’ Remuneration Report (“DRR”)We are proposing a resolution to approve
our forward-looking Remuneration Policy
under the new guidelines for the first
time at our 2014 AGM. I trust that our
work in this regard, including consultation
with our largest ten holders and proxy
voting agents during the first half of 2013,
has resulted in a policy that meets with
the approval of our shareholders. Our
2012 Directors’ Remuneration Report
received 98% of votes cast in favour at
our AGM in May 2013 and, while this
indicated a strong level of support, the
Group is committed to transparency and
I welcome the opportunity for continued
discussion of the Group’s remuneration
with any shareholder, either at our AGM
or at any other time during the year.
Francis CarpenterChairman of the Remuneration Committee3 March 2014

23002-04 Proof 8a 01-04-14
Stock Code: IPO www.ipgroupplc.com 55
Ou
r G
ove
rnan
ce C
om
mitt
ee R
ep
ort
s
Directors’ Remuneration ReportRemuneration Policy
Remuneration policy and componentsThis report sets out the Company’s policy
on the remuneration of its executive and
non-executive directors (the “Policy”)
which will become effective subject to
approval by shareholders at our AGM on
13 May 2014.
Our Policy has been updated following
a review of the Group’s approach
to remuneration by the Committee,
including input from Deloitte LLP and
Hay Group, and following consultation
with our top ten shareholders during
2013. The primary changes to the
previous policy were to reduce the level
of LTIP awards that may be made to the
executive directors and management
team, to narrow the scope of the LTIP
from all staff to senior management
and executive directors, to introduce an
element of short-term incentive through
a new annual incentive scheme that
is available to all staff and to introduce
formal shareholding guidelines.
In devising the Policy, the Committee
has based its principles on the fact that
the overriding strategic objective of the
Group is to provide capital to, and help
to build, outstanding businesses based
on technology innovation. The success
of the Group over time will primarily
be a function of three key variables –
the amount of capital provided to the
portfolio, the return per annum achieved
on that capital and the period over which
it is invested. To achieve this objective,
the Committee believes that the Group
needs a structure that has incentive levers
covering both the short-term (1-3 years)
and the longer-term (3-5 years) and,
for those staff most directly connected
with individual portfolio company
assets (excluding the Group’s executive
directors), incentives directly aligned with
those specific assets, potentially over an
even longer term (5-10 years). The first
two levers are currently the most relevant
for the Group’s executive directors
and therefore are used as the variable
elements of the Group’s proposed
forward-looking remuneration policy.
Remuneration Policy tableThe table below sets out the key components of the Policy for executive directors’ remuneration:
Component Purpose and link to strategyHow this component of remuneration operates Maximum opportunity Performance metrics
Salary To provide an appropriate level of fixed cash income to attract and retain individuals with the personal attributes, skills and experience required to deliver the Group’s strategy
Generally reviewed annually with increases currently effective from 1 April.
Base salaries will be set by the Committee taking into account:
• scale, scope and responsibility of the role;
• skills and experience of the individual;
• retention risk;
• base salary of other employees;
• base salary of individuals undertaking similar roles in companies of comparable size and complexity; and
• appropriate market benchmarks.
There is no prescribed maximum annual salary.
Annual salary increases for Executive Directors will not normally exceed the average increase awarded to other UK-based employees.
Increases may be above this level in circumstances where the Committee considers it appropriate, for example if there is an increase in the scale, scope or responsibility of the role or to allow the base salary of recently appointed executives who are appointed on initially lower levels of base salary to move towards market norms as their experience and contribution increase.
Where a significant discrepancy exists between an executive director’s current salary and market levels, the Committee will normally phase any increases over a number of years.
None, although performance of the individual is considered by the Committee when setting and reviewing salaries annually.
The base salaries for the executive directors effective 1 April 2014 are:
Director Base salary
Alan Aubrey (CEO)Mike Townend (CIO)Greg Smith (CFO)Charles Winward (MD TTV)
£261,000£232,000£186,000£185,000

23002-04 Proof 8a 01-04-14
IP Group plc Annual Report and Accounts for the year ended 31 December 201356
Ou
r G
ove
rnan
ce C
om
mitt
ee R
ep
ort
s
Directors’ Remuneration ReportRemuneration Policy continued
Component Purpose and link to strategyHow this component of remuneration operates Maximum opportunity Performance metrics
Pension Provide a competitive post-retirement benefit in a way that manages the overall cost to the Group in order to retain individuals with the personal attributes, skills and experience required to deliver the Group’s strategy
Contribution to Group Pension Plan (defined contribution scheme) or to personal pension plan of the relevant executive’s choosing or an equivalent cash alternative.
10% of base salary for all executive directors in 2013 and 2014.
No element other than base salary is pensionable.
Absolute maximum pension is 15% of base salary.
Not applicable
Benefits Provide a competitive and appropriate benefits package to assist individuals in carrying out their duties effectively and to retain individuals with the personal attributes, skills and experience required to deliver the Group’s strategy
Ongoing benefits typically comprise, but are not limited to, health and travel insurance, income protection and life assurance and may also comprise a car benefit (or cash equivalent) and telecommunications such as broadband.
The Group also offers certain salary sacrifice schemes including childcare vouchers, purchase of additional holiday and Bike to Work.
Executive directors may also participate in any all-employee share plans that may be operated by the Group from time to time on the same terms as other employees
Additional benefits, which may include relocation expenses, housing allowance or other benefits-in-kind, may be provided in certain circumstances if considered appropriate and reasonable by the Committee, including as may be required on recruitment.
The cost of benefits provided changes in accordance with market conditions and will, therefore, determine the maximum amount that would be paid in the form of benefits under the Policy. There is therefore no overall maximum opportunity under this this component of the Policy
One-off benefits, e.g. relocation, shall not ordinarily exceed 25% of base salary other than in exceptional circumstances at the discretion of the Committee.
Maximum awards under all-employee share plans would be subject to prevailing statutory limits.
Not applicable
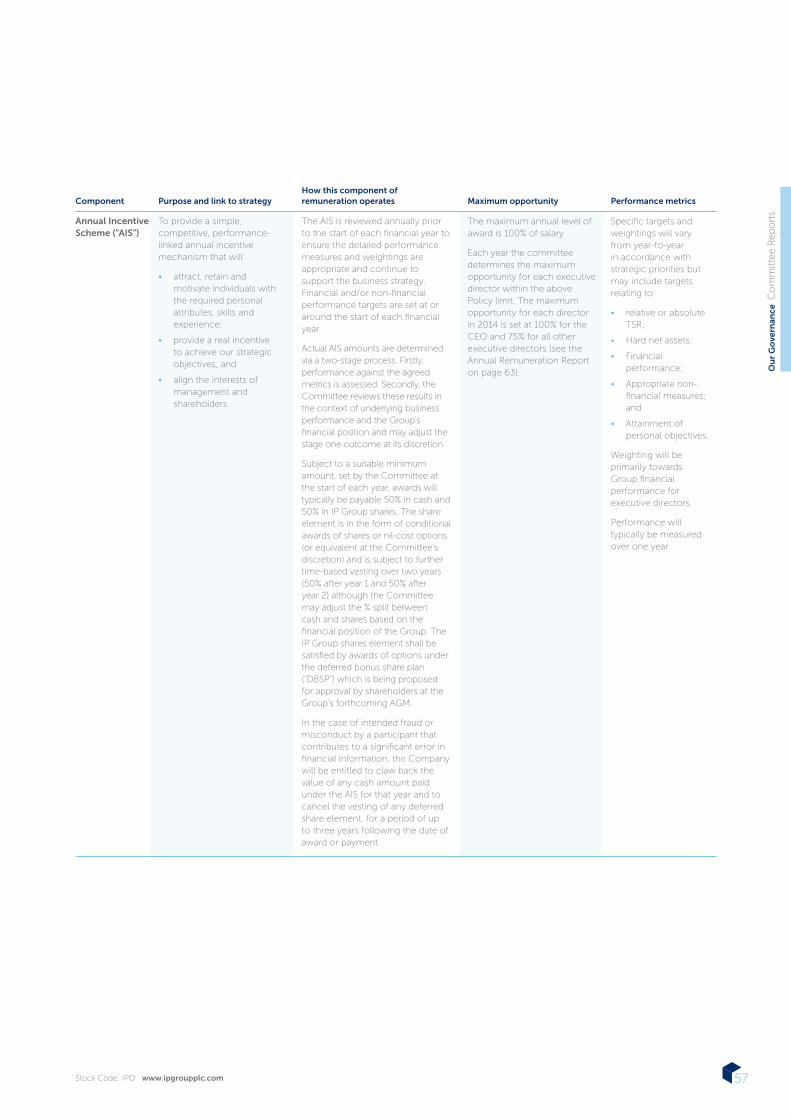
23002-04 Proof 8a 01-04-14
Stock Code: IPO www.ipgroupplc.com 57
Ou
r G
ove
rnan
ce C
om
mitt
ee R
ep
ort
s
Component Purpose and link to strategyHow this component of remuneration operates Maximum opportunity Performance metrics
Annual Incentive Scheme (“AIS”)
To provide a simple, competitive, performance-linked annual incentive mechanism that will:
• attract, retain and motivate individuals with the required personal attributes, skills and experience;
• provide a real incentive to achieve our strategic objectives; and
• align the interests of management and shareholders.
The AIS is reviewed annually prior to the start of each financial year to ensure the detailed performance measures and weightings are appropriate and continue to support the business strategy. Financial and/or non-financial performance targets are set at or around the start of each financial year.
Actual AIS amounts are determined via a two-stage process. Firstly, performance against the agreed metrics is assessed. Secondly, the Committee reviews these results in the context of underlying business performance and the Group’s financial position and may adjust the stage one outcome at its discretion.
Subject to a suitable minimum amount, set by the Committee at the start of each year, awards will typically be payable 50% in cash and 50% in IP Group shares. The share element is in the form of conditional awards of shares or nil-cost options (or equivalent at the Committee’s discretion) and is subject to further time-based vesting over two years (50% after year 1 and 50% after year 2) although the Committee may adjust the % split between cash and shares based on the financial position of the Group. The IP Group shares element shall be satisfied by awards of options under the deferred bonus share plan (“DBSP”) which is being proposed for approval by shareholders at the Group’s forthcoming AGM.
In the case of intended fraud or misconduct by a participant that contributes to a significant error in financial information, the Company will be entitled to claw back the value of any cash amount paid under the AIS for that year and to cancel the vesting of any deferred share element, for a period of up to three years following the date of award or payment.
The maximum annual level of award is 100% of salary
Each year the committee determines the maximum opportunity for each executive director within the above Policy limit. The maximum opportunity for each director in 2014 is set at 100% for the CEO and 75% for all other executive directors (see the Annual Remuneration Report on page 63).
Specific targets and weightings will vary from year-to-year in accordance with strategic priorities but may include targets relating to:
• relative or absolute TSR;
• Hard net assets;
• Financial performance;
• Appropriate non-financial measures; and
• Attainment of personal objectives.
Weighting will be primarily towards Group financial performance for executive directors.
Performance will typically be measured over one year

23002-04 Proof 8a 01-04-14
IP Group plc Annual Report and Accounts for the year ended 31 December 201358
Ou
r G
ove
rnan
ce C
om
mitt
ee R
ep
ort
s
Directors’ Remuneration Report Remuneration Policy continued
Component Purpose and link to strategyHow this component of remuneration operates Maximum opportunity Performance metrics
Long-term incentive plan (“LTIP”)
To provide a competitive, performance-linked long-term incentive mechanism that will:
• attract, retain and motivate individuals with the required personal attributes, skills and experience;
• provide a real incentive to achieve our strategic objectives; and
• align the interests of management and shareholders.
The LTIP is reviewed annually prior to the start of each financial year to ensure the detailed performance measures and weightings are appropriate and continue to support the business strategy. Financial and/or non-financial performance targets are set at or around the start of each financial year.
Awards under the LTIP typically comprise conditional awards of shares in IP Group (although instruments with similar economic effect may be used if considered appropriate.)
From the 2013 LTIP awards onwards any share awards that vest, net of any tax and NICs liabilities, are subject to a further holding period. The holding period will be one year for the 2013 LTIP and two years for subsequent awards.
In the case of intended fraud or misconduct by a participant that contributes to an error in financial information that materially affects the Company’s share value, the Company will be entitled to reduce the number of shares in respect of an unvested award and / or claw back the value of any shares subject to this holding period.
Calculations of the achievement of the vesting targets are reviewed and approved by the Committee.
The maximum annual level of award is:
• 150% of salary for the Chief Executive; and
• A lower percentage for other Executive directors
• Each year the committee determines the maximum opportunity for each executive director within the below scheme limits .The maximum opportunity for each director in 2013 and 2014 has been set at:
• 2013 LTIP: 100% of salary for all executives
• 2014 LTIP: 100% of salary for all executives.
As described on page 64 of the Annual Remuneration Report, the Committee has determined that the 2013 LTIP awards (which could not be granted in 2013) will be granted in 2014.
The overall maximum under the LTIP approved by shareholders is 400% of salary. However the policy limits set out above will apply and this plan limit will only be used in exceptional circumstances (such as a buyout on recruitment or in the circumstances described above regarding the 2013 LTIP).
Specific targets may vary from year-to-year in accordance with strategic priorities but shall be based on:
Relative or absolute TSR; and
Hard net assets.
These performance criteria shall be presented in a matrix format similar to that set out in the Annual Remuneration Report.
The level of vesting for threshold performance is 30% of the maximum.
Where absolute TSR is used as a performance metric, awards may be subject to a relative performance underpin against an appropriate benchmark index or comparator group.
Performance will ordinarily be measured based on a performance period of at least three years.

23002-04 Proof 8a 01-04-14
Stock Code: IPO www.ipgroupplc.com 59
Ou
r G
ove
rnan
ce C
om
mitt
ee R
ep
ort
s
The Committee reserves the right to
make any remuneration payments
and payments for loss of office,
notwithstanding that they are not in line
with the Policy set out in the table on the
previous pages, where the terms of the
payment were agreed either: (i) before
the policy came into effect, or (ii) at a
time when the relevant individual was not
a director of the Company and, in the
opinion of the Committee, the payment
was not in consideration for the individual
becoming a director of the Company. For
these purposes “payments” include the
Committee satisfying awards of variable
remuneration and, in relation to an award
over shares, the terms of the payment are
“agreed” at the time the award is granted.
Differences between the Policy and that applied to employees generallyThe components of remuneration set
out on the previous pages for executive
directors are also applied to the Group’s
senior management team and differ
only in values and award maxima. The
benefits package is typically available
to all UK members of staff following
completion of a probationary period,
with a broadly equivalent package being
offered to overseas staff. All permanent
UK staff employed on 1 January each
year are eligible for an award under the
AIS in that year (with pro-rated inclusion
for permanent members joining up
to 30 June each year), with similar
arrangements for overseas staff. Members
of the Group’s wider staff team do not
participate in the LTIP.
Schemes or arrangements under which allocations or awards are no longer being madeIn addition to the directors’ remuneration
arrangements, the Group previously
allocated carried interest in funds
managed by the Group to executive
directors and other key staff based
on their level of involvement and
contribution of the relevant members of
the team to the management of the fund,
as well as their cash contribution to the
relevant fund (where applicable). No new
allocations of this kind will be made to
executive or non-executive directors but
outstanding allocations will be allowed
to vest.
Illustration of the application of the Policy The value and composition of the executive directors’ remuneration packages for the
year ending 31 December 2014 at below threshold, threshold and maximum scenarios
under the Policy are set out in the charts below. The charts depict an estimate of the
remuneration that could be received by each executive director under the Policy set
out in this report.
Each bar is broken down to show how the total under each scenario comprises fixed
remuneration (salary, pension and benefits), the annual incentive scheme and the LTIP.
CEO policy CIO policy
Maximum
Threshold
Minimum
36% 32% 32%
15% 18%67%
100%
£0k £100k £200k £300k £400k £500k £600k £700k £800k £900k
Fixed AIS LTIP
Maximum
Threshold
Minimum
39% 26% 35%
12% 19%70%
100%
£0k £100k £200k £300k £400k £500k £600k £700k
Fixed AIS LTIP
CFO policy MD TTV policy
Maximum
Threshold
Minimum
39% 26% 35%
12% 19%69%
100%
£0k £100k £200k £300k £400k £500k £600k
Fixed AIS LTIP
Maximum
Threshold
Minimum
39% 26% 35%
12% 19%70%
100%
£0k £100k £200k £300k £400k £500k £600k
Fixed AIS LTIP
Notes:
The basis of calculation for the above graphs and key assumptions used are as follows:
Minimum Threshold/Target Maximum
Fixed elements of remuneration Contracted base salary with effect from 1 April 2014
(before any deduction for fees received directly
from portfolio companies)
Estimated cash cost to the company of benefits
and pension contributions received under the
remuneration policy
Annual incentive scheme1
(pay-out as % of maximum
opportunity: CEO 100%, other
executive directors 75%)
0% 25% (opportunity
based on
achievement of
threshold target)
100%
LTIP2
(vesting as % of maximum
opportunity: 100% all executive
directors)
0% 30% (opportunity
based on
achievement of
threshold targets)
100%
1. As described above, the Group’s annual incentive scheme operates such that any amounts in respect of a financial year are only paid in the following financial year (or later years in the case of the 50% deferred into shares) following completion of all audit, assurance and approval processes. However, the charts above effectively depict the total face value of the bonus that can be earned in respect of the relevant year.
2. Conditional awards of shares under the Group’s LTIP are made based on a percentage of the participant’s salary in face value terms and therefore the above amounts relating to the LTIP component reflect this. Changes in the value of those shares over the vesting period are therefore ignored.
23002-04 Proof 8a 01-04-14
IP Group plc Annual Report and Accounts for the year ended 31 December 201360
Ou
r G
ove
rnan
ce C
om
mitt
ee R
ep
ort
s
Directors’ Remuneration Report Remuneration Policy continued
Development of remuneration PolicyConsideration of pay and conditions for
the wider Group:
The components of pay across the
Group’s UK staff are broadly similar with
only the LTIP from 2013 onwards being
exclusive to the senior management
team and the executive directors. The
Committee considers general pay and
employment conditions of all employees
within the Group and is sensitive to
these, to prevailing market and economic
conditions and to governance trends
when assessing the level of salaries and
remuneration packages of executive
directors. From a practical perspective,
the Group has less than 50 members
of staff and, as a result, the Committee
currently has the ability to review
remuneration levels and changes thereto
across the Group when considering
base salary increases, bonus maxima
and award pay-outs for the executive
directors. No specific consultation in
respect of remuneration took place with
employees during the year although the
Group employed a senior HR consultant
to discuss various human capital related
matters with individuals representing
more than 50% of the Group’s employees
and the Group’s remuneration policy
featured during a number of these
discussions.
Engagement with our shareholders: The Committee is committed to an
ongoing dialogue with shareholders
and seeks to consult with its significant
shareholders and the various proxy
advisory groups when considering
any major changes to remuneration
arrangements. Feedback as part of
any consultation is used to guide
the Committee in its finalisation of
the remuneration arrangements
and their implementation. During
2013 the Committee carried out a
consultation in connection with the
proposed introduction of the AIS and
a commensurate reduction in the level
of awards made under the LTIP, the
proposed levels of executive salary and a
summary of the Group’s forward-looking
remuneration policy. No material changes
were proposed by the parties with whom
the Committee consulted.
Approach to recruitment remuneration The Committee will apply the Policy for
any new executive director recruited
to the board in respect of all elements
of forward-looking remuneration. The
maximum level of variable remuneration
under the AIS and LTIP that may be
awarded will be within the usual maxima
as set out in the Policy (i.e. 100% of salary
under the AIS and 150% of salary under
the LTIP). The Committee retains flexibility
to provide benefits in kind, pensions and
other allowances, such as relocation,
education and tax equalisation, required
in order to recruit the intended candidate.
The Committee may make awards on
hiring an external candidate to buy out
remuneration arrangements forfeited
on leaving a previous employer. In
doing so the Committee will seek to
structure buyout awards on a comparable
basis to awards forfeited, taking into
account relevant factors including any
performance conditions attached to
these awards, the form in which they
were granted (e.g. cash or shares) and
the timeframe of awards. It is intended
that the value awarded would be no
higher than the expected value of the
forfeited awards. The Committee would
seek as far as possible to make such
buyout awards under the Company’s
existing share plans but, if necessary,
may rely on the Listing Rules exemption
which allows for the grant of awards to
facilitate, in exceptional circumstances,
the recruitment of a director.
Similarly, the policy for a new chairman or
new non-executive directors would be to
apply the same remuneration elements as
apply to existing non-executive directors
under the Policy.
In addition to the above principles, the
following additional considerations may
be applied as appropriate depending on
the circumstances:
• In the case of internal promotion,
any existing performance-related
elements arising from an individual’s
previous role will continue to be
honoured under the policy, even if
they may not otherwise be consistent
with the policy prevailing when the
commitment is fulfilled.
• In the case of promotion to executive
director following an acquisition or
other business combination, the
Committee may permit equity-based
incentive arrangements to continue
in force if they can be “rolled-up”
into awards over IP Group shares
provided the performance and vesting
conditions are considered appropriate.
• In the case of the recruitment of an
executive at a time of the year when it
would be inappropriate or not possible
to provide an LTIP award for that year
(for instance due to price sensitive
information or if there is insufficient
time to assess performance). The
quantum in respect of the months
employed during the year may be
transferred to and amalgamated
with the subsequent year’s award if
considered reasonable to do so by the
Committee.
The Committee will include details of the
implementation of the Policy in respect of
any such recruitment to the Board in its
future Annual Remuneration Reports.
Service agreementsThe executive directors have service
contracts that commenced on the dates
set out in the chart opposite and contain
a contractual notice period of six months
by either party. The non-executive
directors have letters of appointment
that commenced on the dates set out
in the chart opposite, are generally for
an initial fixed term of three years, which
is reviewed and may be extended for a
further three years, and are terminable on
three months’ notice by either party. In
accordance with the Code, all directors
submit themselves for annual re-election
by shareholders at each AGM.
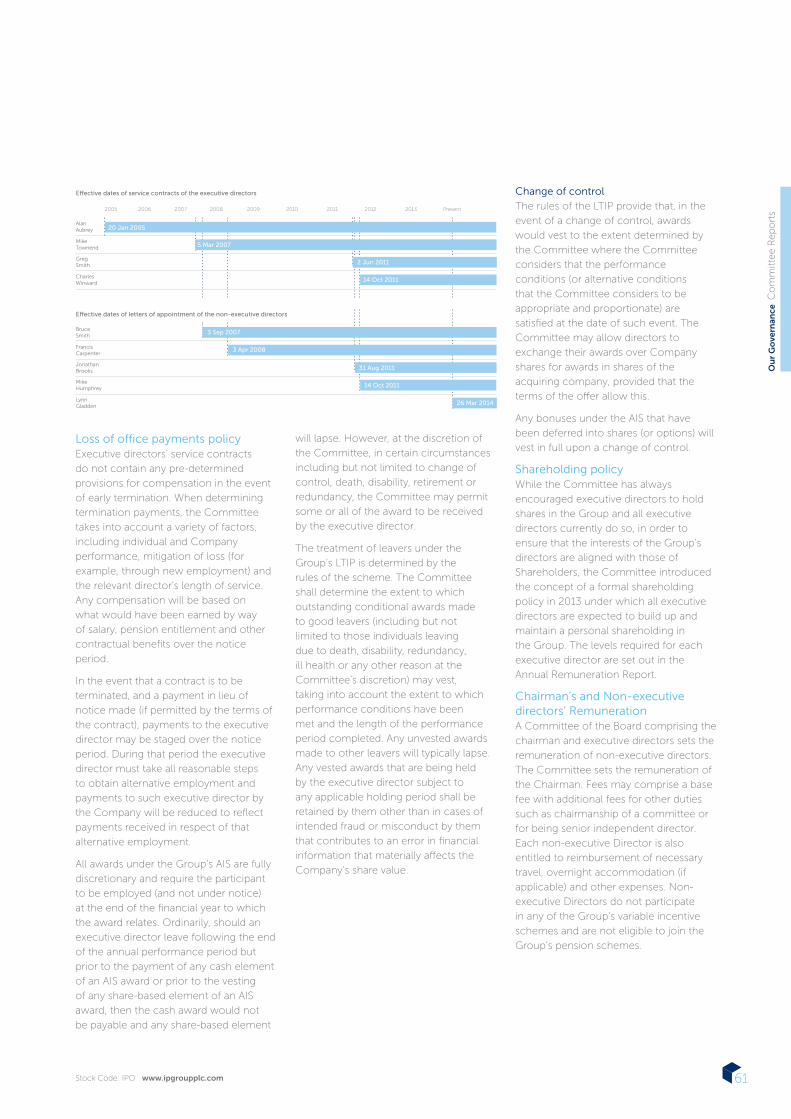
23002-04 Proof 8a 01-04-14
Stock Code: IPO www.ipgroupplc.com 61
Ou
r G
ove
rnan
ce C
om
mitt
ee R
ep
ort
s
Loss of office payments policyExecutive directors’ service contracts
do not contain any pre-determined
provisions for compensation in the event
of early termination. When determining
termination payments, the Committee
takes into account a variety of factors,
including individual and Company
performance, mitigation of loss (for
example, through new employment) and
the relevant director’s length of service.
Any compensation will be based on
what would have been earned by way
of salary, pension entitlement and other
contractual benefits over the notice
period.
In the event that a contract is to be
terminated, and a payment in lieu of
notice made (if permitted by the terms of
the contract), payments to the executive
director may be staged over the notice
period. During that period the executive
director must take all reasonable steps
to obtain alternative employment and
payments to such executive director by
the Company will be reduced to reflect
payments received in respect of that
alternative employment.
All awards under the Group’s AIS are fully
discretionary and require the participant
to be employed (and not under notice)
at the end of the financial year to which
the award relates. Ordinarily, should an
executive director leave following the end
of the annual performance period but
prior to the payment of any cash element
of an AIS award or prior to the vesting
of any share-based element of an AIS
award, then the cash award would not
be payable and any share-based element
will lapse. However, at the discretion of
the Committee, in certain circumstances
including but not limited to change of
control, death, disability, retirement or
redundancy, the Committee may permit
some or all of the award to be received
by the executive director.
The treatment of leavers under the
Group’s LTIP is determined by the
rules of the scheme. The Committee
shall determine the extent to which
outstanding conditional awards made
to good leavers (including but not
limited to those individuals leaving
due to death, disability, redundancy,
ill health or any other reason at the
Committee’s discretion) may vest,
taking into account the extent to which
performance conditions have been
met and the length of the performance
period completed. Any unvested awards
made to other leavers will typically lapse.
Any vested awards that are being held
by the executive director subject to
any applicable holding period shall be
retained by them other than in cases of
intended fraud or misconduct by them
that contributes to an error in financial
information that materially affects the
Company’s share value.
Change of control
The rules of the LTIP provide that, in the
event of a change of control, awards
would vest to the extent determined by
the Committee where the Committee
considers that the performance
conditions (or alternative conditions
that the Committee considers to be
appropriate and proportionate) are
satisfied at the date of such event. The
Committee may allow directors to
exchange their awards over Company
shares for awards in shares of the
acquiring company, provided that the
terms of the offer allow this.
Any bonuses under the AIS that have
been deferred into shares (or options) will
vest in full upon a change of control.
Shareholding policyWhile the Committee has always
encouraged executive directors to hold
shares in the Group and all executive
directors currently do so, in order to
ensure that the interests of the Group’s
directors are aligned with those of
Shareholders, the Committee introduced
the concept of a formal shareholding
policy in 2013 under which all executive
directors are expected to build up and
maintain a personal shareholding in
the Group. The levels required for each
executive director are set out in the
Annual Remuneration Report.
Chairman’s and Non-executive directors’ RemunerationA Committee of the Board comprising the
chairman and executive directors sets the
remuneration of non-executive directors.
The Committee sets the remuneration of
the Chairman. Fees may comprise a base
fee with additional fees for other duties
such as chairmanship of a committee or
for being senior independent director.
Each non-executive Director is also
entitled to reimbursement of necessary
travel, overnight accommodation (if
applicable) and other expenses. Non-
executive Directors do not participate
in any of the Group’s variable incentive
schemes and are not eligible to join the
Group’s pension schemes.
AlanAubrey
MikeTownend
Greg Smith
CharlesWinward
BruceSmith
FrancisCarpenter
JonathanBrooks
MikeHumphrey
2005 2006 2007 2008 2009 2010 2011 2012 2013 Present
E�ective dates of service contracts of the executive directors
E�ective dates of letters of appointment of the non-executive directors
LynnGladden
5 Mar 2007
2 Jun 2011
14 Oct 2011
3 Sep 2007
3 Apr 2008
31 Aug 2011
14 Oct 2011
26 Mar 2014
20 Jan 2005

23002-04 Proof 8a 01-04-14
IP Group plc Annual Report and Accounts for the year ended 31 December 201362
Ou
r G
ove
rnan
ce C
om
mitt
ee R
ep
ort
s
Directors’ Remuneration Report Annual Remuneration Report
Single figure for total remuneration (audited)The following table sets out the single figure for total remuneration for Directors for the financial years ended 31 December 2012
and 2013.
Base salary/fees Benefits Pension Annual Bonus (AIS)1 LTIP2 Total
All £000s 2013 2012 2013 2012 2013 2012 2013 2012 2013 2012 2013 2012
Executive Directors
Alan Aubrey3 189 182 4 5 25 24 254 — 1,375 3,046 1,847 3,257
Alison Fielding4, 5 101 213 3 5 11 21 76 — 524 2,491 715 2,730
Mike Townend 222 214 5 4 21 21 170 — 1,048 2,491 1,466 2,730
Charles Winward6 142 131 4 3 16 14 124 — 698 845 984 993
Greg Smith 149 132 2 2 14 13 120 — 648 686 933 833
Non-executive directors
Bruce Smith 62 60 — — — — — — — — 62 60
Mike Humphrey 42 40 — — — — — — — — 42 40
Graham Richards7 15 37 — — — — — — — — 15 37
Francis Carpenter 41 37 — — — — — — — — 41 37
Jonathan Brooks 42 40 — — — — — — — — 42 40
1. AIS bonus payable in respect of the financial year including the 50% which is deferred into shares over two years at face value at date of award. Further information about how the level of 2013 award was determined is provided in the additional disclosures section below.
2. The 2013 LTIP value is based on the 2011 LTIP award due to vest in March 2014. The value of the award is based on performance to 31 December 2013. Further information about the level of vesting is provided in the additional disclosures section below.
3. In addition, Alan Aubrey retained board fees in 2013 totalling £60,000 (2012: £58,750) from portfolio companies in which the Group is a shareholder that were deducted from his base salary, as described further under “Outside appointments for executive directors” on page 69.
4. Alison Fielding stepped down from the Board due to ill-health with effect from 30 June 2013 however she remains employed by the Group in a part-time capacity. The remuneration information above is presented up to the date of her departure from the Board. Further information on the treatment of her outstanding LTIP awards is described further on page 64.
5. In addition, Alison Fielding retained board fees in 2013 until her retirement from the Group’s board totalling £7,500 (2012: £1,250) from portfolio companies in which the Group is a shareholder that were deducted from her base salary, as described further under “Outside appointments for executive directors” on page 69.
6. In addition, Charles Winward retained board fees in 2013 totalling £13,750 (2012: £12,000) from portfolio companies in which the Group is a shareholder that were deducted from his base salary, as described further under “Outside appointments for executive directors” on page 69.
7. Graham Richards retired from the board with effect from 14 May 2013.
Additional disclosures for single figure for total remuneration table (audited)Base salary2013
Following the consultation process with shareholders during the first half of 2013, the following changes in base salary (before any
deductions for director fees received directly from Group portfolio companies) were introduced with effect from 1 April 2013: former base
salary (2012/13)
new base salary
(2013/14) % change
Alan Aubrey £242,156 £254,250 5%
Mike Townend £215,250 £226,000 5%
Charles Winward £143,500 £165,000 15%
Greg Smith £133,250 £160,000 20%
The average increase across all staff, excluding directors, was 9.5% which was generally reflective of a 5% base level with additional
increases to reflect promotions, increases in role scope and increases in an individual’s skills and experience. The Committee
considered that some of the directors’ salaries were considerably below “market” which was in part as a result of their salaries being at
an initially lower level upon joining the Board to reflect their levels of experience. As the executives’ tenure and experience continues
to grow the Committee has taken steps to increase the base salaries accordingly towards the target salaries of between lower quartile
and median of the relevant benchmarks.
The Chairman’s and non-executive directors’ fees were increased by 5% with the exception of Francis Carpenter whose fee was
increased to the same absolute level as the other non-executives, being £37,000 base fees plus £5,000 as chair of the remuneration
committee.

23002-04 Proof 8a 01-04-14
Stock Code: IPO www.ipgroupplc.com 63
Ou
r G
ove
rnan
ce C
om
mitt
ee R
ep
ort
s
Annual incentive scheme2013
As described earlier in this report, following consultation with its major shareholders, in 2013 the Group introduced the AIS under
which all executive directors were eligible for an award.
The targets for the 2013 AIS were solely financial in nature and were based on annual return on hard net assets (i.e. excluding
intangibles and the Oxford equity rights asset) which were £236.6m at 1 January 2013, as follows: Performance condition Vesting criteria Actual performance
Return on Hard NAV 8% return (£18.9m): 25% of maximum opportunity
(“threshold”)
22.5% return (£53.2m): 100% of maximum opportunity
33.3% return (£78.9m)
As shown in the table, the financial performance of the Group in 2013 was very strong, with the actual return on hard NAV being
33.3% and therefore the maximum awards pool was available for allocation by the Committee.
Taking into account various factors, including the company’s year-end cash position and the level of realisations achieved during
the year, the remuneration committee determined that it would make no amendments to the general policy. Therefore, subject to
a minimum bonus of £20,000, 50% of any individual’s bonus would be payable in cash and 50% would be deferred into equity and
that, in line with the scheme rules, these would be subject to deferral as to 50% over one year and 50% over two years with forfeiture
should the executive director leave the Group within such times. Awards to executive directors are subject to claw-back as set out in
the Policy.
The Committee considered that the executives should be treated equally in terms of bonus outcome for 2013 given the strong all-
round performance. As a result, the following annual incentive scheme awards apply for the 2013 year:
• CEO: 100% of maximum opportunity for the year (100% of salary);
• CFO: 100% of maximum opportunity for the year (75% of salary);
• CIO: 100% of maximum opportunity for the year (75% of salary); and
• MD of TTV: 100% of maximum opportunity for the year (75% of salary).
2012
The Group did not operate any annual bonus scheme in 2012.
Long-term incentive scheme2011 LTIP awards due to vest in March 2014
The 2011 LTIP awards were based on the performance of Group’s Hard NAV (the Group’s net assets excluding intangibles and the
Oxford Equity Rights asset) for the three financial years ending on 31 December 2013 and TSR from date of award to the ordinary
vesting date, being 31 March 2014. Both performance measures were combined into a matrix format, as per the vesting table below.
The total award is subject to an underpin based on the relative performance of the Group’s TSR to that of the FTSE Small Cap index,
which can reduce the awards by up to 50%.
TSR
(p
.a.)
15% 60% 75% 90% 100%
10% 30% 45% 60% 90%
8% 15% 30% 45% 75%
<8% 0% 15% 30% 60%
8% 8% 10% 15%
Growth in NAV (p.a.)
Performance condition Target performanceActual/forecast performance
Hard NAV
(at 31 Dec 2013)
8%: £236.7m
15%: £285.8m
£315.5m
(18.8% p.a. growth)
Annual TSR1
(share price)
8%: 63.0p
15%: 76.0p
156.3p
(61% p.a. growth)
Comparative TSR1 FTSE Small cap
+71%
IP Group
+188%
1. TSR performance based on quarter to 31 December 2013. Actual performance
period to 31 March 2014
As set out in the above table, the actual performance of the Group in terms of Hard NAV growth was in excess of the upper target
and, based on the positions as at 31 December 2013 and the date of this report, it appears that the TSR target and the performance
of the underpin index will also be significantly exceeded at the end of the performance period. As a result of this, it is anticipated that
100% of the 2011 LTIP awards will vest on 31 March 2014.

23002-04 Proof 8a 01-04-14
IP Group plc Annual Report and Accounts for the year ended 31 December 201364
Ou
r G
ove
rnan
ce C
om
mitt
ee R
ep
ort
s
Directors’ Remuneration Report Annual Remuneration Report continued
2010 LTIP awards that vested in April 2013
The following table sets out the outcomes of the performance measures relating to the 2010 LTIP awards against the vesting criteria.
Performance condition Vesting criteriaActual
performance Actual vesting
Hard NAV(i) £226.8m: 25%
£267.4m: 50%
£236.6m 31%
TSR performance (share price) 60p: 25%
67p: 50%
119.9p 50%
TOTAL 81%
i. Hard NAV target increased by the net proceeds of the Group’s 2011 placing plus 8%-15% growth from the date of completion of the placing.
As the performance measures were achieved in part, the relevant proportion of the 2010 LTIP awards vested on 16 April 2013.
2013 awards
During the first half of 2013, the Committee undertook a consultation with major shareholders on the rebalancing of the incentive
mix. The Committee’s intention had been to implement the new incentive framework, including granting the agreed 2013 LTIP
awards, following this consultation. However, as a result of the corporate activity during the second half of the year (culminating in the
Group’s recommended offer for Fusion IP plc and a capital raising in early 2014), there was no appropriate opportunity to grant the
agreed 2013 LTIP awards during the year.
The Committee has therefore determined that the 2013 LTIP awards will be granted at the same time as the 2014 LTIP awards
(discussed on page 66). As communicated during consultation, the 2013 LTIP award will have a face value of 100% of salary based on
the share price at date of grant and will vest three years later subject to performance. Any shares that vest (net of tax) shall be subject
to a further one-year holding period in line with the Policy.
The performance conditions that will apply shall be the same as those used for the 2011 and 2012 awards, i.e. the matrix of TSR and
Hard NAV growth as shown on page 66. Hard NAV growth will be measured over the three year period to 31 December 2015 (starting
point: £236.6m) and TSR shall be measured from March 2013 to March 2016 with a one-month average (starting point: 143p). The
underpin will be with reference to TSR performance against the FTSE 250 over this same period.
Under the new disclosure regulations, there is a requirement to disclose certain details of share awards made during the reporting
year. Although the 2013 LTIP awards were not technically awarded during 2013, the Committee believes it is appropriate and
transparent to include the required table on the basis that the 2013 LTIP awards relate to this reporting year.
Executive Director Type of interestBasis of award
(% salary) Face value*Threshold vesting** End of performance period
Alan Aubrey 2013 LTIP 100% £254k 30% 31 Dec 2015 (NAV) / 28 Mar 2016 (TSR)
Mike Townend 2013 LTIP 100% £226k 30% 31 Dec 2015 (NAV) / 28 Mar 2016 (TSR)
Charles Winward 2013 LTIP 100% £165k 30% 31 Dec 2015 (NAV) / 28 Mar 2016 (TSR)
Greg Smith 2013 LTIP 100% £160k 30% 31 Dec 2015 (NAV) / 28 Mar 2016 (TSR)
* As at the date of this report, these awards have not been made (as described above). The face value represents the value which will be granted when these awards are made in 2014. The number of shares will be calculated using the share price on grant.
** Represents threshold vesting against both elements of the performance matrix. Lower vesting is possible if only one element of the matrix is partially met,
Loss of office payments (audited information)No payments for loss of office were made to past directors during the year. No payments have been made that have not already been
included in the single figure of remuneration set out earlier in this report.
Remuneration for the Chief Operating Officer who stepped down from the Board in 2013 (audited information)As described earlier in this report, Alison Fielding stepped down from the Board due to ill-health with effect from 30 June 2013
however she remains employed by the Group in a part-time capacity. Alison received her base salary, benefits and pension
contributions to the date of stepping down and then continued to do so at a level commensurate with her new part-time role
following this date. In addition, in view of her continued employment with the Group, Alison’s outstanding awards under the Group’s
LTIP remain in force and will vest, or not, in 2014 or 2015 depending on the performance against vesting targets of the awards at
the relevant time. She will also continue to participate in the LTIP as a member of the senior management team. Alison received no
additional remuneration as a result of her stepping down from the board.

23002-04 Proof 8a 01-04-14
Stock Code: IPO www.ipgroupplc.com 65
Ou
r G
ove
rnan
ce C
om
mitt
ee R
ep
ort
s
Change in remuneration of Chief Executive compared to Group employeesThe table below sets out the increase in total remuneration of the Chief Executive and that of our UK employees (excluding directors):
% change in base salary
2012 to 2013
% change in bonus
2012 to 2013
% change in benefits
(exc. pensions) 2012 to 2013
CEO 5.0% N/A* (8.9%)
UK employees 9.5% N/A* 1.7%
* The Group did not operate an annual incentive scheme/bonus in 2012
Historical executive pay and Group performance The table and graph below allow comparison of the total shareholder return of the Group and the CEO remuneration outcomes over
the last five years.
The chart below shows the Group’s TSR performance against the performance of the FTSE All Share and FTSE Small Cap indices
over the five-year period to 31 December 2013. The directors have selected the FTSE All Share and FTSE Small Cap indices as, in their
opinion, these indices comprise the most relevant equity indices of which the Company was a member during the majority of the
period in question and against which total shareholder return of IP Group plc should be measured.
100
50
02008 2009 2010 2011 2012 2013
250
300
350
200
150
IP Group FTSE All Share FTSE Small Cap
Historical CEO remuneration outcomesThe table below summarises the Chief Executive single figure for total remuneration, annual bonus pay-out and LTIP vesting as a
percentage of maximum opportunity for the current year and previous four years. CEO: Alan Aubrey 2009 2010 2011 2012 20131
CEO single figure of remuneration (£000s) 223 193 209 3,257 1,847
Annual bonus pay-out (% of maximum) n/a n/a n/a n/a 100%
LTIP vesting (% of maximum) n/a 0% n/a 81% 100%
1. 2013 LTIP vesting is based on the current expectations of the performance targets as discussed on page 63.
Relative spend on payThe chart below shows the total employee costs, change in “hard” NAV and change in share price from 2012 to 2013.
Total employee costs (£m) +27.5%
4.0
5.1
NAV (£m) +28.1%
2012 2013
236.6
315.5
Share price (p) +41.6%
119.9
169.8
The information shown in this chart is based on the following:
Total employee pay: Total staff costs from note 8 on page 94, including wages and salaries, social security costs, pension and share-based payments.
Change in “hard” NAV: change in the Group’s net assets excluding goodwill, intangibles and the Oxford Equity Rights asset taken from the statement of financial position (page 81)
Returns to shareholders: since the Group does not currently pay a dividend, returns to shareholders are represented by the change in the Group’s share price over the period from 31 December 2012 to 31 December 2013.

23002-04 Proof 8a 01-04-14
IP Group plc Annual Report and Accounts for the year ended 31 December 201366
Ou
r G
ove
rnan
ce C
om
mitt
ee R
ep
ort
s
Directors’ Remuneration Report Annual Remuneration Report continued
Statement of implementation of remuneration policy in the following financial yearSalary and fixed componentsEffective from 1 April 2014, the base salaries of the executive directors will be:
Base salary Increase
Alan Aubrey (CEO) £261,000 2.5% (£6,750)
Mike Townend (CIO) £232,000 2.5% (£6,000)
Charles Winward (MD TTV) £185,000 12% (£20,000)
Greg Smith (CFO) £186,000 16% (£26,000)
The increases for Alan Aubrey and Mike Townend are in line with the general rate of increase across the business. The increases for
Charles Winward and Greg Smith reflect increases that, as described earlier in this report, are being phased over a number of years to
bring the individual closer to a market competitive salary commensurate with their increased experience having both initially joined on
the Board on lower base salaries.
Pension and benefits will be in line with the benefits stated in the policy table.
IncentivesThere will be no change to the maximum opportunity under our AIS, being set by the Committee at 100% of base salary for the CEO
and 75% of base salary for the other executive directors. The performance measures shall be unchanged for 2014 and shall be based
on a minimum return of 8% on the Group’s hard NAV with the maximum awards pool being available for a return of 22.5% or greater.
It is anticipated that the opening hard NAV will be adjusted upwards to reflect the Group’s capital raising and, assuming completion
following the accounts date, the acquisition of Fusion IP plc. This will result in opening hard NAV of approximately £460m requiring a
net return of approximately £37m for any bonus pool to be available and in excess of £100m for the maximum pool to be available.
The 2014 LTIP awards will be made at the same levels that apply for the 2013 awards, being 100% of base salary for all executive
directors. Performance will continue to be assessed against growth in hard NAV and TSR performance (with the underpin based on
relative TSR against the FTSE250) as per the vesting table below.
TSR
(p
.a.)
15% 60% 75% 90% 100%
10% 30% 45% 60% 90%
8% 15% 30% 45% 75%
<8% 0% 15% 30% 60%
8% 8% 10% 15%
Growth in NAV (p.a.)
Hard NAV growth will be measured over the three year period to
31 December 2016 with the starting point being the £315.5m at
31 December 2013 adjusted upwards for the net proceeds of the
Group’s 2014 new equity issue and, assuming it completes, the
Group’s acquisition of Fusion IP and TSR shall be measured from
March 2014 to March 2017 with a one-month average.
The Committee continues to consider that “hard” profitability
(which in turn drives the Group’s net asset value growth over
the longer term) is the most appropriate annual performance
measure for the Group’s business, and considers that increase in
hard NAV and TSR continue to be the most appropriate over the
longer term.
As discussed on page 64, the Committee also intends to grant
the 2013 LTIP awards during 2014 as it was not possible to grant
these during 2013.
Chairman and non-executive directorsWith effect from 1 April 2014, the fees of the Chairman will be £65,000 (reflecting a 2.5% increase compared to 2013/14) and the fees
of the non-executive directors will be £38,000 (reflecting a 2.5% increase compared to 2013/14). Additional fees for chairmanship of a
board committee or for being senior independent director shall be £7,500 (previously £5,000).

23002-04 Proof 8a 01-04-14
Stock Code: IPO www.ipgroupplc.com 67
Ou
r G
ove
rnan
ce C
om
mitt
ee R
ep
ort
s
Directors’ shareholdings and share interests (audited information)As set out in the Policy on pages 55 to 61, the Group has minimum shareholding requirements for each of its executive directors.
In its consultation with shareholders in the first half of 2013, the levels were proposed as 1.5× salary for the CEO and 1.25× salary for
all other executive directors. Mindful of evolving best practice however the Committee has determined to set the limits at 2.0× salary
for the CEO, and 1.5× salary for all other executive directors.
This level of shareholding is required to be met within four years of 1 July 2013 or date of appointment, if later. If the guideline is not
met within this timeframe then the Committee will discuss with the relevant executive director a plan to ensure that the guideline can
be met within a reasonable timeframe. The Committee will ordinarily require executive directors to retain all shares received under the
AIS or LTIP, other than as required to meet tax and NIC liabilities, until the guideline is met.
At the end of the year, all executive directors met this requirement.
Interests in sharesThe directors who held office during 2013 had the following beneficial interests in the ordinary shares of the Company:
31 December 2013Number of shares
Alan Aubrey 2,237,089
Mike Townend 910,718
Greg Smith 227,685
Charles Winward 262,446
Bruce Smith 236,592
Francis Carpenter 239,151
Jonathan Brooks 60,000
Mike Humphrey 80,000
Former directors (interests as at date of leaving the board)
Alison Fielding (stepped down 30 June 2013) 1,051,008
Graham Richards (retired 14 May 2013) 29,250
There have been no changes in the interests of the current executive directors set out above between 31 December 2013 and
3 March 2014 other than in the case of Mike Humphrey who acquired an additional 3,230 shares on 14 February 2014.
Long-Term Incentive PlanDirectors’ participations in the Group’s LTIP are:
Number of shares
conditionally held at
1 January 2013
Conditional shares notionally
awarded in the year
Vested during the year
Lapsed during the year
Potential conditional interest
in shares at 31 December 2013
Share price at date of
conditional award
(p)Earliest vesting
date(s)
Alan Aubrey
2010 LTIP 2,556,818 — (2,071,023) (485,795) — 29
2011 LTIP 879,654 — — — 879,654 54 31 March 2014
2012 LTIP 302,695 — — — 302,695 135.5 31 March 2015
3,739,167 — (2,071,023) (485,795) 1,182,349
Mike Townend
2010 LTIP 2,090,909 — (1,693,636) (397,273) — 29
2011 LTIP 670,213 — — — 670,213 54 31 March 2014
2012 LTIP 230,625 — — — 230,625 135.5 31 March 2015
2,991,747 — (1,693,636) (397,273) 900,838

23002-04 Proof 8a 01-04-14
IP Group plc Annual Report and Accounts for the year ended 31 December 201368
Ou
r G
ove
rnan
ce C
om
mitt
ee R
ep
ort
s
Directors’ Remuneration Report Annual Remuneration Report continued
Number of shares
conditionally held at
1 January 2013
Conditional shares notionally
awarded in the year
Vested during the year
Lapsed during the year
Potential conditional interest
in shares at 31 December 2013
Share price at date of
conditional award
(p)Earliest vesting
date(s)
Greg Smith
2010 LTIP 575,758 — (466,364) (109,394) — 29
2011 LTIP 414,894 — — — 414,894 54 31 March 2014
2012 LTIP 142,768 — — — 142,768 135.5 31 March 2015
1,133,420 — (466,364) (109,394) 557,662
Charles Winward
2010 LTIP 709,091 — (574,364) (134,727) — 29
2011 LTIP 446,809 — — — 446,809 54 31 March 2014
2012 LTIP 153,750 — — — 153,750 135.5 31 March 2015
1,309,650 — (574,364) (134,727) 600,559
Other long-term interests – legacy arrangements (audited information)In addition to the executive directors’ remuneration arrangements, the Group also operates co-investment and carried interest
arrangements relating to certain venture capital funds that are under its management. Under the co-investment arrangements,
executive directors make minority capital and loan commitments to IP Venture Fund (“IPVF”) alongside the Group. Executives are
entitled to participate in a carried interest scheme in respect of IPVF and The North East Technology Fund LP alongside the Group.
Carried interest provides a preferential return to participants once the partnership in question has returned all funds contributed by
limited partners together with a pre-agreed rate of return. The carried interest and co-investment arrangements will generally contain
forfeiture provisions in respect of leavers over the investment period of the relevant partnership (typically 5-6 years).
As described in the Policy, no new allocations of this kind will be made to executive directors in future however the current
outstanding interests in co-investment and carried interest schemes in connection with the Group’s managed funds are as follows:
IPVF co-investment arrangementsThe executive directors’ commitments to, and returns from, IPVF are set out below. Commitments are made indirectly through the
IP Venture Fund (FP) LP, which is the founder partner of IPVF.
Total commitment£000
Limited partnership
interest of IPVF
Total capital contributed to 1 January 2013
£000
Capital contributions
during the year£000
Total capital contributions at
31 December 2013£000
Capital amounts repaid during
the year£000
Executive Directors
Alan Aubrey 56 0.18% 44 4 48 3
Alison Fielding1 56 0.18% 44 4 48 3
Mike Townend 56 0.18% 44 4 48 3
Greg Smith 35 0.11% 23 4 27 1
Charles Winward 56 0.18% 44 4 48 3
Total 259 0.83% 199 20 219 13
1. As described earlier in this report, Alison Fielding stepped down from the Board due to ill-health with effect from 30 June 2013 however she remains employed by the Group in a part-time capacity and continues to participate in the IPVF co-investment arrangement.

23002-04 Proof 8a 01-04-14
Stock Code: IPO www.ipgroupplc.com 69
Ou
r G
ove
rnan
ce C
om
mitt
ee R
ep
ort
s
Carried interest arrangementsThe executive directors’ interests in carried interest schemes are set out below:
Fund(i)
Carried interest(ii)
at 1 January2013
Awarded during the year
Transferred during the year
Lapsed during the year
Scheme interestat
31 December2013(iii)
Accrued value(iv)
of schemeinterest at
31 December2013£000
Executive Directors
Alan Aubrey IPVF 1.81% — — — 1.81% 253
NETF 1.55% — — — 1.55% 47
Alison Fielding(v) IPVF 1.81% — — — 1.81% 253
NETF 1.15% — — — 1.15% 35
Mike Townend IPVF 1.81% — — — 1.81% 253
NETF 1.15% — — — 1.15% 35
Greg Smith IPVF 1.14% — — — 1.14% 159
NETF 0.85% — — — 0.85% 26
Charles Winward IPVF 1.81% — — — 1.81% 253
NETF 0.45% — — — 0.45% 14
i. Under the IPVF fund LPA, payments to participants are made when all limited partners have been repaid their contributions together with a hurdle rate of 8% compound interest. Under the North East Technology Fund (“NETF”) scheme, payments to participants are made when all limited partners have been repaid their contributions together with a hurdle rate of 3.5% compound interest.
ii. Scheme interest represents the percentage of the relevant pool of investments in respect of which the participant is entitled to participate in the realised profits.
iii. The schemes contain forfeiture provisions over the investment period of the fund which may reduce the scheme interest accruing to any participant. The table reflects the maximum scheme interest receivable should no forfeiture occur.
iii. Accrued value of scheme interests is calculated based upon the current fair value of the relevant limited partnership’s assets in excess of the capital contributed and the hurdle rate of return. Any payments will only be made following full repayment of limited partners’ loan commitments and the hurdle return and accordingly actual payments under the scheme, if any, may be materially different to those set out above.
iv. As described earlier in this report, Alison Fielding stepped down from the Board due to ill-health with effect from 30 June 2013 however she remains employed by the Group in a part-time capacity and continues to participate in the IPVF and NETF carried interest arrangements.
Outside appointments for executive directorsAny proposed external directorships
are considered by the Board to ensure
they do not cause a conflict of interest
but, subject to this, executive directors
may accept a maximum of two outside
non-executive appointments and indeed
the Board believes that it is part of
their ongoing development to do so.
Where an executive director accepts an
appointment to the board of a company
in which the Group is a shareholder, the
Group generally retains the related fees.
In the limited circumstances where the
executive director receives such fees
directly, such sums are deducted from
their base salary from the Group. Fees
earned for directorships of companies
in which the Group does not have a
shareholding are normally retained by the
relevant director.
Limits on the number of shares used to satisfy share awards (dilution limits)All of the Group’s incentive schemes that
contain an element that may be satisfied
in IP Group shares incorporate provisions
that in any ten-year period (ending on
the relevant date of grant), the maximum
number of the Shares that may be issued
or issuable under all such schemes shall
not exceed 10% of the issued ordinary
share capital of the Company from time
to time.
The Committee regularly monitors the
position and prior to the making of any
share-based award considers the effect
of potential vesting of outstanding awards
to ensure that the Company remains
within these limits. Any awards which
are required to be satisfied by market
purchased shares are excluded from
such calculations. No treasury shares
were held or utilised in the year ended
31 December 2013.
As at 31 December 2013, the Company’s
headroom position, which remains within
such guidelines, was as shown in the
chart below:
1.73%
0.80%
0.86%
0.78%
5.83%
Vested LTIP awards in past 10 years - Executives
Vested LTIP awards in past 10 years - Other sta�
Outstanding conditional LTIP awards - Executives
Outstanding conditional LTIP awards - Other sta�
Additional headroom

23002-04 Proof 8a 01-04-14
IP Group plc Annual Report and Accounts for the year ended 31 December 201370
Ou
r G
ove
rnan
ce C
om
mitt
ee R
ep
ort
s
Directors’ Remuneration Report Annual Remuneration Report continued
Consideration by the directors of matters relating to directors’ remunerationThe full terms of reference of the
Committee, which are reviewed annually,
are available on the Group’s website at
www.ipgroupplc.com. In summary, the
Remuneration Committee has specific
responsibility for advising the Group’s
Board on the remuneration and other
benefits of executive directors, an overall
policy in respect of remuneration of other
employees of the Group and establishing
the Group’s policy with respect to
employee incentivisation schemes.
The Remuneration Committee comprises
the following independent non-executive
directors, all of whom served throughout
the year, and whose backgrounds and
experience are summarised on page 39:
• Francis Carpenter (Chair)
• Mike Humphrey
• Jonathan Brooks
Committee meetings are administered
and minuted by the Company Secretary.
In addition, the Committee received
assistance from the Chief Financial
Officer and Chief Executive Officer who
attend meetings by invitation, except
when matters relating to their own
remuneration are being discussed.
During the year, the key activities carried
out by the Committee were:
• Consideration of the Group’s overall
remuneration structure to ensure it
continues to promote the Group’s
strategy, including the blend of fixed
and short and longer-term variable
pay.
• Consideration of the skills and
experience of the executive directors
and carried out benchmarking in order
to determine base salaries for the
period 1 April 2013 to 31 March 2014.
• Consultation with the Group’s major
shareholders and proxy advisory
bodies on the above, including the
reduction of awards under the Group’s
LTIP and introduction of an annual
incentive scheme.
• Consideration of the high-level
remuneration arrangements applicable
to the Group’s staff, including the
limitation of the LTIP to management
and executive directors and Group-
wide introduction of the AIS.
• Consideration of LTIP and AIS awards
and vesting targets for 2013 and
determining that it was not appropriate
to make 2013 LTIP awards during the
year.
• Review of the revised remuneration
reporting regulations including
the development of the Group’s
remuneration Policy and preparation
of the Directors’ Remuneration Report.
External advisersThe Remuneration Committee
is authorised, if it wishes, to seek
independent specialist services to provide
information and advice on remuneration
at the Company’s expense, including
attendance at Committee meetings.
During the year the Remuneration
Committee continued its review of
executive remuneration and took into
consideration professional advice from
Hay Group carried out in 2012 in respect
of remuneration policy, typical levels of
remuneration for the industry and sector,
and on the mix of salary and long-term
incentives. Fees paid to Hay Group in
connection with advice to the Committee
in 2013 were £nil and in 2012 were
£22,500.
In addition, the Committee utilised
the services of Deloitte LLP in 2014
to assist in the development of the
Group’s Remuneration Policy and its
reporting under the revised Directors’
Remuneration Reporting Regulations.
Hay Group did not provide any other
advice or services to the Group during
the year. Deloitte is a founding member
of the Remuneration Consultants Group
and adheres to its Code in relation to
executive remuneration consulting in
the UK.
Statement of shareholder votingThe table below sets out the proxy results of the vote on the remuneration report at the Group’s 2013 AGM:
Votes for Votes against Total Total
Number % of votes cast Number % of votes cast Votes cast Votes withheld
298,741,696 97.7% 7,120,577 2.3% 305,862,273 2,763,121
Remuneration disclosureThis report complies with the requirements of the Large and Medium-sized Companies and Groups Regulations 2008 as amended in
2013, the provisions of the UK Corporate Governance Code (September 2012) and the Listing Rules.

23002-04 Proof 8a 01-04-14
Stock Code: IPO www.ipgroupplc.com 71
Ou
r G
ove
rnan
ce C
om
mitt
ee R
ep
ort
s
Audit Committee responsibilitiesThe Committee monitors the integrity
of the financial statements of the Group,
and reviews all proposed annual and half-
yearly results announcements to be made
by the Group with consideration being
given to any significant financial reporting
judgements contained in them.
The Committee also advises the Board
on whether it believes the annual report
and accounts, taken as a whole, is fair,
balanced and understandable and provides
the information necessary for shareholders
to assess the Company’s performance,
business model and strategy.
The Committee also considers internal
controls, compliance with legal
requirements, accounting standards and
the Listing, Disclosure and Transparency
Rules of the Financial Conduct Authority,
and also reviews any proposed
change in accounting policies and any
recommendations from the Group’s
auditor regarding improvements to
internal controls and the adequacy of
resources within the Group’s finance
function.
A full copy of the Committee’s Terms of
Reference, which were updated in early
2013 following an evaluation process, is
available from the Company’s website at
www.ipgroupplc.com.
Committee membershipThe Committee comprises three
independent Non-executive Directors.
The Committee met four times during the
year. The CEO, CFO, Financial Controller,
other members of management and
the external auditor attend meetings by
invitation. As the Chair of the Committee,
I am deemed by the Board to have recent
and relevant financial experience being
a Fellow of the Chartered Institute of
Management Accountants and having
held senior financial positions in my
career. In 2013, Mike Humphrey, Senior
Independent Director, and Francis
Carpenter were the other two members.
The Committee meets at least twice
per annum with the auditor without any
members of the executive management
team being present. I also meet with the
external auditor a few times during the
year away from the Company’s offices.
Activities during the yearThe main activities of the Committee
during 2013 can be seen by referring
to the summary agenda items on page
72. In addition to its normal cycle of
activities, the Committee undertook three
additional activities in 2013. These were
the improvement of governance around
investment and divestment policies,
whistleblowing, and a review of FCA
compliance; secondly a review of the
Group’s cyber-security policies in the light
of the BIS initiative; and thirdly, following
the current audit partner’s completion of
his 5 year term in 2013, the Committee’s
decision to tender the 2014 audit and the
subsequent tender process.
Risk and internal controlsThe key elements of the Group’s internal
control framework and procedures are
set out on pages 32 and 33. The principal
risks the Group faces are set out on pages
34 to 37. Annually, the Audit Committee
considers the Group risk register
and related management controls.
Throughout the process the Board or the
Audit Committee:
• Gives consideration to whether areas
should be looked at more closely
through internal audit or specific
control reviews;
• Identifies areas where enhancement
of internal controls is required; and
• Agrees action plans to deliver
the necessary or recommended
enhancements.
There is a formal whistleblowing
policy which has been communicated
to employees. This policy provides
information on the process to follow
in the event that any employee feels
it is appropriate to make a disclosure.
The Audit Committee is satisfied that
the policy provides an adequate basis
for employees to make representations
in confidence to the Group and
for appropriate and proportionate
investigations.
Valuation of assets and liabilitiesThe Audit Committee discusses
with management and the auditor
the approach that has been taken
in assessing all key estimates. These
include the carrying value of intangible
assets, provisions for impairment of
intangible assets and the taxation status
of the Group. Given the nature of the
Company’s business, this remains an
extremely important element of the
annual audit.
The Board places a very high priority on the integrity of the Group’s financial statements, the quality and transparency of its financial reporting and the effectiveness of IP Group’s risk management and internal control systems. The Audit Committee assists the Board in its oversight and governance of these critical areas.Jonathan Brooks Chairman of the Audit Committee
Report of the Audit Committee
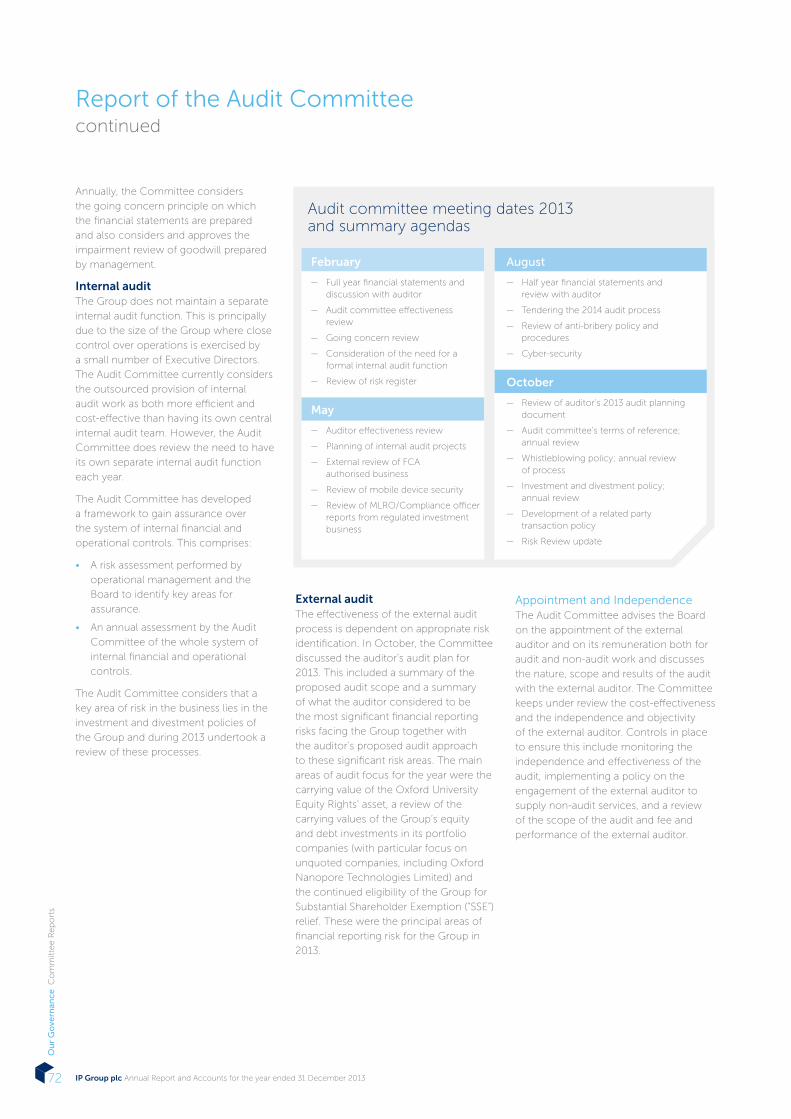
23002-04 Proof 8a 01-04-14
IP Group plc Annual Report and Accounts for the year ended 31 December 201372
Ou
r G
ove
rnan
ce C
om
mitt
ee R
ep
ort
s
Annually, the Committee considers
the going concern principle on which
the financial statements are prepared
and also considers and approves the
impairment review of goodwill prepared
by management.
Internal auditThe Group does not maintain a separate
internal audit function. This is principally
due to the size of the Group where close
control over operations is exercised by
a small number of Executive Directors.
The Audit Committee currently considers
the outsourced provision of internal
audit work as both more efficient and
cost-effective than having its own central
internal audit team. However, the Audit
Committee does review the need to have
its own separate internal audit function
each year.
The Audit Committee has developed
a framework to gain assurance over
the system of internal financial and
operational controls. This comprises:
• A risk assessment performed by
operational management and the
Board to identify key areas for
assurance.
• An annual assessment by the Audit
Committee of the whole system of
internal financial and operational
controls.
The Audit Committee considers that a
key area of risk in the business lies in the
investment and divestment policies of
the Group and during 2013 undertook a
review of these processes.
External auditThe effectiveness of the external audit
process is dependent on appropriate risk
identification. In October, the Committee
discussed the auditor’s audit plan for
2013. This included a summary of the
proposed audit scope and a summary
of what the auditor considered to be
the most significant financial reporting
risks facing the Group together with
the auditor’s proposed audit approach
to these significant risk areas. The main
areas of audit focus for the year were the
carrying value of the Oxford University
Equity Rights’ asset, a review of the
carrying values of the Group’s equity
and debt investments in its portfolio
companies (with particular focus on
unquoted companies, including Oxford
Nanopore Technologies Limited) and
the continued eligibility of the Group for
Substantial Shareholder Exemption (“SSE”)
relief. These were the principal areas of
financial reporting risk for the Group in
2013.
Appointment and IndependenceThe Audit Committee advises the Board
on the appointment of the external
auditor and on its remuneration both for
audit and non-audit work and discusses
the nature, scope and results of the audit
with the external auditor. The Committee
keeps under review the cost-effectiveness
and the independence and objectivity
of the external auditor. Controls in place
to ensure this include monitoring the
independence and effectiveness of the
audit, implementing a policy on the
engagement of the external auditor to
supply non-audit services, and a review
of the scope of the audit and fee and
performance of the external auditor.
Audit committee meeting dates 2013 and summary agendas
February
— Full year financial statements and discussion with auditor
— Audit committee effectiveness review
— Going concern review
— Consideration of the need for a formal internal audit function
— Review of risk register
May
— Auditor effectiveness review
— Planning of internal audit projects
— External review of FCA authorised business
— Review of mobile device security
— Review of MLRO/Compliance officer reports from regulated investment business
August
— Half year financial statements and review with auditor
— Tendering the 2014 audit process
— Review of anti-bribery policy and procedures
— Cyber-security
October
— Review of auditor’s 2013 audit planning document
— Audit committee’s terms of reference; annual review
— Whistleblowing policy; annual review of process
— Investment and divestment policy; annual review
— Development of a related party transaction policy
— Risk Review update
Report of the Audit Committeecontinued

23002-04 Proof 8a 01-04-14
Stock Code: IPO www.ipgroupplc.com 73
Ou
r G
ove
rnan
ce C
om
mitt
ee R
ep
ort
s
Non-Audit WorkThe Audit Committee approves all fees
paid to the auditor for non-audit work.
During the year the auditor did perform
some non-audit work which mainly
consisted of tax compliance work for
subsidiaries of the Group, as well some
other statutory filing work.
The Group does engage other
independent firms of accountants to
perform tax consulting work and other
consulting engagements to ensure that
the independence of the auditor is not
compromised. For example, during 2013,
external advisers were used to advise
on certain matters of taxation as well as
on aspects of the Group’s remuneration
policies. An analysis of non-audit fees
is provided in note 6 to the financial
statements.
Auditor IndependenceA formal statement of independence is
received from the auditor each year and
audit partners are rotated every five years.
The Board and the Audit Committee are
satisfied that the independence of the
auditor, originally appointed in 2002, has
been maintained. However, since the
current audit partner was in his fifth year,
the Audit Committee decided in August
2013 that it would put out the 2014
audit for tender and engaged in a tender
process in March 2014.
Subsequent to the 2013 year end,
our auditors, BDO LLP, also invoiced
£150,000 for financial and tax due
diligence in association with the £100m
equity capital raising and acquisition
of Fusion IP plc by the Group. Before
awarding this work we consulted with
two other firms of accountants and
we obtained other estimates of fees.
Following discussions with our auditors
to ensure that appropriate safeguards
were in place and would be implemented
in accordance with Ethical Standards, I
agreed that the work should be awarded
to BDO LLP.
Auditor EffectivenessDuring the year, the Committee assessed
the effectiveness of the external auditor,
BDO LLP. This assessment was based
upon a number of factors including
reviewing the quality and scope of
the planning of the audit, individual
questionnaire feedback from key
members of the Group’s finance team
and discussions between the Committee
members. The overall conclusion was
that the audit process was effective.
Audit Tender ProcessFollowing informal meetings with six
major accounting firms in the latter part
of 2013 and early 2014, the Committee
decided to invite three firms to tender
for the Group’s 2014 audit. A Request
for Proposal (RFP) was recently issued,
requiring each firm to submit its proposals
against a number of criteria including
audit approach and delivery, audit
quality assurance, the engagement team
proposed and proposed fees and terms.
Each firm will be allowed meetings with
the senior management of the Group and
it is anticipated that each firm will present
to the Audit Committee by early April.
Following the outcome of this process,
the Committee intends to appoint the
selected firm to carry out the Group’s
audit with effect from 2014, including
providing a review opinion on the Group’s
half-yearly results to 30 June 2014.
The Audit Committee currently intends
to recommend to the Board a resolution
to shareholders to appoint the successful
firm at the AGM to be held on 13 May
2014.
I will be available at the AGM to answer
any questions about the Committee’s
work.
Jonathan Brooks Chairman of the Audit Committee 3 March 2014

23002-04 Proof 8a 01-04-14
IP Group plc Annual Report and Accounts for the year ended 31 December 201374
Ou
r G
ove
rnan
ce O
ther
Stat
uto
ry
Report of the directorsThe directors present their report
together with the audited financial
statements for IP Group plc and its
subsidiaries for the year ended
31 December 2013.
Corporate governance statementInformation that fulfils the requirements
of the corporate governance statement
can be found in the Corporate
Governance report on pages 40 to 49
and is incorporated into this Directors’
report by reference.
Results and dividends During the period, the Group made an
overall profit after taxation for the year
ended 31 December 2013 of £72.6m
(2012: £40.7m profit). The directors
do not recommend the payment of a
dividend (2012: £nil).
DirectorsThe names of directors who currently
hold office or did so during 2013 are as
follows:
Executive DirectorsAlan Aubrey
Alison Fielding (resigned on 30 June
2013)
Mike Townend
Greg Smith
Charles Winward
Non-executive DirectorsBruce Smith (Chairman)
Graham Richards (resigned on 14 May
2013)
Francis Carpenter
Jonathan Brooks
Mike Humphrey
Dr Lynn Gladden (appointed with effect
from 26 March 2014)
Details of the interests of directors in the
share capital of the Company are set out
in the Directors’ Remuneration Report on
pages 67 to 68.
Principal risks and uncertainties and financial instruments The Group through its operations is
exposed to a number of risks. The
Group’s risk management objectives and
policies are described on pages 32 to 37
and in the Corporate Governance report
on pages 40 to 49. Further information
on the Group’s financial risk management
objectives and policies, including those
in relation to credit risk, liquidity risk and
market risk, is provided in note 2 to the
consolidated financial statements, along
with further information on the Group’s
use of financial instruments.
Significant agreementsThe Group has entered into various
agreements to form partnerships with
eleven UK universities and two US
universities, as well as agreements to
act as general partner and investment
manager to four limited partnerships.
Further details can be found in the
strategic report and in the notes to the
financial statements.
Share capital and related mattersDetails of the structure of the Company’s
share capital and the rights attaching
to the Company’s shares are set out in
note 20 to the consolidated financial
statements. There are no specific
restrictions on the size of a holding or
on the transfer of shares, which are both
governed by the general provisions of the
Company’s Articles of Association (the
“Articles”) and prevailing legislation.
At the last Annual General Meeting of the
Company, held on 14 May 2013, authority
was given to the directors pursuant to the
relevant provisions of the Companies Act
2006 to allot unissued relevant securities
in the Company up to a maximum
amount equivalent to approximately
one-third of the issued ordinary share
capital on 10 April 2013 at any time up
to the earlier of the conclusion of the
next Annual General Meeting (“AGM”)
of the Company and 11 August 2014.
Further, the directors were given authority
effective for the same period to allot
relevant securities in the Company up to
a maximum of approximately two-thirds
of the total ordinary share capital in issue
on 10 April 2013 in connection with an
offer by way of a fully pre-emptive rights
issue. A total of 9,495,195 shares (2.6% of
issued ordinary share capital at the time
these shares were issued) were issued
during the period using this authority
for the purpose of settling the 2010 LTIP
awards. The directors propose to renew
these authorities at the Company’s
next AGM to be held on 13 May 2014.
The authorities being sought are in
accordance with guidance issued by the
Association of British Insurers.
A further special resolution passed at
the 2013 AGM granted authority to the
directors to allot equity securities in
the Company for cash, without regard
to the pre-emption provisions of the
Companies Act 2006, both: (i) up to a
maximum of approximately two-thirds of
the total ordinary share capital in issue on
10 April 2013 in connection with a fully
pre-emptive rights issue; and (ii) up to
a maximum of approximately 5% of the
aggregate nominal value of the shares
in issue on 10 April 2013, each authority
exercisable at any time up to the earlier
of the conclusion of the next AGM of the
Company and 11 August 2014. Neither of
these authorities has been used during
the year. The directors will seek to renew
these authorities for a similar period at the
next AGM to be held on 13 May 2014.
Under the Companies Act 2006, the
Company has the power to purchase its
own shares in accordance with Part 18,
Chapter 5 of the Companies Act 2006.
At the 2013 Annual General Meeting,
a special resolution was passed which
granted the directors authority to make
market purchases of the Company’s
shares pursuant to these provisions of the
Companies Act 2006 up to a maximum
of approximately 10% of the Company’s
issued share capital on 10 April 2013
provided that the authority granted
set a minimum and maximum price at
which purchases can be made and is
exercisable at any time up to the earlier
of the conclusion of the next AGM and 11
August 2014. This authority has not been
used during the year. The directors will
seek to renew the authority within similar
parameters and for a similar period at the
next AGM to be held on 13 May 2014.
Directors’ report

23002-04 Proof 8a 01-04-14
Stock Code: IPO www.ipgroupplc.com 75
Ou
r G
ove
rnan
ce O
ther
Stat
uto
ry
Articles of AssociationThe Company’s Articles may be
amended by a special resolution of
the shareholders. As at the date of this
report the Company’s Articles include a
qualifying third party indemnity provision
(“QTPIP”) within the meaning of Section
234 of the Companies Act 2006.
Substantial shareholdersAs at 3 March 2014, the Company
had been advised of the following
shareholders with interests of 3% or more
in its ordinary share capital. Other than
as shown, so far as the Company (and
its directors) are aware, no other person
holds or is beneficially interested in a
disclosable interest in the Company.
Shareholder %
Invesco Limited 29.2
Lansdowne Partners 14.8
Bailie Gifford & Co 12.7
Sand Aire Limited 6.4
Oppenheimer Funds Inc.
(Massachusetts Mutual Life
Insurance Company)
5.0
Legal & General Investment
Management (LGIM) 4.6
Ruffer LLP 3.5
Political donations The Group did not make any political
donations in either year.
Corporate and social responsibilityDetails on the Group’s policies, activities
and aims with regard to its corporate and
social responsibilities, including that of
its greenhouse gas emissions is included
in the Sustainability section on pages 50
to 52.
Directors’ indemnity and liability insuranceDuring the year, the Company has
maintained liability insurance in respect
of its directors. Subject to the provisions
of the Companies Act 2006, the Articles
provide that to the extent that the
proceeds of any liability insurance are
insufficient to meet any liability in full,
every director is entitled to be indemnified
out of the funds of the Company against
any liabilities incurred in the execution or
discharge of his or her powers or duties.
RegulationTop Technology Ventures Limited, a
100%-owned subsidiary of the Company,
is authorised and regulated by the
Financial Conduct Authority under the
Financial Services and Markets Act 2000.
Post balance sheet eventsMaterial events occurring since the
balance sheet date are disclosed in the
strategic report. In summary, they are:
• The Group raised £100m (before
expenses) of new equity capital in
February 2014.
• On 23 January 2014, the Group
announced the proposed
recommended acquisition of the
remaining 79.9% shareholding in
Fusion IP plc not currently owned by
the Group in an all-paper transaction
to be implemented by way of a court-
sanctioned scheme of arrangement.
At the date of signing of this Annual
Report, the completion of the
acquisition remains subject to, inter
alia, court sanction and clearance by
the OFT but it is currently anticipated
that completion will occur in late
March 2014.
• The intellectual property
commercialisation agreement with the
University of Manchester was extended
in January 2014 to include proof-of-
principle funding for graphene projects
and to commit a further £2.5 million
of funding, bringing the total to £7.5
million, under the revised terms of
the agreement which has also been
extended to 2019.
• There has been a net unrealised fair
value increase in the Group’s holdings
in quoted portfolio companies of
£23.6m between 31 December 2013
and 28 February 2014.
Disclosure of information to auditor Each of the persons who is a director at
the date of approval of this Annual Report
confirms that:
• so far as the director is aware, there is
no relevant audit information of which
the Company’s auditor is unaware;
and
• the director has taken all steps that he/
she ought to have taken as a director
in order to make himself/herself aware
of any relevant audit information
and to establish that the Company’s
auditor is aware of that information.
This confirmation is given and should
be interpreted in accordance with
the provisions of Section 418 of the
Companies Act 2006.
Appointment of auditor The Company’s Audit Committee is
currently conducting a tender process
for the 2014 audit. It is intended This
process will be completed during March
2014 and a resolution to re-appoint
BDO LLP or appoint the Group’s new
auditors, as recommended by the Audit
Committee, together with a resolution
to authorise the Directors to determine
their remuneration will be proposed at
the AGM.
ON BEHALF OF THE BOARD
Angela Leach Company Secretary3 March 2014

23002-04 Proof 8a 01-04-14
IP Group plc Annual Report and Accounts for the year ended 31 December 201376
Ou
r G
ove
rnan
ce O
ther
Stat
uto
ry
Statement of Directors’ Responsibilities
The Annual Report and Accounts
complies with the Disclosure and
Transparency Rules (DTR) of the United
Kingdom’s Financial Conduct Authority
and the UK Corporate Governance Code
in respect of the requirements to produce
an annual financial report.
The Annual Report and Accounts is the
responsibility of, and has been approved
by, the Directors.
Each of the directors confirms to the best
of their knowledge:
• the Annual Report and Accounts,
taken as a whole, is fair balanced
and understandable and provides
the information necessary for
the assessment of the Group’s
performance, business model and
strategy;
• the Group financial statements have
been prepared in accordance with
International Financial Reporting
Standards (IFRSs) as adopted by the
European Union, the Companies
Act 2006 and Article 4 of the IAS
Regulation, while the Company
accounts have been prepared in
accordance with United Kingdom
Generally Accepted Accounting
Practice;
• the financial statements give a true
and fair view of the assets, liabilities,
financial position and profit and loss of
the Group; and
• the Annual Report and Accounts
includes a fair review of the
development and performance of the
business and the financial position of
the Group and the parent company,
together with a description or the
principal risks and uncertainties that
they face.
ON BEHALF OF THE BOARD
Dr Bruce SmithChairman3 March 2014
The directors are responsible for preparing the Annual Report and Accounts in accordance with applicable law and regulations. Company law requires the directors to prepare financial statements for each financial year. Under that law the directors are required to prepare the Group financial statements in accordance with International Financial Reporting Standards as adopted by the European Union (“IFRSs”).
The directors have elected to prepare the parent company financial
statements in accordance with United Kingdom Generally Accepted
Accounting Practice (United Kingdom Accounting Standards and applicable
law). Under company law the Directors must not approve the financial
statements unless they are satisfied that they give a true and fair view of the
state of affairs of the Group and Company and of the profit or loss for the
Group for that period.
In preparing the Group financial statements, the directors are required to:
• select suitable accounting policies and then apply them consistently;
• make judgements and accounting estimates that are reasonable and
prudent;
• state whether they have been prepared in accordance with the standards
specified above, subject to any material departures disclosed and
explained in the financial statements;
• prepare the financial statements on the going concern basis unless it is
inappropriate to presume that the Group and Company will continue in
business; and
• prepare a directors’ report and directors’ remuneration report which
comply with the requirements of the Companies Act 2006.
The directors are responsible for keeping adequate accounting records that
are sufficient to show and explain the Company’s transactions and disclose
with reasonable accuracy at any time the financial position of the Company
and enable them to ensure that the financial statements comply with the
Companies Act 2006 and, as regards the Group financial statements, Article 4
of the IAS Regulation. They are also responsible for safeguarding the assets of
the Company and hence for taking reasonable steps for the prevention and
detection of fraud and other irregularities. The directors, having prepared the
financial statements, have permitted the auditor to take whatever steps and
undertake whatever inspections it considers to be appropriate for the purpose
of enabling it to give its audit opinion.
The directors are responsible for ensuring the Annual Report and the
financial statements are made available on a website. Financial statements
are published on the Company’s website in accordance with legislation in
the United Kingdom governing the preparation and dissemination of financial
statements, which may vary from legislation in other jurisdictions. The
maintenance and integrity of the Company’s website, including that of the
financial statements contained therein, is the responsibility of the directors.

23002-04 Proof 8a 01-04-14
Stock Code: IPO www.ipgroupplc.com 77
Ou
r Fi
nan
cial
s A
ud
itor’s
Rep
ort
Independent auditor’s report
We have audited the financial statements of IP Group plc for the year ended 31 December 2013 which comprise the consolidated
statement of comprehensive income, the consolidated statement of financial position, the consolidated statement of cash flows, the
consolidated statement of changes in equity, the Company balance sheet and the related notes. The financial reporting framework
that has been applied in the preparation of the Group financial statements is applicable law and International Financial Reporting
Standards (IFRSs) as adopted by the European Union. The financial reporting framework that has been applied in preparation of
the parent company financial statements is applicable law and United Kingdom Accounting Standards (United Kingdom Generally
Accepted Accounting Practice).
Opinion on financial statementsIn our opinion:
• the financial statements give a true and fair view of the state of the Group’s and the Company’s affairs as at 31 December 2013 and
of the Group’s profit for the year then ended;
• the Group financial statements have been properly prepared in accordance with IFRSs as adopted by the European Union;
• the parent company financial statements have been properly prepared in accordance with United Kingdom Generally Accepted
Accounting Practice; and
• the financial statements have been prepared in accordance with the requirements of the Companies Act 2006 and, as regards the
Group financial statements, Article 4 of the IAS Regulation.
Our assessment of risks of material misstatement and an overview of the scope of our auditWe identified the following risks that we believe have had the greatest impact on our audit strategy and scope:
• Valuation of unlisted equity investments – The Group has £148m of investments where no quoted market price is available. These
have been valued by management in accordance with International Private Equity and Venture Capital Valuation Guidelines using a
number of valuation techniques such as price of recent investment and earnings multiples. There is a risk that the carrying value of
the portfolio does not fairly reflect its fair value as at balance sheet date.
— We have documented and assessed the design and implementation of the investment valuation processes and controls in
place.
— Where a recent transaction was used to value an investment we obtained an understanding of the circumstances around the
transaction and whether they were considered to be at an arm’s length. We also agreed the price of recent investment to share
purchase documentation.
— We have challenged management and the investment managers on key judgements and assumptions affecting investment
carrying values and adjustments made to the last price of recent investment in the context of the requirements of the
International Private Equity and Venture Capital Valuation Guidelines. In particular we focussed on the appropriateness of the
valuation basis selected as well as the underlying assumptions such as milestone analysis and/or industry and sector analysis.
We compared key underlying financial inputs to external sources and management information as applicable.
— We considered events subsequent to the year end and up to the date of this report.
• Accounting treatment and valuation of the Oxford equity rights contract - Included in the balance sheet of the Group is the
right to future shares in spin-out companies and licensing income from the University of Oxford chemistry department (‘Equity
Rights’). During the year, a change in the fair value of the Equity Rights amounting to £5m was recognised. Management exercises
significant judgement in determining the underlying assumptions used in the valuation model; the assumptions include the
discount rate, number of spin-out companies and others. We therefore believe that there is a risk in the calculation of the value of
the Equity Rights.
— We have checked the arithmetic accuracy of the discounted cash flow model and audited the inputs and assumptions into
the model which are supported by a combination of historical data and management’s assessment of future events. We have
obtained evidence to support and corroborate assumptions based on historical information and external industry data. For
assumptions based on future events we have compared prior year assumptions against actual outcomes to understand the
reasons for significant variances and considered whether they are indicative of bias or error in management’s approach to
making assumptions.
— We have challenged management on key judgements and assumptions and corroborated these where possible. We involved
our valuations specialists to assess the appropriateness of the model and underlying assumptions. We have also reviewed
management’s sensitivity analysis and in particular to changes in the discount rate and number of spin out companies and
considered this in the context of the fair value range determined by management for this contract.

23002-04 Proof 8a 01-04-14
IP Group plc Annual Report and Accounts for the year ended 31 December 201378
Ou
r Fi
nan
cial
s A
ud
itor’s
Rep
ort
Independent auditor’s reportcontinued
• Tax: Substantial Shareholdings Exemption (SSE) - SSE is an exemption from corporate tax on gains on the disposal of investments in
which a trading group or company holds more than 10% of the share capital of a trading company, for more than 12 months in the
2 year period prior to the date of disposal. The Group does not provide for deferred tax liabilities in respect of portfolio valuation
movements on the basis that the Group qualifies as a trading group under the SSE legislation. There is an ongoing risk that should
IP Group’s activities become substantially non-trading in nature or the legislation changes a deferred tax liability would be required
to be provided.
— We have engaged tax specialists to review the Group’s activities, including the roles and responsibilities of the Group’s
employees in order to assess whether the Group meets the statutory test for not having substantially non-trading activities and
tested the various relative financial measures included within the HMRC manuals to the Group’s financial statements, as well as
reviewing HMRC clearances obtained in prior years.
— We have reviewed any relevent HMRC correspondence on SSE matters during the year and up to the date of this report.
The Audit Committee’s consideration of these risks is set out on page 72.
Purpose of this reportThis report is made solely to the Company’s members, as a body, in accordance with Chapter 3 of Part 16 of the Companies Act
2006. Our audit work has been undertaken so that we might state to the Company’s members those matters we are required to
state to them in an auditor’s report and for no other purpose. To the fullest extent permitted by law, we do not accept or assume
responsibility to anyone other than the Company and the Company’s members as a body, for our audit work, for this report, or for the
opinions we have formed.
Respective responsibilities of directors and auditorAs explained more fully in the statement of directors’ responsibilities, the directors are responsible for the preparation of the financial
statements and for being satisfied that they give a true and fair view. Our responsibility is to audit and express an opinion on the
financial statements in accordance with applicable law and International Standards on Auditing (UK and Ireland). Those standards
require us to comply with the Financial Reporting Council’s (FRC’s) Ethical Standards for Auditors.
Scope of the audit of the financial statementsA description of the scope of an audit of financial statements is provided on the FRC’s website at www.frc.org.uk/auditscopeukprivate.
Our application of materiality We apply the concept of materiality both in planning and performing our audit, and in evaluating the effect of misstatements on our
audit and on the financial statements. We define planning materiality as the magnitude by which misstatements, including omissions,
could influence the economic decisions of reasonable users that are taken on the basis of the financial statements. We also determine
a level of performance materiality which we use to determine the extent of testing needed to reduce to an appropriately low level
the probability that the aggregate of uncorrected and undetected misstatements exceeds materiality for the financial statements as a
whole.
We determined planning materiality for the financial statements as a whole to be £3,400,000. In determining this, we based our
assessment on a level of 1% of total assets which reflects the underlying precision within the valuation of the investment portfolio
and the range of reasonable possible alternative valuations that could be expected to apply to the unquoted investments. On the
basis of our risk assessment, together with our assessment of the Company’s control environment, our judgment is that performance
materiality for the financial statements should be 65% of materiality i.e. £2,200,000. Our objective in adopting this approach is to
ensure that total detected and undetected audit differences do not exceed our materiality of £3,400,000 for the financial statements
as a whole.
We agreed with the Audit Committee that we would report to the Committee all audit differences in excess of £34,000, as well as
differences below that threshold that, in our view, warranted reporting on qualitative grounds.
Opinion on other matters prescribed by the Companies Act 2006In our opinion:
• the part of the directors’ remuneration report to be audited has been properly prepared in accordance with the Companies Act
2006; and
• the information given in the strategic report and the directors’ report for the financial year for which the financial statements are
prepared is consistent with the financial statements.

23002-04 Proof 8a 01-04-14
Stock Code: IPO www.ipgroupplc.com 79
Ou
r Fi
nan
cial
s A
ud
itor’s
Rep
ort
Matters on which we are required to report by exceptionUnder the ISAs (UK and Ireland), we are required to report to you if, in our opinion, information in the annual report is:
• materially inconsistent with the information in the audited financial statements; or
• apparently materially incorrect based on, or materially inconsistent with, our knowledge of the Company acquired in the course of
performing our audit; or
• is otherwise misleading.
In particular, we are required to consider whether we have identified any inconsistencies between our knowledge acquired during the
audit and the directors’ statement that they consider the annual report is fair, balanced and understandable and whether the annual
report appropriately discloses those matters that we communicated to the Audit Committee which we consider should have been
disclosed.
Under the Companies Act 2006 we are required to report to you if, in our opinion:
• adequate accounting records have not been kept, or returns adequate for our audit have not been received from branches not
visited by us; or
• the financial statements and the part of the directors’ remuneration report to be audited are not in agreement with the accounting
records and returns; or
• certain disclosures of directors’ remuneration specified by law are not made; or
• we have not received all the information and explanations we require for our audit.
Under the Listing Rules we are required to review:
• the directors’ statement, set out on page 49, in relation to going concern; and
• the part of the corporate governance statement relating to the Company’s compliance with the nine provisions of the UK
Corporate Governance Code specified for our review.
We have nothing to report in respect of these matters.
Neil Fung-On (senior statutory auditor) For and on behalf of BDO LLP, statutory auditor
55 Baker Street, London
United Kingdom
3 March 2014
BDO LLP is a limited liability partnership registered in England and Wales (with registered number OC305127).
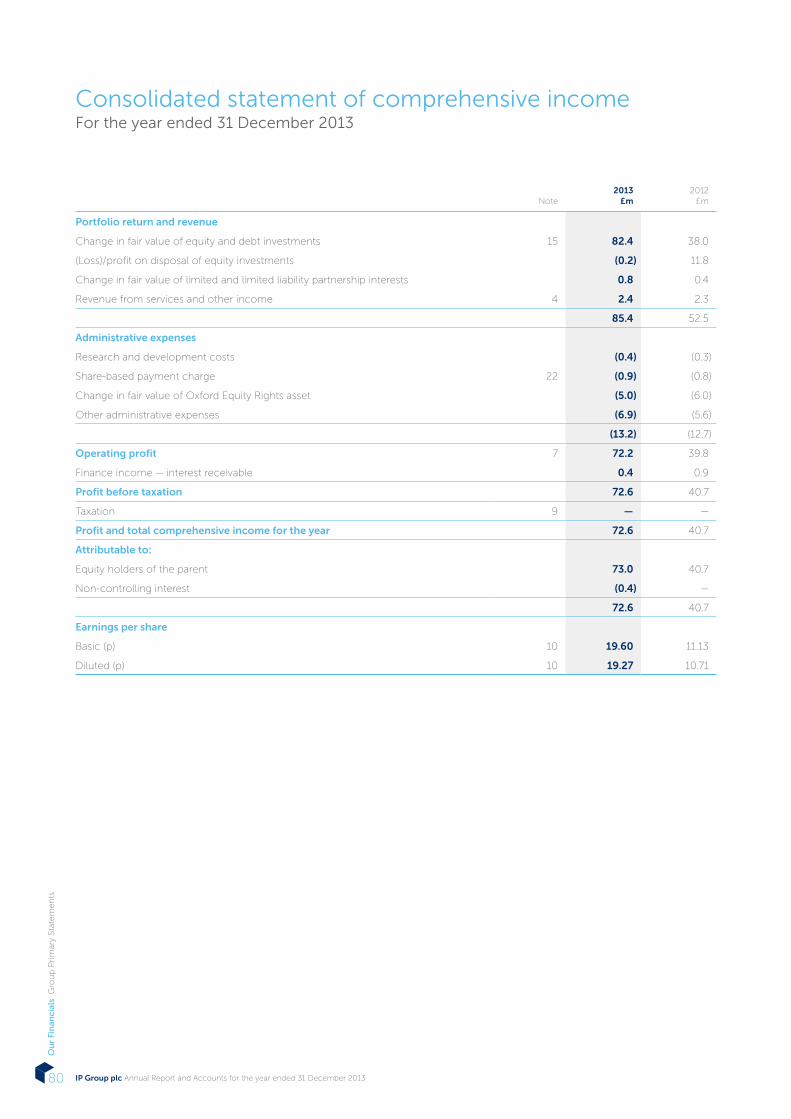
23002-04 Proof 8a 01-04-14
IP Group plc Annual Report and Accounts for the year ended 31 December 201380
Ou
r Fi
nan
cial
s G
rou
p P
rim
ary
Stat
em
en
ts
Note2013
£m2012
£m
Portfolio return and revenue
Change in fair value of equity and debt investments 15 82.4 38.0
(Loss)/profit on disposal of equity investments (0.2) 11.8
Change in fair value of limited and limited liability partnership interests 0.8 0.4
Revenue from services and other income 4 2.4 2.3
85.4 52.5
Administrative expenses
Research and development costs (0.4) (0.3)
Share-based payment charge 22 (0.9) (0.8)
Change in fair value of Oxford Equity Rights asset (5.0) (6.0)
Other administrative expenses (6.9) (5.6)
(13.2) (12.7)
Operating profit 7 72.2 39.8
Finance income — interest receivable 0.4 0.9
Profit before taxation 72.6 40.7
Taxation 9 — —
Profit and total comprehensive income for the year 72.6 40.7
Attributable to:
Equity holders of the parent 73.0 40.7
Non-controlling interest (0.4) —
72.6 40.7
Earnings per share
Basic (p) 10 19.60 11.13
Diluted (p) 10 19.27 10.71
Consolidated statement of comprehensive incomeFor the year ended 31 December 2013

23002-04 Proof 8a 01-04-14
Stock Code: IPO www.ipgroupplc.com 81
Ou
r Fi
nan
cial
s G
rou
p P
rim
ary
Stat
em
en
ts
Note2013
£m2012
£m
ASSETS
Non-current assets
Goodwill 11 18.4 18.4
Property, plant and equipment 12 0.2 0.3
Oxford Equity Rights asset and related contract costs 14 3.1 8.1
Portfolio:
Equity investments 15 283.1 177.9
Debt investments 15 2.8 3.9
Limited and limited liability partnership interests 23 4.8 4.0
Other financial asset 17 0.7 0.7
Contingent value rights 18 1.4 1.4
Total non-current assets 314.5 214.7
Current assets
Trade and other receivables 16 0.8 0.9
Deposits 5.0 32.5
Cash and cash equivalents 19.1 15.4
Total current assets 24.9 48.8
Total assets 339.4 263.5
EQUITY AND LIABILITIES
Equity attributable to owners of the parent
Share capital 20 7.5 7.3
Share premium account 150.4 150.4
Merger reserve 12.8 12.8
Retained earnings 166.3 92.6
Total equity attributable to equity holders 337.0 263.1
Non-controlling interest (0.4) —
Total equity 336.6 263.1
Current liabilities
Trade and other payables 19 1.5 0.4
Non-current liabilities
Loans from limited partners of consolidated funds 1.3 —
Total equity and liabilities 339.4 263.5
Registered number: 4204490
The financial statements on pages 80 to 107 were approved by the Board of Directors and authorised for issue on 3 March 2014 and
were signed on its behalf by:
Greg SmithChief Financial Officer
Alan AubreyChief Executive Officer
Consolidated statement of financial positionAs at 31 December 2013

23002-04 Proof 8a 01-04-14
IP Group plc Annual Report and Accounts for the year ended 31 December 201382
Ou
r Fi
nan
cial
s G
rou
p P
rim
ary
Stat
em
en
ts
2013£m
2012£m
Operating activities
Profit before taxation 72.6 40.7
Adjusted for:
Finance income — interest receivable (0.4) (0.9)
Change in fair value of equity and debt investments (82.4) (38.0)
Change in fair value of limited and limited liability partnership interests (0.8) (0.4)
Depreciation of property, plant and equipment 0.1 0.1
Loss/(profit) on disposal of equity investments 0.2 (11.8)
Change in fair value of Oxford equity rights asset 5.0 6.0
Share-based payment charge 0.9 0.8
Other portfolio income classified as investing activities cash flows (0.3) —
Changes in working capital
Decrease in trade and other receivables 0.1 0.1
Increase/(decrease) in trade and other payables 1.1 (0.3)
Increase in non-current liabilities 1.3 —
Net cash flow from deposits 27.5 17.5
Other operating cash flows
Interest received 0.7 1.1
Net cash inflow from operating activities 25.6 14.9
Investing activities
Purchase of property, plant and equipment — (0.1)
Purchase of equity and debt investments (27.5) (26.3)
Investment in limited and limited liability partnerships (0.2) (0.4)
Proceeds from sale of equity investments 5.5 16.7
Distributions from limited and limited liability partnerships 0.2 0.1
Other portfolio income received 0.1 —
Net cash outflow from investing activities (21.9) (10.0)
Financing activities
Proceeds from the issue of share capital — —
Net cash inflow from financing activities — —
Net increase in cash and cash equivalents 3.7 4.9
Cash and cash equivalents at the beginning of the year 15.4 10.5
Cash and cash equivalents at the end of the year 19.1 15.4
Consolidated statement of cash flowsFor the year ended 31 December 2013

23002-04 Proof 8a 01-04-14
Stock Code: IPO www.ipgroupplc.com 83
Ou
r Fi
nan
cial
s G
rou
p P
rim
ary
Stat
em
en
tsAttributable to equity holders of the parent
Share capital
£m
Share premium(i)
£m
Merger reserve(ii)
£m
Retained earnings(iii)
£mTotal
£m
Non-controllinginterest(iv)
£m
Total equity
£m
At 1 January 2012 7.3 150.4 12.8 51.1 221.6 — 221.6
Profit and total
comprehensive income
for the year
— — — 40.7 40.7 — 40.7
Share-based payment
charge— — — 0.8 0.8 — 0.8
At 1 January 2013 7.3 150.4 12.8 92.6 263.1 — 263.1
Profit and total
comprehensive income
for the year
— — — 73.0 73.0 (0.4) 72.6
Equity issued to settle
share-based payments0.2 — — (0.2) — — —
Share-based payment
charge— — — 0.9 0.9 — 0.9
At 31 December 2013 7.5 150.4 12.8 166.3 337.0 (0.4) 336.6
(i) Share premium — Amount subscribed for share capital in excess of nominal value, net of directly attributable issue costs.
(ii) Merger reserve — Amount subscribed for share capital in excess of nominal value in relation to the qualifying acquisition of subsidiary undertakings.
(iii) Retained earnings — Cumulative net gains and losses recognised in the consolidated statement of comprehensive income net of associated share-based payments credits.
(iv) Non-controlling interest — Share of losses attributable to the Limited Partners of IP Venture Fund II L.P. – a consolidated fund which was created in May 2013.
Consolidated statement of changes in equityFor the year ended 31 December 2013

23002-04 Proof 8a 01-04-14
IP Group plc Annual Report and Accounts for the year ended 31 December 201384
Ou
r Fi
nan
cial
s G
rou
p N
ote
s
1. Accounting PoliciesBasis of preparationThe Annual Report and Accounts of IP Group plc (“IP Group” or the “Company”) and its subsidiary companies (together, the “Group”)
are for the year ended 31 December 2013. The principal accounting policies adopted in the preparation of the financial statements
are set out below. The policies have been consistently applied to all the years presented, unless otherwise stated. These financial
statements have been prepared in accordance with International Financial Reporting Standards, International Accounting Standards
and Interpretations (collectively “IFRS”) issued by the International Accounting Standards Board (“IASB”) as adopted by the European
Union (“adopted IFRSs”).
The preparation of financial statements in compliance with IFRS requires the use of certain critical accounting estimates. It also
requires Group management to exercise judgement in the most appropriate application in applying the Group’s accounting policies.
The areas where significant judgements and estimates have been made in preparing the financial statements and their effect are
disclosed in note 3.
Changes in accounting policies(i) New standards, interpretations and amendments effective from 1 January 2013
IFRS 10 Consolidated Financial Statements: which became effective for periods beginning on or after 1 January 2013, establishes
principles for the preparation and presentation of consolidated financial statements when a reporting entity controls one or more
other entities. The new standard replaces the consolidation requirements in SIC-12 Consolidation — Special Purpose Entities and
IAS 27 Consolidated and Separate Financial Statements. While IFRS 10 specifies new criteria for the assessment of control, it has not
resulted in any conclusions differing to those reached under the previously applicable standards.
IFRS 12 Disclosure of Interests in Other Entities: IFRS 12 sets out the disclosure requirements relating to an entity’s interests in
subsidiaries, joint arrangements, associates and structured entities. The standard requires a reporting entity to disclose information
that helps users to assess the nature and financial effects of the reporting entity’s relationship with other entities. As the new standard
affects only disclosure, there is no effect on the Group’s financial position or performance.
IFRS 13 Fair Value Measurement: IFRS 13 sets out the framework for determining the measurement of fair value and the disclosure
of information relating to fair value measurement, when fair value measurements and/or disclosures are required or permitted by
other IFRSs. As a result, the guidance and requirements relating to fair value measurement that were previously located in other
IFRSs have now been relocated to IFRS 13. While there has been some rewording of the previous guidance, there are few changes
to the previous fair value measurement requirements. Instead, IFRS 13 is intended to clarify the measurement objective, harmonise
the disclosure requirements, and improve consistency in application of fair value measurement. IFRS 13 did not materially affect any
fair value measurements of the Group’s assets or liabilities, with changes being limited to presentation and disclosure, and therefore
has no effect on the Group’s financial position or performance. In addition, IFRS 13 is to be applied prospectively and therefore
comparative disclosures have not been presented. See note 3 Significant accounting estimates and judgements for more details and
further references related to fair value measurement.
No other new standards, interpretations and amendments effective for the first time from 1 January 2013 have had a material effect
on the Group’s financial statements.
(ii) New standards, interpretations and amendments not yet effective
The following new standards, which have not been applied in these financial statements, will or may have an effect on the Group’s
future financial statements:
IFRS 9 Financial Instruments: IFRS 9 will eventually replace IAS 39 in its entirety. The process has been divided into three main
components, being classification and measurement; impairment; and hedge accounting. The Group provisionally assesses the
potential effect to be immaterial given the majority of its financial assets are currently held at fair value through profit or loss. The
previous effective date of 1 January 2015 has been withdrawn and is now expected to be implemented in 2018.
Amendment to IFRS 10 — Investment Entities: The amendments define an investment entity and require a parent that is an
investment entity to measure its investments in particular subsidiaries at fair value through profit or loss, rather than consolidating
them in its consolidated financial statements. Measurement at fair value through profit or loss must also be applied to an investment
entity’s separate financial statements. The amendments also introduce disclosure requirements for investment entities into IFRS 12
Disclosure of Interests in Other Entities and amend IAS 27 Separate Financial Statements. The Group, after a provisional examination
expects to not qualify for the investment entity exemption and consequently, considers that the amendment is unlikely to result in
changes to the preparation and presentation of the Group’s subsidiaries, associates or Limited Partnerships. The mandatory adoption
starts for periods beginning on or after 1 July 2014 following EU endorsement in November 2013.
None of the other new standards, interpretations and amendments not yet effective is expected to have a material effect on the
Group’s future financial statements.
Notes to the consolidated financial statements

23002-04 Proof 8a 01-04-14
Stock Code: IPO www.ipgroupplc.com 85
Ou
r Fi
nan
cial
s G
rou
p N
ote
s
Basis of consolidation(i) Subsidiaries
Where the Group has control over an entity, it is classified as a subsidiary. As per IFRS 10 an entity is classed as under the control of
the Group when all three of the following elements are present: power over the entity, exposure to variable returns from the entity
and the ability of the Group to use its power to affect those variable returns. Control is reassessed whenever facts and circumstances
indicate that there may be a change in any of these elements of control.
In situations where the Company has the practical ability to direct the relevant activities of the investee without holding the majority
of the voting rights, it considered that de facto control exists. In determining whether de facto control exists the Group considers all
relevant facts and circumstances, including:
— The size of the Company’s voting rights relative to both the size and dispersion of other parties who hold voting rights;
— Substantive potential voting rights held by the company and by other parties;
— Other contractual arrangements; and
— Historic patterns in voting attendance.
The consolidated financial statements present the results of the Company and its subsidiaries as if they formed a single entity.
Intercompany transactions and balances between Group companies are therefore eliminated in full. The consolidated financial
statements incorporate the results of business combinations using the acquisition method. In the statement of financial position, the
acquiree’s identifiable assets, liabilities and contingent liabilities are initially recognised at their fair values at the acquisition date. The
results of acquired operations are included in the consolidated statement of comprehensive income from the date on which control
is obtained. They are consolidated until the date on which control ceases.
(ii) Associates
Associates are entities over which the Group has significant influence, but does not control, generally accompanied by a shareholding
of between 20% and 50% of the voting rights.
No associates are presented on the statement of financial position as the Group elects to hold such investments at fair value in the
statement of financial position. This treatment is permitted by IAS 28 Investment in Associates and Joint Ventures, which permits
investments held by entities that are akin to venture capital organisations to be excluded from its scope where those investments
are designated, upon initial recognition, as at fair value through profit or loss and accounted for in accordance with IAS 39 Financial
Instruments: Recognition and Measurement. Changes in fair value of associates are recognised in profit or loss in the period of the
change. The Group has no interests in associates through which it carries on its business.
(iii) Limited partnerships and limited liability partnerships (“Limited Partnerships”)
Limited partnerships
Group entities act as general partner and investment manager to the following limited partnerships:
Name
Interest in limited partnership
%
IP Venture Fund II L.P. (“IPVFII”) 33.3
IP Venture Fund (“IPVF”) 10.0
Top Technology Ventures IV LP (“TTV IV”) 1.0
The North East Technology Fund L.P. (“NETF”) —
The Group receives compensation for its role as investment manager to these limited partnerships including fixed fees and
performance fees. The directors consider that these amounts are in substance and form “normal market rate” compensation for its
role as investment manager.
In order to determine whether these limited partnerships were required to be consolidated, the presence of the three elements of
control noted in part (i) was examined.
The Group’s significant stake in IPVFII creates a significant exposure to the variability of returns from those interests and the Group’s
ability to direct the operations of the fund would result in IP Group obtaining the benefits of its activities. As such IPVFII meets the
criteria in IFRS 10 Consolidated Financial Statements and is consequently consolidated.

23002-04 Proof 8a 01-04-14
IP Group plc Annual Report and Accounts for the year ended 31 December 201386
Ou
r Fi
nan
cial
s G
rou
p N
ote
s
1. Accounting Policies continuedIn the case of IPVF and TTV IV, the directors consider that the minority limited partnership interests do not create an exposure of
such significance that it indicates that the Group acts as anything other than agent for the other limited partners in the arrangement.
Similarly, the lack of a stake in NETF indicates the Group’s role as an agent for the limited partner. As a result, the directors consider
that the Group does not have the power to govern the operations of theses limited partnerships so as to obtain benefits from their
activities and accordingly do not meet the definition of a subsidiary under IFRS 10 Consolidated Financial Statements. However the
Group does have the power to exercise significant influence over its limited partnerships and accordingly the Group’s accounting
treatment for the interests in IPVF and TTV IV is consistent with that of associates as described earlier in this report, i.e. in accordance
with IAS 39 Financial Instruments: Recognition and Measurement and designated as at fair value through profit or loss on initial
recognition.
Limited liability partnershipsThe Group has a 16.7% interest in the total capital commitments of Technikos LLP (“Technikos”). The general partner and investment
manager of Technikos are parties external to the Group.
(iv) Non-controlling interestsThe total comprehensive income, assets and liabilities of non-wholly owned subsidiaries are attributed to owners of the parent and to
the non-controlling interests in proportion to their relative ownership interests.
Portfolio return and revenue Change in fair valueChange in fair value of equity and debt investments represents revaluation gains and losses on the Group’s portfolio of investments.
Gains on disposal of equity investments represent the difference between the fair value of consideration received and the carrying
value at the start of the accounting period on the disposal of equity investments. Change in fair value of limited partnership
investments represents revaluation gains and losses on the Group’s investments in limited partnership funds. Changes in fair values of
assets do not constitute revenue.
Revenue from services and other incomeAll revenue from services is generated within the United Kingdom and is stated exclusive of value added tax. Revenue from services
and other income comprises:
Advisory fees: Fees earned from the provision of business support services are recognised as the related services are provided.
Corporate finance advisory fees are generally earned as a fixed percentage of total funds raised and recognised at the time the related
transaction is successfully concluded.
Fund management services: Fiduciary fund management fees are generally earned as a fixed percentage of total funds under
management and are recognised as the related services are provided.
Dividends: Dividends receivable from equity shares are included within other portfolio income and recognised on the exdividend date
or, where no ex-dividend date is quoted, are recognised when the Group’s right to receive payment is established.
Property, plant and equipmentAll property, plant and equipment is shown at cost less subsequent depreciation and impairment. Cost includes expenditure that is
attributable to the acquisition of the items. Depreciation on assets is calculated using the straight-line method to allocate the cost of
each asset to its residual value over its estimated useful life, as follows:
Fixtures and fittings Over 3 to 5 years
Computer equipment Over 3 to 5 years
The assets’ residual values and useful lives are reviewed, and adjusted if appropriate, at each reporting date.
Intangible assetsGoodwillGoodwill represents the excess of the cost of an acquisition over the fair value of the net identifiable assets of the acquired subsidiary
at the date of acquisition. Goodwill on acquisitions of subsidiaries is included in intangible assets and allocated from the acquisition
date to each of the Group’s cash-generating units (“CGUs”) that are expected to benefit from the business combination. Goodwill may
be allocated to CGUs in both the acquired business and in the existing business.
Impairment of intangible assets (including goodwill)Goodwill is not subject to amortisation but is tested for impairment annually and whenever events or circumstances indicate that the
carrying amount may not be recoverable. Assets that are subject to amortisation are tested for impairment when events or a change
in circumstances indicate that the carrying amount may not be recoverable. An impairment loss is recognised for the amount by
which the carrying amount exceeds its recoverable amount. The recoverable amount is the higher of the asset’s fair value less costs
to sell and the value in use. For the purposes of assessing impairments, assets are grouped at the lowest levels for which there are
identifiable cash flows (i.e. CGUs).
Notes to the consolidated financial statements continued

23002-04 Proof 8a 01-04-14
Stock Code: IPO www.ipgroupplc.com 87
Ou
r Fi
nan
cial
s G
rou
p N
ote
s
Financial assetsIn respect of regular way purchases or sales, the Group uses trade date accounting to recognise or derecognise financial assets.
Financial assets are derecognised when the rights to receive cash flows from the assets have expired or the Group has transferred
substantially all risks and rewards of ownership.
The Group classifies its financial assets into one of the categories listed below, depending on the purpose for which the asset was
acquired. None of the Group’s financial assets are categorised as held to maturity or available for sale.
(i) At fair value through profit or loss
Financial assets at fair value through profit or loss are either financial assets held for trading or financial assets which are designated at
fair value through profit or loss on initial recognition.
This category includes equity investments, debt investments, equity rights, contingent value rights and investments in limited
partnerships. Investments in associated undertakings which are held by the Group with a view to the ultimate realisation of capital
gains are also categorised as at fair value through profit or loss. This measurement basis is consistent with the fact that the Group’s
performance in respect of investments in equity investments, limited partnerships and associated undertakings is evaluated on a fair
value basis in accordance with an established investment strategy.
Financial assets at fair value through profit or loss are initially recognised at fair value and any gains or losses arising from subsequent
changes in fair value are presented in profit or loss in the statement of comprehensive income in the period which they arise.
Fair value hierarchy
The Group classifies financial assets using a fair value hierarchy that reflects the significance of the inputs used in making the related
fair value measurements. The level in the fair value hierarchy within which a financial asset is classified is determined on the basis of
the lowest level input that is significant to that assets fair value measurement. The fair value hierarchy has the following levels:
Level 1 — Quoted prices in active markets.
Level 2 — Inputs other than quoted prices that are observable, such as prices from market transactions. These are mainly based on
prices determined from recent investments in the last twelve months.
Level 3 — One or more inputs that are not based on observable market data.
Equity Investments
The fair values of quoted investments are based on bid prices in an active market at the reporting date. The fair value of unlisted
securities is established using valuation techniques. These include the use of recent arm’s length transactions, discounted cash flow
analysis and earnings multiples. Wherever possible the Group uses valuation techniques which make maximum use of market-based
inputs. Accordingly, the valuation methodology used most commonly by the Group is the ‘price of recent investment’ contained in
the International Private Equity and Venture Capital Valuation Guidelines (the “IPEVCV Guidelines”) endorsed by the British & European
Venture Capital Associations. The following considerations are used when calculating the fair value of unlisted securities:
Cost
Where the investment being valued was itself made recently, its cost may provide a good indication of fair value unless there is
objective evidence that the investment has since been impaired, such as observable data suggesting a deterioration of the financial,
technical, or commercial performance of the underlying business.
Price of recent investment
The Group considers that fair value estimates that are based entirely on observable market data will be of greater reliability than those
based on assumptions and, accordingly, where there has been any recent investment by third parties, the price of that investment will
generally provide a basis of the valuation. The length of period for which it remains appropriate to use the price of recent investment
depends on the specific circumstances of the investment and the stability of the external environment.
Given the nature of the Group’s investments in seed, start-up and early-stage companies where there are often no current and no
short-term future earnings or positive cash flows it can be difficult to gauge the probability and financial impact of the success or
failure of development or research activities and to make reliable cash flow forecasts. Consequently, the most appropriate approach
to determine fair value is a methodology that is based on market data, that being the price of a recent investment. Where the Group
considers that the price of recent investment, unadjusted, is no longer relevant and there are limited or no comparable companies or
transactions from which to infer value, the Group carries out an enhanced assessment based on milestone analysis and/or industry
and sector analysis. In applying the milestone analysis approach to investments in companies in early or development stages the
Group seeks to determine whether there is an indication of change in fair value based on a consideration of performance against any
milestones that were set at the time of the original investment decision, as well as taking into consideration the key market drivers of
the investee company and the overall economic environment.
23002-04 Proof 8a 01-04-14
IP Group plc Annual Report and Accounts for the year ended 31 December 201388
Notes to the consolidated financial statements continued
Ou
r Fi
nan
cial
s G
rou
p N
ote
s
1. Accounting Policies continuedWhere the Group considers that there is an indication that the fair value has changed, an estimation is made of the required amount
of any adjustment from the last price of recent investment. Wherever possible, this adjustment is based on objective data from the
investee company and the experience and judgement of the Group; however, any adjustment is, by its very nature, subjective. Where
a deterioration in value has occurred, the Group reduces the carrying value of the investment to reflect the estimated decrease. If
there is evidence of value creation the Group may consider increasing the carrying value of the investment; however, in the absence
of additional financing rounds or profit generation it can be difficult to determine the value that a purchaser may place on positive
developments given the potential outcome and the costs and risks to achieving that outcome and accordingly caution is applied.
Factors that the Group considers include, inter alia, technical measures such as product development phases and patent approvals,
financial measures such as cash burn rate and profitability expectations, and market and sales measures such as testing phases,
product launches and market introduction.
Other valuation techniques
If there is no readily ascertainable value from following the ‘price of recent investment’ methodology, or there is objective evidence
that a deterioration in fair value has occurred since a relevant transaction, the Group considers alternative methodologies in the
IPEVCV Guidelines, such as discounted cash flows (”DCF”) or price-earnings multiples. DCF involves estimating the fair value of
a business by calculating the present value of expected future cash flows, based on the most recent forecasts in respect of the
underlying business. Given the difficulty of producing reliable cash flow forecasts for seed, start-up and early-stage companies as
described earlier, this methodology is generally used as a confirmatory indicator of the level of any adjustment that may need to be
made to the last price of recent investment.
When using the earnings multiple methodology, earnings before interest and tax (“EBIT”) are generally used, adjusted to a maintainable
level. A suitable earnings multiple is derived from an equivalent business or group of businesses, for which the average price-earnings
multiple for the relevant sector index can generally be considered a suitable proxy. This multiple is applied to earnings to derive an
enterprise value which is then discounted by up to 60% for non-marketability and other risks inherent to businesses in early stages
of operation.
No reliable estimate
Where a fair value cannot be estimated reliably the investment is reported at the carrying value at the previous reporting date unless
there is objective evidence that the investment has since been impaired.
Equity rights
The equity rights asset represent consideration paid to the University of Oxford between December 2000 and June 2001 that gives
the Group contractual rights to the receipt of shares in unlisted spin-out companies (or cash) based on research carried out in the
university’s Department of Chemistry. It is considered to be a derivative financial asset and is designated as at fair value through profit
and loss. Further details on the treatment of this asset are included in note 14.
Debt investments
Debt investments are generally unquoted debt instruments which are convertible to equity at a future point in time. Such instruments
are considered to be hybrid instruments containing a fixed rate debt host contract with an embedded equity derivative. The Group
designates the entire hybrid contract at fair value through profit or loss on initial recognition and, accordingly, the embedded
derivative is not separated from the host contract and accounted for separately. The fair value of debt investments is established by
calculating the present value of expected future cash flows associated with the instrument.
Contingent value rights
In instances where the Group receives contingent financial consideration upon the disposal of a financial asset, the resulting asset
shall be recognised and designated as at fair value through profit and loss, and treated accordingly.
(ii) Loans and receivables
These assets are non-derivative financial assets with fixed and determinable payments that are not quoted in an active market. They
arise principally through the provision of services to customers (trade receivables) and are carried at cost less provision for impairment.
Deposits
Deposits comprise longer-term deposits held with financial institutions with an original maturity of greater than three months.
Cash and cash equivalents
Cash and cash equivalents include cash in hand and short-term deposits held with financial institutions with an original maturity of
three months or less.
Financial liabilitiesFinancial liabilities are composed of trade payables and other short-term monetary liabilities, which are recognised at amortised cost.
Unless otherwise indicated, the carrying amounts of the Group’s financial liabilities are a reasonable approximation to their fair value.

23002-04 Proof 8a 01-04-14
Stock Code: IPO www.ipgroupplc.com 89
Ou
r Fi
nan
cial
s G
rou
p N
ote
s
Share capitalFinancial instruments issued by the Group are treated as equity if the holders have only a residual interest in the Group’s assets after
deducting all liabilities. The objective of the Group is to manage capital so as to provide shareholders with above average returns
through capital growth over the medium to long term. The Group considers its capital to comprise its share capital, share premium,
merger reserve and retained earnings.
Top Technology Ventures Limited, a Group subsidiary, is subject to external capital requirements imposed by the Financial Conduct
Authority (“FCA”) and as such must ensure that it has sufficient capital to satisfy these requirements. The Group ensures it remains
compliant with these requirements as described in the financial statements of Top Technology Ventures Limited.
Employee benefits(i) Pension obligations
The Group operates a company defined-contribution pension scheme for which all employees are eligible. The assets of the scheme are
held separately from those of the Group in independently administered funds. The Group currently makes contributions on behalf of staff
to this scheme or to employee personal pension schemes on an individual basis. The Group has no further payment obligations once
the contributions have been paid. The contributions are recognised as employee benefit expenses when they are due.
(ii) Share-based payments
The Group engages in equity-settled share-based payment transactions in respect of services receivable from employees, by granting
employees conditional awards of ordinary shares subject to certain vesting conditions.
Conditional awards of shares are made pursuant to the Group’s Long-Term Incentive Plan (“LTIP”) awards. The fair value of the shares
is estimated at the date of grant, taking into account the terms and conditions of the award, including market-based performance
conditions.
The difference between the fair value of the employee services received in respect of the shares granted and the price payable is
recognised as an expense over the appropriate performance and vesting period. The corresponding credit is recognised in retained
earnings within total equity. The fair value of services is calculated using the market value on the date of award and is adjusted for
expected and actual levels of vesting. Where conditional awards of shares lapse the expense recognised to date is credited to the
statement of comprehensive income in the year in which they lapse.
Where the terms for an equity-settled award are modified, and the modification increases the total fair value of the share-based
payment, or is otherwise beneficial to the employee at the date of modification, the incremental fair value is amortised over the
vesting period.
Deferred taxFull provision is made for deferred tax on all temporary differences resulting from the carrying value of an asset or liability and its tax
base. Deferred tax is determined using tax rates (and laws) that have been enacted or substantively enacted by the reporting date and
are expected to apply when the related deferred tax asset is realised or deferred tax liability settled. Deferred tax assets are recognised
to the extent that it is probable that the deferred tax asset will be recovered in the future.
LeasesLeases where the lessor retains substantially all of the risks and rewards of ownership are classified as operating leases. Payments
made under operating leases are charged to administrative expenses in the statement of comprehensive income on a straight-line
basis over the term of the lease.
2. Financial Risk ManagementAs set out in the Principal risks and uncertainties section on pages 34 to 37, the Group is exposed, through its normal operations, to a
number of financial risks, the most significant of which are market, liquidity and credit risks.
In general, risk management is carried out throughout the Group under policies approved by the Board of Directors. The following
further describes the Group’s objectives, policies and processes for managing those risks and the methods used to measure them.
Further quantitative information in respect of these risks is presented throughout these financial statements.
(a) Market risk(i) Price risk
The Group is exposed to equity securities price risk as a result of the equity and debt investments, and investments in limited
partnerships held by the Group and categorised as at fair value through profit or loss.
The Group mitigates this risk by having established investment appraisal processes and asset monitoring procedures which are subject
to overall review by the Board. The Group has also established corporate finance and communications teams dedicated to supporting
portfolio companies with fundraising activities and investor relations.

23002-04 Proof 8a 01-04-14
IP Group plc Annual Report and Accounts for the year ended 31 December 201390
Notes to the consolidated financial statements continued
Ou
r Fi
nan
cial
s G
rou
p N
ote
s
2. Financial Risk Management continuedThe Group holds investments which are publicly traded on AIM or ISDX and investments which are not traded on an active market.
The net increase in fair value of the Group’s equity and debt investments during 2013 of £82.4m represents a 45% change against
the opening balance (2012: net increase of £38.0m, 31%) and a similar increase or decrease in the prices of quoted and unquoted
investments is considered to be reasonably possible. The table below summarises the impact of a 1% increase/decrease in the price of
both quoted and unquoted investments on the Group’s post-tax profit for the year and on equity.
2013 2012
Quoted£m
Unquoted£m
Total£m
Quoted£m
Unquoted£m
Total£m
Equity investments and investments in
limited partnerships 1.4 1.5 2.9 0.8 1.0 1.8
(ii) Interest rate risk
As the Group has no significant borrowings it has only a limited interest rate risk. The primary impact to the Group is the impact on
income and operating cash flow as a result of the interest-bearing deposits and cash and cash equivalents held by the Group.
The Group mitigates this risk, in co-ordination with liquidity risk, by managing its proportion of fixed to floating rate financial assets.
The table below summarises the interest rate profile of the Group.
2013 2012
Fixedrate £m
Floating rate£m
Interest free£m
Total£m
Fixed rate£m
Floating rate£m
Interest free£m
Total£m
Financial assets
Equity rights — — 2.9 2.9 — — 7.9 7.9
Equity investments — — 283.1 283.1 — — 177.9 177.9
Debt investments 0.6 — 2.2 2.8 3.0 — 0.9 3.9
Contingent value rights — — 1.4 1.4 — — 1.4 1.4
Deposits 5.0 — — 5.0 32.5 — — 32.5
Cash and cash equivalents — 19.1 — 19.1 — 15.4 — 15.4
Other financial assets — — 0.7 0.7 — — 0.7 0.7
Trade receivables — — 0.4 0.4 — — 0.4 0.4
Other receivables — — 0.4 0.4 — — 0.5 0.5
5.6 19.1 291.1 315.8 35.5 15.4 189.7 240.6
Financial liabilities
Trade payables — — (0.1) (0.1) — — (0.1) (0.1)
Other accruals and deferred income — — (1.4) (1.4) — — (0.3) (0.3)
Loans from limited partners of
consolidated funds — — (1.3) (1.3) — — — —
— — (2.8) (2.8) — — (0.4) (0.4)
At 31 December 2013, if interest rates had been 1% higher/lower, post-tax profit for the year, and other components of equity, would
have been £0.2m (2012: £0.2m) higher/lower as a result of higher interest received on floating rate cash deposits.
(b) Liquidity riskThe Group seeks to manage liquidity risk, to ensure sufficient liquidity is available to meet foreseeable needs and to invest cash assets
safely and profitably. Accordingly, the Group only invests working capital in short-term instruments issued by reputable counterparties.
The Group continually monitors rolling cash flow forecasts to ensure sufficient cash is available for anticipated cash requirements.

23002-04 Proof 8a 01-04-14
Stock Code: IPO www.ipgroupplc.com 91
Ou
r Fi
nan
cial
s G
rou
p N
ote
s
(c) Credit riskThe Group’s credit risk is primarily attributable to its deposits, cash and cash equivalents, debt investments and trade receivables. The
Group seeks to mitigate its credit risk on cash and cash equivalents by making short-term deposits with counterparties, or by investing
in treasury funds with an “AA” credit rating or above managed by institutions. Short-term deposit counterparties are required to have
most recently reported total assets in excess of £3bn and, where applicable, a prime short-term credit rating at the time of investment
(ratings are generally determined by Moody’s or Standard & Poor’s). Moody’s prime credit ratings of “P1”, “P2” and “P3” indicate
respectively that the rating agency considers the counterparty to have a “superior”, “strong” or “acceptable” ability to repay short-term
debt obligations (generally defined as having an original maturity not exceeding 13 months). An analysis of the Group’s deposits and
cash and cash equivalents balance analysed by credit rating as at the reporting date is shown in the table below. All other financial
assets are unrated.
Credit rating2013
£m2012
£m
P1 14.2 14.8
P2 9.9 30.6
AA – 2.5
Total deposits and cash and cash equivalents 24.1 47.9
The Group has no significant concentration of credit risk, with exposure spread over a large number of counterparties and customers.
The Group has detailed policies and strategies which seek to minimise these associated risks, including defining maximum
counterparty exposure limits for term deposits based on their perceived financial strength at the commencement of the deposit.
The maximum single counterparty limit for deposits at 31 December 2013 was £10m (2012: £10m).
The Group’s exposure to credit risk on debt investments is managed in a similar way to equity price risk, as described earlier, through
the Group’s investment appraisal processes and asset monitoring procedures which are subject to overall review by the Board.
The maximum exposure to credit risk for debt investments, receivables and other financial assets is represented by their carrying
amount.
3. Significant Accounting Estimates and JudgementsThe directors make judgements and estimates concerning the future. Estimates and judgements are continually evaluated and are
based on historical experience and other factors, such as expectations of future events, and are believed to be reasonable under the
circumstances. Actual results may differ from these estimates. The estimates and assumptions that have the most significant effects
on the carrying amounts of the assets and liabilities in the financial statements are discussed below.
(i) Valuation of unquoted equity investmentsThe judgements required in order to determine the appropriate valuation methodology of unquoted equity investments have a
significant risk of causing a material adjustment to the carrying amounts of assets and liabilities. These judgements include making
assessments of the future earnings potential of portfolio companies, appropriate earnings multiples to apply, and marketability and
other risk discounts.
(ii) Impairment of goodwillThe Group is required to test, at least annually, whether goodwill has suffered any impairment. The recoverable amount is determined
using a number of value-in-use and fair-value-less-costs-to-sell calculations. The use of these methods requires the estimation of
future cash flows and the selection of a suitable discount rate in order to calculate the present value of these cash flows, as well as
the selection of applicable and reasonable multiples..
(iii) Equity rightsOn initial recognition, the equity rights arrangement was considered in substance to be a derivative financial asset. This conclusion
was reached after considering that the asset’s value changes in response to a change in an ‘underlying’, being the number and value
of spin-out companies created, the net investment was considered to be smaller than would be expected for other contracts with
similar response to changes in market factors and it is to be settled at a future date.
As the asset is not quoted on an active market the fair value is determined using valuation techniques, including discounted cash
flows. The asset has historically been held at cost since no reliable estimate of fair value could be reached. At 31 December 2013 the
information available to the directors and the time remaining in the contract produced a sufficiently accurate estimate of fair value at
balance sheet date. In the discounted cash flow model the directors considered the historic asset performance, the spin-out pipeline
and available economic data to estimate the unobservable inputs. Those inputs include the average spin-out rate and the projected
cash flows on IPO or trade sale from anticipated spin-out opportunities. The discount rate used for valuing the equity rights asset is
determined based on the Group’s cost of capital.
Discussion of sensitivity analyses is included in the relevant note for each of the above estimates and judgements.

23002-04 Proof 8a 01-04-14
IP Group plc Annual Report and Accounts for the year ended 31 December 201392
Notes to the consolidated financial statements continued
Ou
r Fi
nan
cial
s G
rou
p N
ote
s
4. Revenue From ServicesAll revenue from services is derived from the provision of advisory and venture capital fund management services.
5. Operating SegmentsFor both the year ended 31 December 2013 and the year ended 31 December 2012 the Group’s revenue and profit/loss before
taxation were derived almost entirely from its principal activities within the UK. Though the Group has initiated operations in the
US the associated revenues and costs are currently immaterial and accordingly no additional geographical disclosures are given.
For management reporting purposes, the Group is currently organised into three operating segments: (i) the commercialisation of
intellectual property via the formation of long-term partner relationships with universities; (ii) management of venture funds focusing
on early-stage UK technology companies; and (iii) the in-licensing of drugable intellectual property from research intensive institutions.
These activities are described in further detail in the Strategic report on pages 01 to 37.
Year ended 31 December 2013
University partnership
business£m
Venture capital fund
management£m
In-licensing activity
£mConsolidated
£m
STATEMENT OF COMPREHENSIVE INCOME
Portfolio return and revenue
Change in fair value of equity and debt investments 82.4 — — 82.4
Loss on disposal of equity investments (0.2) — — (0.2)
Change in fair value of limited and limited liability partnership interests 0.8 — — 0.8
Revenue from advisory services and other portfolio income 0.8 0.3 — 1.1
Revenue from fund management services — 1.3 — 1.3
Change in fair value of Oxford Equity Rights asset (5.0) — — (5.0)
Administrative expenses (6.9) (0.8) (0.5) (8.2)
Operating profit/(loss) 71.9 0.8 (0.5) 72.2
Finance income – interest receivable 0.4 — — 0.4
Profit/(loss) before taxation 72.3 0.8 (0.5) 72.6
Taxation — — — —
Profit/(loss) and total comprehensive income for the year 72.3 0.8 (0.5) 72.6
STATEMENT OF FINANCIAL POSITION
Assets 332.8 6.4 0.2 339.4
Liabilities (1.3) (1.4) (0.1) (2.8)
Net assets 331.5 5.0 0.1 336.6
Other segment items
Capital expenditure — — — —
Depreciation 0.1 — — 0.1
Amortisation of intangible assets — — — —
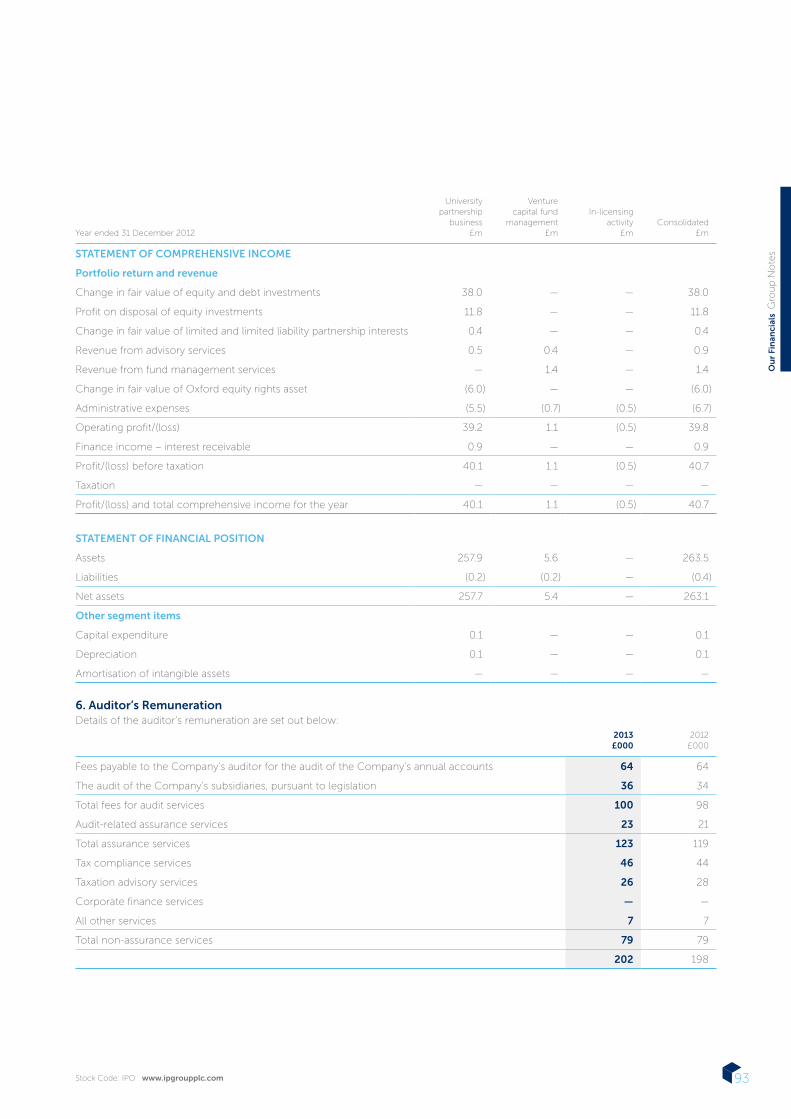
23002-04 Proof 8a 01-04-14
Stock Code: IPO www.ipgroupplc.com 93
Ou
r Fi
nan
cial
s G
rou
p N
ote
s
Year ended 31 December 2012
University partnership
business£m
Venture capital fund
management£m
In-licensing activity
£mConsolidated
£m
STATEMENT OF COMPREHENSIVE INCOME
Portfolio return and revenue
Change in fair value of equity and debt investments 38.0 — — 38.0
Profit on disposal of equity investments 11.8 — — 11.8
Change in fair value of limited and limited liability partnership interests 0.4 — — 0.4
Revenue from advisory services 0.5 0.4 — 0.9
Revenue from fund management services — 1.4 — 1.4
Change in fair value of Oxford equity rights asset (6.0) — — (6.0)
Administrative expenses (5.5) (0.7) (0.5) (6.7)
Operating profit/(loss) 39.2 1.1 (0.5) 39.8
Finance income – interest receivable 0.9 — — 0.9
Profit/(loss) before taxation 40.1 1.1 (0.5) 40.7
Taxation — — — —
Profit/(loss) and total comprehensive income for the year 40.1 1.1 (0.5) 40.7
STATEMENT OF FINANCIAL POSITION
Assets 257.9 5.6 — 263.5
Liabilities (0.2) (0.2) — (0.4)
Net assets 257.7 5.4 — 263.1
Other segment items
Capital expenditure 0.1 — — 0.1
Depreciation 0.1 — — 0.1
Amortisation of intangible assets — — — —
6. Auditor’s RemunerationDetails of the auditor’s remuneration are set out below:
2013£000
2012£000
Fees payable to the Company’s auditor for the audit of the Company’s annual accounts 64 64
The audit of the Company’s subsidiaries, pursuant to legislation 36 34
Total fees for audit services 100 98
Audit-related assurance services 23 21
Total assurance services 123 119
Tax compliance services 46 44
Taxation advisory services 26 28
Corporate finance services — —
All other services 7 7
Total non-assurance services 79 79
202 198

23002-04 Proof 8a 01-04-14
IP Group plc Annual Report and Accounts for the year ended 31 December 201394
Notes to the consolidated financial statements continued
Ou
r Fi
nan
cial
s G
rou
p N
ote
s
7. Profit/(loss) From OperationsProfit/(loss) from operations has been arrived at after charging:
2013£m
2012£m
Amortisation of intangible assets — —
Depreciation of tangible assets 0.1 0.1
Employee costs (see note 8) 5.1 4.0
Operating leases — property 0.4 0.2
(Loss)/profit on disposal of equity investments (0.2) 11.8
8. Employee CostsEmployee costs (including directors) comprise:
2013£m
2012£m
Salaries 3.7 2.7
Defined contribution pension cost 0.1 0.1
Share-based payment charge (see note 22) 0.9 0.8
Social security 0.4 0.4
5.1 4.0
The average monthly number of persons (including executive directors) employed by the Group during the year was 35, all of whom were involved in management and administration activities (2012: 34). Details of directors’ remuneration can be found in the Directors’ Remuneration Report on pages 53 to 70.
9. Taxation2013
£m2012
£m
Current tax — —
Deferred tax — —
The amount for the year can be reconciled to the profit per the statement of comprehensive income as follows:2013
£m2012
£m
Profit before tax 72.6 40.7
Tax at the UK corporation tax rate of 23.5% (2012: 24.5%) 16.9 10.0
Non-taxable income (19.9) (7.2)
Movement in tax losses arising not recognised 3.0 (2.8)
Other adjustments — —
Tax credit — —
At 31 December 2013, deductible temporary differences and unused tax losses for which no deferred tax asset has been recognised totalled £53.0m (2012: £22.6m). An analysis is shown below:
2013 2012
Amount£m
Deferred tax£m
Amount£m
Deferred tax£m
Share-based payment costs 13.7 2.7 — —
Unused tax losses 39.3 7.9 22.6 4.5
53.0 10.6 22.6 4.5
This asset has not been recognised in the financial statements due to current uncertainties surrounding the reversal of the underlying temporary differences. This deferred tax asset would be recovered if there were future taxable profits from which the reversal of the underlying temporary difference could be deducted.
The directors believe that the Group qualifies for Substantial Shareholder Exemption and therefore no deferred tax is provided for in
respect of the net uplift in valuation of the Group’s equity investments.

23002-04 Proof 8a 01-04-14
Stock Code: IPO www.ipgroupplc.com 95
Ou
r Fi
nan
cial
s G
rou
p N
ote
s
10. Earnings Per Share
Earnings2013
£m2012
£m
Earnings for the purposes of basic and dilutive earnings per share 73.0 40.7
Number of shares
2013Number of
shares
2012Number of
shares
Weighted average number of ordinary shares for
the purposes of basic earnings per share372,513,387 365,763,664
Effect of dilutive potential ordinary shares:
Long-Term Incentive Plan 6,515,903 14,142,480
Weighted average number of ordinary shares for
the purposes of diluted earnings per share379,029,290 379,906,144
The Group has only one class of potentially dilutive ordinary share. These are contingently issuable shares arising under the
Group LTIP.
11. Goodwill£m
At 1 January 2012 18.4
At 1 January 2013 18.4
At 31 December 2013 18.4
The Group conducts annual impairment tests on the carrying value of goodwill, based on the recoverable amount of the CGUs to
which the goodwill has been allocated. The goodwill allocated to each CGU is summarised in the table below. A number of both
value-in-use and fair-value-less-costs-to-sale calculations are used to assess the recoverable values of the CGUs, details of which are
specified below.2013
£m2012
£m
University partnership CGU 16.3 16.3
Fund management CGU 2.1 2.1
18.4 18.4
Impairment review of venture capital fund management CGUThe key assumptions of the DCF model used to assess the value in use, and the range of multiples applied in calculating the fair-
value-less-costs-to-sell based on a percentage of assets under management are shown below:2013 2012
Discount rate 9%–11% 9%–11%
Number of funds under management 3 3
Management fee 2%–3.5% 2%–3.5%
Cost inflation 3% 4%
Percentage of assets under management 2%–7% n/a
A number of different value-in-use models were assessed in order to evaluate the recoverable value of the CGU, none of which
resulted in an impairment being required.
Impairment review of the university partnership CGUThe key assumptions of the DCF models used to assess the value in use are shown overleaf.
For the purposes of impairment testing, the university partnership CGU comprises those elements connected with the Group’s
university partnership business other than those that specifically relate to the Group’s contract with the University of Oxford’s
Department of Chemistry (see note 14). The directors consider that for each of the key variables which would be relevant in
determining a recoverable value for the university partnership CGU, there is a range of reasonably possible alternative values. The key
variable ranges are set out overleaf:

23002-04 Proof 8a 01-04-14
IP Group plc Annual Report and Accounts for the year ended 31 December 201396
Notes to the consolidated financial statements continued
Ou
r Fi
nan
cial
s G
rou
p N
ote
s
11. Goodwill continued2013 2012
Number of spin-out companies per year 7–10 4–8
Annual investment rate £20m–£35m n/a
Rate of return achieved 18%–22% n/a
Initial equity stake acquired by the Group under the university partnership 12%–30% 12%–30%
Proportion of spin-out companies failing 32%–45% 30%–45%
Weighted average holding period (years) 3–5 n/a
Dilution rates prior to exit as a result of financing for spin-out companies 40%–60% 40%–60%
Proportion of IPO exits 25%–35% 25%–35%
IPO exit valuations £35m–£45m £20m–£40m
Proportion of disposal exits 28%–32% 25%–35%
Disposal valuations £25m–£35m £10m–£30m
Discount rate 9%–11% 8%–12%
A number of different value-in-use models were assessed in order to evaluate the recoverable value of the CGU, none of which
resulted in an impairment being required.
12. Property, Plant and EquipmentTotal
£m
Cost
At 1 January 2013 1.0
Additions —
At 31 December 2013 1.0
Accumulated depreciation
At 1 January 2013 0.7
Charge for the year 0.1
At 31 December 2013 0.8
Net book value
At 31 December 2013 0.2
At 31 December 2012 0.3
Total£m
Cost
At 1 January 2012 0.8
Additions 0.2
At 31 December 2012 1.0
Accumulated depreciation
At 1 January 2012 0.6
Charge for the year 0.1
At 31 December 2012 0.7
Net book value
At 31 December 2012 0.3
At 31 December 2011 0.2

23002-04 Proof 8a 01-04-14
Stock Code: IPO www.ipgroupplc.com 97
Ou
r Fi
nan
cial
s G
rou
p N
ote
s
13. Categorisation of Financial InstrumentsAt fair value through profit or loss
Financial assetsHeld for trading
£m
Designated upon initial recognition
£m
Loans and receivables
£mTotal
£m
At 31 December 2013
Equity rights 3.1 — — 3.1
Equity investments — 283.1 — 283.1
Debt investments — 2.8 — 2.8
Other financial assets 0.7 — — 0.7
Contingent value rights — 1.4 — 1.4
Limited and limited liability partnership interests — 4.8 — 4.8
Trade and other receivables — — 0.8 0.8
Deposits — — 5.0 5.0
Cash and cash equivalents — — 19.1 19.1
Total 3.8 292.1 24.9 320.8
At 31 December 2012
Equity rights 8.1 — — 8.1
Equity investments — 177.9 — 177.9
Debt investments — 3.9 — 3.9
Other financial assets 0.7 — — 0.7
Contingent value rights — 1.4 — 1.4
Limited and limited liability partnership interests — 4.0 — 4.0
Trade and other receivables — — 0.9 0.9
Deposits — — 32.5 32.5
Cash and cash equivalents — — 15.4 15.4
Total 8.8 187.2 48.8 244.8
All financial liabilities are categorised as other financial liabilities and recognised at amortised cost.
The Group does not consider that any change in fair value of financial assets in the year is attributable to credit risk (2012: £nil).
All net fair value gains in the year are attributable to financial assets designated at fair value through profit or loss on initial recognition
(2012: all net fair value gains attributable to financial assets designated at fair value through profit or loss on initial recognition).
14. Equity Rights and Related Contract CostsEquity rights
£mContract costs
£mTotal
£m
Cost
At 1 January 2013 and 31 December 2013 19.9 0.5 20.4
Aggregate amortisation and change in fair value of contract costs
At 1 January 2013 (12.0) (0.3) (12.3)
Change in fair value during the year (5.0) — (5.0)
At 31 December 2013 (17.0) (0.3) (17.3)
Net book value
At 31 December 2013 2.9 0.2 3.1
At 31 December 2012 7.9 0.2 8.1

23002-04 Proof 8a 01-04-14
IP Group plc Annual Report and Accounts for the year ended 31 December 201398
Notes to the consolidated financial statements continued
Ou
r Fi
nan
cial
s G
rou
p N
ote
s
14. Equity Rights and Related Contract Costs continued
Equity rights£m
Contract costs
£mTotal
£m
Cost
At 1 January 2012 and 31 December 2012 19.9 0.5 20.4
Aggregate amortisation and change in fair value of contract costs
At 1 January 2012 (6.0) (0.3) (6.3)
Change in fair value during the year (6.0) — (6.0)
At 31 December 2012 (12.0) (0.3) (12.3)
Net book value
At 31 December 2012 7.9 0.2 8.1
At 31 December 2011 13.9 0.2 14.1
Carrying amount of equity rightsEquity rights represent consideration paid to the University of Oxford between December 2000 and June 2001.
In return for the non-refundable, non-interest bearing, advance totalling £20.1m, the Group has the right to receive from the University
the following over its 15-year term:
— 50% of the university’s equity shares in any spin-out company created based on intellectual property created by academics that are
considered to be part of the Department of Chemistry (i.e. equity instruments in unlisted companies); and
— 50% of the university’s share of any cash payments received by the university from parties who have licensed intellectual property
created by academics that are considered to be part of the Department of Chemistry.
The contract expires on 23 November 2015.
The directors consider that for each of the key variables which would be relevant in determining a fair value for this financial
instrument, there is a range of reasonably possible alternative values. The key variable ranges are set out below:2013 2012
Number of spin-out companies per year from University of Oxford’s Department of Chemistry 1–2 1–2
Initial equity stake acquired by the Group under the equity rights contract 20%–25% 20%–25%
Proportion of spin-out companies failing 30%–40% 30%–40%
Dilution rates prior to exit as a result of financing for spin-out companies 35%–60% 35%–60%
Proportion of IPO exits 30%–40% 30%–40%
IPO exit valuations £30m–£50m £30m–£50m
Proportion of disposal exits 25%–35% 25%–35%
Disposal valuations £30m–£40m £30m–£40m
Discount rate 9%–11% 9%–11%
These key variable ranges result in a wide range of fair value estimates for the equity rights agreement, from £2.3m to £4.4m using a
range of reasonably possible variables, with the number of spin-outs being the variable giving rise to the widest variation in estimated
fair values. In order to calculate a more accurate valuation figure given the multitude of reliable scenarios generated when altering the
discounted cash flows variables, a probability weighting expected return method is utilised. Having applied probabilities to the various
possible scenarios, the method returned an estimated asset value of £3.1m at 31 December 2013 (2012: £8.1m).

23002-04 Proof 8a 01-04-14
Stock Code: IPO www.ipgroupplc.com 99
Ou
r Fi
nan
cial
s G
rou
p N
ote
s
15. Investment PortfolioLevel 1 Level 2 Level 3
Group
Equity investments in
quoted spin-out companies
£m
Equity investments in
unquoted spin-out companies
£m
Unquoted debt investments
in spin-out companies
£m
Equity investments in
unquoted spin-out companies
£mTotal
£m
At 1 January 2013 84.6 86.5 3.9 6.8 181.8
Investments during the year 9.4 14.1 4.0 – 27.5
Transaction-based reclassifications during the year — 3.6 (3.7) 0.1 —
Other transfers between hierarchy levels during the year 0.6 (12.0) (0.4) 11.8 —
Disposals (5.6) (0.2) — — (5.8)
Change in fair value in the year 46.1 39.0 (1.0) (1.7) 82.4
At 31 December 2013 135.1 131.0 2.8 17.0 285.9
At 1 January 2012 50.0 47.9 3.4 22.5 123.8
Investments during the year 8.5 14.5 2.6 0.7 26.3
Transaction-based reclassifications during the year 3.5 (2.6) (1.2) 0.3 —
Other transfers between hierarchy levels during the year — (1.2) — 1.2 —
Disposals (5.4) — (0.1) (0.8) (6.3)
Change in fair value in the year 28.0 27.9 (0.8) (17.1) 38.0
At 31 December 2012 84.6 86.5 3.9 6.8 181.8
Fair values of unquoted spin-out companies classified as Level 3 in the fair value hierarchy have been determined in part or in full by
valuation techniques that are not supported by observable market prices or rates. Investments in 25 companies have been classified
as Level 3 and the individual valuations for each of these have been arrived at using a variety of valuation techniques and assumptions.
For instances where the fair values are based upon the most recent market transaction but which occurred more than twelve
months previously, the investments are reclassified as Level 3 in the fair value hierarchy. However, if the assumptions used in the
valuation techniques for the Group’s holding in each company are varied by using a range of possible alternatives, there is no material
difference to the carrying value of the respective spin-out company. The effect on the consolidated statement of comprehensive
income for the period is also not expected to be material.
The net increase in fair value for the year of £82.4m (2012: £38.0m) includes a net decrease of £1.7m (2012: £9.9m increase) that has
been estimated using a valuation technique. Further details are contained within the accounting policy for equity investments. During
the period then has been a net transfer between the level 2 heirarchy to level 3 of circa £12m. This is due to a number of portfolio
companies not receiving financing in the previous 12 months and subsequently being reclassified. However these companies had
previously raised sufficient capital to allow extended periods of development and continue to make good progress against technical
milestones.
Change in fair value in the year2013
£m2012
£m
Fair value gains 90.2 64.5
Fair value losses (7.8) (26.5)
82.4 38.0
The Company’s interests in subsidiary undertakings are listed in note 2 to the Company’s financial statements.

23002-04 Proof 8a 01-04-14
IP Group plc Annual Report and Accounts for the year ended 31 December 2013100
Notes to the consolidated financial statements continued
Ou
r Fi
nan
cial
s G
rou
p N
ote
s
16. Trade and Other Receivables2013
£m2012
£m
Trade debtors 0.3 0.4
Prepayments 0.1 0.2
Other receivables 0.4 0.3
0.8 0.9
The directors consider the carrying amount of trade and other receivables to approximate their fair value. All receivables are interest
free, repayable on demand and unsecured.
17. Other Financial AssetOther financial asset comprises a zero-cost forward contract giving the Group the right to receive sale proceeds when University
of Leeds sells down its stake in specified spin-out companies subject to a maximum receivable of £0.7m following £nil receipt of
sale proceeds during 2013 (2012: £0.7m receivable). The asset has no set date of repayment or other rights of recourse. This asset
is classified as a financial asset held for trading initially measured at fair value with subsequent changes recognised in the statement
of comprehensive income. Fair value is determined by discounting expected cash flows at prevailing market rates of interest and
accordingly, the Group considers this asset to be Level 3 in the fair value hierarchy throughout the current and previous financial
years. If the assumptions used in the valuation techniques are varied by using a range of possible alternatives, there is no material
difference to the statement of financial position, nor the consolidated statement of comprehensive income.
18. Contingent Value RightsAs a result of the disposal of Proximagen Group plc in August 2012, the Group received contingent consideration, in the form of
contingent value rights (“CVRs”), based upon future net revenues of two associated drug programmes. In line with the Group’s
policies, these have been recognised as financial assets at fair value through profit and loss, and has been fair valued at £1.4m (2012:
£1.4m). The Group considers this asset to be Level 3 in the fair value hierarchy throughout the current and previous financial years. If
the assumptions used in the valuation techniques are varied by using a range of possible alternatives, there is no material difference to
the statement of financial position, nor the consolidated statement of comprehensive income.
19. Trade and Other Payables
Current liabilities2013
£m2012
£m
Trade payables 0.1 0.1
Social security expenses 0.1 0.1
Other accruals and deferred income 1.3 0.2
1.5 0.4
Non-current liabilities2013
£m2012
£m
Loans drawn down from the Limited Partners of consolidated funds 1.3 —
1.3 —
20. Share Capital2013 2012
Issued and fully paid: Number £m Number £m
Ordinary Shares of 2p each
At 1 January 365,763,664 7.3 365,763,664 7.3
Issued under employee share plans 9,495,195 0.2 — —
At 31 December 375,258,859 7.5 365,763,664 7.3
In April 2013 the Group issued 9,495,195 new ordinary shares with a par value of 2p in order to settle the 2010 LTIP scheme which
partially achieved its vesting conditions and consequently became payable to the Group’s employees. The Company has one class of
ordinary shares which carry equal voting rights, equal rights to income and distributions of assets on liquidation or otherwise, and no
right to fixed income.

23002-04 Proof 8a 01-04-14
Stock Code: IPO www.ipgroupplc.com 101
Ou
r Fi
nan
cial
s G
rou
p N
ote
s
21. Operating Lease Arrangements2013
£m2012
£m
Payments under operating leases recognised in the statement of comprehensive income for the year 0.4 0.4
At the reporting date, the Group had outstanding commitments for future minimum lease payments under non-cancellable operating
leases, which fall due as follows:2013
£m2012
£m
Within one year 0.3 0.3
In the second to fifth years inclusive 0.6 0.9
0.9 1.2
Operating lease payments represent rentals and other charges payable by the Group for certain of its office properties. Leases are
negotiated for an average term of five years and rentals are fixed for an average of one year.
22. Share-Based PaymentsAnnual Incentive SchemeIn 2013, following the reduction in scope of the LTIP scheme, the Annual Incentive Scheme was introduced to provide an element
of short-term incentive. Some awards will include an element of IP Group shares, which will be subject to further time-based vesting
over two years (typically 50% after year 1 and 50% after year 2). As at 31 December 2013 no such options or shares had been granted
and there is no associated fair value. However, as the number shares to be granted are based as a percentage of employees’ salary,
the share-based payments line includes the associated expense incurred in 2013.
Long-Term Incentive Plan (“LTIP”) awards Awards under the LTIP take the form of conditional awards of ordinary shares of 2p each in the Group which vest over the prescribed
performance period to the extent that performance conditions have been met. The Remuneration Committee imposes objective
conditions on the vesting of awards and these take into consideration the guidance of the Group’s institutional investors from time to
time. Further information on the Group’s LTIP is set out in the Directors’ Remuneration Report set out on pages 53 to 70.
No LTIP awards were made in 2013.
The 2012 LTIP awards will ordinarily vest on 31 March 2015, to the extent that the performance conditions have been met. The awards
are based on the performance of Group’s Hard NAV and TSR. Both performance measures are combined into a matrix format to most
appropriately measure performance relative to the business, as shown in the Directors’ Remuneration report on page 63. The total
award is subject to an underpin based on the relative performance of the Group’s TSR to that of the FTSE Small Cap index, which can
reduce the awards by up to 50%. The matrix is designed such that up to 100% of the award (prior to the application of the underpin)
will vest in full in the event of both Hard NAV increasing by 15% per year on a cumulative basis from 1 January 2012 to 31 December
2014 and TSR increasing by 15% per year on a cumulative basis from the date of award to 31 March 2015, using an industry-standard
average price period at the beginning and end of the performance period. Further, the matrix is designed such that 30% of the award
shall vest (again prior to the application of the underpin) if the cumulative increase is 8% per annum for both measures over their
respective performance periods (“threshold performance”). A straight-line sliding scale is applied for performance between the distinct
points on the matrix of vesting targets.
The 2011 LTIP awards will ordinarily vest on 31 March 2014, to the extent that the performance conditions have been met. Deloitte LLP
provided independent external advice to IP Group’s Remuneration committee on the appropriate performance conditions to attach to
the 2011 LTIP awards based on their experience of current market practice. The 2012 awards were designed using on the same matrix
structure, together with the FTSE small-cap index underpin, as was incorporated into the 2011 LTIP.
The 2010 LTIP awards partially vested on 16 April 2013 and on this date shares in IP Group were issued via the Group’s employee
benefit trust to the relevant members of the Company’s staff accordingly. 50% of the awards were based on the increase in IP Group’s
Hard NAV, and 50% were based on IP Group’s share price performance. The table overleaf sets out the performance measures relating
to the 2010 LTIP awards and the actual performance achieved.

23002-04 Proof 8a 01-04-14
IP Group plc Annual Report and Accounts for the year ended 31 December 2013102
Notes to the consolidated financial statements continued
Ou
r Fi
nan
cial
s G
rou
p N
ote
s
22. Share-Based Payments continued
Performance condition Vesting criteriaActual
performancePercentage
vesting
Hard NAV(i) £226.8m: 25%
£267.4m: 50% £236.6m 31%
TSR performance (share price) 60p: 25%
67p: 50% 119.9p 50%
Total 81%
Hard NAV target increased by the net proceeds of the Group’s 2011 placing plus 8%-15% growth from the date of completion of the
placing.
The movement in the number of shares notionally awarded under the LTIP is set out below:2013 2012
At 1 January 18,000,923 17,055,803
Forfeited during the year (2,342,292) (767,746)
Vested during the year (9,495,195) —
Notionally awarded during the year — 1,712,866
At 31 December 6,163,436 18,000,923
No shares were notionally awarded during 2013. The fair value of awards made in the prior year was calculated using a Monte Carlo
pricing model with the following key assumptions:2012
Share price at date of award £1.355
Exercise price £nil
Fair value at grant date £0.38
Expected volatility (median of historical 50-day moving average) 35%
Expected life (years) 2.75
Expected dividend yield 0%
Risk-free interest rate 1.1%
The fair value charge recognised in the statement of comprehensive income during the year in respect of LTIP share awards was
£0.9m (2012: £0.8m).
23. Limited and Limited Liability Partnership Interests£m
At 1 January 2012 3.3
Additions during the year 0.4
Realisations in the year (0.1)
Change in fair value during the year 0.4
At 1 January 2013 4.0
Additions during the year 0.2
Realisations in the year (0.2)
Change in fair value during the year 0.8
At 31 December 2013 4.8
The Group considers interests in limited and limited liability partnerships to be Level 3 in the fair value hierarchy throughout the
current and previous financial years. If the assumptions used in the valuation techniques for the Group’s holding in each company
are varied by using a range of possible alternatives, there is no material difference to the carrying value of the respective spin-out
company. The effect on the consolidated statement of comprehensive income for the period is also not expected to be material.

23002-04 Proof 8a 01-04-14
Stock Code: IPO www.ipgroupplc.com 103
Ou
r Fi
nan
cial
s G
rou
p N
ote
s
24. Related Party TransactionsThe Group has various related parties arising from its key management, subsidiaries, equity stakes in portfolio companies and
management of certain limited partnership funds.
a) Limited partnershipsThe Group manages a number of investment funds structured as limited partnerships. Group entities have a limited partnership
interest (see note 1) and act as the general partners of these limited partnerships. The Group therefore has power to exert significant
influence over these limited partnerships. The following amounts have been included in respect of these limited partnerships:
Statement of comprehensive income2013
£m2012
£m
Revenue from services 1.3 1.4
Statement of financial position2013
£m2012
£m
Investment in limited partnerships 3.6 2.8
Amounts due from related parties — —
b) Key management transactionsThe key management had investments in the following spin-out companies as at 31 December 2013:
Director Company name
Number of shares held at
1 January 2013
Number of shares acquired/ (disposed) in the
period
Number of shares held at 31 December
2013 %
Alan Aubrey Amaethon Limited — A Shares 104 — 104 3.1%
Amaethon Limited — B Shares 11,966 — 11,966 1.0%
Amaethon Limited — Ordinary shares 21 — 21 0.3%
Avacta Group plc 20,276,113 — 20,276,113 0.6%
Capsant Neurotechnologies Limited 11,631 — 11,631 0.8%
Chamelic Limited 26 — 26 0.4%
Crysalin Limited 1,447 — 1,447 0.1%
EmDot Limited 15 — 15 0.9%
Evocutis plc 767,310 — 767,310 0.4%
Getech Group plc 15,000 — 15,000 0.1%
Green Chemicals plc 108,350 — 108,350 0.8%
Icona Solutions Limited 1,674 (1,674) — —
Ilika plc 117,500 — 117,500 0.2%
Karus Therapeutics Limited 223 — 223 0.1%
Mode Diagnostics Limited 3,226 — 3,226 0.4%
Modern Biosciences plc 1,185,150 — 1,185,150 2.1%
Modern Water plc 519,269 — 519,269 0.7%
Oxford Advanced Surfaces Group plc 2,172,809 — 2,172,809 1.1%
Oxford Nanopore Technologies Limited 114,420 — 114,420 0.6%
Oxtox Limited 25,363 — 25,363 0.3%
Pharminox Limited 685 — 685 0.3%
Photopharmica (Holdings) Limited1 37,020 — 37,020 1.0%
Plexus Planning Limited 1,732 — 1,732 0.8%
Retroscreen Virology Group plc 37,160 — 37,160 0.1%
Revise Limited — 19 19 0.5%
Revolymer plc 88,890 — 88,890 0.2%
Salunda Limited 53,639 — 53,639 0.8%
Structure Vision Limited 212 — 212 1.0%
Surrey Nanosystems Limited 393 — 393 0.3%
Sustainable Resource Solutions Limited 30 — 30 1.2%
Tissue Regenix Group plc 2,389,259 — 2,389,259 0.4%
Tracsis plc 168,010 (46,821) 121,189 0.5%
Velocys plc 122,109 (100,591) 21,518 <0.1%
Xeros Limited 241 — 241 0.1%

23002-04 Proof 8a 01-04-14
IP Group plc Annual Report and Accounts for the year ended 31 December 2013104
Notes to the consolidated financial statements continued
Ou
r Fi
nan
cial
s G
rou
p N
ote
s
Director Company name
Number of shares held at
1 January 2013
Number of shares acquired/ (disposed) in the
period
Number of shares held at 31 December
2013 %
Mike Townend Amaethon Limited — A Shares 104 — 104 3.1%
Amaethon Limited — B Shares 11,966 — 11,966 1.0%
Amaethon Limited — Ordinary shares 21 — 21 0.3%
Avacta Group plc 931,367 — 931,367 <0.1%
Capsant Neurotechnologies Limited 11,282 — 11,282 0.8%
Chamelic Limited 23 — 23 0.3%
Crysalin Limited 1,286 — 1,286 0.1%
EmDot Limited 14 — 14 0.8%
Getech Group plc 20,000 — 20,000 <0.1%
Green Chemicals plc 113,222 — 113,222 0.8%
Icona Solutions Limited 1,515 (1,515) — —
Ilika plc 10,000 — 10,000 <0.1%
Mode Diagnostics Limited 1,756 — 1,756 0.2%
Modern Biosciences plc 1,185,150 — 1,185,150 2.1%
Modern Water plc 575,000 — 575,000 0.7%
Oxford Advanced Surfaces Group plc 932,994 — 932,994 0.5%
Oxford Nanopore Technologies Limited 3,490 — 3,490 0.2%
Oxtox Limited 25,363 — 25,363 0.3%
Photopharmica (Holdings) Limited1 37,020 — 37,020 1.0%
Retroscreen Virology Group plc 37,160 — 37,160 0.1%
Revise Limited — 18 18 0.5%
Revolymer plc 35,940 — 35,940 0.1%
Structure Vision Limited 212 — 212 1.0%
Surrey Nanosystems Limited 350 — 350 0.2%
Sustainable Resource Solutions Limited 28 — 28 1.1%
Synairgen plc 20,000 — 20,000 <0.1%
Tissue Regenix Group plc 1,950,862 — 1,950,862 0.3%
Tracsis plc 70,004 (44,574) 25,430 0.1%
Velocys plc 5,000 — 5,000 <0.1%
Xeros Limited 213 — 213 0.1%
Greg Smith Avacta Group plc 390,407 — 390,407 <0.1%
Capsant Neurotechnologies Limited 895 — 895 <0.1%
Chamelic Limited 3 — 3 <0.1%
Crysalin Limited 149 — 149 <0.1%
EmDot Limited 4 — 4 0.2%
Encos Limited 5,671 — 5,671 0.3%
Getech Group plc 8,000 — 8,000 <0.1%
Green Chemicals plc 4,830 — 4,830 <0.1%
Icona Solutions Limited 148 (148) — —
Mode Diagnostics Limited 361 — 361 <0.1%
Modern Biosciences plc 313,425 — 313,425 0.6%
Modern Water plc 7,250 — 7,250 <0.1%
Oxford Nanopore Technologies Limited 150 — 150 <0.1%
Retroscreen Virology Group plc 61,340 — 61,340 0.1%
Revise Limited — 6 6 0.2%
Revolymer plc 4,500 — 4,500 <0.1%
Summit Corporation plc — 15,972 15,972 <0.1%
Surrey Nanosystems Limited 76 — 76 0.1%
Sustainable Resource Solutions Limited 9 — 9 0.4%
Tissue Regenix Group plc 175,358 — 175,358 <0.1%
Velocys plc 2,559 — 2,559 <0.1%
Xeros Limited 33 — 33 <0.1%
24. Related Party Transactions continued

23002-04 Proof 8a 01-04-14
Stock Code: IPO www.ipgroupplc.com 105
Ou
r Fi
nan
cial
s G
rou
p N
ote
s
Director Company name
Number of shares held at
1 January 2013
Number of shares acquired/ (disposed) in the
period
Number of shares held at 31 December
2013 %
Charles Winward Amaethon Limited — A Shares 15 — 15 0.5%
Amaethon Limited — B Shares 1,766 — 1,766 0.2%
Amaethon Limited — Ordinary shares 3 — 3 <0.1%
Capsant Neurotechnologies Limited 2,264 — 2,264 0.2%
Chamelic Limited 3 — 3 <0.1%
Crysalin Limited 189 — 189 <0.1%
EmDot Limited 5 — 5 0.3%
Encos Limited 6,530 — 6,530 0.3%
Icona Solutions Limited 376 (376) — —
Mode Diagnostics Limited 421 — 421 0.1%
Modern Biosciences plc 360,914 — 360,914 0.7%
Modern Water plc 12,400 — 12,400 <0.1%
Oxford Advanced Surfaces Group plc 156,213 — 156,213 0.1%
Oxford Nanopore Technologies Limited 150 — 150 <0.1%
Oxtox Limited 3,742 — 3,742 <0.1%
Photopharmica (Holdings) Limited1 3,590 — 3,590 0.1%
Retroscreen Virology Group plc 66,080 — 66,080 0.2%
Revise Limited — 6 6 0.2%
Revolymer plc 4,500 — 4,500 <0.1%
Structure Vision Limited 26 — 26 0.1%
Surrey Nanosystems Limited 87 — 87 0.1%
Sustainable Resource Solutions Limited 10 — 10 0.4%
Tissue Regenix Group plc 482,236 — 482,236 0.1%
Tracsis plc2 56,500 — 56,500 0.2%
Xeros Limited 39 — 39 <0.1%
Bruce Smith Capsant Neurotechnologies Limited 20,724 — 20,724 1.4%
Evocutis plc 15,241 — 15,241 <0.1%
Getech Group plc 15,000 — 15,000 0.1%
iQur Limited 2,000 — 2,000 0.8%
Nanotecture Group plc 50,000 — 50,000 0.5%
Synairgen plc 200,000 — 200,000 0.3%
Velocys plc 10,000 — 10,000 <0.1%
1. Photopharmica (Holdings) Limited was restructured in 2012 and its trade and assets were transferred to Photopharmica Limited.
2. In addition, Charles Winward holds options over 137,517 ordinary shares in Tracsis plc.
Compensation to key management comprises that paid to Executive and Non-executive directors of the Group. Full details of
directors’ compensation are disclosed in the Directors’ Remuneration Report on pages 53 to 70 and these amounts are included
within the employee costs set out in note 8.
c) Portfolio companiesThe Group earns fees from the provision of business support services and corporate finance advisory to portfolio companies in which
the Group has an equity stake. The following amounts have been included in respect of these fees:
Statement of comprehensive income2013
£m2012
£m
Revenue from services 0.7 0.9
Statement of financial position2013
£m2012
£m
Trade receivables 0.3 0.3

23002-04 Proof 8a 01-04-14
IP Group plc Annual Report and Accounts for the year ended 31 December 2013106
Ou
r Fi
nan
cial
s G
rou
p N
ote
s
Notes to the consolidated financial statements continued
24. Related Party Transactions continued d) Subsidiary companiesSubsidiary companies that are not 100% owned either directly or indirectly by the parent company have intercompany balances with
other Group companies totalling as follows:2013
£m2012
£m
Intercompany balances with other Group companies 7.8 7.1
These intercompany balances represent funding loans provided by Group companies that are interest free, repayable on demand and
unsecured.
25. Capital ManagementThe Group’s key objective when managing capital is to safeguard the Group’s ability to continue as a going concern so that it can
continue to provide returns for shareholders and benefits for other stakeholders.
The Group sets the amount of capital in proportion to risk. The Group manages the capital structure and makes adjustments to it in
the light of changes in economic conditions and the risk characteristics of its underlying assets. In order to maintain or adjust the
capital structure, the Group may adjust the amount of issue new shares or dispose of interests in more mature portfolio companies.
During 2013, the Group’s strategy, which was unchanged from 2012, was to maintain healthy cash and short-term deposit balances
that enable it to provide capital to all portfolio companies as determined by the Group’s investment committee, whilst having
sufficient cash reserves to meet all working capital requirements in the foreseeable future.
26. Capital CommitmentsCommitments to university partnershipsA number of the Group’s partnerships with research intensive universities in the UK include certain arrangements to provide seed
capital to spin-out companies arising from such universities. As at 31 December 2013, the balances were as follows:
Partnership
Year ofcommencement
of partnership
Originalcommitment
£mInvested to date
£m
Remainingcommitment
£m
University of Southampton(i) 2002 5.0 3.6 1.4
King’s College London(ii) 2003 5.0 1.8 3.2
University of York – CNAP(iii) 2003 0.8 0.2 0.6
University of Leeds(iv) 2005 4.2 0.7 3.5
University of Bristol(v) 2005 5.0 1.0 4.0
University of Surrey(vi) 2006 5.0 0.5 4.5
University of York(iii) 2006 5.0 0.1 4.9
Queen Mary University of London(vii) 2006 5.0 0.7 4.3
University of Bath(viii) 2006 5.0 0.2 4.8
University of Glasgow(ix) 2006 5.0 1.2 3.8
University of Manchester(x) 2013 5.0 — 5.0
50.0 10.0 40.0
i. Under the terms of an agreement entered into in 2002 between the Group, the University of Southampton and certain of the University of Southampton’s subsidiaries, IP2IPO Limited agreed to make £5.0m available for the purposes of making investments in University of Southampton spin-out companies.
ii. Under the terms of an agreement entered into during 2003 between the Group and King’s College London (“KCL”) and King’s College London Business Limited (formerly KCL Enterprises Limited), the Group agreed to make £5.0m available for the purposes of making investments in spin-out companies. Under the terms of this agreement, KCL was previously able to require the Company to make a further £5.0m available for investments in spin-out companies on the tenth anniversary of the partnership. However, the 2003 agreement was terminated and replaced by a revised agreement between the same parties on 12 November 2010. Under the revised agreement, the Group has agreed to target investing the remaining commitment of £3.2m over a three-year period; KCL cannot, however, require the Group to make any additional funds available. Other changes effected by the revised agreement included the removal of the Group’s automatic entitlement to initial partner equity in every spin-out company and/or a share of KCL’s licensing fees from intellectual property commercialisation and to the termination rights of the parties.
iii. In 2003 the Group entered into an agreement with the University of York. The agreement relates to a specialist research centre within the University of York, the Centre for Novel Agricultural Products (“CNAP”). The Group has committed to invest up to a total of £0.8m in spin-out companies based on CNAP’s intellectual property. In 2006 the Group extended its partnership with the University of York to cover the entire university. The Group has committed to invest £5.0m in University of York spin-outs over and beyond the £0.8m commitment as part of the Group’s agreement with CNAP. The agreement with York was amended during the year so as to alter the process by which the Group evaluates commercialisation opportunities and the level of initial partner equity the Group is entitled to as a result. Further, the Group’s automatic entitlement to share in any of York’s proceeds from out-licensing has been removed from the agreement.
iv. The Group extended its partnership with the University of Leeds in July 2005 by securing the right with associated contractual commitment to invest up to £5.0m in University of Leeds spin-out companies. This agreement was varied in March 2011 to, amongst other things, remove the Group’s entitlement to a share of out-licensing income generated by the University of Leeds except in certain specific circumstances where the Group is involved in the relevant out-licensing opportunity. Under the terms of the variation agreement, subject to quality and quantity of the investment opportunities, the Group, Techtran and the University of Leeds have agreed to target annual investments of at least £0.7m in aggregate and, subject to earlier termination or the parties otherwise agreeing alternative target, to review this target on 30 April 2017.

23002-04 Proof 8a 01-04-14
Stock Code: IPO www.ipgroupplc.com 107
Ou
r Fi
nan
cial
s G
rou
p N
ote
s
v. In December 2005, the Group entered into an agreement with the University of Bristol. The Group has committed to invest up to a total of £5.0m in University of Bristol spin-out companies.
vi. Under the terms of an agreement entered into in 2006 between the Group and the University of Surrey (“Surrey”), the Group has committed to invest up to a total of £5.0m in spin-out companies based on Surrey’s intellectual property.
vii. In July 2006, the Group entered into an agreement with Queen Mary University of London (“QM”) to invest in QM spin-out companies. The Group has committed to invest up to a total of £5.0m in QM spin-out companies. The agreement was amended in January 2014 primarily to remove the Group’s entitlement to licence fees save where it is involved in the development or licensing of the relevant IP and in most cases to replace the Group’s automatic entitlement to a share of the initial equity in any spin-out company with an equivalent warrant exercisable at the seed stage of the relevant company.
viii. In September 2006, the Group entered into an agreement with the University of Bath (“Bath”) to invest in Bath spin-out companies. The Group has committed to invest up to a total of £5.0m in Bath spin-out companies. The agreement with Bath was amended during 2009 so as to remove the Group’s automatic entitlement to a share of the initial equity or licence fees (as applicable) received by Bath from the commercialisation of its intellectual property in the event the Group and its employees have not been actively involved in developing the relevant opportunity.
ix. In October 2006, the Group entered into an agreement with the University of Glasgow (”Glasgow”) to invest in Glasgow spin-out companies. The Group has committed to invest up to a total of £5.0m in Glasgow spin-out companies.
x. In February 2013, the Group entered into a commercialisation agreement with the University of Manchester. Initially the Group had agreed to make available an initial facility of up to £5.0m to provide capital to new proof of principle projects (excluding grapheme projects) intended for commercialisation through spin-out companies. During January 2014, the Group extended its agreement to include funding for Graphene projects, increased the capital commitment by a further £2.5m, bringing the total to £7.5m, and extended the agreement to 2019.
Commitments to limited partnershipsPursuant to the terms of their limited partnership agreements, the Group has committed to invest the following amounts into limited
partnerships as at 31 December 2013:
Partnership
Year of commencement
of partnership
Original commitment
£m
Invested to date
£m
Remaining commitment
£m
IP Venture Fund 2006 3.1 2.7 0.4
IP Venture Fund II L.P. 2013 10.0 0.4 9.6
13.1 3.1 10.0

23002-04 Proof 8a 01-04-14
IP Group plc Annual Report and Accounts for the year ended 31 December 2013108
Ou
r Fi
nan
cial
s C
om
pan
y St
atem
en
ts
Company balance sheetAs at 31 December 2013
Note2013
£m2012
£m
ASSETS
Fixed assets
Investment in subsidiary undertakings 2 25.3 25.3
Investment in associated undertakings 3 10.5 7.1
Other investments 4 0.5 0.5
Loans to subsidiary undertakings 5 120.4 123.7
Total assets 156.7 156.6
EQUITY AND LIABILITIES
Capital and reserves
Called up share capital 6 7.5 7.3
Share premium account 6 150.4 150.4
Merger reserve 6 12.8 12.8
Profit and loss reserve 6 (14.0) (13.9)
Total equity shareholders’ funds and liabilities 156.7 156.6
Registered number: 4204490
The financial statements on pages 108 to 111 were approved by the Board of Directors and authorised for issue on 3 March 2014 and
were signed on its behalf by:
Greg SmithChief Financial Officer
Alan AubreyChief Executive Officer

23002-04 Proof 8a 01-04-14
Stock Code: IPO www.ipgroupplc.com 109
Ou
r Fi
nan
cial
s C
om
pan
y St
atem
en
ts
Notes to the financial statements
1. Accounting PoliciesThe financial statements of the parent company have been prepared under the historical cost convention, in accordance with the
Companies Act 2006 and applicable United Kingdom accounting standards. A summary of the more important accounting policies
which have been applied consistently throughout the year are set out below.
Investments Investments are stated at historic cost less any provision for impairment in value and are held for long-term investment purposes.
Provisions are based upon an assessment of events or changes in circumstances that indicate that an impairment has occurred
such as the performance and/or prospects (including the financial prospects) of the investee company being significantly below
the expectations on which the investment was based, a significant adverse change in the markets in which the investee company
operates or a deterioration in general market conditions.
Intercompany loansAll intercompany loans are initially recognised at fair value and subsequently measured at amortised cost. Where intercompany loans
are intended for use on a continuing basis in the Company’s activities and there is no intention of their settlement in the foreseeable
future, they are presented as fixed assets.
ImpairmentIf there is an indication that an asset might be impaired, the Company will perform an impairment review. An asset is impaired if
the recoverable amount, being the higher of net realisable value and value in use, is less than its carrying amount. Value in use is
measured based on future discounted cash flows (“DCF”) attributable to the asset. In such cases, the carrying value of the asset is
reduced to recoverable amount with a corresponding charge recognised in the profit and loss account.
Financial instrumentsCurrently the Company does not enter into derivative financial instruments. Financial assets and financial liabilities are recognised and
cease to be recognised on the basis of when the related titles pass to or from the Company.
2. Investments in Subsidiary Undertakings£m
At 1 January 2013 25.3
Additions —
Impairment —
Disposals —
At 31 December 2013 25.3
Details of the Company’s subsidiary undertakings at 31 December 2013 are as follows:
Name of subsidiaryPlace of incorporation (or registration) and operation
Proportion of ownership
interest %
Proportion of voting power
held %
Method used to account for
investment
IP2IPO Limited England and Wales 100.0 100.0 Acquisition
IP2IPO Management Limited1 England and Wales 100.0 100.0 Acquisition
IP2IPO Management II Limited1 England and Wales 100.0 100.0 Acquisition
IP2IPO Management III Limited1,2 England and Wales 100.0 100.0 Acquisition
IP2IPO Management IV Limited1 England and Wales 100.0 100.0 Acquisition
IP2IPO Management V Limited1,2 England and Wales 100.0 100.0 Acquisition
IP2IPO Management VI Limited1 England and Wales 100.0 100.0 Acquisition
IP2IPO Management VII Limited1 England and Wales 100.0 100.0 Acquisition
IP2IPO Management VIII Limited1 England and Wales 100.0 100.0 Acquisition
IP2IPO Americas Limited England and Wales 100.0 100.0 Acquisition
IP2IPO (Europe) Limited1 England and Wales 100.0 100.0 Acquisition
IP2IPO Guarantee Limited1,5 England and Wales 100.0 100.0 Acquisition
IP Group Inc.1 Delaware, USA 100.0 100.0 Acquisition
Top Technology Ventures Limited3 England and Wales 100.0 100.0 Acquisition
Top Technology Ventures IV GP Ltd1,3 England and Wales 100.0 100.0 Acquisition

23002-04 Proof 8a 01-04-14
IP Group plc Annual Report and Accounts for the year ended 31 December 2013110
Ou
r Fi
nan
cial
s C
om
pan
y St
atem
en
ts
Notes to the financial statements continued
Name of subsidiaryPlace of incorporation (or registration) and operation
Proportion of ownership
interest %
Proportion of voting power
held %
Method used to account for
investment
IP Venture Fund GP Limited1,3 England and Wales 100.0 100.0 Acquisition
IP Ventures (Scotland) Limited1,3 Scotland 100.0 100.0 Acquisition
North East Technology (GP) Limited1,3 England and Wales 100.0 100.0 Acquisition
Techtran Group Limited England and Wales 100.0 100.0 Acquisition
Techtran Investments Limited1,2 England and Wales 100.0 100.0 Acquisition
Techtran Services Limited1,2 England and Wales 100.0 100.0 Acquisition
Techtran Corporate Finance Limited1,2 England and Wales 100.0 100.0 Acquisition
Techtran Limited1,2 England and Wales 100.0 100.0 Acquisition
Modern Biosciences plc4 England and Wales 54.3 69.0 Acquisition
PIMCO 2664 Limited1,4 England and Wales 54.3 69.0 Acquisition
Modern Biosciences Nominees Limited1,2 England and Wales 54.3 69.0 Acquisition
MBS Secretarial Limited1,2 England and Wales 54.3 69.0 Acquisition
MBS Director Limited1,2 England and Wales 54.3 69.0 Acquisition
IP2IPO Nominees Limited2 England and Wales 100.0 100.0 Acquisition
IP2IPO Services Limited2 England and Wales 100.0 100.0 Acquisition
LifeUK (IP2IPO) Limited2 England and Wales 100.0 100.0 Acquisition
IP Industry Partners Limited2 England and Wales 100.0 100.0 Acquisition
Union Life Sciences Limited England and Wales 80.0 80.0 Acquisition
1. Company held indirectly.
2. Dormant company.
3. Company engaged in fund management activity.
4. Company engaged in in-licensing of drugable intellectual property activity.
5. Company limited by guarantee.
All companies above are incorporated in England with the exception of IP Ventures (Scotland) Limited which is incorporated in
Scotland and IP Group Inc. which is incorporated in Delaware, USA. All companies above undertake the activity of commercialising
intellectual property unless stated otherwise.
3. Investment In Associated Undertakings£m
At 1 January 2013 7.1
Additions 3.4
Impairment —
Disposals —
At 31 December 2013 10.5
At 31 December 2013 the Company has investments where it holds 20% or more of the issued ordinary share capital of the following
companies:
Undertaking% of issued share
capital heldNet assets
£000Loss before tax
£000Date of financial
statements
Fusion IP plc 20.1% 52,108 (1,204) 31 July 2013
Modern Water plc 20.0% 25,327 (5,487) 31 December 2012
All companies are incorporated in England and Wales.
Subsequent to 31 December 2013 the Group has proposed to acquire the remaining stake in Fusion IP plc, for paper, dependent on
the approval of the OFT.
No profit/(loss) information is presented in respect of companies that have filed abbreviated accounts.
2. Investments in Subsidiary Undertakings continued

23002-04 Proof 8a 01-04-14
Stock Code: IPO www.ipgroupplc.com 111
Ou
r Fi
nan
cial
s C
om
pan
y St
atem
en
ts
4. Other Investments£m
At 1 January 2013 0.5
Additions —
Impairment —
Disposals —
At 31 December 2013 0.5
5. Loans to Subsidiary Undertakings£m
At 1 January 2013 123.7
Repayment during the year (3.3)
At 31 December 2013 120.4
The amounts due from subsidiary undertakings are interest free, repayable on demand and unsecured.
6. Share Capital and ReservesShare
capital£m
Share premium
£m
Merger reserve
£m
Profit and loss reserve
£m
At 1 January 2013 7.3 150.4 12.8 (13.9)
Profit for the year — — — 0.1
Issue of equity 0.2 — — (0.2)
At 31 December 2013 7.5 150.4 12.8 (14.0)
Details of the Company’s authorised share capital and changes in its issued share capital can be found in note 20 to the consolidated
financial statements on page 100. Details of the movement in the share premium account can be found in the consolidated
statement of changes in equity on page 83.
7. Profit and Loss AccountAs permitted by Section 408 of the Companies Act 2006, the Company’s profit and loss account has not been included in these
financial statements. The Company’s loss for the year was £0.1m (2012: £7.7m loss).
Details of auditor’s remuneration are disclosed in note 6 to the consolidated financial statements.
8. Directors’ Emoluments, Employee Information and Share-Based PaymentsThe remuneration of the directors is borne by Group subsidiary undertakings. Full details of their remuneration can be found in the
Directors’ Remuneration Report on pages 53 to 70. Full details of the share-based payments charge and related disclosures can be
found in note 22 to the consolidated financial statements.
The Company had no employees during 2013 or 2012.

23002-04 Proof 8a 01-04-14
IP Group plc Annual Report and Accounts for the year ended 31 December 2013112
Company registration number 4204490
Registered office 24 Cornhill
London
EC3V 3ND
Directors Dr Bruce Gordon Smith CBE (Non-executive Chairman)
Alan John Aubrey (Chief Executive Officer)
Michael Charles Nettleton Townend (Chief Investment Officer)
Gregory Simon Smith (Chief Financial Officer)
Charles Stephen Winward (MD of Top Technology Ventures)
Mike Humphrey (Senior Independent Director)
Francis Adam Wakefield Carpenter (Non-executive Director)
Jonathan Brooks (Non-executive Director)
Professor Lynn Gladden (Non-executive Director)
Company secretary Angela Leach
Brokers Numis Securities LimitedThe London Stock Exchange
10 Paternoster Square
London
EC4M 7LT
Registrars Capita Asset ServicesThe Registry
34 Beckenham Road
Beckenham
Kent BR3 4TU
Bankers Royal Bank of ScotlandPO Box 333
Silbury House
300 Silbury Boulevard
Milton Keynes
MK9 2ZF
Solicitors Pinsent MasonsCityPoint
One Ropemaker Street
London
EC2Y 9AH
Independent auditor BDO LLP55 Baker Street
London
W1U 7EU
Company information

23002-04 Proof 8a 01-04-14
Stock Code: IPO www.ipgroupplc.com
Printed on Cocoon Silk 100.
A recycled paper containing 100% recycled waste and manufactured at a mill certified with ISO 14001 environmental management standard.
Fully recyclable and biodegradable.
The pulp used in this product is bleached using an Elemental Chlorine Free process. (ECF)

23002-04 Proof 8a 01-04-14
IP Group plc24 CornhillLondonEC3V 3ND
T +44 (0)845 074 2929F +44 (0)845 074 2928
www.ipgroupplc.com
IP G
rou
p p
lc An
nu
al Re
po
rt and
Acco
un
ts 20
13