building a low-carbon economy – the uk's contribution to tackling climate change
Post on 21-Dec-2015
219 views
TRANSCRIPT
Building a Low-Carbon Economy –The UK's Contribution to Tackling
Climate Change
www.theccc.org.uk
UK Climate Change Bill (Nov 2008)
Commitment to reduce CO2 emissions by at least 60% (80%) from 1990 levels by 2050
Established system of legally binding “carbon budgets”
Established the CCC as an independent body to provide expert advice on budget levels and the policies to reach them
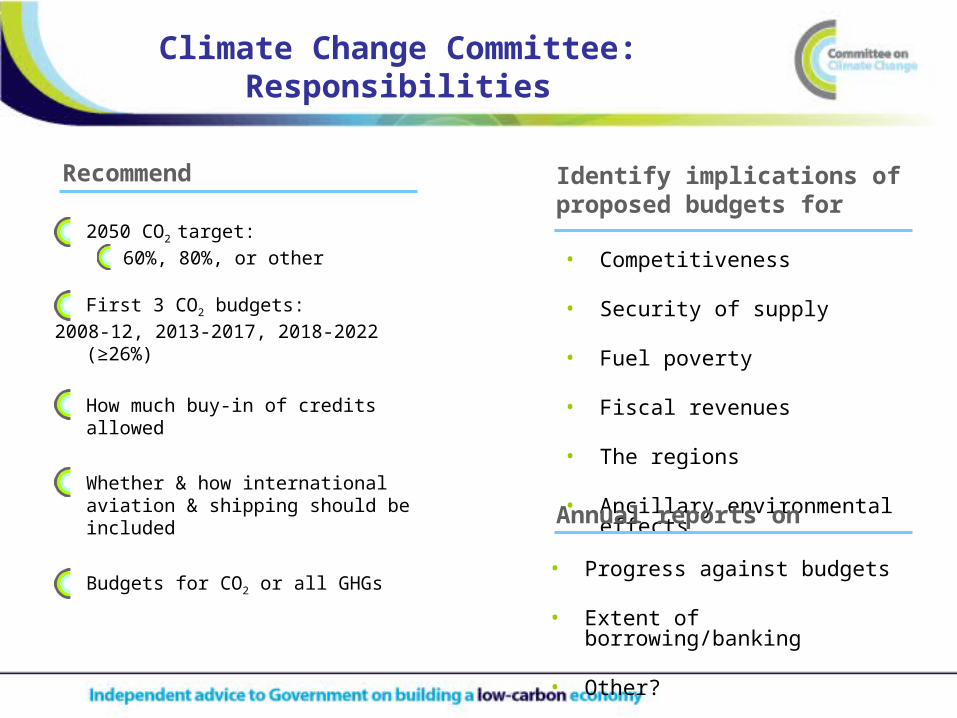
Climate Change Committee: Responsibilities
2050 CO2 target:
60%, 80%, or other
First 3 CO2 budgets:
2008-12, 2013-2017, 2018-2022 (≥26%)
How much buy-in of credits allowed
Whether & how international aviation & shipping should be included
Budgets for CO2 or all GHGs
• Competitiveness
• Security of supply
• Fuel poverty
• Fiscal revenues
• The regions
• Ancillary environmental effects
Recommend Identify implications of proposed budgets for
Annual reports on
• Progress against budgets
• Extent of borrowing/banking
• Other?

Contents of First CCC Report
Pt. I: Setting the target1. Setting 2. Meeting
Pt. II: Setting & meeting the first 3 budgets3. Summary 4. C markets 5. Decarb elec 6. Building & industry 7. Transport
Pt III: Extending the carbon budget framework?8. International aviation & shipping 9. Non CO2 GHG
Pt IV: Wider economic & social considerations10 Competitiveness 11. Econ costs & fiscal 12. Fuel poverty 13. Security 14. Nations
Pt V: Synthesis & recommendations
1. The 2050 target
(i) Required global emissions reduction
(ii) Appropriate UK contribution
(iii) Technologies for meeting required reductions
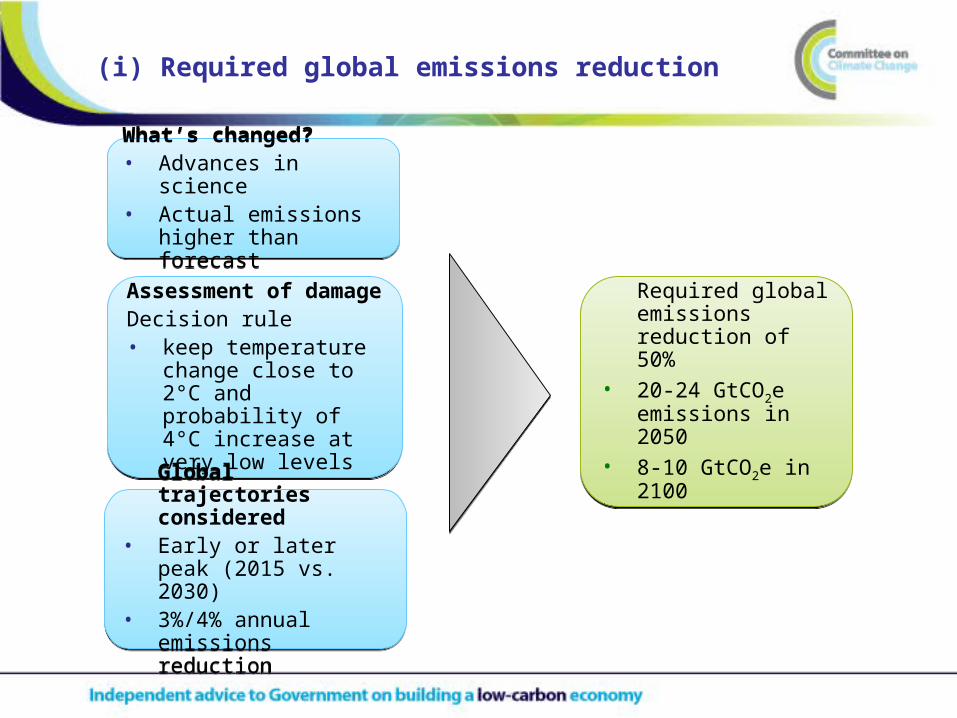
(i) Required global emissions reduction
Required global emissions reduction of 50%
• 20-24 GtCO2e emissions in 2050
• 8-10 GtCO2e in 2100
Required global emissions reduction of 50%
• 20-24 GtCO2e emissions in 2050
• 8-10 GtCO2e in 2100
What’s changed?• Advances in science• Actual emissions higher
than forecast
What’s changed?• Advances in science• Actual emissions higher
than forecast
Assessment of damageDecision rule• keep temperature
change close to 2°C and probability of 4°C increase at very low levels
Assessment of damageDecision rule• keep temperature
change close to 2°C and probability of 4°C increase at very low levels
Global trajectories considered
• Early or later peak (2015 vs. 2030)
• 3%/4% annual emissions reduction
Global trajectories considered
• Early or later peak (2015 vs. 2030)
• 3%/4% annual emissions reduction
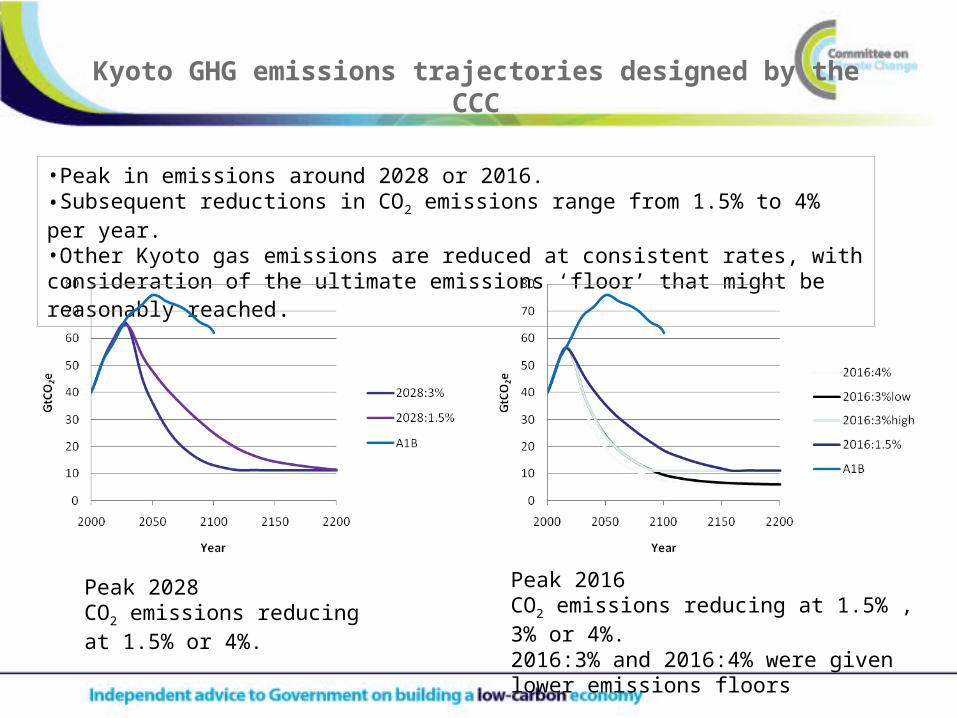
Kyoto GHG emissions trajectories designed by the CCC
•Peak in emissions around 2028 or 2016.•Subsequent reductions in CO2 emissions range from 1.5% to 4% per year. •Other Kyoto gas emissions are reduced at consistent rates, with consideration of the ultimate emissions ‘floor’ that might be reasonably reached.
Peak 2028 CO2 emissions reducing at 1.5% or 4%.
Peak 2016 CO2 emissions reducing at 1.5% , 3% or 4%. 2016:3% and 2016:4% were given lower emissions floors
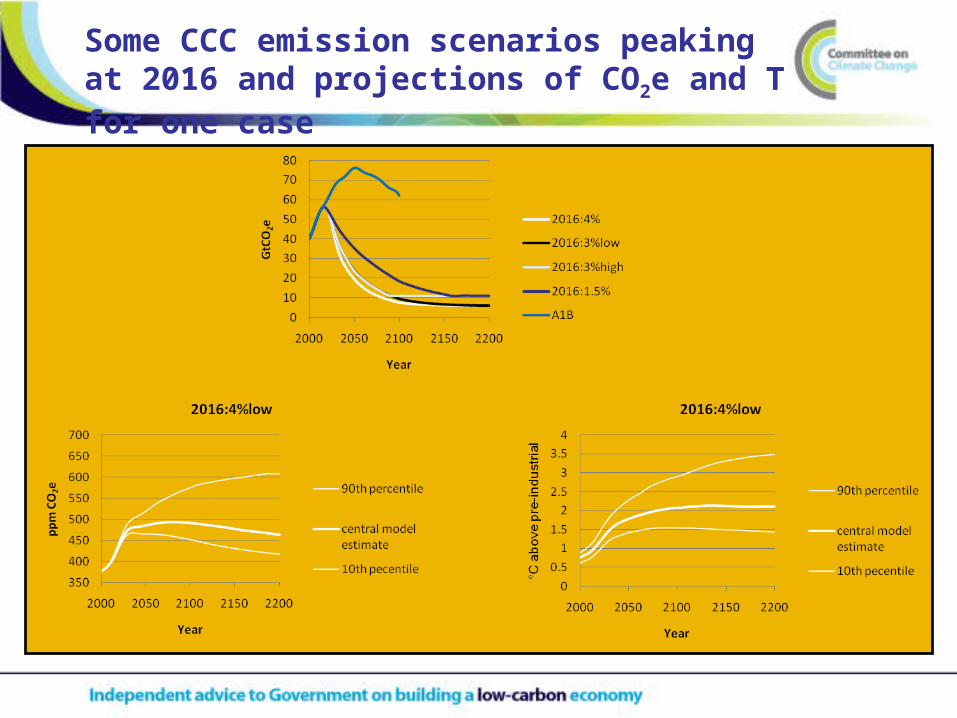
Some CCC emission scenarios peaking at 2016 and projections of CO2e and T for one case
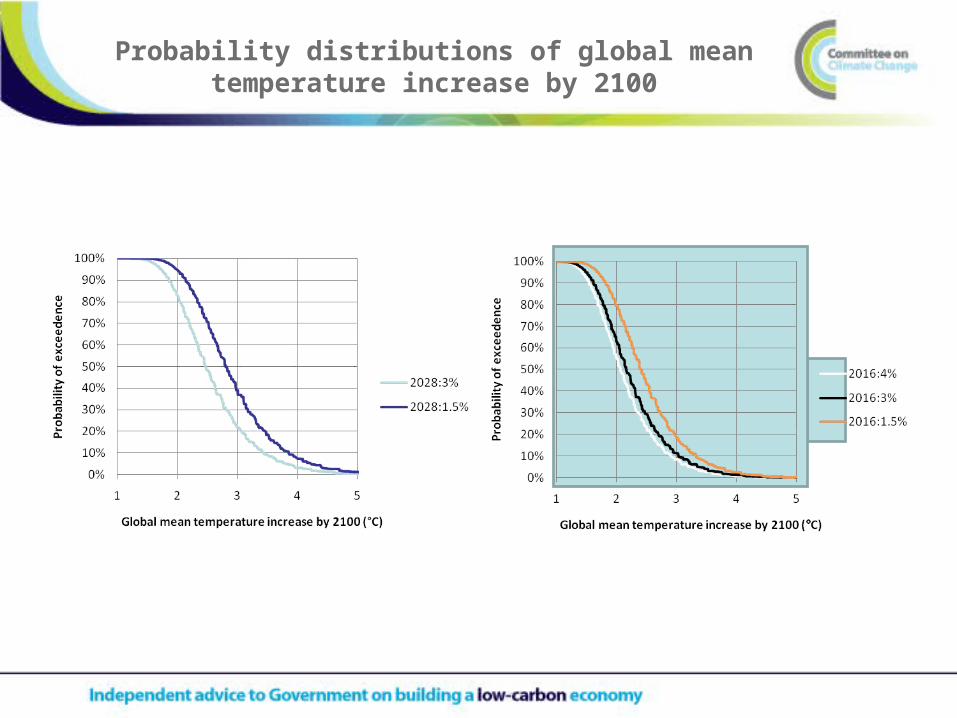
Probability distributions of global mean temperature increase by 2100
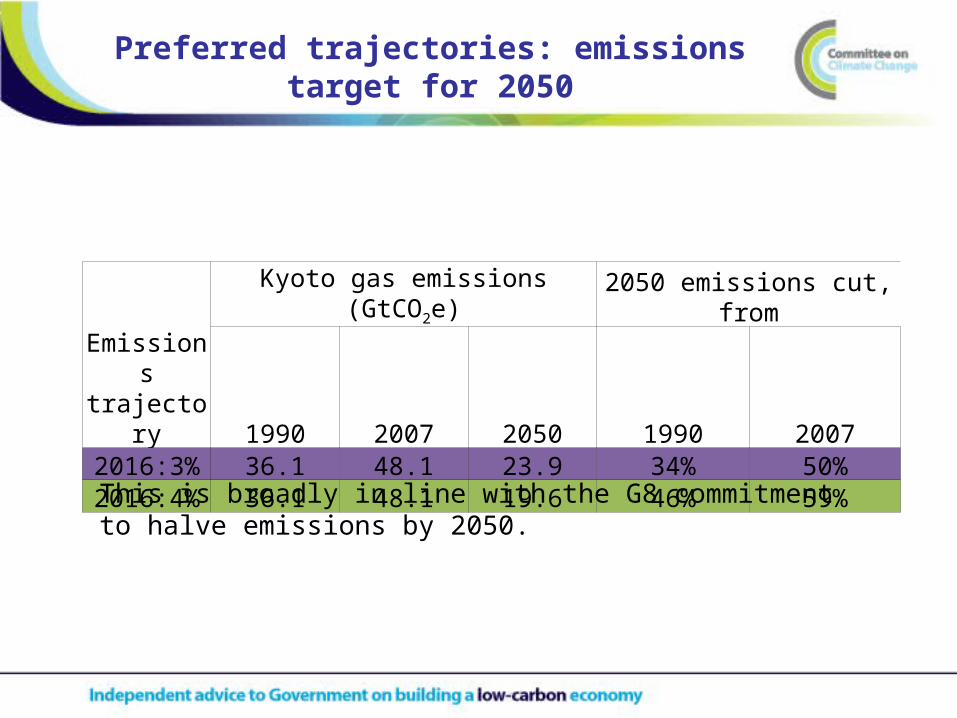
Preferred trajectories: emissions target for 2050
Emissions trajectory
Kyoto gas emissions (GtCO2e) 2050 emissions cut, from
1990 2007 2050 1990 20072016:3% 36.1 48.1 23.9 34% 50%2016:4% 36.1 48.1 19.6 46% 59%
This is broadly in line with the G8 commitment to halve emissions by 2050.
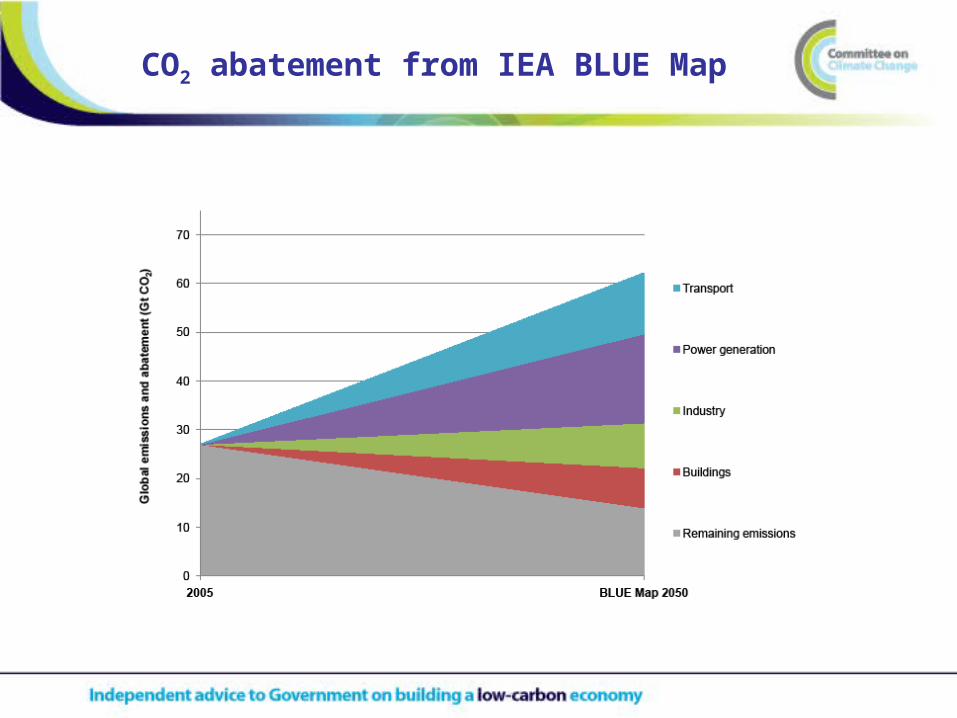
CO2 abatement from IEA BLUE Map
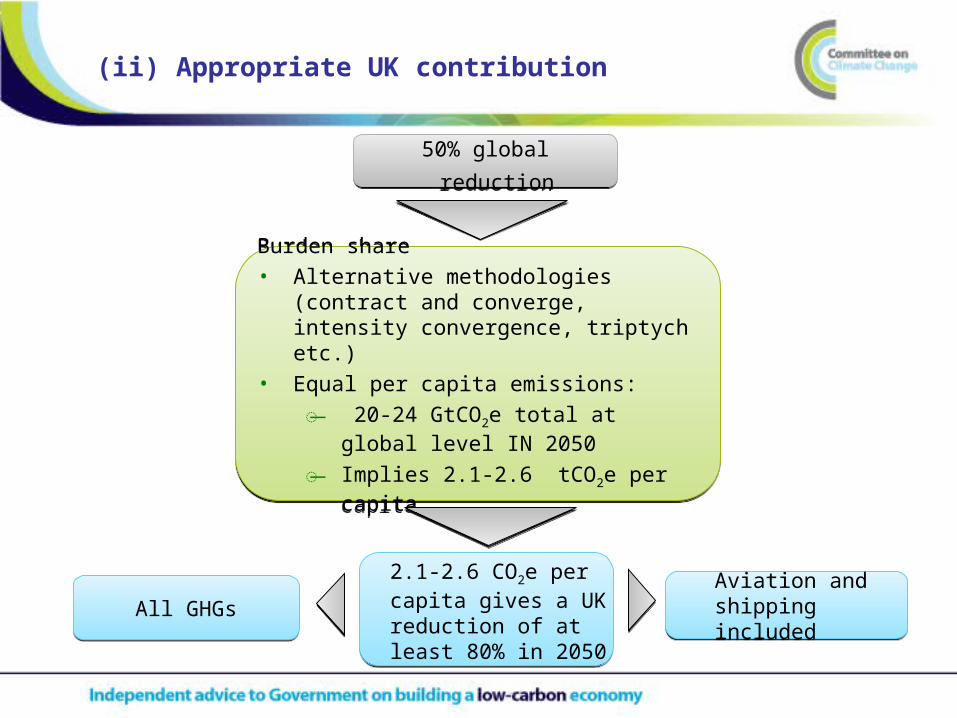
(ii) Appropriate UK contribution
50% global reduction 50% global reduction
Burden share• Alternative methodologies (contract and
converge, intensity convergence, triptych etc.)
• Equal per capita emissions:
I 20-24 GtCO2e total at global level IN 2050
I Implies 2.1-2.6 tCO2e per capita
Burden share• Alternative methodologies (contract and
converge, intensity convergence, triptych etc.)
• Equal per capita emissions:
I 20-24 GtCO2e total at global level IN 2050
I Implies 2.1-2.6 tCO2e per capita
All GHGsAll GHGsAviation and shipping included Aviation and shipping included
2.1-2.6 CO2e per capita gives a UK reduction of at least 80% in 2050
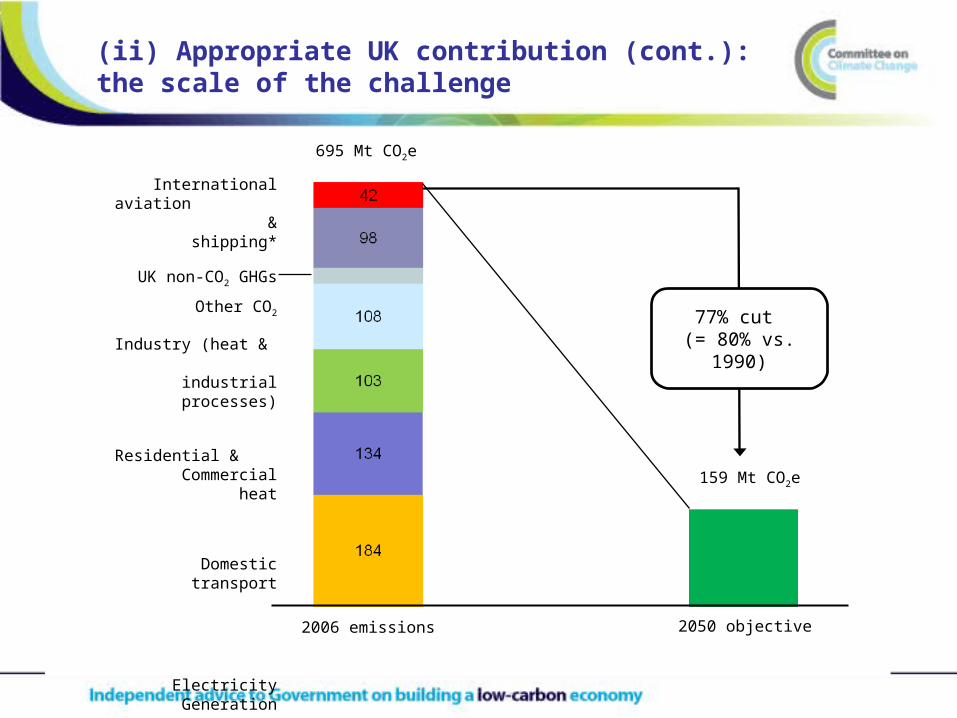
(ii) Appropriate UK contribution (cont.): the scale of the challenge
2006 emissions
International aviation & shipping*
UK non-CO2 GHGs
Other CO2
Industry (heat & industrial processes)
Residential & Commercial heat
Domestic transport
Electricity Generation
* bunker fuels basis
2050 objective
159 Mt CO2e
695 Mt CO2e
77% cut (= 80% vs. 1990)
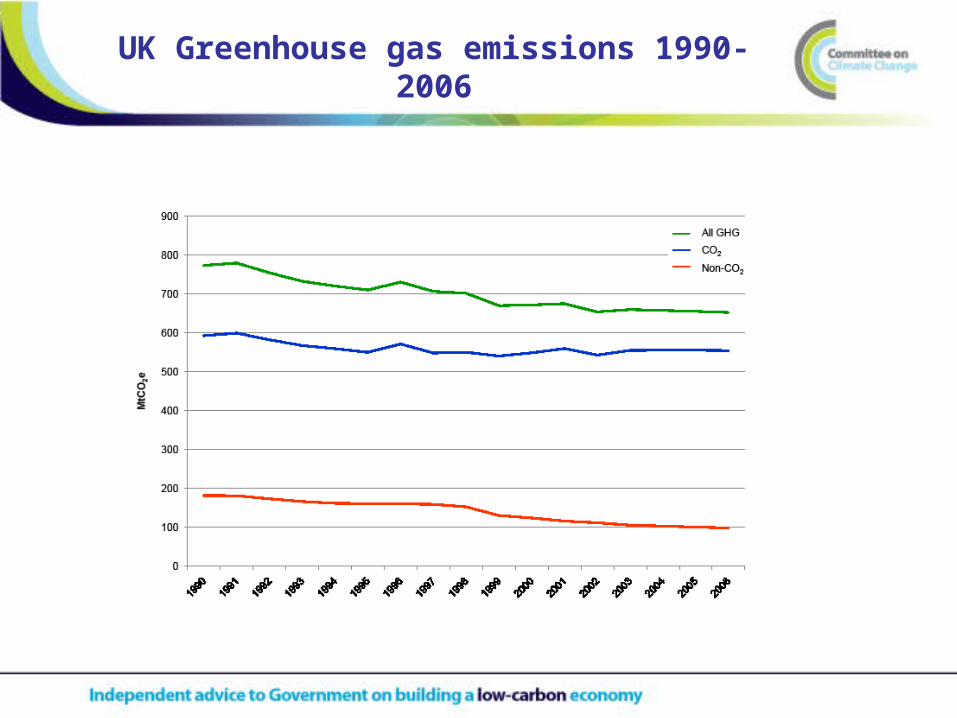
UK Greenhouse gas emissions 1990-2006
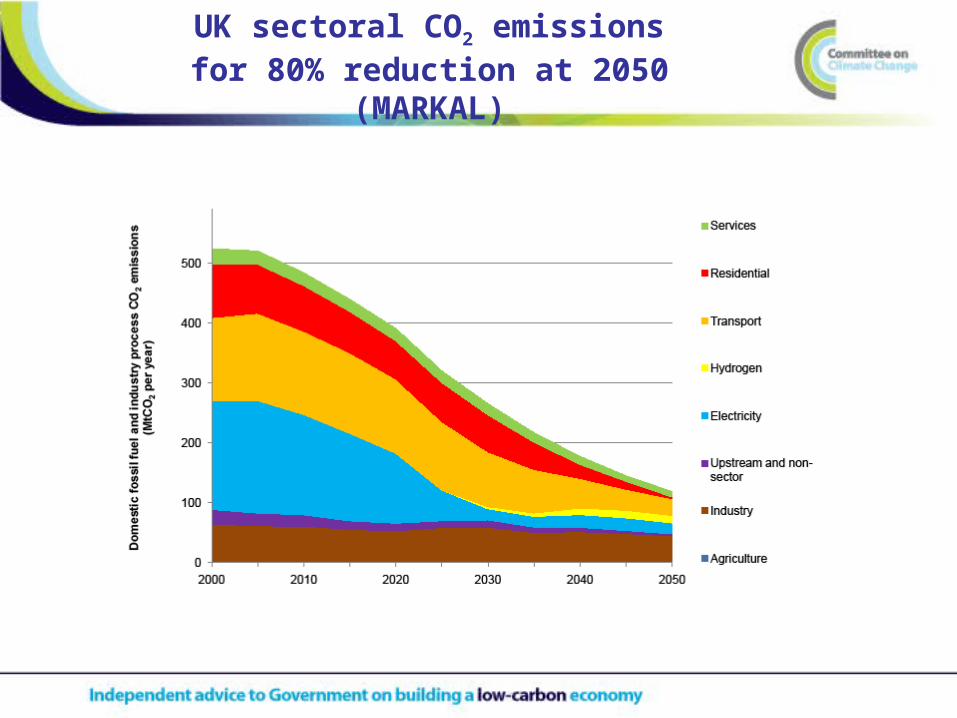
UK sectoral CO2 emissions for 80% reduction at 2050 (MARKAL)
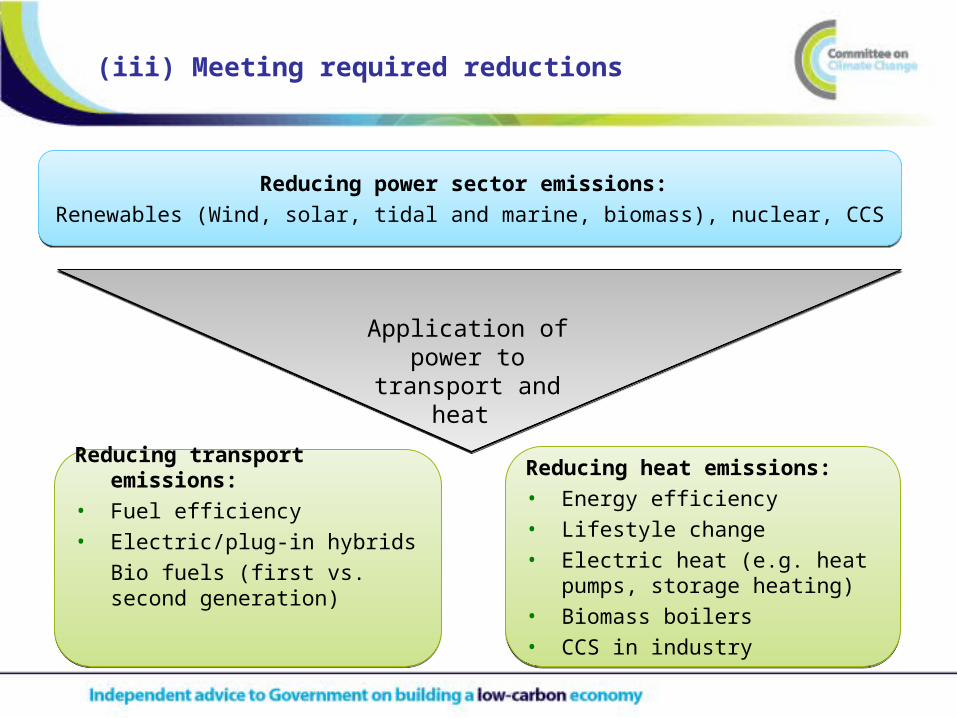
(iii) Meeting required reductions
Reducing power sector emissions:
Renewables (Wind, solar, tidal and marine, biomass), nuclear, CCS
Reducing power sector emissions:
Renewables (Wind, solar, tidal and marine, biomass), nuclear, CCS
Reducing heat emissions: • Energy efficiency• Lifestyle change• Electric heat (e.g. heat pumps,
storage heating)• Biomass boilers• CCS in industry
Reducing heat emissions: • Energy efficiency• Lifestyle change• Electric heat (e.g. heat pumps,
storage heating)• Biomass boilers• CCS in industry
Reducing transport emissions: • Fuel efficiency• Electric/plug-in hybrids
Bio fuels (first vs. second generation)
Reducing transport emissions: • Fuel efficiency• Electric/plug-in hybrids
Bio fuels (first vs. second generation)
Application of power to transport
and heat
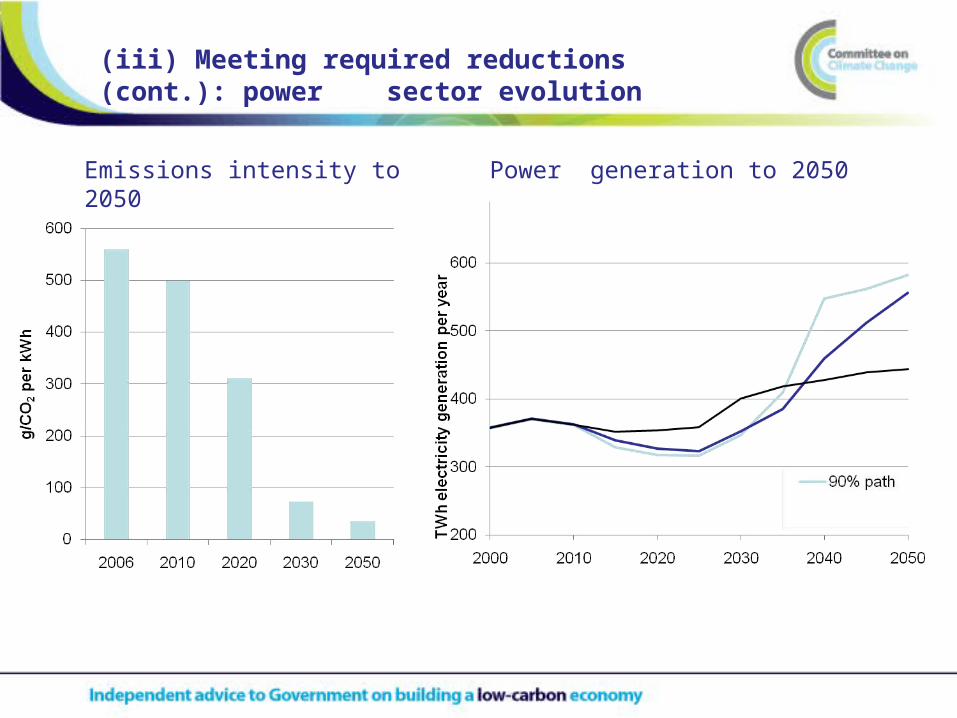
Power generation to 2050
(iii) Meeting required reductions (cont.): power sector evolution
Emissions intensity to 2050
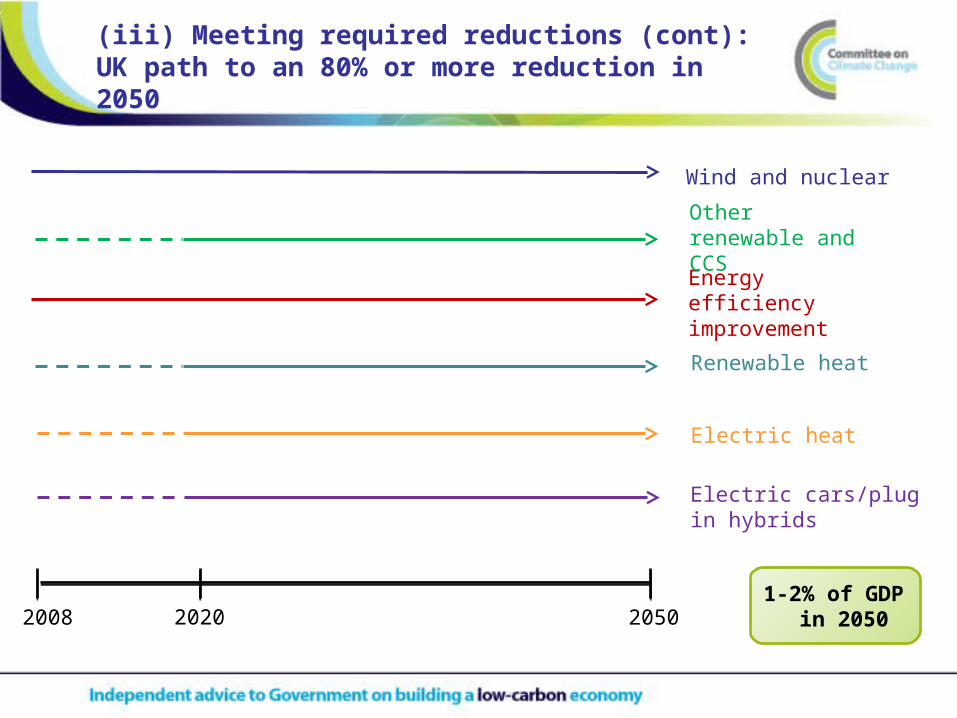
(iii) Meeting required reductions (cont): UK path to an 80% or more reduction in 2050
2050 2008
Wind and nuclear
Energy efficiency improvement
Renewable heat
Electric heat
Electric cars/plug in hybrids
20201-2% of GDP
in 2050
Other renewable and CCS
2. The first three budgets
(i) Level of budget (factors we have considered, CCC proposals)
(ii) Use of credits to meet budget
(iii) Feasible emissions reductions
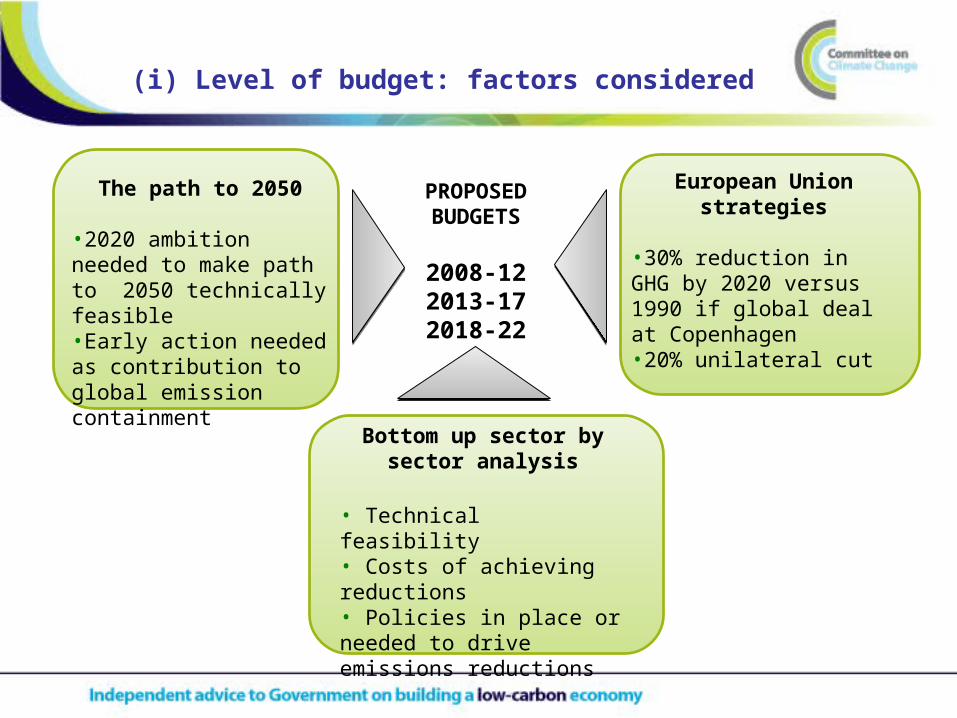
(i) Level of budget: factors considered
PROPOSED BUDGETS
2008-122013-172018-22
The path to 2050
•2020 ambition needed to make path to 2050 technically feasible •Early action needed as contribution to global emission containment
European Union strategies
•30% reduction in GHG by 2020 versus 1990 if global deal at Copenhagen•20% unilateral cut
Bottom up sector by sector analysis
• Technical feasibility • Costs of achieving reductions• Policies in place or needed to drive emissions reductions
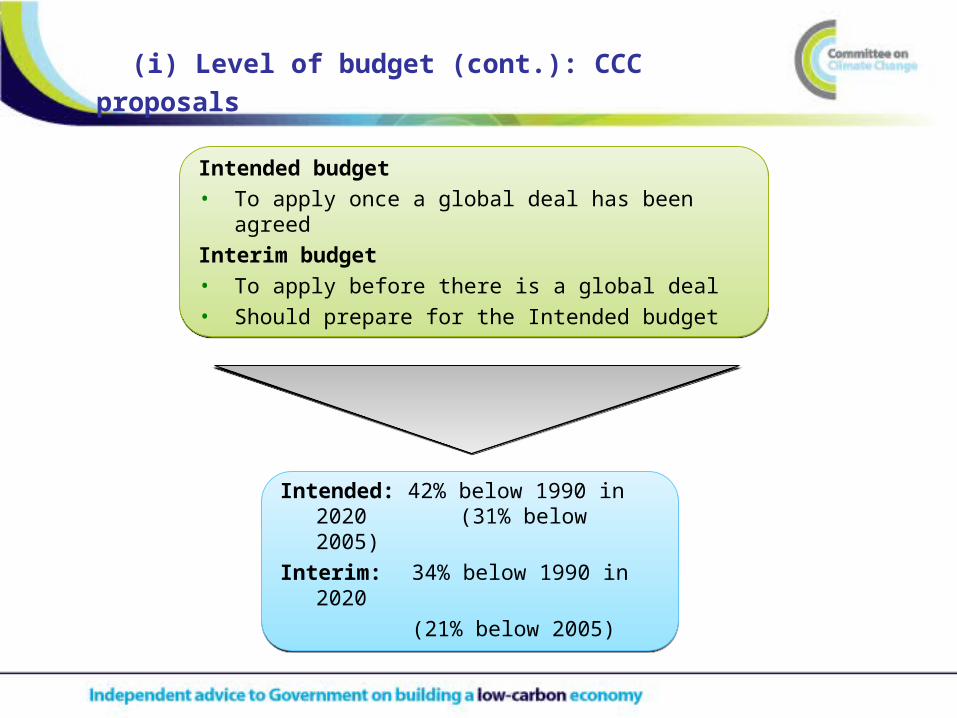
(i) Level of budget (cont.): CCC proposals
Intended budget• To apply once a global deal has been agreed
Interim budget• To apply before there is a global deal• Should prepare for the Intended budget
Intended budget• To apply once a global deal has been agreed
Interim budget• To apply before there is a global deal• Should prepare for the Intended budget
Intended: 42% below 1990 in 2020 (31% below 2005)
Interim: 34% below 1990 in 2020
(21% below 2005)
Intended: 42% below 1990 in 2020 (31% below 2005)
Interim: 34% below 1990 in 2020
(21% below 2005)
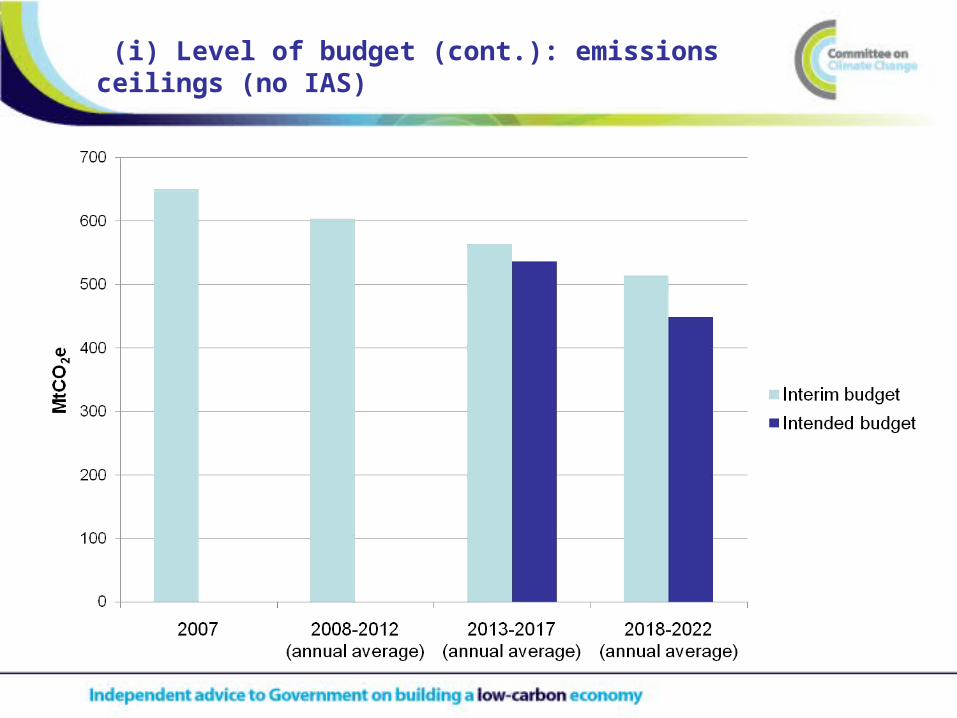
(i) Level of budget (cont.): emissions ceilings (no IAS)
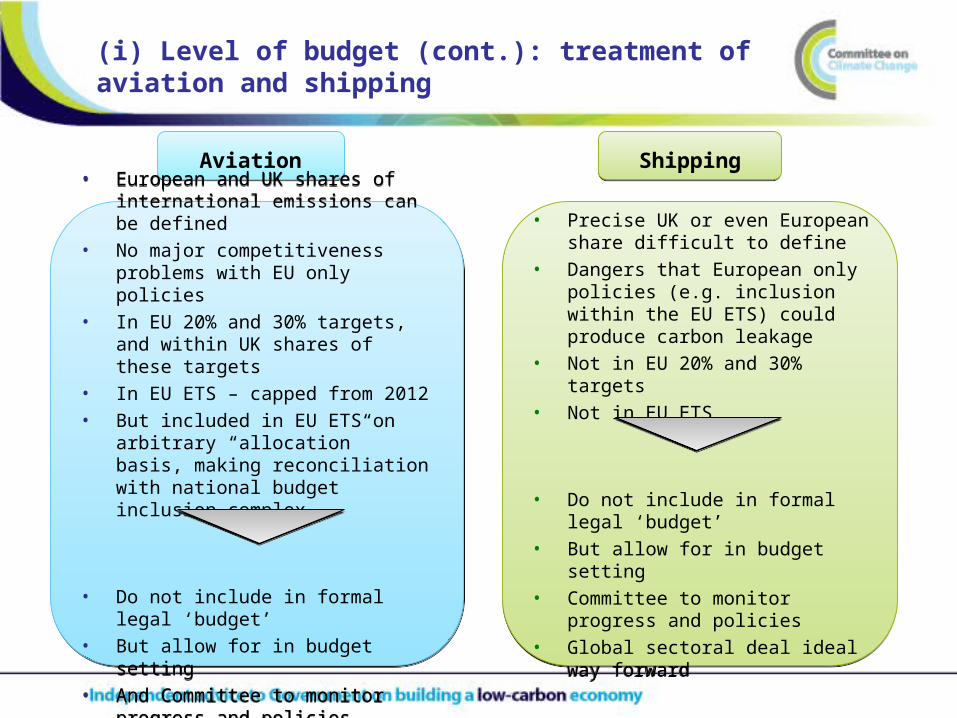
(i) Level of budget (cont.): treatment of aviation and shipping
AviationAviation ShippingShipping
• Precise UK or even European share difficult to define
• Dangers that European only policies (e.g. inclusion within the EU ETS) could produce carbon leakage
• Not in EU 20% and 30% targets• Not in EU ETS
• Do not include in formal legal ‘budget’
• But allow for in budget setting• Committee to monitor progress and
policies• Global sectoral deal ideal way
forward
• European and UK shares of international emissions can be defined
• No major competitiveness problems with EU only policies
• In EU 20% and 30% targets, and within UK shares of these targets
• In EU ETS – capped from 2012• But included in EU ETS on arbitrary
“allocation” basis, making reconciliation with national budget inclusion complex
• Do not include in formal legal ‘budget’• But allow for in budget setting • And Committee to monitor progress
and policies
MtCO2e
…
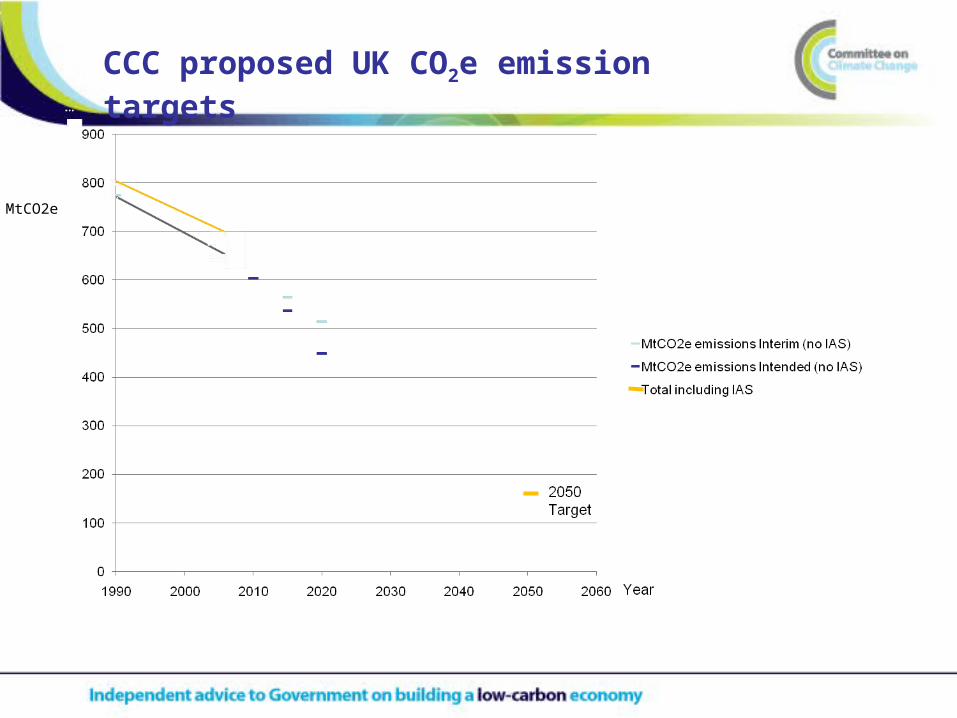
CCC proposed UK CO2e emission targets
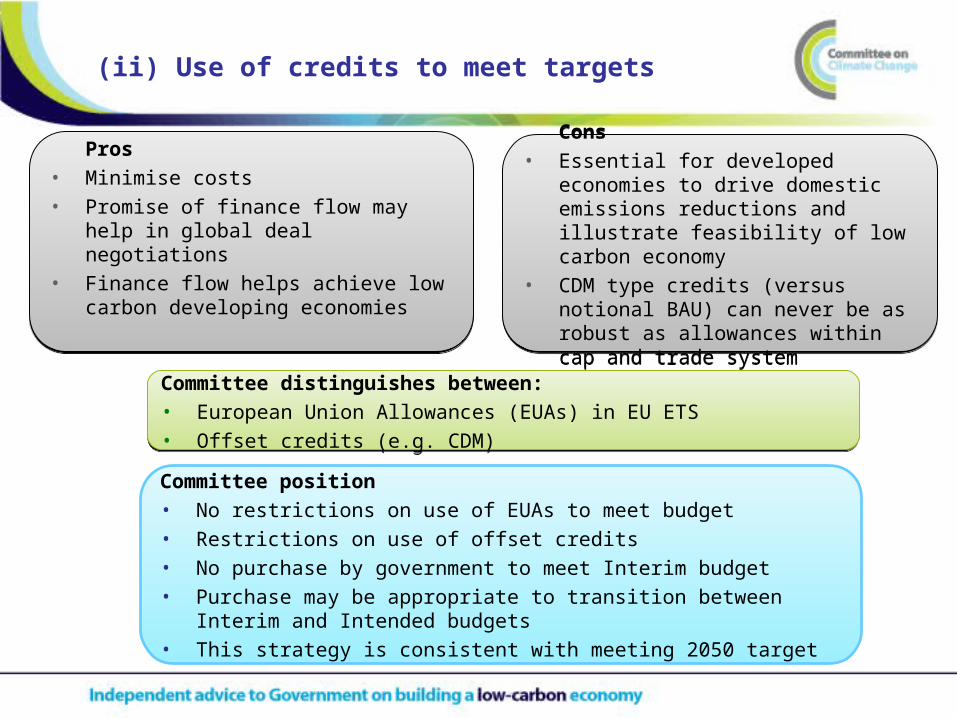
(ii) Use of credits to meet targets
Pros• Minimise costs• Promise of finance flow may help in
global deal negotiations• Finance flow helps achieve low carbon
developing economies
Pros• Minimise costs• Promise of finance flow may help in
global deal negotiations• Finance flow helps achieve low carbon
developing economies
Cons
• Essential for developed economies to drive domestic emissions reductions and illustrate feasibility of low carbon economy
• CDM type credits (versus notional BAU) can never be as robust as allowances within cap and trade system
Cons
• Essential for developed economies to drive domestic emissions reductions and illustrate feasibility of low carbon economy
• CDM type credits (versus notional BAU) can never be as robust as allowances within cap and trade system
Committee distinguishes between:• European Union Allowances (EUAs) in EU ETS • Offset credits (e.g. CDM)
Committee distinguishes between:• European Union Allowances (EUAs) in EU ETS • Offset credits (e.g. CDM)
Committee position• No restrictions on use of EUAs to meet budget• Restrictions on use of offset credits• No purchase by government to meet Interim budget• Purchase may be appropriate to transition between Interim and Intended
budgets • This strategy is consistent with meeting 2050 target
(iii) Feasible emissions reductions - Power
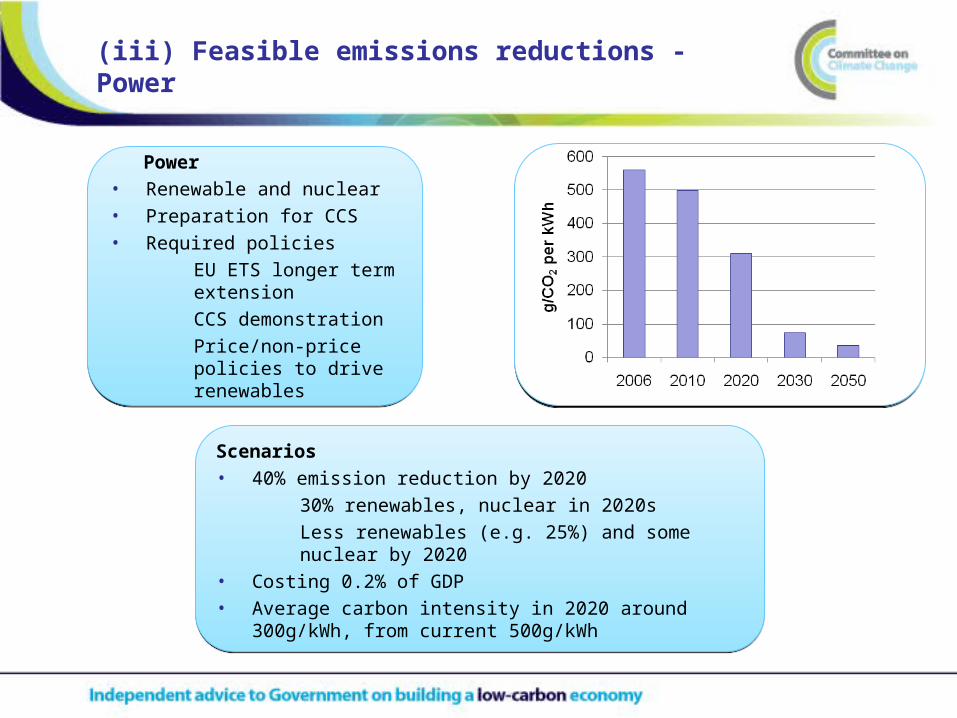
Power• Renewable and nuclear• Preparation for CCS• Required policies
EU ETS longer term extension
CCS demonstration Price/non-price policies
to drive renewables
Power• Renewable and nuclear• Preparation for CCS• Required policies
EU ETS longer term extension
CCS demonstration Price/non-price policies
to drive renewables
Scenarios • 40% emission reduction by 2020
30% renewables, nuclear in 2020s Less renewables (e.g. 25%) and some nuclear by
2020• Costing 0.2% of GDP• Average carbon intensity in 2020 around 300g/kWh, from
current 500g/kWh
Scenarios • 40% emission reduction by 2020
30% renewables, nuclear in 2020s Less renewables (e.g. 25%) and some nuclear by
2020• Costing 0.2% of GDP• Average carbon intensity in 2020 around 300g/kWh, from
current 500g/kWh
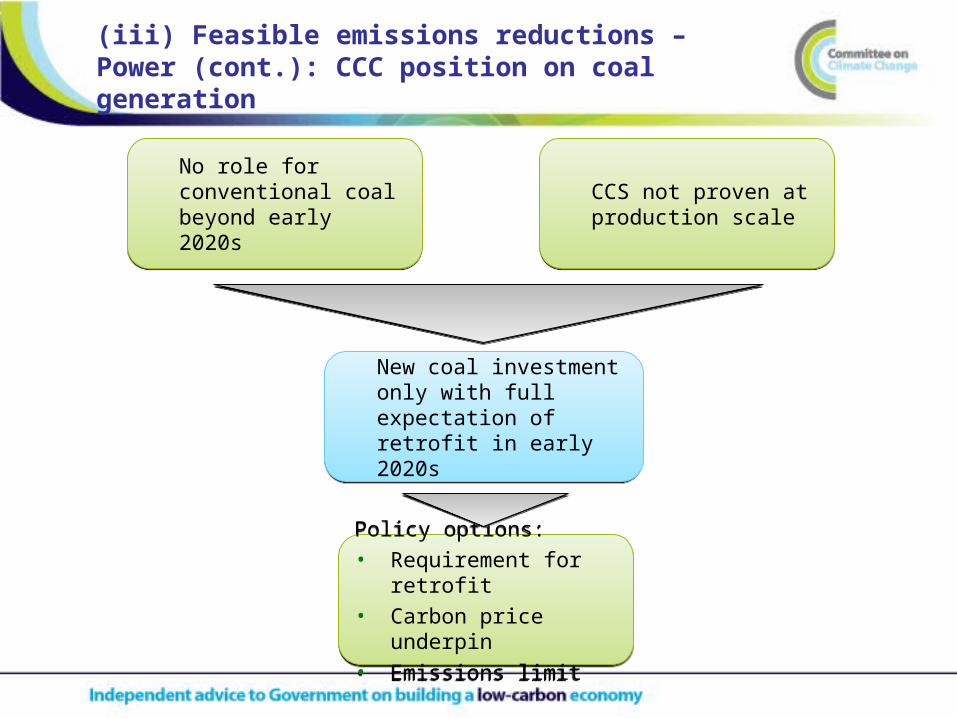
(iii) Feasible emissions reductions – Power (cont.): CCC position on coal generation
No role for conventional coal beyond early 2020s
No role for conventional coal beyond early 2020s
CCS not proven at production scaleCCS not proven at production scale
New coal investment only with full expectation of retrofit in early 2020s
New coal investment only with full expectation of retrofit in early 2020s
Policy options:• Requirement for retrofit• Carbon price underpin• Emissions limit
Policy options:• Requirement for retrofit• Carbon price underpin• Emissions limit
(iii) Feasible emissions reductions – Energy use in buildings and industry
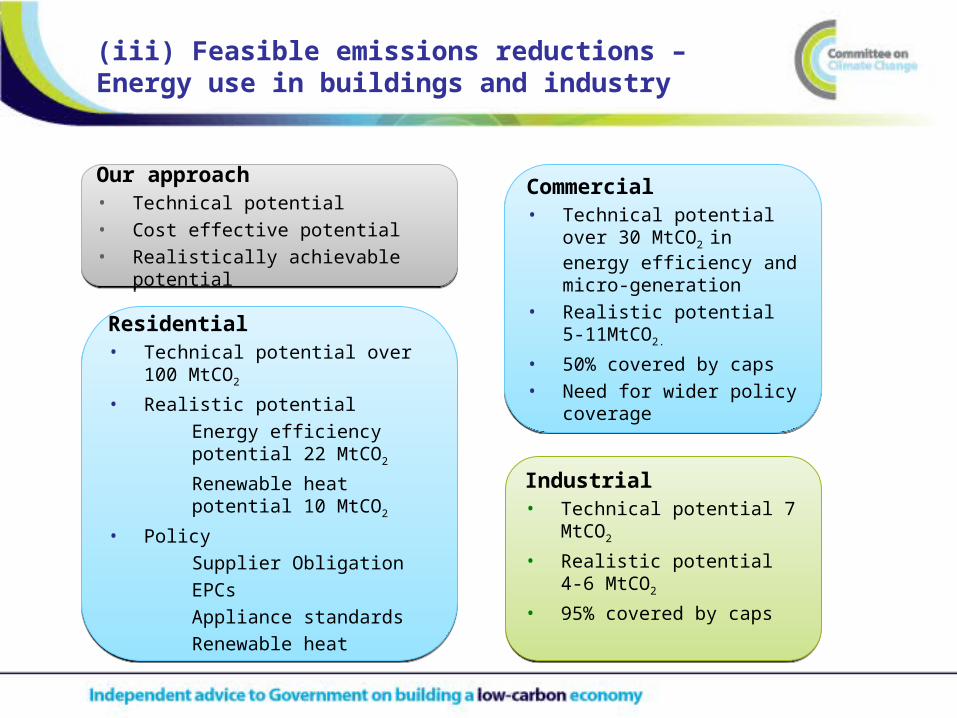
Commercial • Technical potential over 30
MtCO2 in energy efficiency and micro-generation
• Realistic potential 5-11MtCO2.
• 50% covered by caps• Need for wider policy
coverage
Commercial • Technical potential over 30
MtCO2 in energy efficiency and micro-generation
• Realistic potential 5-11MtCO2.
• 50% covered by caps• Need for wider policy
coverage
Our approach• Technical potential• Cost effective potential• Realistically achievable potential
Our approach• Technical potential• Cost effective potential• Realistically achievable potential
Residential • Technical potential over 100
MtCO2
• Realistic potential Energy efficiency potential
22 MtCO2
Renewable heat potential 10 MtCO2
• Policy Supplier Obligation EPCs Appliance standards Renewable heat
Residential • Technical potential over 100
MtCO2
• Realistic potential Energy efficiency potential
22 MtCO2
Renewable heat potential 10 MtCO2
• Policy Supplier Obligation EPCs Appliance standards Renewable heat
Industrial • Technical potential 7 MtCO2
• Realistic potential 4-6 MtCO2
• 95% covered by caps
Industrial • Technical potential 7 MtCO2
• Realistic potential 4-6 MtCO2
• 95% covered by caps
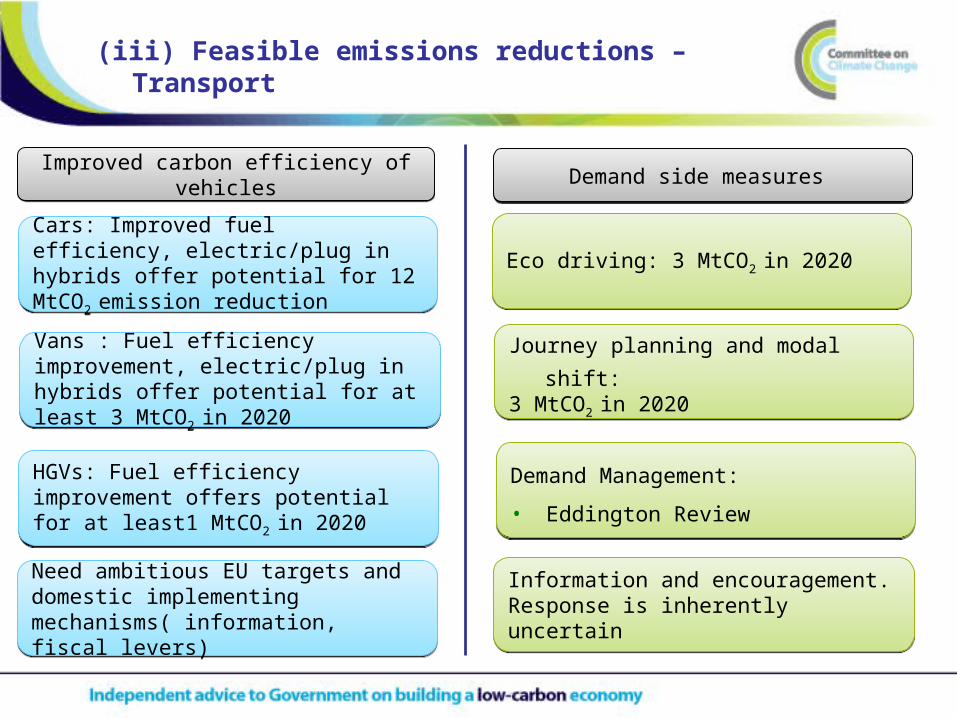
(iii) Feasible emissions reductions – Transport
Improved carbon efficiency of vehiclesImproved carbon efficiency of vehicles
Cars: Improved fuel efficiency, electric/plug in hybrids offer potential for 12 MtCO2 emission reduction
Cars: Improved fuel efficiency, electric/plug in hybrids offer potential for 12 MtCO2 emission reduction
Vans : Fuel efficiency improvement, electric/plug in hybrids offer potential for at least 3 MtCO2 in 2020
Vans : Fuel efficiency improvement, electric/plug in hybrids offer potential for at least 3 MtCO2 in 2020
HGVs: Fuel efficiency improvement offers potential for at least1 MtCO2 in 2020
HGVs: Fuel efficiency improvement offers potential for at least1 MtCO2 in 2020
Need ambitious EU targets and domestic implementing mechanisms( information, fiscal levers)
Need ambitious EU targets and domestic implementing mechanisms( information, fiscal levers)
Demand side measures Demand side measures
Eco driving: 3 MtCO2 in 2020Eco driving: 3 MtCO2 in 2020
Journey planning and modal shift:3 MtCO2 in 2020Journey planning and modal shift:3 MtCO2 in 2020
Demand Management:
• Eddington Review
Demand Management:
• Eddington Review
Information and encouragement. Response is inherently uncertain Information and encouragement. Response is inherently uncertain
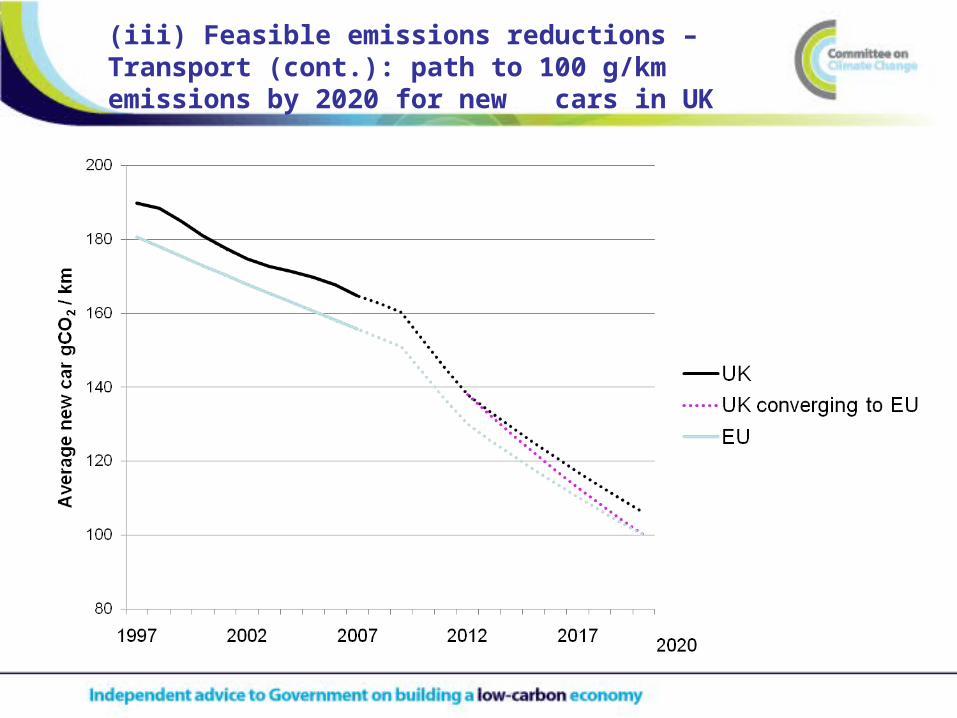
(iii) Feasible emissions reductions – Transport (cont.): path to 100 g/km emissions by 2020 for new cars in UK
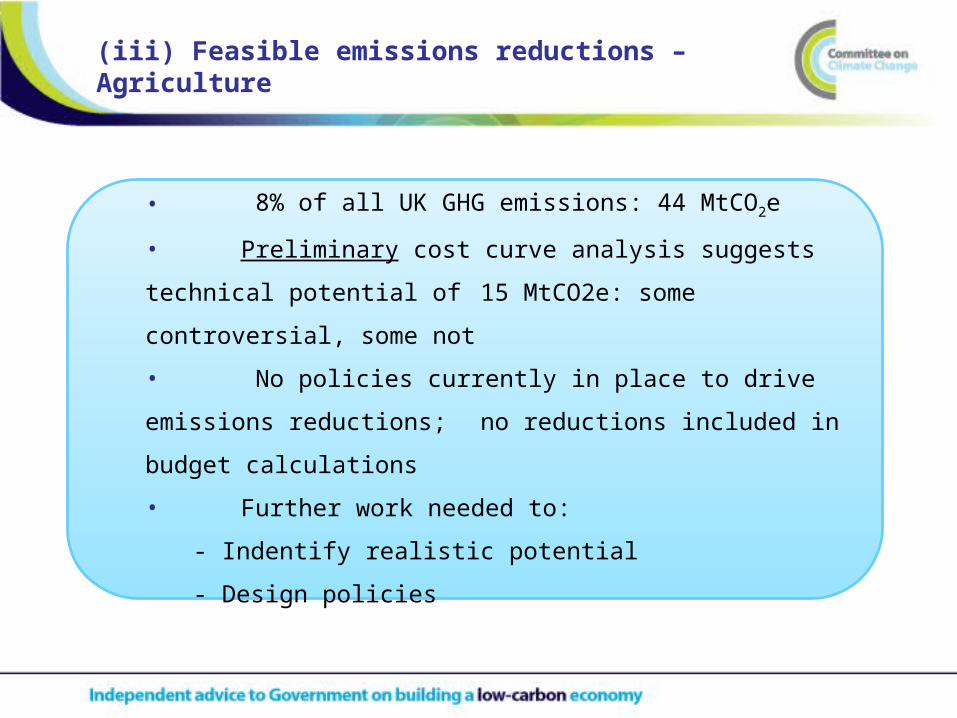
(iii) Feasible emissions reductions – Agriculture
• 8% of all UK GHG emissions: 44 MtCO2e
• Preliminary cost curve analysis suggests technical
potential of 15 MtCO2e: some controversial, some not
• No policies currently in place to drive emissions
reductions; no reductions included in budget calculations
• Further work needed to:
- Indentify realistic potential
- Design policies
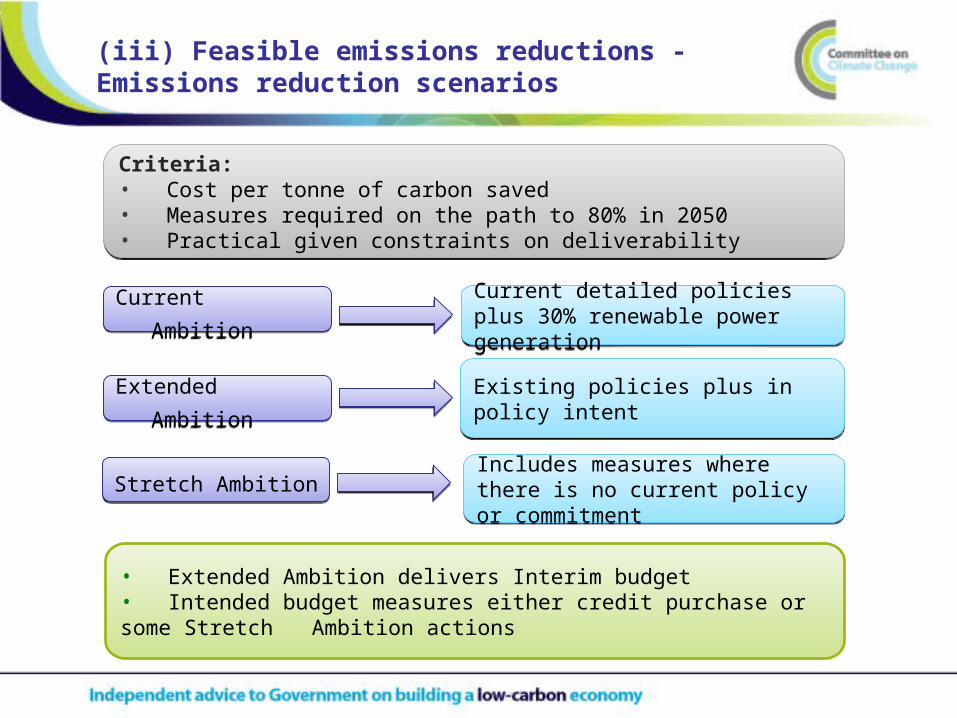
(iii) Feasible emissions reductions - Emissions reduction scenarios
Criteria: • Cost per tonne of carbon saved• Measures required on the path to 80% in 2050• Practical given constraints on deliverability
Criteria: • Cost per tonne of carbon saved• Measures required on the path to 80% in 2050• Practical given constraints on deliverability
Current detailed policies plus 30% renewable power generationCurrent detailed policies plus 30% renewable power generation
Existing policies plus in policy intentExisting policies plus in policy intent
Includes measures where there is no current policy or commitment Includes measures where there is no current policy or commitment
• Extended Ambition delivers Interim budget • Intended budget measures either credit purchase or some Stretch
Ambition actions
Current AmbitionCurrent Ambition
Extended AmbitionExtended Ambition
Stretch AmbitionStretch Ambition
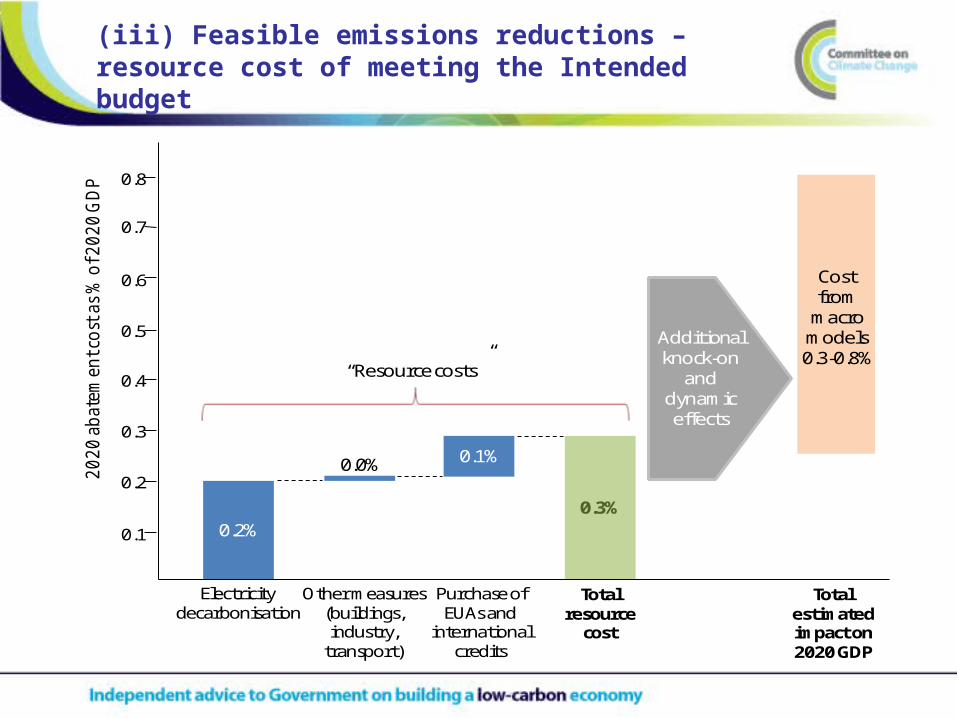
(iii) Feasible emissions reductions – resource cost of meeting the Intended budget
0.2%
0.1%
0.3%
Electricitydecarbonisation
Other measures(buildings,industry,
transport)
Purchase ofEUAs and
internationalcredits
0.0%
Totalresource
cost
“Resource costs”
0.1
0.2
0.3
0.4
0.5
0.6
0.7
0.8
Additional knock-on
and dynamic effects
Totalestimatedimpact on2020 GDP
20
20
ab
atem
ent c
ost
as
% o
f 20
20
GD
P
Cost from
macromodels0.3-0.8%
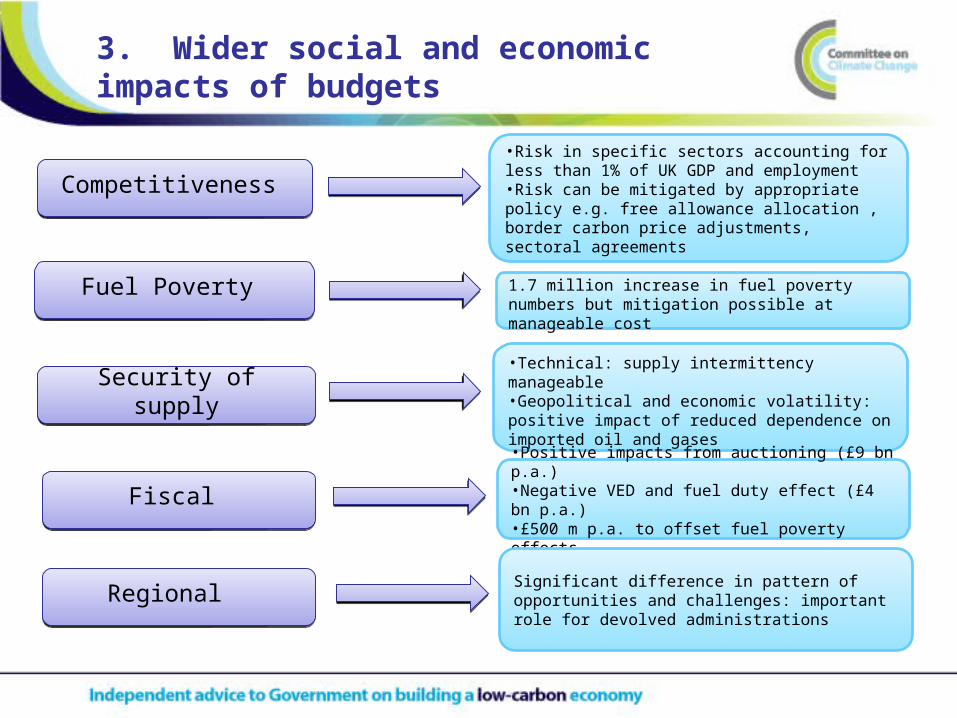
3. Wider social and economic impacts of budgets
Competitiveness Competitiveness •Risk in specific sectors accounting for less than 1% of UK GDP and employment •Risk can be mitigated by appropriate policy e.g. free allowance allocation , border carbon price adjustments, sectoral agreements
Fuel Poverty Fuel Poverty 1.7 million increase in fuel poverty numbers but mitigation possible at manageable cost
•Technical: supply intermittency manageable •Geopolitical and economic volatility: positive impact of reduced dependence on imported oil and gases
Security of supplySecurity of supply
Fiscal Fiscal •Positive impacts from auctioning (£9 bn p.a.)•Negative VED and fuel duty effect (£4 bn p.a.)•£500 m p.a. to offset fuel poverty effects
Regional Regional Significant difference in pattern of opportunities and challenges: important role for devolved administrations

Conclusion
• 80% cut in GHG emission by 2050 relative to 1990, all
GHGs, aviation and shipping included
• Unilateral 34% cut in GHGs by 2020 relative to 1990
(21% relative to 2005)
• 42% cut in GHGs by 2020 relative to 1990 (31%
relative to 2005) after global deal is achieved
• 34% cut predominately through domestic emissions
reduction
• 42% through domestic emissions reduction and credit
purchase
• 2020 cost less than 1% of GDP

MtCO2e
…
CCC proposed UK CO2e emission targets