budget fy 2011 duwayne w. jones, cpcm, fellow san diego, california march 27, 2010
TRANSCRIPT
Budget FY 2011
DuWayne W. Jones, CPCM, FellowSan Diego, CaliforniaMarch 27, 2010
2
2
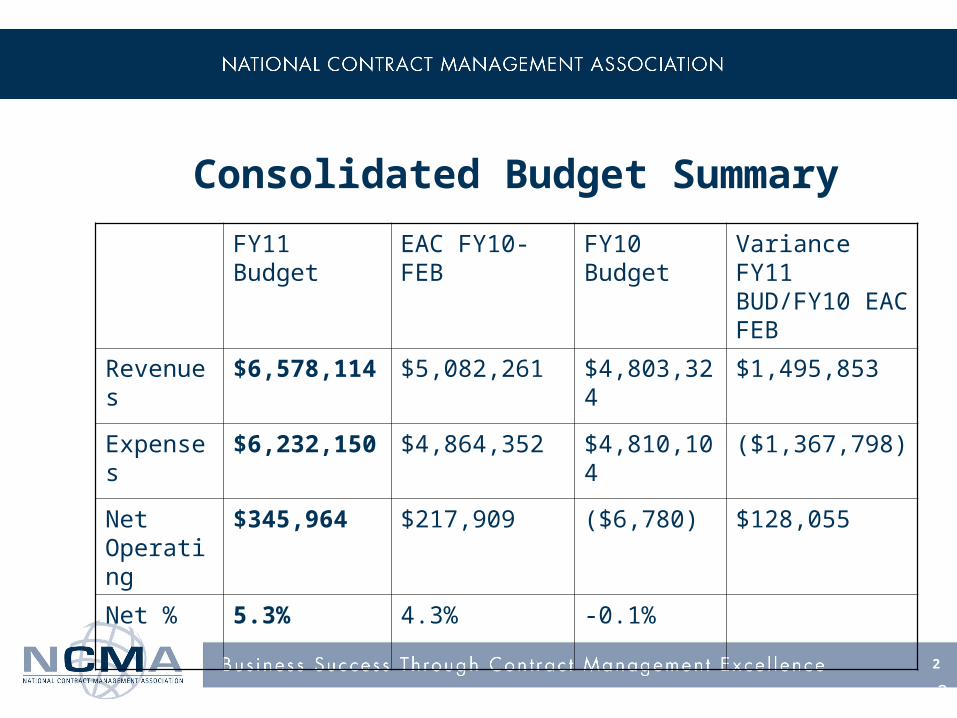
Consolidated Budget Summary
FY11 Budget
EAC FY10- FEB
FY10 Budget
Variance FY11 BUD/FY10 EAC FEB
Revenues
$6,578,114
$5,082,261 $4,803,324
$1,495,853
Expenses
$6,232,150
$4,864,352 $4,810,104
($1,367,798)
Net Operating
$345,964 $217,909 ($6,780) $128,055
Net % 5.3% 4.3% -0.1%

3
General Assumptions
Moderate risk•Continued economic uncertainty.• Income from all advertisement accounts are at risk.
– Association advertising and exhibiting is down.– Print ads down across all industries.– CMjobs.com is subject to employment trends beyond our
control.
•No new income streams although World Congress is back in the budget after one fiscal year hiatus.
•Budgeted surplus from operations is 5.3% (FY 10 EAC 4.3%, FY 09 0%).
4
General Assumptions
• Restricted Investments. In light of the current economic situation, and continued uncertainty in the stock market, and discussions with NCMA’s investment advisors net investment income has been included at zero (Investment Revenue of $10,000 offset by investment fees of $10,000)
• Unrestricted investments – Assumed interest @ 0.2% on $208,000 = $416
• Information Technology Investments: After the significant investment in information technology
both in hardware and software in the past three years the FY 11 Budget includes no significant information technology investment.

5
Revenue Growth Assumptions• Revenue increase over FY 10 EAC: 29.4%.
– Isolating out World Congress and one ADC effect: 6.2%
• Membership 13.1%– Dues increase
• Education 4.3%– Webinars
• Advertising 2.6%– Corporate sponsors/education partners
• Certification 7.2%– Exam fees, recertification fees
• Meetings 130.5% - Isolating out World Congress and one ADC effect (-0.1%)
6
Changes from FY2010•Meeting schedule changed:
– World Congress is Back; schedule shift from April to July.– One ADC in FY2011.– No Academic conference.
•Re-formed Marketing and Communications department. – Dedicated expense accounts.– Moved two employees from Creative Services to Marketing.
• Increased staff:– Director of Marketing (two months in FY 10 EAC)– Educational Technologist– Chapter Relations Specialist - P/T

7
Changes from FY2010 (con’t)•Not forecasting revenues from investments.•CoPs Symposia now Virtual Conferences.•No merger implementation costs included (small
expense planned for exploratory alliance discussions).
•Planned contributions to restricted reserves and new building reserves fund.

8
Total Revenues
Budget FY 11
EAC FY 10 Variance
Membership 2,104,979 1,861,325 243,654 13.1%
Component Relations 9,250 10,445 (1,195) -11.4%
Education 823,760 789971 33,789 4.3%
Advertising 1,444,900 1,407,975 36,925 2.6%
Certification 120,600 112,495 8,105 7.2%
Meetings 2,074,625 900,049 1,174,576 130.5%
Total Revenue 6,578,114 5,082,260 1,495,854 29.4%

9
Revenue FY2003-2013
0
1,000,000
2,000,000
3,000,000
4,000,000
5,000,000
6,000,000
7,000,000
8,000,000
FY 13 FY 12 FY 11 FY 10 FY 09 FY 08 FY 07 FY 06 FY 05 FY 04 FY 03
Meetings
Certification
Advertising
Education
Component Relations
Membership
No World Congress this
FY!
BudgetEstimateEstimate
Recession of 2008-2010
EAC
10
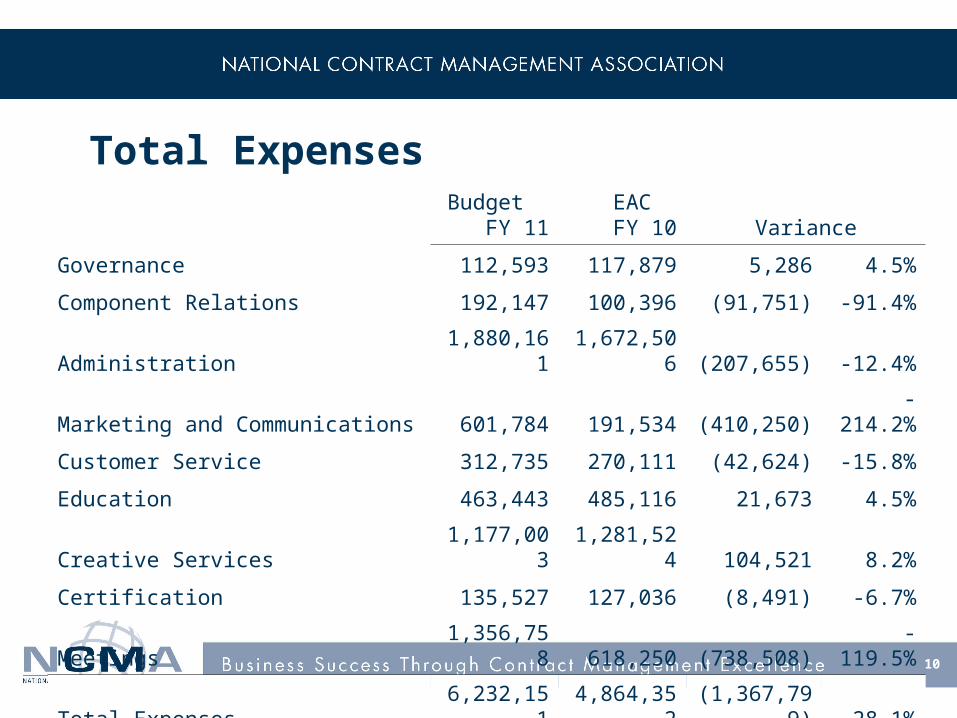
Total ExpensesBudget
FY 11EAC FY 10 Variance
Governance 112,593 117,879 5,286 4.5%
Component Relations 192,147 100,396 (91,751) -91.4%
Administration 1,880,161 1,672,506 (207,655) -12.4%
Marketing and Communications 601,784 191,534 (410,250)-
214.2%
Customer Service 312,735 270,111 (42,624) -15.8%
Education 463,443 485,116 21,673 4.5%
Creative Services 1,177,003 1,281,524 104,521 8.2%
Certification 135,527 127,036 (8,491) -6.7%
Meetings 1,356,758 618,250 (738,508)-
119.5%
Total Expenses 6,232,151 4,864,352(1,367,799
) -28.1%
11
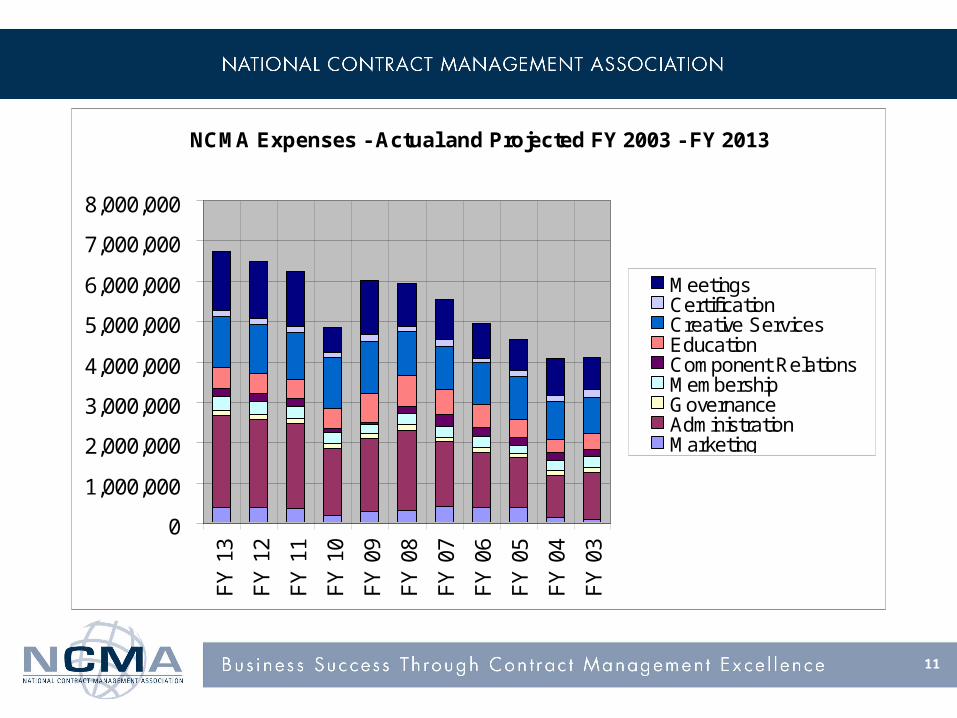
NCMA Expenses - Actual and Projected FY 2003 - FY 2013
0
1,000,000
2,000,000
3,000,000
4,000,000
5,000,000
6,000,000
7,000,000
8,000,000F
Y 1
3
FY
12
FY
11
FY
10
FY
09
FY
08
FY
07
FY
06
FY
05
FY
04
FY
03
MeetingsCertificationCreative ServicesEducationComponent RelationsMembershipGovernanceAdministrationMarketing

12
Expense Summary
•Aggregate Salaries and Benefits – Addition of Director of Marketing, Educational Technologist, Chapter Relations Specialist (P/T), annual raises and higher health insurance costs.
•Component Relations – Increase in Chapter Grant program, Awards – timing (WC Schedule)
•Administration – Staff training, tuition reimbursement, depreciation. Comparable to FY 09 expense - $627,629.
•Marketing – Inclusion of WC, comp CM Magazine program.

13
Expense Summary (con’t)
•Customer Service – Additional mailings, higher printing costs.
•Education – Lower Webinar, Book costs, Higher LDP – timing.
•Creative Services – Variable commission costs, lower CM Magazine printing costs –new contract.
•Meetings – No WC in FY 10, Two ADC’s in FY 10.

14
Reserve Management
• Nonprofit Operating Reserve Policy Group currently drafting white paper on Operating Reserve Policy for Non-Profits.
• Group comprises ED’s, CFO’s, Audit Partners, Consultants and Tax Professionals.
• Chaired by one of the leading experts on Not-for-Profit accounting in the US.
• Greater Washington Society of CPA’s endorses initiative, mission.
• Recommendations will carry weight with AICPA and FASB.
15
Reserve Management – cont.
•Preliminary conclusions by Group on level of Reserves– No right answer.– The balance in reserves should not be less than three months of
the annual expense operating budget.– To determine appropriate level each organizations should
determine risk associated with each revenue stream and the organization’s ability to adjust spending levels as the need arises.
– In most cases level will fall between three and six months.– Only in cases where high percentage of revenue is high risk and
the majority of costs are fixed would a level of reserves in excess of six months be appropriate.
16
Reserve Management – cont. •NCMA’s Risk level for Revenue Streams
– Membership Low– Education Low to Moderate– Advertising Moderate to High– Certification Low– Meetings Moderate
•NCMA’s Ability to Adjust Spending Levels– NCMA has flexibility to adjust costs – Low fixed costs (Mortgage, Leases, Hotel contracts)– Labor is largest cost but can be adjusted if the need arises
17
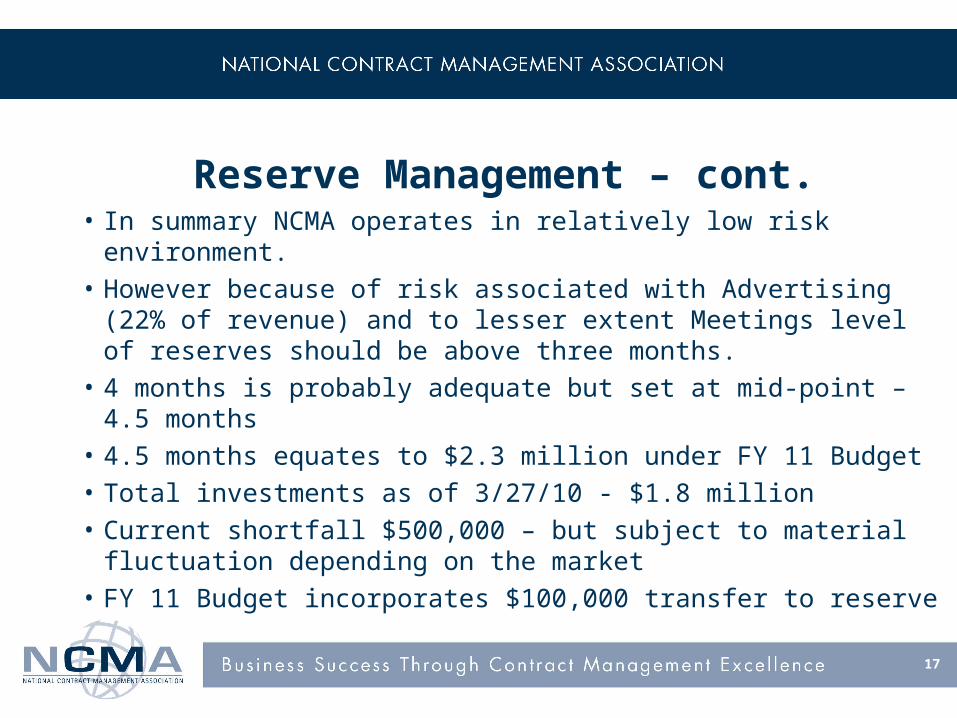
Reserve Management – cont. • In summary NCMA operates in relatively low risk
environment. • However because of risk associated with Advertising (22% of
revenue) and to lesser extent Meetings level of reserves should be above three months.
• 4 months is probably adequate but set at mid-point – 4.5 months
• 4.5 months equates to $2.3 million under FY 11 Budget• Total investments as of 3/27/10 - $1.8 million• Current shortfall $500,000 – but subject to material
fluctuation depending on the market• FY 11 Budget incorporates $100,000 transfer to reserve

18
Building Fund
•No Building Fund currently established.•Prudent to establish fund. •FY 11 Budget establishes fund with initial
transfer of $25,000.• Intention is to make annual transfers.•Fund to be used for building
upkeep/significant repairs.
19
Cash Flow – Summarized
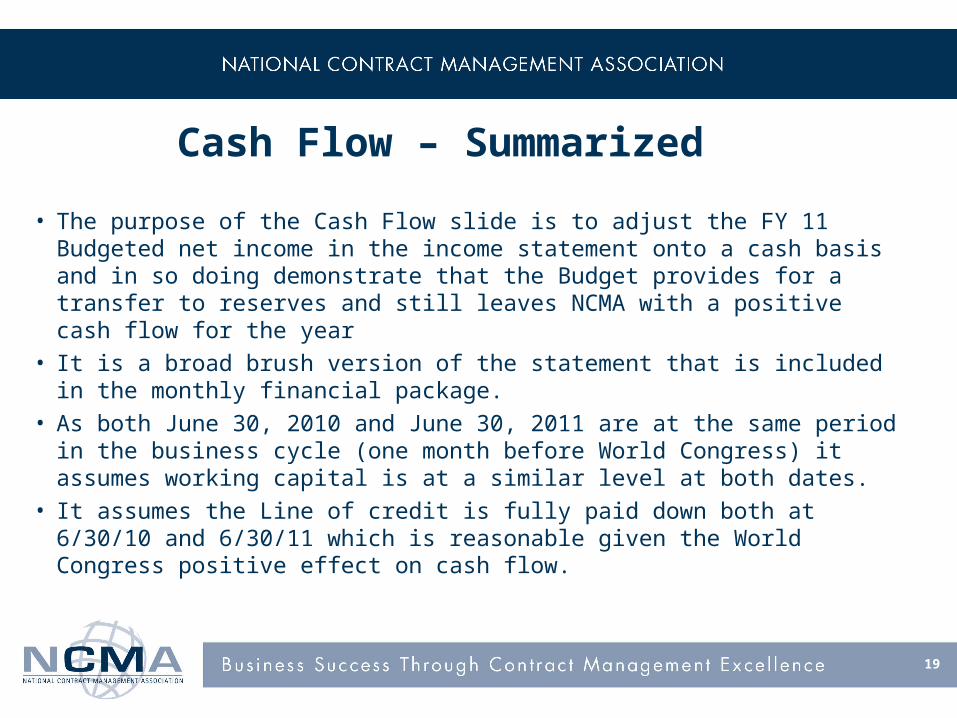
• The purpose of the Cash Flow slide is to adjust the FY 11 Budgeted net income in the income statement onto a cash basis and in so doing demonstrate that the Budget provides for a transfer to reserves and still leaves NCMA with a positive cash flow for the year
• It is a broad brush version of the statement that is included in the monthly financial package.
• As both June 30, 2010 and June 30, 2011 are at the same period in the business cycle (one month before World Congress) it assumes working capital is at a similar level at both dates.
• It assumes the Line of credit is fully paid down both at 6/30/10 and 6/30/11 which is reasonable given the World Congress positive effect on cash flow.

20
Cash Flow – Summarized
FY11 Operating Profit 345,963Income Tax Expense (assumes equals amount paid) (90,000)
_______Net Income from Operating Activities after Tax 255,963Add back non cash items:
Depreciation 267,771
Deduct non Income Statement Cash outflows:Purchase of Fixed Assets (46,248)Mortgage and Leases (Principal) (160,849)
Other Cash OutflowsTransfer to Reserves (100,000)Transfer to Building Fund (25,000)
_______
Increase in Cash under FY 11 Budget 191,637

21
21
Board Motion
Motion:
“Be it resolved that the NCMA Board of Directors approve the Fiscal Year - 2011 financial budget.”