bucknell environmental assesment
DESCRIPTION
Environmental AssesmentTRANSCRIPT

A Comprehensive Environmental Assessment of
Bucknell University
Edited by
Dina El-Mogazi
Director, Campus Greening Initiative Bucknell University Environmental Center

Table of Contents
Editor�’s Note....................................................................................................................... 4
Acknowledgements............................................................................................................. 5
Introduction......................................................................................................................... 9
Environmental assessments and campus sustainability .................................................. 9 Goals of the assessment ................................................................................................ 10 Methodology................................................................................................................. 11
Chapter 1. Administration and Policy.............................................................................. 14
Commitment to sustainability ....................................................................................... 15 Governance ................................................................................................................... 16 Board of Trustees.......................................................................................................... 17 Investments ................................................................................................................... 17 Recommendations......................................................................................................... 21
Chapter 2. Education........................................................................................................ 24
Campus-wide environmental literacy ........................................................................... 25 Sustainability across the curriculum ............................................................................. 27 Teaching and learning methods .................................................................................... 31 Scholarship.................................................................................................................... 33 Recommendations......................................................................................................... 34
Chapter 3. Energy ............................................................................................................ 36
Energy consumption ..................................................................................................... 37 Energy sources and impacts.......................................................................................... 40 Monitoring and regulating energy use .......................................................................... 42 Lighting......................................................................................................................... 45 Appliances..................................................................................................................... 47 Vehicles......................................................................................................................... 49 Recommendations......................................................................................................... 51
Chapter 4. Water .............................................................................................................. 54
Water consumption ....................................................................................................... 55 Irrigation ....................................................................................................................... 59 Appliances and fixtures................................................................................................. 60 Water sources for the campus ....................................................................................... 60 Water quality on campus .............................................................................................. 62 Wastewater.................................................................................................................... 64 Storm water................................................................................................................... 66 Miller Run..................................................................................................................... 66 Recommendations......................................................................................................... 69
Chapter 5. Waste.............................................................................................................. 72
1

Production and disposal ................................................................................................ 73 Paper waste ................................................................................................................... 74 Food waste .................................................................................................................... 75 Alternatives methods of waste disposal........................................................................ 77 Recycling ...................................................................................................................... 78 Hazardous waste ........................................................................................................... 84 Recommendations......................................................................................................... 89
Chapter 6. Purchasing ...................................................................................................... 92
Policies.......................................................................................................................... 93 Durable goods ............................................................................................................... 94 Paper ............................................................................................................................. 95 Disposable goods .......................................................................................................... 99 Recommendations......................................................................................................... 99
Chapter 7. Dining........................................................................................................... 101
Food sources ............................................................................................................... 102 Nutritional quality....................................................................................................... 106 Packaging and service-ware........................................................................................ 107 Food waste .................................................................................................................. 110 Recommendations....................................................................................................... 110
Chapter 8. Built Environment ........................................................................................ 112
Master planning .......................................................................................................... 113 The planning process for new buildings ..................................................................... 114 Construction................................................................................................................ 115 Demolition .................................................................................................................. 120 Indoor air quality......................................................................................................... 122 Transportation ............................................................................................................. 124 Parking ........................................................................................................................ 127 Bicycles....................................................................................................................... 127 Recommendations....................................................................................................... 129
Chapter 9. Landscape..................................................................................................... 134
Overview..................................................................................................................... 135 Open space .................................................................................................................. 136 Biodiversity................................................................................................................. 138 Landscape maintenance .............................................................................................. 144 A model for sustainable landscaping .......................................................................... 150 Recommendations....................................................................................................... 150
Next Steps ....................................................................................................................... 156
References....................................................................................................................... 157
Appendices...................................................................................................................... 165
Appendix I: Campus master plan guiding principles �– DRAFT................................ 165
2

Appendix II: The Talloires Declaration: University Presidents for a Sustainable Future..................................................................................................................................... 167 Appendix III: Statements of environmental principles from other colleges............... 169 Appendix IV: Environmental literacy quiz................................................................ 171 Appendix V: A Partial list of Bucknell University courses addressing sustainability..................................................................................................................................... 175 Appendix VI: Environmental Connections course requirement................................ 186 Appendix VII: Courses teaching about the local environment.................................. 191 Appendix VIII: Energy use monitoring in buildings on Bucknell Campus............... 197 Appendix IX: Bucknell University vehicles .............................................................. 200 Appendix X: Water-use monitoring In campus buildings ......................................... 204 Appendix XI: Paper policy proposal submitted to the Campus Greening Council in July 2008..................................................................................................................... 208 Appendix XII: Disposable service-ware used each week in Bucknell�’s dining facilities..................................................................................................................................... 213 Appendix XIII: Campus habitat map......................................................................... 215 Appendix XIV: Species counts for campus trees ...................................................... 216 Appendix XV: Pesticides and fertilizers used on Bucknell�’s campus....................... 218
3

Editor�’s Note
This report is the result of research conducted by dozens of students, faculty and staff over the period from September 2007 to September 2008. At the project�’s opening summit in September 2007, ten assessment teams were formed, and each was provided with a detailed list of questions to answer. Collectively, these questions addressed nearly every conceivable aspect of the University�’s environmental sustainability. Some questions required a simple �“yes�” or �“no�”, while others required highly sophisticated responses, and since the team members were all contributing the project voluntarily, the process was akin to casting hundreds of seeds into a meadow and waiting to see what would come up. The assessment teams worked autonomously during the research period, and thus their research styles varied considerably. Some teams were led by students, some by faculty, and some by members of the administrative staff. Some teams met regularly, while others chose to divide the tasks with each member working independently. Some of the more difficult questions were turned into student honors theses or course assignments. In September 2008, the questionnaires were collected, and over the next several months, compiled into what is now this document. According to the research methods and working styles of the different teams, the finished products varied considerably in their quality, thoroughness, and style. Due to the inherent variability in the research methods and products, substantial editing was required, and while every effort was made to preserve the original research, corrections were often needed for the sake of accuracy and internal consistency of the document. All of the original questions and responses have been preserved on a Blackboard site for future reference. The editing process has provided ample opportunity to contribute both to the content and the tone of the report, the latter of which is not insignificant. Some environmental investigations are highly critical of their subjects, and come across as judgmental in tone, while others, especially those produced by for-profit companies, are designed to cast their subjects in a glowing light. The tone of this report is intended to be inquisitive and thought-provoking, but this document is not intended as an exposé of the University, nor as a public relations piece. Bucknell has essentially the same environmental challenges of all universities, and is not atypical in its impact. But as an institution operating within a culture that has been on an unsustainable track for centuries, there is, of course, much room for improvement. Therefore this document is intended to take an honest and objective look at the sustainability of Bucknell�’s policies and practices in a way that will encourage creative solutions to our prevailing cultural quandary. Dina El-Mogazi May 3, 2009
4

Acknowledgements
Administration/Policy Team LeaderAmanda Wooden, Assistant Professor Environmental Studies Participants Jamie Hendry, Associate Professor of Management John Ostrow �’09, Management Peter Wilshusen, Assistant Professor Environmental Studies Dennis Hawley, Associate Vice President for Facilities Jim Rice, Associate Provost, Dean of Graduate Studies Kim Loser �‘09, English
Education Team LeadersSherry Finkel �’10, Environmental Studies Lisa Bonnikson �‘10, Management Participants: Alf Siewers, Assistant Professor of English Carl Milofsky, Professor of Sociology Paul Shrivastava, Professor of Management Rick Rosenberg, Director of Corporate & Foundation Relations Helen Morris-Keitel, Assoc Prof of German, Common Learning Coordinator
Energy Team Leaders Jessica Scott �’08, Animal Behavior Jim Knight, Associate Director of Utilities & Cogeneration Participants Eric Fournier �’08, Environmental Studies Katie Ruiz �’09, Economics, Environmental Studies Mike Patterson, Director of Facilities Services Bud Hiller, Technology Support Specialist�—Library and Information Technology Peter Stryker, Associate Prof of Mechanical Engineering Community Consultant: Stacy Richards, Director, Energy Resource Center, SEDA-COG
5

Water Team Leaders Greg Koontz, Assistant Director of Utilities Maintenance Alison Schaffer �‘08, Environmental Studies Participants Matt McTammany, Assistant Professor of Biology & Environmental Studies Jim Laubach, Assistant Golf Course Superintendent Craig Kochel, Professor of Geology Ben Hayes, Director of the Susquehanna River Initiative Carl Kirby, Associate Professor of Geology
Solid Waste Team Leader Tom DiStefano, Associate Professor of Civil & Environmental Engineering Participants Merritt Pedrick, Assoc Director for Operations Annie Lovell �’08, Environmental Studies and Psychology Alex Clavelle �’09, Environmental Studies Jason Snyder, Research Services Librarian�—Library and Information Technology Tom Kinnaman, Associate Professor of Economics
Hazardous Materials Team Leader Jim McCormick, Safety Manager Participants Molly Burke �’10, Environmental Studies, Political Science Jeff Loss, Senior Associate Director for Maintenance Jeff Trop, Assoc Prof of Geology
Purchasing Team Leader Don Krech, Director of Procurement Services Participants Jim Muchler, Director Administrative Services Meagan Gins �’08, Environmental Studies, Political Science Amanda Allen �’08, Environmental Studies Vicky Benion, Director of Bookstore Melissa Gelbart �’10, Environmental Studies, Women and Gender Studies
Dining Team Leader
6

Christine Kassab �’08, Environmental Geology Participants John Cummins, General Manager of Resident Dining�—Parkhurst Dining Services Jordanna Snyder �’09, Biology and Environmental Studies Andrew Casarsa �‘10, Environmental Studies Steve Jordan, Assistant Professor of Biology Community Consultants Sam Pearson, Coordinator, Local Action Network Trish Carothers, Coordinator of Local Foods Initiative, SEDA-COG
Built Environment Team Leader Steve Buonopane, Assistant Professor of Civil & Environmental Engineering Participants: Ashley Hanna �’09, Environmental Studies Jim Hostetler, Director of Construction & Design Abe Abrahamson, Prof of Biology Ellen Peeples �’09, Environmental Studies and Economics Dick McGinnis, Professor of Civil & Environmental Engineering Community Consultants: Sam Pearson, Coordinator, Local Action Network Shawn McLaughlin, Director, Union County Planning Commission Judy Ellis, East Buffalo Township Bike and Pedestrian Committee
Landscape Team Leaders Duane Griffin, Associate Professor of Geography Jessica Glenn �’08, Environmental Studies Participants: Mark Spiro, Associate Professor of Biology Bill Zimmerman, Grounds & Labor Supervisor Charlie Lincicome, Golf Course Superintendent Shelia Lintott, Assistant Professor of Philosophy Carl Beien �’08, East Asian Studies and International Relations Mia Bonnwell �’09, Music Performance Christian Etherton �’09, Geography Brian Gockley, Assistant Director of the Teaching & Learning Center Community Consultant: Brian Auman, Senior Planner, Community Resource Center, SEDA-COG
7

Student Researchers and Interns Molly Burke �‘10 Sherry Finkel �‘10 Alexandra Robertson �‘10 Chelsey Musante �‘10 Matt Tilford �‘11 Catherine Schirm �‘11
8

Introduction
�“Bucknell seeks to educate our students to serve the common good and to promote justice in ways sensitive to the moral and ethical dimensions of life.�” --Bucknell University Mission Statement Since the early 1990�’s, members of the Bucknell community, along with countless other colleges and universities worldwide, have voiced a sincere and increasingly urgent concern for the health and well-being of the planet and its future generations of inhabitants. Concern about global environmental degradation and resource depletion is a logical consequence of the scholarly research, teaching, and learning that takes place on campuses everyday. Because universities are by nature inquisitive institutions, it is only natural for the university to examine itself. Indeed, a university that promotes investigation of the world at large, and neglects to investigate itself in the process, misses a tremendous opportunity to teach its students by example. Thus it is imperative that the university evaluate its own contributions toward a sustainable future.
Environmental assessments and campus sustainability Sustainability is a term that was first made popular by the 1987 Brundtland Report of the World Commission on Environment and Development entitled �“Our Common Future�”. The report defines sustainability as �“meet[ing] the needs of the present without compromising the ability of future generations to meet their own needs�” (World Commission on Environment and Development 1987, p. 24). Although this definition leaves room for interpretation, the Brundtland Report clearly considers both global ecological integrity and social justice to be essential principles of sustainability*. The Brundtland Report helped pave the way for the campus greening movement, which began in earnest in 1994 when delegates from 50 states and 22 countries gathered at Yale University for the Campus Earth Summit. The collaborative work of these participants resulted in the publication of �“Blueprint for a Green Campus,�” (Heinz Family Foundation 1995) which has since served as a compass for campus sustainability initiatives worldwide. The Blueprint explicitly recognizes the importance of environmental audits in its definition of a �“green campus�”:
A green campus is one that integrates environmental knowledge into all relevant disciplines, improves environmental studies course offerings, provides opportunities for students to study campus and local environmental problems, conducts environmental audits of its practices, institutes environmentally
* Although social justice is clearly important to campus sustainability, indicators of social sustainability were not considered in this report, which focuses entirely on environmental concerns. A campus assessment based on social sustainability indicators should be considered as an important follow-up to this research.
9

responsible purchasing policies, reduces campus waste, maximizes energy efficiency, makes environmental sustainability a top priority in land-use, transportation, and building planning, establishes a student environmental center, and supports students who seek environmentally responsible careers (Heinz Family Foundation 1995, p. 1, emphasis added).
It is important to note that the Blueprint stresses both the physical elements of university operations, such as waste and energy efficiency, as well as academic elements such as course offerings and career-building. Thus, the Blueprint suggests that a good assessment will examine multiple aspects of university functioning including both tangible and intangible aspects of university life. Since the Blueprint was issued, innumerable environmental assessments have been conducted and published by colleges and universities worldwide. For instance the Campus Sustainability Assessment Project (CSAP), discussed in greater detail in �“Methodology�” below, maintains a database of over 1,100 such documents from 13 countries (CSAP 2006, �“CSA Database�”).
Goals of the assessment The overarching goals of Bucknell�’s environmental assessment are as follows:
To establish a baseline of existing conditions Although the Bucknell University Environmental Center�’s 2005 campus greening report provided a historical summary of greening efforts at Bucknell, the account in that report was not an exhaustive list, nor was it sufficiently detailed to serve as a reference point for future initiatives (El-Mogazi 2005, pp. 10-20). This environmental assessment establishes a much more thorough baseline reference for future sustainability programming.
To provide basis for improved sustainability Going beyond the baseline data, the assessment serves as a point of departure for further action in campus greening. The data herein will allow the university to compare its programs and operations with others, identify areas in need of improvement, and prioritize the implementation of future projects. This data will also provide a basis for calculating the economic benefits of resource conservation projects by establishing the current rates of resource use and their associated costs.
To promote environmental awareness through the assessment process The environmental assessment has provided students with valuable hands-on learning opportunities and a real sense of benefiting their local and global communities. Furthermore, the assessment process has provided an excellent means for fostering communication among members of the campus and developing greater awareness of the interrelationships among campus departments and operations.
10

To create an educational document for future use This complete report serves as an official reference source for any research, course projects, or new initiatives pertaining to the ecological and physical functions of the campus. As it is also publicly available, the assessment report has the potential to serve as a resource for other colleges and universities that wish to pursue similar projects.
Methodology The research for this document was conducted in large part by ten assessment teams based around ten �“indicators of sustainability�” including administration and policy, education, energy, water, waste, hazardous materials, purchasing, dining, built environment, and landscape (for a list of team members see �“Acknowledgements�” section above). Each assessment team included a mixture of students, faculty, and staff, and every attempt was made not to overlook any campus community member with significant interest, expertise or responsibility in the field represented by that indicator. One or two members of each team took on the role of team leader, with the ultimate responsibility of organizing the work of the group. Each assessment team was provided with a set of guidelines for conducting research, including substantial list of questions to be answered. The guidelines were developed in part from environmental assessments conducted at other colleges and universities. These �“model documents�” were identified on the basis of recommendations provided by the Campus Sustainability Assessment Project (CSAP), a program at the University of Western Michigan initiated in 1999 to assist colleges and universities in �“evaluating their social and environmental performance�” (CSAP 2006, �“Introduction�”). CSAP has evaluated and rated a large number of campus environmental assessments and published their results in a useful database of �“best practices�” (CSAP 2006, �“Best Practice Evaluation�”).
Model Documents A brief commentary on some of the model documents used to inform the guidelines for Bucknell�’s assessment is given below. It is important to note that many other worthy examples of campus environmental assessments are available and worth consulting. (For a comprehensive listing of campus environmental assessments, see the Campus Sustainability Assessment Project database, CSAP 2006, �“Best Practice Evaluation�”.) The documents listed below represent a sampling of the best rated, most relevant, and most accessible assessments available for use in creating these guidelines.
Cochran, Miller, et al. 2004. Assessing Carleton�’s Sustainability: A Campus Environmental Audit.
Because Carleton is one of Bucknell�’s aspirational peers it is a good model for comparison. Carleton College, in Northfield Minnesota has an enrollment of 1932 students, a main campus of 90 acres, and an 880 acre arboretum (Carleton College 2006, �“Fast Facts�”). Carleton�’s audit was performed by environmental studies students, but was based on a template created by a The Good Company, an independent environmental consulting firm. The audit is not as detailed as some,
11

but it does have a very clear and useful organization, and includes goals, benchmarks, and performance details for every indicator listed.
Davis, Jenn, et al, eds. 2003. Concordia Campus Sustainability Assessment.
The environmental assessment conducted by Concordia University, a large urban campus in Montreal, Canada, was highly acclaimed by the Campus Sustainability Assessment Project (CSAP 2006, �“Best Practice Evaluation�”). Concordia�’s document is arguably the most thorough and detailed campus environmental assessment available, and therefore, even though the university bears little resemblance to Bucknell, it provides a useful and inspirational example. The document is also highly �“political�” in nature, taking on many of the basic assumptions underlying common university practices, and examining social and economic issues in addition to environmental concerns.
Dwyer, Michael, et al. 1998. Oberlin and the Biosphere: Campus Ecology Report.
Oberlin College, located in Oberlin Ohio, has an enrollment of 2200 students and is considered to be one of Bucknell�’s general peers. The assessment consists of a series of investigations conducted and written by environmental studies students under the direction of environmental studies professor David Orr. The assessment is very thorough is some areas and sketchy in others, but the fact that it is a comprehensive environmental assessment published by one of Bucknell�’s general peers makes it a highly valuable resource.
Green Destiny Council. 2000. Penn State Indicators Report.
Penn State�’s environmental assessment was conducted during 1996-2000 by the �“Green Destiny Council�”, a team of students, faculty, staff, and professionals working under the guidance of ecology professor Chris Uhl. The document is organized around �“indicators�” of sustainability, a term that has become standard vocabulary in campus environmental assessments. The greatest strength of the Penn State Indicators Report (of which there are many) is that it provides an outstanding model for applied learning through the assessment process.
Woodward and Curran. 2000. Final Draft Report: Environmental Impact Audit,
Bowdoin College.
Bowdoin College, with 1600 students on a 200 acre campus, is roughly half the size of Bucknell, and is also considered to be one of Bucknell�’s aspirational peers. This environmental audit is the only one of the model documents conducted by a professional environmental consulting firm rather than an internal team. The professional quality of the document is apparent, and there is a great attention to detail in areas dealing with campus facilities, especially energy. The audit lacks any discussion of the academic and administrative aspects of sustainability.
12

The assessment process An opening summit in September of 2007 marked the beginning of the research for this document. At this event the assessment teams gathered for the first time to designate team leaders, discuss the assessment questionnaires, and strategize their approaches to the tasks at hand. Over the course of the next year, the teams worked autonomously, determining their own meeting schedules, division of labor, and internal deadlines. The director of the Campus Greening Initiative served as the overall project coordinator and offered assistance to the teams upon request. In April of 2008, several student participants who were graduating from the University gave presentations on their work at a �“spring progress report�”. A closing summit took place on October 1st 2008, during which project highlights were presented by the project coordinator and several of the assessment team leaders. All of the environmental assessment gatherings were designed as models for sustainable practices, featuring 100% recycled paper, local foods meals, and durable rather than disposable dishes.
13

Chapter 1. Administration and Policy
14

A university�’s administration is vital to the process of realizing campus sustainability, and university policy is an essential instrument for any substantial change in the campus fabric. As the most influential members of the campus community, upper-level administrators have the power to �“make or break�” the conditions that favor institutional change. For example, Nan Jenks Jay, director of environmental affairs at Middlebury, reports that administrative participation and support have played an invaluable role in the college�’s highly acclaimed sustainability efforts:
With administrative support being key to long lasting success, this administration's philosophical and financial support is worth noting. The VP/treasurer formed the energy committee; the president designated the environmental peak and funded the campus environmental grants; the VP for academic affairs/provost created the director of environmental affairs position and operating budgets; the dean of faculty supported new shared faculty appointments in the Environmental Studies program; and the VP for facilities planning co-chaired a process to develop sustainable design endorsed by the college�’s trustees (Jay 2003, pp. 2-3).
Assessing a university�’s administration and policy provides a sense of the strengths and weaknesses in a university�’s overall commitment to sustainability, and should help to focus future efforts in campus greening programming. In an effort to characterize the Bucknell administration�’s support for sustainability, the administration and policy assessment team examined statements of commitment, governance, the Board of Trustees, and investment policies.
Commitment to sustainability A written commitment to principles of sustainability ensures clear intentions and a willingness to reflect thoughtfully on this complex topic. Although there is no official �“blanket statement�” regarding Bucknell�’s position on sustainability, recent assurances by President Mitchell move the University decidedly in the direction of a commitment to sustainability principles. On January 31st, 2008, President Mitchell signed the American College and University Presidents' Climate Commitment. According to the President�’s announcement:
This commitment, which has been made by more than 475 college presidents across the country, represents the University�’s pledge to minimize greenhouse gas emissions, enhance environmental stewardship efforts, and foster the concepts of sustainability and environmental ethics in our curriculum.
In addition to the climate commitment, on Jan. 31st, 2008 the President committed the University to creating a Campus Greening Council (see governance section below) and taking the following steps to protect the natural environment and reduce the University�’s ecological footprint:
1. Consider U.S. Green Building LEED certification for new campus construction costing more than $500,000, subject to the approval of the Board of Trustees and consistent with the University�’s campus master plan.
15

2. Purchase Energy Star products that meet the strict efficiency guidelines of the
Environmental Protection Agency and the U.S. Department of Energy.
3. Purchase additional alternative fuel vehicles for the campus fleet.
4. Develop programs in which students, staff, and faculty can "borrow" cars and bicycles from the University to reduce the need for personal vehicles on campus.
5. Include sustainable strategies in the Campus Master Plan, such as establishing
hiking and biking trails that link the University with the larger community, restoring Miller Run, and recapturing access to the Susquehanna River. (See the draft Campus Master Plan Guiding Principles in Appendix I; sustainability principles are underlined.)*
The Sustainable Endowments Institute (SEI) �“2008 College Sustainability Report Card�”, which evaluated Bucknell University as scoring a �“C�” on administration, predated many of the elements of change identified here, as well as the appointment of a full time director of the University�’s Campus Greening Initiative in September 2008 and the execution of this environmental assessment (SEI 2007). Largely as a result of these recent developments, the SEI�’s newly released �“2009 College Sustainability Report Card�” raised Bucknell�’s administrative grade to an �“A�” (SEI 2008).
Governance The governing structure of a university plays a significant role in decisions related to the institutions policies and practices, especially in the area of sustainability where so many different operational units have an impact. The organizational structure for decision-making related to sustainability at Bucknell has been established through the creation of a Campus Greening Council (CGC). According to the CGC�’s charge:
The Council shall have the authority to develop recommendations and evaluate the impact of University policies and practices on the natural environment and the ecology of the campus, including such matters as energy use; air and water emissions; water resource and waste management. The Council shall review periodic environmental assessments of the campus conducted by the BUEC to assist in determining the impact of University policies and practices. The Council shall serve as the planning and monitoring agency for the commitments required pursuant to the American College and University Presidents Climate Commitment�…The Council shall meet at least once a semester. The Council shall report to the President through the University Management Group. The Council shall consist of students, faculty and staff.
Presently, the decision-making process of the CGC is still being developed. Minutes of CGC proceedings are made available upon request, and an online interactive forum
* The final version of the master plan was released in fall 2008 and reinforces the commitment to sustainable principles stated in the draft guidelines (Shepley Bulfinch 2008, p. 13).
16

including a formal proposal template, is under development. A series of open forums to discuss campus sustainability is being planned for 2009. Other governing bodies of the University have the potential to play a significant role in sustainability as well. For instance in 2008 the Faculty Council played a role in endorsing Bucknell�’s first Focus the Nation symposium on climate change. Also in 2008 Bucknell Student Government (BSG) designed and implemented the Bison Bikes program which allows students to borrow bikes free of charge for on-campus transportation, and in 2009 BSG is developing a proposal for a car-borrowing program.
Board of Trustees The Board of Trustees (BOT) represents the most influential governing body at Bucknell, and impacts greatly the priorities and overall ethic of the University. To date, the BOT has been firmly supportive of environmental programming at Bucknell, as made evident by the development and funding of the Bucknell University Environmental Center (BUEC) and a demonstrated interest in the Solar Scholars program. The board has also shown support for sustainable principles in the campus master plan. (See Appendix I for a list of these principles.) The transparency of the BOT is a particularly relevant indicator of sustainability, given that the most significant decisions affecting campus operations take place within the board�’s proceedings. In this regard it is notable that reports of BOT meetings are made available to the Bucknell community and the general public online (Bucknell University Office of the President, 2008), and that the University also makes special documents and reports to the BOT available to members of the Bucknell community through the information folder of �“my Bucknell�” under a sub-folder entitled �“Board Update Documents.�” These resources demonstrate a willingness to communicate openly on major BOT decisions and the rationales behind them. The composition of the board is also relevant. Each member of the BOT brings to this body a certain personal and professional perspective which will contribute to the priorities of the board as a whole. In examining the membership of the current BOT, the assessment team concluded that the board�’s composition does not at this time reflect a particular concern for the environment, and that expertise in sustainability is not currently used as a criterion in member recruitment and selection. To the knowledge of the team members, no trustee has been chosen for his/her expertise on sustainability-related issues. Additional information about the BOT including 1) any stated criteria for trustee appointments, 2) professional backgrounds of current trustees, and 3) ethical standards for trustees�’ conduct and decision-making, was not obtainable by the assessment team. The team deferred these questions for future study.
Investments If dollars are akin to �“votes�” within the global economy, then the way in which a university�’s endowment is invested represents a significant statement of institutional values. As of spring 2008, the size of Bucknell�’s endowment was estimated at $600 million. (This value has declined significantly since the onset of the current economic
17

downturn.) The endowment was broken up into four general allocations, as shown in Figure 1.1 below: 67% of the University�’s endowment was invested in �“growth assets�” (e.g., U.S. equities, international equities, venture capital), 13% in low-volatility assets (e.g., real estate, energy), 4% in inflation protection assets (e.g., bonds), and 16% in hybrid assets (e.g., high-yield debt). Another way of breaking down the investments is by return (see Figure 1.2): 17% in U.S. equities, 34% in international equities, 8% in fixed income, 18 % in hedge funds, 11% in private equity, and 11% in real assets (of which 4% comprise oil, gas, and timberland).
Figure 1.1. Endowment asset classes, spring 2008. *Includes oil, gas, and timberland.
Investment Management The way in which an endowment is managed reflects first and foremost a university�’s concern for the financial sustainability of the institution. However, in the long term, these management decisions also influence the direction of society as a whole, because they determine which corporations, economic sectors, and national interests will be favored over others. Bucknell�’s endowment is controlled by approximately thirty portfolio managers. In spring 2008, three portfolio managers controlled about 23% of the endowment and managed the funds with significant guidance from Bucknell; the other twenty-seven managers intermingle Bucknell�’s funds with other organizations�’ and individuals�’ funds and therefore make investment decisions largely independently. Nevertheless there seems to be a willingness by the University financial administration to suggest to these 27 fund managers certain investment policies to which the University would prefer they adhere.
18

Figure 1.2. Return of each asset class, spring 2008.
Although those who oversee the endowment do not necessarily screen investments like a Large-Cap Mutual Fund would, they do conduct due-diligence on the managers who control the endowments�’ funds and also conduct research into possible new investment managers and funds. For instance, the University has used a Sudan Investment Task Force list for the purposes of divesting in that country, and more recently in August 2008 the University added a renewable energy fund to its investments representing approximately 1.5-2% of the total portfolio. Table 1.1 below summarizes some of the features of this fund. Table 1.1. Fund details of the renewable/alternative energy fund.
19

The SEI�’s �“2008 College Sustainability Report Card�” evaluated Bucknell University as scoring a �“C�” on investment priorities, stating �“The University aims to optimize investment return and has not made any public statements about investigating or investing in renewable energy funds or community development loan funds.�” (SEI 2007) This score improved to a B on the newly released 2009 report card due to the University�’s willingness to explore renewable energy funds and community development loans (SEI 2008).
Shareholder Engagement and Investment Transparency With respect to sustainability principles, shareholder engagement represents an institution�’s willingness to participate in the democratic process of the free market, ensuring that shareholders have a say in the conduct of the companies in which they invest. Bucknell�’s representatives do not participate in proxy votes and the University has no public statements about active ownership. The SEI�’s �“2008 College Sustainability Report Card�” evaluated Bucknell University as scoring an �“F�” on shareholder engagement (SEI 2007). This score did not improve in the most recent evaluation (SEI 2008). Investment transparency refers to the degree to which an institution makes available information regarding their investment priorities and decisions. This indicator is also crucial to the sustainability of the University because it measures the degree to which the members of the Bucknell community are made aware of the kinds of economic �“votes�” that are being cast on their behalf. In the absence of this awareness, no objections may be made to investment decisions that run counter to the values of social and environmental sustainability. The University published annual Endowment Reports in fall 2007 and spring 2008 which are available online as well as in a hard copy (Bucknell University Development and Alumni Relations, 2008). The information is limited, but the reports are a step in the right direction for greater disclosure to the Bucknell community and other interested parties. The SEI�’s �“2008 College Sustainability Report Card�” evaluated Bucknell University as scoring a �“F�” on endowment transparency (SEI 2007) because, �“[T]he university has no known policy of disclosure of endowment holdings or its shareholder voting record. Therefore, there is no known ability to access this information.�” Due to the limited nature of the information disclosed in the annual Endowment Reports, the University did not improve its grade on endowment transparency in the 2009 report card (SEI 2008).
20

How other schools received better grades in the Sustainable Endowments Institute scorecard: Dartmouth College: Received an A in Endowment Transparency by publishing an annual report Williams College: Received an A in Investment Priorities by exploring renewable energy investment funds Carleton College: Received an A in Shareholder Engagement by forming a committee that makes recommendations on proxy issues
Recommendations The administration/policy assessment team recommends the following:
Commitment to sustainability
That thee President develop and sign a formal and inclusive statement on sustainability. One such statement, the Talloires Declaration of University Presidents is included in Appendix II and examples of official statements from other universities (Carleton, Dartmouth, Bowdoin, Middlebury, and Connecticut College) are included in Appendix III.
That the University actively promote its advances in sustainability at the
highest level of the University administration. Examples include the SEI�’s �“College Sustainability Report Card�”, the National Wildlife Foundation�’s (NWF) �“Campus Environment 2008: A National Report Card on Sustainability in Higher Education,�” and Princeton Review�’s Green College Ratings.
That sustainability competency be given high priority for administrative
hires. In the context of new hires within certain areas of the University (e.g. facilities, dining, administrative services, and purchasing) a high priority should be given to administrators who will knowledgably consider and manage the University�’s environmental affairs.
Governance
That there be a transparent and public information dissemination process concerning discussions of sustainability at Bucknell University. Open forums held to discuss campus sustainability would provide opportunities for discussion. Providing an electronic bulletin board/web-based discussion forum would be a useful tool.
21

That there be a clear decision-making process for the Campus Greening Council. The process is currently open to proposals from anyone on campus, but this is not widely known, and although a proposal template has been created, no formal submission process has been developed.
That the Campus Greening Council, in conjunction with the Environmental
Center, develop a set of �“greening priorities�” or greening strategy, a planning document that prioritizes sustainability and links it to the Master Plan.
Board of Trustees
That when recruiting new candidates for membership on the Board of Trustees, interest and competency in environmental affairs be a significant priority. This recommendation recognizes the fact that a number of Bucknell alumni have been highly successful in this area and there are alumni who could be recruited with this sustainability expertise/perspective in mind. For example, Jeff Erikson is a Bucknell alumnus from the late 1980s, Vice President at SustainAbility, might make a good candidate.*
Investments
That Bucknell join the Ceres network�†, a national network of investors, environmental organizations and other public interest groups working with companies to address sustainability challenges such as global climate change. The expense for joining this network is minimal and it would offer those who oversee Bucknell�’s endowment useful resources and investment opportunities.
That the University pursue socially and environmentally responsible investing
(SRI), which is optimizing financial return while fostering social good. There are four basic strategies to pursuing SRI: 1) screening, 2) divesting, 3) shareholder activism, and 4) positive investing. The assessment team recommends that the University first pursue screening and positive investing, given the endowment�’s size and complexity. The Greening Council could begin discussions with the Chief Financial Officer on possible screening techniques (adding sustainability as a criterion for screening investments) that Bucknell would be willing to implement on the one (or all) of the 3 managers who control about 23% of the endowment and manage the funds with significant guidance from Bucknell. Bucknell should then begin to discuss certain investment policies with the other twenty-seven managers that focus on sustainability and environmental issues.
Given that the University has been amenable in the past to divestment in Darfur,
the assessment team would recommend that the University continue that approach, but before divesting first consider positive investment of 5-10% of
* See www.sustainability.com for more information about the company and http://www.sustainability.com/about/profile.asp?id=21 for more about Mr. Erikson �† See http://www.ceres.org
22

the portfolio in funds that support sustainable development, such as clean energy technologies.
That Bucknell expand its annual Endowment Report to include significant
holdings, who manages the endowment�’s money and how much, and all other significant data that would be reported in a company�’s annual report. It would also be useful if Bucknell published a small quarterly report to keep students, faculty, staff and alumni informed.
That the University annually review SRI policies (such as screening, positive
investing, or divestment) so that they can be continually improved and reflect the current market and environment outlook. An advisory committee on socially responsible investment of students, faculty, trustees, and the CIO should be created to review these policies.
Recommendations for future monitoring The administration and policy assessment team recommends the following with respect to future monitoring of this indicator:
Establish a centralized database and create a monitoring system that provides a sufficient depth of detail on data required to continually assess BU�’s sustainability progress; this would require an investment in this equipment/system
Invest early in an online information clearinghouse through the Environmental Center
Evaluate the percentage of the University�’s investment portfolio linked to sustainable development enterprises
Evaluate how sustainability is incorporated as a criterion for investment selection
23

Chapter 2. Education
24

Clearly education and research are a university�’s greatest spheres of influence. Yet quite ironically the State of the Campus Environment Report, the first large-scale study of higher education environmental performance, states that the area in which institutions of higher education need to make the greatest improvement is in �“ensuring graduates, regardless of major, are environmentally aware and literate�” (McIntosh 2001, �“Executive Summary�”). Although minimizing a university�’s negative ecological impact is important, what is even more important is maximizing its positive impact, for in the long run universities produce future leaders whose priorities and decisions continue to impact the planet long after graduation. In this regard it is important to take every opportunity to promote the environmental literacy among the general student population, as well as to provide opportunities for in-depth exploration into environmental disciplines for those students who are inclined to pursue them.
Campus-wide environmental literacy While it is widely accepted that environmental literacy is a desirable goal, there is little agreement at Bucknell about exactly what constitutes environmental literacy and how it should be measured. The subtleties of this question will certainly provide ample material for future dialogues among Bucknell faculty and students, but for the purposes of this preliminary assessment, it may be said that, at minimum, an environmentally literate student will possess a functional awareness of his or her connection to the natural world. This awareness would include both an appreciation of how the natural world supports human life, as well as an understanding of how human actions and choices impact the natural world in turn. Apart from specific degree programs, which provide students with specialized and in- depth knowledge on environmental topics and will be covered in a separate section, the Bucknell University Environmental Center (BUEC) is the primary coordinating body for campus-wide programming on environmental topics. Initiated in November of 2004, the BUEC
seeks to integrate perspectives from the natural and social sciences, humanities, and engineering to enhance faculty, staff, student, and community understanding of complex contemporary environmental issues and of the interaction between nature and human beings in traditions throughout the ages. The center supports faculty, staff, and students dedicated to environmental and nature-related learning, teaching, scholarship, service, and action at local, regional, national, and international levels. (BUEC 2008, �“Mission Statement�”)
Examples of BUEC programming contributing to campus-wide environmental literacy includes speaker series and �“green bag�” lunches as well as large scale annual events such as the Susquehanna River Symposium and Focus the Nation. Focus the Nation began in 2008 as a measure to make all members of campus aware of their personal environmental impacts. The event�’s main attraction was a �“sustainability fair�” which gathered the entire
25

student body in the field house for lunch and educational displays. The lunch featured local, organic, and vegetarian foods served on biodegradable plates and cutlery. Local community organizations and vendors also attended to educate the student body about community sustainability initiatives.
Assessing environmental literacy across the campus What questions should a Bucknell environmental literacy survey contain? How and by whom should the survey be administered? How could improvement in environmental literacy be monitored over time? In attempting to write and administer Bucknell�’s first environmental literacy quiz, the education assessment team discovered just how subtle and challenging these questions are. What emerged was a preliminary experiment in environmental literacy assessment that raised more questions than it answered. Survey methodology and results: Over the process of developing an environmental literacy quiz for the university, two major areas of knowledge emerged as relevant. The first was an understanding of basic concepts pertaining to major environmental policy issues, such as greenhouse gases, endangered species, and energy efficiency. The second was an awareness of local ecological knowledge, such as the drinking water and energy sources, local flora and fauna, and the destination of waste. The quiz was administered to two groups: the first was an upper level management class containing thirty seniors and one junior (with no environmental studies majors represented), and the second was a group of forty-one incoming first-year students who had just arrived for orientation. (The first-year students were quizzed on basic concepts only, due to their limited opportunity to absorb local ecological knowledge.) Results:
First-year students scored an average of 55% on six questions testing basic environmental knowledge.
Upper level students scored an average of 63% on the same six questions, indicating a slight improvement during their time at Bucknell.
The upper level students scored an average of 44% on seven questions pertaining to local ecological knowledge.
See Appendix IV for the full length quiz and detailed results.
The student-run Bucknell Environmental club has also been a major player in efforts to educate the campus community at large. Since 2007 the club has partnered with the facilities department to host Bucknell�’s participation in Recyclemania, an 8 week-long annual recycling competition among college campuses. Additionally, for the past three years the Environmental Club has organized Earth Week programming which includes speakers, entertainment, and educational demonstrations in high traffic areas of the school.
26
Individual departments have also played an important role in campus-wide environmental awareness:
In spring 2008 Bucknell Dining began �“Trayless Tuesdays�”, posting signs in the cafeteria explaining the positive environmental impacts of reducing food waste. The effort was later made into a �“Trayless Tuesday and Thursday�” initiative with intentions of phasing out trays completely.
The Library and Information Technology (LIT) department launched a �“Print Wisely�” campaign in 2007 which uses on-screen notifications to remind students how many copies they have printed each semester and posts signs to encourage double-sided printing.
Since Fall 2006 the facilities department has hired seven student recycling monitors each year to promote and enforce recycling policies within the residential halls. As a result, recycling rates have increased and problems like commingling and overflow have been reduced.
The human resources department now regularly includes a segment on campus greening in their new employee orientation program, and has created a faculty/staff online ride board (through �“My Bucknell�”) to promote car-pooling.
Sustainability across the curriculum A university�’s curriculum provides ample opportunity to address the problem of sustainability from diverse disciplinary perspectives. In assessing whether this opportunity is being fully realized at Bucknell, the education assessment team examined individual courses, universal course requirements, specialized majors and curriculum tracks, and teaching and learning methods.
Addressing sustainability through individual courses In evaluating the extent to which individual courses embrace sustainability principles, the education assessment team attempted to list all courses taught at the University which address sustainability in a significant and meaningful way. In order to do so, a functional definition of such a course had to be developed. After some deliberation, the assessment team settled on the following:
For the purposes of this assessment survey an environmental-related course across all disciplines is defined as a course that includes:
a third to a half of content focused on the interaction of humans and the natural world in ways relatable to current environmental issues (ranging from ecological restoration to environmental ethics and environmental social justice)
theoretical frameworks that probe "open systems" in terms of a focus on human cultures and communities continuously interacting with the non-human world
27

and that encourages students to define for themselves and to act upon sustainability in relation to ethics, personal experience, cultural narratives and/or social action and service.
The list also includes courses with strong potential for meeting that inclusive definition with some tweaking, given their existing framework and orientation.
This inclusive working definition seems to cover all disciplines and cross-disciplinary efforts (including but going beyond environmental studies and ecological sciences), bearing in mind challenges to develop a twenty-first century university curriculum that can engage issues of social justice, economic sustainability, experiential ethics, and cultural imagination in relation to dynamic human engagement with the non-human world. Using the working definition provided, the team scanned both the online and print versions of the course catalog for courses that appeared to satisfy the above criteria. The list and the definition were then circulated among the faculty via email for further revisions. The resulting partial list includes 141 courses from 24 different departments. (For the full list, see Appendix V). Unfortunately, due to the shifting nature of university courses, it was impractical to create a completely current and accurate list, and it was also impractical to determine the total number of courses taught at the University as a point of comparison. That said, the large number of courses identified on the list is very encouraging, and the list will continue to be refined over time.
A universal course requirement Another way in which environmental literacy can be encouraged across the campus is to require that all students, regardless of major, take an environmental course. For instance, beginning in the 2008-2009 academic year, all students at Furman University are required to take a �“Humans and the Natural Environment�” course as described in the 2008-2009 course catalog:
Humans are affecting the dynamics of the planet; they are changing the composition of the atmosphere, the currents in the oceans, and the productivity of natural ecosystems. Because modern societies require more energy, food, and materials than ever before, we are increasingly dependent on stable, productive, and sustainable natural systems. Ironically, our societies are becoming increasingly urban and increasingly insulated from nature just as these ineluctable dependencies are becoming increasingly important. In order to foster an appreciation for these dependencies, courses will emphasize some aspect of the interactive relationships between humans and the natural environment. (Furman University 2008, p. 37)
Similarly, Bucknell�’s Common Learning Agenda (CLA), which applies to all Arts and Sciences students, requires students to take a course addressing Natural and Fabricated Worlds (NFBW). As described in Bucknell�’s 2008/2009 Course Catalog, �“Courses meeting this requirement focus on the influence and impact of technology on society and
28

environment or principles that help us to live harmoniously with the natural world.�” (Bucknell University Course Catalog 2008, �“College of Arts and Sciences�”) Although NFBW appears to be a universal environmental course requirement, there is a widespread feeling among faculty that this requirement is too broad to be effective in promoting environmental literacy. Because the requirement has been interpreted in such a way that it allows a course to address natural and/or fabricated worlds, rather than focusing on the relationship of one with the other, significant �“loopholes�” exist in the requirement�’s enforcement. As a case in point, one course that satisfies this requirement is Introduction to a Microcomputer Environment, described in Bucknell�’s course catalog as including �“the history of computers, hardware, software, file organization, data communications, systems analysis and design, programming, and societal issues.�” This course is required by all students in the School of Management, who by default have the NFBW requirement satisfied through this course. Because the School of Management represents two of the most populous majors at the university (management and accounting), a large number of students are effectively exempted from the requirement of exposure to any significant environmental course content. As the CLA came under revision in 2007-2008, an �“Environmental Connections�” requirement was developed and proposed as a replacement for NFBW in the new College Core Curriculum (CCC). This requirement places stronger emphasis on developing a student�’s personal connection to the natural world while also maximizing choice in course content through a large menu of options. (For the complete description of the requirement see Appendix VI.) One of the foremost intentions in creating the Environmental Connections requirement was to break down the widespread misperception that all environmental courses must be environmental science courses. Instead, the Environmental Connections proposal allows and encourages the relationship between humans and the natural world to be explored through a variety of disciplines, from humanities to social sciences to natural sciences. On February 19, 2008 the new CCC, including the Environmental Connections requirement, was approved by a majority of the Arts and Sciences faculty.
Degree programs For those students who desire an in-depth understanding of environmental issues, two degree programs at Bucknell include a major environmental focus: environmental studies, and civil and environmental engineering. Established in 1979, the Environmental Studies Program at Bucknell exposes students to a broad range of perspectives on environmental topics and sustainability, with faculty representing a dozen different departments teaching courses in the program. BA and BS majors in environmental studies have been awarded since 1990, and presently about twenty students graduate each year with degrees in environmental studies�—typically four BS and sixteen BA. (Bucknell University Environmental Studies Program 2008, �“About the Program�”)
The program underwent a review in 2004, with findings emphasizing the need to expand pathways or �“tracks�” within the major. The BS degree has seventeen courses and has an emphasis on environmental biology. The BA degree, in contrast, has an emphasis on
29

environmental policy. Recently, BA themes have been designed in each of the following areas: environmental policy, politics and economics, environmental planning, environmental ethics/humanities, environmental advocacy, international environmental perspectives, environment and human health, and perspectives on sustainability (Bucknell University Environmental Studies Program 2008, �“The New BA Major�”).
The Civil and Environmental Engineering program offers both B.S. and M.S degrees and among other goals, �“seeks to prepare students to be successful professionals recognized for their�…consideration of global and societal concerns, ethics, and sustainability when making engineering decisions�” (Bucknell University Course Catalog 2008, �“College of Engineering Curricula�”). The program graduated thirty-nine B.S. students and two M.S. students in 2008. Areas of concentration for M.S. students are aligned with faculty research interests including: biodegradation of municipal solid waste and aqueous organics; biological conversion of waste materials to useful forms of energy; life-cycle analysis of engineered environmental systems; bioremediation of contaminated ground water; remediation of hazardous waste sites; characterization of pollution from agricultural sources, and others (Bucknell University College of Engineering 2008, �“Environmental Engineering�”).
Curriculum tracks Other degree programs within the University offer tracks emphasizing environmental concerns. For instance, the Biology Department has a degree program with a focus in ecology and the Geology Department offers both a B.S. and a B.A. in Environmental Geology. One of the most exciting new developments along these lines is occurring within the School of Management, which currently has a �“Managing for Sustainability�” track under construction. According to the program proposal:
The Managing for Sustainability program engages students in interdisciplinary examination of the challenges of managing organizations in a socially, ecologically, and economically sustainable manner. The program fosters students�’ critical thinking about organizational values and goals. Students will consider how diverse organizations �– for-profits, NGOs, and governmental bodies �– can be designed and managed to participate effectively in the global economy while simultaneously reducing poverty, hunger, and other manifestations of human inequality; preserving cultural values and community identity; protecting, conserving, and restoring the environment; and upholding the inherent dignity of humans, nonhumans, and ecosystems affected by organizational activities. Students will develop deep understanding of the social scientific basis of our societal and ecological condition and will gain core management skills for resolving ecological and social challenges and building sustainable organizations. Our graduates will be managers with a deep environmental and social justice ethos who can redirect current business models towards social, ecological, and financial sustainability (Hiller, et al. 2007).
The program is expected to open in academic year 2010-11 with twenty to thirty students.
30

Teaching and learning methods The process of teaching and learning about sustainability thrives upon methods that are often �“outside the box�” of the conventional lecture format, including experiential learning, interdisciplinary team teaching, and learning about the local environment. Therefore, in assessing the degree to which a university promotes sustainability in education, it is helpful to investigate the extent to which these kinds of opportunities made available by the institution. The education assessment team discovered an impressive list of such opportunities at Bucknell, and these are discussed in greater detail below.
Experiential learning A wide variety of programs, courses, and facilities at Bucknell help to support and encourage experiential learning related to social and environmental sustainability and direct understanding of the natural world: Bucknell�’s Office of Service Learning works to engage students in volunteer service projects for non-profit organizations, and plays the role of �“match-maker�” in helping professors, students, and non-profits connect with one another. Currently thirty-five courses from sixteen different departments contain a significant service-learning component, and several of these courses are oriented toward environmental topics including: Civil and Environmental Engineering 433, Urban and Regional Planning; Geography 110, World Environmental Systems; Geology 103, Dynamic Earth; and the Foundation Seminar, Consuming Nature (Bucknell University Office of Service Learning 2009, �“Course List�”). The Office of Service Learning also sponsors long distance service projects in several locations, including the Bucknell Brigade working in Nicaragua, the Katrina Recovery Team working in New Orleans, and most recently Bicycles Against Poverty in Uganda. These projects add a rich dimension of social and environmental understanding for students who are motivated to serve others and work locally and globally toward a more just and sustainable world. The Environmental Residential College, one of seven residential colleges at the University, helps incoming students connect with peers who share a common interest in the environment, and exposes these students to environmentally-themed projects, field trips, and activities during their first year on campus. Recent activities have included a trip to Washington D.C. to lobby congress on climate change legislation; a field trip to Central Park and the Museum of Natural History in Manhattan; a kayak trip down the Susquehanna; and a project to restore a wetland in a local park, among many others (Bucknell University Residential Colleges 2009, �“Environmental College�”). The Solar Scholars Program gives Bucknell students the opportunity for hands-on learning about photovoltaic technology through solar demonstration projects on campus. The program currently maintains three solar arrays, one at the Bucknell University Environmental Center, and two at Bucknell West next to the modular housing units. Students in the program have been responsible for writing grant proposals, installing the equipment, collecting and monitoring data, and holding educational workshops for
31

members of the campus and local community (Bucknell University Environmental Center 2009, �“Solar Scholars Home Page�”). Semester on the Susquehanna is a full-semester of learning about the Susquehanna River where students study primarily off campus, much like a study-abroad program, using the watershed as an outdoor classroom. Activities include river sojourns, scientific and cultural research, mapping, and field trips within the watershed. The course will be offered for the first time in the fall of 2010 (Bucknell University Environmental Center 2009, �“Semester on the Susquehanna�”).
The Bucknell Outing Club�’s mission is �“to promote environmental awareness and give the University community the opportunity to explore the natural habitat of central Pennsylvania and beyond.�” Club activities include mountain biking, hiking, skiing, kayaking, rock climbing, and caving (Bucknell Outing Club 2009).
Bucknell Natural Areas provide students and faculty with valuable research and teaching opportunities, and allow members of the Bucknell community to experience diverse local ecosystems. A brief description of each of these areas is provided below:
Chillisquaque Creek Natural Area is maintained as a research site by the Biology Department and consists of sixty-six acres located in Montour County, 11 miles east of campus. Located within a flood-plain forest, the site is noteworthy for its high diversity of tree species (Bucknell University Biology Department 2009, �“Ecological Habitats�”).
The Forrest D. Brown Conference Center at Cowan is a rustic retreat on Buffalo Creek, approximately 8 miles west of campus. The property is also the site of the CLIMBucknell challenge course, a ropes course designed to teach self-confidence, problem-solving, and team-building skills (Bucknell University Reservation Information and Conference Services 2009, �“CLIMBucknell Challenge Course�”).
Montandon Marsh, directly across the river from campus, is owned by a local building company, and has been used as a research site by the University for over forty years. One of the largest natural palustrine wetlands along the Susquehanna River, this site is now a living laboratory for wetland restoration through a project being conducted by the Bucknell University Environmental Center�’s Susquehanna River Initiative. (For additional information see Bucknell University Biology Department 2009, �“Ecological Habitats�”.)
The newest of Bucknell�’s natural areas, the Roaring Creek Watershed, is currently under development, and will be used to foster student and faculty research in watershed science. This well-preserved watershed located in the midst of Pennsylvania coal-mining country, will serve as a valuable �“reference ecosystem�” for comparison with more degraded watersheds nearby. The site will be maintained in partnership with the Pennsylvania Department of Conservation and Natural Resources (DCNR).
32

Collaborative teaching Environmental concerns are interdisciplinary in nature, requiring understanding of physical and biological processes and political and economic systems as well as insight into human behavior and values. Thus a rigorous approach to contemporary problems of sustainability will often require more tools than a single discipline can provide. Although Bucknell has offered a few team-taught courses over the years, there is now a surge of interest in expanding these offerings. Often cross listed as �“University�” or UNIV courses, some of the current team-taught courses addressing issues of sustainability include: UNIV 245, AIDS, co-taught by professors in biology, sociology, and other departments; UNIV 252, Energy and Sustainability, co-taught by professors in engineering and economics; UNIV 298, Stream Restoration, co-taught by professors in geology and biology, and UNIV 299, Watershed Systems Science, co-taught by professors in geology and biology. The most significant development in collaborative teaching at Bucknell in recent history is the inclusion of an Integrated Perspectives (IP) course requirement in the proposal for a new College Core Curriculum (CCC) for the College of Arts and Sciences. IP courses would be team-taught by 2-3 faculty members representing different academic divisions (humanities, social sciences, or natural sciences) and would be required by all sophomores in the College of Arts and Sciences. According to the proposal, �“The course encourages students and faculty to approach complex issues requiring integration and synthesis of a range of knowledge, perspectives and methods acquired through study and practice across multiple disciplines and diverse educational experiences.�” (Henry et al 2008). Although IP courses are not content-specific (the courses would be oriented toward contemporary problems of all kinds, rather than being directed toward any particular theme) it is expected that many of these courses would be developed around problems of environmental and social sustainability.
Learning about the local environment As revealed by the results of the environmental literacy quiz discussed earlier in this chapter, students are often oblivious to the workings of the environment closest to them. Yet �“knowledge of place�” is a prerequisite for responsible engagement in ones community, and thus essential to a sustainable culture. Even if students are only temporary residents of the community and region, studying the local environment prepares them for a deeper understanding of their future loci. The education assessment team identified sixty-four courses from fifteen of Bucknell�’s departments which provide students with opportunities to study the local natural and/or cultural environment. A full list of these courses is provided in Appendix VII.
Scholarship Faculty and student scholarship are integral components of the University�’s mission, representing a highly focused use of the intellectual skills, time, energy, and funds of the institution. However, assessing the degree to which a university�’s research programs reflect a sustainable ethos is a complicated proposition. Scholarly pursuits are chosen
33

based on a whole host of criteria including intellectual curiosity, personal passion, societal needs, available funding, and professional rewards, and are largely determined by the choices of individual faculty members. That being said, there are many possible ways in which a university can encourage scholarly pursuits to reflect a sustainable ethos, including financial and administrative support, and recognition of scholarly achievements. A full assessment of Bucknell�’s research programs was beyond the scope of this project. However, several noteworthy indicators point towards leadership in sustainability-related scholarship.
In 2007 the Bucknell University Environmental Center (BUEC), working together with the Office of Corporate and Foundation Relations, was awarded a $450K grant from the Henry Luce Foundation supporting teaching, research, and outreach related to the Susquehanna River Initiative.
In 2008 the BUEC, in cooperation with the vice president for external relations,
was successful in securing substantial federal earmark funding ($191K) in support of BUEC student and faculty scholarship.
The Katherine Mabis McKenna Foundation provides stipends for environmental
research projects focused on the Susquehanna bioregion. The program funds eight to eleven student internships each summer.
A cursory analysis of faculty research interests indicates that approximately 35
faculty members (representing approximately 10% of all full time faculty) are conducting sustainability-related research.
Partial lists of student research projects and faculty publications pertaining to sustainability were compiled by the education assessment team. As with the list of sustainability-related courses, finding a suitable definition of a sustainability-related project or publication was challenging and could use further refinement. Projects and publications selected for these lists generally fell into one of six major categories: 1) environmental biology, 2) environmental geology, 3) environmental engineering, 4) campus sustainability, and 5) environmental policy, and 6) literary ecocriticism.
Recommendations Based on their findings the education assessment team recommends the following:
Continued discussion and refinement of an institutional definition of �“sustainability�” for use in the assessment of research and teaching at the University.
Coordination of existing programs and resources toward the ultimate goal of
sustainability across the curriculum.
34

Further exploration of opportunities to educate students on sustainable lifestyle choices within the residential environment.
Implementation of the Environmental Connections requirement, including the
faculty support necessary for development of new courses fulfilling this requirement.
Continued development of �“tracks�” within the Environmental Studies major.
Coordination of sustainability and environmental education with career
development programs.
Recommendations for future monitoring:
Continued assessment and tracking of environmental literacy among the general student population. The environmental literacy survey should be included as part of freshman orientation as well as the senior exit survey. Doing so would provide reliable and comparable data for measuring progress in this area.
Continued development of lists documenting sustainability-related courses,
student research projects, and faculty publications. If possible, an online site should be constructed, allowing faculty and students to view and update the lists.
35
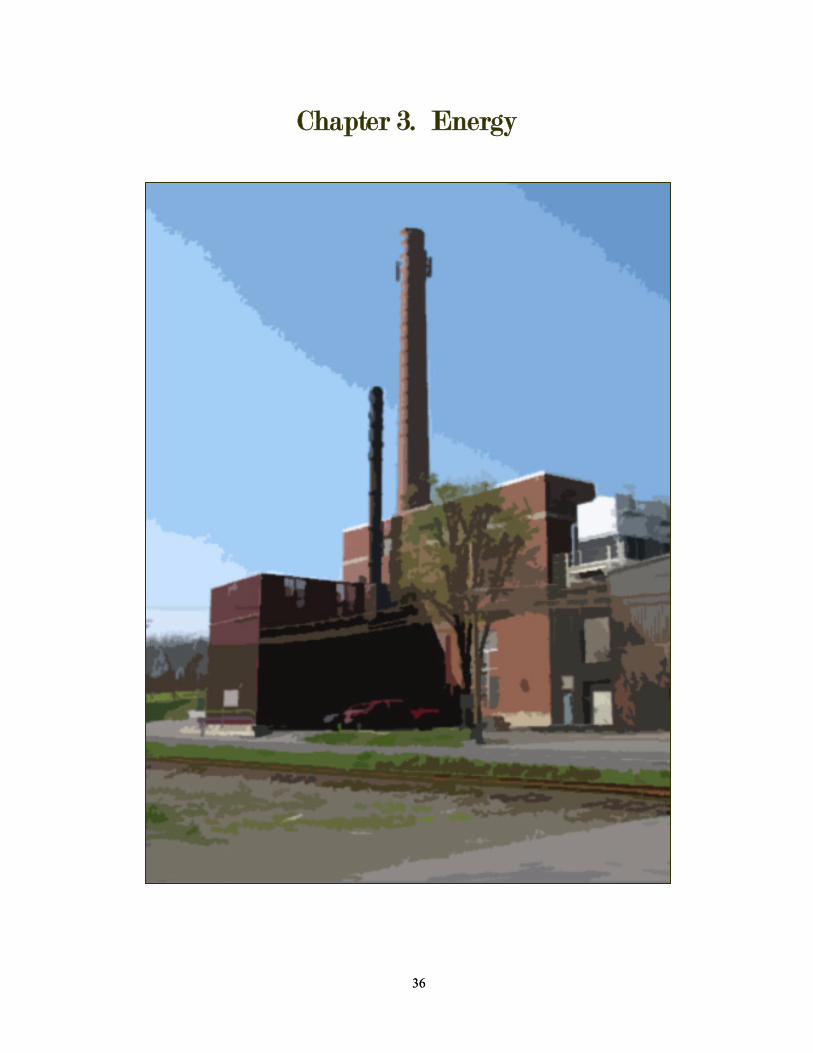
Chapter 3. Energy
36 36

Energy use is clearly an important aspect of campus sustainability and thus requires no explanation for its inclusion in this assessment. However, many may not realize the full extent of the influence that the higher education sector has in the larger energy market. According to a 2005 report by the Apollo Alliance:
College and university campuses are uniquely placed to affect America�’s energy future. The higher education sector is a $317 billion industry that educates and employs millions of people, maintains thousands of buildings and owns millions of acres of land. It spends billions of dollars on fuel, energy and infrastructure. And the footprint of higher education is widening �— enrollment between 2000 and 2013 is expected to increase by 23%. If every one of the 4000 campuses in the U.S. used 100% clean energy, it would nearly quadruple the current renewable electricity demand in the U.S. (Rhodes-Conway 2005, p. 5).
Thus the weight of these figures provides additional motivation for setting a sustainable energy course at Bucknell.
Energy consumption Bucknell�’s net energy use, as measured at the boundary of the campus, was 589 billion Btu in fiscal year 2007. Energy use has remained relatively consistent between 550 and 600 Billion Btu for the past fifteen years (Fig. 3.1). Electricity consumption is calculated based on electricity generated, plus purchases, minus electricity exported to the utility company. Natural gas consumption is based on utility metering data. Oil and propane consumption is tracked based on delivered quantities. This figure does not, however, accurately reflect Bucknell�’s total energy footprint due to the operation of an on-site cogeneration plant since 1998. When adjusted to account for the inefficiency of grid-supplied electricity vs. on-site cogeneration, the total energy impact has decreased from over 750 billion Btu in the early 1990�’s to an average of 622 billion Btu the past 5 years, a 16% improvement (Fig. 3.2) The reduction in energy consumed is more dramatic when normalized per square foot of building space. While building space has increased 26% since 1993, energy usage has declined from 295,000 Btu/SF (unadjusted) in FY 1993 to 227,000 in FY 2007 or 23%. (Fig. 3.2). Adjusted usage has declined 33% during the same period.
37

Campus Energy Use
-100,000200,000300,000400,000500,000600,000700,000
1993
1994
1995
1996
1997
1998
1999
2000
2001
2002
2003
2004
2005
2006
2007
Net Campus Energy (MMBtu) Btu/GSF
Figure 3.1. Net campus energy use ignoring grid-based inefficiencies.
Campus Energy Use
-
200,000
400,000
600,000
800,000
1,000,000
1993
1994
1995
1996
1997
1998
1999
2000
2001
2002
2003
2004
2005
2006
2007
Net Campus Energy (MMBtu) Btu/GSFCampus Energy (Adj) Btu/GSF (Adj)
Figure 3.2. Campus energy use including figures adjusted for grid-based inefficiencies.
Per-capita energy consumption Bucknell uses approximately 166 MMBtu (adjusted) per equivalent campus resident*, down from about 208 MMBtu per resident in the early 1990�’s. (Fig. 3.3). Unadjusted consumption averaged 159 MMBtu per capita over the past five years. (MMBtu=1 million Btu.)
* Each student was counted as one full resident, whereas each faculty and staff member was counted as 0.25 residents. This standard should be noted when comparing per capita energy use to that of other universities, whose figures may not count faculty and staff as fractions, and thus appear to be lower.
38

Per Capita Energy Use
0
50
100
150
200
250
1993
1994
1995
1996
1997
1998
1999
2000
2001
2002
2003
2004
2005
2006
2007
MMBtu per capita Adjusted Energy per Capita
Figure 3.3
Energy cost Annual energy costs have averaged less than $2.7 million for the past 10 years, due primarily to a 10-year, fixed-price natural gas contract. With the expiration of the gas contract in July, 2007, annual energy costs increased to $7.03 million for FY 08, a 260% increase (Figure 3.4). Barring major new construction, the budget is expected to remain constant for the subsequent three fiscal years.
Net Energy Cost
$-
$1,000,000
$2,000,000
$3,000,000
$4,000,000
$5,000,000
$6,000,000
$7,000,000
$8,000,000
1993
1994
1995
1996
1997
1998
1999
2000
2001
2002
2003
2004
2005
2006
2007
2008
Figure 3.4. Net energy cost.
39

Trends in energy consumption A number of factors have contributed to the reduction of energy consumption from the early 1990�’s to recent years. The first and most obvious is the construction and operation of the cogeneration plant. The second is the construction of the central chiller plant in 2001 and the continued expansion of the chilled water distribution system. The third major factor is better efficiency of newly constructed and renovated buildings, which has contributed to reducing the energy use per square foot. It should be noted that Bucknell�’s per square foot and per capita energy use is slightly �“penalized�” by absorbing the inefficiency of the electrical generation process as opposed to grid-purchased electricity for which the inefficiency of production is transparent to the end user. A number of other factors can also affect energy use, such as the percentage of air conditioned space, summer-time usage and occupancy, climate, and usage distribution (classroom, laboratory, residential, office, etc.). These factors must be taken into consideration when comparing energy statistics with other universities. Such a comparison was beyond the scope of this study.
Goals for energy use reduction Given that Bucknell has already reduced energy consumption substantially in the past 15 years, further reductions are likely to be smaller and require more resources. Considering these factors, Bucknell Facilities has established an internal goal of reducing total energy use by 2% per year over 5 years or 10% total. This goal will be reassessed on an annual basis as better data becomes available and the effectiveness of various projects and practices is evaluated.
Energy sources and impacts During the past five years, 94% of Bucknell�’s total energy consumption originated from natural gas. The remaining 6% is produced from No. 2 fuel oil (2%), propane(0.1%), and grid-supplied electricity (2.9%). Although grid-supplied electricity accounts for less than 3% of total energy use, nearly 100% is now sourced from wind-powered generators. Three sets of photovoltaic panels have been installed since August 2006, but produce a negligible percentage of the campus�’ energy requirements. Bucknell�’s natural gas is procured through a contract with Hess Energy by which futures contracts are purchased on Bucknell�’s behalf on the New York Mercantile Exchange (NYMEX). Electricity is supplied by the local utility, Citizens�’ Electric, who purchases wholesale contracts through an energy marketing company. Fuel oil and propane are supplied by local distributors. The major energy source for the campus was converted from coal to natural gas in the mid-1990s. The age, limited capacity, and environmental impact of the old coal-fired power plant were all factors in the decision to construct and natural gas fired cogeneration plant. The vast majority of natural gas is produced domestically, though liquefied natural gas (LNG) imports are increasing foreign supplied gas. A large portion of domestic production, storage, and processing is located in and around the Gulf of
40

Mexico. For this reason, hurricanes are a major cause of supply disruptions and price volatility.
Renewable energy Bucknell began purchasing 1 million kWh per year of wind-power in 2002 in conjunction with a consortium of PA colleges and universities. When the contract was renewed in 2005, an increase from 1 million to 1.5 or 2 million was proposed. The proposal was not approved due to the additional cost. When the contract was due for renewal again in January, 2008, however, the quantity was increased to 4 million kWh. The cost premium increased only $13,600 at this time, as Bucknell was able to shift from Pennsylvania-generated wind power to nationally generated power. The Solar Scholars project, as described in Chapter 2, has the potential to expand into a Renewable Energy Scholars program that goes beyond photovoltaic panels to embrace other forms of renewable energy technology. The University�’s technological �“palette�” is already beginning to expand, as a solar hot water heating system has been installed at Bucknell West Mod #3 along with the photovoltaic panels serving this modular residence. New students will be recruited in 2008-2009 to explore the design, installation, and monitoring of a residential-sized wind installation, working closely with the Environmental Center, the College of Engineering, and the Facilities Department to do so. Bucknell is also currently participating in discussions with several other Pennsylvania universities regarding the purchase and/or construction of a wind, hydro, or solar generating facility. The capital cost relative to the energy produced remains the biggest barrier to investment in renewable electricity generation. For thermal energy, there are few, if any, renewable sources which are viable alternatives to natural gas. Methane recovery from campus bio waste is one potential source, but the scale of production would be a negligible percentage of energy demand. Nonetheless, there is great educational value in such a project, and an anaerobic digester prototype is under development for converting food waste to methane. (For more details see Chapter 5, Solid Waste).
Greenhouse gas emissions Environmental Geology student Christine Kassab �‘08 conducted the first complete inventory of Bucknell�’s greenhouse gas emissions covering FY 1990 through 2005 (Kassab 2006). The most significant finding of this report was that the installation of the co-generation power plant, combined with the change in energy sources from coal to natural gas, reduced the University�’s greenhouse gas emissions by nearly 40% (see figure 3.5). Under the University�’s obligations to the American College and University Presidents Climate Commitment (ACUPCC), Bucknell has agreed to update this greenhouse gas inventory by May of 2009. The resulting report will be publicly available on the ACUPCC website, and will include, for the first time, data on emissions from university-sponsored air travel.
41

Figure 3.5. Net greenhouse gas emissions, (total emissions plus offsets) in Metric Tons of carbon dioxide equivalents, produced by Bucknell University for fiscal years 1990 to 2004 (Kassab 2006).
Monitoring and regulating energy use Electricity is metered in approximately 50 individual locations on campus. Most of these are for individual buildings, though some meters serve multiple buildings. Chilled water, for use in air conditioning, is metered in nearly every building served by the central distribution system. Steam usage is metered in only a few buildings due to the high cost of meter installation and limited accuracy. Steam flow meters were recently installed in the Weis Center and Science Center. For a complete listing of the energy-use monitors in each campus building, see Appendix VIII.
Energy consumption by campus buildings Historical energy use data on Bucknell campus buildings is limited. However, based on design, usage type, and size, the largest energy users on campus are the Science Center, Langone Center, Bertrand Library, Dana Engineering, and the Athletic & Recreation Center. This issue was explored in greater depth by Eric Fournier �‘08, a member of the energy assessment team, who conducted his senior honors thesis on questions relating to energy consumption by individual campus buildings. Eric mapped the energy use intensity of buildings and found that the three greatest users of energy per square foot are the Science Complex, Dana Engineering, and Bertrand Library. The buildings with the lowest energy use intensities are the Carnegie Building, Freas Hall, and the Weis Music Center. (See Figure 3.6) The most important factors determining the energy use intensity of campus buildings were identified as: 1) load composition, 2) usage schedule, 3) heating, ventilation, and air conditioning (HVAC) system configuration, 4) HVAC load size, and 5) construction date. (Fournier 2008, pp. 17-18.)
42

Figure 3.6. The energy use intensity of buildings on the Bucknell Campus. Bucknell has contracted Infometrics, an energy service company, to monitor the utility systems for the Athletic Center and the Science Center (as well as two other buildings). Infometrics has identified 69 action items at the Athletic Center, producing savings in excess of $120,000 per year and 34 items in the Science Center resulting in saving of $60,000 per year. Several conservation measures for the science center were identified in a 1999 study. Many of these have been implemented, including a major upgrade of the air handling system in 2008. Further upgrades of the lab hood system are currently being evaluated. Additionally, upgrades of portions of the Langone Center HVAC system were recently completed, and replacement of the heat pump system for Dana Engineering has been investigated, but has not been funded. Facilities has initiated an energy audit program to evaluate conservation measures in various buildings, starting with the largest users. An audit of Bertrand Library was completed in early 2008 and recommended improvements are being implemented. An audit of Taylor Hall has also been completed, with other buildings to follow. The Facilities Energy Team issues quarterly reports on the current status of energy conservation efforts on campus. These reports can be obtained by contacting the Bucknell Facilities Department.
43

Experimenting with Virtual Energy Consumption Through his honors thesis research, Eric Fournier �’08 took questions about Bucknell�’s energy consumption to a new level. Making the most of state-of-the-art computer technology, Eric saw an opportunity to employ Visual DOE, a software package developed by Department of Energy scientists, as a tool for experimentation with energy consumption in Bucknell�’s buildings. Using data and floor plans provided by Bucknell Facilities, Eric reconstructed several campus buildings in cyberspace, ultimately deciding to focus his efforts on Taylor Hall. Once he had incorporated all of the relevant characteristics of this building into a virtual model, including its envelope, HVAC system, and load characteristics, he was able to experiment with �“virtual renovations�” including: 1) reducing electrical loads through the use of energy efficient lighting and appliances, 2) replacement of single-pane windows with high-efficiency double-pane alternatives, and 3) adjustment of thermostat settings by 3 degrees Fahrenheit each season to reduce heating and cooling demands.
Three views of Eric�’s virtual reconstruction of Taylor Hall
The results were both encouraging and surprising. The model predicted that reducing the electrical load 20% through installation of energy efficient lighting and appliances would actually reduce the building�’s annual energy cost from $22,397 to $13,116, a difference of over 40%. Window replacement was predicted to result in an additional 11% cost reduction. However, the model actually predicted a slight increase in energy use for thermostat adjustments (Fournier 2008, pp. 29-30). Overall, the Visual DOE software proved itself to be useful planning tool, especially for estimating energy consumption by buildings for which installation of energy use monitoring equipment is prohibitively expensive.
44

Regulating heating and cooling A sufficient number of control points for the central regulation of heating and cooling exist only in buildings constructed or renovated within the past ten years, in which new control systems have been installed. Even in newer installations, central monitoring and regulation are provided primarily in classrooms, meeting areas, and other public spaces, not in student rooms or individual offices. All other rooms and buildings have only local controls. In buildings with newer controls, the temperature range is typically limited to 68-74 degrees. The Infometrics monitoring system has enabled Bucknell to identify a number of operational issues related to overheating/overcooling in certain spaces. There have not been any other systematic efforts to identify overheating or overcooling problems. The vast majority of the issues identified to date have been corrected through simple maintenance measures or improved control strategies. A few items have required modifications or additions to existing systems. As buildings are renovated, window, doors, and insulation are typically upgraded. Currently, there is also an annual program to replace windows in campus buildings. Although there have not been extensive efforts to evaluate energy savings associated with renovation projects, some of the data is very encouraging.
Lighting Approximately 50% of all interior lighting now consists of energy saving fixtures. Lighting is typically upgraded when existing buildings are renovated. High efficiency lighting is also incorporated into the design and construction of new buildings. In addition, several stand-alone lighting upgrade projects have been initiated or are planned. As a result, approximately 50% of T-12 fluorescent fixtures have been replaced with T-8 fixtures and approximately 50% of incandescent lamps have been replaced with compact fluorescent lights (CFL). Most recently, upgrades were completed in the following areas during the summer of 2008:
Computer Center 204 (T-8) Olin Science 165, 171, & 461 (T-8) Chemistry 009, 010, 240 & 240A (T-8) Roberts Hall East (CFL & T-8) Vaughan Lit �– Willard Smith Library (CFL) Public Safety (T-8) Biology 012 & 209 (T-8) Bertrand Library (T-8) approx. 75% complete Cooley Hall (T-8) Langone Center 207 (T-8)
In addition, over four hundred incandescent lamps were replaced with CFL by the custodial staff in the Elaine Langone Center during the �’07-�’08 winter break. Below in
45

Table 3.1 is Facilities lighting inventory as of 3-17-08, explaining which locations still have lower-efficiency lighting fixtures. Table 3.1: List of locations where T-12 fluorescent lamps and bulk incandescent lamps have not yet been replaced (as of 3-17-08). Incandescent T12 Locations 1. Weis Center Aud. and others rooms 2. Weis Music Aud. 3. Bostwick Cafeteria 4. Coleman Theatre 5. Vaughan Lit (Trout Aud.) 6. Samek Gallery 7. Larison Dining Hall 8. Art Building Drawing Room 9. Bucknell Hall 10. Carnegie
1. Taylor Hall 2. Gateways 3. Smith Hall 4. Larison Hall and Cottage 5. Elaine Langone Center 6. Biology Building 7. Rooke Chemistry 8. Olin Science 9. Dana Engineering 10. Marts Hall 11. Computer Center 12. Roberts Center 13. Art Building 14. Cooley Hall 15. Lowery House 16. Observatory 17. Freas Hall 18. Botany Building 19. SPE 20. Bertrand Library 21. Stadium 22. Weis Center
Other measures to reduce energy consumed by lighting Facilities personnel have recently been training to evaluate potential energy savings through the reduction of light levels based on usage and need. An audit of Bertrand Library identified numerous areas where de-lamping and fixture replacement would be feasible and cost effective. In order to maximize brightness, lighting fixtures that are accessible via a ladder are cleaned at least annually (typically during the summer). However, fixtures are cleaned more frequently when conditions warrant (e.g. areas where bugs are a problem). Fixtures that are not as accessible are cleaned as necessary to keep up their appearance and to maintain appropriate lighting levels. Some efforts have been made in the past to encourage staff and students to turn off lights when not in use, and a renewed educational effort was undertaken by the Environmental Club in 2007-08. Motion detectors for lighting control have also been tried in various locations in the past. However, most have been removed or disabled, due to safety, reliability, and other concerns. Building codes now require that occupancy sensors be
46

used to control lighting in meeting rooms, offices, and restrooms in all new and renovated buildings.
Appliances There are currently no written guidelines or standards delineating the purchase of energy-savings appliances at Bucknell. However, Facilities personnel are conscientious about looking for the most energy efficient, long-term, cost effective types of units when purchasing appliances for use on campus. For instance, Facilities looks at energy ratings for ranges/ovens and refrigerators/freezers when purchasing these items. Washers and dryers are provided and serviced in residential living areas by an outside vendor. There is no requirement for providing any energy-savings appliances as part of this contract although they are providing front loading washers in most areas of campus.
Energy Star appliances Recently under the American College and University Presidents Climate Commitment (ACUPCC) Bucknell agreed to begin purchasing Energy-Star rated appliances. This commitment was reiterated by President Mitchell during his 2008 Focus the Nation address in January of 2008 (Bucknell University News and Events 2008, �“Mitchell Announces Climate Commitment�”). However, this commitment has yet to be fully institutionalized as policy in all the areas of the University where appliance purchasing decisions are made. The next steps are the tasks of the Campus Greening Council, and that process is currently underway. Bucknell has not actively pursued becoming a partner in the EPA�’s Energy Star Program, as the University has already signed on to the President�’s Climate Commitment, and Energy Star goals are consistent with this program.
Energy consumption by computers, monitors, and printers Although the current bid process for these items does not specify energy-saving attributes, all of the computers that Library and Information Technology (LIT) buys are Energy-Star-rated. This applies to all of the Macs and PCs, including both desktop and laptop models. In addition, LIT has moved to replace nearly all of its cathode-ray tube (CRT) monitors with energy-efficient liquid crystal display (LCD) monitors. And, while not a formalized practice, printers also have power-save settings that are generally set at 30 minutes. Although no formal campaign has been pursued to encourage faculty and staff to power down computers when they are not in use, LIT is committed to educational efforts to promote the responsible use of computers, including turning off machines at night, placing them in stand-by mode, encouraging the use of power management features, and disavowing certain energy use myths. Some common misperceptions about computer energy use include the myths that turning off your computer is bad for the hard drive, that a computer consumes more power when rebooted than when left on, that screen savers save energy, or that turning off your office computer will cause maintenance and back-up problems.
47

Data from other institutions suggest that educational campaigns to turn off computers during breaks can be very successful. For instance, for Thanksgiving break 2002, Harvard launched a �“Go Cold Turkey�” competition in undergraduate houses and residence halls. Residents were encouraged to sign a pledge to switch off their appliances when leaving for the holiday and to minimize their energy consumption if they did not leave. Consumption of electrical energy was 329,000 kWh less than during a baseline week representative of the average. The second annual competition challenged students and employees on Harvard's Cambridge and Longwood campuses to turn off their computers, lights and appliances and turn down their heat during both the Thanksgiving holiday and rest of the year. Savings from the computer energy reduction alone were estimated at 50,000 lbs of CO2 and $45,000 for the year. The third annual Go Cold Turkey Competition resulted in more than 3500 pledges from students, staff and faculty, and in 2007 over 8000 people signed the pledge and made a commitment to take at least 5 actions to conserve resources at Harvard and beyond (Harvard Green Campus Initiative 2008, �“Sustainability Pledge�”).
How much energy is consumed by Bucknell�’s computers* each year? Faculty and staff desktops �– approximately 900 Faculty and staff laptops �– approximately 450 Lab, classroom, and research desktops �– approximately 930 Estimated laptop power use: 80 watts Estimated desktop power use: 120 watts for computer + 20 watts for LCD monitor = 140 watts total Estimated kilowatt-hours (kWh) used for desktops/laptops:
280 kWh/year for energy use for desktop computers with LCD monitors, operated 8 hours/day, 250 work days per year.
1,226 kWh/year for desktop computers left on continuously. 160 kWh/year for laptops operated for 8 hours per day, 250 work days per year. 701 kWh/year for laptops left on continuously.
Total energy consumption by computers if all are powered continuously: (1830 desktops x 1,226 kWh) + (450 laptops x 701 kWh) = 2,559,030 kWh/year Total energy consumption by computers if all are turned off when not in use: (1830 desktops x 280 kWh) + (450 laptops x 160 kWh) = 584,400 kWh/year Therefore, Bucknell could save an estimated 1,974,630 kWh electricity per year if all computers were turned off when not in use. * Due to a lack of data, students�’ personal computers were not considered in this calculation. However, it
is recognized that they represent a very significant number of computers, likely outweighing all faculty, staff, and lab machines combined.
48

Dormitory appliances In general, other than purchasing energy efficient appliances, there is nothing proactively being done to reduce electrical consumption of dormitory appliances. Electrical appliances prohibited in residence halls include refrigerators larger than 4.5 cubic feet; microwaves drawing more than 750 watts, personal appliances (hot plates, toasters, toaster ovens, George Forman grills, hot pots, oil popcorn poppers, etc.) drawing more than 400 watts, space heaters, and window air conditioners. Window air conditioners are permitted in some fraternity houses if the resident has medical justification signed by a physician. Facilities staff members do not check whether appliances have been disconnected over break periods and only note when circuits appear to be overloaded. It is notable that Penn State�’s environmental assessment conducted in 2000 discovered increased electrical appliance usage in residence halls contributed significantly to electrical energy consumption in campus. Their look at one residence hall found that resident computers, refrigerators, and personal lights, were the largest energy consumers. A Penn State junior conducted an inventory of all the plug-ins in ten double rooms in one of the residence halls (Beaver Hall), and found that a typical dorm room has 12 plug-in devices�—micro-fridge, television, VCR, computer, printer, alarm clock, CD player/radio, answering machine, video game unit, and several lamps/lights, with some rooms having as many as 19 plug-ins. Although no similar survey was done at for this assessment, the Penn State data suggests that dormitory appliances are likely to have a major impact on electricity consumption at Bucknell as well (Green Destiny Council 2000). Vehicles (See also �“Transportation infrastructure�” under Chapter 8, �“Built Environment�”). In FY 2009 Bucknell University owned 155 vehicles in total. A table listing all vehicles, including year, make, model, function, fuel type used, and approximate city and highway gas mileage figures is provided in Appendix IX. The FY 2006-2007 total gasoline cost for the university fleet was $159,241.57, a figure that has increased significantly over the past 10 years. Figures 3.7 and 3.8 below provide a summary of gas and diesel consumption over this time period. Emissions for the university vehicle fleet for FY 2006-2007 totaled at 652.58 tons.
Energy efficient and alternative fuel vehicles As of FY 2008, Bucknell had purchased two hybrid vehicles for use in the car pool fleet. (An additional hybrid vehicle was recently purchased by the Bucknell University Environmental Center in 2008 through a grant from the Degenstein Foundation.) Procurement Services, in conjunction with RICS and Facilities, determines what the vehicle needs are for the University�’s car pool, and looks for the most energy efficient vehicles that meet the needs of those using the car pool. A Sprinter bus, which uses diesel fuel, was recently purchased to augment the mini-bus portion of the car pool fleet. This vehicle is much more fuel efficient than the gasoline powered Dodge mini-buses that were purchased several years ago. Facilities also contacted the vendor who supplies
49

Gas Consumption
0
4,000
8,000
1997 1998 1999 2000 2001 2002 2003 2004 2005 2006 2007
Year
Gal
lons
48000
49000
50000
51000
52000
53000
54000
55000
56000
57000
58000
Golf Course GasCampus Gas
Figure 3.7. Gas consumption on main campus (right axis) and golf course (left axis).
Diesel Consumption
0
500
1000
1500
2000
2500
3000
3500
4000
1997 1998 1999 2000 2001 2002 2003 2004 2005 2006 2007
Year
Gal
lons
0
2000
4000
6000
8000
10000
12000
14000
16000
18000
Golf Course Diesel
Campus Diesel
Figure 3.8. Diesel Consumption on main campus (right axis) and golf course (left axis). the University�’s gas and diesel fuel to determine whether bio-diesel is a viable alternative at this time. While the vendor is now providing a 2% bio-fuel product for use in heating systems, a local distribution facility for vehicle bio-fuel products is not currently available. Propane-fueled, electric-powered and other alternative fuel vehicles are not being used on campus at this time.
50

Recommendations On the basis of the information gathered for this environmental assessment, the energy assessment team recommends that Bucknell do the following:
Consumption
Collect energy consumption benchmarks from peer universities, and share these, as well as discreet action plans for energy conservation, with the upper administration.
Support Facilities�’ goal of reducing energy use 2% per year over the next 5 years, for a 10% total decrease through the university budgeting process.
Secure funding to replace the heat pump system in Dana Engineering.
Implement the energy conservation measures identified by Facilities�’ audit process, particularly in the library.
Complete laboratory hood upgrades throughout campus, but particularly in the Biology and Chemistry buildings.
Sources
Decrease reliance on fuel sources that are subject to disturbance in supply and price, such as gasoline and natural gas resources. This can be accomplished through a higher use of renewable energy ON campus, not just through the purchase of green tags. For this reason, consider a bioreactor, wind projects, or photovoltaic panels on campus land. Also, continue participating with the Shared Services Consortium on developing a university owned sustainable energy facility.
Monitoring and regulation
Secure funding to improve metering on campus, so that every entry point of energy (heating/cooling and electric) in every building is monitored.
Increase capital funding to expand and upgrade building automation systems (BAS) to allow efficient temperature control of every room on campus. This should begin with classrooms and meeting spaces, eventually incorporating all offices and student rooms. A large amount of energy is used on inefficient heating/cooling through allowing individual occupants unlimited control of room temperature.
Add one to two support staff positions to improve monitoring and maintenance of existing and new BAS. These positions would also support expanded energy auditing, including implementing conservation measures.
Lighting
Assess the efficiency of outdoor lighting.
51

Replace ALL remaining incandescent and less-efficient fluorescent bulbs. Investigate LED technology for both indoor and outdoor lighting.
Complete upgrades identified by the lighting audit of the library in terms of de-lamping and fixture replacement.
Install motion detectors in meeting rooms, offices, and restrooms to control lighting and/or ventilation.
Appliances
Create a requirement that all outside vendors who provide mini-fridges, microwaves TVs, washers/dryers, etc to campus provide Energy Star-rated appliances.
Create a requirement that all HVAC systems that go in, including smaller A/C units, be Energy Star-certified.
Create a written requirement that all appliances purchased on campus be Energy Star-rated.
The Campus Greening Council should review Energy Star Partnership and lobby for President Mitchell to sign it.
Pursue lower-energy (and therefore lower cost) computer lab configurations, based on benchmarks of what other educational institutions do to maintain a high level of maintenance but a lower level of energy use.*
Educate the campus community regarding computer energy use in a clearly defined educational campaign
Require students to disconnect all electrical appliances over winter break, and ensure that Facilities staff members are enforcing this.
Encourage all students to bring only Energy Star-certified appliances to Bucknell.
Vehicles
Institute a policy requiring that all new vehicles purchased for use in the campus vehicle fleet (including the Car Pool, Public Safety, University Relations, etc.), use the most efficient fuel technology available consistent with the vehicles intended usage. If at all possible, vehicles should use electric or hybrid (gas/electric) technology. Otherwise, vehicles should be able to use available alternative fuels such as biodiesel, propane, natural gas, etc. Written justification should be provided for any new vehicle purchase that is exclusively powered by gasoline.
* See the University of Colorado Green Computing Guide at http://ecenter.colorado.edu/energy/projects/green_computing.html or the University of Buffalo Guide to Green Computing at http://ubgreen.buffalo.edu/content/programs/energyconservation/guide_computing.html for more information.
52
Identify local sources and support local biodiesel production through purchase for all on-campus use.
Replace all vehicles in the public safety fleet with electric or hybrid vehicles.
Replace current mini-busses with Sprinter buses.
Recommendations for future monitoring It is imperative that we improve our metering in every building, so that it is possible to monitor energy use by building and use this as a trouble-shooting tool. Additionally, the Facilities Energy Team should continue to provide quarterly reports on energy at Bucknell, and on current and upcoming renovation projects. These reports should be provided for comment to the Greening Council.
53

Chapter 4. Water
54

Although in the temperate region of the northeastern United States our water supply may appear to be endlessly abundant, the global water picture is much less encouraging. Aquifer depletion and water contamination are taking place at unprecedented rates, and many priceless ecosystems are in decline. Regionally speaking, the quality of the Susquehanna River watershed has been compromised by such anthropogenic impacts as acid mine drainage, agricultural runoff, storm water runoff, legacy sediments, and discharge from municipal sewage treatment plants, to name just a few. Some of these impacts become magnified as the water travels downstream to the Chesapeake Bay, our nation�’s largest estuary. With the Susquehanna River right on Bucknell�’s doorstep, it is particularly appropriate for the University to examine its own practices affecting water consumption and water quality.
Water consumption Water for use on the Bucknell campus originates from two sources, the Pennsylvania American Water Company located in Milton, PA, and on-site well water which is pumped into a golf course pond for use in irrigation. (See Table 4.1 and Figure 4.1 below.) Table 4.1. Annual water consumption on Bucknell campus.
Year
Annual Water From PAWC
(Gallons)
Annual Well Water To Irrigation Pond -
Golf Course (Gallons)
Annual Water Usage - Total
(Gallons) 2000 98,845,206 * 98,845,206 2001 99,177,593 * 99,177,593 2002 93,770,938 * 93,770,938 2003 95,309,491 3,012,911 98,322,402 2004 96,530,509 2,150,989 98,681,498 2005 97,180,952 13,257,221 110,438,173 2006 100,840,374 6,719,538 107,559,912 2007 96,319,650 13,533,873 109,853,523
* Data not available - Well water was not metered prior to 2003. Bucknell�’s annual water consumption from Pennsylvania American Water Company has been consistent since 2000, varying on average 1.8%. (Data for Bucknell�’s water consumption was not available for years prior to 2000.) Bucknell�’s per-capita water consumption has decreased slightly over the years but still remains fairly consistent at approximately 20,000 gallons per person per year in 2007. (See Table 4.2 and Figure 4.2). However, as with the per-capita consumption of energy it would be more accurate to calculate water use on a �“scaled campus user�” basis, with faculty and staff counting as 0.25 resident. On this �“scaled�” basis, the per capita water use is approximately 25,000 gallons per person per year. The cost of providing this water has risen steadily over the past eight years, from $415,000 in 2000 to $541,000 in 2007 (See figure 4.3).
55

Figure 4.1. Annual water consumption on Bucknell Campus. Table 4.2. Per-capita water consumption (excluding golf course irrigation).
Year *Annual Water Usage
(Gallons) Number of Students Number of Faculty,
Staff, Administration
Water Usage per
Person (Gallons)
2000 98,845,206 3,513 1,088.7 21,479 2001 99,177,593 3,523 1,092.3 21,489 2002 93,770,938 3,523 1,109.0 20,245 2003 95,309,491 3,595 1,122.8 20,201 2004 96,530,509 3,544 1,186.3 20,406 2005 97,180,952 3,583 1,129.7 20,620 2006 100,840,374 3,645 1,162.0 20,980 2007 96,319,650 3,605 1,211.1 20,000
* Does not contain water usage for well water used for irrigation on golf course.
Figure 4.2. Per-capita water consumption (excluding golf-course irrigation).
56

Figure 4.3. The annual cost of water provided to Bucknell campus by Pennsylvania American Water Company.
Water consumption monitoring The majority of rental houses, office houses, and fraternities all have individual water meters recording usage. Additionally, some major buildings on campus have water meters, including Breakiron Engineering, Biology Building, Rooke Chemistry, Langone Center, Weis Center for Performing Arts, and the Powerhouse/Co-generation Facility. The remaining buildings are fed from one of several water mains throughout campus. The water mains have individual meter pits before branching off to various buildings. In all only 31% of the buildings are individually metered. A complete account of water meters by building is provided in Appendix X.* Bucknell�’s largest water consumer is the Powerhouse/Co-generation Facility for the generation of steam and chilled water. Rooke Chemistry is the next largest user due to the two cooling towers for the two absorption chillers in the building. The Langone Center and Recreation Center�† follow as the next highest users before the larger Residence Halls. Unfortunately, residence halls do not have individual meters to determine which consume the most water.
Water use for heating and cooling The majority of buildings on campus use water for heating and cooling purposes. Eighty-three percent use water or steam for heating, while fifty-one percent of the buildings with air-conditioning on campus use water for cooling. A complete account of water-use for heating and cooling by building is provided in Appendix X. Table 4.3 summarizes the water usage for heating and cooling on campus, which includes make-up water for cooling towers, make-up water for chilled water, and make-up water * All meters used on campus are the property of Pennsylvania American Water Company. �† Additionally, the pool holds one million gallons of water and is drained once every 5 years for maintenance. Due to conservation efforts this period will probably be extended to once every 7 years.
57

for steam. The make-up water used for cooling towers is lost either as evaporation or blow-down from the cooling towers. (Blow-down is water drained from equipment in order to remove mineral build-up.) Make-up water for the chilled water loop is a result of leaks or maintenance, which requires occasional draining. Lastly, make-up water for steam is required to replace water lost through steam leaks, boiler blow-down, and condensate not returned to the boilers. Lastly, and not shown in the table, is water used to fill localized heating and cooling systems in buildings when they are drained for repair. This data is not captured, and on a whole, is small compared to the steam and cooling tower water usage. In total, approximately 26% of the total water consumption on campus goes toward heating and cooling purposes. Table 4.3. Summary of water consumption for heating and cooling.
Plant Make-up Water for Cooling Towers
(Gallons)
Plant Make-up Water For
Chilled Water (Gallons)
Plant Make-up Water For
Steam (Gallons)
Campus Total Water
Consumption (Gallons)
% of Total Water Used For
Heating & Cooling
2001 9,545,645 * * 98,845,206 * 2002 12,647,416 128,300 12,201,090 99,177,593 25.2% 2003 11,927,214 28,900 9,949,930 93,770,938 23.4% 2004 15,057,583 30,800 10,858,208 96,530,509 26.9% 2005 16,397,988 62,600 10,720,262 97,180,952 28.0% 2006 13,923,539 77,000 9,815,169 100,840,374 23.6% 2007 15,353,447 47,100 10,890,780 96,319,650 27.3%
Average 25.7% * Data not available.
Water is only added to the heating or cooling system when the system is drained for maintenance or a leak is present, and drainage is kept to a minimum. Bucknell Facilities tries to use free cooling as much as possible. However, the majority of time temperatures require the cooling towers to be running, increasing the rate of evaporation and the overall water usage. Additionally some water needs to be blown down from the towers to remove deposits, debris, etc. The condensing water is tested frequently and the blow-down adjusted to the minimum capable of producing good water. Numerous efforts are underway to eliminate steam leaks, return more condensate, and reduce thermal losses through insulation of pipes. The Bucknell Facilities Energy Team is beginning to assess these items on a building by building basis.
Water leaks The university has a computerized maintenance management system (CMMS), which is utilized to communicate leaks and track when leaks are repaired. Persons who identify leaks should write a work order (or notify a person capable of writing a work order) to fix the leak. These work orders are managed and executed by Facilities. If the leak is an emergency, the physical plant will be notified via radio or phone call, and Facilities maintenance personnel will respond accordingly. Additionally, Facilities administrative
58

assistants regularly review the monthly water bills to determine if any are out of ordinary, although the review is not detailed or formalized.
Irrigation Regularly irrigated areas on campus include the golf course and athletic fields, namely the practice field next to Christy Mathewson Stadium and the West Fields. Water is applied to these areas using a Toro pop-up sprinkler system. The total irrigated acreage is 58 acres, or approximately 13% of the Lewisburg campus. Some water is also applied to ornamental plantings when required, but the volume of water used for this purpose is negligible compared to the routine irrigation, is not tracked, and does not use an irrigation system. While no formal policies exist regarding campus irrigation, the prevailing mindset is to use as little water as possible to maintain the irrigated areas. Table 4.4. Annual volumes of water used in irrigation of athletic fields and golf course.
Athletic Fields - Irrigation (Gallons)
Golf Course - Irrigation (Gallons)
Total - Irrigation (Gallons)
2001 1,500,484 10,100,330 11,600,814 2002 2,036,500 6,428,900 8,465,400 2003 182,000 3,246,790 3,428,790 2004 155,700 2,695,040 2,850,740 2005 1,605,488 11,474,100 13,079,588 2006 650,200 6,997,670 7,647,870 2007 739,080 12,674,460 13,413,540
Water conservation measures According to the Pennsylvania Department of Environmental Protection (DEP), under Act 220, �“All persons who withdraw more than 10,000 gallons per day on a 30 day average must register their water sources and withdrawals with DEP. Annual reporting provides valuable information that will be used in a planning effort to preserve and protect our water resources for current and future Pennsylvanians." In accordance with this act, Bucknell submits the required information to the DEP, and when any drought levels are announced, such as drought watch, drought warning, or drought emergency, the University is subject to water restrictions based on the reported data. While there have been occasional drought watches, no drought emergencies or water shortages requiring conservation measures have occurred during the past 5 years. As of now, state and county mandates are the de facto policies for water conservation measures at Bucknell. Act 220 requires Bucknell to have a drought emergency plan for the campus, and the University must follow this plan under drought conditions, but otherwise there are not any regulations as to how much water can be used. Although the Pennsylvania American Water Company occasionally sends notices to domestic water users requesting voluntary water conservation measures, these requests do not apply to large water users who must instead adhere to the drought emergency conservation plan.
59

Appliances and fixtures Currently low-flow shower heads and toilets are used in some buildings, but there is no standardization of such water-saving devices. As buildings are renovated, water-saving fixtures are put in place as required by the plumbing code, which calls for the use of low-flow fixtures. The number of low-flow fixtures installed each year varies depending on which buildings are being renovated. (There is usually a 5-year plan for renovations.) Fixtures replaced as part of routine maintenance are exchanged with low flow substitutes wherever possible. Additionally, some fixtures have been replaced by special request, such as in Taylor St. House where students have created an environmentally-themed living environment. Bucknell Facilities generally accommodates these requests. The low flow requirements in the plumbing code were set by the Energy Policy Act of 1992. Assuming that since 1992 Bucknell has installed all new low flow fixtures during renovations, we can approximate that the square footage of buildings on campus with low flow fixtures is at least 32.9% of the total. The actual square footage with low flow fixtures is most likely higher as Facilities has continually replaced old fixtures with new low flow fixtures each year. However, this progress has not been tracked and a detailed study per building is recommended. Table 4.5 shows the typical water flow through standard fixtures, low flow fixtures, and best available fixtures. As far as appliances are concerned, Don Krech, director of procurement services, reports as of January 2006 all residence halls had converted to front-load machines. Each front loading machine uses 1/3 of conventional washer which is typically 40 gallons for older models. Table 4.5. Water flow rates through different types of fixtures.
Fixture Old Flow Requirements
Low Flow Requirements
Best Available Flow Requirements
Toilet 3.5 gpf 1.6 gpf 0.85 gpf Urinals 3 gpf 1.0 gpf Waterless �– 0 gpf
Lavatory Faucets �– continuous flow Up to 4 gpm < 2.2 gpm 0.38 gpm
Lavatory Faucets �– self closing ? 0.25 gallons per cycle 0.25 gallons per cycle
Shower Heads 5-8 gpm 2.5 gpm @ 80 psig or 2.2 gpm @ 60 psig 1.5 gpm
*Flow requirements obtained from US Dept. Of Energy�’s Energy Efficiency and Renewable Energy / Federal Energy Management Program. **The low flow requirements above are that required by the Energy Policy Act of 1992.
Water sources for the campus Bucknell University�’s water is supplied by Pennsylvania American Water Company�’s White Deer facility, which is located in Milton, Pa. Pennsylvania American White Deer serves a population of 29,816 in Northumberland County and the Lewisburg area. The water is drawn from three different waterways; Spruce Run Creek, White Deer Creek, and the Susquehanna River. All three of these are surface water sources. Bucknell is
60

served by the College Park pump station, built in the 1960�’s. It is an in-ground station and has two pumps. Spruce Run Creek is one of the older sources, established before 1930 (see Figure 4.4). The approved allocation amount for this source is 5,000,000 gallons per day, which is also the amount that has been determined as the safe yield. The safe yield is defined as the maximum quantity of water which can be withdrawn continuously from a surface or ground water source without ultimate depletion of the source, considering intrusion of water of undesirable quality, interference with existing water sources, and minimum downstream flow requirements. The pumping capacity for Spruce Run Creek is greater than both the allocation amount and the safe yield, at 6,000,000 gallons per day. White Deer Creek was also established before 1930, and is the smallest of Bucknell�’s three sources. It has an approved allocation amount of only 3,000,000 gallons per day, and a safe yield of 3,000,000 gallons per day as well. The pumping capacity for White Deer Creek is 6,000,000 gallons per day, much greater than the amount that is actually available to be pumped. The Susquehanna River is the largest of the three sources to that provide Bucknell with its water supply. It was established between 1960 and 1969, so it is much newer than the other two sources. The approved allocation amount for the Susquehanna River is 6,000,000 gallons per day. The pumping capacity is 8,500,000 gallons per day. Since the Susquehanna River is a much larger source than both White Deer Creek and Spruce Run Creek, the safe yield is much larger, at 254,000,000 gallons per day.
Figure 4.4. Spruce Run Reservoir, one of three sources of Bucknell�’s drinking water.*
* Photo by Brent Kline, available from http://www.panoramio.com/photo/5625392 .
61

Water quality on campus Water supplies, after removal of water from natural systems and treatment for consumption, are subject to additional regulation by PA-DEP through direct monitoring of water coming from White Deer Pump Station to our municipal supply. These waters are checked for bacteria, chloride, color, fluoride, iron, manganese, nitrogen (NO2 and NO3), phenolic compounds, sulfate, and total dissolved solids.
Water quality standards Potable Water Supply Water Quality Standards (from Pennsylvania Code, Title 25, Chapter 93) include the following:
Bacteria �– max 5000 coliforms/100 mL as monthly average, 20000 coliforms/100 mL in fewer than 5% of samples
Chloride �– maximum 250 mg/L Color �– maximum 75 units on platinum-cobalt scale Fluoride �– maximum daily average 2.0 mg/L Iron �– maximum 0.3 mg/L as dissolved Manganese �– maximum 1.0 mg/L as total recoverable Nitrite + nitrate �– maximum 10 mg/L as nitrogen Phenolic compounds �– maximum 0.005 mg/L Sulfate �– maximum 250 mg/L Total dissolved solids �– 500 mg/L as monthly average, maximum 750 mg/L
There are many monitoring requirements for all of these water sources to ensure that the water distributed from them is safe and does not contain any contaminants. There is a list of contaminants that are monitored (which can be viewed on the Environmental Protection Agency�’s Drinking Water Reporting System website), such as chlorine, total organic compounds (TOC), turbidity, barium, etc. These different contaminants each have different monitoring frequencies, ranging from continuous monitoring to monthly and quarterly monitoring, to even monitoring every few years. The number of samples taken to test for these contaminants varies as well. Some contaminants require up to 30 samples, however the majority only require one or two samples to be taken. According to the Environmental Protection Agency (EPA), Bucknell�’s water supply has no health-based violations (EPA 2009, �“Safe Drinking Water Information System�”). Health-based violations occur when �“the amount of contaminant exceeded safety standard or water was not treated properly.�” However, according to the National Tap Water Quality Database, contaminants were found in the PA American White Deer water sources. The tap water was tested from 1998 through 2002, and five pollutants were found, three of which were above health based limits, however they did not exceed the legal limits. These contaminants are atrazine (which is an herbicide used on crops), total haloacetic acids (dichloroacetic acid, trichloroacetic acid, monochloroacetic acid, monobromoacetic acid, and dibromoacetic acid), and total trihalomethanes (Environmental Working Group�’s 2009).
62

What can be said about the long-term integrity of Bucknell�’s water supply? According to Bucknell�’s resident aquatic ecologist, Professor Matt McTammany, the outlook is mostly positive. Spruce Run and White Deer Creek are both heavily forested and contain large amounts of protected State Forest Land in their watersheds, upstream of the reservoir and water withdrawal points. It is therefore unlikely that there are any threats to the drinking water sources in these streams. Although still susceptible to episodic problems, primarily during storms, West Branch Susquehanna River has actually been improving its water quality over the past decade or so. This trend is likely to continue due to major efforts to treat mine drainage, to manage agricultural runoff, and to improve sewage treatment systems throughout the Susquehanna River watershed. Pennsylvania Department of Environmental Protection maintains a list of waterways in the state along with �“designated uses�” for each waterway (Commonwealth of Pennsylvania, Pennsylvania Code, Title 25. Environmental Protection, Chapter 93. Water Quality Standards). Minimum standards for a variety of water quality metrics depend on the designated use for a particular waterway. For example, minimum dissolved oxygen concentrations must be much higher in a stream designated for supporting �“cold-water fishes�” than in a stream designated to support �“warm-water fishes�”. Special protections may be given for the highest quality or biologically important waterways in the state. Spruce Run and White Deer Creek are designated �“high-quality cold-water fishery�”, and West Branch Susquehanna River is designated �“warm-water fishery�”. Protections related to aquatic life uses are based on maintaining healthy populations of particular types of organisms and relate to water chemistry, temperature, and oxygen availability. Spruce Run is achieving its designated use as a high-quality cold-water fishery. White Deer Creek is also achieving its designated use for most of its length, but is designated impaired in the downstream by mercury contamination (as assessed 2004, with no identifiable source). West Branch Susquehanna River is also listed as impaired by mercury (as assessed in 2002) and polychlorinated biphenyls (as assessed in 2004, again with no identifiable source). In addition, based Professor McTammany�’s own research, the river is highly productive, transports tons of nutrients and sediments, and suffers from periodic bacteria problems (sewage treatment plant overflows, fish kills from bacterial infections). A �“Susquehanna River Assessment�” has been proposed, but any river of this size almost needs to be considered against itself over time and will require repeated assessment to determine patterns and improvements.
63

Wastewater Bucknell�’s wastewater production is measured and billed for treatment according to the University�’s water consumption. Bucknell is credited for water used for make-up in the Rooke Chemistry and Power Plant cooling towers as well as for water used for practice field and golf course irrigation. Bucknell�’s wastewater flows to Lewisburg Area Joint Sewer Authority (LAJSA) for treatment and is subsequently released into the Susquehanna River. Table 4.6 estimates the annual quantity of wastewater charged to Bucknell by the Lewisburg Area Joint Sewer Authority (LAJSA). Over the past eight years, the cost of wastewater treatment has varied from a low of $211,000 in 2003 to a high of $401,000 in 2006 (See Figure 4.5). Table 4.6. An estimate of the annual volume of wastewater produced at Bucknell and treated by the LAJSA. The actual LAJSA data is currently unavailable.
Rooke Chemistry
Cooling Tower - Water
Consumption (Gallons)
Physical Plant Cooling
Tower - Water Consumption
(Gallons)
Practice Field Irrigation
Water Consumption
(Gallons)
Campus Total Water
Consumption (Gallons)
Total Wastewater (Gallons)
2001 * * 492,600 98,845,206 98,352,606 2002 4,086,400 734,000 1,207,000 99,177,593 93,150,193 2003 5,340,500 638,500 60,800 93,770,938 87,731,138 2004 5,163,600 769,500 0 96,530,509 90,597,409 2005 6,259,800 1,059,900 182,320 97,180,952 89,678,932 2006 5,122,000 664,900 30,100 100,840,374 95,023,374 2007 3,093,000 863,500 * 96,319,650 92,363,150
* Data not available
Figure 4.5. The annual cost of wastewater treatment.
64

Wastewater treatment process The Lewisburg Area Sewage Treatment Authority (LAJSA) operates a sewage treatment plant (STP) at College Park under the National Pollution Discharge Elimination System (NPDES) permit number PA0044661, which was originally issued in January 1981 and was renewed in January 2008. The LAJSA College Park STP is a secondary treatment facility designed to reduce biochemical oxygen demand of wastewater prior to discharging it to a receiving waterway, the West Branch Susquehanna River in this case. Biochemical oxygen demand (or BOD) is a measure of how much oxygen must be consumed by organisms to digest or decompose the amount of organic material in a fluid medium. BOD is high in sewage and historically caused serious ecological harm (fish kills, disease, and anoxia) to receiving water bodies prior to the use of sewage treatment facilities. The College Park STP digests incoming organic material in municipal wastewater using activated sludge in a plug-flow system. Biosolids are then removed from the mixed �“liquor�”, dehydrated, stabilized, and stored. Prior to discharging the treated liquid, effluent is sterilized with chlorine. The plant is permitted to release 2.42 million gallons of treated effluent per day but operates at approximately 1.1 million gallons per day from September through May and approximately 0.7 million gallons per day over the summer months. LAJSA also holds a permit for distributing its collected biosolids as industrial or agricultural fertilizer through the �“beneficial use of non-exceptional quality sewage sludge by land application�” program. These dehydrated and stabilized biosolids are transported from College Park to two farms in the area and have been used without complaint for over 15 years (W. E. Drasher, Plant Manager, personal communication).
Ecological impact of wastewater Permitted discharges are monitored regularly for flow, pH, total suspended solids, nitrogen (total, as NH3, as NO2+NO3), phosphorus (total), chlorine, fecal coliform bacteria, total coliform bacteria, and biochemical oxygen demand (BOD) by state regulatory authorities. The College Park STP has not received a violation since 2002. Despite its not receiving any violations, the water from the STP has high chlorine concentrations as a result of the sterilization process at the end of sewage treatment. In addition, the water leaving the plant contains high concentrations of nitrogen and phosphorus. Each of these pollutants is rapidly diluted by the volume of water in the Susquehanna River, particularly during high seasonal base flows in winter and spring. Technology exists to reduce nutrient loads from sewage treatment facilities and is being made mandatory on all major sewage treatment facilities in the Chesapeake Bay watershed. LAJSA will be constructing a $9.5 million nitrogen and phosphorus removal system using sand filtration on its College Park plant, which should be operational by September 2010 W. E. Drasher, Plant Manager, personal communication). Ultimately, the College Park STP performs its designed function to reduce BOD and avoid contaminating receiving waters with bacteria from human sources or the sewage treatment process itself. The addition of nitrogen and phosphorus removal will provide an important added stage in the treatment of Bucknell�’s wastewater by the College Park STP.
65

Storm water Impervious surfaces, such as buildings, roads, and parking lots, comprise approximately 40% of Bucknell�’s main campus, which includes all of the campus to the east of Route 15. If the west campus and golf course are included, the figure is much lower, at 19%. (For a full accounting of built vs. open space on campus, see Chapter 9, �“Landscape�”.) The majority of storm water shed by impervious surfaces on campus is channeled through the storm drain system to Miller Run, which empties into Bull Run and then into the Susquehanna River. The remainder of Bucknell�’s storm water is channeled directly into the Susquehanna River. The planning, design, and construction team of Bucknell Facilities is the primary group working with storm water management on campus. The campus has a few storm water collection structures including one at West Fields, one at the Golf Course, one in the parking lot behind Fraternity Road, and one underground structure adjacent to the O�’Leary Building. These structures are designed to slow down the flow of storm water and reduce flooding, but generally do not serve the purpose of recharging ground water. Storm water is a significant source of water pollution, as it carries with it contamination washed from the surface including fertilizers, pesticides, road salt, petroleum residues, sediment from construction sites, and others. (For a full accounting of pesticides and fertilizers used on campus see Chapter 9, �“Landscape�” and Appendix XV). Very few measures have been taken to improve the quality of storm water runoff at Bucknell, although the Campus Master Plan does call for a more progressive approach to handling storm water in conjunction with the creation of a Miller Run greenway (Shepley Bulfinch 2008, p. 30).
A number of sites enable direct access of road runoff to Miller Run (e.g., Loomis Road bridge). In order to reduce the amount of sediment and chemicals entering the stream and to slow the pulse of storm flow, these points of direct storm water entry must be reduced and replaced with systems designed to retain and filter water. Cleaner water can then be released more slowly to Miller Run, or even better, to its watershed and aquifer. An added approach would be to reduce the amount of water draining to these direct access points by distributing devices throughout the watershed for retention and filtering of storm water. Essentially, Bucknell University needs to consider a basin-wide approach to storm water management if it hopes to reduce flooding and improve water quality conditions in Miller Run. Most problems associated with storm water derive from �“developed�” parts of campus, primarily east of Route 15. More specific suggestions for improvements are provided in the �“Recommendations�” section of this chapter.
Miller Run*
Miller Run drains 2.32 sq km of land in Union County, approximately 80% of which is owned by Bucknell University. As a result, the activities of our campus and grounds * The research in this section is derived from Alison Schaffer�’s Honors Thesis in Environmental Studies (Schaffer 2008) conducted under the direction of Professor M. E. McTammany, who wrote this summary.
66

have a significant effect on water quality and ecology of this stream. Specifically, Miller Run will receive runoff from the application of fertilizers and pesticides on the golf course, lawns, and athletic fields along with direct transport of chemicals applied to roads and parking areas. Impervious surfaces associated with the university campus also dramatically alter the hydrology of Miller Run watershed, causing severe changes in the response of Miller Run to storms and snow melt. We studied hydrology and water quality of Miller Run from fall 2007 through spring 2008 to assess the impact of campus on Miller Run. We monitored 2 sites along Miller Run, one upstream of Route 15 at the entrance to the Art Barn and another downstream of campus at the Hunt Hall Parking Lot. Gages to monitor stream stage were installed at each site, and each site was repeatedly sampled during base flow and during storm flow. In general, Miller Run suffers from moderate nutrient loading, heavy sediment loading, channelization and bank incision, unstable flow regime, water withdrawal for irrigation on the golf course, and inadequate natural forested vegetation in streamside areas. At base flow, water quality conditions were similar between sites in Miller Run. However, the impacts of impervious surfaces on campus were evident during storms. Stage and water quality changes were measured extensively during a single storm event in late February 2008. Peak flows were much higher and arrived earlier at the downstream site than at the upstream site during storms, which is completely backwards from normal stream behavior. Typically, high flows propagate downstream during storms, with higher and earlier peaks (more �“flashy�” hydrographs) in upstream reaches. Impervious surfaces on campus cause extremely rapid, direct flow of storm water to Miller Run, which leads to flashy conditions near Hunt Hall (see figure 4.6).
0
0.02
0.04
0.06
0.08
0.1
0.12
0.14
0.16
0.18
12:00 AM 2:24 AM 4:48 AM 7:12 AM 9:36 AM 12:00 PM 2:24 PM 4:48 PM 7:12 PM 9:36 PM 12:00 AM
Time
Dis
char
ge (m
3/s)
Upstream (by Art Barn)
Downstream (by Hunt Hall)
Figure 4.6. Hydrograph of Miller Run during a storm event in late February 2008, with insets showing Alison Schaffer at the two sampling sites. The fact that the downstream discharge (blue) peaked before the upstream discharge (pink) indicates human disturbance to the watershed (Shaffer 2008).
67

This storm water also transports large amounts of sediment and chemicals. Total suspended solids (TSS) reached over 150 mg/L and peaked prior to discharge at the downstream site during the February storm (see Figure 4.7). Interestingly, TSS also increased to 100 mg/L at the upstream site, most likely due to a construction site along Beagle Club Road in the headwaters, but this peak occurred much later in the storm. Specific conductance, a measure of total dissolved solids, increased from 500 to 4000
S/cm at the downstream site but only reached 800 S/cm upstream during the rain storm. Most of the ions causing this increase in conductivity were associated with road salts applied on campus during winter (sodium, potassium, chloride). As an example, chloride peaked in less than two hours during the storm at 600 mg/L at the downstream site and only reached 50 mg/L three hours into the storm. Other chemicals were diluted by storm flow, namely those chemicals most abundant in groundwater whose source is weathering of bedrock materials (calcium, magnesium). Nutrients (nitrogen, phosphorus) also increased in concentration during the storm. Ammonium (a reduced form of nitrogen common in fertilizers and animal wastes) peaked close to 4 mg/L at the downstream site during the storm while only reaching 0.6 mg/L at the upstream location. Phosphorus concentrations were similar and increased at both sampling locations during the storm to high values near 20 g/L. Heavy metals showed erratic spikes at both sampling locations. Stream pH decreased during the storm at both sites because rainwater in central Pennsylvania is acidic (near 4.5), but overall pH remained above 7 due to buffering by underlying carbonate rocks. During our study, we observed several additional insults of note to Miller Run watershed and water quality. The construction along Beagle Club Road obviously contributes large amounts of sediment to Miller Run during storms, as evidenced by the reddish tint to TSS at the upstream site. TSS was black and gray from road runoff at the downstream site early during storms and turned brown and red later, as upstream sediments reached downstream areas (see Figure 4.7 inset). In addition, Bucknell uses Miller Run as a receiving system for water pumped from its steam system. While this is not normally an issue, a broken pump can allow water to fill the steam access manholes and reach very high temperatures (in excess of 80 °C). On 10 March 2008, we observed very hot water being pumped directly into a storm drain at the intersection of 7th Street and Moore Avenue. This water increased temperature in Miller Run several degrees and added large amounts of salts from the accumulated runoff in the manhole. Lastly, maps and historical records suggest that Miller Run has sustained perennial surface flow, even during droughts. However, more recent observations (including currently) demonstrate that the channel regularly dries during low flow periods of late summer and early fall. Without performing the modeling necessary to confirm this idea, we feel that the recent onset of drying in the stream channel is caused by pumping groundwater from the source aquifer in upstream parts of Miller Run watershed. Bucknell University golf course irrigates 42 acres of property from 2 pumps operating to remove millions of gallons of water per year from the aquifer (12.7 million gallons in 2007). Most of this irrigation occurs during dry periods of summer. This withdrawal complies with Act 220 of the PA Department of Environmental Protection (and is monitored by Susquehanna River Basin
68

Commission), but the onset of pumping in 2001 coincides clearly with dry periods in Miller Run. While some of the water used for irrigation will return to Miller Run, it seems likely that enough is lost as evapotranspiration following irrigation to reduce base flows in Miller Run and cause intermittent drying. If Bucknell University continues to treat Miller Run as nothing more than a drainage ditch, it will remain an eyesore and a flood hazard to campus.
-20
0
20
40
60
80
100
120
140
160
180
12:00 AM 4:48 AM 9:36 AM 2:24 PM 7:12 PM 12:00 AM
Time
TSS
(ppm
)
Upstream (by Art Barn)Downstream (by Hunt Hall)
Figure 4.7. Total suspended solids in Miller Run during a storm event in late February 2008. The inset shows the variation in actual sediment samples taken from the stream. The different colors indicate different sources (Schaffer 2008). Further information and analysis can be found in Alison Schaffer�’s honors thesis (Schaffer 2008).
Recommendations The water assessment team recommends the following actions with respect to the consumption and handling of water on campus:
Water consumption
Establish a water use awareness program; include effects of heating and cooling on water usage as well.
Investigate ways to capture more condensate from steam.
Install individual water meters on buildings, specifically residence halls and heavily used student buildings such as KLARC and LC. Use metered data to identify water savings opportunities.
Irrigation
Continue to audit and minimize irrigation.
69

Investigate alternative sources of irrigation water, such as rainwater collection, gray water, and other non-potable water supplies.
Appliances & fixtures
Conduct an appliances survey for every building on campus to include all fixtures and appliances. Recruit the Environmental Club or student interns to conduct the above inventory and a water use survey (possibly as part of the water conservation campaign).
List the number of water-saving appliances and non-water-saving appliances in each building (for shower heads, toilets, washing machines, dishwashers).
Create a list of all of the water-saving technologies that could be used in replace of the older technologies and/or for new buildings on campus.
Calculate the costs and payback periods of changing over to these newer appliances and/or adding water-saving appliances to new buildings.
Develop standards for all new and replaced water fixtures.
Wastewater
Determine actual wastewater amounts from sewer authority and track over past 10 years
Try experimental approaches to reuse of wastewater on an educational scale.
Storm Water
Determine how the proportion of campus covered with impervious surfaces has changed over the past 10-40 years using aerial photos or historic photos available in the library
Work toward the following goals to improve storm water management:
1. Slowing the pulse of storm flow
2. Increasing groundwater recharge
3. Decreasing the amount of sediment and chemicals reaching stream
4. Increasing channel capacity to limit damage during high flows
Consider the following methods to achieve goals 1-3: rain gardens, curb cuts, retention basins, passive flow wetlands, cisterns, French drains, semi-pervious surfaces.
Consider the following methods to achieve goal 4: channel modifications, removal of channelized sections, terraced floodplains, on-channel wetlands.
Other ideas for ecological improvement
Maintain minimum base flows in Miller Run (by limiting groundwater pumping during sensitive seasons).
70

Restore riparian vegetation.
Measure pesticides and petroleum-based residues in Miller Run.
Use research in the stream restoration course in spring 2009 to develop restoration plan for Miller Run.
Confirm the impairment status of Miller Run with the Department of Environmental Protection.
71

Chapter 5. Waste
72

Municipal solid waste and hazardous waste have a number of adverse environmental impacts, most of which are well known and not in need of elaboration. Municipal solid waste sent to the landfill takes up large amounts space that could otherwise serve better uses, such as farmland or wildlife habitat. Buried waste contains harmful contaminants that leach into soil and water supplies, and also produces greenhouse gases contributing to global warming. Furthermore, solid waste represents wasted material resources that could otherwise be channeled into better service through recycling, repair, and reuse. Hazardous waste represents significant risks to human health and ecological integrity and often persists in the environment leaving a legacy of land and water contamination for generations. Many hazardous materials accumulate in the tissues of organisms and become concentrated within food chains, leading to cancer, endocrine disruption, birth defects, and other tragedies. The minimization and safe handling of waste materials are essential to a sustainable university and the long-term health of the planet.
Production and disposal In 2007, the University produced and disposed of approximately 1420 tons of solid waste through its day-to-day operations. This figure represents a 10-year low, down 13% from the maximum figure of 1630 tons in 1998. Although waste has varied considerably from year to year, the trend in waste disposal on campus is clearly in the downward direction over the past 10 years (See Figure 5.1). In per-capita terms, the waste generated in 2007 amounts to approximately 662 pounds per person on campus, using calculation standards set by Recyclemania, a yearly recycling competition in which Bucknell has participated for the past three years*. The University hauls its own waste to the Lycoming County Landfill, approximately 17 miles from campus. Lycoming Landfill has about 5 years of capacity remaining. However, Lycoming County Resource Management Services (LCRMS) recently received approval from the Pennsylvania Department of Environmental Protection to expand the footprint of the landfill, so capacity is expected to extend for at least 15 years. Also, LCRMS has entered into a contract with a Belgian manufacturer of anaerobic reactors for municipal solid waste. The initial facility to be installed at LCRMS will process 1/6 of total biodegradable MSW into methane and residual. If economics are favorable, LCRMS will expand the reactor system to manage all of the biodegradable municipal solid waste (estimated to be 600 tons per day, which is half of daily receipts). The anaerobic reactor system will serve as a source of renewable energy and extend landfill life even more.
* The Recyclemania guidelines count full time residential students as 1 person, faculty, staff, and non-residential students as 0.75 person, and part time staff, faculty, and students as 0.5 persons. Note that this standard is different than the ones used to calculate per-capita water and energy consumption.
73

Total Solid Waste
Figure 5.1. Total solid waste disposed of by Bucknell (in tons) over the past decade.
The cost of waste disposal Collection and disposal of municipal solid waste incurs a variety of costs including tipping fees, dumpsters, truck maintenance and depreciation, fuel, and staff time. The total yearly cost of collecting and disposing solid waste on campus is approximately $150,000 annually of which almost $70,000 is tipping fees. At a cost of $48.60 per ton, in 2007, tipping fees present a clear opportunity to reduce costs by minimizing waste sent to the landfill.
Landscaping waste Landscaping waste, which is handled separately from other solid waste, is fully recycled on campus. In 2006, Bucknell Facilities recycled 1,675 tons of wood waste (trees, branches, scrap wood). This waste is run through a tub grinder and managed in windrows and used for mulch. Also in 2006, Bucknell Facilities recycled 345 tons of yard waste (mostly leaves). This waste is also managed in windrows and used for compost and soil amendment.
Paper waste (See also �“Paper and ink�” under �“Purchasing�”) Bucknell recycles magazines, newspaper, and mixed office paper. White paper is recycled both through shredding and mixed paper streams. For the purposes of this report, the solid waste assessment team attempted to estimate the percentage of white printing and photocopying paper recycled on campus and concluded, based on purchasing
74

and recycling records, that approximately 57% of white paper was recycled in 2006 and approximately 85% of white paper was recycled in 2007*.
Year 2006 2007 Reams purchased and used 27,560 24,120 Weight of purchased paper 68.9 tons 60.3 tons Weight recycled through shredding and mixed office paper streams
39.4 tons 51.2 tons
Percentage recycled 57% 85% Figure 5.1. Estimates of the percentage of white printing and copying paper recycled on campus for the years 2006 and 2007.
To help encourage the reduction of paper waste, Library and Information Technology (LIT) initiated a �“Print Wisely�” campaign in 2007. Every lab machine�’s desktop wallpaper says �“Print Wisely, think before you print�” and every student is given a �“quota�” of 500 sheets per semester, the balance of which is displayed every time a student prints from a lab computer. �† Additionally, more recycling bins for paper have been placed in the library and in labs.
All lab printers are set to double-sided as a default, where equipment is available (which is most open access labs). Many offices are defaulted to double sided, but they have the option of changing it to single sided, and some offices are still defaulted to single sided printing. Instructions are given on how to save paper in other ways, such as smart ways of printing PowerPoints, excel spreadsheets, and websites. Lab computers are set to duplex automatically, so there is no need for double-sided printing instructions.
In an effort to save paper, more campus-wide mailings are going paperless. For instance, Notes and Notices, a newsletter that was once printed and sent to all faculty and staff multiple times per week, became an electronic publication in 2008 and is no longer sent in printed form unless requested. The lengthy printed version of the course roster was also discontinued in 2008 because the on-line version was universally available and widely used
Food waste Currently, food waste is treated like all other municipal solid waste at Bucknell, except that it is first pulped and �“de-watered�” by removing excess moisture in order to reduce its weight for transport to the Lycoming County Landfill. According to research performed by a team of Civil and Environmental Engineering seniors under the direction of Professor Tom DiStefano, the total food waste generated on campus per day (when the campus is serving its full population) is 625.76 kg or 1,376 lbs/per day (Amundson et al
* The weight of recycled paper also includes some colored paper and other items such as envelopes, so these figures are somewhat inflated. �† Students are not charged for exceeding their quotas; the balance is displayed for awareness purposes only.
75

2008). A detailed break-down of the food waste by source is provided in table 5.2. Assuming that the full campus population is present 32 weeks per year, during fall and spring semesters and finals, the yearly total would be greater than 154 tons per year (not including food waste generated during breaks, special events, or the summer semester). In another study of Bostwick Cafeteria, Jason VerNooy �’08 determined that Bostwick Cafeteria�’s total food waste was approximately 850 lbs per day, based on measurements taking place over one week in November of 2007 (VerNooy 2008, p.10, See Table 5.3). Using the same assumptions of 32 weeks of full attendance, this data extrapolates to a yearly figure of 95 tons per year from Bostwick alone, not including the summer semester. In 2005 another senior design group estimated that approximately 138 tons of food waste per year was generated in Bostwick Cafeteria and the Terrace Room together (Barben, et al, 2006).
Place Generated Amount of waste
(kg/day) Amount of waste
(lbs/day) Bostwick Cafeteria
454.55 909.1
Bison 30.30 66.66 Fraternities 140.91 310.00
Total Food Waste 625.76 1376.32 Table 5.2. Food Waste Generated on Bucknell University�’s Campus in 2008 (Amundson, et al 2008).
11/1/07 11/8/07 11/29/07 11/30/07 Average (lbs) Morning 88 lbs, 5 oz 88.31
Afternoon 190 lbs, 0 oz 131 lbs, 1 oz 160.53 Dinner 492 lbs, 4 oz 489 lbs, 14 oz 491.06 Closing 120 lbs, 2 oz 157 lbs, 2 oz 138.63
Total 878.53 The far left column designates the four collection times when garbage is taken out of the cafeteria. The middle columns show the collected weights for different times. The weights from each collection time were averaged and then summed to produce the total food waste generation per day.
Table 5.3. Results from the food waste generation study at Bucknell�’s Bostwick Cafeteria (VerNooy 2008, p.10). In summary, estimates of yearly food waste on campus indicate significant quantities are generated in the University�’s dining venues, ranging from over 95 tons per year in Bostwick alone (VerNooy 2008) to over 154 tons per year for Bostwick, the Bison, and Fraternities combined, not including breaks and summer semester (Amundson et al 2008) to 138 tons per year for Bostwick and the Terrace Room combined (Barben et al 2005).
Efforts to reduce food waste In an effort to reduce food waste, in 2008 Bucknell Dining (which is served by Parkhurst Dining Services) began experimenting with trayless Tuesdays and Thursdays, during which no trays are provided in Bostwick Cafeteria. Preliminary indications are that food
76

waste was reduced by over 150 lbs on these days. An additional benefit was reduced water consumption for washing of trays (Bucknell Dining 2009). Although sending surplus food to charitable organizations would seem to be another good option for reducing food waste, this has not been considered a viable option for the University. Most of the waste comes from prepared food which has been left out in serving areas, and once this has occurred, the food is considered to be potentially contaminated and a liability for the University. The second major initiative in the reduction of food waste is the conversion of used cooking oil into biodiesel. As of 2007, all used cooking oil from the major dining facilities of the Bucknell campus have been collected by Valley Protein for processing into biodiesel fuel, which has a much smaller environmental impact compared to petroleum diesel. A number of vehicles operated by Bucknell�’s dining contractor, Parkhurst Dining Services, are operated with biodiesel (Bucknell Dining 2009). Additionally, Chi Phi fraternity sends its used kitchen oil to Kalin Landscaping, where it is converted to biodiesel for use in tractors/mowers.
Alternatives methods of waste disposal Two alternative methods of waste disposal are currently being explored at the University. An organic farm in Mifflinburg has recently been permitted for composting food waste and presents a potential alternative to the Lycoming County Landfill for Bucknell�’s food waste. Details that have yet to be worked out are storage, collection, transport, and cost of sending food waste to this location. The benefits of doing so include reduced transportation distance for the waste (8 miles to the farm vs. 17 miles to the landfill), and the fact that the food waste would be converted into a usable and beneficial product, namely an organic soil amendment for an organic farm. A second alternative method of disposal is anaerobic digestion of the food waste on site. Over the past several years at Bucknell, research by Professor Tom DiStefano and his students has focused on a pilot-scale anaerobic reactor which converts food waste and landscape waste into methane and an organic residue (for the full proposal, see Amundson, et al 2008). The methane would be captured to serve as a valuable energy source, most likely as a source of fuel for stoves in Bostwick Cafeteria. The organic residue would provide a �“mulch-like�” soil amendment similar to composting. The advantages of this approach over composting are that anaerobic digestion produces energy in the form of methane, while composting, being an aerobic process, requires energy inputs for aeration. An added advantage of the anaerobic digester is that the entire process could take place on campus and serve as a valuable educational demonstration. The disadvantage of the anaerobic digester is its cost, estimated at $157,000 for equipment alone (Amundson, et al, 2008). However, state grant money is available for such projects and if acquired could significantly offset this cost.
The anaerobic digester concept is supported by Dennis Hawley (Associate Vice President for Facilities) and David Myers (Chief of Staff) and plans are underway to develop and submit a proposal for funding of phased system that will initial manage 25% of food
77

waste from Bostwick Cafeteria. It is expected that the system will (after acclimation) be able to manage half of the Bostwick food waste. Pending favorable performance and economics, a parallel system could then be installed to manage all food waste from the Langone Center plus the fraternities (Amundson et al 2008, p. 40). Given the educational value of the digester, and its ability to produce net energy, this project is clearly a priority for the University. However, since the full operation of this equipment may be several years in the making, the option of open air composting in Mifflinburg is still �“on the table�” in the short term.
Recycling Bucknell has recycled as far back as most current staff members can remember. Recycling rates exceeded state goals in the 1990�’s but then in 2000 the rate dropped below these levels. In 2003, Facilities and the Environmental Club took steps to revitalize the program, and Residential Life and the Residence Hall Association joined the effort in 2006. The programs that have since been implemented have resulted in improved trends. As one of the top universities in the country, Bucknell is poised to have one of the country�’s top recycling programs.
Campus-wide recycling Over the past 15 years, the total waste recycled from campus has varied from just over 450 tons in 1995 to just over 250 tons in 1998. (A full accounting of total waste recycled at Bucknell by material is provided in Table 5.4.) In 2007 Bucknell recycled 320 tons of materials, which is approximately 18% of the total waste stream. Based on studies of what has been achieved at other universities, over 50% can be recycled if a concerted effort is made to do so, indicating that although Bucknell has a good recycling infrastructure, that infrastructure is not being used to its full potential. The materials recycled in greatest quantities at Bucknell are glass, plastic, paper, aluminum, metal cans, scrap metal, and cardboard. Newspaper is taken by Bucknell to Mifflinburg to a farmer that shreds it and sells for livestock bedding. Office paper, tires, magazines, plastic, glass, cardboard, and metal cans are taken by Bucknell to Lycoming County Resource Management Service (LCRMS) located in Montgomery, Pa. Aluminum cans and appliances are taken by Bucknell to Pheasant Valley Recycling in Alpharta, Pa. Scrap metals are placed in a roll-off bin provided by and transported by Staiman Bros. to Williamsport, Pa. Currently the University recycles the following materials across the campus:
Aluminum and Metal
o Soda and beer cans o Bi-metal (tin) cans o Steel food cans
Glass
o Clear o brown and blue
78

o green
Plastic
o #1 polyethylene terephthalate (PETE) o #2 high density polyethylene (HDPE)
Cardboard
Corrugated boxes
Newsprint
o Magazines o Newspaper o Course Catalogs o Newsprint coupons o Glossy inserts o Glossy catalogs o Lewisburg phone books
Paper
o Notebooks o Copy/Laser printer o All computer paper o Envelopes o Glossy paper o Construction paper o Text books o Campus phone books o calendars
In order to boost Bucknell�’s recycling rate, a full scale waste audit ought to be performed so that the composition of the University�’s waste can be determined, including the proportions and types of recyclables escaping into the general municipal waste stream. For instance dumpster excavations at Penn State in 2000 revealed a high percentage of recyclable contents. On the basis of this waste audit it was projected that the Penn State could save approximately $100 K per year if recyclables were removed from the waste stream (Green Destiny Council 2000, p. 31).
79

Examining the recycling life cycle: The impact of recycled paper Environmentalists live by the three �“R�”s: reduce, reuse and recycle. Reducing and reusing are two obvious solutions for saving energy; however, recycling consumes a considerable amount of energy in and of itself. Instead of simply accepting the societal norms Molly Burke �’10 decided to test the theory. Her 2008 McKenna Research Internship with Professor Peter Wilshusen examined the carbon impact of Bucknell�’s paper recycling efforts through a comparative analysis of the production of recycled paper vs. virgin fiber paper. Methodology The goal of the research was to compare the greenhouse gas emissions of paper recycling against using virgin fiber in paper production (as measured in Metric Tons of Carbon Dioxide Equivalents (MTCO2e)). Global Warming Potential (GWP) was used to convert other greenhouse gases to a carbon equivalent. Average energy and fuel usages were compiled from each production site and entered into a carbon calculator designed by the National Council for Air and Stream Improvement (NCASI), International Council of Forest and Paper Associations (ICFPA), and the GHG Protocol. The calculator assesses emissions from facilities, transportation, and waste management, among other sources, all specific to pulp and paper mills. Results The analysis showed that post-consumer recycled paper has a lower carbon footprint than virgin fiber paper. In total, Bucknell would emit 18.62 MTCO2e�’s annually if it used only virgin-fiber paper for office paper; in comparison with 8.62 MTCO2e�’s for 100% recycled-content paper. Figure 1 compares the differences in MTCO2e�’s for both commodity chains�’ life cycle analysis.
Figure 1. Metric Tons of Carbon Dioxide Equivalents (MTCO2e) throughout the life cycle of recycled-content paper and virgin content
80

The majority of the emissions associated with virgin-fiber paper originated from the landfill, as the paper decomposed and methane leaked. Although the Lycoming landfill, the waste management system observed, collects 75% of the methane, the remaining quarter contributed over 62% of virgin fiber�’s carbon footprint (Figure 2).
Figure 2. A chart illustrating emissions from virgin paper�’s final stage of the life cycle analysis (LCA).
The two paper mill facilities differ greatly in carbon footprints. Virgin-fiber paper facilities emit few greenhouse gases during production, whereas paper mill emissions are a large percentage of the total emissions of recycled-content paper. Most virgin fiber paper mills get about half of their energy from pulping liquors and wood waste, which are biofuels producing insignificant greenhouse gas emissions. The remaining half of their fuel is usually coal or natural gas. The recycled-content paper mill observed in this study used coal as a fuel source. If this mill used a fuel source with fewer greenhouse gas emissions, such as natural gas, its carbon footprint would be reduced significantly. This region in the commodity chain represents about 82% of the total greenhouse gas emissions for recycled paper. Therefore, these mills have the potential to greatly reduce the amount of MTCO2e�’s emitted. Discussion After concluding research on paper recycling it is evident that one of the greatest environmental benefits of this practice is reducing the amount of waste that would be sent to the landfill, therefore reducing greenhouse gas emissions. Using even the most efficient collection systems, the methane emissions from decomposing material in the landfill produce an overwhelmingly large percentage of the total LCA emissions. Therefore it is recommended to promote the use of recycled-content office paper at Bucknell, in addition to increasing recycling standards.
81

Table 5.4. Recycling totals in tons/year for various materials.
Glass Plastic Paper Cardbd Alum Metal Tires Batteries Other Total
1994 124.50 1.48 117.91 78.71 3.90 69.87 0.00 0.00 0.00 396.37
1995 117.30 6.40 151.34 82.05 5.20 51.35 0.00 0.00 0.00 413.64
1996 67.14 4.39 76.21 89.51 3.50 15.46 4.35 0.25 0.00 260.81
1997 54.91 5.19 83.99 89.03 2.87 18.16 3.12 0.75 0.00 258.02
1998 41.28 5.30 80.99 95.91 1.74 28.06 2.29 1.30 0.00 256.87
1999 30.47 7.63 79.99 101.17 1.64 114.68 4.15 0.00 0.00 339.73
2000 28.64 6.59 85.93 100.97 1.53 67.34 3.65 0.00 0.00 294.65
2001 28.96 7.67 103.45 105.53 1.10 92.75 5.01 0.00 0.00 344.47
2002 19.46 8.61 87.24 109.16 1.25 111.14 4.87 0.00 0.00 341.73
2003 19.16 7.84 47.02 107.61 1.07 79.86 6.79 0.00 2.00 271.34
2004 19.31 8.33 32.48 110.39 0.97 96.9 2.97 0.00 2.00 273.55
2005 20.74 10.43 57.95 109.84 2.26 79.73 5.18 0.00 0.00 286.13
2006 30.38 12.13 67.55 113.98 2.88 97.57 3.97 0.00 0.00 328.47
2007 35.30 18.27 80.93 109.83 4.28 67.35 4.15 0.00 0.00 320.11
Special Items In addition to those items recycled campus-wide, certain special items are recycled within particular departments on campus, and these include the following:
Bucknell Computers: Bucknell recycles university electronic equipment through The Federal Prison Industries Inc. (UNICOR) Recycling Group at Lewisburg Prison where the components are reused as much as possible. UNICOR accepts the electronic equipment at no cost to the University (including monitors), recycles as much as possible, and properly disposes of the rest.
Ink Jet and Toner Cartridges: Most Bucknell printer cartridges (HP, Dell, etc) can be recycled and many black ink cartridges will generate cash in return. The cartridges are sent via campus mail to the Environmental Center collects and the Bucknell Environmental Club processes them as a source of revenue. Black & white, HP cartridges go to a recycler from State College. Color HP cartridges go back to HP for recycling. Other cartridges go to Unicor for recycling.
Yard Waste/Trees: All Landscaping waste generated on Campus is placed at a site on West Campus where a Tub grinder mulches the debris. The debris is then
82

placed in windrows and rotated periodically where it partially decomposes. This composting process generates a very fertile top-dressing for plantings on campus. Surplus compost is sometimes mixed with soil as fill material.
Rubber: Tires are taken to Lycoming Landfill where they are collected and then sent to a vendor who recycles them.
Solvents: Solvents used for washing are collected in Facilities and sent to an outside company for recycling.
Oil: Used motor and hydraulic oils are picked up by several local vendors who either recycle them or mix them with fuel oil for heat.
Antifreeze: Used antifreeze is collected and recycled by a vendor.
Batteries: Used car batteries are taken to NAPA for recycling.
Furniture: the Bucknell Facilities warehouse collects used Bucknell furniture. Reusable furniture is stored in the warehouse for possible reuse within the University. Excess used furniture is sent to several non-profit organizations.
Although Bucknell is already recycling a wide variety of materials, there are still others that could be added to the list. For instance, as long as there are no restrictions imposed by Pennsylvania state law that would prevent the University from doing so, it would make sense to recycle cereal boxes and other non-corrugated cardboard, as there is a facility in Milton that now accepts this material. The economics and environmental impact of collection and transport of this facility should be considered. Another potential addition to the list would be campus-wide recycling of batteries. Although automotive batteries are already recycled by Facilities, appliance batteries are simply discarded into the municipal solid waste stream. These batteries contain significant concentrations of heavy metals and thus leave a legacy of heavy metal contamination in landfills. Some other universities, including Dickinson College nearby, have campus-wide battery recycling programs that could be used as models. Further research on a local destination for the batteries would need to be carried out.
Recycling collection Most of the University�’s recycled materials are collected from 36 outside bins and 41 pickup areas across the campus. A map of these locations is made available by Facilities (Bucknell Facilities 2009, �“Recycling�”) Facilities continues to identify areas that need greater access to recycling bins. For instance, in recent years the golf course and Sunflower Childcare on West Campus have been provided with bins. However, there are no recycling bins located inside the Bucknell Mods.
Special events on campus often present an additional challenge for the recycling program. Special recycling efforts have been made in the following areas:
Weis Center: Staff members recycle unused programs and any programs that people leave for Facilities to recycle. They don�’t recycle plastic water bottles from audience
83

concessions, and the black plastic cups used for concessions are not recyclable. The front offices and backstage recycle plastic bottles, soda cans, glass, and all paper.
Craft Center: Staff members recycle cardboard from the boxes that supplies are shipped in, and cans and plastic drink bottles that students consume while working. They also recycle clay by salvaging anything that does not get fired. They have tried at different times to recycle packing peanuts but have been rebuked by both administrative services and mailboxes unlimited.
ACE events/CAP Center: Many of these events are in locations where there are already recycling bins like the Bison and the Terrace Room (recycling bins are throughout the building). Staff members have also begun adding recycling bins to some of the larger events if there is anything to recycle, although many of the events have no recyclable products. They also recycle any paper from ACE advertising in the CAP center.
Dining Services: Recycling at these events is the responsibility of the Bucknell Catering team. As they plan and create events they stay in touch with Facilities staff members and inform them of what products they are using and what kinds of bins they need for recycling.
Uptown: There are actually no recycling containers located in Uptown although the employees would like them. They usually recycle anything that the staff brings like water bottles, etc. by keeping a small container for recycling in the office and then sorting it into the recycling receptacle outside of Swartz once it is full.
Large Scale Events: At Commencement, Alumni Weekend, Chrysalis, Homecoming, and Parents Weekend recycling bins are provided. There is presently a plan to purchase more containers for outdoor events.
Athletic events: recycling of plastic bottles by spectators could be improved by strategic placement of recycling containers (next to trash cans).
Recycling education Recycling guidelines are posted on the Facilities website (Bucknell Facilities 2009, �“Recycling�”) and also in many recycling areas on campus. As of 2006 recycling became mandatory in residence halls, and student recycling monitors were employed by facilities to help with education and enforcement in those areas. The Recyclemania competition, in which Bucknell has participated each year since 2006, has also served to educate the campus community. During the competition members of the Bucknell Environmental Club send out campus-wide emails informing the Bucknell community of the University�’s weekly recycling totals, total waste production, and ranking in the competition.
Hazardous waste Although a hazardous materials assessment team was assembled and provided with a detailed set of questions for this environmental assessment, Bucknell�’s Safety Services department declined to answer the questions due to the fact that the university is currently undergoing a very rigorous self-assessment process for the Environmental Protection
84
Agency (EPA). This �“peer audit�” is being conducted through the Association of Independent Colleges and Universities of Pennsylvania (AICUP). These universities have entered into a group contract/commitment with EPA to conduct independent pre-audit analyses of their practices and procedures, in return for which the EPA agreed (1) to postpone their own audits until the cycle of self-audits was complete and (2) to waive any penalties or fines for universities which self-reported and self-corrected. The complete self-audit expected to be finished by March of 2010, at which time the results will be made publicly available.
As described by Stephanie Hair, a consultant at Turning Bird, the peer audit process
�“�…takes individuals from a number of AICUP institutions and trains them to become peer auditors at other AICUP institutions. The individuals go through an extensive 3 - 4 day training to teach them the items to look for and how to use the protocols. A professional auditor is on-site to guide the team, but the peer auditors (from other schools) complete the team (this is kind of like a shared services program).�”
A preliminary study to the EPA Self-Audit was conducted by Turning Bird Consulting at Bucknell during March 17-21, 2008, and made available for summary in this document. The following information was taken from a PowerPoint presentation compiled by Victoria Justus of Turning Bird:
Areas and programs audited The areas of university operations considered under the preliminary self-audit included:
Chemistry Physics Biology Fine Arts Theater Athletics Geology Engineering Physical Plant and Trades Shops Misc. Mechanical Spaces Golf Course General Environmental, Health, and Safety programs Food Services Health Center Day Care Building
The audit team looked into any areas where there could be potentially hazardous chemicals, wastes, etc. For example, in theater departments there tend to be a lot of paint cans and spray paint. Spray paint falls under RCRA regulations because the residual propellant in the cans is hazardous. Also, Art and Theater departments use paint and then
85

wash brushes in the sink which could potentially lead to a Clean Water Act violation (oil based paints, some of the colorants, etc). In Food Service and the auditors look for any possible chemicals going down the drain, chemical incompatibilities, and waste streams (including biohazardous wastes). Athletics frequently has equipment with mercury in it (blood pressure cuffs, thermometers, etc.), and there must be a spill kit available if a spill event if it were to happen. In the case of Sunflower Childcare, the auditors looked at the chemicals and how they were stored, and also at the age of the building to determine if lead-based paint was present. On the positive side, the audit team found a great faculty and staff response, desire to improve issues, strong environmental ethic in many departments, and clean and organized facilities. Recommended areas for improvement were more centralized recordkeeping, programs (including hazardous waste contingency, pollution prevention controls, source reduction strategy, universal waste, turf management, and emergency response planning), training, and greater personnel power to respond to environmental compliance issues.
Resource Conservation and Recovery Act (RCRA) compliance RCRA is the primary federal legislation dealing with the disposal of hazardous waste in the United States. With respect to this legislation, the auditors found a commendable effort to comply with RCRA regulations at Bucknell. Most chemical wastes have been identified and segregated for hazardous waste disposal, and the majority of wastes are collected and not released to the environment. Areas requiring improvement included waste determinations and characterizations, and hazardous waste training. Waste characterizations and determinations require written identification of what is in a waste container and a determination of whether or not the waste is hazardous (See Figure 5.2 below). For instance, aerosol cans, epoxies, and glues fall into this category.
86

Figure 5.2. Illustrations of proper hazardous waste labeling, segregation, and secondary containment practices (left) and improper practices (right) in Bucknell labs. Source: Victoria Justus, Turning Bird Consulting.
Universal waste Universal waste is a term referring to items like mercury thermometers and fluorescent light fixtures, which are common throughout the University, but unsafe to combine with the general municipal waste stream. With respect to the handling of universal waste at Bucknell, the auditors found that a central universal waste storage area has been established, mercury-containing devices are being actively replaced, waste streams are being captured, and recycling is well-documented. Universal waste handling practices identified as needing improvement included the collection and management of fluorescent bulbs, and the protection of mercury-containing devices. For instance, spent fluorescent bulbs were not always packaged in structurally sound containers to prevent breakage (see Figure 5.3).
Figure 5.3. Campus examples of good universal waste handling practices (left) and practices needing improvement (right). Source: Victoria Justus, Turning Bird Consulting.
87

Pollution prevention The auditors found that Bucknell�’s recycling program, yard waste composting, and e-waste reduction measures all have a positive effect on pollution reduction. Additionally, one chemistry professor, Marj Kastner, is leading the way in micro-scale experiments designed to reduce the volume of hazardous waste generated in teaching labs. In the coming months the university will need to take these measures a step further by developing source reduction strategies and a pollution prevention plan.
Clean Water Act (CWA) The CWA is the primary federal legislation dealing with water pollution in the United States and regulates the discharge of wastewater into rivers and streams. The audit team commended the University�’s separation of storm water from the sanitary sewer, installation of low-flow fixtures in new buildings, and protection of cup sinks and laboratory sink troughs as examples of best practices in water pollution prevention. However, the team also found some storage of chemicals near drains, storage of chemicals in fume hoods without secondary containment in some labs, disposal of potentially hazardous wastes to the sanitary sewer, and inadequate capacity of secondary containment for �“satellite accumulation areas�” in laboratories. (SAA�’s are areas where small quantities of hazardous wastes are stored near the site of waste generation.) The auditors also found the need for an equipment wash-down area at the golf course in order to prevent lawn chemical residues from draining into the storm sewer.
Spill prevention, control, and counter-measures As part of the EPA's strategy to prevent oil spills from entering waterways, the EPA requires that certain facilities develop and implement plans for oil spill prevention, control, and countermeasures (SPCC). The audit team found Bucknell�’s SPCC plan to be comprehensive, with initial SPCC training conducted and double-walled storage tanks in place. Minor areas cited for improvement were the addition of elevators to the oil inventory and secondary containment for transformer oil vessels.
Emergency Planning and Community Right-to-Know Act Emergency Planning and Community Right-to-Know Act (EPCRA) establishes requirements regarding emergency planning and "Community Right-to-Know" reporting on hazardous and toxic chemicals. The act ensures that the public has access to information on chemicals, their uses, and releases into the environment at individual facilities. The audit team found that Bucknell has completed chemical inventories in most areas, has excellent material safety data sheet (MSDS) management, and has been filing the necessary reports under this act since 1998.
Toxic Substances Control Act Under the Toxic Substances Control Act of 1976 the EPA has authority to require reporting, record-keeping and testing requirements, and restrictions relating to chemical substances and/or mixtures. TSCA regulates the production, importation, use, and disposal of certain highly toxic substances such as polychlorinated biphenyls (PCBs),
88

asbestos, radon and lead-based paint. As part of its TSCA reporting, Bucknell has completed surveys of asbestos-containing materials and lead-based paint, and has tested all transformers for PCB�’s. The audit team found Bucknell�’s PCB record keeping to be commendable. Areas where TSCA improvements were recommended included documentation collection, asbestos operations and maintenance planning, access to information on asbestos containing materials on campus, and premanufactory notification planning (for research chemicals manufactured in campus labs).
Federal Insecticide, Fungicide, and Rodenticide Act Bucknell is currently complying with licensing and record-keeping requirements for pesticide application. The audit team found that some old insecticides were in need of disposal and that, in one case, an employee was applying pesticides without a license.
Clean Air Act The Clean Air Act is the primary federal legislation dealing with air pollution in the United States. The audit found that Bucknell�’s emissions testing and reporting were being conducted, and suggested adding some minor emissions sources to the existing permit. The team also cautioned against leaving open containers of waste solvents to evaporate in laboratory fume hoods.
Recommendations Based on the findings of the solid waste assessment team the following measures are recommended:
Waste production and disposal
Conduct an in-depth waste audit to determine what proportion and what kinds of recyclables are being discarded into the general municipal solid waste stream.
To reduce container waste, revise operations in the Bison. Re-consider use of biodegradable �“to go�” containers. Provide biodegradable �“to go�” containers to diners that are taking food from the Bison; install dish-washing equipment and employ reusable (washable) dining ware to all �“in-diners�”.
Anecdotal information suggests that some fraternities use disposable dining ware for all meals. Support and encouragement for use of washable dining ware should be initiated for all fraternities.
Explore options for students to exchange and re-use dormitory furnishings and accessories in good condition. These are often cast off into dumpsters during the moving-out period at the end of the year.
89

Paper waste
To save paper, include a message on �“my Bucknell�” encouraging double sided printing and recommending electronic communication as the primary mode of information exchange.
Ensure that all copy machines and high volume printers have recycled paper bins nearby.
Continue to identify print publications that could be eliminated or minimized using electronic alternatives.
Food waste
To reduce food and water waste, implement a �“no tray�” policy in cafeterias.
To reduce food waste, re-consider the �“all-you-can-eat�” policy in cafeterias.
Implement full-scale on-site anaerobic digestion of food waste.
Recycling
Increase the size of recycle bins at residences to facilitate on-site sorting of materials.
Provide recycling instructions and statistics at all recycle locations.
Continue to evaluate the need for additional recycling containers across campus and at special events.
Consider collection and transportation of chipboard (non-corrugated containers) to facility in Milton.
Consider collection and transportation of appliance batteries to a recycling facility.
Consider implementation of incentive-based programs that motivate people to act in accordance with the positive attitudes they already have toward recycling.
Hazardous waste (as recommended by the AICUP peer audit team)
Continued to dispose of unused or legacy chemicals and wastes, especially in chemical stockrooms.
Restrict access to �“special hazard�” substances, especially in science labs.
Develop a hazardous waste management and disposal program which will identify satellite accumulation areas, improve labeling and document waste characterizations.
Work to get all campus departments to adopt the University�’s strong environmental and safety ethic.
90
Break down �“silos�”, build bridges, and establish a comprehensive, cohesive, and diverse corrective action team that has the authority to initiate and implement change and is adequately funded.
Centralize recordkeeping on hazardous materials.
Develop and implement required programs (see �“Hazardous Waste�” above), including training.
Future monitoring
Collect and publicize data on the following: food waste, paper consumption, recycling statistics, disposable dining service-ware.
Continue participation in Recyclemania and discuss strategies for improving Bucknell�’s performance.
Continue support of student recycling coordinators in residence halls.
91

Chapter 6. Purchasing
92

The purchasing department is an important hub of material flows within the university. As explained by Sarah Creighton in Greening the Ivory Tower, �“The purchasing department has an important educational role to play. Even in a decentralized university, it is often a central point of information, policy, and process for all items bought within the university and it can therefore be a university-wide catalyst for action to minimize environmental impacts�” (Creighton 1998, p. 156). On that note, it is essential that the environmental assessment process look into the impacts of purchasing practices and investigate the great potential for this office to become an instrument of sustainability.
Policies At Bucknell major purchases are centralized through Procurement Services while minor purchases are often conducted through individual departments. Departments have access to Departmental Purchase Orders (DPO�’s) which are valid for purchases less than $350.00. Additionally, some departments may have a credit card (ProCard) which allows them the ability to purchase items that cost up to a few thousand dollars. Departments may not purchase capital items (items exceeding $5,000) with their ProCards. Capital items are purchased through Procurement Services, who issue purchase orders for those items.
Some departments are exempt from these guidelines including:
The Campus Store -purchases all the items that it resells.
Dining Services - purchases all their food products.
Facilities �– purchases all items that they use to perform their jobs (e.g. cleaning supplies, plumbing supplies) and purchases all items that are an integral part of the �“sticks and bricks�” of capital projects.
Environmental standards At this time, no specific policies have been written to deter the purchase of ecologically harmful products through Procurement Services. Safety Services is notified of any toxic products, and this department tracks the items and their eventual disposal. The only current purchasing policy specifically written to encourage the procurement of environmentally beneficial products is a directive under the American College and University Climate Commitment to purchase Energy Star appliances. This directive was reinforced by President Mitchell in his 2008 Focus the Nation address, during which he also expressed a commitment to purchasing additional hybrid vehicles for the campus fleet. A purchasing policy for paper used in university printers and copiers is currently under review (see Appendix XI for a copy of the proposal).
Local sourcing Procurement Services recognizes the desirability of local purchases and recommends local vendors whenever possible. Examples of local purchases include the following:
In the last ten years, Bucknell has purchased the vast majority of fleet vehicles from local car dealerships.
93

Administrative Services has a number of local print shops that they regularly use.
The Bookstore uses a number of local vendors including Purity Candies,
Brubaker�’s, Dwellings, and local screen printers, and also sources wooden crates from a local cabinet shop.
. Bucknell Dining (operated by Parkhurst Dining Services) sources approximately
25% of their food purchases locally within 150 miles (See Chapter 7, �“Dining�”).
The University purchases all wood residence hall furniture through a local supplier. Mattresses are manufactured less than 100 miles away.
The University purchases a significant amount of wood furnishings (lecterns,
tables, desks, custom cabinetry) from a local wood-worker who procures all his wood locally.
Procurement Services has also successfully nurtured local businesses so that they can better compete. For example, this department provides local car dealerships with Bucknell�’s national fleet account numbers to ensure that they offer the highest discount possible.
Packaging No explicit policies have been adopted at Bucknell to promote the use of vendors who reclaim or minimize their packaging materials. However, certain vendors have been sought out for their environmental benefits. These include the vendors Humanscale and Global Total Office, who have decreased their packaging for office chairs so that they can now ship via the United Parcel Service (UPS). Previously, Procurement Services purchased many office products that were shipped via LTL (less than truckload) tractor trailers. UPS provides shipping that is much more energy efficient.
Durable goods Procurement services purchases a wide variety of durable goods for the university including appliances, photocopiers, computer equipment, furnishings, automobiles, and many others. As of 2008 the University has made a commitment to purchase only Energy Star rated appliances, and one of the first major purchases under that commitment was a series of Cannon copier/printer/fax machines acquired by Administrative Services (see also �“Appliances�” under Chapter 3, �“Energy�”). Computer purchases have also become more energy efficient with the substitution of Liquid Crystal Display (LCD) monitors for Cathode Ray Tube (CRT) monitors throughout the University, and the conversion to Energy Star desktops and laptops (see also �“Appliances�” under Chapter 3, �“Energy�”). As of 2006 all dormitory washing machines were replaced with front-loading substitutes which use 1/3 the water of top-loading equivalents. As for furniture, the University purchases a number of items with recycled content including Adirondack-style chairs and benches made from recycled plastic, lounge
94

furniture made with recycled upholstery, and office and classroom chairs containing up to 100% recycled materials. Some recently purchased outdoor furniture is constructed of sustainably-harvested teak and no unsustainably-harvested tropical hardwoods are purchased. In an effort to increase the durability of dormitory furnishings, the University recently switched from cotton-covered to vinyl-covered mattresses, which significantly increases the lifespan of these items. Vinyl does, however, have many environmental problems of its own, including highly toxic emissions in the manufacturing phase of its life-cycle. This example illustrates the complexity of making purchasing decisions when environmental factors are considered. As for vehicles, in recent years the University has purchased three hybrid automobiles: a Toyota Prius, a Toyota Highlander, and a Honda Accord. Additionally, Bucknell has three Subaru sedans obtained from a Subaru plant in Indiana which recycles 99% of its waste. A subcommittee under the Campus Greening Council has recently been formed to explore the potential for expanding the number of hybrid and alternative fuel vehicles in the campus fleet.
Paper Because universities use paper in particularly high volumes, it is worth examining this purchase in depth. Paper production begins depletes forest land, consumes significant quantities of energy, and produces significant toxic air and water emissions, so there is a considerable �“hidden cost�” to this class of products.
Paper for printers and copiers Procurement Services tracks paper purchases of plain copy/printer paper, the most commonly used paper on the campus, and reports the following quantities for the past five fiscal years in reams of 500 sheets each:
2007 �– 42,800 reams 2006 �– 26,400 reams 2005 �– 26,400 reams 2004 �– 26,400 reams 2003 �– 16,000 reams
Although these figures would appear to show an upward trend in paper purchasing, they do not necessarily reflect paper use because in some years more paper is purchased than is actually used, and the surplus is used during the next fiscal year. Administrative Services tracks paper use and reports this was 27,560 reams in 2006 and 24,120 reams in 2007. In recent years Bucknell�’s default printer and copier paper has been Xerox 4200 which contains no post-consumer recycled content, is chlorine-bleached, and is not certified by the Forest Stewardship Council (FSC), an independent organization which ensures that products come from sustainably managed forests and environmentally responsible paper
95

manufacturers. However, in the summer of 2008, for the first time Administrative Services purchased Domtar 30% post-consumer, Sustainable Forestry Initiative (SFI) certified paper for all printers and copiers at the University. The significant post-consumer recycled content represents a marked improvement in environmental impact, and although there is some controversy regarding the SFI, due to its original ties with the paper industry, there are indications that this certification agency has become more rigorous and independent in recent years (See Appendix XI for more details). Administrative Services does stock FSC-certified 100% post-consumer recycled paper (Roland Enviro 100) and makes it available to departments upon request. The greatest deterrents to increasing the recycled content of printer and copier paper is cost, which is approximately 15% higher for 30% post-consumer recycled content, and 25% higher for 100% post-consumer recycled content. Other deterrents include the perception that the paper is of inferior quality, or that it will cause jams in printers. In order to test these perceptions, as part of a summer internship with the Environmental Center, Meagan Gins �’08 conducted a trial of the 100% recycled paper in four departments (Geography, Political Science, Management, and Biology). Three of the four departments found the paper to be equal in quality to the standard virgin paper. One department found the paper to be slightly less bright and said that it could not be used for all purposes, but would be sufficient for most. There were no reported problems with printer jams.
Other types of paper Other types of paper commonly used on campus include paper used for special publications and mailings, stationery, colored copy paper, and paper sold through the Bookstore. Publications and mailings represent a very large volume of paper. In fact, according to Jim Muchler, Director of Administrative Services, the Communications Department alone used approximately 17,537,000 sheets of paper for various mailings, brochures, etc. during the past year. This figure does not consider envelopes or postcards. The paper used for these items was typically supplied by the print shop creating the piece. The Bookstore sold 11,397 units of paper, such as notebooks, in fiscal year 2008 and 12,896 units in fiscal year 2007. Colored paper is relatively minor in comparison, at an annual average of approximately 230 reams. Publications are increasingly moving toward paper with less environmental impact. For instance, Admissions publications are now printed on recycled paper, and the Bucknell Calendar was printed on FSC-certified paper in 2008. Bucknell Magazine is printed on paper certified by the Programme for the Endorsement of Forest Certification (PEFC), a European agency. Bucknell letterhead is printed on Neenah Classic Crest, a 100% post-consumer recycled sheet. The Bookstore also offers many recycled paper products including Bucknell imprinted spiral notebooks, plain spiral notebooks, index cards, pocket folders, binders, notepads, legal pads, journals, greeting cards, gift bags, and boxed stationery.*
* Other items with recycled content sold by the Bookstore include pens, mugs, lanyards, Nalgene bottles, laptop bags, tote bags, and crates.
96

Life-cycle of a Bucknell Sweatshirt�—by Sherry Finkel �‘10 The cotton sweatshirt is a ubiquitous component of American apparel. Bucknell�’s Bookstore consistently offers the heavyweight hooded sweatshirt, item W1017. Students don this seemingly benign sweatshirt consistently on Bucknell�’s campus, though little thought is given to the materials and processes in constructing this item. According to bookstore manager Vicki Benion, last fall the Bookstore at Bucknell sold 1,163 of these sweatshirts, each weighing 12.5 oz, so the total mass of the sweatshirts sold was over 900 lbs. Cotton farming Clearly, a 95% cotton sweatshirt by composition uses arable land for cotton farming. Cotton farming shares the problems faced by most types of farming. Over 50 pests are deemed harmful to cotton production, and the most common of these are bollworm and the boll weevil, which consume the cotton plants in mass quantities. Genetically modified crops and pesticides have been used to thwart the effects of pests. Consequently, the pests have grown immunities to these synthetic methods (World Resources Institute 2008). Pesticides and herbicides are composed of chemicals that can runoff into waterways and bioaccumulate in ecosystems. Furthermore, eradication programs target specific pests by over-applying fertilizer for a specific amount of time. The United States Department of Agriculture (USDA) supported the Boll Weevil Eradication Program in 1995. This required farmers to apply large amounts of Malathion to their fields. The results were both economically and environmentally disastrous. Cotton yield dropped by over 80% in 1995 because the Malathion also killed pest-controlling insects (World Resources Institute 2008). Bioaccumulation of pesticides in ecosystems is a well known ecological phenomenon. Heavy rainfall creates runoff into creeks and streams. Plants and low trophic-level organisms absorb toxins. Higher level organisms ingest the lower level organisms and the toxins within them. The toxins remain within the bodies of the upper level organisms. This process continues until the highest member of the food chain accumulates deadly doses of toxins (EPA 2001). Another environmental impact involved in cotton agriculture is fertilizer application use. Inorganic fertilizers provide phosphorous, nitrogen, and potassium to induce growth. Unfortunately, these excess nutrients also runoff into nearby bodies of water. The nutrients are taken up by algae in the water, causing algal blooms or massive growth of algae in bodies of water. Once the algae die, they are decomposed by organisms that take up massive amounts of oxygen. This process lowers the dissolved oxygen content of the waters, thereby suffocating fish and other organisms.
97

Sourcing Despite these problems, cotton growth in the United States is more conservation oriented than in other areas of the world. In a market that encourages out-sourcing to environmentally deleterious manufacturers overseas, Bucknell is fortunate enough to purchase its apparel from the Cotton Exchange. The Cotton Exchange is based in Wilmington, North Carolina and boasts a �“USA Made�” label on all products. The Cotton Exchange is able to use cotton grown in North Carolina which is shipped to North Carolina yarn spinning and printing mills. Cotton that is harvested is grouped into 500 pound bales and sent to yarn spinning companies (Davis 2008). Processing The yarn for our object of interest is sent from North Carolina farms to Parkdale Mills, a North Carolina yarn spinning company (Davis 2008). At this location, combing, carding, drawing, and drafting involve manipulating the fibers into more suitable products for spinning. Their ecological cost is mostly energetic because the processes involve electrically powered machinery. The yarn must undergo warping, slashing, and weaving before a usable fabric is created (EPA 1997, p. 42). Wet processing prepares fabrics for use outside of the factory and is broken up into three phases: preparation, dyeing or printing, and finishing. These processes occur at the Mocaro Mills dyeing/printing company in North Carolina (Davis 2008). The most detrimental phase of preparation is scouring, a method that uses strong bases such as sodium hydroxide to clean natural oils from the cotton fibers. High biological oxygen demand (BOD) waste loads are created in this process. Bleaching with hydrogen peroxide often follows scouring and creates a much smaller but significant BOD waste load as well. Mercerizing, the final preparation process, increases the luster and dye affinity of the fabric. The fabric is sprayed with a hot caustic soda, and the wastewater of this process is high in alkalinity (EPA 1997, p. 32). Mocaro Mills dyeing and printing company is located in Statesville, NC, in the Pamlico Sound and Atlantic Ocean watersheds. Therefore, any wastewater generated in the plant would impact these waters. Shipping By the time the fabric has reached the Cotton Exchange headquarters, it has traveled roughly 500 miles. The carbon dioxide emissions created in truck transportation are much less significant than those that could have been created in airplane shipping. When The Cotton Exchange headquarters receive the fabric, they prepare the product for sale. They place each sweatshirt in an individual, non-recyclable plastic bag. These sweatshirts are placed in corrugated cardboard boxes and shipped by either DSL or UPS trucks to Bucknell (Davis 2008). The distance between Wilmington, NC and Lewisburg, PA is 580 miles. Despite the fact that the cotton sweatshirts are American made, the pre-use phase still requires the product to travel roughly 1000 miles!
98

Disposable goods Because disposables add significantly to the waste stream and contribute to environmental degradation in the resource extraction and manufacturing phases of their life cycles, it is desirable to minimize their consumption whenever possible in favor of durable goods. When durable goods are not an option, disposables that are recycled, recyclable, or biodegradable are preferable to those made from virgin, non-recyclable, and non-biodegradable materials. At Bucknell large quantities of disposable service-ware are used in dining facilities, and these are discussed separately in Chapter 7, �“Dining�” under �“Packaging and Service-ware�”. In addition to these dining items, other major types of disposable goods are paper products such as paper towels and toilet tissue. According to Procurement Services data, the University purchases nearly 7 million square feet of paper towels and 10 million square feet of toilet tissue per year. These products are purchased from the Kimberly Clark Corporation, and either meet or exceed the Environmental Protection Agency standards of 20% post-consumer recycled content for toilet tissue and 40% post-consumer recycled content for paper towels. All are bleached using an elemental-chlorine-free (ECF) bleaching process, meaning that they are not totally chlorine free (TCF) but do not use the most harmful form of chlorine in their manufacturing. However, ECF paper products are still a concern to the environment. According to the California Integrated Waste Management Board,
�“TCF papers are much more environmentally preferable than ECF papers because chlorine derivatives�—while less harmful to the environment than elemental chlorine�—still produce toxic chlorinated organic compounds, including chloroform, a known carcinogen. These compounds are released into waterways as effluent from the bleaching process, where they produce environmental damage. Oxygen, ozone, and hydrogen peroxide are some bleaching alternatives to chlorine and chlorine derivatives.�” (California Integrated Waste Management Board 2009).
Additionally, in recent years the Kimberly Clark Corporation has been strongly criticized by environmental organizations because they use fibers obtained from old-growth Canadian forests and, although Kimberly Clark includes recycled content in their institutional brands of paper products, their �“at home brands�” such as Kleenex tissue, contain 100% virgin fibers (Natural Resources Defense Council 2005).
Recommendations Purchasing policy
Adopt a set of environmental standards for university purchases. Although many good choices have been made in recent years in the procurement of products that are less harmful to the environment, these choices have been made somewhat
99
inconsistently. A standardized environmental purchasing policy*, as adopted by several other universities, would ensure a basic adherence to environmental principles in all university purchases.
Continue to seek out and favor vendors who reduce packaging and reclaim their products.
Continue to seek out and support local vendors.
Durable goods
Continue to institutionalize and monitor Bucknell�’s commitment to purchase Energy Star appliances.
Implement President Mitchell�’s pledge to purchase additional hybrid and alternative fuel vehicles for the campus fleet.
Expand the purchases of durable goods with recycled content.
Paper
Adopt the proposed purchasing policy for certified, chlorine-free, 30% or greater post-consumer recycled content paper.
Promote the voluntary use of 100% post-consumer recycled paper to individual departments, along with voluntary paper reduction suggestions to help offset the increased cost.
Disposable goods
Explore alternatives to Kimberly Clark products manufactured by companies with better environmental records, such as Seventh Generation.
Recommendations for future monitoring The purchasing assessment team�’s biggest challenge was establishing a benchmark to measure paper usage. The most accurate indicator for paper usage is not reams or units, but weight in pounds or tons. Weight is currently used in waste management because it allows easy comparisons. Administrative Services is currently working on setting up a database to measure the University�’s paper usage. It is hoped that this model could be used by other departments on campus.
* For examples of environmental standards in university procurement, see Oberlin�’s Green Purchasing Policy at http://www.aashe.org/resources/documents/OberlinCollegeGreenPurchasingPolicy.pdfor Berea College Green and Socially Responsible Purchasing at http://www.berea.edu/sens/sustainabilityinitiatives/purchasing.asp
100

Chapter 7. Dining
101

The impact of food choices on environmental quality is often underestimated. For instance, a study by the Union of Concerned Scientists presents a scientifically-backed rationale for consumers who wish to make effective environmental decisions. The study determined that eating organic food and less meat is second only to reducing gasoline consumption as the most effective environmental choice an individual consumer can make (Brower and Leon 1999, p. 85). Farming practices have a tremendous impact on soil and water quality, and food packaging contributes significantly to municipal solid waste. Furthermore, food quality has lasting effects on the health and well-being of campus community members. For these reasons dining practices are important indicators of ecological sustainability. Bucknell Dining has already begun to recognize the importance of sustainability in many significant ways, and has collaborated with the Bucknell Environmental Club, the Civil and Environmental Engineering Department, and the Bucknell University Environmental Center on several projects designed to reduce the environmental impact of their operations. As a further example of their commitment to sustainable principles, Dining Services hired two student sustainability coordinators in 2008 to further their environmental initiatives. These initiatives are discussed in greater detail in this chapter as well as in Chapter 5 under �“Food Waste�”.
Food sources Parkhurst Dining Services operates Bucknell�’s dining facilities through a contract that took effect in July 2005 and extends through July 2010. Parkhurst also provides catering services for all of the special events on campus. The only dining venues on campus not served by Parkhurst are the University�’s fraternities, who each contract their food service individually. The University�’s total food budget, fraternities excluded, is approximately $4 million per year.
Local foods When considering sustainability, purchasing local foods is key, because the fossil fuels required to transport and refrigerate the food are significant. In a globalized economy with relatively cheap fossil fuels, the distances over which food is transported for large-scale dining operations are often much larger than necessary. Penn State�’s environmental assessment reports that, based on one day�’s lunch menu, the average menu item traveled 873 miles to its final destination in a state where agriculture is a major industry. This study recommends that Penn State commit to purchasing at least 10% of its non-dairy food from Central Pennsylvania growers, and also emphasizes the importance of �“making the food system visible�” through labeling and education (Green Destiny Council 2000, pp. 43-45). Approximately 25% of Bucknell�’s food purchases are local within 150 miles of the University (Bucknell Dining 2009). All dairy products are obtained locally, and approximately $100,000 per year, or 2.5%, is spent on local produce. Local suppliers include:
102

Pocono Produce, Stroudsburg, PA �– local produce and other products
Keigles Produce, Lancaster, Pa. �– local produce and other products
Front Street Bagels, Berwick, Pa �– New York Style Bagels
Dries Orchard, Sunbury, Pa �– 8 types Apples/Peaches/Cider
MacNeal Orchards, Rebersburg, PA �– 15 types of Apple
Snyder Valley Farms, Williamsport, PA �– Milk and Ice Cream
Buttercrust Bakery, Sunbury �– Packaged Bread products
New Lycoming Bakery, WiIliamsport �– Retail and Catering Rolls
Tallman Potatoes, Tower City, PA �– Assorted Style Potatoes
W.A. DeHart, New Columbia, Pa �– Dried Fruit, Local Nuts, Candy
Local food items are labeled for certain events where these items are showcased, for instance, during the annual local foods dinner in Bostwick Cafeteria that takes place in the fall in collaboration with the regional chapter of the Buy Fresh Buy Local program. However, many local foods are not labeled on a regular basis because they are combined in prepared dishes with ingredients obtained from non-local sources. Whole fruit and ice cream are labeled local on a regular basis.
Organic foods Organic food purchases also have the potential to make a big impact on the sustainability of a university�’s dining operations. Organic farms are much less polluting to the environment, as they do not use synthetic pesticides, most of which are toxic and contaminate water and soil. Furthermore, organic farming practices build soil fertility through the use of fertilizers that add organic matter to soil, whereas conventional farming practices deplete soil fertility through the use of inorganic fertilizers that are readily washed into waterways and leached into groundwater causing nutrient pollution as they accumulate. At Bucknell a nominal amount of produce is Certified Organic. This produce is sold in the retail segments as opposed to being used as ingredients in Catering and Resident dining programs. Organic coffee is also provided as an option in dining venues. Additionally, several organic meals are offered each year on special request. When this occurs, additional organic food is purchased. Organic items are regularly labeled because there is recognition of both economic and educational value in doing so.
103

A closer look at meat: Of all the things we eat, meat can have some of the highest environmental impacts. According to research by Cornell ecologist David Pimentel, typically 6 kg of vegetable protein must be consumed in order to produce 1 kg of animal protein, leading to a �“multiplier effect�” in environmental impact when comparing meat to grains or vegetables. In terms of energy inputs, 28 kcal of energy is required to produce 1 kcal of animal protein on average (with the greatest ratio at 54:1 for beef, and the smallest ratio at 4:1 for chicken). Animal products produced in large-scale concentrated animal feeding operations, or CAFO�’s, require greater energy investments than smaller �“free-range�” operations because feed must first be grown, harvested, and transported to the CAFO before it is consumed by the animals. In terms of water consumption, 100,000 liters of water are required to produce one kg of beef, whereas only 900 liters of water are required to produce one kg of wheat, further emphasizing the multiplier effect of meat�’s environmental impacts (Cornell Science News 1997). Sources and quantities of four types of meat consumed at Bucknell: As part of a summer research internship in 2008, Chelsey Musante �’11 set out to trace the quantities, sources, and environmental impacts of four types of meat consumed at Bucknell: Boneless chicken breast, deli ham, ground beef patties, and salmon fillets. All four types of meat are purchased for preparation in Bucknell�’s dining facilities by Parkhurst Dining Services, who in turn purchases it from the US Foodservice Corporation, a national company with over 70 distribution offices nationwide, the nearest of which is in Allentown, PA (US Foodservice 2009, �“About Us�”). All quantity figures were provided by John Cummins, General Manager of Parkhurst Dining Services at Bucknell. Boneless chicken breast At nearly 100,000 lbs consumed in the �’07-�’08 academic year, boneless chicken breast is by far the most common type of meat consumed on campus. The chicken breast is purchased by US Foodservice from the Tyson Corporation, based in Arkansas, who in turn operates 123 chicken processing plants and contracts with 6,729 domestic chicken growers. Tyson�’s own literature claims environmental efforts are being made in the areas of nutrient management, water conservation, and greenhouse gas reduction (Tyson 2009, �“Environment). However, Tyson does have a history of environmental violations, the most significant of which may be the release of untreated wastewater into the storm water discharge system in Sedalia, Mo., resulting in 20 felony violations of the Clean Water Act and a $7.5 million settlement in 2003 (Environmental Protection Agency 2003). On the positive side, chicken represents a much more favorable embodied energy than other kinds of meat, as mentioned above.
104

Ground beef patties In academic year �’07-�’08 approximately 14,100 lbs of ground beef patties were consumed at Bucknell. (A significant amount of ground beef was used in the preparation of other entrées as well.) The beef is acquired through Karns Quality Foods based in Mechanicsburg, PA. Although the precise origins of the beef were undeterminable, the company�’s literature states that Karns is committed to buying 100% domestic beef. Karns�’ sustainability initiatives include switching to more efficient lighting, reducing their use of Styrofoam, purchasing local and organic foods, and recycling over 1 million lbs of cardboard each year (Karns Foods 2009). However, no references are made to sustainability initiatives specifically relevant to beef sourcing. Because, like US Foodservice, Karns is another general food supplier, the chain of acquisition of Bucknell�’s beef patties is particularly complex, making the specific environmental impacts of this item difficult to trace. Deli ham Throughout the course of the 2007-2008 year, Bucknell University consumed approximately 16,000 lbs of deli ham. US Foodservice acquires pork from the local manufacturer and supplier, Hatfield Quality Meats, based about two and one-half hours southeast of Bucknell in Hatfield, PA. According to contacts at US Foodservice, the majority of their livestock is raised on farms in Pennsylvania, all of which are less than 300 miles from the processing facility, and the nearest of which is just outside of Lewisburg. According to their own literature, Hatfield operates under an Environmental Management System (EMS), which sets conservation standards pertaining to water, energy, emissions, recycling, and transportation. For example, through the implementation of EMS at on-site sewage treatment plant, Hatfield has been able to increase water re-use to 90%, greatly reducing the need for freshwater (Hatfield Quality Meats 2009). According to one independent article, the company had a clean environmental record for 15 years prior to 2001 and served as a model for other pork producing companies (Knight Ridder/Tribune Business News 2001). Salmon fillets The most recent annual consumption of Bucknell�’s salmon fillets totaled approximately 5,775 lbs. US Foodservice acquires the salmon from Trident Seafood which is based in Alaska. The Trident Seafood company specifies that the salmon is wild-caught and �“quick frozen�” (Trident Seafood 2009). Although the Alaskan salmon makes a long journey to Bucknell, and therefore has a hefty carbon footprint, it is widely recognized that there are definite environmental advantages to wild-caught Alaskan salmon over Atlantic farmed salmon, which often contains significant concentrations of contaminants such as polychlorinated biphenyls (PCBs) and dioxin, and which creates significant ocean pollution in its production.
105

Campus organic garden The only food currently produced on campus is grown in the organic garden behind the Bucknell University Environmental Center, which consists of twelve raised beds for vegetables, a small planting of grape vines, and several young apple trees. The produce grown in this garden is not used by Dining Services since, at this point in time, the amount of food produced is not sufficient to provide a consistent source to the dining operations. Dining services has expressed interest in developing an on-campus source of fresh herbs, and since these are grown relatively easily there is strong potential for developing this idea as a student project.
Nutritional quality Human health and well-being are very important aspects of environmental sustainability, and therefore the nutritional quality of the food consumed at Bucknell is an important consideration in this assessment. One indicator of nutritional quality is nutritional standards. The U.S. Department of Agriculture (USDA) dictates a minimum grade of red meat purchased in Bucknell�’s dining facilities. Otherwise, no nutritional guidelines are legally specified for food purchases. The University dictates additional standards for red meat, such as fat content, but there are no particular standards specified for chicken or fish. Since 2005, out of concern for the health implications of consuming trans-fats, all cooking oils used by Parkhurst have been trans-fat-free. No other food items have been excluded for consideration on Bucknell�’s menus purely out of nutritional concerns, but some, such as whole grain breads and whole wheat pizza, have been chosen for their greater nutritional value. Another indicator of nutritional quality is nutritional education. Most serving stations in the cafeteria provide nutrition information such as calories, fat calories and vitamin counts. Posters include information about portion size and what types of food constitute a balanced diet. In the Bison and other areas where items are packaged �“to go�” some nutrition information is provided on labels. A monthly mailer focusing on nutrition is also distributed to students. Apart from providing this information, the University relies on each individual student to make sensible nutritional choices. Additionally, Tanya Williams, a professional nutritionist at the campus health center, is available for students who wish to consult individually about their eating habits. Vegetarian entree options (not necessarily vegan) are offered for lunch and dinner during the week, and sometimes on weekends. Food allergies usually affect four or five individuals in the student population, and are accommodated on a case by case basis. Personal attention is given to those students, and they are introduced to all dining service staff. Labels are placed on some items, such as those that contain peanuts or seafood and those that are gluten-free. In order to accommodate student preferences, Dining Services conducts a yearly survey and also regularly solicits student suggestions via opinion cards, which are available in dining venues and online.
106

Packaging and service-ware Since disposable packaging, plates, napkins, and utensils contribute significantly to the municipal solid waste stream, they also have a significant impact on the University�’s sustainability. Several dining facilities on campus operate entirely on disposable service-ware and �“to-go�” packaging including The Bison, 7th Street Café, Library Café, and the mini marts. (In contrast, Bostwick Cafeteria, the Terrace Room, and the Refectory operate by-and-large on durable service-ware.) The total annual cost of these disposable items is not trivial, approximately $232,000 per year not including the summer semester and special events. A full accounting of the disposable items used in Bucknell Dining facilities each week is provided in Appendix XII.
Materials used in disposable packaging and service-ware Most disposable service items, including utensils, bowls, plates, cups, straws, lids, bags, and to-go containers, are made from non-biodegradable petroleum-based plastics (45% on a cost basis and 35% on a unit basis). Petroleum-based plastic items are also used to a great extent in the catering of special events where food is sometimes served in large quantities (for instance graduation, alumni weekend, parents�’ weekend, and the spring picnic for staff). Furthermore, some of the catering service items (known as �“upscale disposables�” are much heavier and more substantial than those used in the dining facilities. These materials are of concern because they persist in the environment for very long periods of time and result in toxic emissions in various phases of their life cycle (See Catherine Schirm�’s research in the box below). Napkins, coffee cups, and some cold cups are made from biodegradable paper (approximately 30% by cost, or 52% on a unit basis�—largely due to the very high number of napkins used), and these all contain some recycled material. A smaller but growing number of service items are made of biodegradable plant-based plastics (approximately 25% by cost, or 13% by unit). These are clear cups used to contain cold �“to-go�” items such as grapes, yogurt, and other snacks. Additionally, biodegradable plastic plates and utensils are now being offered in catering services by request, although this has not been widely publicized. For instance, during the Focus the Nation event in 2008, Bostwick Cafeteria was closed for lunch and the meal was moved into the field house where all meals were served on biodegradable plant-based plastic service-ware. Unfortunately none of the disposable service items is recyclable or compostable under the University�’s current waste management program. However, there is strong potential to work out an arrangement in which biodegradable items may be composted or anaerobically digested in the future. A collaborative effort between Bucknell Dining, Bucknell Facilities, the Campus Greening Council, and Civil and Environmental Engineering would be required to make such a program work. If pursued, this program would significantly increase the incentive for purchasing biodegradable disposables.
Efforts to reduce the use of disposables In recognition of the many environmental benefits to reducing disposable service-ware, Bucknell Dining has worked with the Bucknell Environmental Club on two major waste reduction initiatives. The first, a reusable mug incentive program, was piloted Fall 2007,
107

Exploring the environmental impact of a disposable to-go container and utensils By Catherine Schirm * To-go containers and black plastic utensils from the Bison are used every day by lots of students. To keep up with student use, Frank Hummel, the Executive Sous Chef of Retail Operations, reports that in the Bison alone customers use 3,000 to 4,000 to-go containers a week. He also orders 9-10 cases of utensils a week, each with 1,000 utensils per case. That is a lot of plastic to send to a landfill! The to-go containers, manufactured by Dart Container Corporation, are made of polystyrene, and the utensils, manufactured by Dispoz-o, are made of polypropylene. On top of the immense amount of waste produced by these disposables, the main plastics in the two products also have negative impacts on human health and the environment in other stages of their life cycles. The production processes for polystyrene and polypropylene are relatively similar. Both are derived mainly from petroleum, thus using fossil fuels such as oil and natural gas for production. There are three main steps to the production of plastic: heating, shaping and cooling. Polymerization is the specific process that synthesizes plastic resins to create the polymers used in food packaging and cutlery. Many chemicals are used in the preparation of the production of the reactants used in polymerization, the most important ones being catalysts, monomers and solvents. These are combined to create plastic pellets. During the thermoplastic processes, pellets or granules are melted so the liquids, also known as resins, can be shaped. Dart uses extrusion blow molding, the type of process used to create hollow containers such as to-go containers. The next step, thermoset processes, transforms the resins into products (EPA 1997). The production processes create many pollution outputs. Not all of the raw materials are used, creating waste streams with various pollutants. While the waste streams vary depending on the polymer being synthesized and what production method is being used, outputs generally include byproducts and unreacted monomer. According to the Toxic Release Inventory Program, in 1997, 70% of toxic air emissions were from industries manufacturing plastic resins. Most of these emissions are carbon disulfide, methanol, and Volatile Organic Compounds (VOC�’s). The emissions come from point source locations such as pumps, valves, tanks, and compressors. Wastewater is also created during production (EPA 1997). Direct contact with raw materials, intermediate products, finished byproducts, or waste products contribute to the creation of wastewater. Wastewater is also produced from cooling operations, utilities maintenance, and monomer and polymer recovery processes such as centrifuging, monomer stripping, and slurry tanks. The water has high concentrations of contaminants such as equipment oil, spent solvent, and raw material drum residuals, as well as dilute concentrations of salts, organics, and acids from polymerization. *Catherine completed this research in 2008 as a first-year student at Bucknell, and has since transferred from the University.
108

Residual wastes are another type of pollution outputs created during the production process. These include contaminated polymer, catalyst manufacture waste, reaction byproducts, waste oil, and general plant wastes (EPA 1997). The manufacturing of polystyrene and polypropylene also has effects on human health. Exposure to styrene, mainly from indoor air pollution in the facilities, has many short and long term effects. Acute effects include mucous membrane and eye irritation and gastrointestinal effects. Chronic effects include effects on the central nervous system such as headache, fatigue, weakness, depression, hearing loss and peripheral neuropathy (EPA 2008, �“Styrene�”). The risks of health effects from the production of polypropylene are not considered as likely as risks from polystyrene.
However, studies have shown that there is a potential health hazard from occupational exposure to what is referred to as �“flock,�” synthetic polymers inhaled as microfibers.
These particles can cause inflammatory reactions in the lungs. In a study published in the European Respiratory Journal, 26% of 50 workers from polypropylene facilities had work-related respiratory symptoms (Atis and Levant 2005). After the plastics are produced, they are transported to Bucknell through by means of fossil fuels. Dart Container Corporation, the manufacturer of the to-go containers, is located in Mason, Minnesota. The containers travel about 500 miles from the factory to Bucknell, probably by truck. Dispoz-o, the company that manufactures the utensils, has distribution centers in Houston, Texas and Los Angeles, California. The Texas facility is about 1535 miles from Bucknell, while the California facility is 2620 miles. When factoring the transport of raw materials to the manufacturing facilities, it becomes apparent that significant quantities of fossil fuels must be factored into the environmental impacts of the to-go containers and utensils. Although during the �“use phase�” of their life cycle to-go containers and utensils seem to be harmless, even then some evidence suggests that the plastics may pose a threat to human health. Polystyrene, the more hazardous of the two, migrates into food and gets stored in body fat. There is evidence that every individual�’s body contains polystyrene. Even though polypropylene is safer, it still leaches into food. Water in plastic water bottles containing polypropylene has been found to contain toxics such as BHT, Chimassorb 81, Irganox PS 800, Irganix 1076, and Irganox 1010 (Ecology Center 2008). The replacement of plastic to-go containers and utensils with durable, recyclable or biodegradable alternatives would make a difference in the amount of waste the university produces. It could also help raise student awareness about environmentally responsible products, the importance of changing our consumer throw-away behavior, and also the effects of plastic in our lives and others. Modifying our products can help introduce us to a more sustainable way of living, connecting us back to nature and helping us understand our duty and place to protecting the Earth and its resources.
109

at which time special 16 oz coffee mugs were sold to customers in exchange for a discount on future coffee purchases. In spring 2008 the program was reworked to allow people to place durable stickers on their own mugs instead of purchasing a new one, thereby reducing the need for additional mugs and allowing people use the mug that they prefer. A second major initiative to reduce the use of disposables is a program to offer re-usable take-out containers in the Bostwick Cafeteria. According to data provided by Dining Services approximately 1500 large and 3000 small plastic take-out containers are used in Bostwick every week by students who prefer to take their meals to a different location. Students may now purchase a single re-usable container, return it dirty, and Dining Services will replace it with a clean one. Re-usable bags are now also made available for carrying the take-out items. This program is in the pilot phase, but has great potential for expanding and becoming a model for future waste reduction initiatives.
Food waste (see Chapter 5, �“Solid Waste�”)
Recommendations Based on the information gathered in this report, the dining assessment team recommends the following:
Food sources
Increase the amount of local food and the relationship with more local farmers especially in the area of protein (chicken, beef, pork, etc).
Consider purchasing more organic produce and free range meats.
Increase the awareness of the local food used in the cafeteria. Continue hosting the local food nights, and make a special meal once a week featuring a local item or items.
Nutrition
Show sample plates with good portion sizes and balanced meals.
Offer more and creative vegetarian and vegan options, especially with respect to protein sources.
Incorporate more fresh fruits and vegetables into cooking.
Use smaller bowls and plates to reduce portion sizes and smaller drink cups as well.
Schedule nutrition information sessions in the cafeteria with Bucknell�’s resident nutritionist to inform students about the benefits of a low fat, low cholesterol, well-balanced diet.
110

Offer more whole grain foods and low fat cheeses, and replace butter with non fat cooking spray or olive oil in prepared dishes.
Use the most popular recipes from �“hemisflavors�” to expand the number of recipes using fresh produce.
Place salad bar and stations offering the healthiest food in prominent locations to draw people away from fried foods.
Packaging and service-ware Continue working on decreasing the packaging and moving towards more
sustainable packing (ie reusable takeout containers).
Increase student awareness and interest in waste reduction initiatives. Continue to work with Tom DiStefano and the Engineering Dept and Facilities to put a full scale Anaerobic Digester in place to be able to handle all food waste produced.
As a long term goal, make all service-ware durable and/or biodegradable.
Recommendations for future monitoring
Continue to track percentage quantities of local foods purchased, especially produce, meat, eggs, and dairy.
Continue to track disposable service-ware and packaging quantities through the spreadsheet.
Maintain and expand the roles of the Student Sustainability Coordinators who can keep track of monitoring all aspects of dining
111

Chapter 8. Built Environment
112

Buildings are some of the most resource-intensive components of the campus, using vast quantities of metals, wood, concrete, brick, glass, plastics, and other materials. Campus buildings also require extraordinary amounts of energy for their use and maintenance. Furthermore, these buildings have very long life spans, so any decisions made about their design and function will have lasting impact. It is therefore prudent to examine, as closely as possible, the process of constructing new buildings on campus, in order to maximize the potential for their sustainable design and use. Transportation is also a highly energy intensive aspect of campus operations. As mentioned in the previous chapter, a study by the Union of Concerned Scientists determined that reducing gasoline consumption is the foremost action that a consumer can take to reduce his or her personal impact on environmental quality (Brower and Leon 1999, p. 85). The design and planning of campus transportation infrastructure has the potential to influence automobile use to a great extent, thus setting the stage for fuel conservation by the thousands of campus community members who drive their automobiles to and on campus each day.
Master planning Within the development of the new Campus Master Plan, a process which began in 2005 and concluded in 2008, a set of principles were established based on consultation and review by many members of the campus community. With the use of these principles, Bucknell hopes to achieve a campus that enhances not only academic areas of the university but also the surrounding natural areas. The Master Plan lays out the desire to commit to environmental planning policies while being financially practical.
Planning Principles:
Be a pedestrian campus
Use existing space purposefully and thoughtfully
Reflect the Larson Plan by tying new construction into a sense of this place
Be open to its natural neighbors and remove obstacles to seamless integration
Commit to environmental planning policies
Integrate Bucknell West into the core mission of the University
Maintain or enhance the quality of academic facilities, student housing, extracurricular environments, and support areas
Integrate the planned and natural environments more fully with one another and The Plan for Bucknell
Encourage development in the corridor between the campus and Lewisburg�’s Market Street and along Market Street itself
Seek financial partners and use the entire scope of University resources to accomplish these goals
113

The Campus Master Plan hopes to decrease the impact of car traffic on campus by creating an outer loop/road around the perimeter of campus with smaller inner loops into the campus core to provide handicap and emergency vehicle accessibility. In addition, the Master Plan looks to increase walking and biking on campus by adding signed and safe walking and jogging trails both on campus and off, connecting with the surrounding neighborhood and ultimately the region. There are also plans to add indoor bike storage facilities or racks, and potentially separate bike lanes (Shepley Bullfinch 2008). To help achieve both of these goals and to increase the green space of campus, the surface parking currently located within the five-minute walking radius on campus may be moved to a zone between five and ten minutes away, or into structural parking, preferably below grade. Potential structural parking locations include both ends of the athletic facility and a major underground structure below the first phase of the new academic quad. In order to decrease the impact of surface lots, these will be designed to higher environmental standards, minimized in size, and screened in with significant landscaping. New surface lots are proposed at the south end of the South Village Farm, the south end of the stadium, and in the middle of the west campus athletic complex. Current surface parking will be reorganized and enhanced to minimize impact (Shepley Bullfinch 2008).
Historic preservation With the recent development of an Architectural Preservation Master Plan funded by The Getty Foundation�’s Campus Heritage Grant Program and preformed by John Milner Associates, Inc., Bucknell now has a set of guidelines on how to most seamlessly connect the current campus with future projects in order to maintain the architectural context and integrity of projects. In addition to guidelines, the plan provided the university with a list of suggested projects, such as brickwork needed on Trax Hall or a restoration of the quad between Trax, Kress, and Roberts, that will further enhance the campus. This preservation plan took place between 2004 and 2006, with the final draft submitted to The Getty Foundation in March of 2006 (Silvers 2008).
The planning process for new buildings New projects often create the need for a committee made up of members of the campus community most closely tied to the building�’s use. These committees typically consist of faculty, staff, deans, and students. There once was an agreement with the top administration that there should be campus wide committees with broad representation of the Bucknell community and must contain a certain number of faculty and students depending on the project. This process has since been abandoned because of the large committees it created. Today, committees are as small as possible in order to increase efficiency. There are hopes, however, to revert back to the old process because it ensured the campus community had a voice (Hostetler 2008).
Community ties Bucknell holds multiple meetings for members of the surrounding municipalities in order in inform them of new campus plans. Meetings are often not well attended and typically those who do participate tend to have disagreements with the University�’s proposals. In
114
addition to getting community opinion, Bucknell will talk with the Borough Manager or the Borough Foreman (Smith 2008). Bucknell's involvement in the Union County Comprehensive Plan is fairly significant. The University has a representative serving on the county's 28 member plan advisory committee. Additionally, Bucknell's administration participated in an interview with county staff and project consultants and has been sharing data and information with the county regarding future plans on and adjacent to campus, downtown, etc (McLaughlin 2008).
Selecting planners and architects When the University selects architects and planners, they begin with a list of over 160 firms, ranging in size and location. They will then pick roughly 60 architects based on university need and architect experience and begin the application process in order to identify individuals whom best fit the needs of the project. The firm is then reached and asked to fill out a preliminary form. At this point, firms are not allowed to come to campus or contact faculty, they are not told any specifics on the project, and they are not allowed to diverge from the form in any way. By restricting every firm to the same form, they are easily compared and the top 20-30 will be sent packets of information compiled by the design committee. This typically includes maps, members of the steering committee, feasibility studies, contracts, and electronic documents and photos of the campus. After looking over these documents, the firm will have two to three weeks to put together a proposal booklet. Most of these typically include a potential schedule and cost estimate, and some incorporate a list of awards the firm has won. Each firm spends anywhere from $5,000-$10,000 assembling this booklet, despite the chance they will not be selected. All Bucknell members involved, including steering committee members, look through these booklets and the previous list of 20-30 is narrowed down to 3-5 firms. These 3-5 firms then must come to campus for a question answer session with the steering committee. Finally, the top firm is chosen, often based on which will give the University the lowest cost estimate while still maintaining a good chemistry with members of the community (Hostetler 2008). While this process may not seem to take into consideration �“green�” architecture, those in Bucknell�’s Construction and Design office feel that a lot can be said about a company that sends in their application electronically rather than sending in 10 hard copies. Also, because sustainability and green design are such hot topics today, many of the awards the firms choose to incorporate into their book show a firm�’s ability to build and design in this way (Hostetler 2008). Construction(See also Chapter 3: �“Energy production and consumption�”) Bucknell has added substantially to its building space in the recent years. From the construction of the science complex in 1988 to the completion of the Breakiron Building in 2003, the University added nearly 600,000 square feet of building space in fifteen years. Significant renovations have taken place as well. Table 8.1 below summarizes the
115

Table 8.1. A summary of construction projects at Bucknell University since 1988. (Salyards 2008. Adjusted to 2007 Cost/Sq. Ft. based on R.S. Means 2007 Square Foot Costs, historical cost index for Harrisburg, PA for new construction only.)
Building Name Year Description Sq. Ft. Cost/Sq. Ft.
Adjusted to 2007Cost/Sq. Ft.
Rooke Chemistry 1988 New Construction 71419 $100.16 $149
Olin Science 1988 Renovation included with Rooke 50746
included above
Golf Course 1989 Club House Addition 3900 $113.04 Langone Center 1989 Bookstore Renovation 11665 Langone Center 1990 Bison Renovation 10100 $45.41 Biology Building 1990 New Construction 83258 $116.63 $206 Botany Building 1992 Entire Renovation 9922 $37.90 Taylor Hall 1994 Entire Renovation 26346 $63.07 Larison Hall 1995 Entire Renovation 55588 $7.11 Sunflower Daycare 1995 New Construction 4293 $64.83
$102
Langone Center 1996 Bison Renovation 4030 Harris Hall 1998 Entire Renovation 30160 $33.40 Vaughan Literature 1998 Classroom Renovations 5772 $35.66
Bertrand Library 1999 1st Floor Renovations 25608 $11.49
Swartz Hall 1999 Renovation of Center of Bldg. 3925 $34.08
McDonell Hall 1999 New Construction 98000 $115.71 $162 Weis Music Bldg. 1999 New Construction 29835 $171.13 $240 Vaughan Literature 1999 Auditorium Renovation 5470 $46.46
Galloway House 1999 Entire Renovation 3856 $59.91 Coleman Theatre 2000 Theatre Renovation 2800 $189.13 Dana Building 2000 CLE Addition 3140 $137.31 KLARC 2001 New Construction 178000 $150.50 $201 O'Leary Center 2001 New Construction 43180 $140.95 $188 Coleman Hall 2001 Entire Renovation 46320 $93.44
Langone Center 2001-02 Bostwick Renovation 35060 $37.26
Theta Chi 2002 Entire Renovation 8598 $34.63 Breakiron Building 2003 New Construction 38500 $184.56
$236
Vedder Hall 2003 Entire Renovation 79644 $30.05 Dana Building 2004 Dana Repurposing 25430 $15.95 Delta Upsilon 2005 Entire Renovation 14424 $65.63 Olin Science 2005 Renovation 2828 $91.01 Rooke Chapel 2005 Renovation 15546 $58.68 Taylor Hall 2007 Renovation 2060 $68.39
Swartz Hall 2007 C&D Wing Renovations + Utilities 35944 $169.23
116

major construction projects completed by Bucknell during the past 20 years, including building name, function, date of construction, area in square feet, and approximate cost per square foot.
Expansion and renovation plans By 2013, the university has plans to reduce the number of students allowed to live off campus from the current 365-385 each year to only 200 students per year (Audette 2008). Coupling that with plans to demolish the Mods, there will be a future need of over 600 new beds on campus. In order to meet this need, land behind the library and Fraternity Road will be developed. Current plans for a �“South Village Farm�” will include fraternity housing, affinity housing, apartment style living, and alternative housing for seniors who would have opted to live off campus (Shepley Bullfinch 2008; Hawley 2008). In the next five years, planning will begin on an addition to the library and parts of a new academic quad located directly behind the library, mirroring the current academic quad. If possible, construction on either one or both sides of the new quad will begin, but before this can take place replacements must be built for the fraternity houses that will be torn down to make way for this new construction. Because Bucknell typically looks to reuse or reassign existing buildings before constructing any new facility, there are plans to potentially renovate Carnegie into office space, student space, archives/gallery space, or new presidential office space depending on future needs (Hawley 2008). While specifics about future construction are not yet �“set in stone�”, it has been established that most new buildings will be designed as interdisciplinary space when possible. Building this way will insure that new construction is capable of being flexible should the need arise. Designing a building to the specifications of one department creates limitations on future building use (Hostetler 2008). There are plans currently in the developmental stage that will relocate the Route 15 and Moore Avenue entrance into Bucknell. Should the university find benefactors to contribute the necessary funds, it is likely that we will see design plans for a new inn and conference center with a substantial parking structure close to this new entrance. Also, it is written in the Campus Master Plan that there is a need for a welcome center that will serve as a replacement for admissions, financial aid, and alumni relations. This is to be located near the new Route 15 entrance (Hawley 2008; Hostetler 2008) In hopes of better connecting the Bucknell community with Lewisburg�’s Market Street, there are plans to acquire or lease the current Lewisburg post office and turn the upper levels into space for administrative services while keeping the ground floor the post office. There are also plans to acquire or lease the Borden building on the corner of Market and Fourth Street for the University�’s new bookstore (Hawley 2008).
Green buildings Before Bucknell begins planning the construction of a new building, the uses of the University�’s current buildings are assessed in hopes of reassigning one or multiple buildings to meet needs. Should it be decided that a new building is necessary, there are
117

usually very few extra �“green�” features incorporated into construction besides what is laid out in the International Building Code which Bucknell follows (Hostetler 2008). While the University does not harvest local timber, it does purchase all brick locally (less than 75 miles away) from Glen Gery in Shoemakersville, Pennsylvania. Although it brings a higher initial cost, the long life span and low maintenance requirements of brick pays off in the long run (Hawley 2008). Additionally, in attempts to lower energy costs, Bucknell uses all clad windows, energy efficient insulation, low flow toilets, and as required in building codes, variable frequency drives in HVAC equipment and occupancy sensors for lighting (Hawley 2008). While the idea of �“green�” or sustainable design has been around for sometime, many of Bucknell�’s decision-makers perceive the technology as new, creating an apprehension towards its addition into new campus buildings. Contrary to these beliefs, there are actually many well known and established companies providing sound �“green�” product options that could be used in future construction. The University is very cautious about incorporation of new products, and until the decision makers become familiar with the substantial use and testing of these features they will most likely not end up on the campus due to concerns that the technology will not meet current performance standards. Bucknell�’s Master Plan specifies in its design guidelines that building materials should be sustainable, and that primary wall-cladding material used should be brick with a combination of solar panel and slate roofs (Shepley Bullfinch 2008). In addition to the principles laid out in the Master Plan and in continuation with current procedures, Bucknell will continue to use existing space purposefully and thoughtfully instead of building new and taking over green space (Hostetler 2008).
Leadership in Energy and Environmental Design (LEED) certification In January 2008 President Mitchell pledged to consider pursuing LEED certification for all new campus construction over $500,000. LEED certification is often not pursued because of the perception by decision-makers that it will add 20% to the cost of a project, and Bucknell has had a difficult time finding the funding necessary for the additional consulting and paper work required to certify a building. This perceived 20% cost increase likely originates in the price of certifying a building as LEED Platinum, while LEED Silver certification may increase costs by as little as 2% (Hawley 2008). Several studies have been completed on the costs of sustainable building construction. The most complete study (Kats 2003) is based on 33 LEED registered buildings. It suggests a nominal increase in first cost of only about 2%. Note that 12 of the 33 buildings are in Pennsylvania, and these are primarily state-owned buildings and elementary schools. Construction estimates for new buildings are typically only accurate to within 15% or more and construction budgets include a contingency of similar magnitude to account for this. Therefore the cost �“premium�” of a few percent is well below the level of accuracy of the cost estimates.
118
Additionally, a National Renewable Energy Laboratory (NREL) study of a 20,000 sf commercial building also found about a 2% increase, but about a 40% reduction in annual energy costs (NREL 2003). The energy savings had a payback period of less than 9 years. (This includes a full economic model to consider the �“cost of money�”.) A more recent study (Davis Langdon 2007) focuses on first cost in light of more widespread adoption of sustainable building practices and the recent increase in building costs (25% in the last 3 years). Their findings are important:
1. Many projects are achieving LEED within their budgets, and in the same cost range as non-LEED projects.
2. Construction costs have risen dramatically, but projects are still achieving LEED.
3. The idea that green is an added feature continues to be a problem.
The study includes specific analyses of three types of academic buildings (classroom, laboratory, and library). LEED registered buildings appear distributed across the entire price range.
There is a fee for the LEED-certification process itself, and there are some additional initial costs that are necessary, such as building commissioning. Typically these are small in comparison to the lifetime cost of the building. The true cost of building design should really be measured on a life cycle basis, rather than first cost basis. Life cycle building cost includes first costs due to construction as well as building operating costs and end-of-life costs. Building operating costs include cost of energy (HVAC and electricity), water, solid waste, and building maintenance and renovation. Well-documented life cycle costs from actual construction are difficult to find. Many available data are based on predicted costs and may only include limited components (energy being the most commonly studied). Some estimates are that the construction cost is on the order of 10% of building life cycle cost, but this may vary widely depending on the assumed lifetime of the building. Government and institutional owners expect to own the building for the entire lifetime, so life cycle costs should be a major factor in any economic analysis of these types of buildings. This is the primary reason why federal and state governments and institutions are major players in the high-performance building market. Sustainable buildings also have documented economic and other benefits that are not captured in the cost of the building itself. For commercial office space, sustainable buildings have been demonstrated to increase productivity and reduce absenteeism among occupants. In the commercial setting employee costs (salary and benefits) are typically about 8 times greater than building costs (lease and utilities) and thus a small increase in productivity represents a significant economic benefit. Although the University does not measure its costs in the same manner, productivity-related economic benefits to the University may still be substantial. For instance, studies of sustainably designed elementary schools have documented an increase in standardized test scores,
119
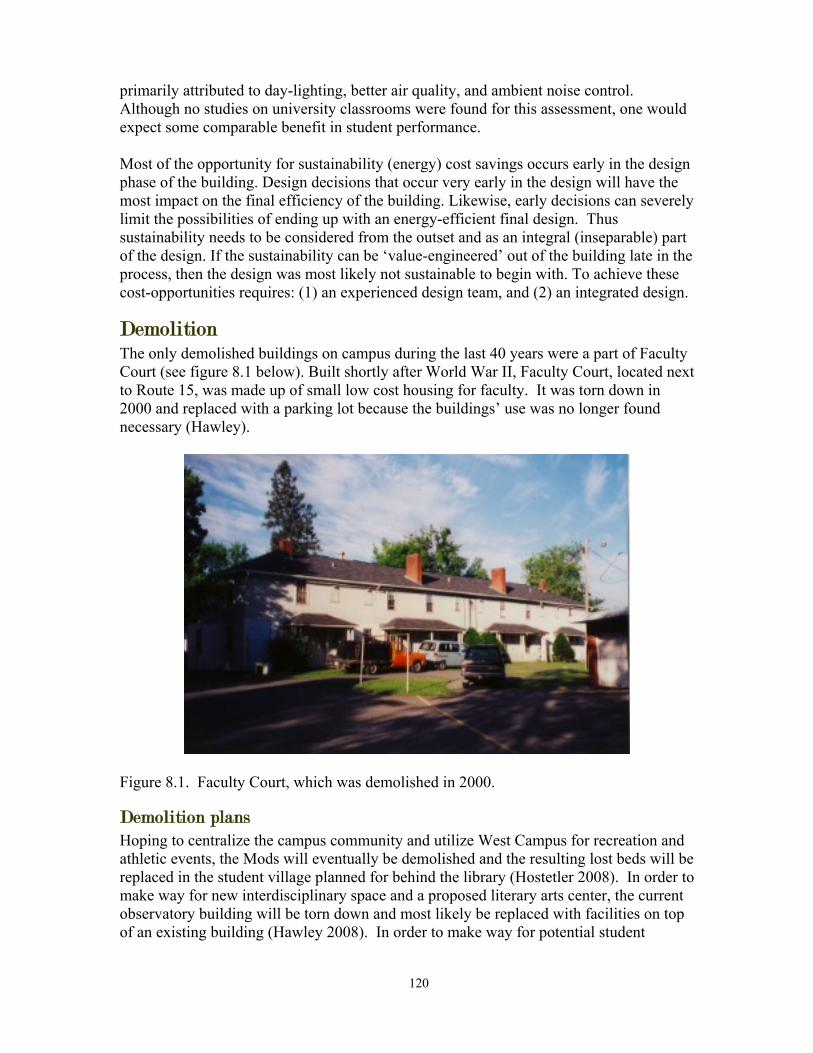
primarily attributed to day-lighting, better air quality, and ambient noise control. Although no studies on university classrooms were found for this assessment, one would expect some comparable benefit in student performance. Most of the opportunity for sustainability (energy) cost savings occurs early in the design phase of the building. Design decisions that occur very early in the design will have the most impact on the final efficiency of the building. Likewise, early decisions can severely limit the possibilities of ending up with an energy-efficient final design. Thus sustainability needs to be considered from the outset and as an integral (inseparable) part of the design. If the sustainability can be �‘value-engineered�’ out of the building late in the process, then the design was most likely not sustainable to begin with. To achieve these cost-opportunities requires: (1) an experienced design team, and (2) an integrated design.
Demolition The only demolished buildings on campus during the last 40 years were a part of Faculty Court (see figure 8.1 below). Built shortly after World War II, Faculty Court, located next to Route 15, was made up of small low cost housing for faculty. It was torn down in 2000 and replaced with a parking lot because the buildings�’ use was no longer found necessary (Hawley).
Figure 8.1. Faculty Court, which was demolished in 2000.
Demolition plans Hoping to centralize the campus community and utilize West Campus for recreation and athletic events, the Mods will eventually be demolished and the resulting lost beds will be replaced in the student village planned for behind the library (Hostetler 2008). In order to make way for new interdisciplinary space and a proposed literary arts center, the current observatory building will be torn down and most likely be replaced with facilities on top of an existing building (Hawley 2008). In order to make way for potential student
120

housing in the distant future, the Public Safety office, Ziegler Health Center, and the Engineering Structural Laboratory will eventually be torn down and replaced elsewhere on campus. These projects will most likely not occur for the next 10 �– 15 years (Hawley 2008; Shepley Bullfinch 2008). The new campus plan has the intention of centralizing all of the arts into one location near the current Weis Performing Arts Center and Music Building. Therefore a new art building would likely be built near these facilities. There is also a desire to recapture the land where the art building currently stands after demolition in hopes of enhancing the current green space of the Grove. However, these plans are not definite, and this space is currently designated as future academic space (Hawley 2008; Shepley Bullfinch 2008). Lambda Chi and Kappa Delta Rho will be the first of the fraternity houses to be torn down to make way for the new academic quad. The rest of the fraternity houses will be demolished over the next 15-20 years. Specifics of the replacements are still in the idea phase, but they will most likely be included in the student village behind the library (Hawley 2008; Shepley Bullfinch 2008). There have been attempts for the past several years to tear down Cemetery House, located on the corner of 7th Street and St. George. Because this is technically listed as a contributing piece of architecture, demolition plans have been unsuccessful, however, by preserving the building through a technique known as "historical mitigation" the university may be able to tear it down while still keeping records of the building and it�’s architecture, history, provenance and manifestation (Hawley 2008; Hostetler 2008).
Demolition waste The contractors handle all waste material from campus construction or demolition. It is written into the official contract that it is the responsibility of the building company to handle any and all waste in the appropriate manner. All hazardous material removed from a building is considered Bucknell owned even after leaving the campus, and the University must be able to show a chain of custody that approves everywhere that material goes. All material eventually is sent to a local landfill (Hostetler 2008). Very little is reused or recycled because of the perception that it will increase building cost. However, on larger projects there will be separate dumpsters on site for different materials such as woods, metals and depending on the project, carpet may be separated out as well. Unfortunately, none of the recycled or reused material is tracked (Hostetler 2008). Salvaged wood is used to create Bucknell�’s mulch. After collecting leaves, shrub and tree trimmings, stumps, and construction debris a tub grinder is used to grind the material into mulch sized pieces. This is then put into large piles and turned on a regular basis (Hawley 2008). LEED certification includes as many as 4 points related to recycling and reuse of construction materials. It is likely that the University will need to adopt some recycling and reuse to achieve LEED certification in coming years. Effective construction waste management can actually reduce costs by reducing tipping fees and waste transportation.
121
Specialty waste management contractors exist in Central PA that have experience in this field and can do it cost-effectively. It is likely to be most effective on large, new building projects. Salvage materials and contents can be used on other Bucknell renovation projects, donated to local contractors and businesses (e.g. ReStore of Bellefonte, Hand-Up Recycling of Milton), non-profits (Habitat for Humanity, Union County Housing Authority) or used to start a local building salvage material business. Such requirements would need to be stipulated in the general conditions of any construction contract, and may or may not result in increased overall cost depending on how they are implemented.
Indoor air quality In order to ensure the best indoor air quality possible, Bucknell will test the air quality of campus buildings and make necessary upgrades to older ventilation systems. The frequency of maintenance on ventilation equipment depends on the size of the equipment. Large systems will be checked more frequently than small systems and checkups may take place on all different frequencies from monthly to semi-annually to even annually. Typically, facilities will check or replace air filters, tighten belts, and check the cleanliness of cooling/heating coils. Upgrades will include increasing the total amount of airflow in a room or building or bringing in more outside air (Knight 2008; Koontz 2008). In bigger volume buildings such as the Weis Performing Arts Center or Sojka Pavilion, the CO2 is monitored to maintain proper concentration levels. Because it is an expensive and complicated process, it is only reserved for buildings used for periodic events with large attendance (Knight 2008). University building ventilations systems follow all industry standards laid out by the American Society of Heating, Refrigerating and Air-Conditioning Engineers (ASHRAE). ASHRAE is the professional organization that establishes design standards for building ventilation systems, which are often incorporated in building codes. Bucknell requires engineering firms to design building ventilation systems for campus facilities to meet the relevant standards as well as local, state and federal code. The standard referenced the most is Standard 62.1-2007 - Ventilation for Acceptable Indoor Air Quality. This standard defines the requirements for ventilation for acceptable indoor air quality such as minimum distance for fresh air intake from an exhaust source, minimum ventilation rates in a classroom, and minimum exhaust rates for a bathroom. Standards that will soon be incorporated include ASHRAE Standard 90.1-2007 Energy Standard for Buildings Except Low-Rise Residential Buildings and ASHRAE Standard 90.2-2007 Energy Efficient Design of Low-Rise Residential Buildings. There are numerous other building/area/process specific standards but these are the two most commonly used (Koontz 2008).
Volatile organic compounds (VOC) While Bucknell often does not look to specifically buy products known for low toxic off-gassing, some of the products Bucknell utilizes do meet this need. Lees Carpeting is one
122
such product, regularly installed at the University, which is both durable and low in toxic off-gassing. Typically, most of the low VOC restrictions laid out in construction or renovation specifications address paints and adhesives. Bucknell does not go above and beyond any VOC regulations laid out in industry standards, but many chemical components are naturally restricted in construction (Vieceli 2008). The experience cited above suggests that it is possible for a product to be durable, cost-effective and environmentally responsible. It is unclear whether the low VOC products mentioned would meet the more stringent criteria necessary for LEED certification.
Air quality complaints All air quality complaints are taken very seriously and if a concern is raised, a facilities staff member will typically do an initial check to assure the building ventilation systems are functioning normally. If nothing obvious is found, a consultant will be hired to take air quality measurements in the space to determine whether there are any unusual contaminants present. If so, they will provide recommendations for correcting the situation. If campus members call in a problem as a work order, the facilities office is capable of tracking progress. For more significant issues, there is a utility project list used to track the work. In either case, the work is initiated by calling the Facilities office. There is not a specific form for air quality concerns, however, if it�’s deemed necessary to bring in a consultant, the affected occupants fill out a survey to develop a sense of the type of problem people perceive. Typical complaints are often a result of improper placement of copy machines in poorly ventilated rooms causing indoor ozone. Humidity, stuffiness, itchy eyes, and rashes are also issues brought to the attention of facilities but are often highly specific to individuals using the area of complaint (Knight 2008). Adjustments have been made to many air systems to address high humidity. Previously, when hot air was brought into the system it was lowered to 70 degrees leaving 100% humidity behind. Now, warm air will be brought into the system and lowered to 55 degrees. Then it is warmed to 70 degrees. While this does consume more energy, only 50% humidity remains. The only exceptions to this process are a few sensitive areas, such as Samek Art Gallery, Weis Center and Weis Music auditoriums, in which the humidity level in the space is watched and the ventilation system is controlled, usually 50% RH. There are newer systems that use desiccants to dehumidify incoming air, but these have yet to be installed on campus. Most recently, Vedder, Trax, Kress, Swartz, Taylor, and Marts have all had upgrades to their ventilation systems (Knight 2008). When indoor ozone is found to be an issue, it is typically a result of copy machine placement under a vent, which carries air throughout the entire building. The machines will either be moved to a better location or the number of machines will be decreased. Any complaints of mold result in a thorough cleaning of the room and shampooing of the carpet. Once clean, an outside agency will come in to test if there is still an issue (Knight 2008).
123

Projects completed in the engineering labs and machine shop (PDL) often require the use of high VOC paints and adhesives. Presently there are no proper facilities for the safe use of such products and their use can result in substantially affected air quality in parts of Dana. There have been several incidents in the past five years, including reports filed with the Environmental Safety Officer. Other recent incidents include the use of high VOC paints by unsupervised students in classrooms and project rooms with no ventilation. The resultant fumes are spread to adjacent spaces and through the building HVAC system. Students and faculty advisors seem generally uninformed about the proper handling and use of such products.
Transportation During the 2007-2008 year there were 2104 student cars and 4824 faculty and staff cars registered on campus making for a total of 6928 total registered vehicles. 40% of registered students/faculty/staff registered two cars and a very small percent registered three or more cars (Lapp 2008). As of October 2007, there were a total of 1,148 faculty and staff members on campus. The reason for the substantial difference between number of faculty and staff and the number of registered cars is due to faculty and staff registering multiple cars and retired faculty and staff members that may no longer work on campus still retaining their parking privileges (Lapp).
Commuting The best available data commuting on campus commuting habits comes from Bucknell�’s first greenhouse gas emissions inventory completed in 2006 by Christine Kassab �’08. 214 faculty and staff and 149 students responded to the survey. This data was extrapolated to the University as a whole (Kassab 2006, p. 12). The data revealed that over 50% of faculty and staff members live within 5 miles of campus but most people, even most of those living within 3 miles, choose to drive. According to the report, only those who live less than one mile from campus walk or bike more often than they drive. Of those faculty members who drive, most drive alone, and those who carpool typically live more than 15 miles from campus. Overall the survey determined that over 85% of faculty and staff drive to work, and that only 16% of faculty and 4% of staff carpool (Kassab 2006, p. 12). As for students, the number of usable responses in the study was very low (87), but based on this small number, the data revealed that for those who did drive to or around campus, the total distance driven per week was less than 5 miles. Approximately 69% of students drive to campus, whether is be from the Lewisburg community, downtown, Bucknell West, or just from one end of campus to the other. Of these, it was determined that about 35% of students ride alone, while about 65% carpool (Kassab 2006, page 13). This data is being updated for the next greenhouse gas emissions inventory which will be completed by May 2009.
124

Traffic on campus There is relatively little traffic congestion on Bucknell�’s campus, and with the exception of periodic large volume event such as an athletic game, the majority of congestion is created in parking lots and along streets as drivers search for an open space. There is also some congestion at the intersection of Moore Ave and 7th Street due to pedestrian activity coming to and from the Langone Center and 7th Street. Some efforts have been made to encourage alternative modes of transportation, including the following:
Some parking lots have been moved to the perimeter of campus and green spaces have been put in their place to encourage walking, e.g. the quad between Dana and Olin/O�’Leary, although this limited effort has not been much of a deterrent to those who wish to drive around campus.
The Bison Bikes program, recently developed by Bucknell Student Government,
allows students to use a pool of bikes on campus free of charge. (See also �“Bicycles�” below.)
The University offers weekend shuttles to Wal-Mart and Weis, but they are often
cancelled due to lack of participation from the students.
Human Resources has created a faculty/staff online ride board (through �“My Bucknell�”) to promote car-pooling.
Pedestrian concerns During the past several years the transverse striping on most crosswalks has been removed, making them less visible to drivers, thereby increasing risk to pedestrians. In other locations the striping is severely worn also reducing visibility. In many locations on campus, crosswalks are not coordinated with adjacent walkways. There are crosswalks that do not lead to paths and paths that end at streets with no crosswalks. Studies of pedestrian mobility on campus by students of Professors Richard McGinnis and Michael Malusis have revealed the following problem areas:
Loomis Street and Walker Street: �“�…has a high volume of pedestrian traffic due to the large number of students living in the four surrounding dorms. After observing the intersection, it was found that it is currently unsafe for pedestrians due to visibility, driver compliance with traffic laws, and existing pedestrian and vehicle facilities. For visibility, bushes block the corner of the crosswalk where pedestrians wait to cross; making drivers unable to sufficiently see pedestrians. The corner also has a sharp curve and drivers cannot see pedestrians crossing on the other side of the curve�” (Asmundson et al 2007, page 9)
7th Street and Moore Ave: �“�…cars often roll into the crosswalks on all
approaches. Although the vehicles yield to pedestrians, rolling into the crosswalk
125

hinders the pedestrian�’s ability to cross the road safely while in the crosswalk. The main reason why cars go into the crosswalk before passing through the intersection is because the line of sight between the Southern and Western approaches is poor. The Western crosswalk, crossing from the Elaine Langone Center to the parking lots, is extremely unsafe. Since the stop sign and stop line are beyond the crosswalk, vehicles rarely stop for pedestrians who are trying to cross safely. Although it is the law to yield to pedestrians, observations of the intersection indicate that vehicles drive right through the crosswalk to the stop line. (Asmundson et al 2007, page 10)
Moore Ave: �“Due to the abundance of parking spaces located along the sides of
the road, pedestrians have problems seeing oncoming vehicles. Parking is located close to the crosswalks for this area. Thus, pedestrians have to step far into the crosswalk to even notice if a car is coming. The vehicles also have a problem seeing the pedestrians waiting to cross because the vehicles parked along the sides of the roadblock them from view. Another issue discovered in this area was that there is a sidewalk located only on the Northern side of Moore Avenue, but not on the Southern side. This provides a problem for the vehicle owners who park on the Southern side of the road. When pedestrians get out of their vehicles, the only way for them to get to the Elaine Langone Center is by crossing the street to get to the sidewalk, or by walking in the road for a considerable distance until they get to their destination. Most pedestrians tend to use the latter option, thus, creating a safety issue for oncoming traffic. It is also a safety issue for pedestrians, who risk being struck by an oncoming vehicle.
An issue that was somewhat surprising with this area was that there are areas where pedestrians are expected to cross, but there are no existing crosswalks. These areas are especially dangerous because drivers do not know they are required to slow down due to the lack of paint indicating that pedestrians have the right- of-way. Also, there are no �‘Yield to Pedestrian�’ signs in this area; these signs would help alert drivers to the fact that there is an abundance of pedestrians.�” (Asmundson et al 2007, page 11)
Fraternity Road: �“There are no sidewalks along Fraternity Road and no
crosswalks exist across Fraternity Road linking the Farm Lot to the rest of the campus. Pedestrians are forced to travel along the road, which is especially dangerous in areas where visibility is low. Another danger comes from speeding vehicles. The posted speed limit is 15 mph but the 85th percentile speed is 25 mph and the average speed is 21 mph.�” (Abellard et al 2007, pages 7 �– 8)
Seventh Street: �“�…on the southern end of campus is a serious problem area for
pedestrians. The street crossing next to the Biology Building, on the west side of Seventh Street, has no marked crosswalk to offer pedestrians safe access when walking from the uphill Langone Center to the Kress Hall area. The small asphalt section that connects the Kress Hall path to Seventh Street is in poor condition, which hinders a pedestrian�’s walking path. On the west side of the Seventh Street,
126

there is no sidewalk along the Biology Building. This forces pedestrians to walk in the street and in the line of traffic when moving uphill.�” (Abellard et al 2007, page 11)
Parking There are roughly 2,638 parking spaces on campus, including 15 minute parking, handicapped parking, service vehicle parking, and the west fields. There are an additional 415 spots not owned by Bucknell but monitored by Public Safety (Lapp 2008). Approximately 551,173 square feet of parking exists on Bucknell�’s main campus, comprising approximately 8% of the 153 acres east of Rt. 15. This works out to approximately 113 square feet of parking per person in 2007.
Parking restrictions Parking permits are required for all students, staff, and faculty. Students pay $50.00 per year, and $5.00 for additional cars. Students may register as many cars as they would like as long as they pay for a permit. Students registering multiple cars are typically registering a second 4-wheel drive vehicle for the winter months. First-year students or those in poor standing with the university are not allowed to bring cars to campus unless specific permission is given. Faculty and staff may each register up to three cars at no charge. After the third car they must pay for a permit (Lapp).
Bicycles A thorough study of bicycle usage and infrastructure was conducted in 2007 by students Civil and Environmental Engineering 330: Introduction to Transportation Engineering. A survey of bicycle use habits was sent to all students, staff, and faculty, yielding 205 responses. A summary of the data resulting from the survey is provided in table 8.2 below. Table 8.2. Summary of bicycle usage data (Kaplan et al, 2007). Percent of people who live on campus and OWN a bicycle 73 Percent of people who live on campus and have their bicycle on campus 26 Percent of people who live downhill and walk to class 95 Percent of people who live downhill and bike to class 4 Percent of bicycles registered with public safety 10 Percentage of people who use their bicycle for the following purposes�… To Get to Class 29 To Get Downtown 13 Recreation 52 To Get to the Mods/Athletic Fields 6
127

The authors of this study note that �“while the survey showed that 94% of students who live downhill walk to class; it is these students who likely drive to class more often as well due to their relative long distance from most academic buildings.�” It was also noted that �“while the survey showed only a small percentage of people having their bicycles registered; Public Safety suggests that the actual percentage is even lower�” (Kaplan et al, 2007, Page 9). There is no registration requirement for bicycles on campus, however national registration is encouraged. Registration enables Public Safety to locate missing or stolen bicycles and return them to their owners. To determine the current status of bicycle infrastructure on campus, the students tallied o bicycle racks throughout the campus. The observation took place on Wednesday March 28th, 2006, between the hours of 4 and 7pm. Data recorded included the location of the bicycle rack, total capacity, number of bicycles parked, condition of rack, proximity to building door, and proximity to path. A summary of data from this portion of the study is provided in Table 8.3 below. Typical bicycle facilities are shown in Figure 8.2. Total Number of Bike Racks 46 Total Current Capacity 565 Number of Bikes in Racks 193 Number of Racks in Good Condition 14 Number of Racks in Fair Condition 11 Number of Racks in Poor Condition 15 Number of Racks in Very Poor Condition 6 Locations Needing Racks 10 On the basis of the above data, the first conclusion of the study was that the condition of the bicycle racks on campus was poor. 32 racks out of a total of 46 on campus were determined to be in fair condition or worse. Racks that were determined to be in poor or very poor condition often displayed similar characteristics. These racks were severely rusted, mainly due to the fact that they are not painted or coated. Many of racks in poor condition or worse also had rungs that were missing, broken, or bent. Of the 46 bicycle racks on campus, only six were protected from precipitation. These racks are located behind Leiser House and underneath the Smith Hall breezeway (Kaplan et al, p.10). The study also revealed that there were locations on the Bucknell campus without bicycle racks. These locations include: The Career Development Center, Taylor Hall, Taylor House and surrounding small houses, The Public Safety Office, The Student Health Center, The 7th Street House, The Weis Center, the stadium, the observatory, The Brungraber Structural Testing Laboratory, and the tennis courts. (Kaplan et al, p. 10) Currently there are no specific bicycle lanes or trails on campus. However, the campus Master Plan does suggest the construction of bicycling and walking trails around the perimeter of campus to encourage a walking campus and connection with natural surroundings (see �“Master planning�” above). Bucknell Facilities is currently in communication with the East Buffalo Township Pedestrian and Bicycle Committee to
128

consider pedestrian and bicycle trails through west campus to nearby residential neighborhoods.
Figure 8.2. Typical campus bicycle facilities near the Gateway residence halls.
Recommendations The built environment assessment team recommends the following:
Buildings
Start small, try some things on low risk projects (e.g. paint, carpets, lighting, water fixtures etc.) to get some experience and establish relationships with local vendors and contractors. Such experience will be critical when we design and build a green building.
Make use of faculty expertise and student research for actual campus projects.
Pursue grants that will offset some of the �“start up costs�” of going green and provide direct campus involvement (e.g. the Luce Foundation grant for Miller Run and the Getty Preservation grant).
NaturalStep training for employees across all levels.
Design and construction
Use life-cycle costs during design to encourage better informed economic decisions.
Commit to LEED silver certification as a minimum standard .
Hire a campus architect.
129

Pursue adaptive re-use of historic structures, especially in the Lewisburg Historic District (e.g. Cemetery house).
Conduct specific studies on reuse and recycle of building materials given the expected demolition of several buildings in the near future.
Donate salvage materials to Hand-Up (Milton) or Re-Use (Bellefonte), establish a working relationship on small renovation projects.
Revise contract language for construction waste handling to require greater reuse and recycling.
Make more inclusive the means by which campus and local community provides input to the building planning and design process.
Ensure proper and safe facilities for use of high VOC products for engineering projects and labs.
Provide education of staff and students in use of high VOC products.
Improve testing and monitoring of indoor air quality to consider a wider list of air pollutants (not just CO2).
Incorporate design for adaptability and ease of renovation (e.g. raised floor system).
These specific building characteristics are recommended:
o Green (vegetated) roofs
o Passive solar design
o Solar hot water
o Low albedo, reflective roofs
o Earth sheltered design for buildings on the slope
o Light shelves and other day-lighting measures
Energy (see also Chapter 3: �“Energy�”)
Monitor building energy use.
Require detailed energy modeling by designers of new buildings.
Require building commissioning with performance-based criteria.
Educate in-house staff on energy modeling.
Make visible building energy use in real-time to occupants and via web (e.g. building dashboard).
Education
Make a LEED AP (Accredited Professional) certification a hiring preference for new staff.
130

Provide support for existing staff to become LEED APs, and have Facilities staff attend LEED training sessions.
Subscribe to Environmental Building News (EBN) and BuildingGreen.com.
Have Facilities staff attend local green building educational events (e.g. Building Green by SEDA-COG) and national conferences (Green Build).
Become members of Green Building Assoc of Central PA (USGBC affiliate).
Tour green/LEED buildings in PA.
Water (see also Chapter 4: �“Water�”)
Design and implement more innovative stormwater management (e.g. bio-infiltration, rain garden, green roofs).
Pursue collection of water for re-use, irrigation.
Implement Miller Run stream restoration plan conducted through Luce grant research.
Use pervious pavement where appropriate.
Transportation
Crosswalks:
o Increase visibility through design (striping, raised, surface treatment) or mid-crosswalk signs.
o Enforce yielding to pedestrians.
o Redesign to provide proper sight lines for both pedestrians and drivers (e.g. at crosswalk to KLARC visibility blocked by adjacent parking).
o Coordinate with sidewalks (add crosswalks in locations where sidewalks end and pedestrians are expected to cross; e.g. 7th street at Biology Building).
Implement street closures and/or traffic calming at Seventh St, Moore Ave, and Dent Dr.
Sidewalks:
o Construct new sidewalks with any new building construction.
o Use pervious pavement (e.g. new Sojka walk would have been a good opportunity).
Remove curbs to create plazas.
Coordinate with local community to improve pedestrian links and support of off-campus initiatives.
Conduct ducation campaigns through website, Bucknellian, and local papers.
131

Bicycles
Expand the current bike share/loan program (including reusing abandoned bikes).
Install more bike racks.
Consider covered bike storage areas with security gating for new residence halls.
Provide interior bike storage in dorms and new academic buildings.
Require bike registration (to allow for monitoring).
Provide changing and shower facilities in academic buildings for bicycle commuters.
Add dedicated bike lanes with all new campus road construction.
Study possible bike/pedestrian conflicts on existing paths, sidewalks.
Start a mountain bike borrowing program for use in local state parks.
Coordinate with the local community to improve pedestrian links and support of off-campus initiatives.
Conduct education campaigns through website, Bucknellian, local papers, campus events.
Parking & driving
Restructure parking fees to reflect real cost of parking.
Use a �“smart meter�” system that can charge per actual use.
Move student parking to periphery and away from academic buildings to reduce �“driving to class/to campus�” phenomenon.
Eliminate all parking in central campus except handicapped, delivery, short-term drop-off
Establish remote lots (across Rt 15 or Ames) with shuttle service.
Use pervious paving or recessed parking grids for parking lots.
Remove parking on Moore Ave.
Update records of parking permits so we know how many are actually being used (monitoring).
Create a campus shuttle loop using an alternative fuel vehicle.
Obtain alternative fuel vehicles (or cargo bicycles) for campus delivery and other service needs.
Create a car sharing program for faculty, staff and students (e.g. ZipCar).
Conduct an education campaign through website, Bucknellian, local papers, campus events.
132

Recommendations for future monitoring
Require bike registration for monitoring and tracking purposes.
Use GIS to compile better data on commuting distances (student project).
Monitor and track issue and use of parking permits.
Conduct building energy monitoring for all buildings.
Resurvey various key facilities staff after sustainability continuing education and see how their views have changed.
133

Chapter 9. Landscape
134 134

While the aesthetic appearance of the campus landscape is often admired and appreciated, its functional significance as part of the larger ecosystem is often ignored or misunderstood. The large amounts of land dedicated to college and university campuses function both as habitat for plants and animals, and as watersheds for local rivers and streams. Furthermore, the maintenance of campus landscapes to suit a traditional highly-groomed aesthetic is resource-intensive and can lead to larger scale environmental degradation. A closer look at the campus landscape and its associated maintenance impacts is essential to an ecologically sustainable campus.
Overview Bucknell�’s portion of the Central Pennsylvania landscape includes three sites comprising ca 556 acres of land. The 273 acre academic campus, 48 acres of adjacent farmland and a 127 acre golf-course, make up the core university landscape. Bucknell also owns two properties outside of Lewisburg: a 42 acre property in Cowan, and the 66 acre Chillisquaque Creek Natural Area (CCNA), totaling 599 acres.* For the purpose of this analysis, we divided the Lewisburg properties into four parts: east campus, west campus, golf course, and agricultural fields (�“farm�”). Unless otherwise noted, our analysis focuses on these four areas (See Figure 9.1 below). Bucknell�’s campus landscape serves both aesthetic and functional purposes. Aesthetically, the East campus combines two basic landscape styles. The core academic area comprises geometrically arranged quads of neatly trimmed grass lawns and well-maintained trees, shrubs, and ground layer plantings accentuate the Georgian Collegiate-style buildings. This �“classical academe�” landscape is surrounded by �“romantic pastoral�” downhill spaces characterized by less formal arrangements of trees and shaded lawns (e.g. the grove), residential halls and small houses, the railway corridor, and Miller Run. The west campus is dominated by athletic fields, modular housing, and the Art Barn, interspersed with more functional spaces devoted to tree nurseries, shredding and mulching operations, storage, and other physical plant operations. The golf course embodies a �“country club�” aesthetic combining well groomed fairways, greens, and roughs with mature trees, sand traps, and some water features. Functionally, the university landscape contributes to regional biodiversity and acts as a source, a sink, and pathway for chemicals and material inputs into the Susquehanna River and thus, ultimately, into the Chesapeake Bay. The landscape assessment team was tasked with evaluating these functional aspects in terms of sustainability, using the definition put forward by the United Nations�’ Brundtland Commission of "[meeting] the needs of the present without compromising the ability of future generations to meet their own needs." The team found this criterion too abstract to provide firm guidance and conducted our evaluation in terms of two criteria: biodiversity and environmental impacts. In the sections below, the team directly addresses the questions presented in the Environmental Assessment Guidelines.
* Totals based on GIS-based measurements of parcel data provided by Union County.
135

Figure 9.1. The major components of Bucknell�’s main campus. Open space The following estimates (Table 9.1) are derived from orthographically rectified aerial photographs taken in 2005 & 2006 and provided by the PAMAP project. The �“Built�” category includes impervious surfaces. There is nothing in the campus master plan that formally designates an area as preserved, though lawn below the main quad and the grove are understood to be �“sacred space�”. The plan does recognize the importance of open space and the overall rural character of the campus to Bucknell�’s character and states an intention to remain true to the Larson vision, with its emphasis on open space. At the time of this writing, the final plan has not been produced, but the draft materials presented by Shepley Bulfinch include sketches that show the eastward expansion of the campus into the farm. The planners have a stated
136
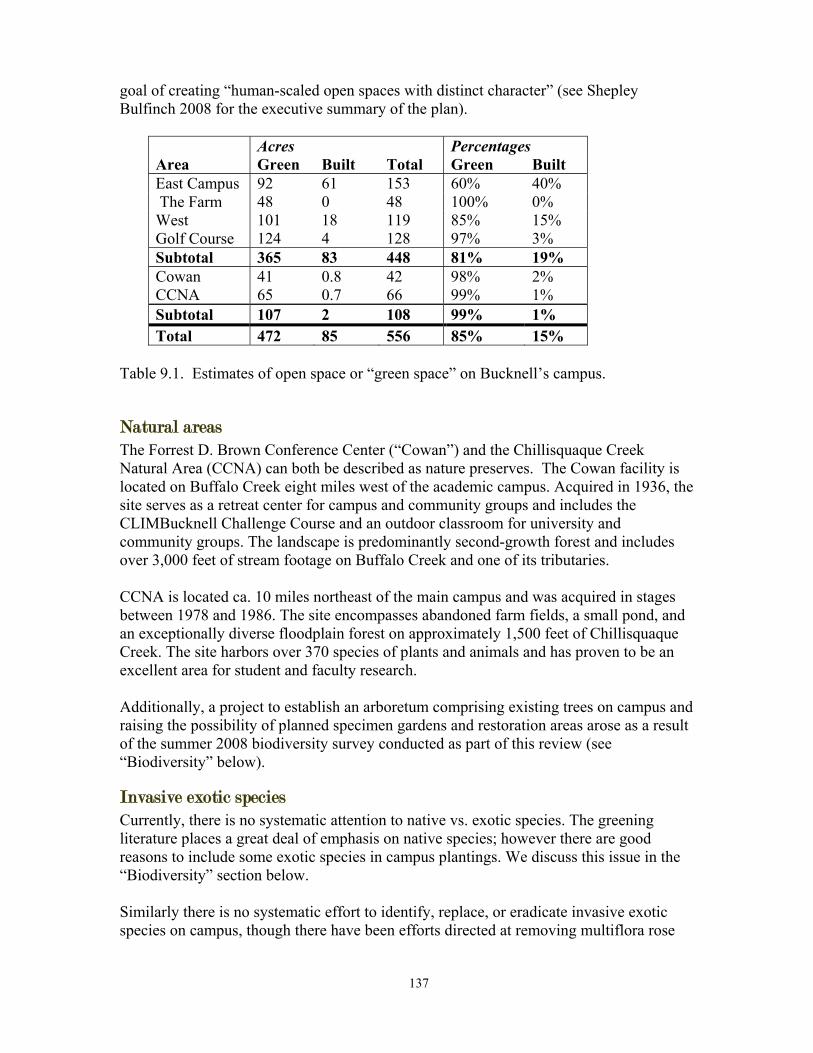
goal of creating �“human-scaled open spaces with distinct character�” (see Shepley Bulfinch 2008 for the executive summary of the plan).
Percentages Area
Acres Green
Built
Total Green Built
East Campus The Farm West Golf Course
92 48 101 124
61 0 18 4
153 48 119 128
60% 100% 85% 97%
40% 0% 15% 3%
Subtotal 365 83 448 81% 19% Cowan CCNA
41 65
0.8 0.7
42 66
98% 99%
2% 1%
Subtotal 107 2 108 99% 1% Total 472 85 556 85% 15%
Table 9.1. Estimates of open space or �“green space�” on Bucknell�’s campus.
Natural areas The Forrest D. Brown Conference Center (�“Cowan�”) and the Chillisquaque Creek Natural Area (CCNA) can both be described as nature preserves. The Cowan facility is located on Buffalo Creek eight miles west of the academic campus. Acquired in 1936, the site serves as a retreat center for campus and community groups and includes the CLIMBucknell Challenge Course and an outdoor classroom for university and community groups. The landscape is predominantly second-growth forest and includes over 3,000 feet of stream footage on Buffalo Creek and one of its tributaries. CCNA is located ca. 10 miles northeast of the main campus and was acquired in stages between 1978 and 1986. The site encompasses abandoned farm fields, a small pond, and an exceptionally diverse floodplain forest on approximately 1,500 feet of Chillisquaque Creek. The site harbors over 370 species of plants and animals and has proven to be an excellent area for student and faculty research. Additionally, a project to establish an arboretum comprising existing trees on campus and raising the possibility of planned specimen gardens and restoration areas arose as a result of the summer 2008 biodiversity survey conducted as part of this review (see �“Biodiversity�” below).
Invasive exotic species Currently, there is no systematic attention to native vs. exotic species. The greening literature places a great deal of emphasis on native species; however there are good reasons to include some exotic species in campus plantings. We discuss this issue in the �“Biodiversity�” section below. Similarly there is no systematic effort to identify, replace, or eradicate invasive exotic species on campus, though there have been efforts directed at removing multiflora rose
137

(Rosa multiflora) from the Bucknell Natural Area as well as the occasional removal of Canada thistle (Cirsium arvense) where they have become problematic. To date, invasive exotics have posed little problem, but it is worth monitoring their occurrence and developing a program or policy to limit their spread if necessary. An informal assessment of the campus shows that invasive exotic plant species are most dominant along the Susquehanna River and along portions of Miller Run.
Biodiversity Each part of the landscape provides aesthetic, educational, and other values to the campus community, and all open spaces function as plant and animal habitats and provide ecosystem services (i.e. services that would otherwise be foregone or provided artificially and at cost) such as moderating temperature and reducing runoff. We evaluated Bucknell�’s landscapes in terms of a continuum between predominantly natural areas (spaces with minimal inputs of human energy or direct impacts from human activity) and artificial areas maintained by heavy inputs of human, chemical, and mechanical energy.
Habitat To assess the main campus, Carl Beien �‘08, Mia Bonewell �‘09, and Christian Etherton �‘09 devised a landscape classification based on a system developed for use with remote sensing data (Anderson et al. 1976) and used it to create a land use/land cover (LULC) map of Bucknell�’s Lewisburg properties (See Appendix XIII). We grouped LULC classes into three broad categories: relatively natural, relatively artificial, and intermediate based on a scoring system that combined degree of artificiality (a surrogate for wild plant and animal habitat quality) and maintenance inputs (ranked qualitatively from high to low). The qualifier �“relatively�” acknowledges the fact that no area is completely natural, and that even artificial environments function has plant and animal habitat. Not surprisingly, most of the campus area (80%; Figure 9.2, table 9.2) falls within the relatively artificial class, which includes buildings and grounds, lawns, and golf course fairways and greens (we did not include the farm in the calculations). A riparian woodland along the Susquehanna near the physical plant, an upland forest patch south end of the agricultural fields, and a small area of relatively neglected shrub understory above the Gateways constitute the three percent that is relatively natural. Seventeen percent of the campus and golf course fall midway along the spectrum. These areas include the grove, the tree nursery, golf course rough, and the disturbed area west of the Art Barn.
Vegetation The diversity of organisms within a landscape is an important component of both its aesthetics and ecological function. On a college campus, biological diversity also performs a critical educational function by providing learning and research opportunities. Functionally, diversity helps stabilize ecosystems against fluctuations in climate, diseases, pests, and other disturbances and disruptions.
138

Landscape Classification and Area
0%
20%
40%
60%
80%
100%
RelativelyNatural
Intermediate Relativelyartificial
Figure 9.2. Landscape classification according to land use/land cover.
Classification Acres Percent Relatively Natural Upland forest 7.5 2% Riparian forest 4.0 1% Campus--large trees with shrub understory 1.1 0.3%
Total 13 3% Intermediate Disturbed areas 10.0 2.5% Miller Run 2.3 0.6% Golf course other than fairways and greens 41.4 10% Nursery/tree farm 6.1 1.5% Lawns with large trees/dense shade 9.2 2.3%
Total 69 17% Relatively artificial Campus lawns 81.3 20% Residential/small buildings and grounds 48.9 12% Large buildings and grounds 108.2 27% Golf course fairways and greens 79.8 20%
Total 18 80% Table 9.2. Relative areas of natural vs. artificial landscape on Bucknell University�’ main campus (Lewisburg Campus and Golf Course, not including agricultural fields) calculated from the campus habitat map. The United Nations (1993, p. 147) Convention on Biological Diversity�—arguably the most influential single policy document on the topic�—defines biodiversity as �“the variability among living organisms from all sources including, inter alia, terrestrial, marine and other aquatic ecosystems and the ecological complexes of which they are
139

part; this includes diversity within species, between species and of ecosystems.�” By this definition, biodiversity on Bucknell�’s main campus landscape consists of the relatively narrow range of ecosystems contained within its bounds, particularly aquatic ecosystems. The largest area of the campus and golf course are given over to lawns and beddings, which are extremely low in plant diversity and offer little in the way of habitat for animals.
Figure 9.3. Locations of campus trees, summer 2008. Each red dot represents a tree in the Arboretum database. No survey of plant or animal diversity has been conducted previously, but in summer 2008, Daniel Wang, �’10, working with Professors Mark Spiro and Duane Griffin, located, identified, and entered into a Geographic Information System, over 1,600 trees growing on the main campus (Figure 9.3). We began the inventory of campus biodiversity with trees because plant diversity exerts a strong influence on animal diversity, and trees are particularly important because of their architectural role in habitat structure. Analysis of
140

this data set shows that 77 species occur on campus, 53 of which (75%) are native to North America (Table 9.3, Appendix XIV). Species Count Percent White Oak (Quercus alba) 238 15% Sugar Maple (Acer saccharum) 132 8% Norway Spruce (Picea abies) 108 7% Pin Oak (Quercus palustris) 105 6% White Pine (Pinus strobus) 103 6% Flowering Dogwood (Cornus florida) 101 6% Norway Maple (Acer platanoides) 78 5% Red Oak (Quercus rubra) 67 4% Black Maple (Acer nigrum) 66 4% Red Maple (Acer rubrum) 62 4% Kousa Dogwood (Cornus kousa) 38 2% Eastern Hemlock (Tsuga canadensis) 33 2% Japanese Cherry (Prunus serrulata 'Kanzan') 32 2% Honey Locust (Gleditsia triacanthos) 28 2% Green Ash (Fraxinus pennsylvanica) 28 2%
Table 9.3. Most common trees on campus (non-native species in bold type). Together, these species make up 75% of trees on the east campus. Tree species diversity on the main campus is remarkable considering that the surveyed area harbors 53 native species out of 60 species that the PA Flora Project (Morris Arboretum 2008) lists as occurring in the county. Some of the species found on campus (e.g. Osage orange and Douglas fir) are North American, but not native to Pennsylvania, but the number is still impressive considering that the survey area represents only 0.07% of Union County. A small number of species represent the vast majority of individual trees (Figure 9.4). This is the typical pattern for natural ecological communities, but it does leave the campus tree cover vulnerable to species-specific pests. For example, nearly 30% of campus trees are oaks. A period of environmental stress such as drought or excessive rainfall, unseasonable frost, or pest outbreak could trigger an outbreak of oak decline (Wargo et al. 1983) that would decimate that campus landscape.
Species selection According to the Pennsylvania Flora Project (Morris Arboretum 2008), there are ca. 100 tree species that occur in the region. A worthy goal would be to have each of these represented by at least one, and preferably five or more, of each of these species. (See Figure 9.5 for examples. Further assessment will be needed to determine which ones). Specimens of non-native species, particularly those of special botanical interest (e.g. dawn redwood, Metasequoia glyptostroboides), should also be considered. Doing so will increase the diversity of trees on campus and help spread the risk of catastrophic tree loss and contribute much to the educational function of the campus tree cover. Shrub and herbaceous plantings that attract and support beneficial or aesthetically pleasing animal
141

species, such as songbirds and butterflies would also add to the biodiversity and aesthetic appeal of the campus.
0
5
10
15
20
25
30
35
40
45
50
1-10
21-3
0
41-5
0
61-7
0
81-9
0
101-
110
121-
130
141-
150
161-
170
181-
190
201-
210
221-
230
N individuals
N s
peci
es
Figure 9.4. Tree species frequency distribution. Most species on campus (50 spp.) are represented by ten or fewer individuals.
Figure 9.5. A Yellowwood tree (Cladrastis lutea) and a Shadblow Serviceberry (Amelanchier canadensis), two attractive natives that should be encouraged on campus.
142

Native vs. exotic species Penn State�’s environmental assessment maps the expansion of the university�’s land holdings over a 70 year period and reports that the university maintains several large tracts of natural areas. A survey of the woody plants on campus revealed a species composition that is 48% native and 52% exotic, a statistic which was attributed to the lack of any policy to promote native plants on campus (Green Destiny Council 2000, pp. 48-52). Bucknell�’s tree cover includes a much higher proportion of native species than Penn State�’s, and the Bucknell also has a much higher percentage of the campus devoted to green space. The literature on sustainability places great emphasis on the promotion of native species over exotic ones (i.e., those introduced from elsewhere, primarily Europe and Asia). Native species may be better adapted to a particular environment than are exotics, and other organisms may depend specifically on native species. As such, native species may require less watering or other care than natives, and may act as multipliers for the diversity of other species. On the other hand, introduced species are generally freed from their pests, parasites, and pathogens, a relative advantage that can be a boon to gardeners and landscapers, since non-native plantings may be more robust and require less care and pesticide inputs than native ones. However, the relative advantage exotic species gain can also cause ecological problems in cases if introduced species become invasive or introduce diseases or pests that affect native species. Examples include chestnut blight and Dutch elm disease, which have left their mark on campus by precluding the planting of American chestnut and killing off most of our American elms. Another introduced pest, hemlock wooly adelgid, is currently attacking hemlocks on campus, all of which will likely be dead within a few years. Emerald ash borers already require monitoring and treatment, and our 100+ flowering dogwoods are at risk from dogwood anthracnose, though the non-native Kousa dogwoods on campus are not. Finally, non-native species may hold considerable pedagogical value, providing a wider representation of Earth�’s taxonomic diversity. As such, they are valuable components of a university campus.
Animal diversity While we did not survey animal species diversity, casual observation suggests that the campus and golf course harbor significant wildlife population. The number and quality of trees on campus, not to mention the availability of human food waste, supports a large population of squirrels that are evident almost everywhere. Other small mammals (e.g. groundhogs, skunk, opossum, and chipmunks) are commonly on campus and the golf course, particularly at night and in the early morning, as are deer. Birds and bats are also abundant, suggesting that insect prey populations are healthy, and sightings of predators such as foxes and hawks indicate that they function as habitat for wildlife, as well as students, though a systematic formal survey is needed to determine quality of this habitat and the nature, diversity of the animal community that inhabits it.
143

The biodiversity of Miller Run A full assessment of Miller Run is currently underway (in the spring 2009 course Environmental Studies 298: Stream Restoration), but experience suggests that it is not a particularly healthy stream. A major limitation as aquatic habitat is the fact that it has a very small watershed with a relatively high proportion of impervious surface and lawn cover and relatively steep gradient. Moreover, most of its reach has been channelized (straightened and armored with large boulders to reduce erosion), which contributes to rapid drainage and renders it an intermittent stream (See Chapter 4, �“Water�” for more on Miller Run�’s hydrology). Currently, Miller Run has all of the ecological and aesthetic appeal of a large ditch, which is essentially what it is. Anything that can be done to minimize runoff and increase infiltration and groundwater retention in the creek�’s watershed will improve its quality and aesthetic appeal. Given our regional climate characteristics, it is unlikely that it will ever be a permanent stream, but much could be done to improve its quality as an intermittent stream habitat. Restoring some degree of sinuosity to the channel and establishing even small ephemeral wetlands and tree plantings its banks would greatly improve the stream, help reduce flooding risks, create excellent opportunities for on-campus learning activities, and make a significant improvement to the campus aesthetic environment.
Landscape maintenance The landscape assessment team attempted to determine the costs associated with maintaining Bucknell�’s landscape by evaluating mowing frequency, fertilizer and pesticide use, and landscape waste handling. Lawn turf is a highly artificial ecological community that occurs naturally only in marine west-coast climates such as those in northern Europe under grazing pressure. Transplanted elsewhere, turf grass communities can only be maintained through management and relatively large inputs of mechanical and chemical energy. The golf course and athletic fields have performance requirements that are more stringent than most other campus spaces, which serve primarily aesthetic functions. As a result, inputs on the golf course are two to three times higher than for the main campus, including athletic fields. Social factors also play a role in golf course management decisions. The course serves a paying membership that has high expectations and is more than willing to voice displeasure and even anger when these are not met. This situation requires a delicate balancing act on the part of the golf course leadership and imposes constraints on management options.
Irrigation See Chapter 4, �“Water�”.
Mowing Approximately 200 acres of the academic campus are mowed on a regular basis. Lawns are mowed once per week, and athletic fields (est. 27 acres) twice per week. The golf
144

course includes three acres of greens that are cut daily and approximately 90 acres of fairways and rough that are cut three times per week. Golf course maintenance required 4,365 gallons of gasoline and 3396 gallons of diesel costing a $20,680 in 2007. Data are still being collected on fuel use for the campus, but it is possible to estimate campus fuel use based on mowing frequencies and acreages, assuming similar types of equipment and allowances for the more frequent mowing for athletic fields. Using this method, we estimate that fuel use on the main campus is approximately 2,000 gallons of diesel fuel and 2,700 gallons of gasoline, which would have cost an estimated $13,000. The environmental cost, in terms of greenhouse gases, of these inputs is readily calculated. Each gallon of gasoline burned produces 19.4 lbs/CO2, and each gallon of diesel produces 22.2 lbs. Using these values, the total CO2 emissions for both the campus and golf course are approximately 118 tons per year. This is slightly less than the emissions generated by five Pennsylvania households. Considering that Bucknell�’s landscape directly �“serves�” a community of perhaps 6,000 people (students, staff, golfers, and neighbors), per capita costs and emissions work out to an estimated $8.00 and forty pounds of CO2 per year.
Pest control Appendix XIV contains data on pesticide uses and potential hazards for both the academic campus and the golf course. As is the case with fuel, pesticide inputs on the golf course are more than twice those of the athletic fields, which constitute the primary pesticide target on the main campus. Pesticides are applied only as needed, preferably when the campus population is low. If it is not, the treated area is marked with yellow flags. Before the pesticide application, the University Safety Manager (James McCormick) is notified, as are other staff members as appropriate. Eight trained pesticide applicators (certified and licensed by the Pennsylvania Department of Agriculture) aided by six technicians are responsible for all pesticide applications. Before 1998, pesticides applications were preventative. Now, they are used on a preventative and curative basis to treat problems only when they arise. For instance, on the main campus, trees are monitored monthly for emerald ash borers, and turf grass areas are monitored twice monthly for pest problems and treated as needed. As a result of these conservative practices, pesticide use on Bucknell�’s academic campus is relatively low (0.2 gallons/acre of liquid and zero dry pesticide on the main campus) and mostly concentrated on the athletic fields (~0.7 gallons of liquid and 211 lbs/acre). Higher aesthetic and performance demands on the golf course translate to higher pesticide usage as well. In 2007, course staff applied ~8.4 gallons of liquid and 532 lbs dry pesticide per acre on fairways and greens. Usage volumes only tell part of the story. Even small amounts of pesticide can cause ecological harm if not used properly. Bucknell�’s grounds and golf course supervisors and their staffs are highly cognizant of the environmental and health risks posed by the pesticides used, and great care is taken in their application to minimize these risks.
145

Less toxic alternatives On the main campus, the primary alternative to herbicide use has been to simply accept the presence of a wider range of species in lawns and treat only when weeds get out of control. This strategy is not currently an option on the golf course, however, because for some users, even a single dandelion is an affront. The demands of maintaining a high quality golf course landscape, as opposed to aesthetically pleasing lawns and even athletic fields, are reflected in the diversity and quantity of chemical inputs that the course requires. Input data alone cannot tell us much about their impact on groundwater or runoff. A list of pesticides, their quantities, and their potential environmental impacts is shown in Appendix XV. Efforts have been made to use less-toxic pesticides to the greatest degree possible. No pesticides in health risk Category I (highest risk) are used. Only one Category II product, Daconil ZN, is used, but it is used only sparingly (15 gallons in 2007). All other pesticides carry a Category III health risk (Category IV is the lowest risk category). User expectations and demands have more strictly constrained the ability to reduce inputs on the golf course, which absorbs the largest inputs of human, mechanical, and chemical energy, and thus has the greatest potential for both generating adverse environmental impacts and for future progress towards sustainability. Pesticides applied to the landscape do not simply do their jobs and then move on to pollute groundwater and streams; rather, they are largely degraded by ultraviolet light and microbes, attenuated by soil and organic matter, and otherwise broken down. Groundwater and stream pollution only occur when application rates exceed the turf ecosystem�’s ability to absorb and process chemical inputs. Properly selected and applied, nearly all of the material should be taken up and incorporated into plant tissues. Extreme algal growth in aquatic habitats indicates excessive fertilization, and algae dominate the pond on the 12th and 13th holes. Fertilizer from the golf course, particularly the greens and fairways immediately adjacent to the pond, may contribute to the problem. However, most of the area contributing runoff to this pool is either golf course rough, which receives little fertilizer, or the suburban neighborhoods to the west (Figure 9.6), which not only includes large areas of lawn, but has steep slopes that encourage runoff. The master plan for the golf course calls for the pond to be filled in, but funds have not been available to do so, (Bucknell University Golf Club, 2007) and chemical treatments have failed to kill the algae. Given the quality of the golf course turf and the professional care taken in pesticide and fertilizer application, the risk of pollution from the golf course than likely to be much
146

A Bucknell Prairie? By Professor Duane Griffin The idea of a prairie in Central Pennsylvania is less odd than it may seem, and there are conservation, aesthetic, functional, economic, and historical reasons to consider this possibility for Bucknell. Prairies, a vegetation type characterized by grasses and wildflowers, are among the most diverse ecosystems in North America. They are also among the rarest, since they were the easiest vegetation type to convert to agriculture during the days of European settlement. As a result, prairie species make up a disproportionate number of state- and federally-listed threatened and endangered species. Consequently, there is currently a great deal of interest in prairie restoration in the United States. Penn State, for example, has established an experimental prairie restoration patch as part of the Arboretum at Penn State (Arboretum at Penn State 2008). Aesthetically, prairies provide ever-changing displays of wildflowers and varying plant colors and textures, and their low stature preserves distant views of the surrounding landscape. When prairies are carefully kept, edged, and especially if offset with attractive fencing, their aesthetic appeal is considerable. Other small rural campuses, such as Middlebury and Carleton Colleges, have established such prairie plantings on slopes and other marginal areas, creating a graceful and dramatic transition from formal geometric areas to woodlands and agricultural areas beyond the campus.
Restored prairie at Gettysburg National Monument
147

Functionally, prairie vegetation supports both plant and animal species (e.g. bluebirds) that currently find little or no habitat on the Bucknell campus, helps control runoff, and requires little care or maintenance. The potential to support dozens of species in even small areas make prairie plantings, together with their aesthetic, ecological, and historical interest would provide a wide range of educational opportunities on campus while simultaneously providing economic and environmental benefits. The fiscal advantages of prairie plantings can be significant. Once established, prairie requires little or nothing in the way of fertilizers, pesticides, or management beyond annual mowing (or controlled burning), which produces significant cost savings. A Wisconsin study, for example, found that the twenty-year maintenance cost for an acre of wetland or prairie is only 15% that for non-native turf grass (Lake Huron Centre for Coastal Conservation, 2003).
Above: sketches for the Penn State prairie (Arboretum at Penn State 2008).
Finally, Bucknell has an important historical tie to prairies. While most of pre-European Pennsylvania was dominated by forest, prairies and savannas (widely scattered, open-grown trees with a grassy understory) occupied many of the broad central valleys (Laughlin and Uhl 2003) including Buffalo Valley (Allen 1896). Lewisburg�’s location, a wooded hill on the edge of Buffalo Valley�’s great prairie, held symbolic meaning for Bucknell�’s founders, who established the university to prepare Baptist clergy to carry out the denomination�’s mission in the prairies of the Great Plains. The bison that gave the Valley its name also gave the university its mascot. For all of these reasons, we recommend that the university give serious consideration to establishing a prairie as the farm becomes incorporated into the campus, and vice versa.
148

lower than it is for the surrounding suburban area. As noted in the Biodiversity section, the presence of top predators (hawks and foxes) that use the golf course as habitat suggests that the terrestrial ecosystem supports a well-functioning ecological community, though more detailed assessment is necessary to verify this impression. The ongoing analysis of Miller Run should shed light on the downstream effects.
Figure 9.6. The aerial photo above shows the sub-watershed of Miller Run draining into the Hole 12/13 pond (blue area, upper right). Water which falls within the red lines drains into the pond either as overland or subsurface flow. The yellow lines show the main drainage pathways.
Fertilizers A list of fertilizers currently used on the Bucknell campus is provided in Appendix XV. Six fertilizers are used on the academic campus, all but two of which are OMRI (Organic Materials Review Institute) listed and only one of which is inorganic. Organic fertilizers constitute 77% of the 1.5 tons of fertilizers used on the campus. Inorganic fertilizers are used on the golf course. Differences in accounting methods preclude quantitative comparisons between the golf course and the main campus. If
149

fertilizer applications follow a ratio similar to those for fuel and pesticides, the per-acre quantities are probably two to three times those of the campus.
Landscaping waste All tree limbs from the golf course, as well as all yard waste from the academic campus is composted, and reused on campus. Some is composted into mulch to be used on campus landscape beds, and around trees, and leaves are mixed into soil used for plantings and topdressing turf. No data are available on the amounts of organic material used.
A model for sustainable landscaping In the summer of 2007 the landscape around the Bucknell University Environmental Center was converted into a native plants garden. This landscape was designed to serve as a test bed for native species and a model for sustainable landscaping on the campus at large (Bucknell University Environmental Center 2008 �“Native Plants Garden�”). Summer research intern Saskia Madlener �’08, worked in collaboration with faculty advisors Dina El-Mogazi, Craig Kochel, and Peter Wilshusen, researched, designed, and installed a low maintenance native plants garden for the center�’s property. Volunteers from the Bucknell and Lewisburg communities helped to plant and water the garden during one of the hottest, driest summers in recent memory. Since the year of its installation, the garden has required no watering, mowing or chemical inputs. Periodic weeding and mulching have been accomplished through occasional work parties and intern assistance. The garden contains over 30 species of trees, shrubs, and perennials native to the region, and has replaced the majority of lawn on the property. The shadier �“front yard�” has been transformed into a woodland landscape with such species as Sweet Gum, Red Oak, Winterberry Holly, Dwarf Crested Iris, and Eastern Red Bud. The open, sunny �“back yard�” has become a meadow planted thickly with Black Eyed Susans, Bee Balm, Echinacea, New England Aster, Summersweet Clethra, and many other species. A central feature of the design is a small pond, which contains native aquatic plant species and attracts scores of songbirds on a daily basis. In summer 2008 Ally Robertson �’10 compiled an illustrated garden guide listing all of the species and their cultural requirements (Robertson 2008).
Recommendations Thanks to wise planning and stewardship, Bucknell has a beautiful and distinctive academic campus with abundant green space and a diverse tree flora that includes many trees that predate the university�’s establishment (a white oak recently removed from near the art building dated to 1778). Its groundskeepers have done an extraordinary job of maintaining this landscape heritage, and our overall sense is that, thanks to their efforts and foresight, we are already far along the continuum of sustainability as we understand it and in an excellent position to move even further in that direction. Over the long term, the campus�’s planned expansion to the east presents an opportunity to build on the excellent foundation we have in place and develop a landscape that incorporates sustainability principles, both literally and figuratively from the ground up.
150

Some of the most notable accomplishments towards landscape greening have been in the reduction of pesticides use on the main campus over the past decade. This reduction has been accomplished by shifting from a pesticide-intensive preventative approach to a more targeted strategy based on pest monitoring and response, coupled with cultural practices such as increasing mowing heights, which helps reduce pest populations and cuts maintenance costs.
Short term recommendations:
Get more students involved in research projects that support landscape sustainability. Student research projects are valuable because they can provide valuable information to managers and experience to students, thus contributing to the University�’s greening and its pedagogical goals. The Miller Run restoration, arboretum, and other projects are models of how student summer research projects can support such an effort. Good starting points include:
o Determine and monitor whether pesticides are entering groundwater or streams and if so, in what concentrations. Any problems that are identified could guide management decisions and provide opportunities for further projects aimed at mitigation.
o Determine the source(s) of nitrates and other pollutants in the golf course. o Expand the biodiversity survey to cover trees on the golf course, west campus,
and other parts of campus not surveyed in 2008, and to herbaceous plants, shrubs, vertebrates, and invertebrates on campus.
o Continue monitoring and updating biodiversity databases and developing the Bucknell Arboretum web site.
o Employ the College of Engineering�’s senior design project requirement to solve problems that are identified.
Identify and develop opportunities to replace chemical energy with human
energy. Both as a university and as a society, we have gotten ourselves into situations where we use petrochemical and electrical energy to make our lives easier, and then rely on gym workouts to replace the conditioning that physical labor provides. It might be possible to reverse that situation and, if only a few days each year, harness the abundant energy of our students, staff, and faculty and direct it to work that otherwise has to be done by machines. We might envision, for example, a weekend work party each semester in which leaves are raked and disposed of, flower beds and plantings are built, and other work is accomplished. The work itself could be structured into competitions between student organizations, residential halls, and athletic teams. Beyond the reduction in greenhouse gas emissions and noise (e.g. from leaf blowers), physical involvement in the upkeep and beautification of the campus should help promote appreciation for it and the people who have made and who maintain it.
151
Continue and expand the outstanding work that has been done to reduce pesticide and fertilizer use on campus and the shift towards more environmentally-friendly products wherever possible. Integrated Pest Management (IPM) approaches may offer further options for reducing both pests and pesticide use in flower beds and lawns, but the amount of pesticide used for these is already quite low. Fertilizer and fuel inputs and maintenance costs might be reduced and drought resistance augmented by adopting Low Input Lawn Care (LILaC)* practices for wherever applicable and converting marginal lawn areas to prairie wildflower plantings. Products such as the Nature Safe fertilizers used on the academic campus have less environmental impact than standard fertilizers. As similar products suitable for golf course use come on the market, these should be used wherever possible.
Compost tea might be an option for reducing fertilizer use and encouraging beneficial soil organisms. We already produce compost from landscape maintenance operations, and it might be possible to build a processor that could produce compost tea in industrial quantities. This would make a good engineering senior design project.
Establish outreach and education efforts directed towards changing attitudes
among golf course users. While we do not currently know the fate and impact of pesticides and fertilizers applied to the golf course, decreasing chemical inputs is always desirable, if only for economic reasons. As noted in the introduction to the maintenance section, however, golf course landscape management is difficult to change because of the strict constraints placed on the course Supervisor and Board by the demands of its users, which is strongly conditioned by what we can call the larger �“golf culture�” of the U.S.
The good news is that golf culture is changing in concert with the larger culture shift towards greening everything from socks to jetliners. This year (2008), for example, the Professional Golfers�’ Association�’s has named the world�’s best-selling organic wine producer, Bonterra Vineyards, as its Official Wine. Both the PGA and Bonterra have formed partnerships with Audubon International to promote its Audubon Cooperative Sanctuary Program for Golf Courses (ACSP)�†, which the organization describes as �“an education and certification program that helps golf courses protect the environment and preserve the natural heritage of the game of golf.�”�‡ Over 1,200 facilities have signed on to the program, including the host of this year�’s Ryder Cup (Valhalla), and many other the top U.S. golf courses. Further evidence of the industry�’s shift towards �“greening the greens�” is Wildlife Links§, a cooperative effort of the U.S. Golf Association and the U.S. Fish and Wildlife Service. This project
*The University of Minnesota, a leader in developing and promoting this approach, describes it as �“an approach that embraces strategies and practices designed to reduce the use of lawn care products, water, and the time and labor so often required when maintaining a healthy lawn�” (see http://www.extension.umn.edu/distribution/horticulture/DG7552.html ) �†Golf and Environment web site: http://www.golfandenvironment.org/ �‡ http://acspgolf.auduboninternational.org/ § http://www.usga.org/turf/images/photos/Wildlife_Links_lo-res.pdf
152

promotes the importance of golf courses as wildlife habitat and provides support for managing courses in ways that augment this important function, which benefits wildlife and golfers�’ experience of the game.
As these cultural changes trickle down from professional golfers, elite courses, and national organizations to the golfing public, smaller courses, and their directors, Bucknell will likely follow the trend towards enhancing the environmental values that golf courses can provide. Changing culture is also driving markets for greener alternatives and development of new technologies, current products and practices. The resulting changes that should make it easier and even more cost effective to reduce inputs and impacts without compromising performance, while enhancing both aesthetic and habitat values on the course. Leadership in this area will have to come from the board of directors, but Bucknell can help foster the cultural change through education, outreach, and demonstration projects.
Establish outreach and education efforts directed towards changing attitudes
and landscape practice among our Miller Run neighbors. If lawn chemical-laden runoff from non-campus areas of Miller Run, it may be possible to influence landowners�’ lawn culture practices to reduce runoff and pollution. Outreach programs might help in this regard, and could even include offers to conduct soil testing and site evaluations and recommendations for fertilizer and pesticide use.
Begin the process of increasing tree species diversity. Given the tradeoffs of
native vs. non-native tree species described in the Biodiversity exercise above, a prudent course of action is probably to maintain current proportions of native and non-native tree species. Efforts should be directed towards identifying suitable non-native species that pose little or no risk of spreading, native species that are not currently represented on campus, and especially those with significant botanical interest that will support educational goals.
Similarly, we recommend increasing the population of trees currently represented by small numbers of individuals (e.g., catalpa, cucumber magnolia, tulip poplar, shagbark hickory, yellowwood, and shadbush). Doing so will spread the risk of losses from emerging pests and diseases that might attack one or more of the species that make up the bulk of trees on campus.
Support the locals and create small natural areas. Bucknell is fortunate to have
the CCNA and Cowan, but there is little relatively natural space available on the academic campus. The new master plan should attempt to incorporate large natural areas into the campus landscape, but properly done, even small areas can enhance aesthetic values and biodiversity, provide on-campus educational opportunities, decrease direct environ mental impacts, and lower costs by reducing management inputs. Unlike trees, herbaceous species are more readily established and replaced if something goes wrong, and non-native herbaceous species are more likely to become
153
invasive and are more difficult to get rid of than are exotic trees. For these reasons, native shrubs and herbaceous species should be promoted wherever possible, using the Bucknell University Environmental Center garden as a model.
These species, and many others, could be planted as garden plants in existing campus ornamental beds and in less formal wildflower patches in marginal and problem areas and in �“dead spaces�” currently occupied by lawns but little used. Four examples in particular come to mind:
o The south side of Coleman Hall between the theater and the building extensions. Mowed paths and benches would add aesthetic appeal and make such spaces more inviting.
o The border between the east parking lots and the farm could planted in wildflowers and prairie grasses, creating an attractive transition between the campus and the agricultural fields while preserving the view and sense of openness.
o There are parts of the grove that cannot sustain grass because of shade and waterlogged soils. Planting these areas with shade-tolerant native ferns, forest wildflowers, sedges, and possibly shrubs such as mountain laurel would enhance their aesthetic appeal and reduce maintenance costs.
o Rain gardens are another option for creating small wild areas that also aid in runoff management by slowing and filtering runoff from parking lots and buildings
Improve conditions for wildlife. In addition to providing food sources for birds
and other wildlife, other landscape elements that favor wildlife should also be considered. These include strategic plantings of shrubs to provide food and cover, establishing corridors between habitat patches where practical to do so, developing vertically-layered vegetation (trees, shrubs, and ground layer plants), and installing nesting boxes for species such as bluebirds, owls, and bats.
Convert the problematic pond on holes 12 and 13 to a wetland. While the golf
course master plan calls for filling the pond completely, doing so will eliminate some of the course�’s interest and challenge and will only displace the fertilizer runoff to groundwater or further down Miller Run. As an alternative, it might be possible fill the pond only partially and establish a wetland on the site with emergent aquatic plants (such as cattails and water lilies) that would shade out the algae. Doing so would save the water feature while also creating important wildlife habitat and would trap pollutants and keep them out of Miller Run. We recommend that this possibility be explored as part of the Miller Run restoration. If feasible, it would be an ideal project for a civil engineering class or senior design project and would likely be eligible for outside funding.
154

Long Term Recommendations
Protect open space and use the farm development to expand the amount of natural area. The dramatic, if relatively inaccessible, river and ridge view that we have to the east is a tremendous asset to the campus, and will become more valuable as the campus expands into the farm. The current draft master plan calls for the addition of a residential �‘village�’ that clusters buildings and leaves a relatively large area of open space. We recommend that as much of the area be retained as open natural space as possible, and that only low-growing vegetation be planted on the slope below campus in order do preserve the view across the river. In fact, we recommend that Bucknell establish a prairie.
Restore Miller Run. There is currently a project underway to determine the feasibility of this project.
Establish a Bucknell Arboretum. A direct outgrowth of the biodiversity tree inventory was the establishment of an arboretum project that would make the data accessible via an interactive web page and other means to highlight notable trees or communities on campus. In effect, the University could establish a campus arboretum using the trees that already exist on campus, a strategy that has been utilized by other campuses as well (Swarthmore, for example).
In the long run, if this project continues, one day the Bucknell Arboretum could have an actual embodiment as a distinct location, with themed and specimen gardens, and perhaps a building of its own that could function as an educational and research center.
Recommendations for future monitoring As mentioned above under recommendations for student involvement:
Determine and monitor whether pesticides are entering groundwater or streams and if so, in what concentrations. Any problems that are identified could guide management decisions and provide opportunities for further projects aimed at mitigation.
Determine the source(s) of nitrates and other pollutants in the golf course.
Expand the biodiversity survey to cover trees on the golf course, west campus, and other parts of campus not surveyed in 2008, and to herbaceous plants, shrubs, vertebrates, and invertebrates on campus.
Continue monitoring and updating biodiversity databases and developing the Bucknell Arboretum web site.
Employ the College of Engineering�’s senior design project requirement to solve problems that are identified.
155

Next Steps
At the environmental assessment�’s closing summit on October 1st 2008, project participants and community members gathered to share the results of the research and discuss options for moving forward. The participants expressed strong support for making the results of the study public, and specifically mentioned the senior administrative staff, Board of Trustees, Faculty Council, Bucknell Student Government, and the Lewisburg community among those who should be made fully aware of the report. Based on surveys distributed at the closing summit brainstorming session, proposed methods for disseminating the information were many and varied, but a strong web presence was the most often cited recommendation. Other propositions included making presentations at large gatherings (including reunion weekends, national and regional conferences, faculty and administrative forums), creating organized discussion groups, distributing the report to the local media, and integrating the research into educational venues. Because of the many recommendations made in the report, there is an obvious need for prioritization. Suggested strategies included targeting those projects with the greatest economic, environmental, and educational returns. Among a list of specifically recommended actions, LEED certification of new buildings was the most commonly mentioned. Others included maximizing energy efficiency, reducing vehicle dependence, restoring Miller run, and promoting environmental literacy. As the primary university committee concerned with environmental affairs, the Campus Greening Council will certainly play a major role in determining how these priorities are addressed. However, institutional transformation is, in the end, an organic process requiring the simultaneous cooperation of all levels of the university community, from individuals to large groups, and from voluntary efforts to mandatory policies. A variety of approaches will be necessary to bring a vision of sustainability into fruition, and this study represents an important early step in that ongoing process.
156

References
Abellard, Stanley, Daniel Ruffing, Sarah Williams, Katrina Asmundson, Tyler Troast,
and Gillian Young. 2007. �“Final Report: Bucknell University Pedestrian Mobility Plan�”. Project for CENG 330: Introduction to Transportation Engineering, under the direction of Dr. Richard G. McGinnis and Dr. Michael A. Malusis.
Allen, J.A. 1876. The American Bison, Living and Extinct. New York, New York:
Cambridge University Press. Amundson, Katie, Luke Belenky, Marisa Buyers-Basso, and Rob Thompson. 2008.
�“Sustainable Food Waste Management at Bucknell University�”. Senior design project under the direction of Tom DiStefano.
Arboretum at Penn State. 2008. �“A Prairie in Central Pennsylvania?�” Arboretum at
Penn State online. Available from http://www.arboretum.psu.edu/research/prairiepatch.html; internet.
Asmundson, Katrina, Tyler Troast, and Gillian Young. 2007. �“Pedestrian Mobility at
Bucknell University�”. Project for CENG 330: Introduction to Transportation Engineering under the direction of Dr. Richard G. McGinnis and Dr. Michael A. Malusis.
Atis, S. and E. Levent. 2005. �“The Respiratory Effects of Occupational Polypropylene
Flock Exposure.�” European Respiratory Journal. Vol. 25, No. 1: 110 - 117. [article online]; available from <http://www.erj.ersjournals.com/cgi/content/full/25/1/110> (accessed 20 February 2008).
Audette, Kyle. Email Correspondence. 8 July, 2008 Barben, E.J. , Erin Depew, Jennifer Gibbons and Emily Guyer. 2006. "Bucknell
University Food Waste Disposal: Anaerobic Reactor Design". Senior design project under the direction of Tom DiStefano.
Brower, Michael and Warren Leon. 1999. The consumer's guide to effective environmental
choices: practical advice from the Union of Concerned Scientists. New York: Three Rivers Press.
Bucknell Dining. 2009. �“Sustainable Dining.�” Bucknell Dining online. Available from
http://www.bucknell.edu/x44946.xml; internet.
157

Bucknell Facilities. 2009. �“Recycling.�” Bucknell Facilities online. Available from http://www.bucknell.edu/x4772.xml; internet.
Bucknell Outing Club. 2009. �“Bucknell Outing Club.�” Bucknell University online.
Available from http://www.orgs.bucknell.edu/boc/; internet. Bucknell University Biology Department. 2009. �“Ecological Habitats.�” Bucknell
University Biology Department online. Available from http://www.bucknell.edu/x765.xml; internet.
Bucknell University College of Engineering. 2009. �“Environmental Engineering.�”
Bucknell University online. Available from http://www.bucknell.edu/x1815.xml; internet.
Bucknell University Course Catalog. 2008. �“College of Arts and Sciences.�” Bucknell
University online. Available from http://www.bucknell.edu/x3290.xml; internet. Bucknell University Course Catalog. 2008. �“College of Engineering Curricula�”
Bucknell University online. Available from http://www.bucknell.edu/x3288.xml#bscivil; internet.
Bucknell University Development and Alumni Relations. 2008. �“Endowment Reports.�”
Bucknell University Development and Alumni Relations online. Available from http://www.bucknell.edu/x39565.xml; internet.
Bucknell University Environmental Center. 2008. �“Native Plants Garden.�” Bucknell
University Environmental Center online. Available from http://www.bucknell.edu/x45652.xml; internet.
Bucknell University Environmental Center. 2008. �“Mission Statement.�” Bucknell
University Environmental Center online. Available from http://www.bucknell.edu/x3415.xml; internet.
Bucknell University Environmental Center. 2009. �“Semester on the Susquehanna.�”
Bucknell University Environmental Center online. Available from http://www.departments.bucknell.edu/environmental_center/inside/teaching/semester_on_the_susquehanna.html; internet.
Bucknell University Environmental Center. 2009. �“Solar Scholars Home Page.�”
Bucknell University Environmental Center online. Available from http://www.bucknell.edu/x20303.xml; internet.
Bucknell University Golf Club. 2007. �“Green Committee,�” Bucknell University Golf
Club online. Available from http://www.bucknell.edu/x674.xml; internet.
158

Bucknell University News and Events. 2008. �“Mitchell Announces Climate Commitment�” Bucknell University News and Events online. Available from http://www.bucknell.edu/x40046.xml; internet.
Bucknell University Office of the President. 2008. �“Speeches and Reports.�” Bucknell
University Office of the President online. Available from http://www.bucknell.edu/x44418.xml; internet.
Bucknell University Office of Service Learning. 2009. �“Course List.�” Bucknell
University Office of Service Learning online. Available from http://www.bucknell.edu/x33709.xml; internet.
Bucknell University Reservation Information and Conference Services. 2009.
�“CLIMBucknell Challenge Course.�” Bucknell University Reservation Information and Conference Services online. Available from http://www.bucknell.edu/x8586.xml; internet.
Bucknell University Residential Colleges. 2009. �“Environmental College.�” Bucknell
University Residential Colleges online. Available from http://www.bucknell.edu/x1660.xml; internet.
California Integrated Waste Management Board. 2009. �“Chlorine-Free Paper.�” California
Integrated Waste Management Board online. Available from http://www.ciwmb.ca.gov/Paper/ChlorineFree/Default.htm; internet.
Campus Sustainability Assessment Project (CSAP). 2006. �“Best Practice Evaluation.�”
Campus Sustainability Assessment Project online. Available from http://csap.envs.wmich.edu/pages/bestpracticeevaluation.htm; internet.
Campus Sustainability Assessment Project (CSAP). 2006. �“CSA Database.�” Campus
Sustainability Assessment Project online. Available from http://csap.envs.wmich.edu/pages/bestpracticeevaluation.htm; internet.
Cornell University Science News. 1997. �“U.S. could feed 800 million people with grain that livestock eat.�” [article online]; available from Cornell University <http://www.news.cornell.edu/releases/Aug97/livestock.hrs.html> (accessed January 30, 2009).
Creighton, Sarah Hammond. 1998. Greening the Ivory Tower: Improving the
Environmental Track Record of Universities, Colleges, and Other Institutions. Cambridge, MA: MIT Press.
Davis, Jay. 2008. �“The Cotton Exchange Life Cycle Analysis Letter.�” Received 15 Feb 2008.
159

Davis Langdon. 2007. The Cost of Green Revisited: Reexamining the Feasibility and Cost Impact of Sustainable Design in the Light of Increased Market Adoption. [report online]; available from Davis Langdon <http://www.davislangdon.com/USA/Research/ResearchFinder/2007-The-Cost-of-Green-Revisited/> (accessed March 11, 2009).
Ecology Center. 2008. �“Adverse Health Effects of Plastics.�” Ecology Center online.
Available from: http://www.ecologycenter.org/factsheets/plastichealtheffects.html; internet.
El-Mogazi, Dina. 2005. Fertile Ground for Campus Greening: Programming and
Organizational Recommendations for the Ecological Sustainability of Bucknell University. [report online]; available from Bucknell University Environmental Center, <http://www.bucknell.edu/Documents/EnvironmentalCenter/GreeningReportFinal.pdf> (accessed December 22, 2008).
Environmental Protection Agency (EPA). 1997. Profile of the Plastic Resins and Man-
made Fibers Industry. [report online]; available from Environmental Protection Agency, <http://www.epa.gov/compliance/resources/publications/assistance/sectors/notebooks/plastic.html> (accessed 20 February 2008).
Environmental Protection Agency (EPA). 1997. Profile of the Textile Industry. [report
online]; available from Environmental Protection Agency, <http://www.epa.gov/compliance/resources/publications/assistance/sectors/notebooks/textilsnp1.pdf> (accessed 24 Feb 2008).
Environmental Protection Agency (EPA). 2003. �“Tyson Foods to Pay $7.5 Million for
Federal and State Clean Water Violations�” Environmental Protection Agency online. Available from http://yosemite.epa.gov/opa/admpress.nsf/a883dc3da7094f97852572a00065d7d8/51c2d19d5df66b4185257059006bbbff!OpenDocument; internet.
Environmental Protection Agency (EPA). 2003. �“Watersheds.�” Environmental
Protection Agency online. Available from: http://www.epa.gov/what_is_a_watershed.htm; internet.
Environmental Protection Agency (EPA). 2008. �“Styrene.�” Environmental Protection
Agency online. Available from: http://www.epa.gov/ttn/atw/hlthef/styrene.html; internet.
Environmental Protection Agency (EPA). 2009. �“Safe Drinking Water Information
System�” Environmental Protection Agency online. Available from http://oaspub.epa.gov/enviro/sdw_report_v2.first_table?pws_id=PA4490023&state=PA&source=Surface_water&population=29816&sys_num=0; internet.
160

Environmental Working Group. 2009. �“National Tap Water Quality Database�” Environmental Working Group online. Available from http://www.ewg.org/tapwater/yourwater/system.php?pwsid=PA4490023; internet.
Fournier, Eric. 2008. �“A comprehensive assessment of Bucknell University's energy
profile with performance simulations for various campus facilities.�” Honors thesis conducted under the direction of Professor Molly McGuire. Available in Bertrand Library, Bucknell University.
Furman University. 2008. Furman University Catalog. [document online]; available
from Furman University, <http://www.furman.edu/catalog/2008-2009_catalog.pdf> (accessed December 24, 2008).
Green Destiny Council. 2000. The Penn State Indicators Report. [report online]; Available
from Green Destiny Council < http://www.bio.psu.edu/Greendestiny/publications/gdc-indicators_2000.pdf > (accessed January 15, 2009).
Harvard Green Campus Initiative. 2008. �“Sustainability Pledge.�” Harvard Green
Campus Initiative online. Available from http://www.greencampus.harvard.edu/pledge/about.php; internet.
Hatfield. 2009. �“Environmental Stewardship.�” Hatfield Quality Meats online.
Available from http://www.hatfieldqualitymeats.com/about/environmental-stewardship.aspx; internet.
Hawley, Dennis, Associate Vice President for Facilities, Bucknell University. Personal
Interview. 13 June, 2008, 18 July, 2008 Heinz Family Foundation. 1995. Blueprint for a Green Campus: The Campus Earth
Summit Initiatives for Higher Education. [report online]; available from Heinz Family Foundation, < http://www.heinzfamily.org/pdfs/Blueprint-For-Green-Campus.pdf> (accessed December 22, 2008).
Henry, Sue Ellen et al. 2008. �“College Core Curriculum (CCC): An Executive Summary
of the Revised Curriculum for the College of Arts and Sciences.�” Circulated for review by the faculty on November 13, 2008.
Hiller, Tammy et al. 2007. �“Managing for Sustainability Program Proposal.�” Submitted
to Curriculum Review Committee on June 25, 2006; Updated 1/13/07. Hostetler, Jim, Director of Construction and Design, Bucknell University. Personal
Interview. 6 June. 2008. Jenks Jay, Nan. 2003. �“Cultivating a Shared Environmental Vision at Middlebury
College.�” [article online]; Available from Project Kaleidoscope, <http://www.pkal.org/documents/middlebury-shared-environmental-vision.pdf> (accessed June 7, 2006).
161

Kaplan, Brittany, Karina Lassner, and Ben Erker. 2007. �“Making Bucknell University a
Bike Friendly Campus�” Project for CENG 330: Introduction to Transportation Engineering, under the direction of Professor McGinnis & Professor Malusis.
Karns Foods. 2009. �“Living Green.�” Karns Foods online. Available from
http://www.karnsfoods.com/livingGreen.html; internet. Kats (2003) The Costs and Financial Benefits of Green Buildings: Report to California�’s
Sustainable Building Task Force. [report online]; available from the California Integral Waste Management Board. <http://www.ciwmb.ca.gov/greenbuilding/design/costbenefit/report.pdf> (accessed March 11, 2009).
Knight, James, Associate Director of Utilities and Cogeneration, Bucknell University.
Personal Interview. 17 June, 2008 Knight Ridder/Tribune Business News. 2001. �“Pork Plant in Pennsylvania Has Clean
Environmental Record, Officials Say.�” [article online]; Available from Knight Ridder/Tribune Business News, <http://www.accessmylibrary.com/coms2/summary_0286-6732110_ITM> (accessed January 31, 2009).
Koontz, Gregory, Assistant Director of Utilities Maintenance, Bucknell University.
Personal Interview. 17 June, 2008 Lake Huron Centre for Coastal Conservation. 2003. �“Lake Huron Biodiversity,�” Lake
Huron Centre for Coastal Conservation online. Available from http://lakehuron.on.ca/resources/Importance-of-Native-Plants(2003).pdf; internet.
Lapp, Lisa, Parking Enforcement Coordinator, Bucknell University. Personal Interview. 9 June, 2008 Laughlin, D.C., and C. F. Uhl. 2003. The xeric limestone prairies of Pennsylvania.
Castanea. 68: 300�–316. McIntosh, Mary. 2001. State of the Campus Environment: A National Report Card on
Environmental Performance and Sustainability in Higher Education. [report online]; available from National Wildlife Federation, <http://www.nwf.org/campusecology/resources/HTML/stateofthecampusreport.cfm#conclusion> (accessed December 19, 2008).
McLaughlin, Shawn, Director, Union County Planning Commission. Email
Correspondence. 7 July, 2008 Morris Arboretum. 2008. �“PA Flora Project.�” Morris Arboretum online. Available from
http://www.paflora.org/; internet.
162

Natural Resources Defense Council. 2005. �“Kimberly Clark: Cutting Down Ancient
Forests to Make Throwaway Products. Natural Resources Defense Council online. Available from http://www.nrdc.org/media/pressreleases/041118b.asp; internet.
Rhodes-Conway, Satya, et al. 2005. New Energy for Campuses: Energy Saving Policies for
Colleges and Universities. [report online]; Available from Apollo Alliance <http://www.apolloalliance.org/downloads/resources_new_energy.pdf> (accessed January 11, 2009).
Robertson, Ally. 2008. Online Garden Guide: A Short Guide to the Plants in the Native
Plants Garden. [report online]; Available from Bucknell University Environmental Center <http://www.bucknell.edu/documents/EnvironmentalCenter/finished%20garden%20guide.pdf> (accessed March 23, 2009).
Salyards, Justin, Asst Project Manager for Contract Administration, Bucknell University.
Email Correspondence. 2 June, 2008 Schaffer, Alison. 2008. �“Hydrologic and water quality assessment of Miller Run: a
study of Bucknell University's impact.�” Senior honors thesis conducted under the direction of Professor Matt McTammany. Available in the Bertrand Library at Bucknell University.
Shepley, Bulfinch, Richardson and Abbot. 2008. �“The Master Plan: A Vision for
Bucknell, Executive Summary.�” Silvers, Dominic, Senior Project Manager, Bucknell University. Personal Interview. 15
July, 2008 Smith, Chad. Personal Interview. 11 June, 2008 Sustainable Endowments Institute. 2007. 2008 College Sustainability Report Card
[report online]; Available from Sustainable Endowments Institute <http://www.greenreportcard.org/report-card-2008/schools/bucknell-university> (accessed December 17, 2008).
Sustainable Endowments Institute. 2008. 2009 College Sustainability Report Card
[reports online]; Available from Sustainable Endowments Institute <http://www.greenreportcard.org/report-card-2009/schools/bucknell-university> (accessed December 17, 2008).
Trident Seafoods. 2009. �“Fishing Seasons�—Salmon.�” Trident Seafoods online.
Available from http://www.tridentseafoods.com/company/fishing_salmon.php; internet.
163
Tyson. 2009. �“Environment.�” Tyson online. Available from http://www.tyson.com/Consumer/AboutTyson/TysonCares/environment.aspx; internet.
United Nations. 1993. Convention on biological diversity (with annexes). Concluded at
Rio de Janeiro on 5 June 1992. United Nations Treaty Series 1760:142-382. United States Department of Agriculture (USDA). �“Briefing Room: Cotton.�” 2008.
USDA online. Available from http://www.ers.usda.gov/Briefing/Cotton/; internet. US Foodservice. 2009. �“About Us�”. US Foodservice online. Available from
http://www.usfoodservice.com/usf/html/overview.html; internet. VerNooy, Jason. 2008. �“Anaerobic digestion of food waste on Pennsylvania campuses:
a life cycle assessment study on waste disposal options.�” Senior thesis conducted under the direction of Professor Tom DiStefano.
Vieceli, Angelo, Senior Project Manager, Bucknell University. Email Correspondence.
29 July, 2008 Wargo, P, D. Houston, and L. LaMadeleine. 1983. Oak Disease. Forest Insect & Disease
Leaflet 165. Washington: U.S. Department of Agriculture Forest Service. World Commission on Environment and Development. 1987. Our Common Future.
[report online]; Available from United Nations Documents Cooperation Circles. <http://www.un-documents.net/wced-ocf.htm> (accessed December 22, 2008).
Worlds Resources Institute. 2008. �“Earth Trends: Agriculture.�” World Resources
Institute online. Available from www.earthtrends.org; internet.
164

Appendices
165

Appendix I: Campus master plan guiding principles �– DRAFT (Sustainability principles are underlined) Bucknell will:
�• Integrate the planned and natural environments more fully to one another and to The Plan for Bucknell;
�• Be a pedestrian friendly campus where the environment will focus on the
students, faculty, and student - faculty interaction;
�• Take special care to utilize existing space, repurposing when possible and thoughtfully considering any new building initiatives;
�• Reflect the Larson Plan in new construction, tying new construction into a sense
of place and a respect for the environment;
�• Open to its neighbors �– East Buffalo Township, Lewisburg, and the Susquehanna River �– removing obstacles to seamless integration;
�• Commit to sound, reasonable and sustainable environmental planning policies;
�• Integrate Bucknell West into the core mission of the University;
�• Maintain or enhance the quality of academic facilities, student housing,
extracurricular environments, and support areas to promote the seamless integration of the living and learning experience;
�• Encourage development in the corridor between the campus and Market Street
and along Market Street itself, where practical;
�• Seek a full range of financial public and private partners and utilize the entire scope of University resources to accomplish these goals.
166

Appendix II: The Talloires Declaration: University Presidents for a Sustainable Future (See http://www.ulsf.org/programs_talloires.html) We, the presidents, rectors, and vice chancellors of universities from all regions of the world are deeply concerned about the unprecedented scale and speed of environmental pollution and degradation, and the depletion of natural resources. Local, regional, and global air pollution; accumulation and distribution of toxic wastes; destruction and depletion of forests, soil, and water; depletion of the ozone layer and emission of "green house" gases threaten the survival of humans and thousands of other living species, the integrity of the earth and its biodiversity, the security of nations, and the heritage of future generations. These environmental changes are caused by inequitable and unsustainable production and consumption patterns that aggravate poverty in many regions of the world. We believe that urgent actions are needed to address these fundamental problems and reverse the trends. Stabilization of human population, adoption of environmentally sound industrial and agricultural technologies, reforestation, and ecological restoration are crucial elements in creating an equitable and sustainable future for all humankind in harmony with nature. Universities have a major role in the education, research, policy formation, and information exchange necessary to make these goals possible. The University heads must provide the leadership and support to mobilize internal and external resources so that their institutions respond to this urgent challenge. We, therefore, agree to take the following actions: 1. Use every opportunity to raise public, government, industry, foundation, and university awareness by publicly addressing the urgent need to move toward an environmentally sustainable future. 2. Encourage all universities to engage in education, research, policy formation, and information exchange on population, environment, and development to move toward a sustainable future. 3. Establish programs to produce expertise in environmental management, sustainable economic development, population, and related fields to ensure that all university graduates are environmentally literate and responsible citizens. 4. Create programs to develop the capability of university faculty to teach environmental literacy to all undergraduate, graduate, and professional school students. 5. Set an example of environmental responsibility by establishing programs of resource conservation, recycling, and waste reduction at the universities.
167
6. Encourage the involvement of government (at all levels), foundations, and industry in supporting university research, education, policy formation, and information exchange in environmentally sustainable development. Expand work with nongovernmental organizations to assist in finding solutions to environmental problems. 7. Convene school deans and environmental practitioners to develop research, policy, information exchange programs, and curricula for an environmentally sustainable future. 8. Establish partnerships with primary and secondary schools to help develop the capability of their faculty to teach about population, environment, and sustainable development issues. 9. Work with the UN Conference on Environmental and Development, the UN Environment Programme, and other national and international organizations to promote a worldwide university effort toward a sustainable future. 10. Establish a steering committee and a secretariat to continue this momentum and inform and support each other's efforts in carrying out this declaration.
168

Appendix III: Statements of environmental principles from other colleges Carleton College Environmental Statement of Principles http://apps.carleton.edu/governance/environment/history/eac_approved/ Environmental Statement of Principles as Approved by the Board of Trustees and the EAC "Carleton College recognizes that it exists as part of interconnected communities that are impacted by personal and institutional choices. We are dedicated to investigating and promoting awareness of the current and future impacts of our actions in order to foster responsibility for these human and natural communities. Carleton strives to be a model of stewardship for the environment by incorporating ideals of sustainability into the operations of the college and the daily life of individuals." Endorsed by the Board of Trustees, Building and Grounds Committee, 18 May 2001 "Carleton College, as a liberal arts institution, recognizes that it exists as part of interconnected communities that are impacted by personal and institutional choices. We are dedicated to investigating and promoting awareness of the current and future impacts of our actions in order to foster responsibility for these human and natural communities. Carleton strives to be a model of stewardship for the environment by incorporating ideals of sustainability into the operations of the college and the daily life of individuals." Approved by the Environmental Advisory Committee 12 April 2001 Middlebury College: http://community.middlebury.edu/%7Eenviroc/ "Middlebury College as a liberal arts institution is committed to environmental mindfulness and stewardship on all its activities. This commitment arises from a sense of concerned citizenship and moral duty and from a desire to teach and lead by example. The College gives a high priority to integrating environmental awareness and responsibility into the daily life of the institution. Respect and care for the environment, sustainable living, and intergenerational responsibility are among the fundamental values that guide planning, decision making, and procedures. All individuals in this academic community have personal responsibility for the way their actions affect the local and global environment." Adopted by Middlebury College Trustees, June 1995 Dartmouth College "Statement of Commitment to Environmental Sustainability": http://www.dartmouth.edu/~rwg/start.html
169

"Dartmouth College is committed to developing and maintaining a sustainable and environmentally responsible mode of operation, within the context of its educational mission, fiscal constraints, and responsibilities to students, faculty, staff, alumni, and the local community. Dartmouth's commitment to environmental responsibility is intended both to educate the Dartmouth community about environmental issues and to minimize the College's adverse impacts on the environment." Bowdoin College: As one of five domains in the Mission of the College http://www.bowdoin.edu/communications/publications/mission.shtml "As a liberal arts college in Maine, Bowdoin assumes a particular responsibility to use nature as a resource for teachings and engaging students -- notably to help them obtain a broad sense of the natural environment, local and global, and the effects and the role of human beings regarding it." Connecticut College "Statement on Sustainability" http://aspen.conncoll.edu/camelweb/index.cfm?fuseaction=offices&circuit=ehb&function=single&id=113 "In 1997, Connecticut College became a signatory of the Talloires Declaration, a pledge taken by university leaders from around the world to put their resources towards creating "an equitable and sustainable future for all humankind in harmony with nature." Sustainability has been defined as human activities that do not deplete or degrade natural resources upon which present and future populations depend. Connecticut College recognizes that restoring balance between human health, economic viability and ecosystem well-being is the means of achieving greater stability of social and natural systems. To this end, all departments and all individuals within the college are asked to incorporate ideals of sustainability into everyday choices, including purchasing, transportation, energy and water usage and disposal of waste. The college acknowledges its responsibility to teach environmental stewardship, not just in the classroom, but in all campus operations as well. By striving to make operations more efficient and environmentally-sound, Connecticut College can serve as an environmental model while also saving money and resources. All members of the college are enlisted to do their part by to REDUCING consumption, REUSING whenever possible and lastly, disposing of waste by RECYCLING designated materials and putting hazardous material in its place."
170

Appendix IV: Environmental literacy quiz 1. What types of plastics, numerically labeled, are currently recyclable at Bucknell?
A. 1 and 2 only B. All C. 1, 2, and 7 D. 2, 4, and 6
Correct answer: A Average score of upper level management class: .48/1 Average score of incoming first-year group: N/A 2. What is a �“CFL�” bulb?
A. Chlorofluorocarbon light bulb B. Compact fluorescent light bulb C. Chloro-fluorescent light bulb D. Compact full-spectrum light bulb
Correct answer: B Average score of upper level management class: .52/1 Average score of incoming first-year group: .51/1 3. What is an �“ecological footprint�”?
A. A measurement of one�’s demand on the earth�’s ecosystems B. A method used in tracking native species C. A measurement of industrial effluents D. A projection of the future human population
Correct answer: A Average score of upper level management class: .94/1 Average score of incoming first-year group: .76/1 4. What does a CAFE standard measure?
A. The average carbon emissions of an airline fleet B. The average fuel efficiency of a manufacturer�’s airline fleet C. The average fuel efficiency of a single automobile D. The average fuel efficiency of a manufacturer�’s auto fleet E. The average carbon emissions of all automobiles
Correct answer: D (half credit was given for answer C due to the fine distinction) Average score of upper level management class: .32/1 Average score of incoming first-year group: .39/1 5. The source of Bucknell�’s drinking water is (circle all that apply):
171

A. The Susquehanna River B. Groundwater C. Spruce Run D. White Deer Creek E. Penn�’s Creek
Correct answer: A, C, and D (partial credit awarded for any of these) Average score of upper level management class: .21/1 Average score of incoming first-year group: N/A 6. Which of the following is currently designated as an endangered species?
A. White-tailed Deer B. California Condor C. Bald Eagle D. Peregrine Falcon
Correct answer: B Average score of upper level management class: .26/1 Average score of incoming first-year group: N/A 7. Which of the following is an example of an invasive exotic species in Pennsylvania?
A. Indiana Bat B. White-tailed Deer C. Starling D. Eastern Gray Squirrel
Correct answer: C Question was �“thrown out�” due to a typo that gave away the answer. 8. What is phantom power?
A. The power appliances use when they are plugged in but not in use B. The power wasted by power plants to keep them running continuously C. A strategy for reducing energy use during periods of peak demand D. None of the above
Correct answer: A Average score of upper level management class: .77/1 Average score of incoming first-year group: .63/1 9. What kind of fuel currently provides most of Bucknell�’s power?
A. Coal B. Oil C. Natural gas D. Wind
Correct answer: C
172

Average score of upper level management class: .39 Average score of incoming first-year group: N/A 10. Where does Bucknell�’s garbage go?
A. A municipal waste incinerator in New Jersey B. Lycoming Landfill C. Dauphin Meadows Landfill D. Southern Pennsylvania Landfill
Correct answer: B Average score of upper level management class: .68/1 Average score of incoming first-year group: N/A 11. Where does the Susquehanna River end?
A. The Delaware Bay B. The Hudson River C. Lake Erie D. The Chesapeake Bay
Correct answer: D Average score of upper level management class: .77/1 Average score of incoming first-year group: N/A 12. What is the approximate population of the earth?
A. 5.5 billion B. 6.6 billion C. It recently exceeded 7 billion D. 6.0 billion
Correct answer: B Average score of upper level management class: .68/1 Average score of incoming first-year group: .57/1 13. Which of the following is a greenhouse gas (circle all that apply)?
A. Methane (CH4) B. Carbon dioxide (CO2) C. Nitrous oxide (N2O) D. Water vapor (H2O)
Correct answer: A, B, C, D (partial credit awarded for any of these) Average score of upper level management class: .56/1 Average score of incoming first-year group: .50/1 14. Which tree is native to PA (circle all that apply)
A. Northern Red Oak (Quercus rubra) B. Blue Spruce (Picea pungens)
173

C. Eastern Hemlock (Tsuga Canadensis) D. Giant Sequoia (Sequoiadendron giganteum)
Correct answer: A, C (partial credit awarded for either of these) Average score of upper level management class: .31/1 Average score of incoming first-year group: N/A
174
Appendix V: A Partial list of Bucknell University courses addressing sustainability Compiled 9/20/08 by Education Assessment Team, S. Finkel and A. Siewers, editors Updated 12/23/08 by Dina El-Mogazi Sources: BUEC �“Environmental Connections�” CLA course list, the School of Management�’s �“Management for Sustainability�” elective course list, suggestions by Environmental Assessment Education team members, a survey by BUEC intern Sherry Finkel �’10, and a survey of the faculty. Current tally: 142 courses (but syllabi will need vetting) For the purposes of this ongoing assessment survey an environmental-literacy course across all disciplines is defined by the assessment team provisionally as:
A course with a third to a half of its content highlighting the interaction of humans and the natural world in ways relatable to current environmental issues (ranging from ecological restoration to environmental ethics and environmental social justice); with theoretical frameworks that probe �“open systems�” in terms of a focus on human cultures and communities continuously interacting with the non-human world; and that encourages students to define for themselves and to act upon sustainability in relation to ethics, personal experience, cultural narratives and/or social action and service.
We�’re also including courses with strong potential for meeting that inclusive definition with some tweaking, given their existing framework and orientation.
The goal here is to cover all disciplines and cross-disciplinary efforts (including but going beyond Environmental studies and sciences), bearing in mind challenges to develop a curriculum that can engage issues of social justice, economic sustainability, experiential ethics, and cultural imagination in relation to dynamic human engagement with the non-human world.
Next steps: Collecting and reviewing syllabi, interviews with faculty, efforts to increase faculty use of environmental-related language in course descriptions when appropriate, discuss with Registrar optimal ways to gather and statistically analyze course information.
1. ANTH 256. Native Americans, Past and Present (AI; 3, 0) Origins, prehistoric development, historic contact, resistance and suppression of Native North Americans, and their current struggle as sovereign nations inside the United States and Canada.
2. ANTH 260. Anthropological Perspectives on Human-Environment Relations (II; 3, 0)
Using anthropological methods and theories as a guide, this course considers the form and content of human interactions with the environment in various regions of the world.
175

3. BIOL 150. Plants, People, and the Environment (AI; 3, 3) The diversity and evolution of plants, fungi, and related organisms with special emphasis on flowering plants; their importance for food, fiber, medicine, and psychoactive compounds; origins of agriculture; domestication of plants; and the role of plants in the environment. No prerequisite required. Meets Lab Science requirement.
4. BIOL 208. Population and Community Biology (II; 3, 3)
Introduction to systematic biology, evolutionary theory, physiological ecology, behavioral ecology, population and community ecology, and ecosystem structure and function. Fourth core course. Prerequisite: a general biology course or BIOL 207.
5. BIOL 321. Behavioral Ecology
6. BIOL 330/630 Plant Systematics
7. BIOL 353. Ecosystem Ecology (AI; 3, 0)
Interactions between organisms and physical and chemical environment including nutrient cycling and energy flow, global biogeochemistry, temporal and spatial dynamics of ecosystems. Prerequisites: BIOL 208, junior or senior status, and permission of the instructor.
8. BIOL 334. Limnology (I; 3, 3)
The physical, chemical, and biological characteristics of freshwater communities are studied. Prerequisites: BIOL 208 and permission of the instructor.
9. BIOL 353. Ecosystem Ecology
10. BIOL 354. Tropical Ecology (I or II; 3, 0)
Introduction to tropical ecology, including life history strategies of vertebrates and invertebrates, biodiversity management and conservation. Emphasis on class and individual projects, data collection, and journal keeping. Prerequisites: BIOL 208 and permission of the instructor. Cross-listed as ANBE 354.
11. BIOL 356 Plant-Animal Interactions.
12. BIOL 415. Conservation Biology (I or II; 3, 0)
A synthesis of topics relating to the conservation of plants and animals including extinction, genetics, demography, insularization, threats to biodiversity, conservation economics, environmental ethics, and strategies for conservationists. Prerequisites: BIOL 208 or BIOL 122 and permission of the instructor. Cross-listed as ANBE 415.
13. CAPS 498 01. Politics and Economics of International Environmental Aid.
This interdisciplinary course will provide insight into the particular environmental issues facing developing and �“transitional�” countries and the ways in which the international community attempts to assist in addressing those issues.
14. CENG 320. Water Resources Engineering (II; 3, 3) Planning, design, and operation of water resources projects with emphasis on hydrology, hydraulic structures, and open and closed conduits; applications in stormwater management and water supply.
15. CENG 330. Introduction to Transportation (II; 3, 2)
Transportation systems, operations, planning, and design for highways and other modes; sustainability, safety, social, and economic issues; traffic studies in the local community.
16. CENG 340. Environmental Engineering (I; 3, 2)
An introduction to the fundamentals of environmental engineering and science such as chemistry, microbiology, mass balance, and reactor theory. Application of fundmental concepts to environmental engineering includes water quality, water and wastewater treatment, solid and hazardous waste, air pollution, greenhouse gases and global warming, green energy, and professional ethics. The course includes a hands-on laboratory component with a focus on experiential learning. Prerequisite: ENGR 222 or permission of the instructor.
17. CENG 350. Geotechnical Engineering I (I; 3, 2)
Origin, composition, structure, and properties of soils. Identification, classification, strength, permeability,
176

and compressibility characteristics. Introduction to foundation engineering. Laboratory determination of soil properties. Prerequisites: ENGR 208 and ENGR 222 or permission of the instructor.
18. CENG 421. Hydrology (I or II; 3, 3)
The interrelation of meteorological conditions, precipitation, surface runoff, and groundwater storage. Prerequisites: CENG 320 and permission of the instructor.
19. CENG 429. Advanced Topics in Water Resources Engineering (I or II; 3, 2)
Topics will vary. Prerequisite: permission of the instructor.
20. CENG 431. Introduction to Urban and Regional Planning (I or II; 4, 0) Problems of urban and regional planning and the treatment of various factors of a comprehensive plan. Emphasis on the sustainability and interrelationships between engineering, sociology, geography, and economics. Prerequisite: permission of the instructor.
21. CENG Transportation Policy and Planning (I or II; 4, 0)
Analysis of policy in a social and environmental context. Transportation supply, demand, and pricing. Evaluation of alternative plans. Analysis of transportation benefits and costs. Prerequisite: CENG 330 or permission of the instructor.
22. CENG 433.Mass Transportation Seminar (II; 4, 0)
A pragmatic analysis of mass transportation, its history, present condition, and future; emphasis on the social and economic aspects of transit. Prerequisite: permission of the instructor.
23. CENG 434. Innovative Transportation Engineering (AII; 3, 1)
Innovative concepts in transportation planning, design, and operation including context sensitive design, traffic calming, roundabouts, intelligent transportation systems, and geographic information systems. Prerequisite: permission of the instructor.
24. CENG 440. Physical/Chemical Treatment Processes (I or II; 3, 3)
Fundamental principles of physical and chemical treatment processes used to treat contaminated water, air, and soil such as ion-exchange, coagulation, sedimentation, filtration, air stripping, disinfection, adsorption, and membrane processes. Laboratory experiments are used to reinforce theory and to develop design criteria for full-scale treatment processes. Prerequisite: permission of the instructor.
25. CENG 441. Environmental Engineering Biotechnology (I or II; 3, 3)
Theory and design of biological waste treatment for industrial, municipal, and hazardous pollutants, and natural biotransformation of pollutants in the environment. Kinetics of biological growth. Biological treatment of industrial wastes and bioremediation of hazardous wastes. Prerequisite: CENG 340 or permission of the instructor.
26. CENG 444. Hazardous Waste Management (I or II; 3, 3)
Toxicology and risk assessment, bioremediation, industrial waste pretreatment, stabilization techniques, facilities siting, secure landfill design, incineration, legal and liability issues, public participation, remedial action, and emergency response. Prerequisite: CENG 340 or permission of the instructor.
27. CENG 445. Environmental Engineering Chemistry (I or II; 3, 2)
Principles of aquatic chemistry and applications with emphasis on acid-base reactions, metal speciation and solubility, and oxidation-reduction reactions in water. Prerequisite: permission of the instructor.
28. CENG 448. Environmental Engineering Unit Operations and Processes (I or II; 3, 3)
Fundamental principles of physical, chemical, and biological treatment systems used in the treatment of air, soil, and water in the field of environmental engineering. The course focuses on coagulation, flocculation, sedimentation, filtration, gas/liquid transfer, adsorption, biological treatment, and the design and analysis of these technologies in environmental treatment process. Laboratory experiments are used to demonstrate and reinforce theory of these processes. Prerequisite: CENG 340 or permission of the instructor.
29. CENG 449. Advanced Topics in Environmental Engineering (I or II; R; 4, 0)
Prerequisite: permission of the instructor.
177

30. CENG 451. Environmental Geotechnology (II; 3, 3) Interaction between hazardous and toxic wastes and geotechnical properties of soils. Remediation of the subsurface environment. Prerequisite: CENG 350 or equivalent or permission of the instructor.
31. CENG 491. Civil Engineering Design (II; 2, 10)
A comprehensive design of a civil engineering project that integrates at least two subdisciplines of civil engineering. Projects are designed by teams of two to four students and must involve analysis and synthesis to produce design solutions that achieve the desired "client" needs within specified constraints. A weekly seminar series by practicing engineers and others focuses on ethics, professionalism, global issues, and engineering careers. Prerequisite: CENG 490.
32. CHEG 444. Green Engineering
33. CHEG 455, Atmospheric Chemistry and Physics
34. CHEM 160. Introduction to Environmental Chemistry (II; 3, 3)
One semester terminal course in chemistry. Basic chemical concepts as they relate to chemical behavior, toxicity, and effects in the environment. Case studies are used to illustrate concepts. Satisfies laboratory science requirement for bachelor of arts students not majoring in science or engineering. Laboratory will emphasize techniques used for environmental analysis. Not open to students who have taken CHEM 201, CHEM 202 or CHEM 211. Prerequisite: high school chemistry. Seniors by permission only.
35. CHEM 360. Advanced Environmental Chemistry
36. CLASSICS 247/ENT STUDIES 247 Environmental History of the Ancient World
37. ECON 231. Resources and the Environment (I; 3, 0)
This course will develop economic concepts to explain why well-intentioned individuals so often choose to abuse their own environment and stock of natural resources and suggest and evaluate policies designed to remedy the situation. Prerequisite: ECON 103 or permission of the instructor
38. ECON 252. Political Economy of Global Resources (I or II; 3, 0)
A study of environmental and energy economics in the context of global resources and politics. The theme of sustainable development will be linked to the new realities of international relations. Prerequisite: ECON 103. Cross-listed as IREL 252.
39. ECON 258. Intermediate Political Economy (I or II; 3, 0)
Intermediate study of Marxist and institutionalist political economy. The ideas of Marx and Veblen applied to such matters as the distribution of income and power, the environment, working conditions, consumerism, and race and gender issues. Prerequisite: ECON 103.
40. ECON 357. Economic Development (I; 3, 0)
The main theories of development; economic and social dualism; agricultural, industrial, and trade strategies; the use of monetary and fiscal policies in promoting economic development; and the role of less developed countries in the emerging global economy. Prerequisites: ECON 256 and ECON 257 or permission of the instructor.
41. ENGL 90. Landscape and Literature (Foundation Seminar)
This course asks the questions (1) how does landscape function in literature, and how does literature contribute to the making of landscape? And (2) why has landscape been so important in the western imagination, and what moral and consolatory function has it performed historically?
42. ENGL 150. Art, Nature, and Knowledge (I or II; 4, 0)
Interdisciplinary study of selected works in art, music, literature, science, and philosophy from the Renaissance through the 19th century. Cross-listed as HUMN 150, PHIL 150 and RESC 150.
43. ENGL 201. Nature Writing/Writing Nature.
This creative writing �“form and theory�” course surveys the tradition of nature writing in several traditions with a close eye on the ways in which nature is inscribed by literary forms.
44. ENGL 213. Deep Ecology in Native American Storytelling
178

This course is a survey of precontact Native American literature with an emphasis on creation myths, extended adventure narratives, and other forms of storytelling that illustrate the foundational literature�—as it is known through scholarly translations�—of Native North American cultures.
45. ENGL 240. The Green World of English Literature.
This course surveys medieval literature from the perspective of environmental literary criticism, viewing development of Western notions of subjectivity and relationships through the framework of nature.
46. ENGL 243. Elvish Writing: Spenser, Chaucer, and Early English Phenomenology
A study of Chaucer�’s Canterbury Tales and Spenser�’s Faerie Queene as textual landscapes shaping cultural views of nature and landscape, in light of current writings in environmental phenomenology examining the environmental function of narrative.
47. ENGL 340. Empire and Archipelago: Place and Literature in Early Celtic Britain.
This seminar examines nature in the literature of post-Roman and early medieval Britain through the lens of environmental philosophy, including deep ecology, environmental phenomenology and place studies, and the geophilosophy of Deleuze and Guattari.
48. ENST 100. Introduction to Environmental Studies (I; 3, 0)
A first course in environmental studies, exploring our major impacts upon the environment in their cultural, political, historical, economic, and ethical context.
49. ENST 200. Environmental research methods (focus on environmental health)
50. ENST 205. Green Utopias (II; 3, 0)
Introduction to literary utopias and to the cultural writings of various ecological movements offering alternative concepts to the increasing destruction of nature.
51. ENST 207. American Environmental History (II; 3, 0)
Explores American environmental history by asking; "How did Americans interact with their landscape?" and "What were the consequences?". The course proceeds both chronologically and topically. Cross-listed as HIST 212.
52. ENST 211. Environmental Pollution and Control (I; 3, 3)
Introduction for non-engineering students to the major areas of environmental engineering. Topics include air, noise, and water pollution, solid, hazardous, and radioactive waste and methods to treat and dispose of these pollutants. Not open to students in the College of Engineering.
53. ENST 215. Environmental Planning (I; 3, 0)
Explores the main approaches to planning theory and their environmental applications. Considers how environmental planning can promote the socio-ecological health and sustainability of democratic communities.
54. ENST 221. Hazardous Waste and Society (II; 3, 3)
Hazardous waste regulation, risk assessment and toxicology, overview of treatment technologies and site investigation, environmental audits, facilities siting and public participation, pollution prevention. Not open to students in the College of Engineering.
55. ENST225 Environmental Dispute Resolution
56. ENST 226. Water Politics and Policies (I; 3, 0)
Examines the evolution and philosophical foundations of water use as well as the politics surrounding current issues in water use.
57. ENST 228. The Loire. A Cultural Heritage or a �“Wild�” River of the Anthropecene? (I or II; 3, 0)
This course includes in-class lectures and on-site discovery of the river aboard traditional boats. Goals of the course are: to develop a good understanding of the links between a-biotic and biotic dynamics and human activities, to understand the importance and the necessity of the river management, especially on rivers like the Loire (wild aspects, hydrology, etc.) Prerequisite: Open only to students enrolled in the Bucknell en France program.
58. ENST 230. Introduction to Ecological Design (II; 3, 0)
179

The application of basic ecological principles to the design of buildings, landscapes, communities, and cities. Emphasis is placed on real situations in the local environment.
59. ENST 235 Land Use: History Ethics and Politics
60. ENST 240. Sustainable Resource Management (II; 3, 0)
Course will focus on the conceptual and practical challenges of managing for sustainability in a variety of resource contexts, including forests, water, wildlife, and recreation.
61. ENST 245. Environmental Politics and Policy (I; 3, 0)
An introduction to understanding the role of political institutions, stakeholders and policy processes (in the U.S. and internationally) in addressing environmental problems.
62. ENST 250. Environmental Policy Analysis (II; 3, 0)
Focuses on problem-oriented policy analysis of domestic and international environmental issues including ecosystem management, endangered species, protected areas, and community-based co nservation.
63. ENST 255. Environmental Justice (II; 3, 0)
Utilizing the literature of moral, social and political philosophy, we will analyze how variations in our definition of justice dictate distinct public policies toward nature.
64. ENST 260. Environmental Law (I; 3, 0)
This course will examine the statutes, regulations and common law pertaining to risk and pollution abatement. We will both analyze current law and propose changes to better address the environmental problems involved.
65. ENST 270. Environmental Science and Public Policy
66. GEOG 100, From Earth to Home
Through field trips, readings, discussions, and lectures, we will explore our local laboratory -the Susquehanna Valley environment, its interconnectedness to the wider world, and the manner in which we continue to transform this part of the earth into home.
67. GEOG 101. Geographies of Globalization (I; 3, 0)
An introduction to the processes and dynamics leading to the ever-changing character of places and regions, and an examination of interdependence amidst processes of globalization.
68. GEOG 110. World Environmental Systems (I; 3, 3)
Survey of physical geography, organized upon an understanding of how natural systems �– climate, landscape evolution, biological community �– create the different environments of the world. Laboratory science course.
69. GEOG 113. Human Impact on the Environment (II; 3, 0)
Causes and effects of major environmental changes induced by humans, and the tools scientists use to interpret environmental change. Non-laboratory science course for BA students.
70. GEOG 166. Reading the Cultural Landscape (I; 3, 0)
Understanding the human landscape as a cultural, historic, ecological, and symbolic system, through our observations of the geography around us. Prerequsite: juniors and seniors by permission only.
71. GEOG 209. Economic Geography (II; 3, 0)
Inquiry into local and global changes in economic activity, location, and spatial organization, especially focusing on implications for the well-being of people in particular places.
72. GEOG 210. Urban Condition (I; 3, 0)
Geographic and sociological inquiry into pressing urban issues of advanced industrialized societies, including inequality, housing, employment, and how cities fit into the American present and future. Cross-listed as SOCI 210.
73. GEOG 211, Political Geography (I; 3, 0)
Illustrates the complex relationship between power, knowledge, and geography at a range of different scales, from the local to the global. Also examines the role played by geographers in the service of empires, states and nations, and questions whether contemporary developments challenge the existence of the nation state.
180

74. GEOG 231. Weather and Climate (II; 3, 3)
The controls of weather: insolation, evaporation, wind, and topography; the climates that result; and their impact on human activity.
75. GEOG 232. Evolution, Ecology, and Human Impact (I; 3, 3.5)
This introductory course explores processes shaping the distribution and diversity of life on earth as a framework for understanding our impact on the biosphere. Laboratory science course.
76. GEOG 233. Food and Environment
77. GEOG 235. Marine Environment (II; 3, 0)
Future of the oceans: global change and sea level rise, pollution and human impact, coastal management, threatened ecology of the ocean, sustainability and marine resources.
78. GEOG 236. Third World Development (II; 3, 0)
Socio-cultural, economic, and environmental problems confronting developing countries. Includes such topics as political-economic change in a global and local context, transnational corporations, gender relations, food production/consumption, urbanization, and sustainable development.
79. GEOG 257. Global Environmental Change (I or II; 3, 0)
Understanding human and physical systems as they respond to the natural and human-induced changes in the global environment. Prerequisite: permission of the instructor.
80. GEOG 265. Geography of Pennsylvania (II; 3, 0)
Exploring the landscape, industry, culture, and history of Pennsylvania; using this example to understand the broad themes of human geography.
81. GEOL 103. Dynamic Earth
General introduction to the earth's external and internal dynamic systems; processes that operate within plate tectonics to make Earth a unique planet and human interaction with the earth.
82. GEOL 104. Evolution of the Earth (I and II; 3, 4)
An introduction to the evolution of life, climate, plate tectonics, and catastrophes through time provides perspective for making decisions about ongoing human impacts on the environment. Demonstrated by a field-based study of the Appalachian Mountains. Prerequisite: first- or second-year status, others by permission.
83. GEOL 106. Environmental Geology (I and II; 3, 4)
Geologic factors and limitations that affect use or management of the environment. Not open to students who have taken GEOL 103 or GEOL 150.
84. GEOL 107. Global Change - Past and Present
Introduction to major transformations of the physical, biological, and chemical components of Earth systems from a geological perspective including climate, tectonics, biodiversity, sea-level and ocean circulation.
85. GEOL 150. Engineering Geology
Basic principles, including properties of rocks and soils, hydrology, surface processes, rock mechanics, environmental parameters, geological hazards, and engineering case histories.
86. GEOL 205. Introduction to Geochemistry
Element distribution, basic thermodynamics and kinetics, mineral and gas solubility, phase diagrams, stable and radioactive isotopes, oxidation-reduction processes, surface geochemistry, composition of natural water.
87. GEOL 207. Environmental Geohazards
Geologic environmental hazards. Emphasis on hazards recognition and assessment in seminars, and field applications. Topics include: soils, slopes, floods, fans, earthquakes, land use, coastal and groundwater hazards.
181

88. GEOL 210. Geomorphology
Physical processes shaping the earth�’s surface and evolution of resulting landforms. Emphasis on linkages between landscape components and understanding complex relationships between process and form.
89. GEOL /298BIOL 298/ENST298/UNIV298. Stream Restoration
Scientific principles to integrate physical and biological approches to stream restoration in watershed management. Team-taught field course highlights developing restoration plan for Bucknell's Miller Run.
90. GEOL299/BIOL299/ENST299/ UNIV 299. Watershed Systems Science
Watersheds regulate water flow and ecosystem health on our landscape. Team-taught field course integrating physical, chemical, and biological processes in watersheds, using the Susquehanna and tributaries.
91. GEOL 301, Geophysics
92. GEOL 324/624. Hydrogeology
Fundamentals of subsurface flow, regional groundwater flow, well hydraulics, and groundwater quality.
93. GEOL/ENST/UNIV XXX. Semester on the Susquehanna.
New course to be taught in 2009-2010.
94. GEOL CAPS. Cosmology and Ecology
95. HIST 170. Introduction to the History of Science and Technology (I or II; 3, 0) A general survey of Western science and technology in relation to social and intellectual developments from ancient times to the present.
96. HIST 212. American Environmental History (II; 3, 0)
Explores American environmental history by asking: "How did Americans interact with their landscape?" and "What were the consequences?" The course proceeds both chronologically and topically. Cross-listed as ENST 207.
97. HIST 229. Topics American Intellectual History: Environmental Thinkers
This course explores environmentalist thought�—both pro and con-through the major environmental debates of the last 150 years.
98. HIST 371. Environmental History (I or II; 3, 0)
Intensive study of selected issues. Topics vary Cross-listed as ENST 371.
99. HUMN 150. Art, Nature, and Knowledge (I or II; 4, 0) An interdisciplinary study of selected works in art, music, literature, science and philosophy from the Renaissance through the 19th century. No prerequisite. May be cross-listed as ENGL 150, PHIL 150, and RESC 150.
100. IREL 255. International Law (II; 3, 0)
The nature, historical development, and sources of international law; substantive and procedural international law and its role in international relations. Cross-listed as POLS 278.
101. IREL 275. Global Governance (I or II; 3, 0)
This course explores the rationales, processes, and institutions of multilateral governance in a globalized world. We examine the U.N., nongovernmental organizations, conflict resolution, economic development, environment, human rights, and international law. Not open to first-year students. Cross-listed as POLS 275.
102. MGMT 312. Business, Government and Society (I or II; 3, 1)
Focuses on the social and political environments in which firms operate. Includes topics such as ethical
182

decision-making, managing multiple stakeholder (market and non-market) relationships, business involvement in the public policy process, and the role of the multinational firm in the global economy/
103. MGMT 319. Management Strategy and Policy.
This course focuses on ecologically and socially sustainable strategic management of organizations in the context of ecologically sustainable global economic development.
104. MGMT (FOUN 099) Six Degrees of Separation
105. MGMT 339 Organizational Theory
106. MGMT 340 Decision Sciences
107. MGMT (CAPS 499) The Rise of the Network Society
108. MECH 441, The Fundamentals of Combustion
The fundamentals of chemically reactive flow systems with application to jet, rocket, and other air-breathing engines with special interest paid to pollutant formation.
109. PHIL 150. Art, Nature, and Knowledge (I or II; 4, 0)
An interdisciplinary study of selected works in art, music, literature, science, and philosophy from the Renaissance through the 19th century. Cross-listed as ENGL 150, HUMN 150, and RESC 150.
110. PHIL 213. Ethics (II; 3, 0)
An attempt to formulate adequate criteria for the basic moral conceptions of good and bad, right and wrong, and duty, by a study of leading ethical view points from Plato to the present. Prerequisite: PHIL 98 or 100 or 103 or 201 or 220.
111. PHIL 214. Social and Political Philosophy (II; 3, 0)
Problems such as individual and state, freedom and organization, power and rectitude, philosophy of law, equity and differences, the sociomoral basis of rights. Prerequisite: PHIL 98 or 100 or 103 or 201 or 220.
112. PHIL 218. Ecology, Nature, and the Future (I or II; 3, 0)
Analysis of some philosophical conceptions of the self-nature relation and their implications for the use and abuse of our natural environment.
113. PHIL 311. Environmental Aesthetics.
114. PHIL 480. Western Perspectives on Animals (I or II; 3, 0)
Examines the conceptual and moral status of animals in our culture, as expressed in philosophy, religion, ethology (animal behavior), the law, and social policy. Prerequisite: one course in philosophy.
115. POLS 231. Introduction to Public Policy (I; 3, 0)
Course introduces students to theories of the policy-making process in America, and also provides an overview of the major policy areas in American politics.
116. POLS 232. American Public Policy (II; 3, 0)
Advanced, in-depth look at different features of American public policy and the policy process. Specific topics rotate, but past topics have included affirmative action, welfare reform, Social Security, and high school reform.
117. POLS 281 Peace Studies
118. POLS 211 Third World Politics
119. POLS 234. State and Local Internship Program (II; 3; 0)
Participants explore politics and policy at the state and local level through integrated class work, independent research, and real world work experiences.
120. POLS 269. Power, Protest, and Political Change (AI; 3, 0)
Explores the life cycle of social movements. Looks at mobilization, tactic selection, and the legacies of "passionate politics" through specific cases of social movement activity. Cross-listed as SOCI 269.
183

121. POLS 275. Global Governance
This course explores the rationales, processes, and institutions of multilateral governance in a globalized world. We examine the U.N. nongovernmental organizations, conflict resolution, economic development, environment, human rights, and international law.
122. POLS 276. Global Justice and Social Change (I or II; 3, 0)
Analysis of different views of global justice; study of ethical and global problem-oriented "benevolent" actors in international relations, such as Amnesty International and Greenpeace; development of solutions to urgent global problems and discussion of strategies of social change.
123. PSYC 266 Animal Behavior
124. PSYC 370 Primate Behavior and Ecology
125. RELI (FOUN 099) The Ethics of Consumption
126. REL 214 God Nature and Knowledge
127. RELI 226. Environmental Ethics
This course will present a variety of approaches to this question in the field of environmental ethics. Our principal aim will be to bring some conceptual clarity to contemporary efforts to speak about the moral value of "nature."
128. RUSSIAN 253 Folklore and Ritual
129. SOCI 201. Field Research in Local Communities (I or II; 3, 0)
Participant observation, interviewing and other field research methods. Students will carry out exercises and projects in local communities. Cross-listed as ANTH 201.
130. SOCI 215. Human Service Systems (I; 3, 0)
Historical and contemporary development of social services in relation to changing political-economic structures and human needs. Emergence and impact of service organizations and professions. Recommended as prerequisite for SOCI 318.
131. SOCI 310. The Sociology of Developing Societies (II; 3, 0)
Examines various conceptions of development and how they are implemented in selected countries. Prerequisite: any sociology or anthropology course, or permission of the instructor.
132. SOCI 322. Sociology of Medicine (I or II; 3.0)
A seminar in which topics of interest to students in the area of the sociology of health, medicine, and medical policy will be discussed. (Potential environmental health focus.)
133. SOCI 311. Globalization, Technology, and Cultural Change (I; 3, 0)
Examination of the impact of the processes of global restructuring and the technological revolution on people, culture, and society. Prerequisite: any course in sociology.
134. SOCI 210 The Urban Condition
135. SOCI 290 The Sociology of Caribbean Society
136. SOCI 418 Social Services and Community: A Practicum
137. SOCI (CAPS 428) Culture and Politics in the 1960s
138. SPAN 346. Utopia/Dystopia in Urban Latin America (I or II; 3, 0)
This interdisciplinary course explores cities of Latin America through the lens of utopia and dystopia. Sources of inquiry include film, architecture, art, fiction, poetry, and readings in history, politics, economics, and environmental studies. Cross-listed as SPAN 446.
184

139. UNIV 242. Food and Society (AI or II; 3, 0) This course explores the impact that technologically driven changes in food production and distribution are having on individuals, communities, cultures, and the environment.
140. UNIV 270. Technical Prospectives: Life, the Universe, and Engineering (I or II; 4, 0)
Technical and critical evaluation of issues in our society using principles of mass and energy conservation and engineering design methodology. Issues may include: global warming, disposal of hazardous waste, product advertisements, pharmaceutical development and testing, product manufacturing, successes and failures. Cross-listed as ENGR 270.
141. UNIV 335. Practicing Democracy: Active Citizenship, Community Engagement and Social Change (AI;
3, 1-2) An examination of historic and contemporary concepts of democratic citizenship, this interdisciplinary course explores efforts promoting the common good. Students practice civic engagement through public service. Prerequisite: permission of the instructor.
185

Appendix VI: Environmental Connections course requirement
Environmental Connections: Human Interactions with the Natural World
Proposal to the Curriculum Committee for inclusion in the proposed Common Learning Agenda Revisions
First version submitted to the Curriculum Committee on December 11, 2007
Revised version submitted March 31, 2008
Core Rationale We propose that a required course focused on the connections between humans and the natural world be included as part of the disciplinary breadth component of the revised Common Learning Agenda (CLA). All humans depend upon and impact the natural environment thus necessitating an ability to critically analyze and evaluate these complex interrelationships from diverse disciplinary perspectives. Today�’s students will enter a world far different from that of their parents�’ time, a world in which many human social issues are often inextricably tied to environmental issues. A human-environment relationships requirement would prepare our students to fully appreciate these complex interrelationships in order to enable them to successfully address contemporary and future challenges. Links to Bucknell�’s Mission, Strategic Plan, and Educational Goals Developing our students�’ ability to critically analyze and evaluate the relationships between humans and the natural environment from diverse disciplinary perspectives reinforces Bucknell�’s mission �“to educate students for the exercise of high responsibility in all phases of society.�” Courses and activities related to the environmental connections requirement would also contribute to achieving goals in The Plan for Bucknell including strengthening the academic core, deepening the residential learning experience, and building bridges with the local community. Further, this requirement would support President Mitchell�’s recent pledge pertaining to the American College and University Presidents Climate Commitment to �“foster the concepts of sustainability and environmental ethics in our curriculum.�” Finally, an environmental connections requirement would respond to many of the recently approved educational goals, particularly:
Develop knowledge and skills to identify and respond creatively and effectively to local and global challenges to humans and the natural world.
Understand the importance of and develop the capacities for self-assessment, ethical reasoning, and effective interaction with others so as to act responsibly and to promote justice in professional and communal life.
Develop critical thinking skills to evaluate arguments and address complex issues using techniques including quantitative and qualitative analysis and scientific reasoning.
186

Links to Bucknell�’s Curriculum The competencies outlined in this proposal highlight and focus existing academic strengths at Bucknell and an expanding number of course offerings, student research opportunities, and service activities that address the human-natural environment nexus from disciplinary perspectives spanning the humanities, social sciences, and natural sciences. In combination with other curricular areas and proficiencies emphasized in the disciplinary breadth component�—including study of foreign languages, intercultural affairs, and diversity�—inclusion of an environmental connections requirement would allow Bucknell to take a leadership role in cross-disciplinary liberal arts education. Human connections to the environment�—which can involve other humans, non-humans, and complex systems comprising both humans and non-humans�—will provide a unique cross-disciplinary framework for fostering proficiencies that involve students in learning about themselves, their values, and their cultural and physical interrelationships. Students will develop such proficiencies and their own structures for thinking about environmental connections in an academic setting that engages urgent contemporary social and physical concerns as well as emerging new global disciplines and career emphases. Implementation In order to maintain Bucknell�’s high educational standards, meet the university�’s recent environmental commitments, and provide leadership as a liberal arts college in addressing this century�’s challenges, a core requirement focused on human-environment relationships would help prepare students to be responsible, self-assessing, ethical, critical, and knowledgeable about environmental issues. Such a course would be defined as one that meets at least three criteria as follows�—�“environmental connections,�” �“personal connections,�” and �“physical,�” or �“cultural,�” or �“social�” connections :
(1) Environmental Connections�—students develop the ability to analyze, evaluate, and synthesize complex interrelationships between humans and the natural world. [Core Proficiency]
(2) Personal Connections�—students achieve at least one of the proficiencies
described under the personal connections area presented below. [Area of Proficiency I] This proficiency is required of all �“environmental connections�” courses in order that students develop a direct appreciation for their connections to the natural world as individuals.
(3) Physical, Cultural, and Social Connections�—students achieve at least one of the
proficiencies described under at least one of the remaining areas�—physical connections, cultural connections, and social connections. [Areas of Proficiency II, III, and IV]
Faculty would most likely develop an �“environmental connections�” course from their area of expertise such that any disciplinary field could potentially fulfill the requirement. Current courses in all major field areas of the College of Arts and Sciences could be adapted to meet
187

the criteria. Faculty might develop proposals for inclusion as an �“environmental connections�” course based on a checklist that covers the proficiencies described below. In the event that the proposal for the revised common learning agenda calls for the formation of a coordinating committee to support the CLA coordinator, faculty members associated with this proposal (among other candidates) could assist in reviewing �“environmental connections�” course proposals. A full list of proficiencies follows: Areas of Proficiency�—One from (I) and one from either (II), (III), or (IV) I. Personal Connections
A. To reason about ethical issues pertaining to the environment. This proficiency requires students to examine their personal ethical beliefs about the environment honestly and responsibly, including their relationships with other species and future generations.
B. To facilitate a direct experiential awareness of the natural world. This competency may be
cultivated through a broad spectrum of activities that foster or encourage purposeful engagement with the natural world, practical knowledge or direct appreciation of nature, creative exchange with nature, or meditative/bodily awareness in relation to the environment.
C. To connect to the community. This ability requires students to learn to engage as
individuals in meaningful, constructive, and mutually beneficial relationships with local, regional, and global communities in contexts emphasizing the natural world.
D. To connect individual choices to larger societal goals related to the environment. This proficiency
requires students to understand the connections between the choices they make in their daily lives and the shared resources of the natural world upon which many others depend.
II. Physical Connections
A. To trace the fundamental physical interconnections between humans, other species, and the environment. This skill encompasses a practical understanding of human ecological relationships. Examples might include discussion of natural resource cycles and human consumption�—e.g., where food and drinking water come from, where wastewater goes, what happens when unwanted things are thrown �“away�”, and how consumer goods �“materialize�” from natural resources.
B. To explain how natural systems function and how human actions affect them. This proficiency
requires students to understand basic principles of ecology, geology, and
188

atmospheric science such as water cycling, soil-building, air circulation, energy flow, food webs, and evolutionary adaptation, along with associated human impacts such as water contamination, soil erosion, climate change, habitat encroachment, and extinction.
C. To distinguish between human impacts and natural changes. This competency requires
students to discern the difference between environmental changes that occur in contexts beyond human control, and those that are anthropogenic.
D. To elucidate the concept of sustainability. This skill requires students to be able to weigh
and consider multiple definitions of environmental sustainability, and critically evaluate competing claims as to what is �“sustainable�”.
189

III. Cultural Connections
E. To analyze current cultural narratives that shape our relationship to the environment. This competency requires students to be skilled in the identification, interpretation, and reformulation of cultural assumptions such as those inherent in religious, philosophical, mythological, scientific, media, and economic narratives.
F. To analyze past cultural constructions of the environment. This competency requires
students to be fluent in their interpretation of historic environmental narratives, including alternatives within and outside of dominant Western traditions.
IV. Social Connections
G. To analyze societal mechanisms that influence our relationship to the environment. This skill requires students to be able to evaluate and scrutinize the environmental impacts of cultural systems including the economic, political, educational, and technological frameworks that govern the operation of our society.
H. To assess governance and the varieties of political conflicts regarding human-environment
relationships. Develop an understanding of economic, cultural, scientific and political influences on the state�’s role governing the use of and impact on the environment.
I. To understand the role of technological, economic, and scientific knowledge in environmental decision-
making and power relations between social actors. This skill requires students to understand the debates about how such knowledge is used in political and social frameworks and the connections between these types of knowledge and public opinion, indigenous knowledge, or �“street science.�”
Contributors: Dina El-Mogazi, Peter Wilshusen, Amanda Wooden, Jamie Hendry, Alf
Siewers, Jeff Trop, Ben Marsh, Craig Kochel, Duane Griffin, and Mark Spiro.
Endorsed by: Maria Antonaccio, Chris Camuto, Katie Faull, Michael Johnson-Cramer,
Ellen Herman, Tammy Hiller, Steve Jordan, Carl Kirby, Molly McGuire, Matt McTammany, Ned Searles, Paul Shrivastava, and Steve Stamos.
190

Appendix VII: Courses teaching about the local environment (With 2008-2009 Instructors) Animal Behavior 296. Applied Research Methods in Animal Behavior (I or II; 0; 3*) �– Prof. Maureen Leonard (Fall), Prof. Peter Judge (Spring) Laboratory and/or field research to accompany ANBE/BIOL/PSYC 266 (Animal Behavior) Prerequisite: PSYC 215 and prerequisite or co requisite ANBE/BIOL/PSYC 266. Cross-listed as PSYC 296. Anthropology 201. Field Research in Local Communities (I or II; 3, 0) �–Prof. Michelle Johnson (Spring) Participant observation, interviewing and other field research methods. Students will carry out exercises and projects in local communities. Cross-listed as SOCI 201. 351. Field Research (AII; R; 3, 0) Half to two courses. Independent investigation in the field; formulation of hypotheses, construction of measuring instruments, data collection, data analysis, and test of hypotheses. 410. The Environment in Cross-Cultural Perspectives (I or II; 3, 0) �– Prof. Edmund Searles (Fall) Explores how particular environments come to have particular meanings �– cultural and sociological, economic and political, local and global, private and public. Prerequisite: senior status. Biology 150. Plants, People, and the Environment (AI; 3, 3) The diversity and evolution of plants, fungi, and related organisms with special emphasis on flowering plants; their importance for food, fiber, medicine, and psychoactive compounds; origins of agriculture; domestication of plants; and the role of plants in the environment. No prerequisite required. Meets Lab Science requirement. 208. Population and Community Biology (II; 3, 3) �– Prof. Warren Abrahamson, Prof. Stephan Jordan (Spring only) Introduction to systematic biology, evolutionary theory, physiological ecology, behavioral ecology, population and community ecology, and ecosystem structure and function. Fourth core course. Prerequisite: a general biology course or BIOL 207. 313. Mammalogy (AI; 3, 3*) Biology of mammals, including evolution, classification, biodiversity, behavior, anatomy, physiology, ecology, and conservation. Lab will include specimen identification, preparation, and field study. Prerequisites: BIOL 206 and permission of the instructor. 316. Plant Growth and Development (AI; 3, 3) The physiological and molecular bases of growth and development at the organ, tissue, and cellular levels. Effects of environmental stimuli and hormones on gene expression and the resultant changes at higher levels of organization. Prerequisites: BIOL 205, BIOL 206, and permission of the instructor. 334. Limnology (I; 3, 3) �– Prof. Peter Petokas (Fall) The physical, chemical, and biological characteristics of freshwater communities are studied. Prerequisites: BIOL 208 and permission of the instructor. 353. Ecosystem Ecology (AI; 3, 0) �–Prof. Matt McTammany (Spring) Interactions between organisms and physical and chemical environment including nutrient cycling and energy flow, global biogeochemistry, temporal and spatial dynamics of ecosystems. Prerequisites: BIOL 208, junior or senior status, and permission of the instructor. 355. Social Insects (I; 3, 3) Evolution and genetics of social behavior, caste, communication in foraging and colony defense, queen and worker
191

control over reproduction, social homeostasis, and population dynamics. Occasionally may be taught as a laboratory science. Prerequisites: BIOL 208 and permission of the instructor. Cross-listed as ANBE 355. Juniors and seniors only. 356. Plant-Animal Interaction (I; 3, 3) The coevolution and ecology of plants and animals covering pollination ecology, seed dispersal, plant-herbivore interactions, and habitat constraints on the behavioral ecology of animals. Prerequisites: BIOL 122 or 208 and permission of the instructor. Cross-listed as ANBE 356. 357. Ornithology (II; 3, 3) �– Prof. Donald Dearborn (Spring) The biology of birds, including evolution, behavior, anatomy, physiology, ecology, and conservation; lab trips focus on identification of birds in the field. Prerequisites: BIOL 206 and BIOL 208 and permission of the instructor. Cross-listed as ANBE 357. 415. Conservation Biology (I or II; 3, 0) �–Prof. Warren Abrahamson (Fall) A synthesis of topics relating to the conservation of plants and animals including extinction, genetics, demography, insularization, threats to biodiversity, conservation economics, environmental ethics, and strategies for conservationists. Prerequisites: BIOL 208 or BIOL 122 and permission of the instructor. Cross-listed as ANBE 415. Chemical Engineering 410. Project Engineering (II; 3, 3) �– Profs. James E. Maneval, Katsuyuki (Kat) Wakabayashi, and Brandon M. Vogel. Second of two Capstone experiences for chemical engineering majors. Students refine a general problem statement in order to plan, execute, and assess a project that achieves specified goals. Design, construction, and testing of an apparatus, system, or simulation. Problem-solving, teamwork, communication, professional development, and laboratory work are emphasized. Prerequisite: CHEG 400. Civil Engineering 300. Introduction to Structural Engineering (I; 4, 0) �– Prof. Stephen Buonopane (Fall) Introduction to behavior, analysis, and design of structures; including design, criteria, loads, modeling of structural systems, design with various material types (e.g. steel, concrete, timber, masonry). Discussion of the design process, and societal and global context of structural design. Case studies used throughout the course. Prerequisites: ENGR 208 and ENGR 242. 305. GIS Applications for Engineering (I or II; 3, 2) Introduction to basic concepts in geographic systems, spatial analysis, and their application in engineering. Students will learn to use GIS software for presenting and analyzing engineering problems. Prerequisite: permission of the instructor. 320. Water Resources Engineering (II; 3, 3) �– Prof Richard Crago (Spring) Planning, design, and operation of water resources projects with emphasis on hydrology, hydraulic structures, and open and closed conduits; applications in stormwater management and water supply. Prerequisite: ENGR 222. 330. Introduction to Transportation (II; 3, 2) �– Lecture Staff, Lab Prof. Cara Wang (Spring) Transportation systems, operations, planning, and design for highways and other modes; sustainability, safety, social, and economic issues; traffic studies in the local community. 340. Environmental Engineering (I; 3, 2) - Prof. Matthew Higgins (Fall) An introduction to the fundamentals of environmental engineering and science such as chemistry, microbiology, mass balance, and reactor theory. Application of fundamental concepts to environmental engineering includes water quality, water and wastewater treatment, solid and hazardous waste, air pollution, greenhouse gases and global warming, green energy, and professional ethics. The course includes a hands-on laboratory component with a focus on experiential learning. Prerequisite: ENGR 222 or permission of the instructor. 431. Introduction to Urban and Regional Planning (I or II; 4, 0) Problems of urban and regional planning and the treatment of various factors of a comprehensive plan. Emphasis on the sustainability and interrelationships between engineering, sociology, geography, and economics. Prerequisite: permission of the instructor.
192

432. Transportation Policy and Planning (I or II; 4, 0) Analysis of policy in a social and environmental context. Transportation supply, demand, and pricing. Evaluation of alternative plans. Analysis of transportation benefits and costs. Prerequisite: CENG 330 or permission of the instructor 433.Mass Transportation Seminar (II; 4, 0) A pragmatic analysis of mass transportation, its history, present condition, and future; emphasis on the social and economic aspects of transit. Prerequisite: permission of the instructor. 434. Innovative Transportation Engineering (AII; 3, 1) Innovative concepts in transportation planning, design, and operation including context sensitive design, traffic calming, roundabouts, intelligent transportation systems, and geographic information systems. Prerequisite: permission of the instructor. 435. Travel Demand Modeling (I or II; 3, 2) Introduction to current development of travel demand modeling, including the four-step method and its extensions, with brief introductory sessions on other integrated models. 451. Environmental Geotechnology (II; 3, 3) Interaction between hazardous and toxic wastes and geotechnical properties of soils. Remediation of the subsurface environment. Prerequisite: CENG 350 or equivalent or permission of the instructor. Engineering 100. Exploring Engineering (I; 3, 2) Multiple Instructors (Fall) Introduction to the study and practice of engineering, including overviews of specific disciplines. Participatory focus involves group design projects, hands-on learning, computer work, team building, and engineering ethics discussion. Permission of instructor required for non-first-year students. 208. Mechanics of Materials (I; 4, 0) �– Profs. Jai Kim and Kelly Salyards (Fall) Axial loading torsion, plane stress, and strain stresses in beams, deflection of beams, unsymmetrical bending, inelastic bending, column theory and design. Prerequisite: ENGR 220. Open to civil engineering students only. 270. Technical Perspectives: Life, the Universe and Engineering (I or II; 4, 0) Technical and critical evaluation of issues in our society using principles of mass and energy conservation and engineering design methodology. Issues may include: global warming, disposal of hazardous waste, product advertisements, pharmaceutical development and testing, product manufacturing successes and failures. Cross-listed as UNIV 270. English 120. Literature and the Environment (I; 3, 0) Interdisciplinary study of major texts which demonstrate an abiding interest in nature and in cultural and social values concerning the environment. Environmental Studies 215. Environmental Planning (I; 3, 0) �– Prof. Peter Wilshusen Explores the main approaches to planning theory and their environmental applications. Considers how environmental planning can promote the socio-ecological health and sustainability of democratic communities. 221. Hazardous Waste and Society (II; 3, 3) �–Prof. Kevin Gilmore Hazardous waste regulation, risk assessment and toxicology, overview of treatment technologies and site investigation, environmental audits, facilities siting and public participation, pollution prevention. Not open to students in the College of Engineering. 230. Introduction to Ecological Design (II; 3, 0) The application of basic ecological principles to the design of buildings, landscapes, communities, and cities. Emphasis is placed on real situations in the local environment.
193
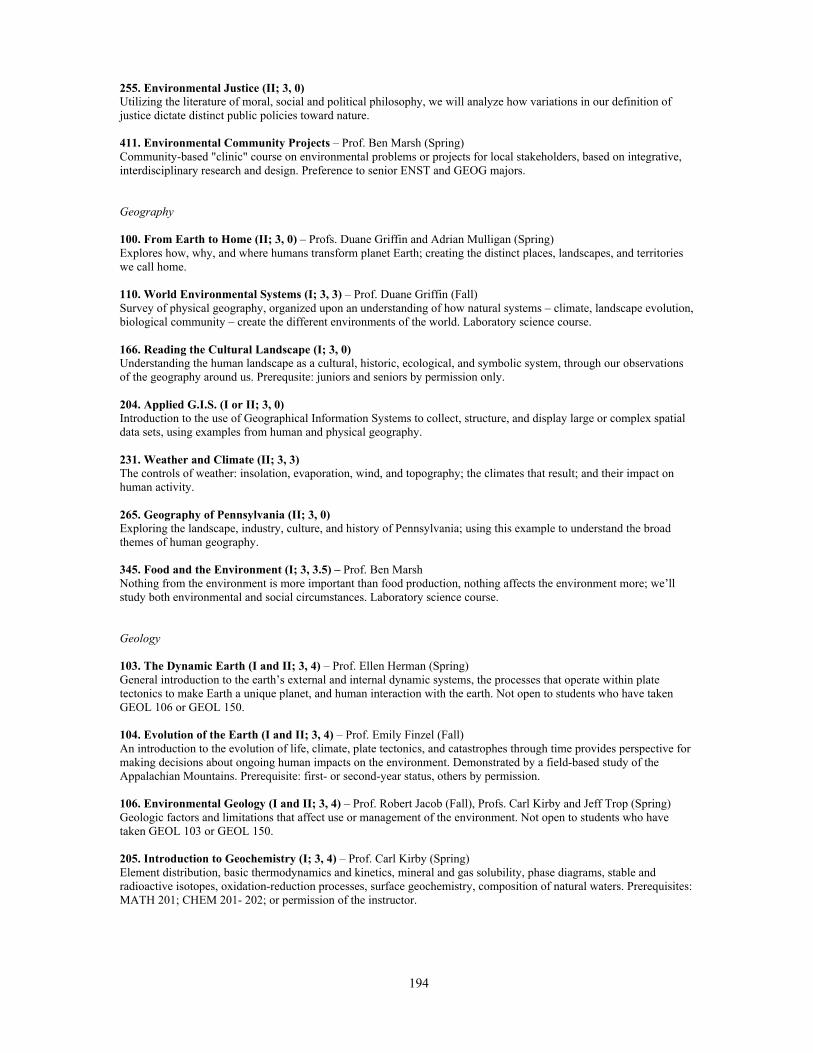
255. Environmental Justice (II; 3, 0) Utilizing the literature of moral, social and political philosophy, we will analyze how variations in our definition of justice dictate distinct public policies toward nature. 411. Environmental Community Projects �– Prof. Ben Marsh (Spring) Community-based "clinic" course on environmental problems or projects for local stakeholders, based on integrative, interdisciplinary research and design. Preference to senior ENST and GEOG majors. Geography 100. From Earth to Home (II; 3, 0) �– Profs. Duane Griffin and Adrian Mulligan (Spring) Explores how, why, and where humans transform planet Earth; creating the distinct places, landscapes, and territories we call home. 110. World Environmental Systems (I; 3, 3) �– Prof. Duane Griffin (Fall) Survey of physical geography, organized upon an understanding of how natural systems �– climate, landscape evolution, biological community �– create the different environments of the world. Laboratory science course. 166. Reading the Cultural Landscape (I; 3, 0) Understanding the human landscape as a cultural, historic, ecological, and symbolic system, through our observations of the geography around us. Prerequsite: juniors and seniors by permission only. 204. Applied G.I.S. (I or II; 3, 0) Introduction to the use of Geographical Information Systems to collect, structure, and display large or complex spatial data sets, using examples from human and physical geography. 231. Weather and Climate (II; 3, 3) The controls of weather: insolation, evaporation, wind, and topography; the climates that result; and their impact on human activity. 265. Geography of Pennsylvania (II; 3, 0) Exploring the landscape, industry, culture, and history of Pennsylvania; using this example to understand the broad themes of human geography. 345. Food and the Environment (I; 3, 3.5) �– Prof. Ben Marsh Nothing from the environment is more important than food production, nothing affects the environment more; we�’ll study both environmental and social circumstances. Laboratory science course. Geology 103. The Dynamic Earth (I and II; 3, 4) �– Prof. Ellen Herman (Spring) General introduction to the earth�’s external and internal dynamic systems, the processes that operate within plate tectonics to make Earth a unique planet, and human interaction with the earth. Not open to students who have taken GEOL 106 or GEOL 150. 104. Evolution of the Earth (I and II; 3, 4) �– Prof. Emily Finzel (Fall) An introduction to the evolution of life, climate, plate tectonics, and catastrophes through time provides perspective for making decisions about ongoing human impacts on the environment. Demonstrated by a field-based study of the Appalachian Mountains. Prerequisite: first- or second-year status, others by permission. 106. Environmental Geology (I and II; 3, 4) �– Prof. Robert Jacob (Fall), Profs. Carl Kirby and Jeff Trop (Spring) Geologic factors and limitations that affect use or management of the environment. Not open to students who have taken GEOL 103 or GEOL 150. 205. Introduction to Geochemistry (I; 3, 4) �– Prof. Carl Kirby (Spring) Element distribution, basic thermodynamics and kinetics, mineral and gas solubility, phase diagrams, stable and radioactive isotopes, oxidation-reduction processes, surface geochemistry, composition of natural waters. Prerequisites: MATH 201; CHEM 201- 202; or permission of the instructor.
194

210. Geomorphology (II; 3, 4) Physical processes shaping the earth�’s surface and evolution of resulting landforms. Emphasis on linkages between landscape components and understanding complex relationships between process and form. Prerequisite: one 100-level course in geology. 230. Environmental GIS (AI or II; 3, 4) Geographic Information Systems (GIS) in geologic mapping, environmental monitoring, and hydrologic modeling. Introduction to global positioning (GPS), environmental databases, spatial analyses, and terrain modeling. 298. Stream Restoration- Prof. Craig Kochel (Spring) Scientific principles to integrate physical and biological approaches to stream restoration in watershed management. Team-taught field course highlights developing restoration plan for Bucknell's Miller Run. 299. Watershed Systems Science- Profs. Craig Kochel, Carl Kirby, and Matt McTammany (Fall) Watersheds regulate water flow and ecosystem health on our landscape. Team-taught field course integrating physical, chemical, and biological processes in watersheds, using the Susquehanna and tributaries. 305. Aqueous and Environmental Geochemistry (AII; 3, 4) Thermodynamics and kinetics as applied to environmental geochemical problems such as aqueous complexation, weathering, clay minerals, sorption phenomena. Analytical and statistical approaches to geochemical data collection and reduction. Prerequisite: GEOL 205 or permission of the instructor. 324. Hydrogeology (I or II; 3, 4) �–Prof. Ellen Herman (Fall) Fundamentals of subsurface flow, regional groundwater flow, well hydraulics, and groundwater quality. Prerequisites: GEOL 103, 106, 150, or permission of the instructor. History 200. The Historians�’ Craft (I or II; 3, 0) �– Prof. David Del Testa (Spring) An intensive introduction to the discipline of history, its various approaches and methods as practiced by members of the department. The course includes a research component. 370. History of Science and Medicine (I or II, R; 3, 0) Intensive study of selected issues. Topics vary. Prerequisite: permission of the instructor. 371. Environmental History (I or II; 3, 0) �– Prof. Diana Di Stefano (Spring) Intensive study of selected issues. Topics vary Cross-listed as ENST 371. Management 240. Introduction to Information Science (I or II; 3, 0) �– Prof. Greta Polites (Fall and Spring), Prof. Eric Santanen (Spring only) This course explores different types of information systems (IS) and the various business functions for which they are used within organizations. Topics include using IS to gain strategic advantage, conducting electronic commerce, managing supply chains, data warehousing and analysis, knowledge management, information systems security, and the impacts of IS upon individuals, organizations and society. Special focus is placed upon current events and hands-on organizational study. 335. Seminar in Organization Studies (I or II; R; 3, 0) �– Multiple professors Special topics in organizational behavior, organization theory and design organization development, human resources management, and related topics. Seminar discussions of current theory and research. Fulfills BSBA distribution requirements in organization studies. Prerequisites: MGMT 101 (or equivalent) and permission of the instructor. Mechanical Engineering 486. Environmental Fluid Dynamics (I or II; 3, 0) Environmental fluid flow in lakes, rivers, oceans, and the atmosphere; contaminant transport; mixing ; reaction and
195

particle dispersion processes; applications to natural and engineering systems. Prerequisite: MECH 313 or ENGR 222 or ENGR 233. Political Science 232. American Public Policy Analysis (II; 3, 0) Learn to conduct policy analysis through in-depth exploration of policy issues such as health care, criminal justice, immigration, and art policy. Specific topics will vary. Sociology 208. Methods of Social Research (I or II; 3, 0) �– Prof. John Bridges (Fall and Spring) An introduction to various paradigms of social research with emphasis on the logic of social inquiry, research design, and data collection. Prerequisites: two prior sociology courses and permission of the instructor. 215. Human Service Systems (I; 3, 0) �– Prof. Carl Milofsky (Fall) Historical and contemporary development of social services in relation to changing political-economic structures and human needs. Emergence and impact of service organizations and professions. Recommended as prerequisite for SOCI 318. 322. Sociology of Medicine (I or II; 3, 0) �– Prof. Carl Milofsky (Spring) A seminar in which topics of interest to students in the area of the sociology of health, medicine, and medical policy will be discussed. 372. Analyzing the Social World (II; R; 3, 0) A course in sociological data analysis, using the General Social Survey and other data sets, promoting student research. Requires SOCI 208 or permission of the instructor. 402. Public Service and Nonprofit Organizations (I or II; 3, 0) �– Prof. Carl Milofsky (Fall) Nonprofit organizations are major settings for the delivery of social services. Government increasingly is "privatizing" services. Nonprofits often involve an orientation towards public service and community action. Using case studies they conduct, students explore these issues.
196

Appendix VIII: Energy use monitoring in buildings on Bucknell Campus. * indicates Citizens�’ Electric meter. ** indicates that meter is combined with another building *** indicates hot water from facilities
Building Yr.
const. Steam CHW Electric
or Acq. BU Dist. MeteredBU
Dist. Metered BU
Dist. MeteredArt Studio Complex
Barn 1935 X "Bullpen" 1935 X
Milkhouse 1935 X Welding Shed 1935 X
Recycling Shed 1935 X Theatre Storage X
Sculpture Classroom 1989 X Painting Studio 1987 X
Garage X Bertrand Library 1951 X X yes X yes Biology Building 1991 X X pending X pending Seventh St. Café 1949 X X Botany Building 1928 X X yes X yes Breakiron Engineering 2004 X yes X yes X yes Bucknell Cottage X X Bucknell Hall 1886 X X Bucknell West 1972 X Bucknell West 1973 X Bucknell West 1979 X Bucknell West 1984 X Carey House 1919 X X ** Carnegie Building 1905 X X yes Rooke Chemistry 1989 X pending X yes X yes Child Test Bldg. 1971 X Civil Eng. Test Bldg. 1985 X Clauss House 1967 yes Coleman Hall 1959 X X yes X yes Computer Center 1980 X X yes Cooley Hall 1880 X X yes
Cowan F.D. Brown Conf. Ctr. 1958 yes
Caretakers Res. 1936 yes Dana Engineering 1922 X X yes Davis Gymnasium 1938 X ** X ** X ** Delta Upsilon 2005 acq X X yes
197

Dispensary Garage 1919 X Edwards House 1951 X X ** Farm House 1935 X yes Financial Aid 1925 X X Admin Services 1954 X X Frat Road 604 1996acq. yes Freas Hall 1965 X X ** X Galloway House 1968 X Gateway Res. Ctr. 1986 *** X yes Roser 1986 *** X yes Kalman-Posner 1986 *** X yes Malesardi 1986 *** X yes Vidinghoff 1986 *** X yes Silbermann 1986 *** X yes Garage & Shop Area X X Golf Cse. Clubhouse 1928 yes Golf Cse. Maint.Bldg. Golf Cse. Barn 1928 yes Golf Cart Storage 1993 Greenhouse(research) 1990 X Harris Hall 1905 X X Hazardous Waste 1987 X Hulley House 1941 X X yes Hunt Hall 1928 X X yes X yes Judd House 1962 acq X yes Kappa Sigma 1978acq. X yes Kinney Natatorium 2002 X ** X ** X * Kosak House 1994acq. yes Kress Hall 1900 X X yes X yes Langone Center 1971 X X yes X yes Lamda Chi Alpha 2004 acq X yes Larison Hall 1857 X X yes X Leiser House 1958 X X Lowry House 1984acq. yes McDonnell Hall 2000 X X yes X yes Malcolm St. 5 1981acq. yes Martin House 1939 X X Marts Hall 1960 X X yes X Art Building 1890 X X yes Observatory 1963 yes O'Leary Center 2002 X yes X yes X yes Olin Science 1955 X X ** X yes Phi Kappa Psi 1991acq. X yes Geiger Phys. Plant 1938 X X yes Phys Plnt. Chiller Bldg 1938 X X Power House 1948 X X yes President's House 1875 X X Psychology Lab 1947 X yes
198

Purchasing Office 1957 X X Gerhard Field House 1977 X X yes Reitz House 1970 yes Roberts Hall 1857 X X yes Rooke Chapel 1964 X X yes X Sculpture Bldg. 1968 X Public Safety 1928 X X Seventh St. House 1945 X X X Seventh St. 304 1965 X X Saint George St. 628 1992acq. yes Saint George St. 632 1990acq. yes Sigma Alpha Epsilon 1976acq. yes Sigma Alpha Mu 1970 yes Sigma Chi 2005acq. Sigma Phi Epsilon 1994acq. X yes Smith Hall 1986 X X yes X yes Sojka Pavillion 2003 X yes X yes X yes Spratt House 1952 X Stadium 1924 X X Stuck House 1989acq. X Sunflower Bldg. 1996 Swartz Hall 1954 X yes X yes X yes Berger Training Center 1956 X ** X ** X Taylor Hall 1848 X yes X yes Taylor St. House 1937 X X Tau Kappa Epsilon 1999 acq yes Trax Hall 1907 X X yes X yes Tustin Bldg. 1890 X X Alumni House 1926 yes Vaughan Lit. 1934 X X ** X yes Vedder Hall 1965 X X yes X yes Wagner House 1986acq. yes Ward House 1956 X X Warehouse (farm) 1949 X Warehouse (P.P.) 1984 X X Weis Center 1988 X pending X yes X yes Weis Music Bldg 2000 X yes X yes X yes Ziegler Health Center 1919 X X
199

Appendix IX: Bucknell University vehicles
Year Description Responsible
Office Fuel Type
2006/2007 Mileage
MPG City
MPG Highway
1973 Ford F600 Facilities Gas 42 9 111978 Ford Dump Truck Facilities Gas 180 9 111979 GMC 1.5 Ton Stake Body Facilities Gas Sell 7 91981 Ford Stake Body Facilities Gas 332 7 91982 Chevrolet StepVan Facilities Gas 3,313 10 141984 Ford F250 Flatbed Facilities Gas 1,485 11 161985 GMC Truck w/bucke Facilities Gas 295 6 81985 Dodge Ram truck Golf Course Gas 1,782 12 161986 Chevrolet 4x4 Facilities Diesel 1,178 14 191986 Ford F350 Cargo Van Facilities Gas 2,122 12 161986 Chevy C-30 truck - blue Facilities Gas 2,715 15 171986 Ford pickup Facilities Gas Sell 12 151987 GMC Dump Facilities Gas 1,073 6 81987 International Truck Facilities Diesel 3,224 6 81988 Chevy 2500 Truck - Orange Facilities Gas 1,992 14 171988 Chevy pickup Facilities Gas 2,267 14 191988 Chevrolet Tan Pick Up Facilities Gas 3,904 14 191989 Chevy S10 Pickup - Red Car Pool Gas 0 15 201989 Ford Aerostar Facilities Gas 1,131 15 211990 Ford Truck - White Facilities Gas 1,138 12 151990 Ford F250 4X4 - Red Facilities Gas 1,359 11 161990 F-250 Ford - Orange Facilities Gas 1,415 11 161990 Ford Van - Tan / 15 Pass Facilities Gas 2,409 12 161990 Ford F150 - Red & White Facilities Gas 4,269 13 171990 Dodge Dakota Pickup Facilities Gas 4,838 14 18
1990 Dodge Dakota 4X4-Black/Silver Facilities Gas Sell 14 18
1991 Chev. Station Wagon - Gray Facilities Gas 1,671 15 231991 Ford 15 Pass. Van - White Facilities Gas 1,716 12 161991 Ford Aerostar - Gold Facilities Gas 5,998 16 221992 Ford Aerostar - Beige Car Pool Gas 1,170 16 221992 Ford 15 Pass. Van - Blue Facilities Gas 1,255 12 161992 Ford dump truck - F600 Facilities Diesel 814 9 11
1992 Ford XLT Supercab F-150 - Tan Facilities Gas 1,323 12 17
1992 Dodge Van - White Facilities Gas 1,447 12 171992 Ford Ranger - Blue Facilities Gas 2,926 15 201993 Ford Aerostar - Green Car Pool Gas 1,226 16 221993 Blue Bird Bus/41 Pass. Car Pool Diesel 7,197 8 101993 Ford Aerostar - Blue Facilities Gas 1,402 16 221993 ChevyTruck - Red Facilities Gas 1,578 14 191993 Ford Super Wagon/15 Pass Facilities Gas 4,248 11 15
1993 Chevy Truck - Two-tone blue Facilities Gas 8,169 14 19
200

1993 Chevy 4X4Silverado - Green Facilities Gas 6,057 14 17
1993 Chevy 2500 Truck - Black/Brn Facilities Gas New 14 17
1994 Ford 350 Pickup Car Pool Gas 264 12 161994 Ford Van-White 15 Passngr Facilities Gas 1,510 12 161994 Ford F450 Utility Tk. - White Facilities Gas 2,021 12 16
1994 Aerostar-Green 7 Passenger Facilities Gas 2,863 16 22
1994 Ford F-450 Facilities Diesel 3,533 12 16
1994 Chevy Truck - Two-tone brown Facilities Gas 6,635 14 19
1994 Mercury Topaz - Green Golf Course Gas 3,778 19 251995 Ford Aerostar-Mocha Frost Car Pool Gas 1,506 16 221995 Ford Aerostar Facilities Gas 441 16 221995 Ford 15 Pass. Van Facilities Gas 714 11 161995 Ford Club Wagon-15 Pass. Facilities Gas 2,005 11 161995 Chevrolet Caprice Wagon Facilities Gas 3,001 15 231995 Ford E350 Van - Dark Blue Facilities Gas 3,467 11 13
1995 Dodge 2500 Series Van -Blue Facilities Gas 4,715 12 16
1995 Ford LS 9000 - White Facilities Diesel 2,966 6 8
1995 GMC 3500-HD-SL Dump Truck Golf Course Diesel 1,363 6 8
1996 Dodge Ram Maxiwagon-Red Car Pool Gas 11 12 15
1996 Ford Aerostar-Irish Frost Car Pool Gas 4,702 16 221996 Ford Club Wagon-Blue Facilities 6 1,043 11 161996 Ford Aerostar-Mocha Frost Facilities Gas 1,645 16 22
1996 Ford Club Wagon-Mocha Frost Facilities Gas 1,727 11 16
1996 Ford Aerostar-Willow Green Facilities Gas 2,888 16 221997 Ford F350 Car Pool Gas 2,551 12 161997 Ford Crown Victoria-White Car Pool Gas 5,361 15 231997 Ford Crown Victoria - Green Car Pool Gas 12,173 15 23
1997 Ford F-250 Utility Truck-White Facilities Gas 800 12 17
1997 Ford Aerostar - Tan Facilities Gas 1,922 15 221997 Ford F350 - Blue Facilities Gas 2,398 12 16
1997 Ford 4x4 Truck - Green,Silver Facilities Gas 3,801 14 17
1998 Dodge Caravan - Teal Car Pool Gas 2,907 17 221998 Olds Regency-Silver Facilities Gas 1,702 16 251998 Chevrolet Venture - Silver Facilities Gas 1,071 16 231998 Chevy Truck 4X4 - Red Facilities Gas 1,340 14 191998 Chevy Step-Van - White Facilities Gas 1,625 10 141998 Chevy 2500 pickup - White Facilities Gas 2,320 14 171998 Ford F-150 4X4 Maroon/Tan Facilities Gas 16,866 14 171999 Dodge Ram Truck - Green Athletics Gas 5,686 12 161999 Plymouth Voyager-Teal Car Pool Gas 1,647 16 221999 Dodge Van -Cranberry Car Pool Gas 4,182 12 17
201
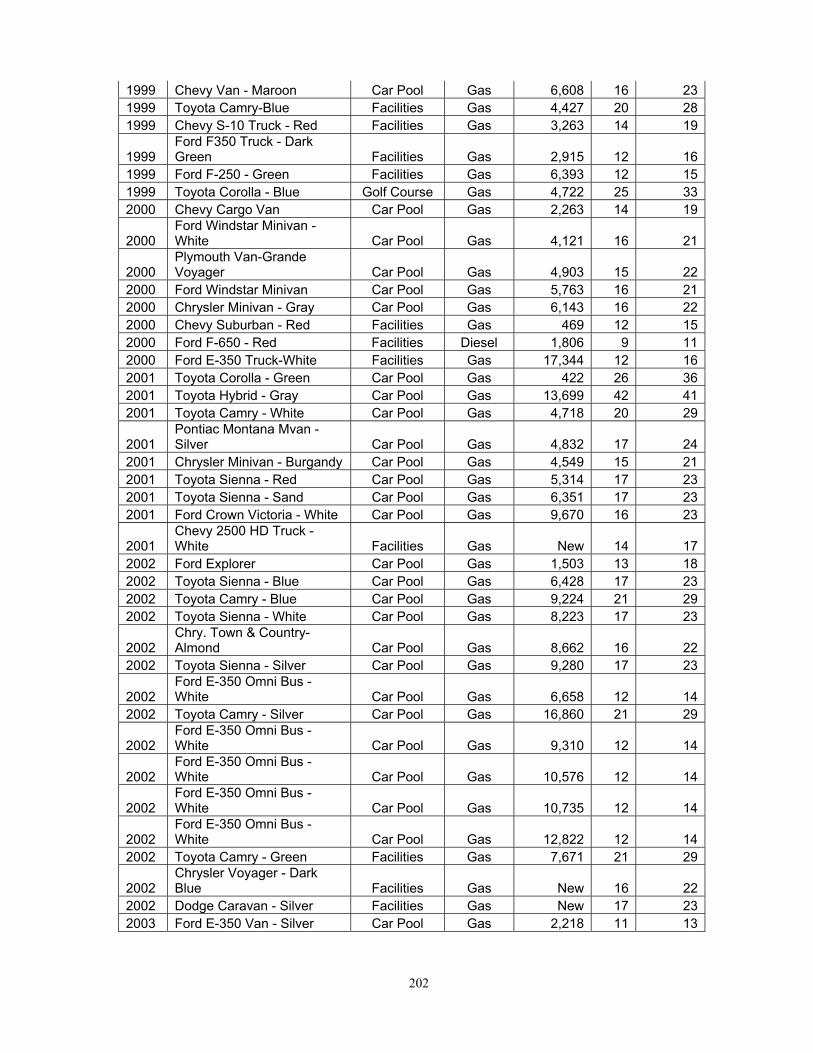
1999 Chevy Van - Maroon Car Pool Gas 6,608 16 231999 Toyota Camry-Blue Facilities Gas 4,427 20 281999 Chevy S-10 Truck - Red Facilities Gas 3,263 14 19
1999 Ford F350 Truck - Dark Green Facilities Gas 2,915 12 16
1999 Ford F-250 - Green Facilities Gas 6,393 12 151999 Toyota Corolla - Blue Golf Course Gas 4,722 25 332000 Chevy Cargo Van Car Pool Gas 2,263 14 19
2000 Ford Windstar Minivan - White Car Pool Gas 4,121 16 21
2000 Plymouth Van-Grande Voyager Car Pool Gas 4,903 15 22
2000 Ford Windstar Minivan Car Pool Gas 5,763 16 212000 Chrysler Minivan - Gray Car Pool Gas 6,143 16 222000 Chevy Suburban - Red Facilities Gas 469 12 152000 Ford F-650 - Red Facilities Diesel 1,806 9 112000 Ford E-350 Truck-White Facilities Gas 17,344 12 162001 Toyota Corolla - Green Car Pool Gas 422 26 362001 Toyota Hybrid - Gray Car Pool Gas 13,699 42 412001 Toyota Camry - White Car Pool Gas 4,718 20 29
2001 Pontiac Montana Mvan - Silver Car Pool Gas 4,832 17 24
2001 Chrysler Minivan - Burgandy Car Pool Gas 4,549 15 212001 Toyota Sienna - Red Car Pool Gas 5,314 17 232001 Toyota Sienna - Sand Car Pool Gas 6,351 17 232001 Ford Crown Victoria - White Car Pool Gas 9,670 16 23
2001 Chevy 2500 HD Truck - White Facilities Gas New 14 17
2002 Ford Explorer Car Pool Gas 1,503 13 182002 Toyota Sienna - Blue Car Pool Gas 6,428 17 232002 Toyota Camry - Blue Car Pool Gas 9,224 21 292002 Toyota Sienna - White Car Pool Gas 8,223 17 23
2002 Chry. Town & Country-Almond Car Pool Gas 8,662 16 22
2002 Toyota Sienna - Silver Car Pool Gas 9,280 17 23
2002 Ford E-350 Omni Bus - White Car Pool Gas 6,658 12 14
2002 Toyota Camry - Silver Car Pool Gas 16,860 21 29
2002 Ford E-350 Omni Bus - White Car Pool Gas 9,310 12 14
2002 Ford E-350 Omni Bus - White Car Pool Gas 10,576 12 14
2002 Ford E-350 Omni Bus - White Car Pool Gas 10,735 12 14
2002 Ford E-350 Omni Bus - White Car Pool Gas 12,822 12 14
2002 Toyota Camry - Green Facilities Gas 7,671 21 29
2002 Chrysler Voyager - Dark Blue Facilities Gas New 16 22
2002 Dodge Caravan - Silver Facilities Gas New 17 232003 Ford E-350 Van - Silver Car Pool Gas 2,218 11 13
202

2003 Dodge Sprinter - White Car Pool Diesel 4,725 24 29
2004 Chrysler Town & Country Van Car Pool Gas 2,547 15 21
2004 Toyota Sienna LE Car Pool Gas 9,968 17 252004 Toyota Sienna - Dark Blue Car Pool Gas 10,526 17 252004 Toyota Sienna - Pewter Car Pool Gas 11,836 17 252004 Honda Odyssey - Silver Car Pool Gas 11,363 16 23
2004 Ford E-350 Omni Bus - White Car Pool Gas 8,918 12 14
2004 Honda Odyssey - Char. Gray Car Pool Gas 14,555 16 23
2004 Toyota Camry - Black Car Pool Gas 18,578 20 29
2004 Toyota Sienna - Silver Shadow Car Pool Gas 18,219 17 25
2004 Toyota Highlander - Gold Car Pool Gas 19,303 18 232004 Toyota Camry - Gray Car Pool Gas 26,682 20 29
2004 Ford F-450 Dump Truck - Blue Facilities Diesel 3,673 12 16
2004 GMC-3500 Dump Truck Facilities Gas 2,710 6 82004 Isuzu NPR-HD - White Facilities Gas Own 7 92005 Dodge Sprinter - White Car Pool Diesel 7,845 24 292005 Subaru Legacy - Silver Car Pool Gas 19,278 20 272005 Honda Accord - Green Car Pool Gas 25,011 21 312005 Subaru Legacy - Blue Car Pool Gas 23,096 20 272005 Honda Accord - Silver Car Pool Gas 26,202 21 312005 Ford Explorer - White Car Pool Gas 15,904 13 182005 Honda Accord - Graphite Car Pool Gas 30,480 21 312005 Honda Pilot - Silver Car Pool Gas 20,774 15 202005 Honda Accord - Beige Car Pool Gas 35,955 21 312006 Dodge Caravan - Black Car Pool Gas 280 17 242006 Ford F350 Lariat - Silver Car Pool Diesel 1,729 12 162006 Ford Explorer Lariat - White Car Pool Gas 3,907 13 192006 Subaru Legacy - Silver Car Pool Gas 9,183 20 27
2006 Dodge Grand Caravan - Silver Car Pool Gas 8,409 17 24
2006 Honda Accord Hybrid - Silver Car Pool Gas 14,960 22 31
2006 Toyota Sienna CE Car Pool Gas 11,519 17 24
2006 Dodge Grand Caravan - Green Car Pool Gas 14,230 17 24
2006 Mack CT-713-Granite - White Facilities Diesel 9,647 5 7
2007 Honda Accord - Gray Car Pool Gas 11,088 21 31
203

Appendix X: Water-use monitoring in campus buildings
Bucknell University - BuildingWater Meters & Usage
Building Name Individually
Metered (Y/N) Does Heat Use
Water Does Cooling
Use Water AdminServ/Prod Ctr-660 S 7th St Y Art Bldg - 605 Walker St Y Art Barn & Studio Bertrand Libr-580 Coleman Hall Dr Y Y Biology - 715 Dent Dr Y Y Y Botany - 540 S 7th St Y Y Botany Greenhouse Y Breakiron Y Y Y Bucknell Hall - 540 Loomis St Y Y Carnegie - 580 S 7th St Y Civil Engr Test - 630 S 7th St Cogen - 1225 River Road Y Y Coleman Hall-560 Coleman Hall Dr Y Y Y Computer Ctr - 585 S 7th St Y Cooley Hall - 82 Univ Ave Y Y Y Dana Engr-580 Vaughan Lit Dr Y Facilities - 245 Gateway Drive Y Y Farm Storage Freas Hall - 775 Dent Drive Y Y Garage / Shops - 280 River Rd Y Judd Hse - 79 Univ Ave Y Y KLARC - Kinney Nat-Pool-770 Moore Ave Y Y KLARC - Krebs Fitness Y Y KLARC - REC Ctr - 790 Moore Ave Y KLARC - Sojka Pav-Basketball-770 Moore Y Langone Ctr - 701 Moore Ave Y Y Y Marts Hall- 545 Van Lit Dr Y Y Observatory-840 Frat Rd Y O'Leary Ctr - 565 S 7th St Y Y Olin Science- 570 Vaughan Lit Dr Y Y Psychology Lab-300 S Derr Drive Y Y Public Safety - 580 Snake Rd Y Rooke Chapel-820 Dent Drive Y Y Rooke Chemistry-735 Dent Dr Y Y Y Sculpture Bldg Seventh St Café - 420 S 7th St Y
204
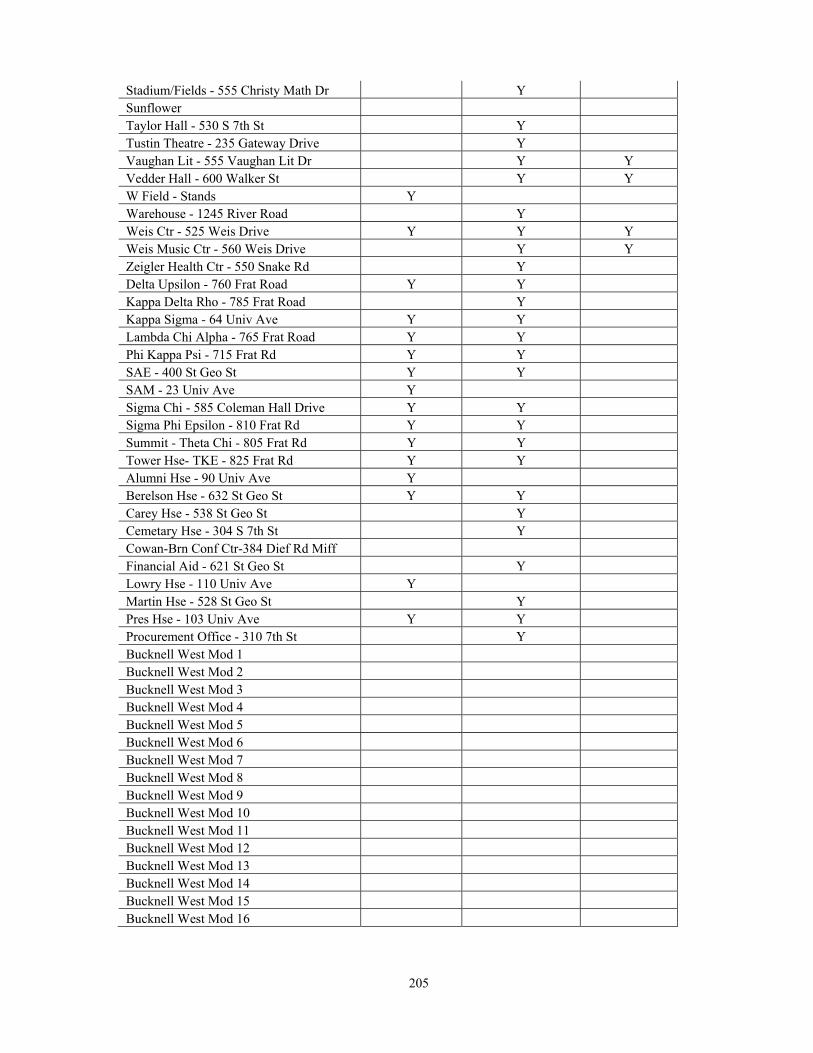
Stadium/Fields - 555 Christy Math Dr Y Sunflower Taylor Hall - 530 S 7th St Y Tustin Theatre - 235 Gateway Drive Y Vaughan Lit - 555 Vaughan Lit Dr Y Y Vedder Hall - 600 Walker St Y Y W Field - Stands Y Warehouse - 1245 River Road Y Weis Ctr - 525 Weis Drive Y Y Y Weis Music Ctr - 560 Weis Drive Y Y Zeigler Health Ctr - 550 Snake Rd Y Delta Upsilon - 760 Frat Road Y Y Kappa Delta Rho - 785 Frat Road Y Kappa Sigma - 64 Univ Ave Y Y Lambda Chi Alpha - 765 Frat Road Y Y Phi Kappa Psi - 715 Frat Rd Y Y SAE - 400 St Geo St Y Y SAM - 23 Univ Ave Y Sigma Chi - 585 Coleman Hall Drive Y Y Sigma Phi Epsilon - 810 Frat Rd Y Y Summit - Theta Chi - 805 Frat Rd Y Y Tower Hse- TKE - 825 Frat Rd Y Y Alumni Hse - 90 Univ Ave Y Berelson Hse - 632 St Geo St Y Y Carey Hse - 538 St Geo St Y Cemetary Hse - 304 S 7th St Y Cowan-Brn Conf Ctr-384 Dief Rd Miff Financial Aid - 621 St Geo St Y Lowry Hse - 110 Univ Ave Y Martin Hse - 528 St Geo St Y Pres Hse - 103 Univ Ave Y Y Procurement Office - 310 7th St Y Bucknell West Mod 1 Bucknell West Mod 2 Bucknell West Mod 3 Bucknell West Mod 4 Bucknell West Mod 5 Bucknell West Mod 6 Bucknell West Mod 7 Bucknell West Mod 8 Bucknell West Mod 9 Bucknell West Mod 10 Bucknell West Mod 11 Bucknell West Mod 12 Bucknell West Mod 13 Bucknell West Mod 14 Bucknell West Mod 15 Bucknell West Mod 16
205

Bucknell West Mod 17 Bucknell West Mod 18 Bucknell West Mod 19 Bucknell West Mod 20 Bucknell West Mod 21 Bucknell West Mod 22 Bucknell West Mod 23 Bucknell West Mod 24 Bucknell West Mod 25 Bucknell West Mod 26 Bucknell West Mod 27 Bucknell West Mod 28 Bucknell West Mod 29 Bucknell West Mod 30 Bucknell West Mod 31 Bucknell West Mod 32 Bucknell West Mod 33 Bucknell West Mod 34 Bucknell West Mod 35 Gateway A (Roser) Y Y Gateway B (KP) Y Y Gateway C (Malesardi) Y Y Gateway D (Vindinghoff) Y Y Gateway E (Silberman) Y Y Harris Hall - 370 Harris Drive Y Hunt Hall - 570 Loomis St Y Y Kress Hall-560 S 7th St Y Y Larison Dining Hall Y Y Larison Hall/BU Cottage-521 / 535 St Geo Y McDonnell Hall-560Christy Math Dr Y Y Roberts Hall - 570 S 7th St Y Seventh St Hse - 490 S 7th St Y Y Y Smith Hall - 380 S 7th St Y Y Spratt Hse-ROTC-725 ROTC Drive Y Y Swartz Hall - 565 Coleman Hall Dr Y Y Y Taylor St Hse - 625 St Geo St Y Trax Hall - 590 S 7th St Y Y Edwards Hse - 218 S 6th St Y Y Galloway Hse - 235 6th/602 St Geo Y Y Hulley Hse - 518 St Geo St Y Kosak Hse - 545 Smoketown Rd Y Leiser Hse - 522 St Geo St Y Anderson -101 / 103 S 4th St Clauss Hse - 704 Campus Lane Y Y Dillard - 28 Univ Ave Y Farm Hse - 42/44 Art Barn Drive Y Kindig - 808 Campus Lane Y Y Malcolm St Hse - 5 Malcolm St Y Y
206

Reitz Hse - 221 6th St Y Ritter Hse 835 Frat Rd - Envirn Ctr Y St Geo St - 628 - Chaplain Hse Y Y Stuck Hse - 414 S 7th St Y Y Wagner Hse - 804 Campus Lane Y Y Ward Hse - 625 St Geo St Y Y
207

Appendix XI: Paper policy proposal submitted to the Campus Greening Council in July 2008 Campus Greening Council PROPOSAL FORM Submitted by: Dina El-Mogazi Class/Major or Title/Department: Sustainability Coordinator, BUEC Date: 7/30/08
I. PROJECT DESCRIPTION A. Objective. Describe the purpose of the policy or project. What
operations or practices will be addressed in the proposal? Proposal: that all paper purchased by Administrative Services for the routine stocking of Bucknell copiers and printers shall be FSC-certified, chlorine-free paper, with a minimum of 30% post-consumer recycled content. Concomitantly, a paper use awareness campaign would be employed to reduce the total amount of paper used in printing and photocopying at Bucknell. The purpose of this proposal is to improve the sustainability of printing and photocopying at Bucknell. Currently, the standard paper used in Bucknell printers and copiers, Xerox Business 4200, contains 0% post-consumer recycled content, is chlorine bleached, and is not certified as sustainable. The use of this paper in very large volumes each year represents a major environmental impact of the university (see section I.C).
B. Implementation Plan. Describe the specific details of the policy or project. How will the objectives be met? Who will oversee implementation, and who will be accountable for the outcome(s)?
Jim Muchler, Director of Administrative Services, and Don Krech, Director of Procurement Services would be the leaders in charge of implementing the purchasing portion of this proposal. Implementation would require identifying the best brand of paper to purchase, as well as testing the paper to make sure that it meets Bucknell�’s standards and doesn�’t pose a problem for university printers, copiers, and high-volume folding and collating machines. Bucknell�’s Administrative Services Department has done some preliminary testing on Envirographic 100, a 100% post-consumer chlorine-free paper. With a brightness value of 92% this paper is virtually indistinguishable from virgin paper in color and texture\. According to Muchler, Administrative Services will continue performing tests on 30%
208

and 100% post-consumer recycled paper throughout summer 2008. In recent years many schools have successfully transitioned to paper with 30% or greater recycled content including Oberlin, Colgate, Middlebury, Princeton, Franklin and Marshall, and several others. Library and Information Technology, under the direction of Param Bedi, Chief Information Officer, would be responsible for conducting the paper use awareness campaign. According to Bedi, the implementation of this campaign is already in progress.
C. Environmental Benefits. Describe in detail how the proposal will reduce the environmental impact of university operations or practices. Be sure to address reductions in greenhouse gases where applicable.
According to Jim Muchler, Director of Administrative Services, in 2006 Bucknell used 27,560 reams of 8.5 by 11 inch paper in its printers and copiers. This figure amounts to approximately 13 million sheets or 137,800 lbs of paper. In 2007 this number declined to 24,120 reams in 2007, representing 12.1 million sheets, or 120,600 lbs. Based on these numbers, the environmental benefits of the proposal are given below:
Benefits of Certification: Purchasing Forest Stewardship Council (FSC) certified paper would ensure that basic ethical and ecological principles are upheld by the companies who log and manage forest land. (Studies by the National Wildlife Federation in 2001 and Yale University in 2008 have shown that FSC certification is more rigorous and comprehensive than its main competitor, the Sustainable Forestry Initiative (SFI). See http://www.yale.edu/forestcertification/pdfs/auditprograms.pdf , and http://www.buildinggreen.com/auth/article.cfm?fileName=170101a.xml for more details.)
Benefits of Chlorine-free Paper: The chlorine used in bleaching both virgin and
recycled paper is harmful to aquatic ecosystems when released via wastewater. Furthermore, highly toxic and persistent chlorinated organic byproducts such as dioxin are produced in the paper manufacturing process when chlorine bleaching is employed (Firestone, Aaron. �“Environmentally Sound Paper Overview: Essential issues Part III Making Paper: Content�” Conservatree. 2007. See http://www.conservatree.org/learn/Essential%20Issues/EIPaperContent.shtml). The purchase of chlorine-free paper bleached using alternatives such as ozone or hydrogen peroxide would eliminate these impacts.
Benefits of Post-consumer Recycled Content: Increasing the post-consumer
recycled content of Bucknell�’s copy and printer paper would go much further in reducing the ecological impact of paper use at the University. Switching to 30% or 100% post-consumer recycled paper would not only save trees, but also
209

significant amounts of energy, greenhouse gases, water, and solid waste (see Table 1 below).
210

Table 1: Reduction in ecological impact that would have occurred if Bucknell had used 100% or 30% post-consumer recycled paper in 2006 and 2007.
Impact of paper 2006 (27,560 reams) 2007 (24,120 reams) Recycled Content 100%
30% 100% 30%
Trees 1,654
496 1,447
434
Energy (kilowatt hours) 774,586 101,109 677,873
88,507
Greenhouse gases (in lbs CO2 equivalents)
392,055
43,574 343,119 38,135
Water (gallons) 1,314,281
180,867 1,150,234
158,291
Solid Waste (lbs) 156,978 23,226 137,384 20,327 (Environmental impact estimates were made using the Environmental Defense Paper Calculator. See http://www.papercalculator.org. Conversion from BTU�’s to kilowatt hours made using Calculate Me. See http://www.calculateme.com/Energy/BTUs/ToKilowattHours.htm)
II. PROJECT FUNDING. A. Initial Cost. How much will the project cost to implement?
According to Jim Muchler, cost increases for recycled paper range from 15% more for 30% post-consumer content (approximately $10,000 per year) to 25% more for 100% post-consumer content (approximately $17,000 per year). However, if the efforts of the paper reduction awareness campaign were successful in reducing paper use by at least 15-25%, there would be no net cost increase for this proposal. According to Param Bedi, this is an achievable target for such a campaign.
B. Financial Benefits. Is there an anticipated financial benefit over time? If
so, what is the anticipated pay-back period?
If the paper use awareness campaign were successful in decreasing paper use by more than the increased cost of the paper (15-25%), in net effect, the proposal would actually save the university money over time.
C. Funding. What are the specific funding sources for the proposal?
Since each department at the university pays for its own paper, each department would bear the cost of this proposal separately according to their volume of paper use. This would mean that the burden of the additional cost would be dispersed, and there would be incentive for each department to conserve paper.
211

212
III. CONNECTIONS TO MISSION AND STRATEGIC PLANNING
If applicable, discuss how the proposal supports the goals of The Plan for Bucknell and/or the overall mission of the University.
Two of the seven goals in Bucknell�’s Mission are to �“educate students for the exercise of high responsibility in all phases of society,�” and �“engage in institutional programs and practices that exemplify compassion, civility, and a sense of justice.�” Should this policy be adopted by the Bucknell Administration, it would send a clear message to students, staff, and faculty that Bucknell University is committed to the responsible use of natural resources, and thereby the humane treatment of future generations who will depend on those resources. Bucknell has long taken pride in its recycling program, which includes the collection and recycling of office paper. By becoming a purchaser of post-consumer recycled paper as well, the university would demonstrate a commitment to supporting the market for the end product of the paper it currently recycles. Furthermore, in his January, 2008 address at the Focus the Nation teach-in President Mitchell pledged his support for �“using Forest Stewardship Council certified paper in all copiers and printers on campus.�” Additionally, as noted in section I.C., paper consumption results in greenhouse gas production, and thus the adoption of this policy would reinforce Bucknell�’s commitment to reduce its carbon footprint as specified in the American College and University Presidents Climate Commitment.

App
endi
x X
II:
Dis
posa
ble
serv
ice-
war
e u
sed
each
wee
k i
n B
uck
nel
l�’s d
inin
g fa
cili
ties
Item
pa
ck
si
ze
Bos
twic
kB
ison
Libr
ary
Caf
é 7t
h St
C
afé
Min
i Mar
tsTo
tal
case
s To
tal
Cos
t
si
ze
D
egra
dabl
e na
pkin
s 60
00
8 7
incl
uded
in
B
ison
15
$4
50.0
0 R
ecyc
labl
e 12
oz
pape
r cof
fee
cups
50
0 0
1 3
2 1
7 $4
20.0
0
16 o
z pa
per c
offe
e cu
ps
500
0 2
3 1
1 7
$560
.00
Mad
e of
20
oz
pape
r cof
fee
cups
50
0 0
1 3
2 1
7 $4
20.0
0 re
cycl
ed
mat
eria
l 16
oz
pape
r col
d cu
p 50
0 3
0 0
0 0
3 $1
50.0
0
24 o
z pa
per c
old
cup
50
0 0
4 0
0 0
4 $2
00.0
0
44 o
z pa
per c
old
cup
50
0 0
2 0
0 0
2 $1
00.0
0
Pl
astic
pl
astic
silv
erw
are,
spo
on
1000
0
3 in
clud
ed
in
Bis
on
3 $7
1.34
plas
tic s
ilver
war
e, k
nife
10
00
0 3
incl
uded
in
B
ison
3
$71.
34
Not
pl
astic
silv
erw
are,
fork
10
00
0 3
incl
uded
in
B
ison
3
$71.
34
Bio
-de
grad
able
pl
astic
silv
erw
are
Sou
p Sp
oon
1000
0
1 in
clud
ed
in
Bis
on
1 $2
3.78
disp
osab
le u
tens
ils p
ack
250
8 0
0 0
0 8
$320
.00
pl
astic
bag
s 10
00
2 6
incl
uded
in
B
ison
8
$160
.00
Not
recy
clab
le
Sod
a Li
ds
1000
2
6 0
0 0
8 $0
.00
C
offe
e Li
ds
500
0.5
8 in
clud
ed
in
Bis
on
8.5
$170
.00
pr
emad
e S
alad
Bow
ls
250
0 4
incl
uded
in
B
ison
4
$200
.00
pl
astic
fold
ove
r, sm
all
500
6 9.
5 in
clud
ed
in
Bis
on
15.5
$5
27.0
0
plas
tic fo
ld o
ver,
larg
e 25
0 6
8 in
clud
ed
in
Bis
on
14
$448
.00
sa
lad
bow
l w/ l
id, s
mal
l 16
oz
200
0 2
0 0
0 2
$80.
00
sa
lad
bow
l w/ l
id, l
arge
24
oz
200
0 4
0 0
0 4
$160
.00
co
ndim
ent c
ups
w/ l
id
1000
0
1.75
0
0 0
1.75
$4
0.25
pl
astic
sou
p co
ntai
ners
w/ l
id,
smal
l 50
0 0
2.5
0 0
0 2.
5 $1
00.0
0
pl
astic
sou
p co
ntai
ners
w/ l
id,
larg
e 50
0 0
2.5
0 0
0 2.
5 $1
00.0
0
213
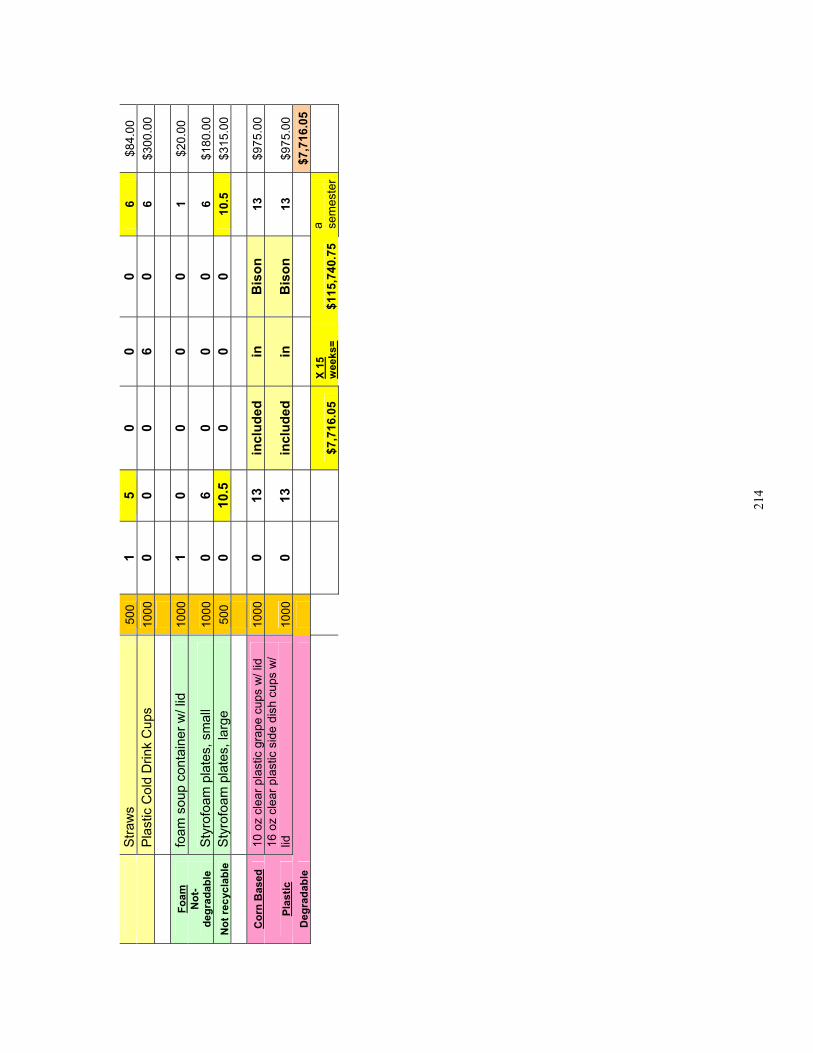
214
St
raw
s 50
0 1
5 0
0 0
6 $8
4.00
Pla
stic
Col
d D
rink
Cup
s 10
00
0 0
0 6
0 6
$300
.00
Foam
fo
am s
oup
cont
aine
r w/ l
id
1000
1
0 0
0 0
1 $2
0.00
N
ot-
degr
adab
le
Sty
rofo
am p
late
s, s
mal
l 10
00
0 6
0 0
0 6
$180
.00
Not
recy
clab
le
Sty
rofo
am p
late
s, la
rge
500
0 10
.5
0 0
0 10
.5
$315
.00
Cor
n B
ased
10
oz
clea
r pla
stic
gra
pe c
ups
w/ l
id
1000
0
13
incl
uded
in
B
ison
13
$9
75.0
0
Plas
tic
16 o
z cl
ear p
last
ic s
ide
dish
cup
s w
/ lid
10
00
0 13
in
clud
ed
in
Bis
on
13
$975
.00
Deg
rada
ble
$7,7
16.0
5
$7
,716
.05
X 15
w
eeks
= $1
15,7
40.7
5 a se
mes
ter

Appendix XIII: Campus habitat map.
215

App
endi
x X
IV:
Spe
cies
cou
nts
for
cam
pus
tree
s N
orth
Am
eric
an n
ativ
e tre
es a
nd fr
eque
ncie
s(as
of s
umm
er 2
008)
. Sp
ecie
s C
ount
Sp
ecie
s C
ount
Whi
te O
ak (Q
uerc
us a
lba)
23
8
Blu
e S
pruc
e (P
icea
pun
gens
) 6
Sug
ar M
aple
(Ace
r sac
char
um)
132
A
mer
ican
Elm
(Ulm
us a
mer
ican
a)
6P
in O
ak (Q
uerc
us p
alus
tris)
10
5
Pig
nut H
icko
ry (C
arya
gla
bra)
5
Whi
te P
ine
(Pin
us s
trobu
s)
103
B
lack
Che
rry
(Pru
nus
sero
tina)
5
Flow
erin
g D
ogw
ood
(Cor
nus
florid
a)
101
S
awto
oth
Oak
(Que
rcus
acu
tissi
ma)
5
Red
Oak
(Que
rcus
rubr
a)
67
Red
Bud
(Cer
cis
cana
dens
is)
4B
lack
Map
le (A
cer n
igru
m)
66
Sm
ooth
Sha
dbus
h (A
mel
anch
ier l
aevi
s)
3R
ed M
aple
(Ace
r rub
rum
) 62
Y
ello
ww
ood
(Cla
dras
tis k
entu
kea)
3
Eas
tern
Hem
lock
(Tsu
ga C
anad
ensi
s)
33
Haw
thor
ne (C
rata
egus
sp.
) 3
Gre
en A
sh (F
raxi
nus
penn
sylv
anic
a)
28
Am
eric
an B
eech
(Fag
us g
rand
ifolia
) 3
Hon
ey L
ocus
t (G
ledi
tsia
tria
cant
hos)
28
W
hite
Ash
(Fra
xinu
s am
eric
ana)
3
Arb
or-v
itae
(Thu
ja o
ccid
enta
lis)
26
Ken
tuck
y C
ofee
tree
(Gym
nocl
adus
dio
icus
) 3
Will
ow O
ak (Q
uerc
us p
hello
s)
17
Cuc
umbe
r Mag
nolia
(Mag
nolia
acu
min
ata)
3
Tulip
Pop
lar (
Lirio
dend
ron
tulip
ifera
) 14
S
wam
p W
hite
Oak
(Que
rcus
bic
olor
) 3
Che
stnu
t Oak
(Que
rcus
prin
us)
14
Sha
gbar
k H
icko
ry (C
arya
ova
ta)
2Bl
ack
Wal
nut (
Jugl
ans
nigr
a)
11
Bla
ckgu
m (N
yssa
syl
vatic
a)
2A
mer
ican
hor
nbea
m (C
arpi
nus
caro
linia
na)
10
Am
eric
an Y
ew (T
axus
can
aden
sis)
2
Blac
k O
ak (Q
uerc
us k
ello
ggii)
10
C
atal
pa (C
atal
pa s
peci
osa)
1
Bur
Oak
(Que
rcus
mac
roca
rpa)
10
Fr
inge
tree
(Chi
onan
thus
virg
inic
us)
1S
ilver
Map
le (A
cer s
acch
arin
um)
9
Gre
en H
awth
orne
(Cra
taeg
us v
iridi
s)
1R
ed P
ine
(Pin
us re
sino
sa)
9
Com
mon
Per
sim
mon
(Dio
spyr
os v
irgin
iana
) 1
Blac
k Lo
cust
(Rob
inia
pse
udoa
caci
a)
9
Fran
klin
Tre
e (F
rank
linia
ala
tam
aha)
1
Am
eric
an B
assw
ood
(Till
ia a
mer
ican
a)
9
Osa
ge-O
rang
e (M
aclu
ra p
omife
ra)
1S
wee
tgum
(Liq
uida
mba
r sty
raci
flua)
8
U
mbr
ella
Tre
e (M
agno
lia tr
ipet
ala)
1
Com
mon
Hac
kber
ry (C
eltis
occ
iden
talis
) 7
W
hite
Spr
uce
(Pic
ea g
lauc
a)
1P
aper
Birc
h (B
etul
a pa
pyrif
era)
6
S
carle
t Oak
(Que
rcus
coc
cine
a)
1
216

Sw
eetb
ay M
agno
lia (M
agno
lia v
irgin
iana
) 6
N
on-n
ativ
e tr
ees a
nd fr
eque
ncie
s (as
of s
umm
er 2
008)
. Sp
ecie
s C
ount
Nor
way
Spr
uce
(Pic
ea a
bies
) 10
8N
orw
ay M
aple
(Ace
r pla
tano
ides
) 78
Kou
sa D
ogw
ood
(Cor
nus
kous
a)
38Ja
pane
se C
herr
y (P
runu
s se
rrul
ata
'Kan
zan'
) 32
Kat
sura
(Cer
cidi
phyl
lum
japo
nicu
m)
20C
alle
ry P
ear (
Pyr
us c
alle
ryan
a)
18D
ougl
as F
ir (P
seud
otsu
ga m
enzi
esii)
12
Japa
nese
Zel
kova
(Zel
kova
ser
rata
) 12
Gin
kgo
Tree
(Gin
kgo
bilo
ba)
10Ja
pane
se C
rypt
omer
ia (C
rypt
omer
ia ja
poni
ca)
9Ja
pane
se M
aple
(Ace
r pal
mat
um)
7Sa
ucer
Mag
nolia
(Mag
nolia
x s
oula
ngia
na)
7W
hite
Mul
berry
(Mor
us a
lba)
5
Pan
icle
d G
olde
n R
aint
ree
(Koe
lreut
eria
pan
icul
ata)
4
Littl
e-le
af L
inde
n (T
ilia
cord
ata)
4
Eur
opea
n Li
nden
(Tili
a eu
ropa
ea)
4E
urop
ean
Larc
h (L
arix
dec
idua
) 3
Pap
erba
rk M
aple
(Ace
r gris
eum
) 2
Syc
amor
e M
aple
(Ace
r pse
udop
lata
nus)
2
Eur
opea
n W
eepi
ng B
irch
(Bet
ula
pend
ula)
1
Chi
nese
Che
stnu
t (C
asta
nea
mol
lissi
ma)
1
Sta
r Mag
nolia
(Mag
nolia
ste
llata
) 1
Che
rry
(Pru
nus
sp.)
1S
chol
ar T
ree
(Sop
hora
japo
nica
) 1
217

App
endi
x X
V:
Pes
tici
des
and
fert
iliz
ers
use
d on
Bu
ckn
ell�’s
cam
pus
Pes
tici
des
use
d on
Bu
ckn
ell
Un
iver
sity
�’s ac
adem
ic c
ampu
s
Pest
icid
e Q
uant
ity
Loca
tion
Purp
ose
Act
ive
Ingr
edie
nt/s
H
ealth
Haz
ards
Ec
olog
ical
Ris
ks
Hor
ticul
tura
l O
il 2.
0 ga
llons
Var
ious
tree
s and
sh
rubs
on
cam
pus
Inse
ct C
ontro
l M
iner
al O
il; P
etro
leum
Dis
tilla
tes
CA
TEG
OR
Y II
I-C
AU
TIO
N
Hor
ticul
tura
l oil
is to
xic
to fi
sh a
nd a
quat
ic
orga
nism
s, an
d is
dam
agin
g to
cer
tain
pla
nts
and
trees
, whe
n ap
plie
d du
ring
certa
in se
ason
s.
Spee
d Zo
ne
10.3
4 ga
llons
H
igh
prof
ile
turf
on
ca
mpu
s. A
thle
tic F
ield
s
Wee
d C
ontro
l In
Tur
f
2,4-
D, 2
-eth
ylhe
xyl e
ster
- 28.
57%
M
ecop
rop-
p ac
id-5
.88%
D
icam
ba a
cid-
01.7
1%
Car
fent
razo
ne-e
thyl
-0.6
2%
Iner
t Ing
redi
ents
-63.
22%
CA
TEG
OR
Y II
I-C
AU
TIO
N
Toxi
c to
alg
ae a
nd a
quat
ic in
verte
brat
es,
mod
erat
ely
toxi
c to
fish
. Adv
erse
eff
ects
on
plan
ts a
nd a
quat
ic in
verte
brat
es fr
om ru
noff
. Po
tent
ial f
or g
roun
dwat
er c
onta
min
atio
n.
Dim
ensi
on
2,50
0 lb
s A
thle
tic fi
elds
W
eed
Con
trol
In T
urf
Dith
iopy
r C
ATE
GO
RY
III
-C
AU
TIO
N
Toxi
c to
fish
, hig
hly
toxi
c to
oth
er a
quat
ic
orga
nism
s. C
onta
min
ates
wat
er th
roug
h ru
noff
. W
as n
ot fo
und
to b
e re
adily
bio
degr
adab
le in
la
b te
sts.
Mod
erat
e to
hig
h po
tent
ial f
or
bioa
ccum
ulat
ion.
Rou
ndup
35
.0 g
allo
ns
Orn
amen
tal b
eds,
Park
ing
lots
, Ed
ging
are
as
Wee
d C
ontro
l O
n ca
mpu
s G
lyph
osat
e-41
.0%
O
ther
ingr
edie
nts-
59.0
%
CA
TEG
OR
Y II
I-C
AU
TIO
N
Min
imal
risk
.
Mac
h II
3,
000
lbs
Ath
letic
Fie
lds
Inse
ctic
ide
In T
urf
Hal
ofen
ozid
e B
enzo
ic a
cid,
4-c
hlor
o-,2
ben
zoyl
- (1
-1-d
imet
hyle
thyl
) hyd
razi
de-0
.86%
In
ert I
ngre
dien
ts-9
9.14
%
CA
TEG
OR
Y II
I-C
AU
TIO
N
Mod
erat
e po
tent
ial f
or b
ioac
cum
ulat
ion.
M
oder
atel
y to
xic
to a
quat
ic in
verte
brat
es, a
nd
slig
htly
toxi
c to
bird
s (fr
om d
iet).
218

Dyl
ox 6
.2 G
21
0 lb
s A
thle
tic F
ield
s In
sect
icid
e Tr
ichl
orfo
n-6.
20%
C
ATE
GO
RY
III-
CA
UTI
ON
Hig
hly
toxi
c to
bird
s, an
d bo
th c
old
and
war
m
wat
er fi
shes
. Mod
erat
e-H
igh
acut
e to
xici
ty
tow
ard
certa
in b
enef
icia
l or n
on-ta
rget
inse
cts
and
aqua
tic in
verte
brat
es (t
his d
oes n
ot in
clud
e be
es).
Hig
hly
mot
ile in
soils
, and
eas
ily
diss
olve
d m
akin
g gr
ound
wat
er c
onta
min
atio
n lik
ely.
Hig
hly
pers
ista
nt in
wat
er.
Rel
y II
Ath
letic
Fie
lds
Wet
ting
Age
nt
Prop
oxyl
ated
Pol
yeth
ylen
e G
lyco
ls-
99.0
%
NO
NE
No
know
n Ec
olog
ical
Ris
ks.
ProS
tar
5.0
gallo
ns
Ath
letic
Fie
lds
Fung
icid
e Fl
utol
anil:
N-[
3-(1
-met
hyle
thox
y)
Phen
yl]-
2-(tr
ifluo
rom
ethy
l) be
nzam
ide-
70.0
%
Iner
t Ing
redi
ents
-30.
0%
CA
TEG
OR
Y II
I-C
AU
TIO
N
Toxi
c to
aqu
atic
inve
rtebr
ates
. Pot
entia
l for
gr
ound
wat
er c
onta
min
atio
n.
Hea
dway
3
gallo
ns
Ath
letic
Fie
lds
Fung
icid
e Fo
r Tur
f
Azo
xyst
robi
n:m
ethy
l(E)-
[2-[
6-(2
-cy
anop
heno
xy)
Pyrim
idin
-4-y
loxy
]phe
nyl}
-3-
met
hoxy
acry
late
-5-7
3%
Prop
icon
azol
e:C
AS
No.
602
07-9
0-1)
-9.
54%
O
ther
Ingr
edie
nts-
84.7
3%
CA
TEG
OR
Y II
I-C
AU
TIO
N
For g
roun
dwat
er c
onta
min
atio
n. T
oxic
to fi
sh
and
aqua
tic in
verte
brat
es. P
oten
tial a
dver
se
effe
cts o
n aq
uatic
org
anis
ms f
rom
runo
ff.
219

Pes
tici
des
use
d on
Bu
ckn
ell
Un
iver
isit
y�’s
Gol
f C
ours
e
Pest
icid
e Q
uant
ity
Act
ive
Ingr
edie
nt(s
) Fo
rmul
atio
n Pu
rpos
e H
ealth
R
isk
Ecol
ogic
al R
isk
Bens
umec
4L
F
6 ga
llons
Ben
sulid
e 46
%
Liqu
id
Pre
-em
erge
nce
herb
icid
e
C
ateg
ory
III
Toxi
c to
fish
. Con
tam
inat
es w
ater
thro
ugh
runo
ff.
Chi
pco
26G
T
49 g
allo
ns
Ipro
dion
e 23
.3%
Liqu
id
Fung
icid
e
C
ateg
ory
III
Pot
entia
l for
gro
undw
ater
con
tam
inat
ion.
Drif
t/run
off
may
be
haza
rdou
s to
aqu
atic
org
anis
ms
in a
djac
ent
area
s.
Cle
ary'
s 33
36 F
23 g
allo
ns
Thio
phan
ate-
met
hyl 4
1.25
%
Liqu
id
Fung
icid
e
C
ateg
ory
III
Toxi
c to
fish
. Con
tam
inat
es w
ater
thro
ugh
runo
ff.
Dac
onil
Wea
ther
St
ick
77.5
ga
llons
Chl
orot
halin
il 5
4%
Liqu
id
Fung
icid
e
C
ateg
ory
III
Toxi
c to
fish
and
inve
rtebr
ates
. Thi
s pr
oduc
t is
know
n to
leac
h th
roug
h so
il in
to g
roun
dwat
er.
Pot
entia
l for
gro
undw
ater
con
tam
inat
ion.
Und
er
certa
in c
ondi
tions
, it m
ay h
ave
a hi
gh p
oten
tial f
or
runo
ff in
to s
urfa
ce w
ater
(dep
endi
ng o
n so
il co
nditi
ons,
slo
pes,
pro
xim
ity to
sur
face
wat
er e
tc.)
Dac
onil
ZN
15 g
allo
ns
Chl
orot
halin
il 38
.5%
Liqu
id
Fung
icid
e
C
ateg
ory
II
Toxi
c to
aqu
atic
wild
life
and
inve
rtebr
ates
. Kno
wn
to
leac
h th
roug
h so
il in
to g
roun
dwat
er u
nder
cer
tain
co
nditi
ons.
Pot
entia
l gro
undw
ater
con
tam
inat
ion.
U
nder
cer
tain
con
ditio
ns, i
t may
hav
e a
high
po
tent
ial f
or ru
noff
into
sur
face
wat
er (d
epen
ding
on
soil
cond
ition
s, s
lope
s, p
roxi
mity
to s
urfa
ce w
ater
et
c.)
Dim
ensi
on
.13%
20-
4-10
10,8
50 lb
s
Dith
iopy
r 0
.13%
Gra
nula
r
Pre
-em
erge
nce
herb
icid
e
C
ateg
ory
III
Toxi
c to
fish
, and
hig
hly
toxi
c to
oth
er a
quat
ic
orga
nism
s in
clud
ing
oyst
ers
and
shrim
p. D
rift a
nd
runo
ff fro
m tr
eate
d tu
rf m
ay a
dver
sely
affe
ct a
quat
ic
orga
nism
s in
adj
acen
t aqu
atic
site
s.
220
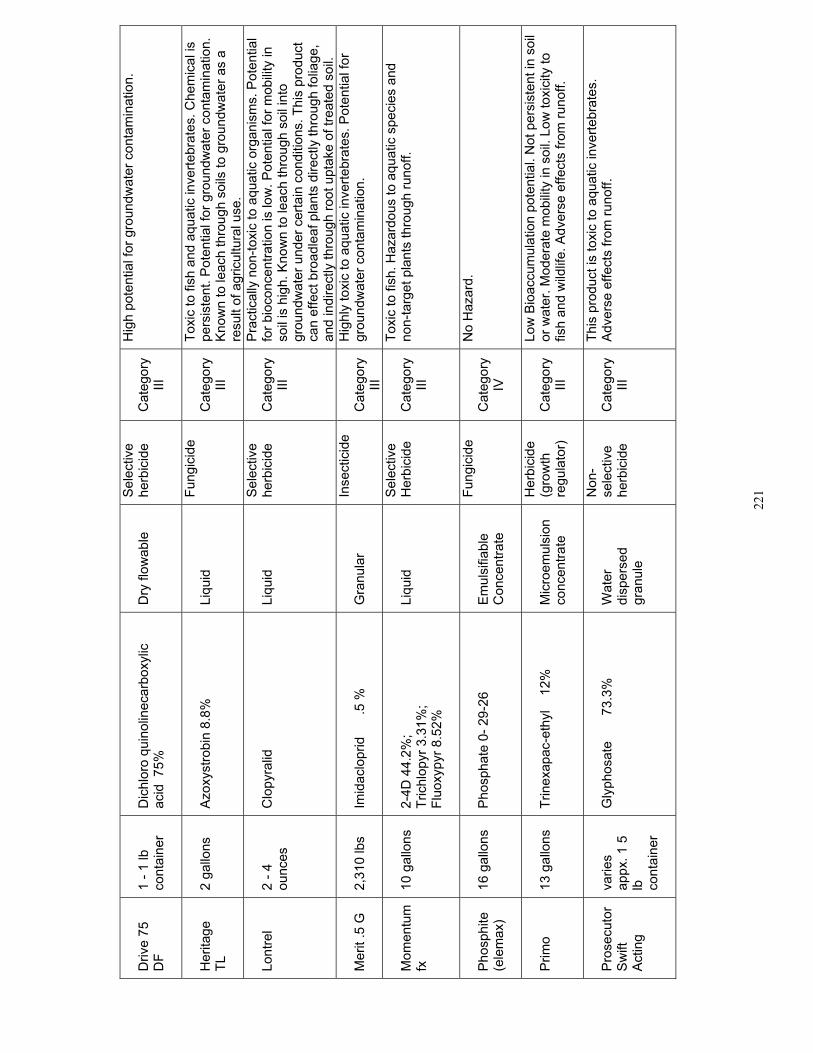
Driv
e 75
D
F
1 - 1
lb
cont
aine
r
Dic
hlor
o qu
inol
inec
arbo
xylic
ac
id 7
5%
Dry
flow
able
Sel
ectiv
e he
rbic
ide
C
ateg
ory
III
Hig
h po
tent
ial f
or g
roun
dwat
er c
onta
min
atio
n.
Her
itage
TL
2 ga
llons
Azo
xyst
robi
n 8.
8%
Liqu
id
Fung
icid
e
C
ateg
ory
III
Toxi
c to
fish
and
aqu
atic
inve
rtebr
ates
. Che
mic
al is
pe
rsis
tent
. Pot
entia
l for
gro
undw
ater
con
tam
inat
ion.
K
now
n to
leac
h th
roug
h so
ils to
gro
undw
ater
as
a
resu
lt of
agr
icul
tura
l use
. Lo
ntre
l
2 - 4
ou
nces
Clo
pyra
lid
Liqu
id
Sel
ectiv
e he
rbic
ide
C
ateg
ory
III
Pra
ctic
ally
non
-toxi
c to
aqu
atic
org
anis
ms.
Pot
entia
l fo
r bio
conc
entra
tion
is lo
w. P
oten
tial f
or m
obilit
y in
so
il is
hig
h. K
now
n to
leac
h th
roug
h so
il in
to
grou
ndw
ater
und
er c
erta
in c
ondi
tions
. Thi
s pr
oduc
t ca
n ef
fect
bro
adle
af p
lant
s di
rect
ly th
roug
h fo
liage
, an
d in
dire
ctly
thro
ugh
root
upt
ake
of tr
eate
d so
il.
Mer
it .5
G
2,31
0 lb
s Im
idac
lopr
id
.5
%
Gra
nula
r
Inse
ctic
ide
Cat
egor
y III
Hig
hly
toxi
c to
aqu
atic
inve
rtebr
ates
. Pot
entia
l for
gr
ound
wat
er c
onta
min
atio
n.
Mom
entu
m
fx
10 g
allo
ns
2-4D
44.
2%;
Tric
hlop
yr 3
.31%
; Fl
uoxy
pyr 8
.52%
Liqu
id
Sel
ectiv
e H
erbi
cide
Cat
egor
y III
Toxi
c to
fish
. Haz
ardo
us to
aqu
atic
spe
cies
and
no
n-ta
rget
pla
nts
thro
ugh
runo
ff.
Pho
sphi
te
(ele
max
)
16 g
allo
ns
Pho
spha
te 0
- 29-
26
Em
ulsi
fiabl
e C
once
ntra
te
Fung
icid
e
C
ateg
ory
IV
No
Haz
ard.
Prim
o
13 g
allo
ns
Trin
exap
ac-e
thyl
1
2%
Mic
roem
ulsi
on
conc
entra
te
Her
bici
de
(gro
wth
re
gula
tor)
C
ateg
ory
III
Low
Bio
accu
mul
atio
n po
tent
ial.
Not
per
sist
ent i
n so
il or
wat
er. M
oder
ate
mob
ility
in s
oil.
Low
toxi
city
to
fish
and
wild
life.
Adv
erse
effe
cts
from
runo
ff.
Pro
secu
tor
Sw
ift
Act
ing
varie
s ap
px. 1
5
lb
cont
aine
r
Gly
phos
ate
73.3
%
Wat
er
disp
erse
d gr
anul
e
Non
-se
lect
ive
herb
icid
e
C
ateg
ory
III
This
pro
duct
is to
xic
to a
quat
ic in
verte
brat
es.
Adv
erse
effe
cts
from
runo
ff.
221

Prox
y
6 ga
llons
Eth
epho
n 2
1.7%
Liqu
id
Her
bici
de
(gro
wth
re
gula
tor)
C
ateg
ory
III
Drif
t and
runo
ff m
ay b
e ha
zard
ous
to a
quat
ic
orga
nism
s in
nei
ghbo
ring
area
s.
Sev
en S
L
4.5
gallo
ns
Car
bary
l 4
3%
Liqu
id
Inse
ctic
ide
Cat
egor
y III
This
pro
duct
is to
xic
to a
quat
ic a
nd e
stua
rine
inve
rtebr
ates
. May
kill
hone
ybee
s in
sub
stan
tial
num
bers
. Thi
s pr
oduc
t is
high
ly to
xic
to b
ees
expo
sed
to d
irect
trea
tmen
t of r
esid
ues
on b
loom
ing
crop
s or
wee
ds. A
dver
se e
ffect
s fro
m ru
noff.
S
naps
hot
TG
250
lbs
Isox
aben
0.5
%
Trifl
ural
en 2
%
Gra
nula
r
Pre
-em
erge
nce
herb
icid
e
C
ateg
ory
III
Hig
hly
toxi
c to
aqu
atic
org
anis
ms.
Bio
conc
entra
tion
pote
ntia
l is
mod
erat
e to
low
. Mat
eria
l not
con
side
red
to b
e re
adily
bio
degr
adab
le.
Tals
tar
3 ga
llons
Bife
nthr
in
7.9%
- Fl
owab
le
Inse
ctic
ide
Cat
egor
y III
This
pes
ticid
e is
ext
rem
ely
toxi
c to
fish
and
aqu
atic
in
verte
brat
es. T
his
prod
uct i
s hi
ghly
toxi
c to
bee
s ex
pose
d to
dire
ct tr
eatm
ent o
r res
idue
s on
blo
omin
g cr
ops
or w
eeds
. Per
sist
ent i
n aq
uatic
sed
imen
ts.
Low
pot
entia
l for
gro
undw
ater
con
tam
inat
ion.
P
oten
tial f
or b
ioco
ncen
tratio
n.
Trim
mit
2SC
1.5-
2 ga
llons
Pac
lobu
trazo
l 2
3.3%
Liqu
id
Her
bici
de
(gro
wth
re
gula
tor)
Cat
egor
y III
N
ot p
ersi
sten
t in
soil.
Adv
erse
effe
cts
from
runo
ff.
Turfc
ide
950
lbss
P
enta
chlo
roni
trobe
nzen
e 10
%
Gra
nula
r Fu
ngic
ide
Cat
egor
y III
Acu
te to
xici
ty to
fish
and
aqu
atic
inve
rtebr
ates
. Drif
t an
d ru
noff
from
trea
ted
area
s m
ay b
e ha
zard
ous
to
fish
and
aqua
tic o
rgan
ism
s in
adj
acen
t aqu
atic
site
s.
222

Fert
ilize
rs u
sed
on B
uckn
ell U
nive
rsity
�’s a
cade
mic
cam
pus
Q
uant
ity U
sed
Ann
ually
(lbs
) Fe
rtili
zer
Type
N
-P-K
(t
ons)
L
ocat
ions
on
Cam
pus
Eco
logi
cal I
nfor
mat
ion
4650
lbs
Nat
ure
Safe
- G
ranu
lar
5-6-
6
2.33
tons
1 Ea
rly sp
ring
appl
icat
ion
on h
igh
prof
ile tu
rf a
reas
. N
ewly
seed
ed a
reas
.
Nat
ure
Safe
5-6
-6 c
onta
ins h
umus
whi
ch c
ondi
tions
the
soil
and
incr
ease
s wat
er re
tent
ion.
Hum
us is
soil
orga
nic
mat
ter w
hich
ha
s the
abi
lity
to b
uffe
r pla
nts a
gain
st h
igh
conc
entra
tions
of
salts
. It i
mpr
oves
the
Cat
ion
Exch
ange
Cap
acity
(CEC
) of t
he
soil
to m
inim
ize
leac
hing
and
enh
ance
upt
ake
of p
hosp
hate
s an
d ot
her e
ssen
tial m
icro
nutri
ents
to im
prov
e vi
gor.
This
pr
oduc
t will
hel
p in
the
min
eral
izat
ion
of in
solu
ble
nutri
ents
.
14,4
50 lb
s N
atur
e Sa
fe �–
G
ranu
lar
8-3-
5
7.23
tons
3-4
appl
icat
ions
per
ye
ar o
n hi
gh p
rofil
e la
wns
and
ath
letic
fie
lds
Hum
us h
as b
een
adde
d to
impr
ove
Cat
ion
Exch
ange
Cap
acity
(CEC
), bu
ffer
th
e so
il ag
ains
t ext
rem
e sa
lt co
ncen
tratio
ns a
nd im
prov
e so
il st
ruct
ure
for
tole
ranc
e du
ring
heat
and
dro
ught
con
ditio
ns. N
atur
e Sa
fe 8
-3-5
is n
on-
burn
ing
and
very
low
in sa
lt. V
irtua
lly a
ll of
the
prod
uct i
s util
ized
thro
ugh
com
plet
e pl
ant u
ptak
e, w
ith m
inim
al le
achi
ng a
nd v
olat
iliza
tion.
Nat
ure
Safe
ac
ts a
s a sp
onge
in re
tain
ing
moi
stur
e an
d nu
trien
ts fo
r pla
nt u
se, e
spec
ially
in
sand
y so
ils.
223

1,10
0 lb
s N
atur
e Sa
fe �–
G
ranu
lar
8-5-
5
0.55
tons
1 ap
plic
atio
n on
or
nam
enta
l bed
s
Car
bohy
drat
es in
the
form
of s
impl
e su
gars
and
star
ches
are
ad
ded
to st
imul
ate
mic
robi
al a
ctiv
ity. H
umus
is in
clud
ed to
bu
ffer
the
soil
agai
nst e
xtre
me
salt
conc
entra
tions
and
impr
ove
soil
stru
ctur
e fo
r tol
eran
ce d
urin
g he
at a
nd d
roug
ht c
ondi
tions
. V
irtua
lly a
ll of
the
prod
uct i
s util
ized
thro
ugh
plan
t upt
ake,
with
m
inim
al le
achi
ng a
nd v
olat
iliza
tion.
Nat
ure
Safe
8-5
-5
Land
scap
e Fe
rtiliz
er is
OM
RI l
iste
d, a
nd a
llow
ed u
nder
NO
P gu
idel
ines
val
idat
ing
its u
se in
the
prod
uctio
n of
org
anic
ce
rtifie
d cr
ops.
Nat
ure
Safe
is th
e on
ly c
ompa
ny to
hav
e ce
rtifie
d al
l of i
ts o
pera
tions
thro
ugh
Aud
ubon
�’s C
oope
rativ
e Sa
nctu
ary
Prog
ram
, ser
ving
as a
mod
el fo
r env
ironm
enta
l st
ewar
dshi
p ex
celle
nce
and
safe
ty.
2,10
0 lb
s N
atur
e Sa
fe �–
G
ranu
lar
21-3
-7
1.05
tons
1 ap
plic
atio
n on
va
rsity
ath
letic
fiel
ds
Due
to h
ow it
�’s m
ade
(a c
ombi
natio
n of
Nat
ure
Safe
and
U
FLEX
X) t
he p
rodu
ct p
rovi
des n
itrog
en to
pla
nts,
whi
le
redu
cing
nitr
ogen
loss
due
to le
achi
ng, v
olat
iliza
tion,
and
de
nitri
ficat
ion.
It is
a lo
w-c
ost a
ltern
ativ
e fo
r fai
rway
, la
ndsc
ape,
and
law
ncar
e.
700
lbs
Espo
ma
Hol
lyto
ne
4-6-
4
0.35
tons
Aci
d-lo
ving
pla
nts o
n ca
mpu
s
�• Com
plex
ble
nd o
f nat
ural
org
anic
s pro
vide
com
plet
e &
ba
lanc
ed fe
edin
g of
all
15 n
utrie
nts.
�• Env
ironm
enta
lly sa
fe. N
o sl
udge
s, ha
zard
ous o
r tox
ic
ingr
edie
nts.
�• Lon
g la
stin
g, sl
ow re
leas
e. W
on�’t
burn
or l
each
aw
ay.
�• Con
tain
s org
anic
mat
ter r
ich
in v
itam
ins a
nd b
enef
icia
l m
icro
bes t
o im
prov
e so
il.
3,
400l
bs
H
arre
lls
6-0-
0 in
sect
icid
e 1.
7 to
ns
Ath
letic
fiel
ds to
trea
t fo
r gru
bs
Poss
ible
dam
age
to lo
cal a
quat
ic o
rgan
ism
s.
224

Fert
ilize
rs u
sed
for
Buc
knel
l Uni
vers
ity�’s
Gol
f Cou
rse
Ferti
lizer
Typ
e N
-P-K
Q
uant
ity U
sed
Loca
tions
on
Cam
pus
Ecol
ogic
al in
form
atio
n
Dim
ensi
on .1
3%
Act
ive
Ingr
edie
nt: d
ithio
pyr
20 �–
4 �–
10
.88
lb. N
/100
0 sq
ft
All
trees
, gre
en
surr
ound
s, fa
irway
s, ro
ugh
(hig
h pl
ay)
1 sp
ring
appl
icat
ion
This
pro
duct
is to
xic
to fi
sh a
nd h
ighl
y to
xic
to
othe
r aqu
atic
org
anis
ms
incl
udin
g oy
ster
s an
d sh
rimp.
Use
with
car
e w
hen
appl
ying
to tu
rf ar
eas
adja
cent
to a
ny b
ody
of w
ater
. Drif
t and
ru
noff
from
trea
ted
turf
may
adv
erse
ly a
ffect
aq
uatic
org
anis
ms
in a
djac
ent a
quat
ic s
ites.
D
o no
t app
ly d
irect
ly to
wat
er, o
r to
area
s w
here
sur
face
wat
er is
pre
sent
, or t
o in
terti
dal
area
s be
low
the
mea
n hi
gh ti
de m
ark.
Do
not
appl
y w
hen
wea
ther
con
ditio
ns fa
vor d
rift
away
from
trea
ted
area
s. D
o no
t con
tam
inat
e w
ater
whe
n di
spos
ing
of e
quip
men
t w
ashw
ater
s.
2
�– 5
�– 15
Con
trolle
d re
leas
e N
ap
prox
. 1/1
0 lb
N
per
wee
k un
til m
id S
ept.
Fairw
ays
1 la
te sp
ring
appl
icat
ion
Seed
Sta
rting
Fer
tiliz
er
19 �–
26
�– 5
1l
b N
/100
0 sq
ft.
Fairw
ays,
Rye
gras
s tee
s,
1 ea
rly fa
ll ap
plic
atio
n or
an
y ne
wly
seed
ed a
rea
5
�– 5
�– 20
1
lb. N
Ben
tgra
ss T
ees
1 Fa
ll ap
plic
atio
n
225