bubble properties and pressure fluctuations in pressurized bubble columns
TRANSCRIPT
*Corresponding author. Tel.: #82-42-821-5683; fax: #82-42-825-7673.
E-mail address: [email protected] (Y. Kang)
Chemical Engineering Science 55 (2000) 411}419
Bubble properties and pressure #uctuations in pressurizedbubble columns
Y. Kang!,*, Y.J. Cho!, K.J. Woo!, K.I. Kim!, S.D. Kim"
!Department of Chemical Engineering, Chungnam National University, Daeduk Science Town, Taejon 305-764, South Korea"Department of Chemical Engineering, KAIST, Taejon 305-701, South Korea
Received 31 March 1999; accepted 1 April 1999
Abstract
Bubble characteristics and pressure #uctuations have been investigated in a pressurized bubble column (0.1}0.6 MPa). The bubbleproperties have been measured by means of resistivity probe method and the pressure #uctuations by a semi-conductor type pressuretransducer. The e!ects of gas velocity and pressure on the bubble properties such as chord length, frequency and rising velocity havebeen determined. The number density distributions of the individual bubble chord length have been represented by the logarithmicnormal distributions, by which the mean chord length of a bubble has been determined. The pressure #uctuations due to the bubblingphenomena in the column have been analyzed by resorting to the deterministic chaos theory; the mutual information function,phase-space portraits and correlation dimension have been obtained from the time series of pressure #uctuations. It has been foundthat the mutual information function, phase-space portraits and correlation dimension can be utilized to describe and explain thenon-linear dynamical behaviors of gas}liquid #ow as well as the bubble properties in pressurized bubble columns. They can providequantitative measures of dynamical behavior arising from the complex gas}liquid #ow. The bubble properties have been wellcorrelated with the complex bubbling phenomena by means of the correlation dimension. ( 1999 Elsevier Science Ltd. All rightsreserved.
Keywords: Bubble properties; Pressure #uctuations; Pressurized bubble columns; Chaos analysis; Mutual information function; Phase-space portraits;Correlation dimension
1. Introduction
The pressurized bubble columns have been utilized forthe chemical, biochemical and synthetic fuels processessuch as direct coal liquefaction, Fischer}Tropsch reac-tion, etc. (Clark, Foster & Weiss, 1983; Tarmy, Chang,Coulaloglou & Ponzi, 1984). For the purpose of wideindustrial applications of bubble column, more reliableand practical experimental data on the hydrodynamicsand bubble properties have been indispensable, with thevariation of pressure in the column (Idogawa, Ikeda,Fakuda & Morooka, 1986; Clark, 1990; Wilkinson & vanDierendonck, 1990; Wilkinson, Spek & Van Dieren-donck, 1992; Wilkinson, Van schayk & Spronken, 1993;Oyenaar, Bos & Westerterp, 1991; Schumpe, 1993; Jiang,
Lin, Luo & Fan, 1995; Kang, Shim, Cho, Choi & Lee,1995). The e!ect of pressure on the bubble holdup and itssize has been explained by means of two main reasons;the one is due to that the bubble size is reduced informing at the distributor at the elevated pressure condi-tions (LaNauze & Harris, 1974; Tsuge & Hibino, 1983),while, the other is that the bubble coalescence is de-creased and bubble break-up is increased considerablywith increasing the pressure in the column (Wilkinson& Dierendonck, 1990; Wilkinson et al., 1993; Clark, 1990;Letzel, Schouten, van den Bleek & Krishna, 1997).
In employing the bubble columns as reactors or con-tact processes, however, some signi"cant problems havebeen often encountered arising from the rather poorperformance predictions. This is mainly attributableto that the #ow behavior of bubbles in the column ishighly complicated, irregular and random, althoughthe scheme of bubble column is simple. The resultantbehaviors of bubbles can be expressed in terms of pres-sure #uctuations in the system as its state variables
0009-2509/00/$ - see front matter ( 1999 Elsevier Science Ltd. All rights reserved.PII: S 0 0 0 9 - 2 5 0 9 ( 9 9 ) 0 0 3 3 6 - X
(Fan, Neogi & Yashima, 1991; Drahos, Bradka & Punc-ochar, 1992; Kang, Woo, Ko & Kim, 1997a, Kang et al.,1997b; Kikuchi et al., 1997).
The non-linear bubbling phenomena in the pressurizedbubble column can be described e!ectively by means ofthe mutual information function, phase-space portraitsand correlation dimension (Van der Stappen, Schouten& Van der Bleek, 1992; Daw & Halow, 1993). The mutualinformation function describes the dependence betweensuccessive measurements without assuming a particularfunctional relationship. Conglomerating e!ects of mul-tiple dynamic events occurring over a broad regime ofthe column can be detected by means of phase-spacetrajectories. Moreover, the correlation dimension canprovide a quantitative measure of the signi"cant numberof dynamic degree of freedom.
For the reduction of risk in predicting the performanceand for the design, scale-up and fault diagnosis of thepressurized bubble column reactors or processes, it isnecessary to yield useful information on the relationbetween the bubble properties and the resultant bubblingphenomena in the column.
Thus, in the present study, the bubble properties andresultant bubbling phenomena in the pressurized bubblecolumn have been investigated to obtain the reliable in-formation on the relation between them. More speci"cally,the bubble properties such as chord length, frequency andrising velocity have been measured. And those propertieshave been related to the bubbling phenomena in thecolumn by means of the strange attractor and correlationdimension of pressure #uctuations in the column.
2. Analysis
2.1. Mutual information function
From pressure #uctuation time series X(t), a discretedata set of X(t) can be written as X(t)"MX(t
1), X(t
2),
X(t3), 2, X(t
n)N. Values of X may be divided into bins,
each with a range in X(t), and denoted by valuesX
1, X
2, X
3, 2, X
n. Then, the probability of any value of
X is P(Xi)"X
i/n. Hence, a set of probabilities
P(X1), P(X
2), P(X
3), 2, P(X
N), can be created from the
original data set. Here, consider another discrete data set,>(t)"MX(t
1#q), X(t
2#q), X(t
3#q), 2, X(t
m#q)N,
with set of probabilities P(>1), P(>
2), P(>
3), 2, P(>
M).
Then, the mutual information function can be describedas (Mansuripur, 1987; Daw & Halow, 1993; Karamavruc,Clark & Halow, 1995).
I(X, >)"H(X)#H(>)!H(X, >), (1)
where
H(X)"!
N+i/1
P(Xi)log
2P(X
i), (2)
H(>)"!
M+j/1
P(>j)log
2P(>
j), (3)
H(X,>)"!
N+i/1
M+j/1
P(Xi, >
j)log
2P(X
i, >
j). (4)
In Eqs. (1)}(4), X and > denote the whole system whichconsist of all measured data. H(X) and H(>) are theaverage entropy corresponding to X(t) and >(t), respec-tively, and H(X, >) is the average joint entropy.
2.2. Phase-space portraits
The multidimensional phase-space portraits can beconstructed from the pressure #uctuation time series bymeans of the time delay method (Packard, Crutch#eld,Farmer & Shah, 1980; Roux, Simoyi & Swinney, 1983).That is, the experimentally obtained time-series signal,X(t), is digitized with a time step of *t; the resultant(m#1) values of the signal, X(i*t), are stored for
i"0, 1, 2,2, m.
Thus, the vector time series is de"ned as
Zi(t)"[X(i*t), X(i*t#q),2, X(i*t#(p!1)q)],
i"0, 1, 2, 2, [m!(p!1)k], (5)
where
q"k*t, k"1, 2, 3, 2
and p is the dimension of the vector, Z(t). Therefore,moving along with time t, a series of p-dimensional vec-tors representing the p-dimensional portrait of the systemcan be obtained. Occasionally, p is referred to as theembedded phase-space dimension of the reconstructedtrajectory or attractor.
2.3. Correlation dimension
To estimate the correlation dimension of the timeseries X(t), the trajectories of them reconstructed byresorting to time embedding have been used.
From the trajectories of the vector time series thecorrelation integral (the space correlation function) of theprocess, C(r), is de"ned as (Grassberger & Procaccia,1983; Abraham et al., 1986)
C(r)" limm?=
1
m2[number of pairs (i, j) whose distance
DZi(t)!Z
j(t)D(r]. (6)
Formally,
C(r)" limm?=
1
m2
m+i/1
m+j/1
H[r!DZi(t)!Z
j(t)D], iOj, (7)
412 Y. Kang et al. / Chemical Engineering Science 55 (2000) 411}419

Fig. 1. Experimental apparatus.
where m is the number of data points, and H is Heavysidefunction,
H[r!DZi(t)!Z
j(t)D]"G
1 if r'DZi(t)!Z
j(t)D,
0 otherwise.(8)
The correlation integral, C(r), has been found to bea power function of r for small r's:
C(r)"krDc. (9)
The slope of the plot of ln C(r) vs. lnr is an estimate ofD
Cfor the given embedded space dimension, p.
3. Experimental
Experiments were carried out in a stainless-steel col-umn of 0.058 m in diameter and 1.5 m high as shown inFig. 1. The distributor was situated between the maincolumn section and a 0.2 m high stainless-steel distribu-tor box into which water was introduced througha 0.025 m pipe from the liquid reservior. Oil-free com-
pressed air was fed to the column through a pressureregulator, "lter and a calibrated rotameter. It was admit-ted to the column through three 3.0 mm ID. perforatedpipes drilled horizontally in the grid. The pipes wereevenly spaced across the grid having 12 holes whosediameter is 1 mm. The super"cial velocity of gas phaseranged from 0.02 to 0.25 m/s, and the pressure in thecolumn ranged from 0.1 to 0.6 MPa, respectively.
3.1. Bubble properties
The bubble size in terms of bubble chord length, risingvelocity and frequency were measured by means of dualelectrical resistivity probe system (Matsuura & Fan,1984; Idogawa et al., 1986). The probe applied by1.75 V DC detected the di!erence in conductivity of gasand liquid. The dual electrical resistivity probe which wasinstalled at 0.2 m from the distributor, consisted of two7 mm diameter stianless-steel pipes coated with epoxyresin. The vertical distance between the tips of the twoprobe was 2 mm. The probe was located at the centerbetween the wall and center of the column. The tips of theprobe, which are made of platinum wire, had a diameterof 0.2 mm.
The analog signals obtained from each probe circuitare processed to produce the digital data. The preselectedsampling rate at the personal computer with the DT2805Lab Card was 500 Hz. The total sampling time was 15 s.The signals were processed o!-line. The bubble chordlength, frequency and rising velocity have been calculatedfrom the relationship between reformed and digitizedprobe signals and bubble dwell and lag time (Yu & Kim,1988,1991).
3.2. Pressure yuctuations
The static and dynamic pressures have been measuredby means of pressure sensors.
Pressure taps for measuring the pressures were moun-ted #ush with the wall of the column at 0.2}0.4 m abovethe distributor. The pressure sensor was a semiconductortype (Coppel electronics) that has enough fast responsetime to measure the dynamic pressure #uctuations in thecolumn. The output voltage from the pressure trans-ducer, which is proportional to the pressure #uctuations,was processed by means of a data acquisition system(Data Precision Model, D-6000) and a personal com-puter. The voltage}time signals, corresponding to thepressure}time signals, were sampled at a rate of 0.005 sand stored in the data acquisition system. The totalacquisition time was 15 s having 3000 data points. Thiscombination of sampling rate and time can detect the fullspectrum of hydrodynamic signals (200 Hz) in multi-phase #ow system (Kang et al., 1997a,b).
Y. Kang et al. / Chemical Engineering Science 55 (2000) 411}419 413
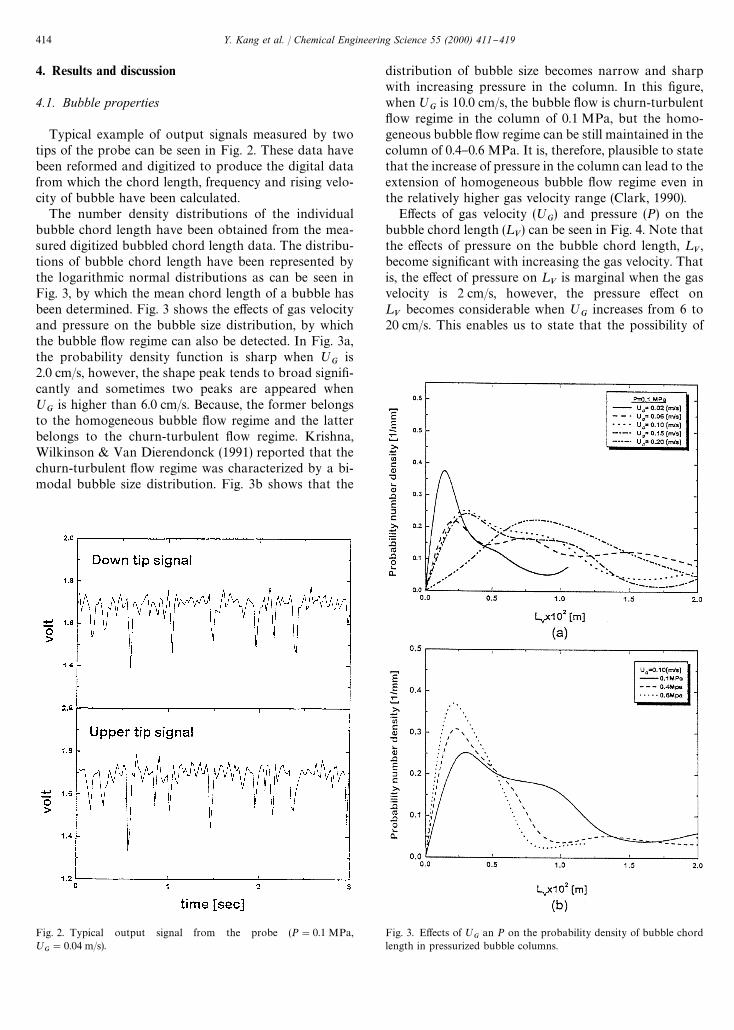
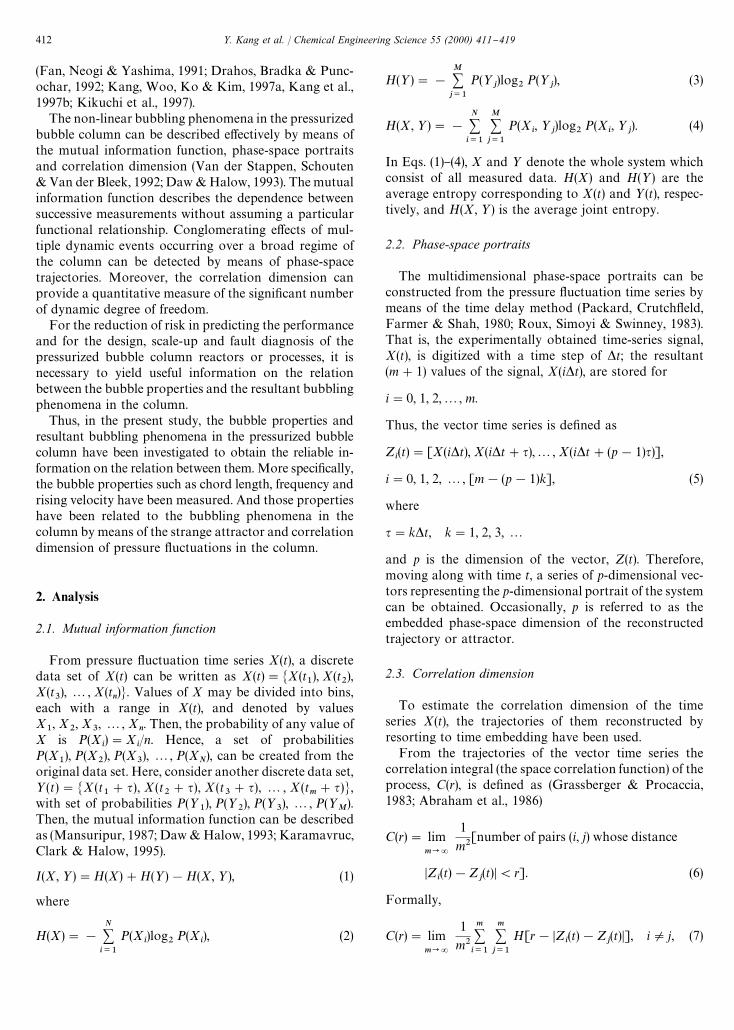
Fig. 2. Typical output signal from the probe (P"0.1 MPa,;
G"0.04 m/s).
Fig. 3. E!ects of ;G
an P on the probability density of bubble chordlength in pressurized bubble columns.
4. Results and discussion
4.1. Bubble properties
Typical example of output signals measured by twotips of the probe can be seen in Fig. 2. These data havebeen reformed and digitized to produce the digital datafrom which the chord length, frequency and rising velo-city of bubble have been calculated.
The number density distributions of the individualbubble chord length have been obtained from the mea-sured digitized bubbled chord length data. The distribu-tions of bubble chord length have been represented bythe logarithmic normal distributions as can be seen inFig. 3, by which the mean chord length of a bubble hasbeen determined. Fig. 3 shows the e!ects of gas velocityand pressure on the bubble size distribution, by whichthe bubble #ow regime can also be detected. In Fig. 3a,the probability density function is sharp when ;
Gis
2.0 cm/s, however, the shape peak tends to broad signi"-cantly and sometimes two peaks are appeared when;
Gis higher than 6.0 cm/s. Because, the former belongs
to the homogeneous bubble #ow regime and the latterbelongs to the churn-turbulent #ow regime. Krishna,Wilkinson & Van Dierendonck (1991) reported that thechurn-turbulent #ow regime was characterized by a bi-modal bubble size distribution. Fig. 3b shows that the
distribution of bubble size becomes narrow and sharpwith increasing pressure in the column. In this "gure,when;
Gis 10.0 cm/s, the bubble #ow is churn-turbulent
#ow regime in the column of 0.1 MPa, but the homo-geneous bubble #ow regime can be still maintained in thecolumn of 0.4}0.6 MPa. It is, therefore, plausible to statethat the increase of pressure in the column can lead to theextension of homogeneous bubble #ow regime even inthe relatively higher gas velocity range (Clark, 1990).
E!ects of gas velocity (;G) and pressure (P) on the
bubble chord length (¸V) can be seen in Fig. 4. Note that
the e!ects of pressure on the bubble chord length, ¸V,
become signi"cant with increasing the gas velocity. Thatis, the e!ect of pressure on ¸
Vis marginal when the gas
velocity is 2 cm/s, however, the pressure e!ect on¸V
becomes considerable when ;G
increases from 6 to20 cm/s. This enables us to state that the possibility of
414 Y. Kang et al. / Chemical Engineering Science 55 (2000) 411}419
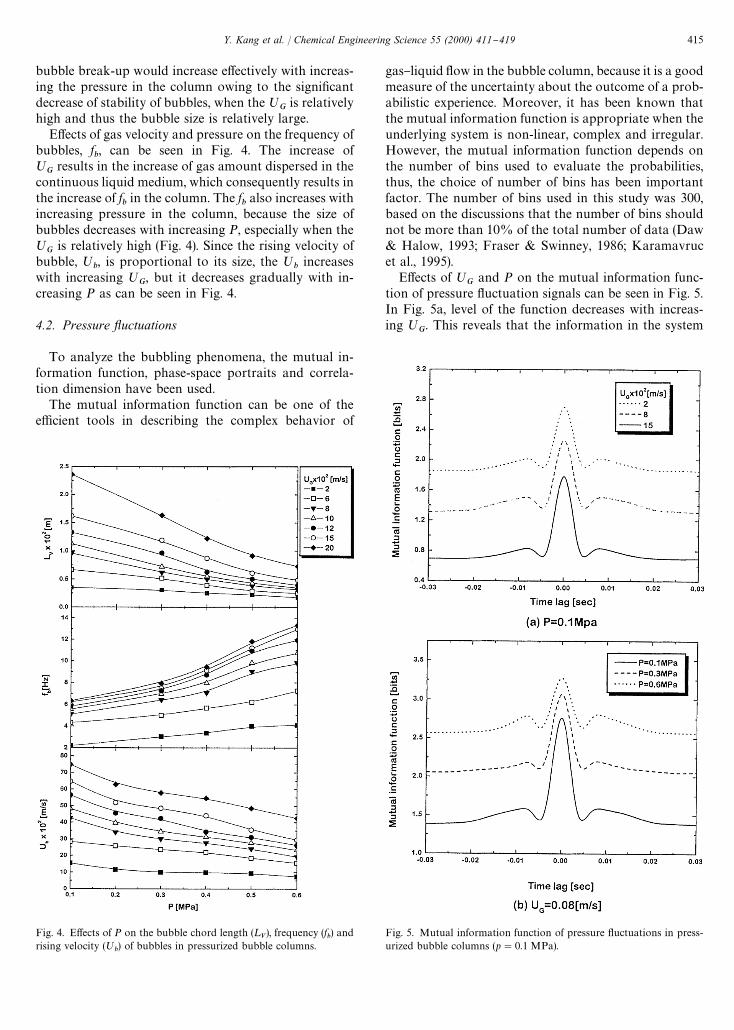
Fig. 4. E!ects of P on the bubble chord length (¸V), frequency (f
b) and
rising velocity (;b) of bubbles in pressurized bubble columns.
Fig. 5. Mutual information function of pressure #uctuations in press-urized bubble columns (p"0.1 MPa).
bubble break-up would increase e!ectively with increas-ing the pressure in the column owing to the signi"cantdecrease of stability of bubbles, when the ;
Gis relatively
high and thus the bubble size is relatively large.E!ects of gas velocity and pressure on the frequency of
bubbles, fb, can be seen in Fig. 4. The increase of
;G
results in the increase of gas amount dispersed in thecontinuous liquid medium, which consequently results inthe increase of f
bin the column. The f
balso increases with
increasing pressure in the column, because the size ofbubbles decreases with increasing P, especially when the;
Gis relatively high (Fig. 4). Since the rising velocity of
bubble, ;b, is proportional to its size, the ;
bincreases
with increasing ;G, but it decreases gradually with in-
creasing P as can be seen in Fig. 4.
4.2. Pressure yuctuations
To analyze the bubbling phenomena, the mutual in-formation function, phase-space portraits and correla-tion dimension have been used.
The mutual information function can be one of thee$cient tools in describing the complex behavior of
gas}liquid #ow in the bubble column, because it is a goodmeasure of the uncertainty about the outcome of a prob-abilistic experience. Moreover, it has been known thatthe mutual information function is appropriate when theunderlying system is non-linear, complex and irregular.However, the mutual information function depends onthe number of bins used to evaluate the probabilities,thus, the choice of number of bins has been importantfactor. The number of bins used in this study was 300,based on the discussions that the number of bins shouldnot be more than 10% of the total number of data (Daw& Halow, 1993; Fraser & Swinney, 1986; Karamavrucet al., 1995).
E!ects of ;G
and P on the mutual information func-tion of pressure #uctuation signals can be seen in Fig. 5.In Fig. 5a, level of the function decreases with increas-ing ;
G. This reveals that the information in the system
Y. Kang et al. / Chemical Engineering Science 55 (2000) 411}419 415
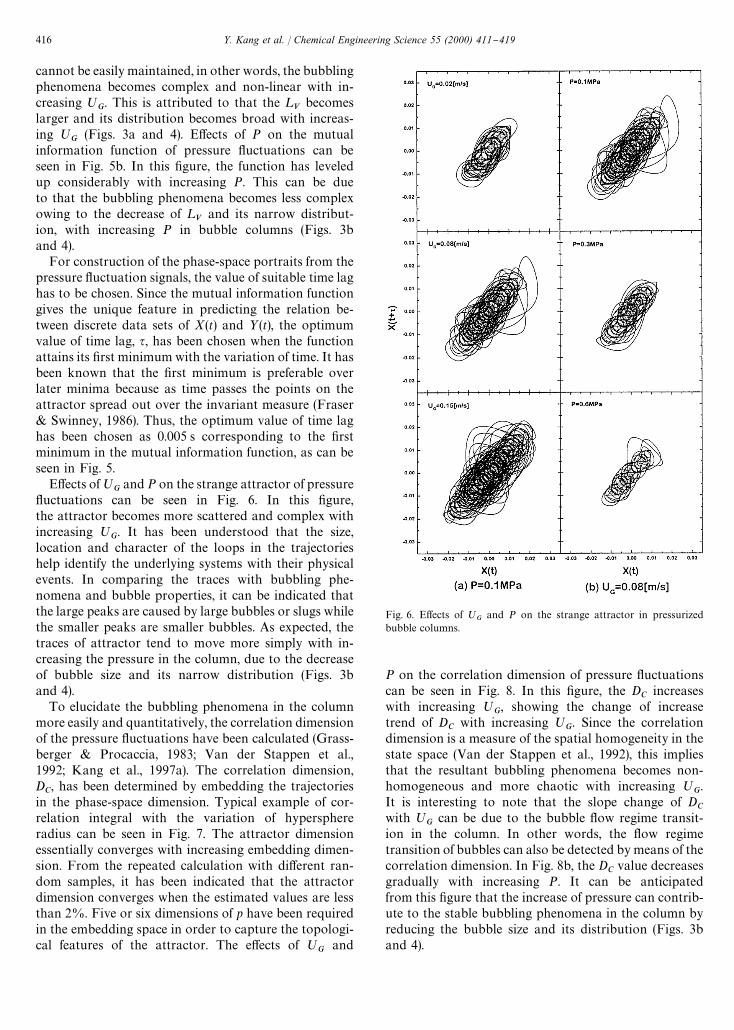
Fig. 6. E!ects of ;G
and P on the strange attractor in pressurizedbubble columns.
cannot be easily maintained, in other words, the bubblingphenomena becomes complex and non-linear with in-creasing ;
G. This is attributed to that the ¸
Vbecomes
larger and its distribution becomes broad with increas-ing ;
G(Figs. 3a and 4). E!ects of P on the mutual
information function of pressure #uctuations can beseen in Fig. 5b. In this "gure, the function has leveledup considerably with increasing P. This can be dueto that the bubbling phenomena becomes less complexowing to the decrease of ¸
Vand its narrow distribut-
ion, with increasing P in bubble columns (Figs. 3band 4).
For construction of the phase-space portraits from thepressure #uctuation signals, the value of suitable time laghas to be chosen. Since the mutual information functiongives the unique feature in predicting the relation be-tween discrete data sets of X(t) and >(t), the optimumvalue of time lag, q, has been chosen when the functionattains its "rst minimum with the variation of time. It hasbeen known that the "rst minimum is preferable overlater minima because as time passes the points on theattractor spread out over the invariant measure (Fraser& Swinney, 1986). Thus, the optimum value of time laghas been chosen as 0.005 s corresponding to the "rstminimum in the mutual information function, as can beseen in Fig. 5.
E!ects of;G
and P on the strange attractor of pressure#uctuations can be seen in Fig. 6. In this "gure,the attractor becomes more scattered and complex withincreasing ;
G. It has been understood that the size,
location and character of the loops in the trajectorieshelp identify the underlying systems with their physicalevents. In comparing the traces with bubbling phe-nomena and bubble properties, it can be indicated thatthe large peaks are caused by large bubbles or slugs whilethe smaller peaks are smaller bubbles. As expected, thetraces of attractor tend to move more simply with in-creasing the pressure in the column, due to the decreaseof bubble size and its narrow distribution (Figs. 3band 4).
To elucidate the bubbling phenomena in the columnmore easily and quantitatively, the correlation dimensionof the pressure #uctuations have been calculated (Grass-berger & Procaccia, 1983; Van der Stappen et al.,1992; Kang et al., 1997a). The correlation dimension,D
C, has been determined by embedding the trajectories
in the phase-space dimension. Typical example of cor-relation integral with the variation of hypersphereradius can be seen in Fig. 7. The attractor dimensionessentially converges with increasing embedding dimen-sion. From the repeated calculation with di!erent ran-dom samples, it has been indicated that the attractordimension converges when the estimated values are lessthan 2%. Five or six dimensions of p have been requiredin the embedding space in order to capture the topologi-cal features of the attractor. The e!ects of ;
Gand
P on the correlation dimension of pressure #uctuationscan be seen in Fig. 8. In this "gure, the D
Cincreases
with increasing ;G, showing the change of increase
trend of DC
with increasing ;G. Since the correlation
dimension is a measure of the spatial homogeneity in thestate space (Van der Stappen et al., 1992), this impliesthat the resultant bubbling phenomena becomes non-homogeneous and more chaotic with increasing ;
G.
It is interesting to note that the slope change of DC
with ;G
can be due to the bubble #ow regime transit-ion in the column. In other words, the #ow regimetransition of bubbles can also be detected by means of thecorrelation dimension. In Fig. 8b, the D
Cvalue decreases
gradually with increasing P. It can be anticipatedfrom this "gure that the increase of pressure can contrib-ute to the stable bubbling phenomena in the column byreducing the bubble size and its distribution (Figs. 3band 4).
416 Y. Kang et al. / Chemical Engineering Science 55 (2000) 411}419
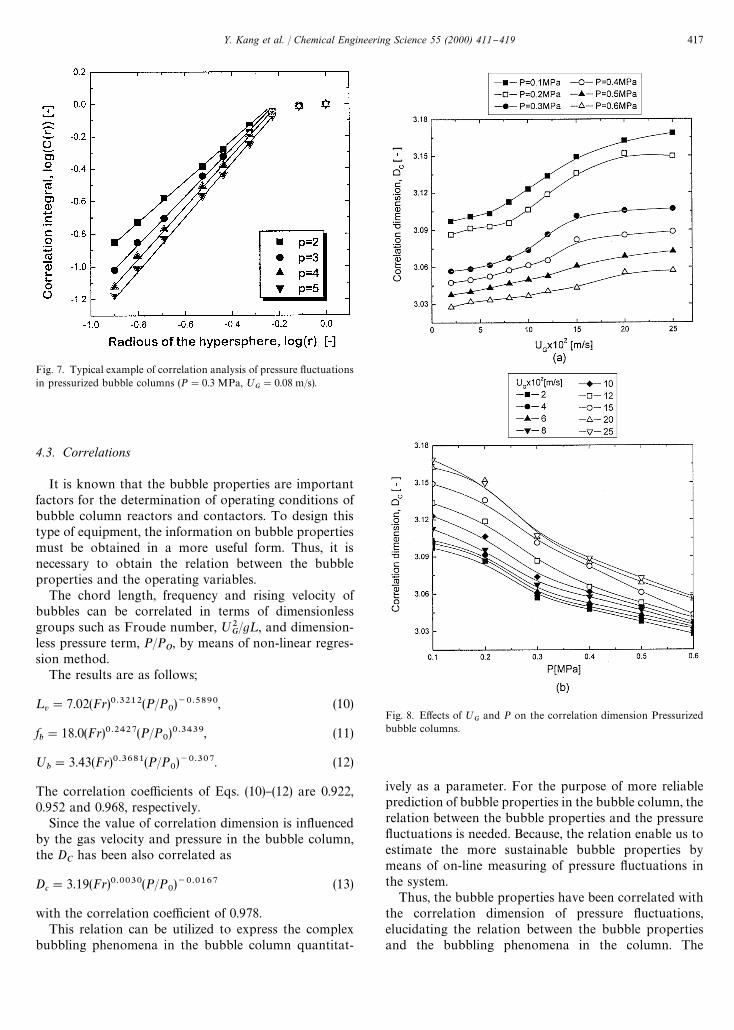
Fig. 7. Typical example of correlation analysis of pressure #uctuationsin pressurized bubble columns (P"0.3 MPa, ;
G"0.08 m/s).
Fig. 8. E!ects of ;G
and P on the correlation dimension Pressurizedbubble columns.
4.3. Correlations
It is known that the bubble properties are importantfactors for the determination of operating conditions ofbubble column reactors and contactors. To design thistype of equipment, the information on bubble propertiesmust be obtained in a more useful form. Thus, it isnecessary to obtain the relation between the bubbleproperties and the operating variables.
The chord length, frequency and rising velocity ofbubbles can be correlated in terms of dimensionlessgroups such as Froude number, ;2
G/g¸, and dimension-
less pressure term, P/PO, by means of non-linear regres-
sion method.The results are as follows;
¸v"7.02(Fr)0.3212(P/P
0)~0.5890, (10)
fb"18.0(Fr)0.2427(P/P
0)0.3439, (11)
;b"3.43(Fr)0.3681(P/P
0)~0.307. (12)
The correlation coe$cients of Eqs. (10)}(12) are 0.922,0.952 and 0.968, respectively.
Since the value of correlation dimension is in#uencedby the gas velocity and pressure in the bubble column,the D
Chas been also correlated as
Dc"3.19(Fr)0.0030(P/P
0)~0.0167 (13)
with the correlation coe$cient of 0.978.This relation can be utilized to express the complex
bubbling phenomena in the bubble column quantitat-
ively as a parameter. For the purpose of more reliableprediction of bubble properties in the bubble column, therelation between the bubble properties and the pressure#uctuations is needed. Because, the relation enable us toestimate the more sustainable bubble properties bymeans of on-line measuring of pressure #uctuations inthe system.
Thus, the bubble properties have been correlated withthe correlation dimension of pressure #uctuations,elucidating the relation between the bubble propertiesand the bubbling phenomena in the column. The
Y. Kang et al. / Chemical Engineering Science 55 (2000) 411}419 417
equations are
¸v
Dc
"2.207(Fr)0.3183(P/P0)~0.5734, (14)
fb
Dc
"5.675(Fr)0.2399(P/P0)0.3595, (15)
;b
Dc
"1.078(Fr)0.3651(P/P0)~0.3440. (16)
The correlation coe$cients of Eqs. (14)}(16) are 0.923,0.951 and 0.969, respectively.
5. Concluding remarks
The bubble properties and bubbling phenomena inpressurized bubble columns have been analyzed and de-scribed successfully by adopting the deterministic chaostheory. The bubble size, frequency and rising velocityhave increased while the size distribution becomes broad,with increasing gas velocity. On the other hand, thebubble size and rising velocity have decreased and thefrequency of bubbles has increased, with increasing thepressure in the column. Also, the increase of pressure canlet the bubble size distribution become narrow, thus, itenables that the homogeneous bubble #ow regime can bemaintained even at the relatively higher gas velocitycondition. The bubble properties have been easily ex-plained by means of pressure #uctuations and they havebeen well correlated with the correlation dimension ofpressure #uctuations. The mutual information function,phase-space portraits and correlation dimension can beutilized as e!ective tools in predicting the bubbling phe-nomena in pressurized bubble columns.
Notation
C(r) correlation integralD
Ccorrelation dimension
fb
bubble frequency, 1/sFr
Froude numberg gravitational acceleration, m/s2H Heavyside function de"ned as Eq. (8)H(X), H(>) average entropy corresponding to X(t) and
>(t), bitsH(X,>) average joint entropy, bitI(X, >) mutual information function, bitk constant¸ distance from the distributor, m¸V
bubble chord length, mM number of possible outcomes in >(t)m number of data pointN number of possible outcomes in X(t)P, P
opressure, MPa
P(Xi), P(>
j) probability corresponding to X
iand >
jP(X
i, >
j) joint probability
p embedded dimensionr radius of hyperspheret time, s;
bmean bubble rising velocity, m/s
;G
gas velocity, m/sX(t) time series of pressure #uctuations, VZ
ithe vector time series de"ned as Eq. (5)
Greek lettersq time delay, s
References
Abraham, N. B., Albano Das, B., Guzman, G. D., Yong, S., Puceioni,G. P., & Tredicce, J. R. (1986). Calculating the dimension of attrac-tors from small data sets. Physics Letters A, 114, 217}221.
Clark, K. N., Foster, N. R., & Weiss, R. G. (1983). Evaluation of neutronabsorption technique for the determination of residence time distri-butions in coal hydrogenation reactors. Proceedings of the 11thAustralian Chemical Engineering Conference 239}244.
Clark, K. N. (1990). The e!ect of high pressure and temperature onphase distributions in a bubble column. Chemical EngineeringScience, 45, 2301}2307.
Daw, C. S., & Halow, J. S. (1993). Evaluation and control of #uidizationquality through chaotic time series analysis of pressure-dropmeasurement. A.I.Ch.E. Symposium Series, 296(89), 103}121.
Drahos, J., Bradka, F., & Puncochar, M. (1992). Fractal behavior ofpressure #uctuations in a bubble column. Chemical EngineeringScience, 47, 4069}4075.
Fan, L. T., Neogi, D., & Yashima, M. (1991). In Elementary introductionto spatial and temporal fractal (pp. 60}69). Heidelberg, Germany:Springer.
Fraser, A., & Swinney, H. L. (1986). Independent coordinates forstrange attractors from mutual information. Physical Review A, 33,1134}1140.
Grassberger, P., & Procaccia, I. (1983). Measuring the strangeness ofstrange attractors. Physica D, 9, 189}194.
Idogawa, K., Ikeda, K., Fukuda, T., & Morooka, S. (1986). Behavior ofbubbles of the air-water system in a column under high pressure.International Chemical Engineering, 26, 468}474.
Jiang, P., Lin, T. J., Luo, X., & Fan, L. S. (1995). Flow visualization ofhigh pressure (21 MPa) bubble column: Bubble characteristics.Transactions of the Institute of Chemical Engineers, 73(Part A),269}274.
Karamavruc, A. I., Clark, N. N., & Halow, J. S. (1995). Application ofmutual information theory to #uid bed temperature and di!erentialpressure signal analysis. Powder Technology, 84, 247}257.
Kang, Y., Shim, J. S., Cho, S. H., Choi, M. J., & Lee, K. W. (1995).Dehydration of ortho-boric acid in a three-phase bubble columnreactor operating at low pressure. Journal of Chemical Technologyand Biotechnology, 63, 313}320.
Kang, Y., Woo, K. J., Ko, M. H., & Kim, S. D. (1997a). Particledispersion and pressure #uctuations in three-phase #uidized beds.Chemical Engineering Science, 52, 3723}3732.
Kang, Y., Woo, K. J., Cho, Y. J., Song, P. S., Ko, M. H., & Kim, S. D.(1997b). Search for the Intrinsic order of gas}liquid #ow in a bubblecolumn. HWAHAK KONGHAK, 35, 649}654.
Kikuchi, R., Yano, T., Tsutsumi, A., Yoshida, K., Punchochar, M.,& Drahos, J. (1997). Diagnosis of chaotic dynamics of bubblemotion in a bubble column. Chemical Engineering Science, 52,3741}3745.
418 Y. Kang et al. / Chemical Engineering Science 55 (2000) 411}419
Krishna, R., Wilkinson, P. M., & van Dierendonck, L. L. (1991).A model for gas holdup in bubble columns incorporating thein#uence of gas density on #ow regime transitions. Chemical Engin-eering Science, 46, 2491}2496.
LaNauze, R. D., & Harris, I. J. (1974). Gas bubble formation at theelevated system pressure. Transactions of the Institute of ChemicalEngineers, 45, 337}348.
Letzel, H. M., Schouten, J. C., van den Bleek, C. M., & Krishna, R.(1997). In#uence of elevated pressure on the stability of bubble#ows. Chemical Engineering Science, 52, 3733}3739.
Mansuripur, M. (1987). In Introduction to information theory (pp. 49}62).Englewood Cli!s, NJ: Prentice Hall.
Matsuura, A., & Fan, L. S. (1984). Distribution of bubble properties ina gas}liquid}solid #uidized bed. A.I.Ch.E. Journal, 30, 894}903.
Oyenaar, M. H., Bos, R., & Westerterp, K. R. (1991). Interfacial areasand gas hold-ups in gas}liquid contactors at elevated pressures from0.1 to 0.8 MPa. Chemical Engineering Science, 46, 1217}1231.
Packard, N. H., Crutch#eld, J. P., Farmer, J. D., & Shaw, R. S. (1980).Physics Review Letters, 45, 712}716.
Roux, J. C., Simoyi, R. H., & Swinney, H. L. (1983). Physica D, 8, 257}261.Schumpe, A. (1993). Pressure e!ects on slurry bubble column perfor-
mance. Private paper.Tarmy, B. L., Chang, M., Coulaloglou, C. A., & Ponzi, P. R. (1984).
Three phase hydrodynamic characteristics of the EDS coal liquefac-
tion reactors. Proceedings of the eighth International SymposiumChemical Reaction and Engineering, (pp. 303}317).
Tsuge, H., & Hibino, S. (1983). Bubble formation from an ori"cesubmerged in liquids. Chemical Engineering Communication, 22,63}79.
Van der Stappen, M. L. M., Schouten, J. C., & Van der Bleek, C. M.(1992). Application of deterministic Chaos theory in understandingthe #uid dynamics behavior of gas}liquid #uidization. A.I.Ch.ESymposium Series, 89(296), 91}102.
Wilkinson, P. M., & van Dierendonck, L. L. (1990). Pressure and gasdensity e!ects on bubble break-up and gas hold-up in bubblecolumns. Chemical Engineering Science, 45, 2309}2315.
Wilkinson, P. M., Spek, A. P., & van Dierendonck, L. L. (1992). Designparameters estimation for scale-up of high pressure bubble columns.A.I.Ch.E. Journal, 38, 544}554.
Wilkinson, P. M., Van schayk, A., & Spronken, J. P. M. (1993). Thein#uence of gas density and liquid properties on bubble breakup.Chemical Engineering Science, 48, 1213}1226.
Yu, Y. H., & Kim, S. D. (1988). Bubble characteristics in the radialdirection of three-phase #uidized beds. A.I.Ch.E. Journal, 34,2069}2072.
Yu, Y. H., & Kim, S. D. (1991). Bubble properties and local liquidvelocity in radial direction of cocurrent gas-liquid #ow. ChemicalEngineering Science, 46, 313}320.
Y. Kang et al. / Chemical Engineering Science 55 (2000) 411}419 419