btd2015 - your place in devtops is finding solutions - not just bugs!
TRANSCRIPT

Andreas Grabner
Your place in DevTOps is not about finding more bugs, but problem solutions
That’s why I ended up talking at BTD
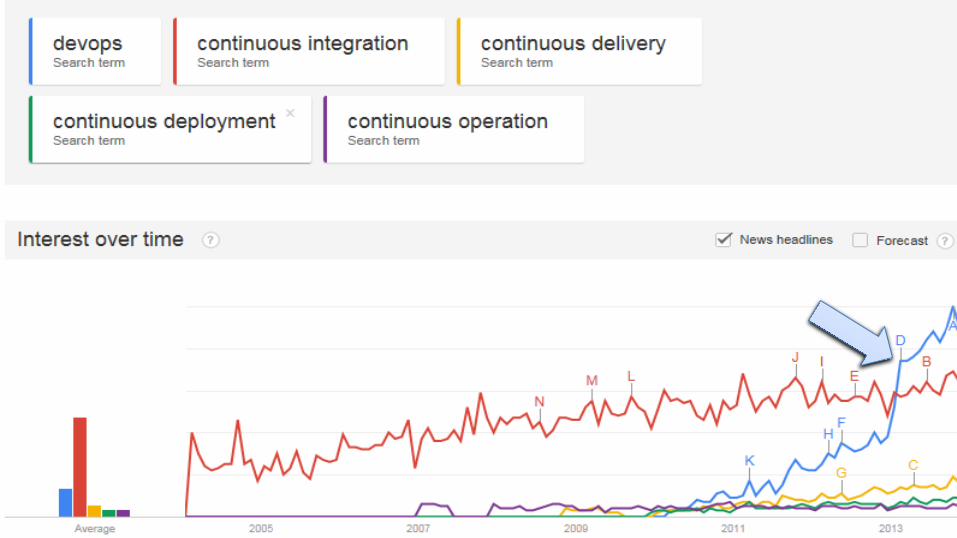

So - Some call it

Evolution of Software Engineering
My Definition of DevOpsThe stuff we did
when we were a Start Up and we All were
Devs, Testers and Ops


Our Goal?
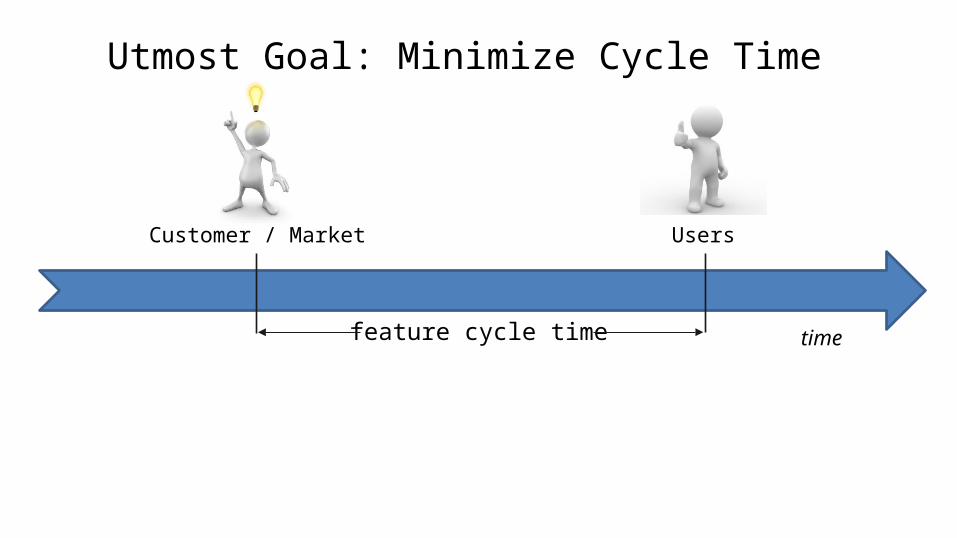
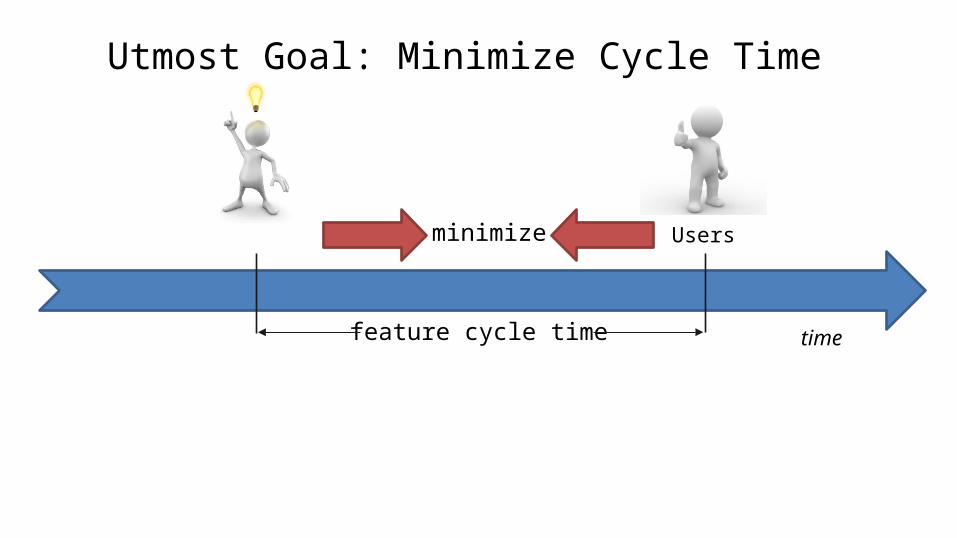
Utmost Goal: Minimize Cycle Time
feature cycle time time
Customer / Market Users
Utmost Goal: Minimize Cycle Time
feature cycle time time
minimize Users
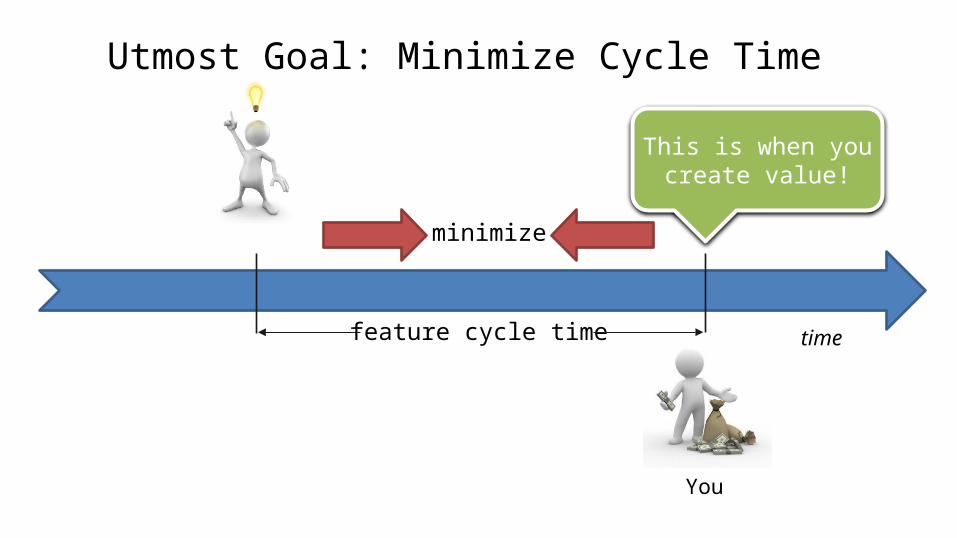
Utmost Goal: Minimize Cycle Time
feature cycle time time
This is when youcreate value!
minimize
You
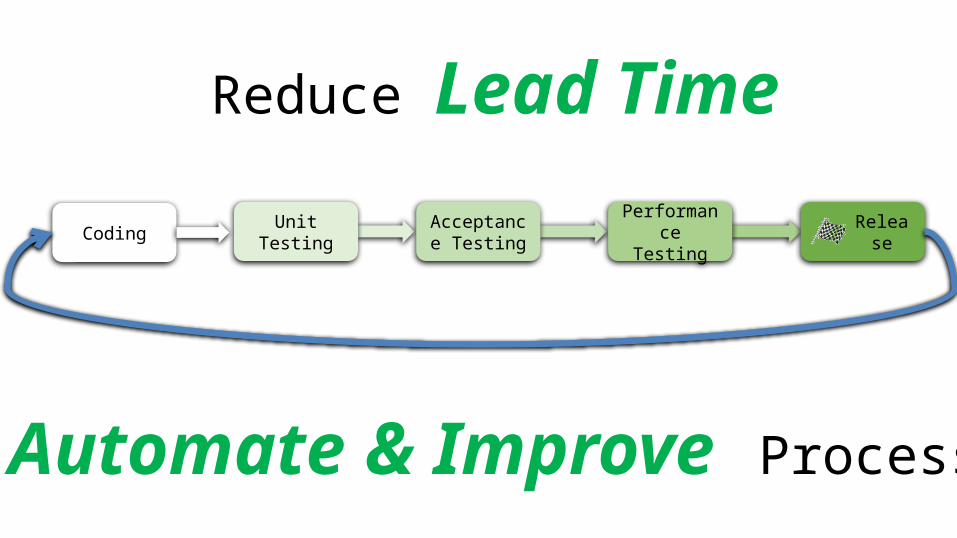
ReleaseAcceptance TestingUnit Testing Performance
TestingCoding
Reduce Lead Time
Automate & Improve Process
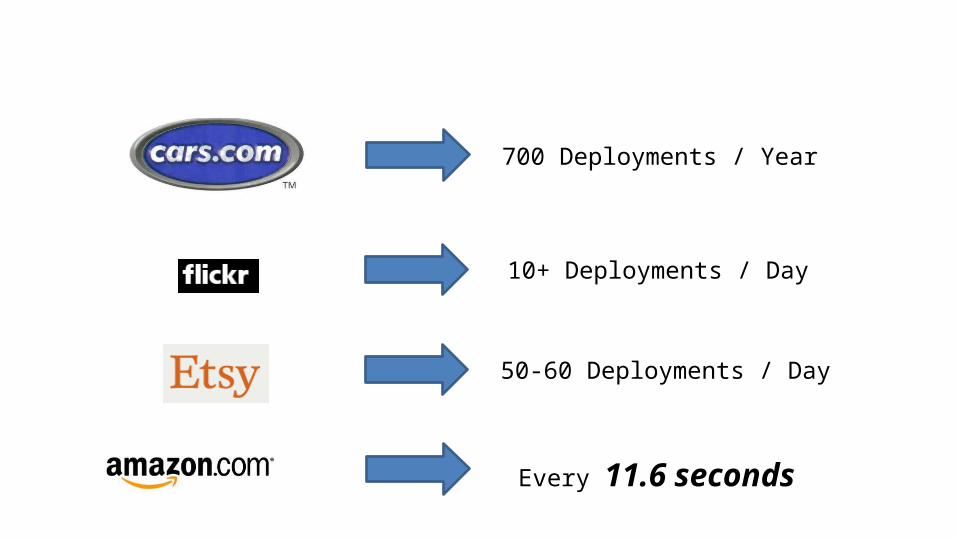
700 Deployments / Year
50-60 Deployments / Day
10+ Deployments / Day
Every 11.6 seconds
Its Possible!!
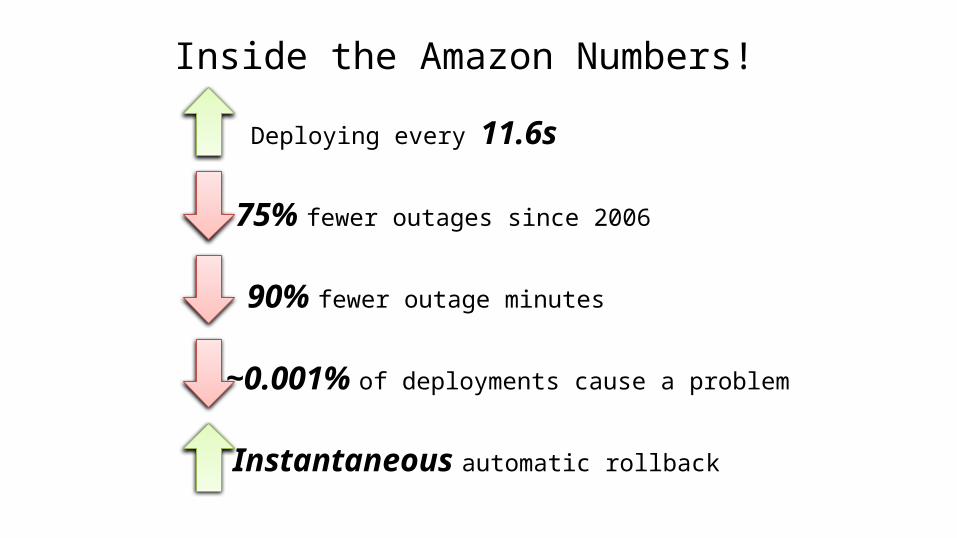
Inside the Amazon Numbers!
75% fewer outages since 2006
90% fewer outage minutes
~0.001% of deployments cause a problem
Instantaneous automatic rollback
Deploying every 11.6s

Challenges?

Deploy Faster!!

Fail Faster!!?

Right Focus?!

Failures happen!!
Nobody likes it when …
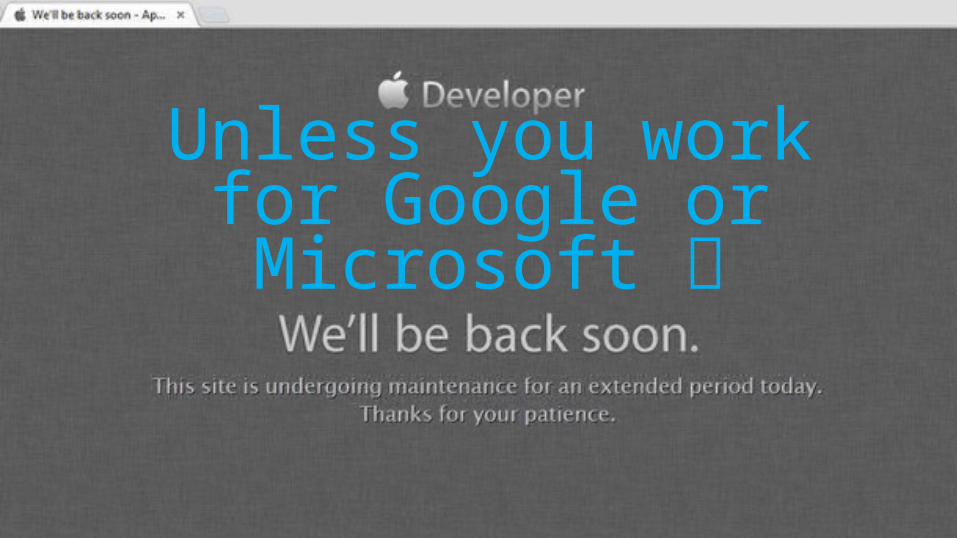
Unless you work for Google or Microsoft

… or this …


.. as it leads to this …
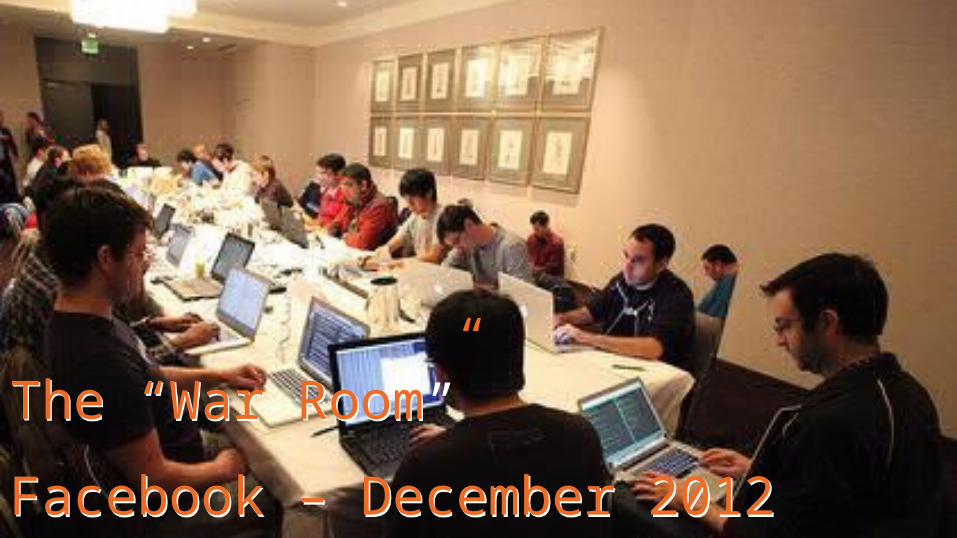
The “War Room”
Facebook – December 2012
The “War Room”
Facebook – December 2012

… and potentially to this …


And this isn’t helping either …


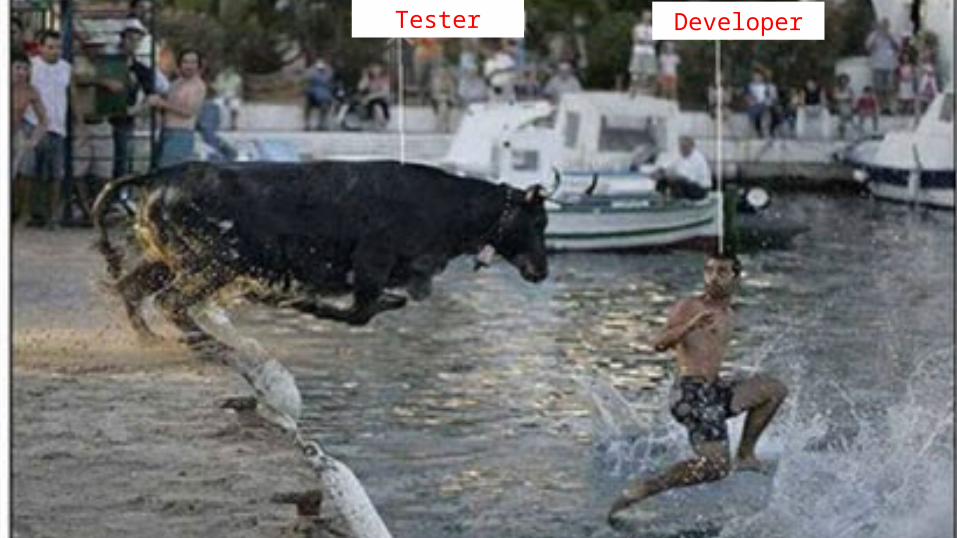
Tester Developer


This ATTITUDE is
the main PROBLEM
as it LEADS to …

80%$60B
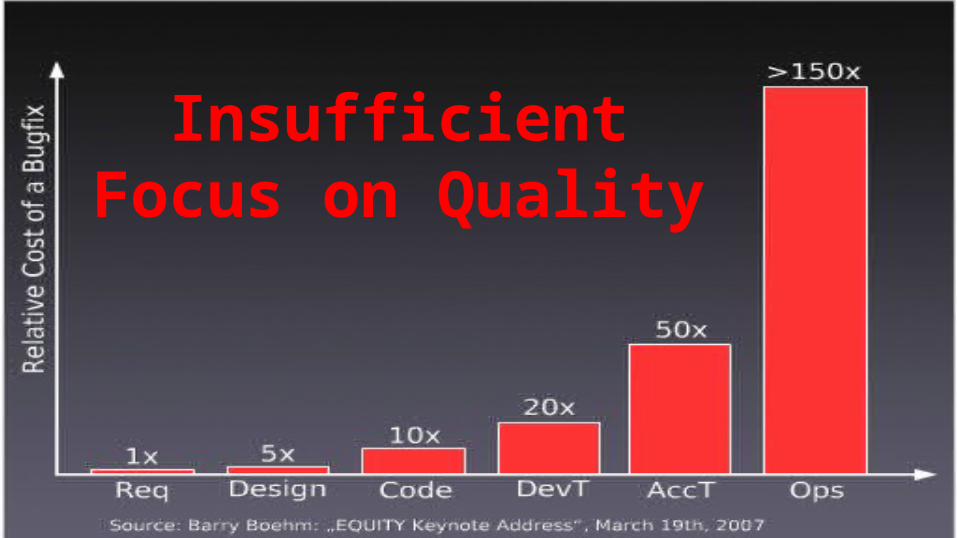
Insufficient Focus on Quality


20%80%


Learning from Others

4 Use Cases:WHY, HOW& METRICS
4 Use Cases:WHY, HOW& METRICS


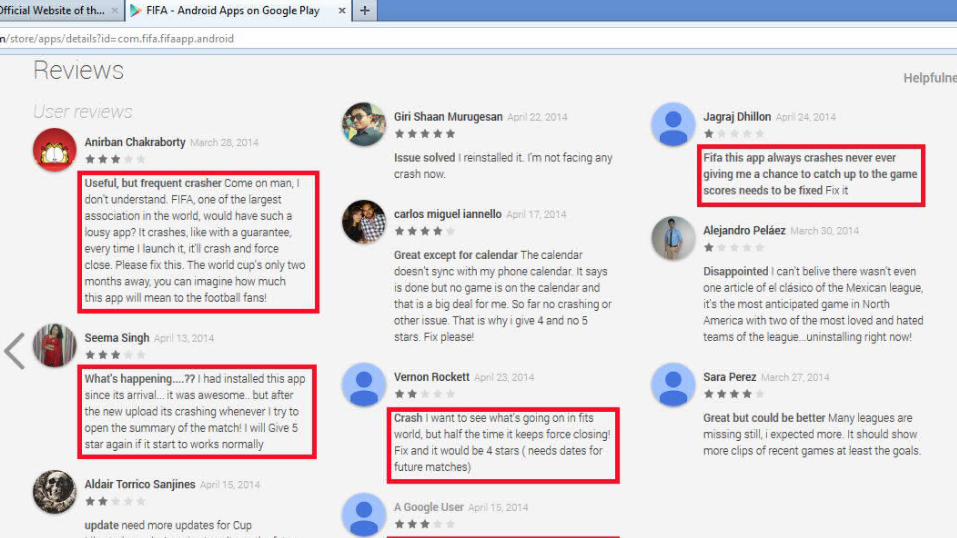
#Push without a Plan
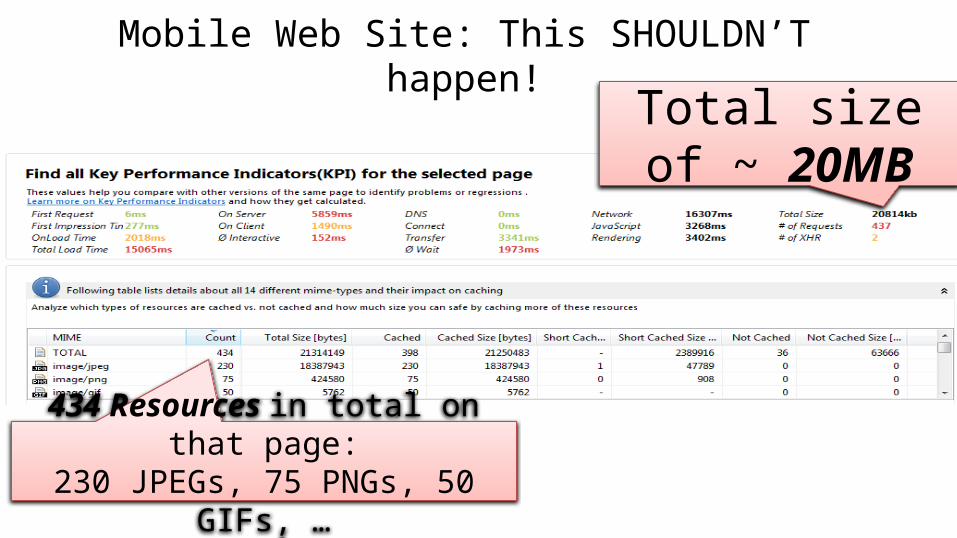
Mobile Web Site: This SHOULDN’T happen!
434 Resources in total on that page:230 JPEGs, 75 PNGs, 50 GIFs, …
Total size of ~ 20MB
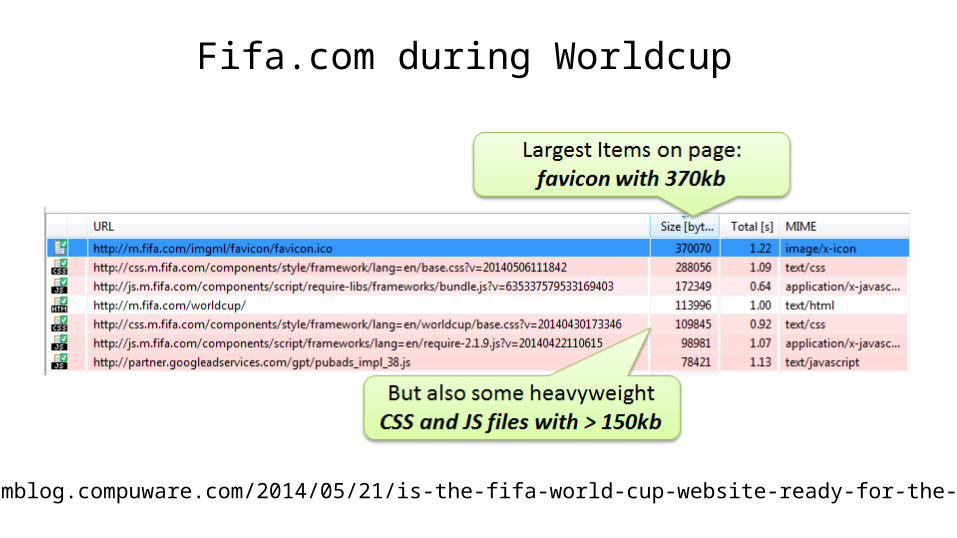
Fifa.com during Worldcup
http://apmblog.compuware.com/2014/05/21/is-the-fifa-world-cup-website-ready-for-the-tournament/

Page SizeItem Size# Objects

• Developers not using the browser built-in diagnostics tools
• Testers not doing a sanity checks with the same tools
• Some tools for you (Quick Demo)• Built-in Inspectors via Ctrl-Shift-I in Chrome and Firefox• YSlow, PageSpeed, SpeedTracer• Dynatrace
• Level-Up: Automate Testing and Diagnostics Check
Lessons Learned – NO Excuse for …


Not every Architect makes good decisions
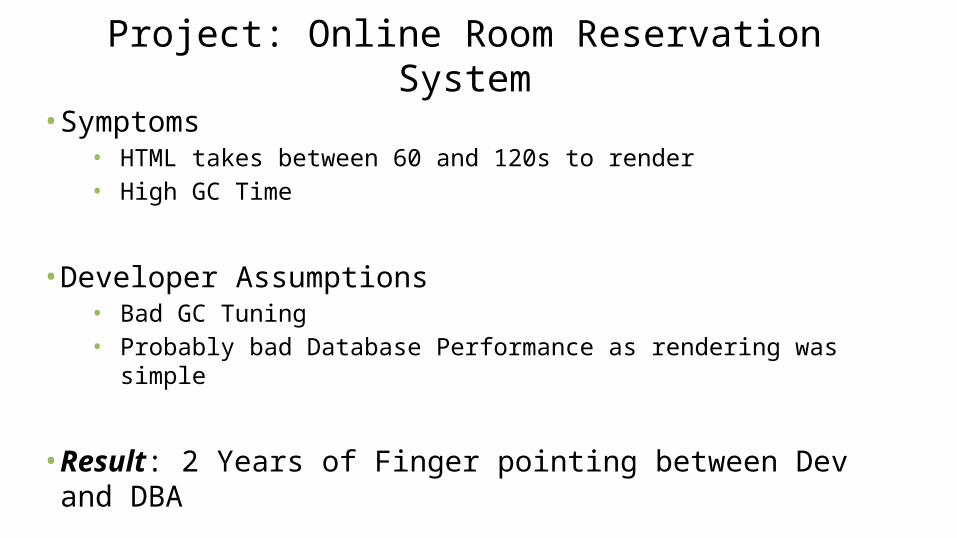
• Symptoms• HTML takes between 60 and 120s to render• High GC Time
• Developer Assumptions• Bad GC Tuning• Probably bad Database Performance as rendering was simple
• Result: 2 Years of Finger pointing between Dev and DBA
Project: Online Room Reservation System
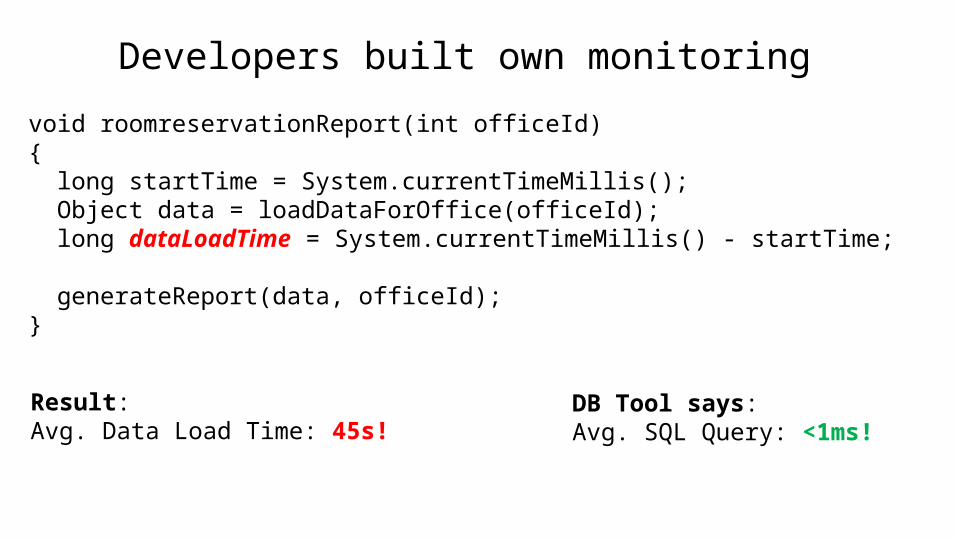
Developers built own monitoring
void roomreservationReport(int officeId){ long startTime = System.currentTimeMillis(); Object data = loadDataForOffice(officeId); long dataLoadTime = System.currentTimeMillis() - startTime; generateReport(data, officeId);}
Result:Avg. Data Load Time: 45s!
DB Tool says:Avg. SQL Query: <1ms!
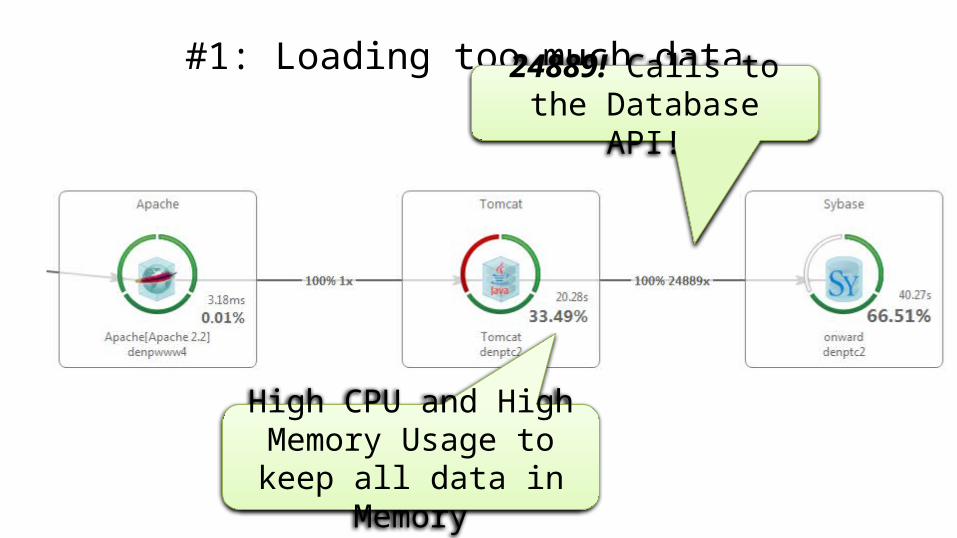
#1: Loading too much data24889! Calls to the
Database API!
High CPU and High Memory Usage to keep all
data in Memory
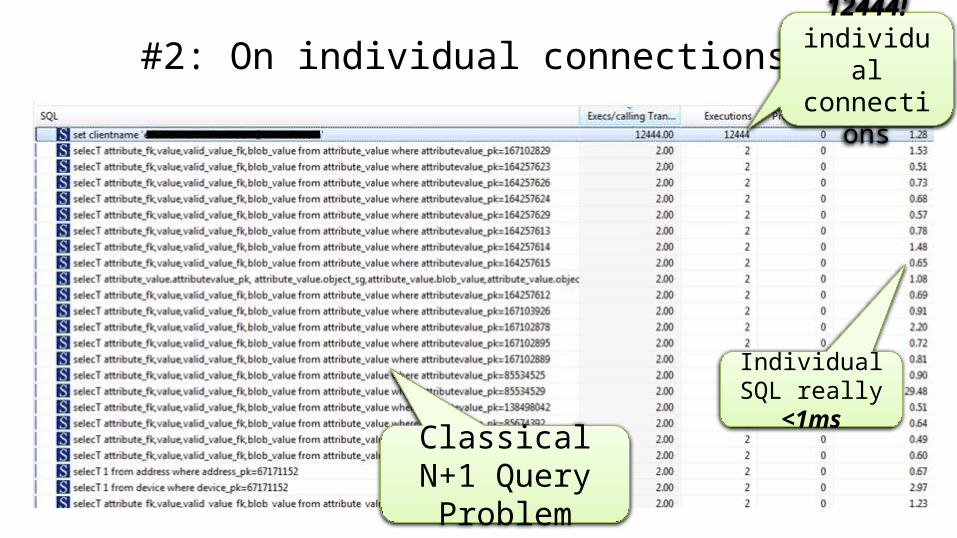
#2: On individual connections 12444! individual
connections
Classical N+1 Query Problem
Individual SQL really <1ms

#3: Putting all data in temp Hashtable
Lots of time spent in
Hashtable.get
Called from their Entity Objects

# SQL Executions# of SAME SQLs
Conn. Acquisition Time
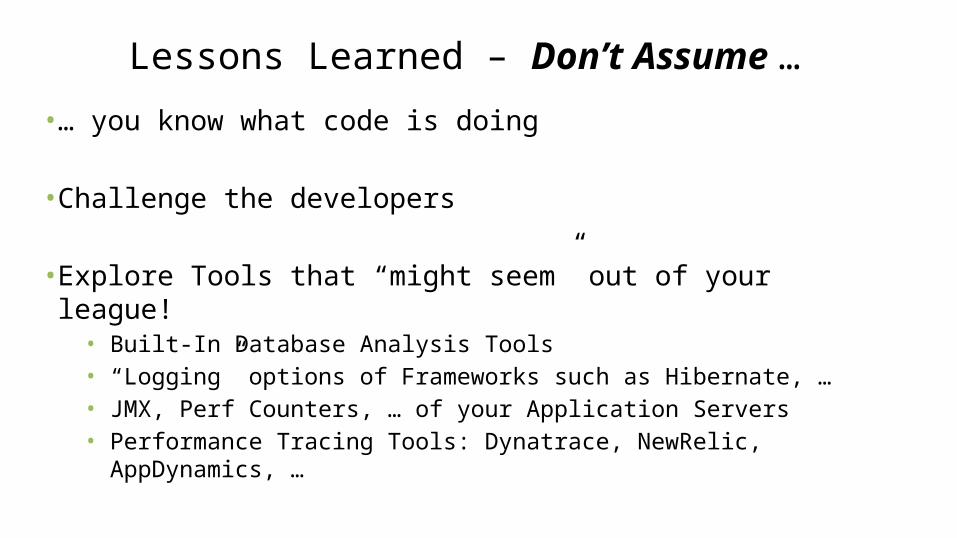
• … you know what code is doing
• Challenge the developers
• Explore Tools that “might seem” out of your league!• Built-In Database Analysis Tools• “Logging” options of Frameworks such as Hibernate, …• JMX, Perf Counters, … of your Application Servers• Performance Tracing Tools: Dynatrace, NewRelic,
AppDynamics, …
Lessons Learned – Don’t Assume …


“Deployment” Gone Bad!
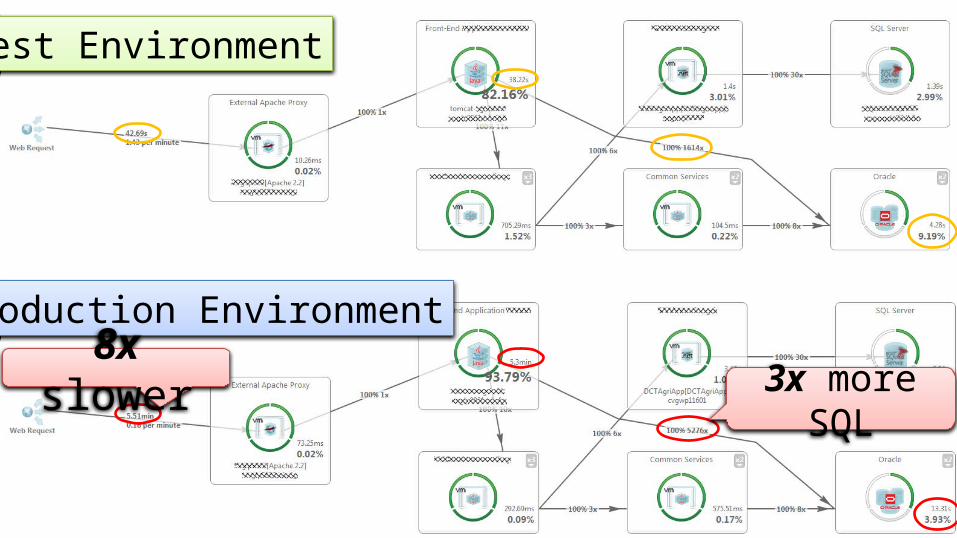
Test Environment
Production Environment
8x slower3x more SQL
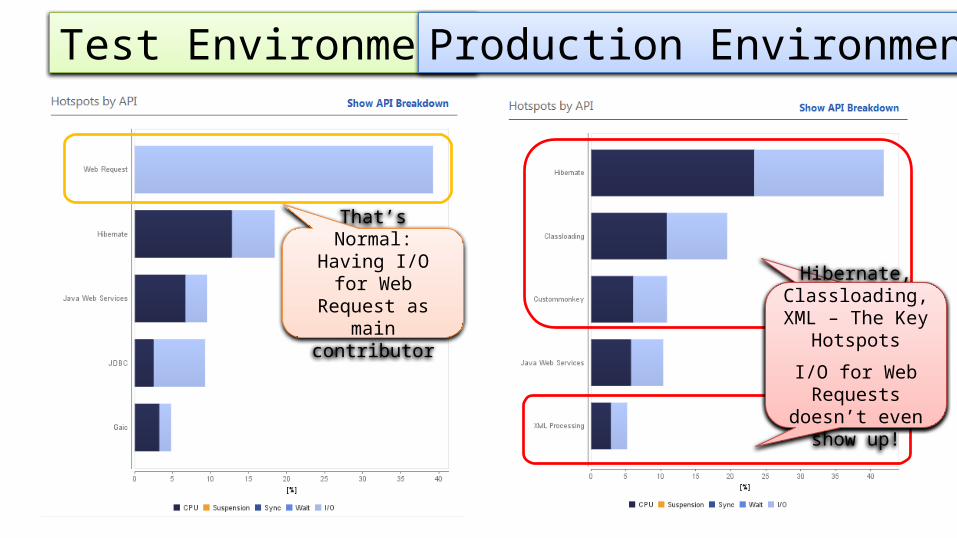
Test Environment Production Environment
Hibernate, Classloading,
XML – The Key Hotspots
Hibernate, Classloading, XML
– The Key Hotspots
I/O for Web Requests doesn’t
even show up!
That’s Normal: Having I/O for Web
Request as main contributor
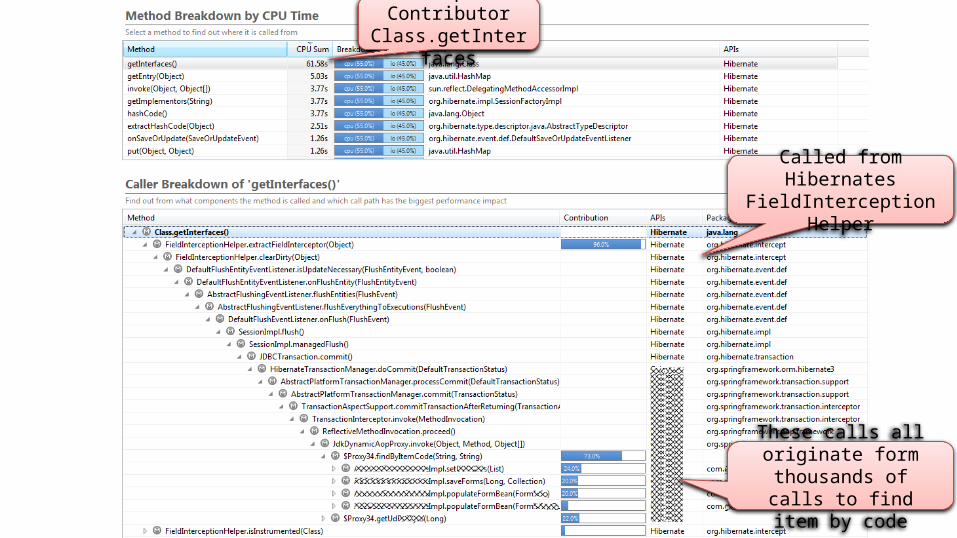
Top Contributor Class.getInterfaces
Called from Hibernates FieldInterceptionHelper
These calls all originate form thousands of calls to
find item by code
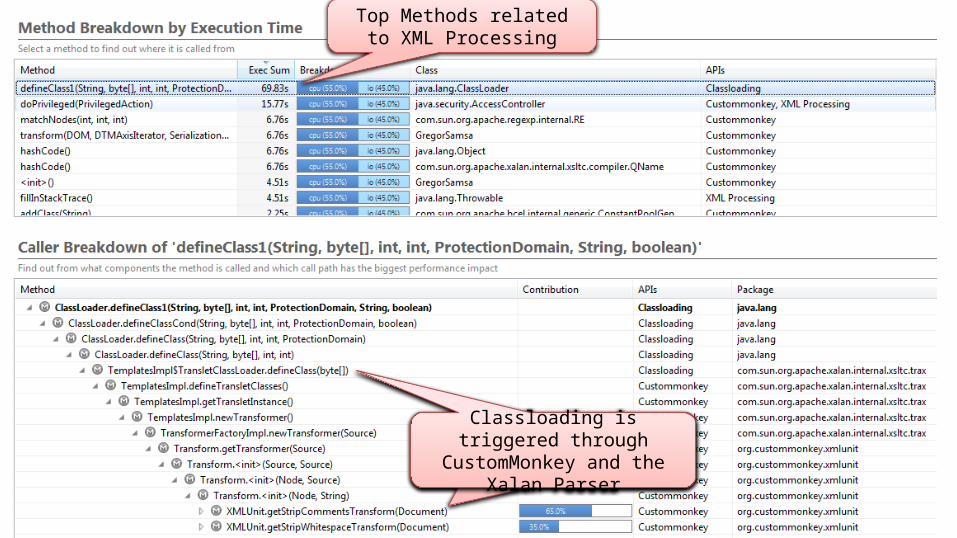
Top Methods related to XML Processing
Classloading is triggered through CustomMonnkey and the Xalan
Parser
Classloading is triggered through CustomMonkey and the Xalan
Parser
Time Spent in API# Calls to API
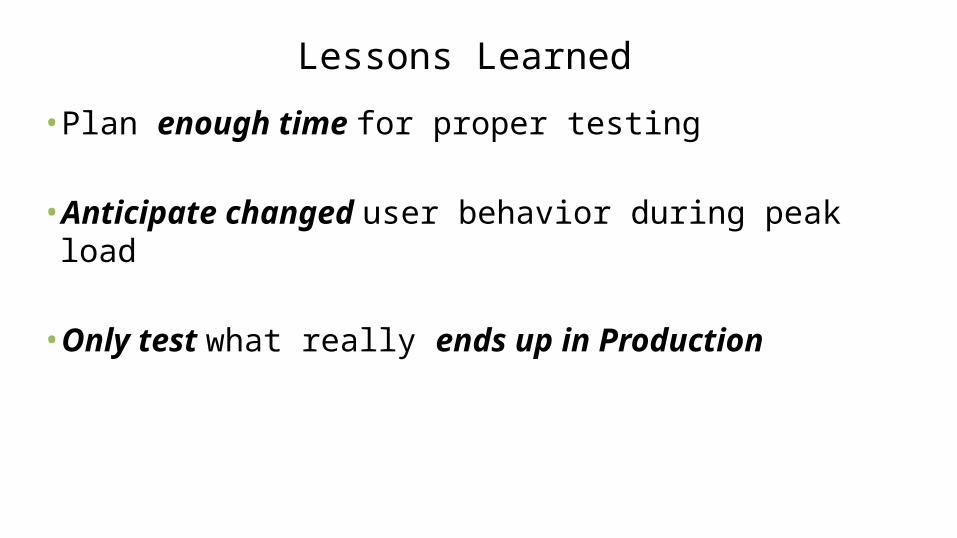
• Plan enough time for proper testing
• Anticipate changed user behavior during peak load
• Only test what really ends up in Production
Lessons Learned

12 000 000 $
#No “Agile” Deployment
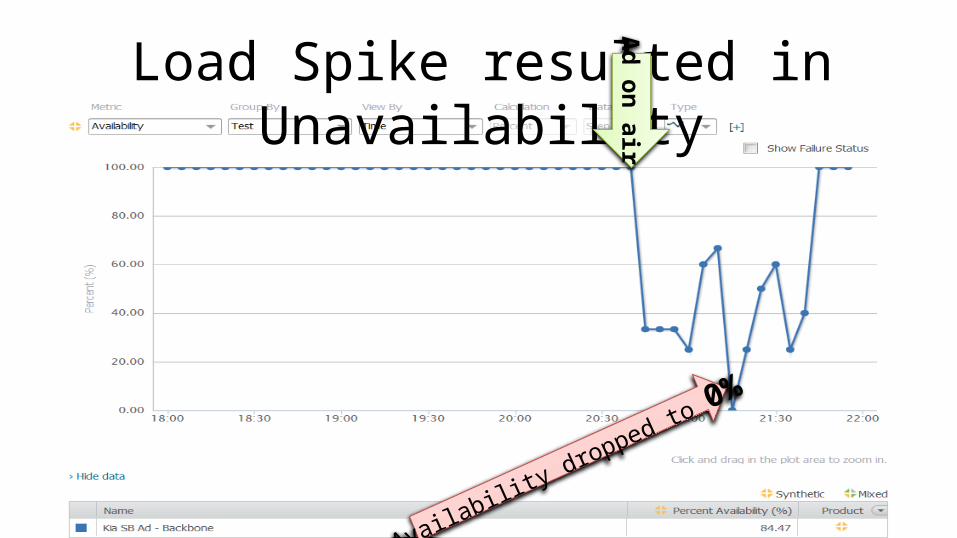
Availability dropped to 0%
Load Spike resulted in UnavailabilityAd on air
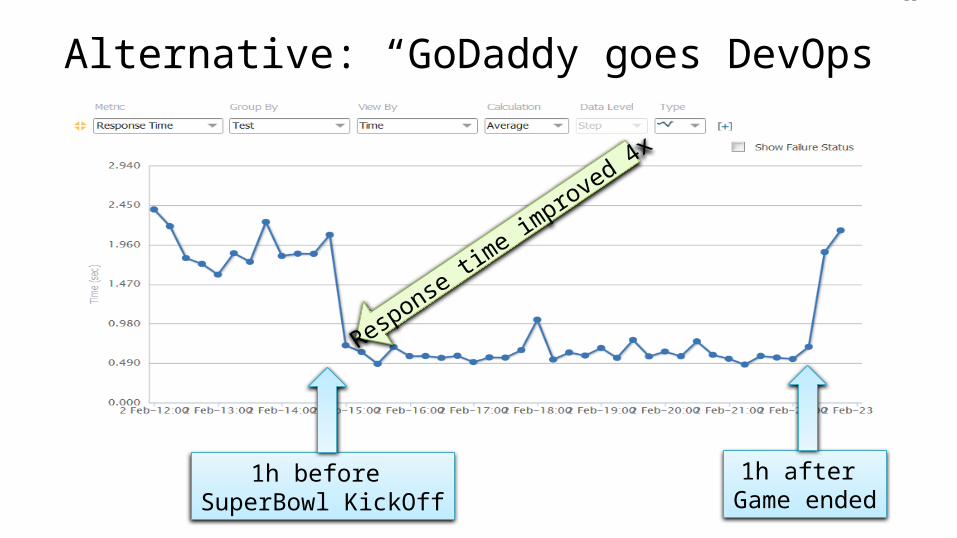
Alternative: “GoDaddy goes DevOps”
Response time improved 4x
1h before SuperBowl KickOff
1h after Game ended

# of DomainsTotal Size
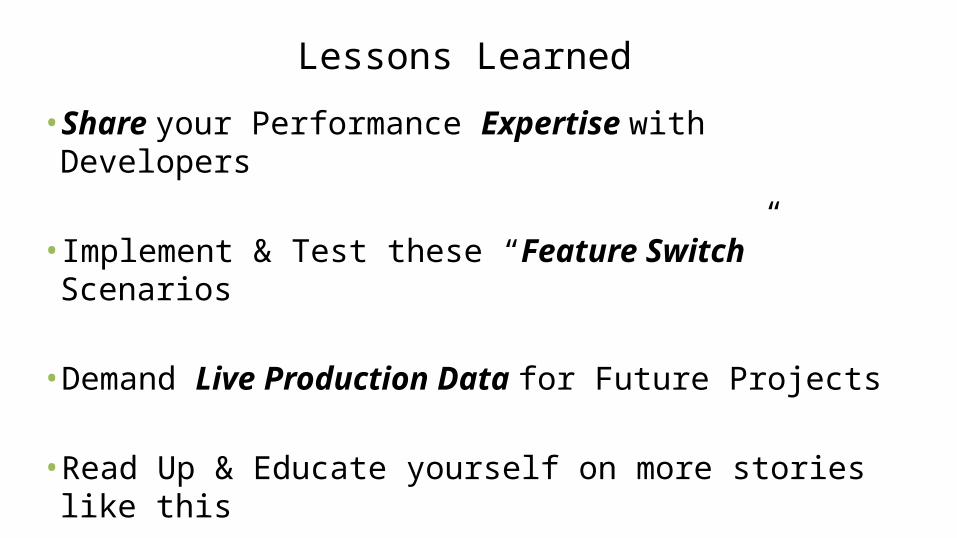
• Share your Performance Expertise with Developers
• Implement & Test these “Feature Switch” Scenarios
• Demand Live Production Data for Future Projects
• Read Up & Educate yourself on more stories like this
Lessons Learned
•http://blog.dynatrace.com•http://www.perfplanet.com/•http://highscalability.com/ •http://blog.ruxit.com/
More of these Use Cases?

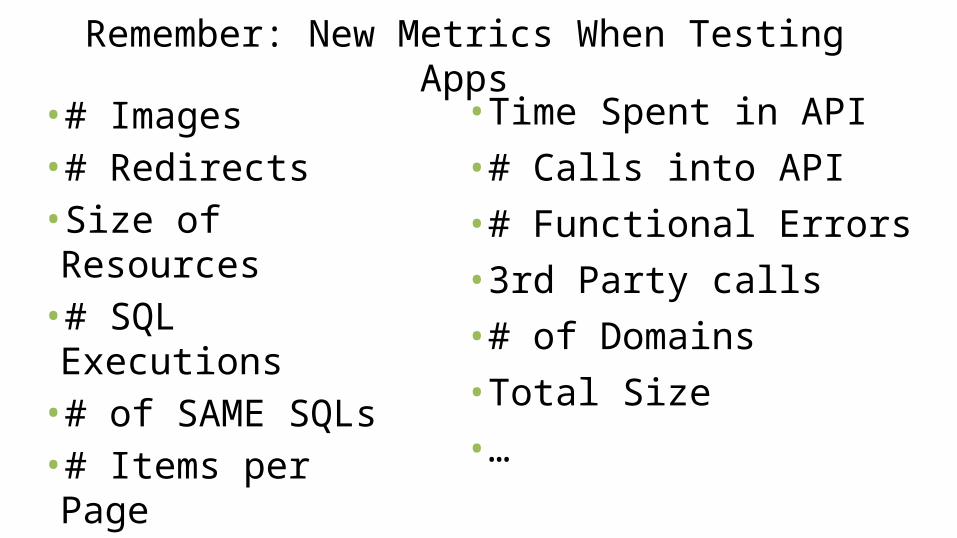
•# Images•# Redirects•Size of Resources•# SQL Executions•# of SAME SQLs•# Items per Page•# AJAX per Page
Remember: New Metrics When Testing Apps•Time Spent in API
•# Calls into API
•# Functional Errors
•3rd Party calls
•# of Domains
•Total Size
•…

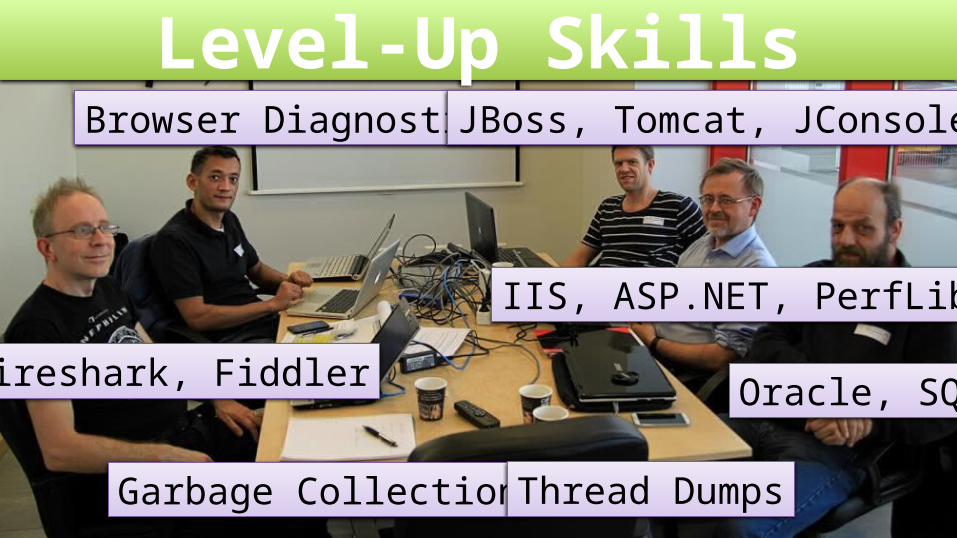
Level-Up SkillsBrowser Diagnostics
Wireshark, Fiddler
JBoss, Tomcat, JConsole
IIS, ASP.NET, PerfLib
Oracle, SQL
Garbage Collection Thread Dumps
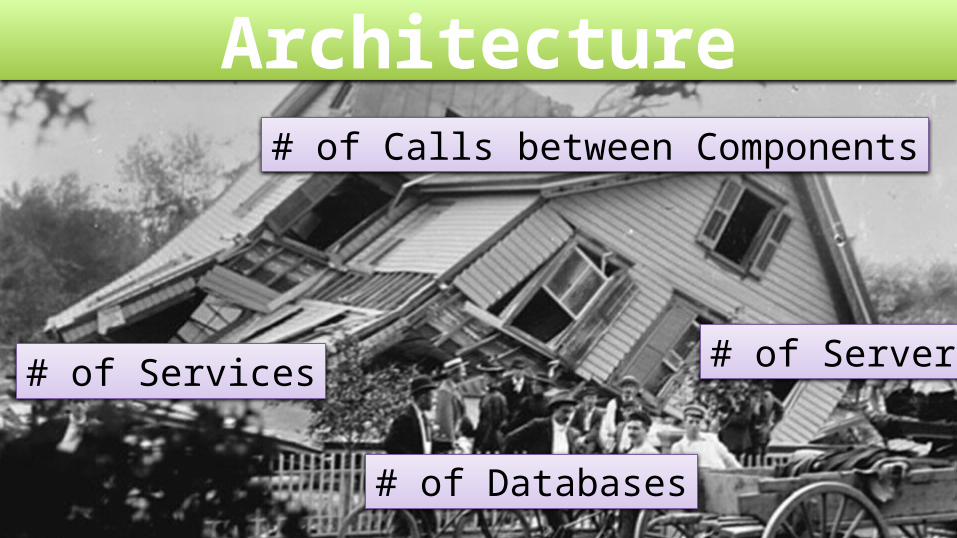
Architecture
# of Services
# of Databases
# of Servers
# of Calls between Components
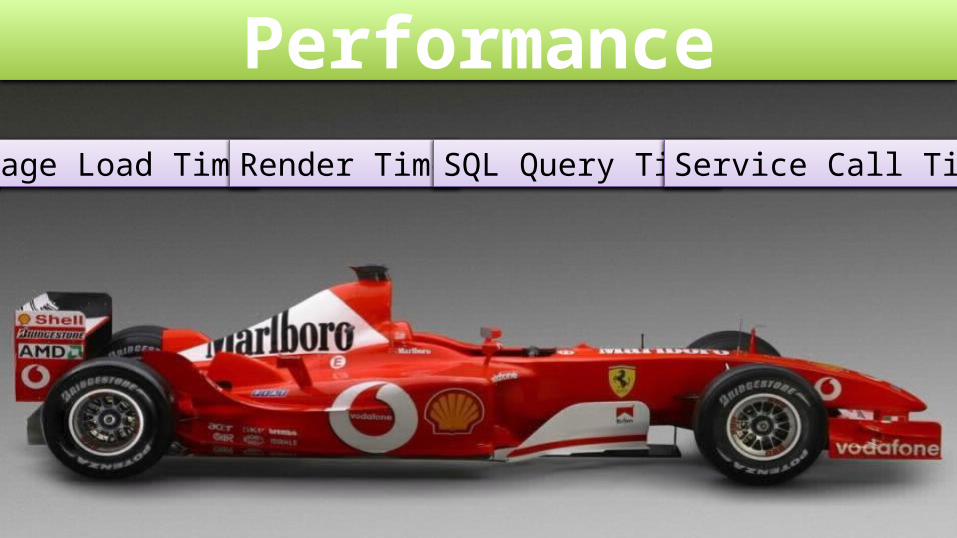
PerformancePage Load Time Render Time SQL Query Time Service Call Time
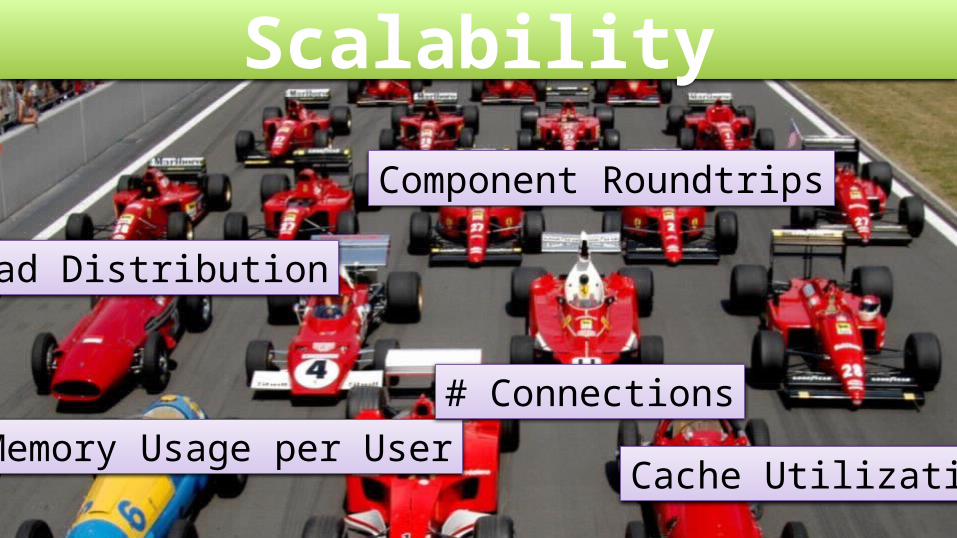
Scalability
Memory Usage per User# Connections
Cache Utilization
Load Distribution
Component Roundtrips
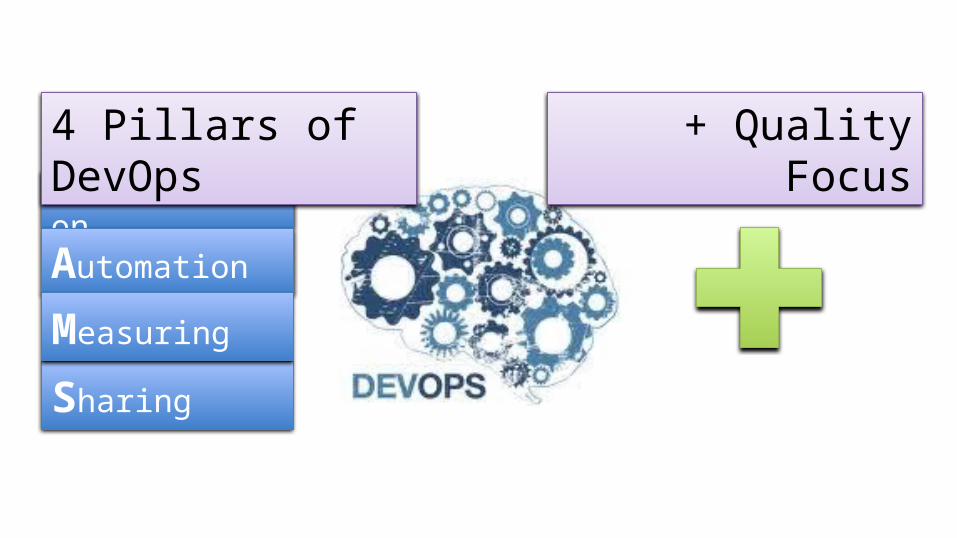
Collaboration
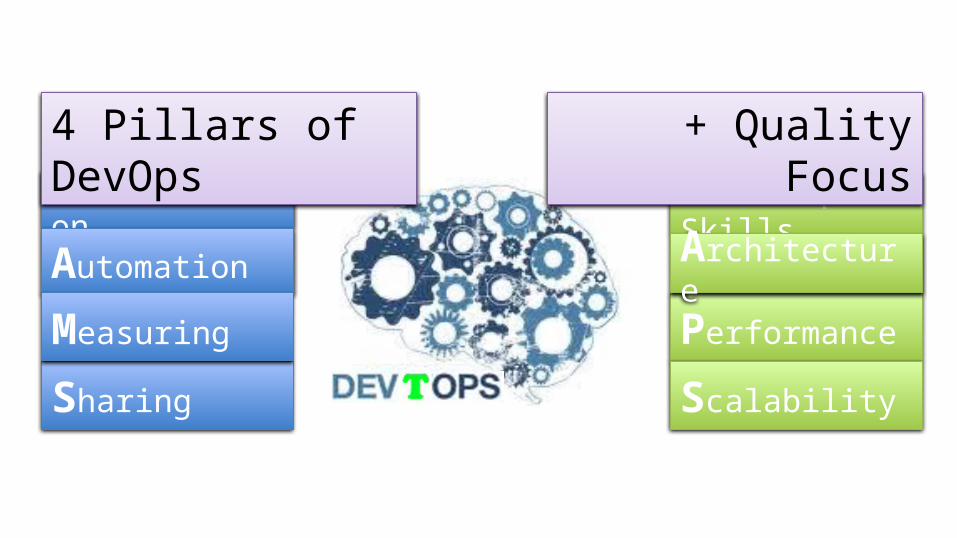
Automation
Sharing
Measuring
Level-Up Skills
Performance
Scalability
Architecture
4 Pillars of DevOps + Quality Focus

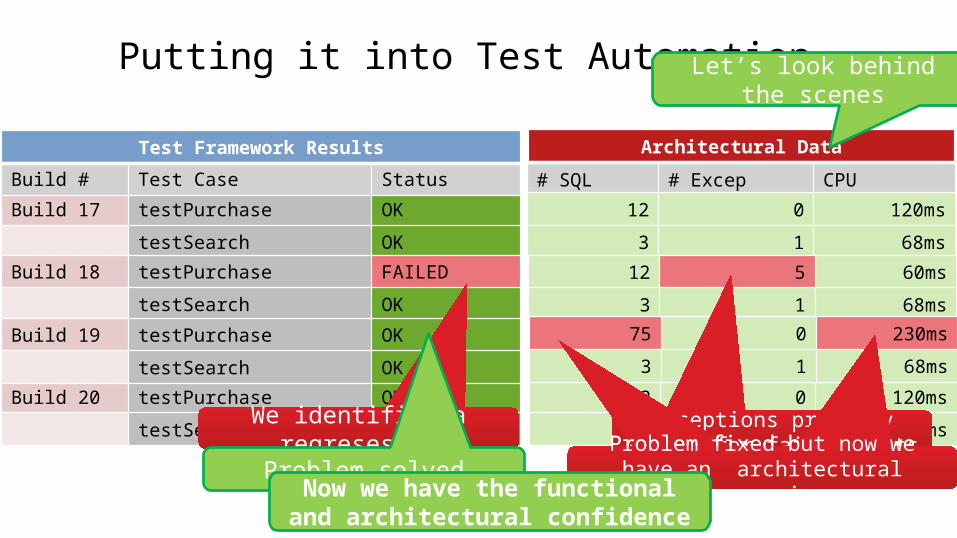
Putting it into Test Automation
12 0 120ms
3 1 68ms
Build 20 testPurchase OK
testSearch OK
Build 17 testPurchase OK
testSearch OK
Build 18 testPurchase FAILED
testSearch OK
Build 19 testPurchase OK
testSearch OK
Build # Test Case Status # SQL # Excep CPU
12 0 120ms
3 1 68ms
12 5 60ms
3 1 68ms
75 0 230ms
3 1 68ms
Test Framework Results Architectural Data
We identified a regresesion
Problem solved
Exceptions probably reason for failed testsProblem fixed but now we have an
architectural regressionProblem fixed but now we have an
architectural regressionNow we have the functional and architectural confidence
Let’s look behind the scenes
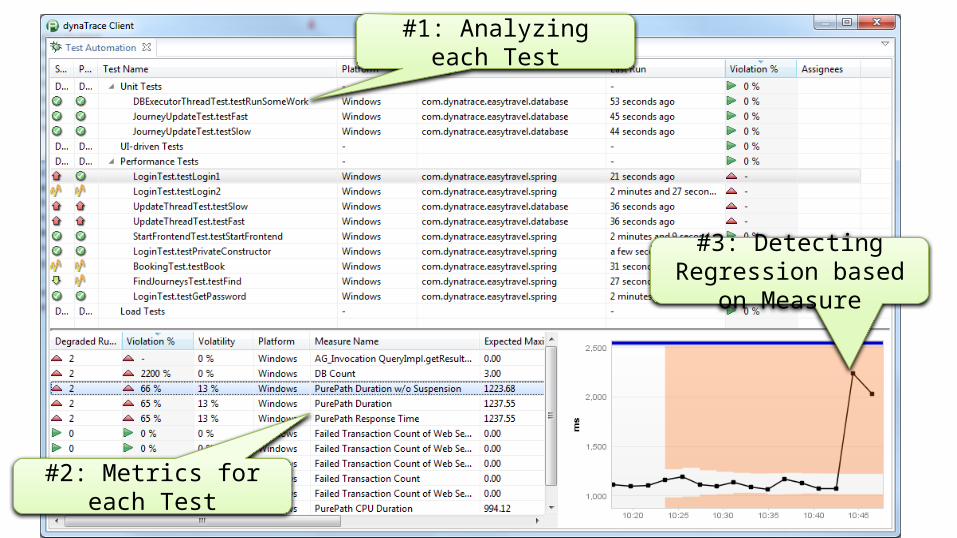
#1: Analyzing each Test
#2: Metrics for each Test
#3: Detecting Regression based on Measure
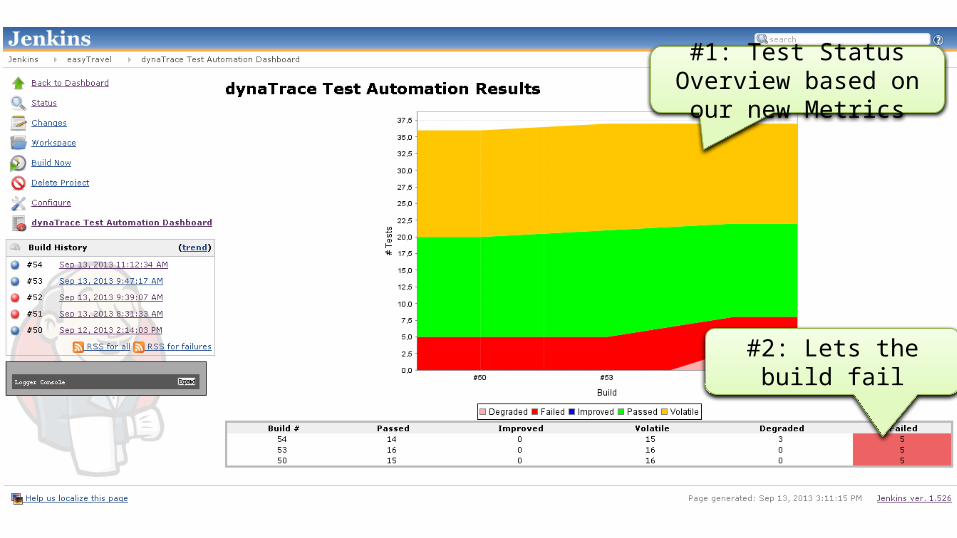
#1: Test Status Overview based on our new Metrics
#2: Lets the build fail
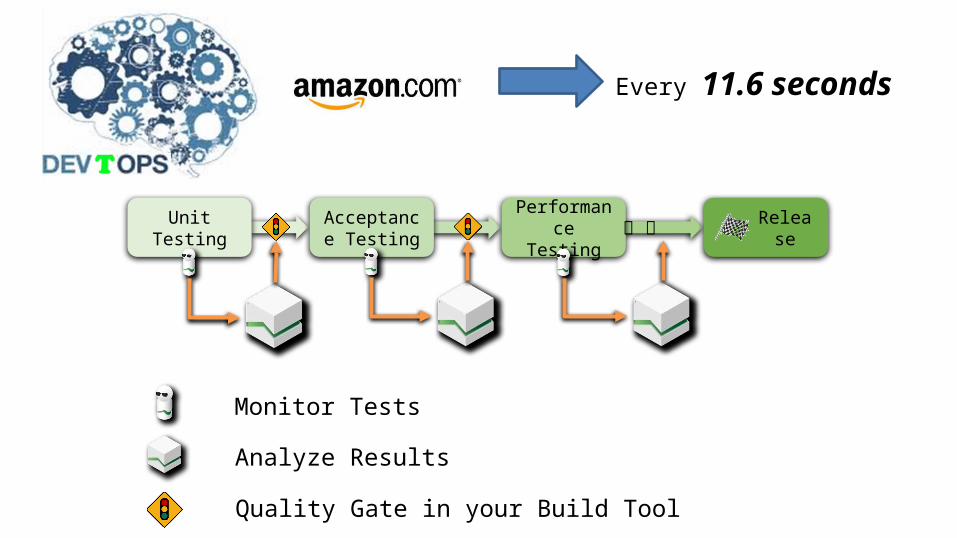
ReleaseAcceptance TestingUnit Testing Performance
Testing
Monitor Tests
Analyze Results
Quality Gate in your Build Tool
Every 11.6 seconds

Deploy Faster!! With Better Quality

Andreas Grabner
Your place in DevTOps is not about finding more bugs, but problem solutions
Slides: slideshare.net/grabnerandi
Get Tools: bit.ly/dttrial
YouTube Tutorials: bit.ly/dttutorials
Contact Me: [email protected]
Follow Me: @grabnerandi
Read More: blog.dynatrace.com


Incorrect Sizing of Pools and
Queues
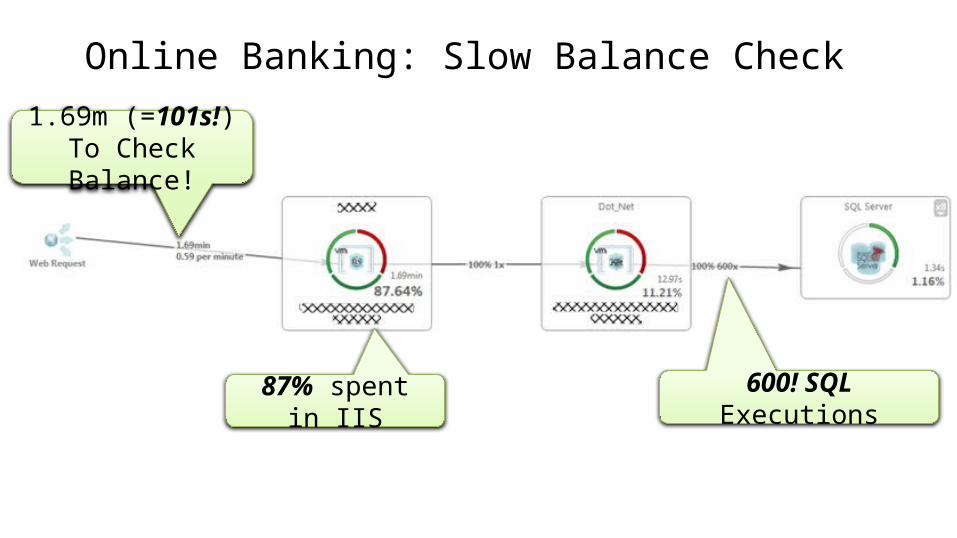
Online Banking: Slow Balance Check
1.69m (=101s!) To Check Balance!
87% spent in IIS 600! SQL Executions
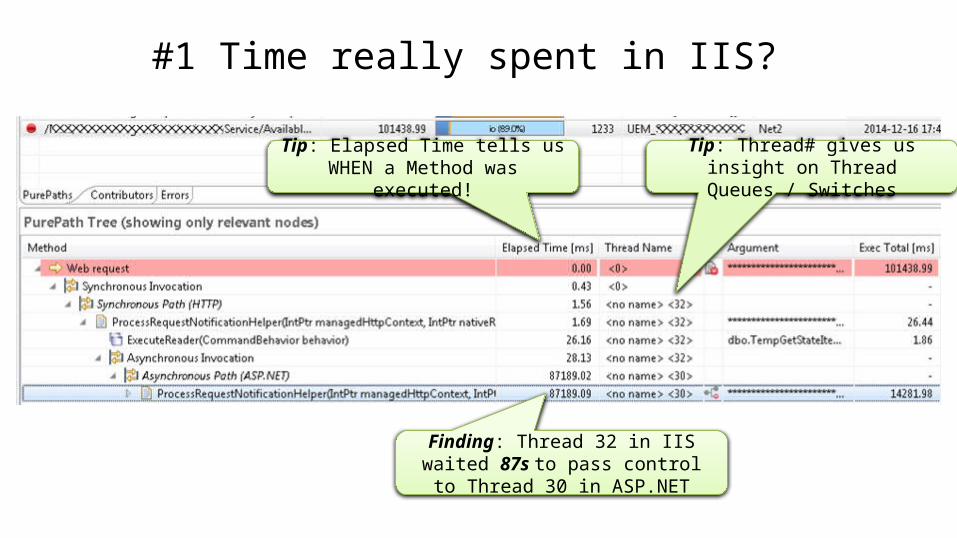
#1 Time really spent in IIS?
Tip: Elapsed Time tells us WHEN a Method was executed!
Finding: Thread 32 in IIS waited 87s to pass control to Thread 30 in ASP.NET
Tip: Thread# gives us insight on Thread Queues / Switches
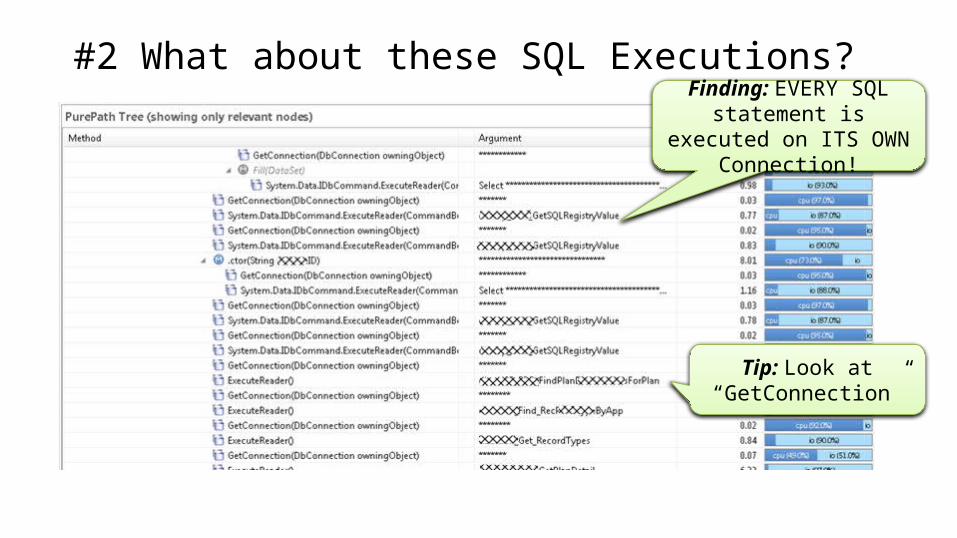
#2 What about these SQL Executions?Finding: EVERY SQL
statement is executed on ITS OWN Connection!
Tip: Look at “GetConnection”
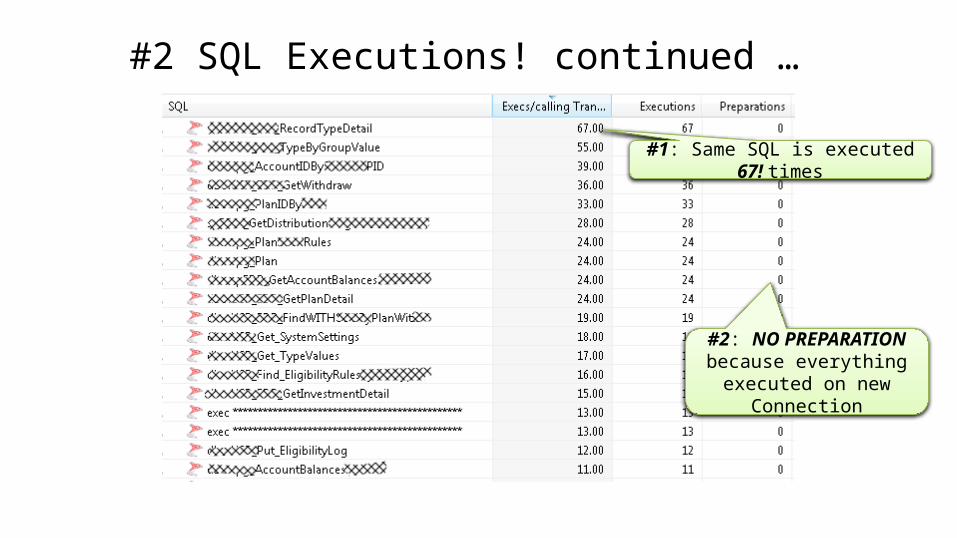
#2 SQL Executions! continued …
#1: Same SQL is executed 67! times
#2: NO PREPARATION because everything
executed on new Connection
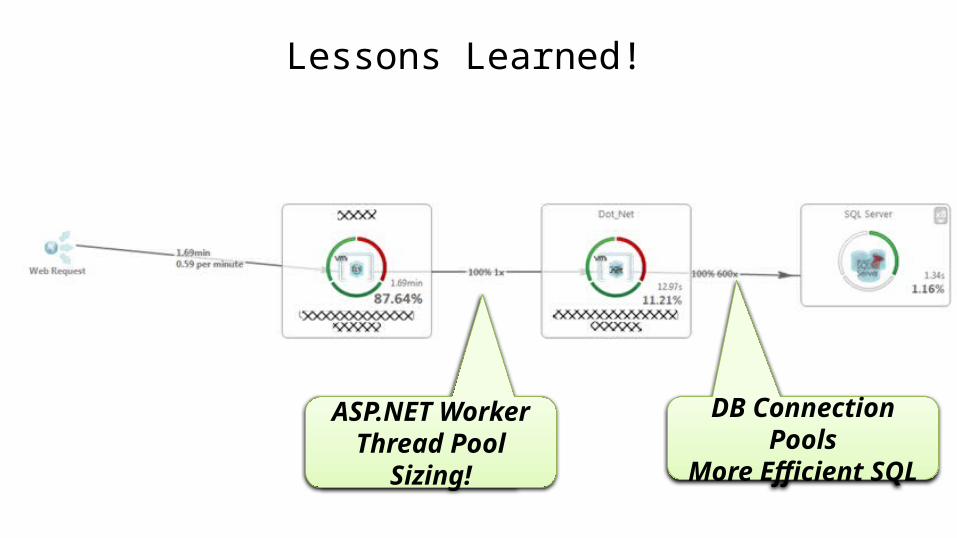
Lessons Learned!
ASP.NET Worker Thread Pool Sizing!
DB Connection PoolsMore Efficient SQL
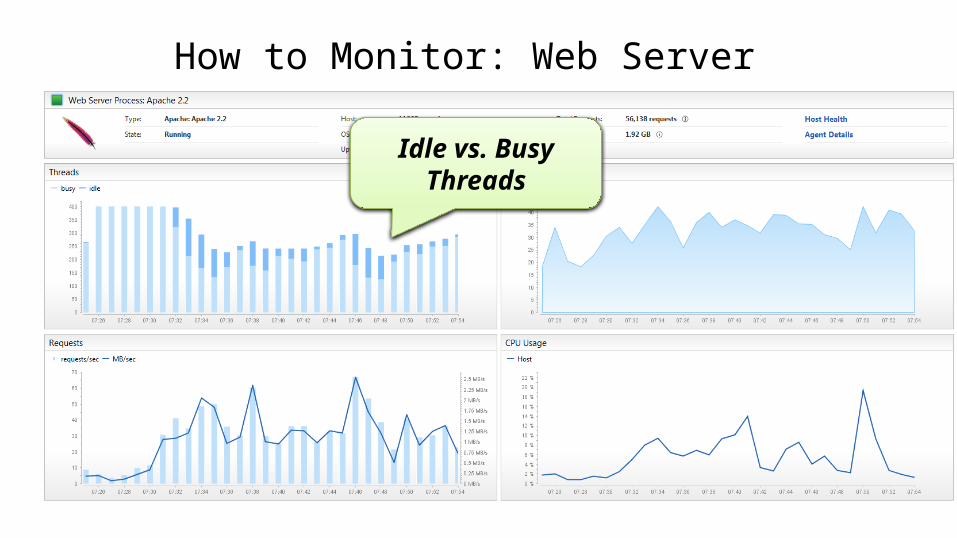
How to Monitor: Web Server
Idle vs. Busy Threads
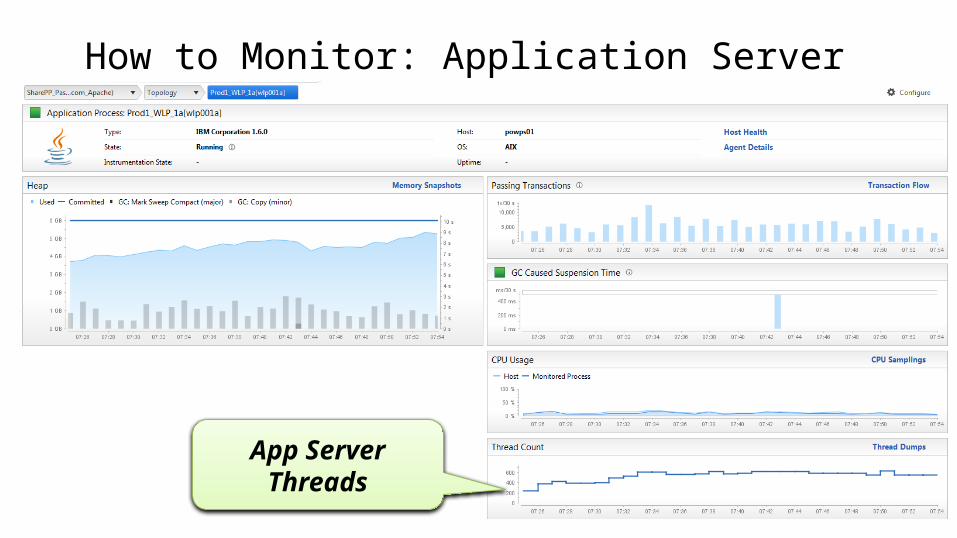
How to Monitor: Application Server
App Server Threads
Idle vs. Busy Threads# SQLs / Request# GetConnection

Collaboration
Automation
Sharing
Measuring
4 Pillars of DevOps + Quality Focus