bruce mayer, pe licensed electrical & mechanical engineer bmayer@chabotcollege
DESCRIPTION
Chabot Mathematics. §1.2 Graphs Of Functions. Bruce Mayer, PE Licensed Electrical & Mechanical Engineer [email protected]. 1.1. Review §. Any QUESTIONS About §1.1 → Introduction to Functions Any QUESTIONS About HomeWork §1.1 → HW-01. §1.2 Learning Goals. - PowerPoint PPT PresentationTRANSCRIPT
[email protected] • MTH15_Lec-02_Fa13_sec_1-2_Fcn_Graphs.pptx1
Bruce Mayer, PE Chabot College Mathematics
Bruce Mayer, PELicensed Electrical & Mechanical Engineer
Chabot Mathematics
§1.2 Graphs
Of Functions

[email protected] • MTH15_Lec-02_Fa13_sec_1-2_Fcn_Graphs.pptx2
Bruce Mayer, PE Chabot College Mathematics
Review §
Any QUESTIONS About• §1.1 → Introduction to Functions
Any QUESTIONS About HomeWork• §1.1 → HW-01
1.1

[email protected] • MTH15_Lec-02_Fa13_sec_1-2_Fcn_Graphs.pptx3
Bruce Mayer, PE Chabot College Mathematics
§1.2 Learning Goals
Review the rectangular coordinate system
Graph several functions Study intersections of graphs, the
vertical line test, and intercepts Sketch and use graphs of quadratic
functions in applications
[email protected] • MTH15_Lec-02_Fa13_sec_1-2_Fcn_Graphs.pptx4
Bruce Mayer, PE Chabot College Mathematics
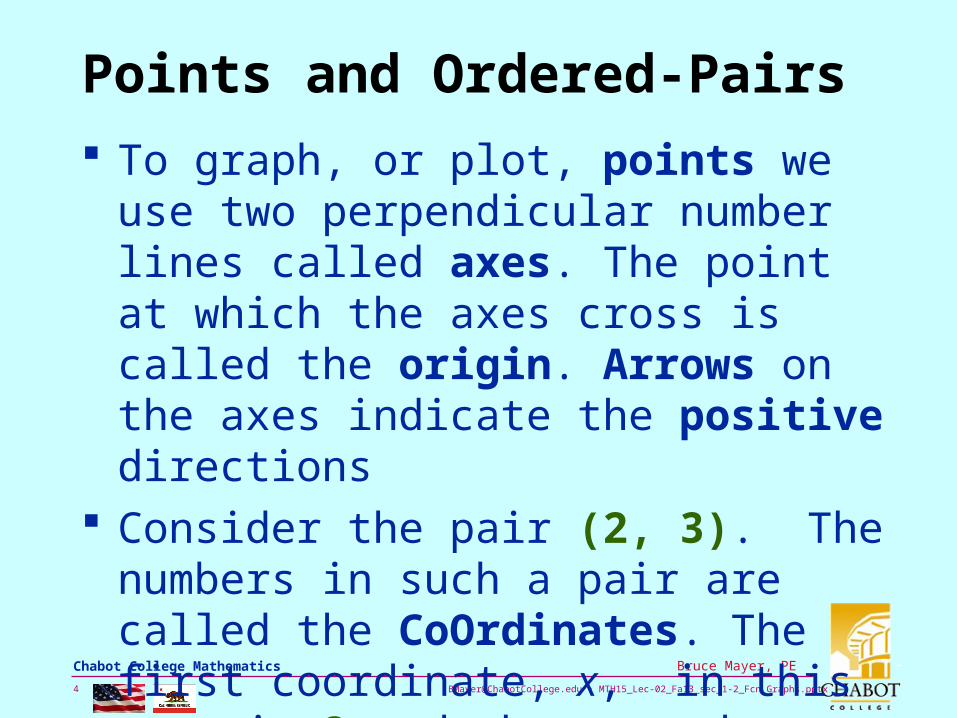
Points and Ordered-Pairs
To graph, or plot, points we use two perpendicular number lines called axes. The point at which the axes cross is called the origin. Arrows on the axes indicate the positive directions
Consider the pair (2, 3). The numbers in such a pair are called the CoOrdinates. The first coordinate, x, in this case is 2 and the second, y, coordinate is 3.
[email protected] • MTH15_Lec-02_Fa13_sec_1-2_Fcn_Graphs.pptx5
Bruce Mayer, PE Chabot College Mathematics
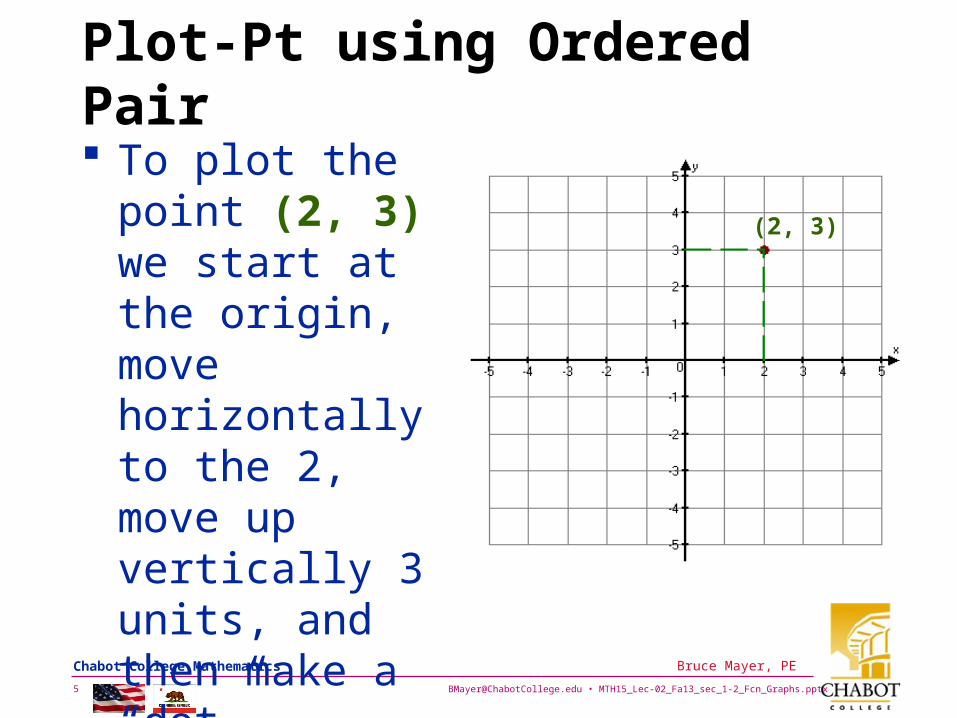
Plot-Pt using Ordered Pair
To plot the point (2, 3) we start at the origin, move horizontally to the 2, move up vertically 3 units, and then make a “dot”• x = 2• y = 3
(2, 3)

[email protected] • MTH15_Lec-02_Fa13_sec_1-2_Fcn_Graphs.pptx6
Bruce Mayer, PE Chabot College Mathematics
Example Plot the point (–4,3)
Starting at the origin, we move 4 units in the negative horizontal direction. The second number, 3, is positive, so we move 3 units in the positive vertical direction (up)• x = –4; y = 3
4 units left
3 u
nit
s u
p

[email protected] • MTH15_Lec-02_Fa13_sec_1-2_Fcn_Graphs.pptx7
Bruce Mayer, PE Chabot College Mathematics
Example Read XY-Plot
Find the coordinates of pts A, B, C, D, E, F, G
AB
C
D
E
F
G
• Solution: Point A is 5 units to the right of the origin and 3 units above the origin. Its coordinates are (5, 3). The other coordinates are as follows: – B: (−2,4)– C: (−3,−4)– D: (3,−2)– E: (2, 3)– F: (−3,0)– G: (0, 2)

[email protected] • MTH15_Lec-02_Fa13_sec_1-2_Fcn_Graphs.pptx8
Bruce Mayer, PE Chabot College Mathematics
Tool For XY Graphing
Called “ Engineering Computation Pad”• Light Green
Backgound• Tremendous Help
with Graphing and Sketching
• Available in Chabot College Book Store
• I use it for ALL my Hand-Work
Graph on this side!
[email protected] • MTH15_Lec-02_Fa13_sec_1-2_Fcn_Graphs.pptx9
Bruce Mayer, PE Chabot College Mathematics
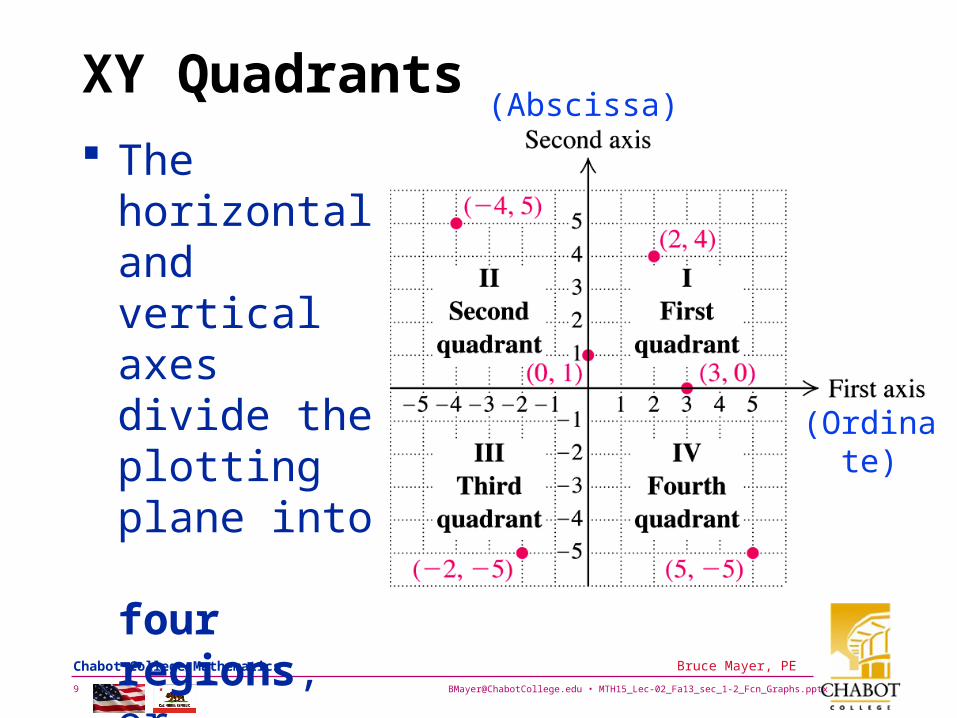
XY Quadrants
The horizontal and vertical axes divide the plotting plane into four regions, or quadrants• Note the
Ordinate & Abscissa
(Ordinate)
(Abscissa)

[email protected] • MTH15_Lec-02_Fa13_sec_1-2_Fcn_Graphs.pptx10
Bruce Mayer, PE Chabot College Mathematics
The Distance Formula
The distance between the points (x1, y1) and (x2, y1) on a horizontal line is |x2 – x1|.
Similarly, the distance between the points (x2, y1) and (x2, y2) on a vertical line is |y2 – y1|.
-6 -5 -4 -3 -2 -1 0 1 2 3 4 5 6-6
-5
-4
-3
-2
-1
0
1
2
3
4
5
6y
O
(-4,-2) (3,-2)
(5,4)
(5,-4)
x
XYGraph6x6HnVdistance.fig
743 Hd
844 Vd

[email protected] • MTH15_Lec-02_Fa13_sec_1-2_Fcn_Graphs.pptx11
Bruce Mayer, PE Chabot College Mathematics
Pythagorean Distance
Now consider any two points (x1, y1) and (x2, y2).
These points, along with (x2, y1), describe a right triangle. The lengths of the legsare |x2 – x1| and |y2 – y1|.
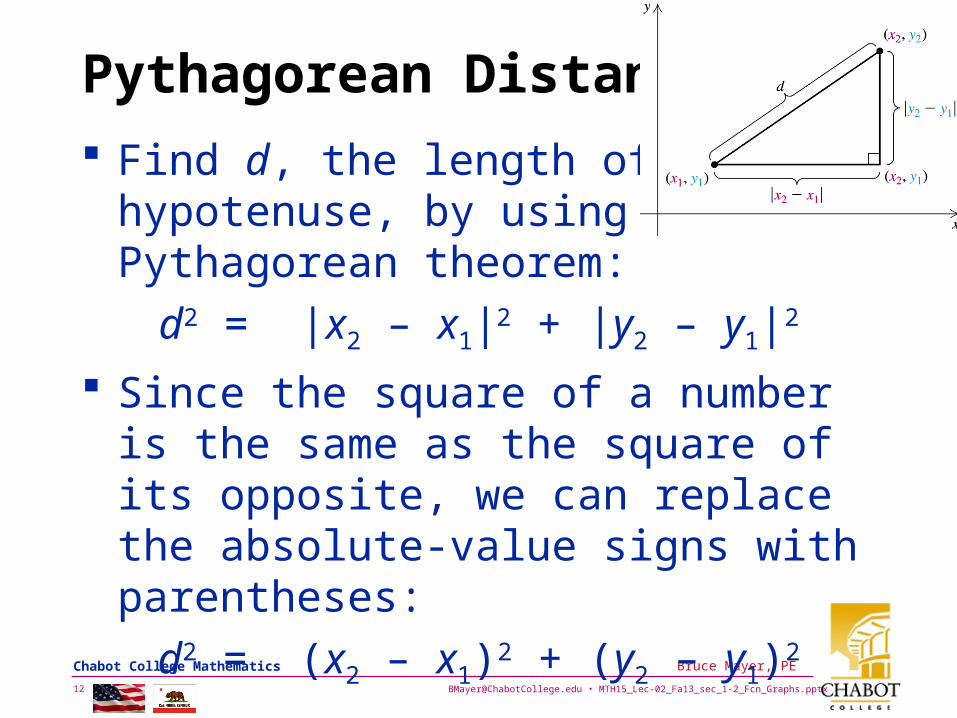
[email protected] • MTH15_Lec-02_Fa13_sec_1-2_Fcn_Graphs.pptx12
Bruce Mayer, PE Chabot College Mathematics
Pythagorean Distance
Find d, the length of the hypotenuse, by using the Pythagorean theorem:
d2 = |x2 – x1|2 + |y2 – y1|2
Since the square of a number is the same as the square of its opposite, we can replace the absolute-value signs with parentheses:
d2 = (x2 – x1)2 + (y2 – y1)2

[email protected] • MTH15_Lec-02_Fa13_sec_1-2_Fcn_Graphs.pptx13
Bruce Mayer, PE Chabot College Mathematics
Distance Formula Formally
The distance d between any two points (x1, y1) and (x2, y2) is given by
212
212 yyxxd

[email protected] • MTH15_Lec-02_Fa13_sec_1-2_Fcn_Graphs.pptx14
Bruce Mayer, PE Chabot College Mathematics
Example Find Distance Find Distance
Between Pt1 & Pt2 Use Dist Formula
Pt-1
Pt-2
212
212 yyxxd
22 2682 d
483686 22 d
10100 d

[email protected] • MTH15_Lec-02_Fa13_sec_1-2_Fcn_Graphs.pptx15
Bruce Mayer, PE Chabot College Mathematics
Graphing by Dot Connection
“Connecting the Dots” ALWAYS works for plotting any y = f(x) from an eqn
The procedure• Use Fcn Eqn to make
a “T-Table”• Properly Construct and
Label Graph• Plot Ordered-Pairs in T-Table• Connect Dots with Straight
or Curved Lines
x y
-6 0.74-5 1.02-4 1.40-3 1.92-2 2.65-1 3.640 5.001 6.872 9.453 12.994 17.865 24.566 33.76
T-Table for xexfy 5

[email protected] • MTH15_Lec-02_Fa13_sec_1-2_Fcn_Graphs.pptx16
Bruce Mayer, PE Chabot College Mathematics
Making Complete Plots1. Arrows in
POSITIVE Direction Only
2. Label x & y axes on POSITIVE ends
3. Mark and label at least one unit on each axis
4. Use a ruler for Axes & Straight-Lines
5. Label significant points or quantities

[email protected] • MTH15_Lec-02_Fa13_sec_1-2_Fcn_Graphs.pptx17
Bruce Mayer, PE Chabot College Mathematics
Example Graph f(x) = 2x2
Solution:Make T-Table andConnect-Dotsx y (x, y)
01
–12
–2
02288
(0, 0)(1, 2)
(–1, 2)(2, 8)
(–2, 8) x = 0 is Axis of Symm (0,0) is Vertex
x
y
(-1,2 )
(2,8)(-2,8)
-5 -4 -3 -2 -1 1 2 3 4 5
4
3
6
2
5
1
(1,2)
(0, 0)-1
-2
78

[email protected] • MTH15_Lec-02_Fa13_sec_1-2_Fcn_Graphs.pptx18
Bruce Mayer, PE Chabot College Mathematics
Plot PieceWise Function: f(x) = |x|
ReCalling the Absolute Value Definition can State Function in PieceWise Form
Make T-Table from Above Fcn Def
Class Question: What will be the SHAPE of the the Graph of this Function?
0
0
xx
xxxfy

[email protected] • MTH15_Lec-02_Fa13_sec_1-2_Fcn_Graphs.pptx19
Bruce Mayer, PE Chabot College Mathematics
Example Graph f(x) = |x|
Make T-tablex y = |x |
-6 6-5 5-4 4-3 3-2 2-1 10 01 12 23 34 45 56 6
x
y
-6
-5
-4
-3
-2
-1
0
1
2
3
4
5
6
-6 -5 -4 -3 -2 -1 0 1 2 3 4 5 6
file =XY_Plot_0211.xls
Plot Points, and Connect Dots

[email protected] • MTH15_Lec-02_Fa13_sec_1-2_Fcn_Graphs.pptx20
Bruce Mayer, PE Chabot College Mathematics
Graph Intersections
How To Find Solutions to the Equality of Functions? • Graph Both Functions and Find
Intersections– At Intersections x & y are the SAME for both
functions, and ANY point on the graph is a “Solution” to Fcn
Thus at Intersections BOTH Fcns are Simultaneously Solved

[email protected] • MTH15_Lec-02_Fa13_sec_1-2_Fcn_Graphs.pptx21
Bruce Mayer, PE Chabot College Mathematics
Graph InterSection Example
Consider two Functions: Want to Find solution(s), xs, such that
Note that this Equation can NOT Solved exactly; The solutions are irrational Numbers• Such “NonAlgebraic” Eqns are Called
“Transcendental”
Find Solution by Graph Intersection(s)
1lncos7 21 xxfxxf
ssss xfxxxf 21 1lncos7

[email protected] • MTH15_Lec-02_Fa13_sec_1-2_Fcn_Graphs.pptx22
Bruce Mayer, PE Chabot College Mathematics
Graph InterSection Example
Plot Both Functions on Same Graph
Find Intersection(s)
Read xs from intersection points
0 1 2 3 4 5 6 7 8-8
-6
-4
-2
0
2
4
6
8
x
f 1(x)
= 7
cos(
x) •
f 2(x)
= ln
(x+
1)
f1
f2
≈1.44 ≈4.97 ≈7.54

[email protected] • MTH15_Lec-02_Fa13_sec_1-2_Fcn_Graphs.pptx23
Bruce Mayer, PE Chabot College Mathematics
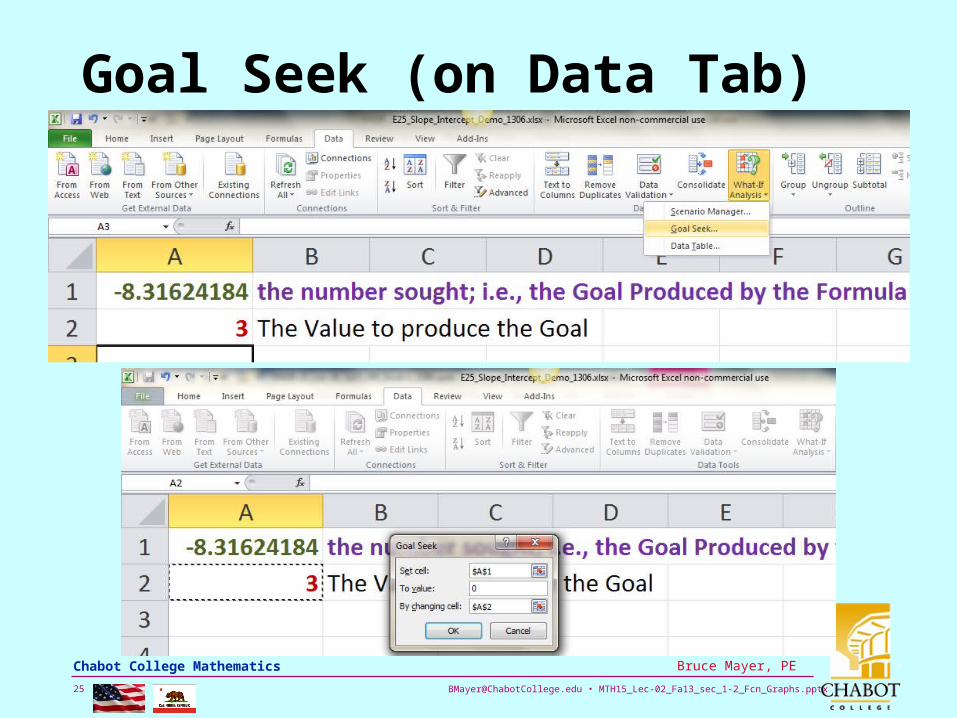
MSExcel vs Transcendental The “Goal Seek”
Command in MicroSoft Excel to Find xs with greater Accuracy
Use Excel to Solve the Transcendental Equation
Collect Terms on One Side, and use “Goal Seek” to find x that satisfies eqn
For the Eqn Above the solutions, xs, are called the “zeros” or “roots” of the “zeroed” eqn
1lncos7 xx
01lncos7 xx

[email protected] • MTH15_Lec-02_Fa13_sec_1-2_Fcn_Graphs.pptx24
Bruce Mayer, PE Chabot College Mathematics
MSExcel vs Transcendental
Use The “Goal Seek” Command in MicroSoft Excel to Find xs with greater Accuracy
[email protected] • MTH15_Lec-02_Fa13_sec_1-2_Fcn_Graphs.pptx25
Bruce Mayer, PE Chabot College Mathematics
Goal Seek (on Data Tab)
[email protected] • MTH15_Lec-02_Fa13_sec_1-2_Fcn_Graphs.pptx26
Bruce Mayer, PE Chabot College Mathematics
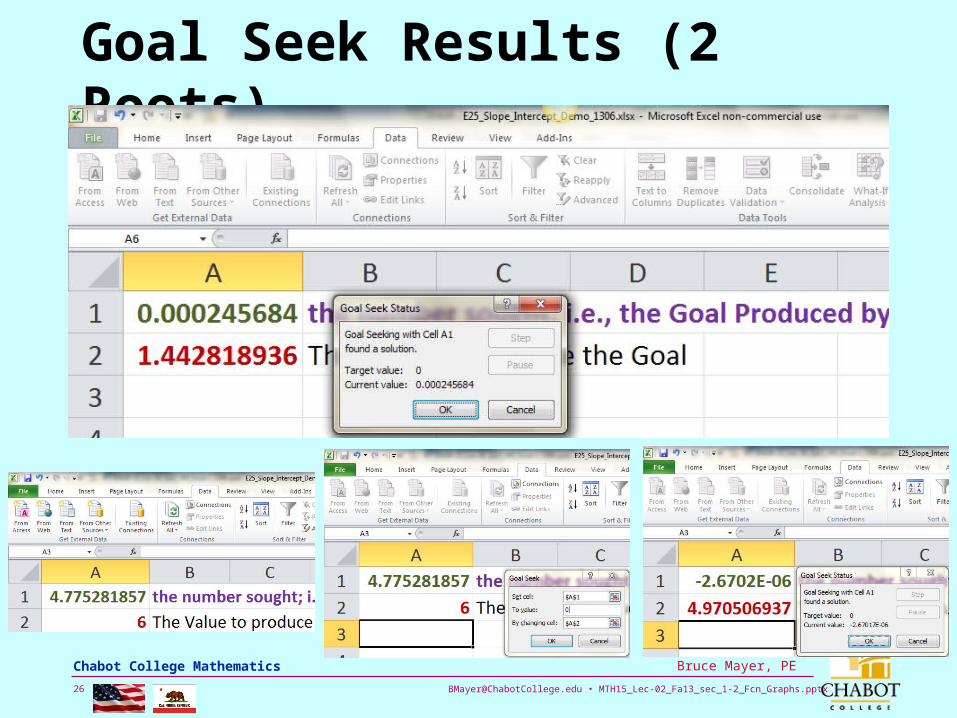
Goal Seek Results (2 Roots)

[email protected] • MTH15_Lec-02_Fa13_sec_1-2_Fcn_Graphs.pptx27
Bruce Mayer, PE Chabot College Mathematics
Zeros Graphed by MATLAB
0 1 2 3 4 5 6 7 8-10
-8
-6
-4
-2
0
2
4
6
8
u
v
>> u = linspace(0, 2.5*pi, 300);>> v = cos_ln(u);>> xZ = [0,8]; yZ = [0, 0];>> plot(u,v, xZ,yZ, 'LineWidth',3), grid, xlabel('u'), ylabel('v');>> Z1 = fzero(cos_ln,2)Z1 = 1.4429>> Z2 = fzero(cos_ln,5)Z2 = 4.9705>> Z3 = fzero(cos_ln,8)Z3 = 7.5425

[email protected] • MTH15_Lec-02_Fa13_sec_1-2_Fcn_Graphs.pptx28
Bruce Mayer, PE Chabot College Mathematics
Power Function f(x) = Kxn
In the Power Function “n” can be ANY number, positive, negative, rational or Irrational. Some Examples
0 2 4 6 8 103
3.5
4
4.5
5
5.5
6
x
f(x)
= 3
x2/7
0 2 4 6 8 100
0.5
1
1.5
2
2.5
3
3.5
4
4.5
5
x
f(x)
= 5
x-ln9
0 2 4 6 8 10-100
-90
-80
-70
-60
-50
-40
-30
-20
-10
0
x
f(x)
= -
2x1.
7
M15PwrFcnGraphs_1306.m

[email protected] • MTH15_Lec-02_Fa13_sec_1-2_Fcn_Graphs.pptx29
Bruce Mayer, PE Chabot College Mathematics
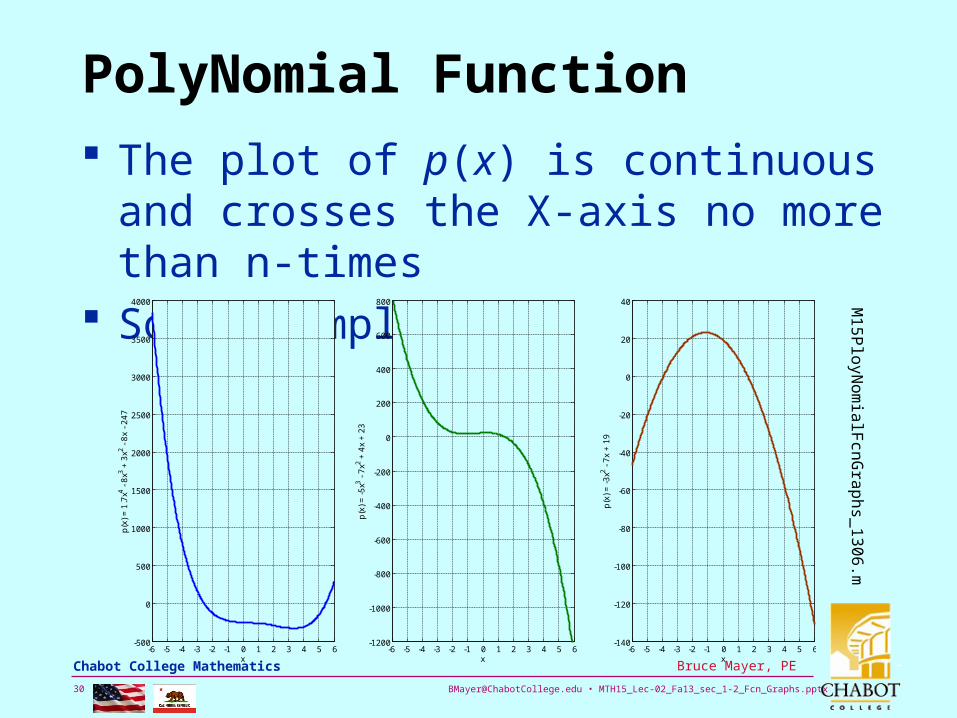
PolyNomial Function
The General PolyNomial Function
Where• n ≡ a positive integer constant• ak ≡ any real number constant
n (the largest exponent) is called the DEGREE of the Polynomial
0122
1
0122
1
221
01221
or
axaxaxaxaxaxp
xaxaxaxaxaxaxp
nnn
nnn
nnn
nnn
[email protected] • MTH15_Lec-02_Fa13_sec_1-2_Fcn_Graphs.pptx30
Bruce Mayer, PE Chabot College Mathematics
PolyNomial Function
The plot of p(x) is continuous and crosses the X-axis no more than n-times
Some Examples
-6 -5 -4 -3 -2 -1 0 1 2 3 4 5 6-500
0
500
1000
1500
2000
2500
3000
3500
4000
x
p(x
) =
1.7
x4 - 8
x3 + 3
x2 - 8
x -
24
7
-6 -5 -4 -3 -2 -1 0 1 2 3 4 5 6-1200
-1000
-800
-600
-400
-200
0
200
400
600
800
x
p(x
) =
-5
x3 - 7
x2 + 4
x +
23
-6 -5 -4 -3 -2 -1 0 1 2 3 4 5 6-140
-120
-100
-80
-60
-40
-20
0
20
40
x
p(x
) =
-3
x2 - 7
x +
19
M15PloyNomialFcnGraphs_1306.m

[email protected] • MTH15_Lec-02_Fa13_sec_1-2_Fcn_Graphs.pptx31
Bruce Mayer, PE Chabot College Mathematics
Rational Function
A rational function is a function f that is a quotient of two polynomials, that is,
Where• where p(x) and q(x) are polynomials and
where q(x) is not the zero polynomial. • The domain of f consists of all
inputs x for which q(x) ≠ 0.
( )( ) ,
( )
p xf x
q x

[email protected] • MTH15_Lec-02_Fa13_sec_1-2_Fcn_Graphs.pptx32
Bruce Mayer, PE Chabot College Mathematics
Rational Fcn Examples
Note the Asymptotic Behavior
-6 -5 -4 -3 -2 -1 0 1 2 3 4 5 6-25
-20
-15
-10
-5
0
5
10
15
20
25
x-6 -5 -4 -3 -2 -1 0 1 2 3 4 5 6
-25
-20
-15
-10
-5
0
5
10
15
20
25
x-2 -1.5 -1 -0.5 0 0.5 1 1.5 2
-10
-8
-6
-4
-2
0
2
4
6
8
10
x
4 2
4
6 3 1( )
9 3 2
x xf x
x x
2
2 3( )
4
xf x
x
3
2
x
xxf

[email protected] • MTH15_Lec-02_Fa13_sec_1-2_Fcn_Graphs.pptx33
Bruce Mayer, PE Chabot College Mathematics
Graphing & Vertical-Line-Test
Test a Reln-Graph to see if the Relation represents a Fcn
If no VERTICAL line intersects the graph of a relation at more than one point, then the graph is the graph of a function.

[email protected] • MTH15_Lec-02_Fa13_sec_1-2_Fcn_Graphs.pptx34
Bruce Mayer, PE Chabot College Mathematics
Example Vertical-Line-Test
Use the Vertical Line Test to determine if the graph represents a function
SOLUTION• NOT a function as
the Graph Does not pass the vertical line test

[email protected] • MTH15_Lec-02_Fa13_sec_1-2_Fcn_Graphs.pptx35
Bruce Mayer, PE Chabot College Mathematics
Example Vertical-Line-Test
Use the Vertical Line Test to determine if the graph represents a function
SOLUTION• NOT a function as
the Graph Does not pass the vertical line test
TRIPLEValued
[email protected] • MTH15_Lec-02_Fa13_sec_1-2_Fcn_Graphs.pptx36
Bruce Mayer, PE Chabot College Mathematics
Example Vertical-Line-Test
Use the Vertical Line Test to determine if the graph represents a function
SOLUTION• IS a function as the
Graph Does pass the vertical line test
SINGLEValuedSINGLEValued

[email protected] • MTH15_Lec-02_Fa13_sec_1-2_Fcn_Graphs.pptx37
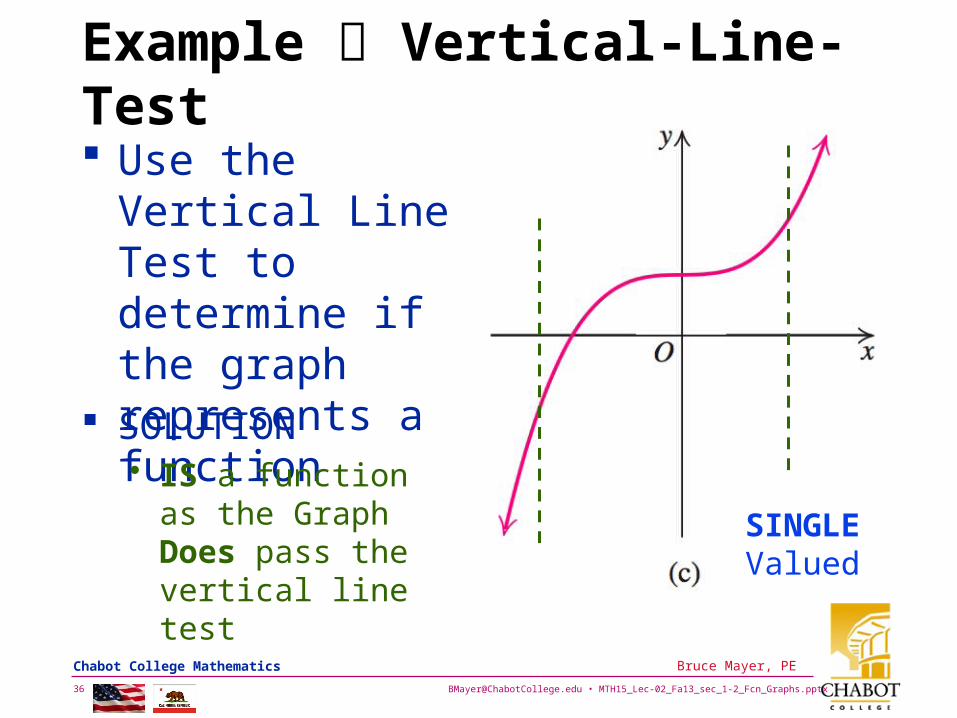
Bruce Mayer, PE Chabot College Mathematics
Example Vertical-Line-Test
Use the Vertical Line Test to determine if the graph represents a function
SOLUTION• IS a function as the
Graph Does pass the vertical line test
SINGLEValued

[email protected] • MTH15_Lec-02_Fa13_sec_1-2_Fcn_Graphs.pptx38
Bruce Mayer, PE Chabot College Mathematics
Quadratic Functions
All quadratic functions have graphs similar to y = x2. Such curves are called parabolas. They are U-shaped and symmetric with respect to a vertical line known as the parabola’s line of symmetry or axis of symmetry.
For the graph of f(x) = x2, the y-axis is the axis of symmetry. The point (0, 0) is known as the vertex of this parabola.

[email protected] • MTH15_Lec-02_Fa13_sec_1-2_Fcn_Graphs.pptx39
Bruce Mayer, PE Chabot College Mathematics
The Vertex of a Parabola
The FORMULA for the vertex of a parabola given by f(x) = ax2 + bx + c:
24, or , .
2 2 2 4
b b b ac bf
a a a a
• The x-coordinate of the vertex is −b/(2a). • The axis of symmetry is x = −b/(2a). • The second coordinate of the vertex is most
commonly found by computing f(−b/[2a])

[email protected] • MTH15_Lec-02_Fa13_sec_1-2_Fcn_Graphs.pptx40
Bruce Mayer, PE Chabot College Mathematics
Graphing f(x) = ax2 + bx + c
1. The graph is a parabola. Identify a, b, and c
2. Determine how the parabola opens• If a > 0, the parabola opens up. • If a < 0, the parabola opens down
3. Find the vertex (h, k). Use the formula
h, k b
2a, f
b
2a
.

[email protected] • MTH15_Lec-02_Fa13_sec_1-2_Fcn_Graphs.pptx41
Bruce Mayer, PE Chabot College Mathematics
Graphing f(x) = ax2 + bx + c
4. Find the x-interceptsLet y = f(x) = 0. Find x by solving the equation ax2 + bx + c = 0.
• If the solutions are real numbers, they are the x-intercepts.
• If not, the parabola either lies – above the x–axis when a > 0 – below the x–axis when a < 0

[email protected] • MTH15_Lec-02_Fa13_sec_1-2_Fcn_Graphs.pptx42
Bruce Mayer, PE Chabot College Mathematics
Graphing f(x) = ax2 + bx + c
5. Find the y-intercept. Let x = 0. The result f(0) = c is the y-intercept.
6. The parabola is symmetric with respect to its axis, x = −b/(2a)
• Use this symmetry to find additional points.
7. Draw a parabola through the points found in Steps 3-6.

[email protected] • MTH15_Lec-02_Fa13_sec_1-2_Fcn_Graphs.pptx43
Bruce Mayer, PE Chabot College Mathematics
Example Graph SOLUTION
f x 2x2 8x 5.
Step 1 a = –2, b = 8, and c = –5Step 2 a = –2, a < 0, the parabola opens down.Step 3 Find (h, k).
h b
2a
8
2 2 2
k f 2 2 2 2 8 2 5 3
h, k 2, 3 Maximum value of y = 3 at x = 2

[email protected] • MTH15_Lec-02_Fa13_sec_1-2_Fcn_Graphs.pptx44
Bruce Mayer, PE Chabot College Mathematics
Example Graph SOLUTION
f x 2x2 8x 5.
Step 4 Let f (x) = 0.
f 0 2 0 2 8 0 5
y-intercept is 5 .Step 5 Let x = 0.
2x2 8x 5 0
x 8 8 2 4 2 5
2 2 4 6
2
x-intercepts are 4 6
2 and
4 6
2.

[email protected] • MTH15_Lec-02_Fa13_sec_1-2_Fcn_Graphs.pptx45
Bruce Mayer, PE Chabot College Mathematics
Example Graph SOLUTION
f x 2x2 8x 5.
Step 6 Axis of symmetry is x = 2. Let x = 1, then the point (1, 1) is on the graph, the symmetric image of (1, 1) with respect to the axis x = 2 is (3, 1). The symmetric image of the y–intercept (0, –5) with respect to the axis x = 2 is (4, –5).
Step 7 The parabola passing through the points found in Steps 3–6 is sketched on the next slide.

[email protected] • MTH15_Lec-02_Fa13_sec_1-2_Fcn_Graphs.pptx46
Bruce Mayer, PE Chabot College Mathematics
Example Graph f x 2x2 8x 5.
SOLUTION cont.• Sketch Graph
Using the pointsJust Determined
f x 2x2 8x 5

[email protected] • MTH15_Lec-02_Fa13_sec_1-2_Fcn_Graphs.pptx47
Bruce Mayer, PE Chabot College Mathematics
WhiteBoard Work
Problems §1.2-44• Supply & Demand

[email protected] • MTH15_Lec-02_Fa13_sec_1-2_Fcn_Graphs.pptx48
Bruce Mayer, PE Chabot College Mathematics
All Done for Today
AutoMobileStoppingDistance

[email protected] • MTH15_Lec-02_Fa13_sec_1-2_Fcn_Graphs.pptx49
Bruce Mayer, PE Chabot College Mathematics
Bruce Mayer, PELicensed Electrical & Mechanical Engineer
Chabot Mathematics
Appendix
–
srsrsr 22

[email protected] • MTH15_Lec-02_Fa13_sec_1-2_Fcn_Graphs.pptx50
Bruce Mayer, PE Chabot College Mathematics

[email protected] • MTH15_Lec-02_Fa13_sec_1-2_Fcn_Graphs.pptx51
Bruce Mayer, PE Chabot College Mathematics

[email protected] • MTH15_Lec-02_Fa13_sec_1-2_Fcn_Graphs.pptx52
Bruce Mayer, PE Chabot College Mathematics

[email protected] • MTH15_Lec-02_Fa13_sec_1-2_Fcn_Graphs.pptx53
Bruce Mayer, PE Chabot College Mathematics
(120, 0)

[email protected] • MTH15_Lec-02_Fa13_sec_1-2_Fcn_Graphs.pptx54
Bruce Mayer, PE Chabot College Mathematics

[email protected] • MTH15_Lec-02_Fa13_sec_1-2_Fcn_Graphs.pptx55
Bruce Mayer, PE Chabot College Mathematics

[email protected] • MTH15_Lec-02_Fa13_sec_1-2_Fcn_Graphs.pptx56
Bruce Mayer, PE Chabot College Mathematics

[email protected] • MTH15_Lec-02_Fa13_sec_1-2_Fcn_Graphs.pptx57
Bruce Mayer, PE Chabot College Mathematics
Grap
h b
y MA
TL
AB
0 20 40 60 80 100 1200
100
200
300
400
500
600
700
800
p ($/Unit)
E (
$k/
Mo
nth
)MTH15 P1.2-44 • Bruce Mayer, PE
M15P12441306.m

[email protected] • MTH15_Lec-02_Fa13_sec_1-2_Fcn_Graphs.pptx58
Bruce Mayer, PE Chabot College Mathematics
MATLAB Code% Bruce Mayer, PE% MTH-15 • 23Jun13% M15P12441306.m%% The FUNCTIONp = linspace(0,120,500); E = -p.^2/5 + 24*p;% % the Plotaxes; set(gca,'FontSize',12);whitebg([0.8 1 1]); % Chg Plot BackGround to Blue-Greenplot(p,E, 'LineWidth', 3),axis([0 120 0 800]),... grid, xlabel('\fontsize{14}p ($/Unit)'), ylabel('\fontsize{14}E ($k/Month)'),... title(['\fontsize{16}MTH15 P1.2-44 • Bruce Mayer, PE',]),... annotation('textbox',[.55 .055 .0 .1], 'FitBoxToText', 'on', 'EdgeColor', 'none', 'String', 'M15P12441306.m','FontSize',9)