brs weekly market report - 13.11.2015
DESCRIPTION
BRS Weekly Market Report - 13.11.2015TRANSCRIPT
Week II : 09th
Nov - 13th
Nov 2015 BRS Weekly Market Report
BRS Market Report
Week II : 09th
Nov - 13th
Nov 2015
We
ek
ly
65, Braybrooke Place, Colombo 2, Sri Lanka • [email protected] • +94 11 5220200
2
Week II : 09th
Nov - 13th
Nov 2015 BRS Weekly Market Report
The Week at a Glance
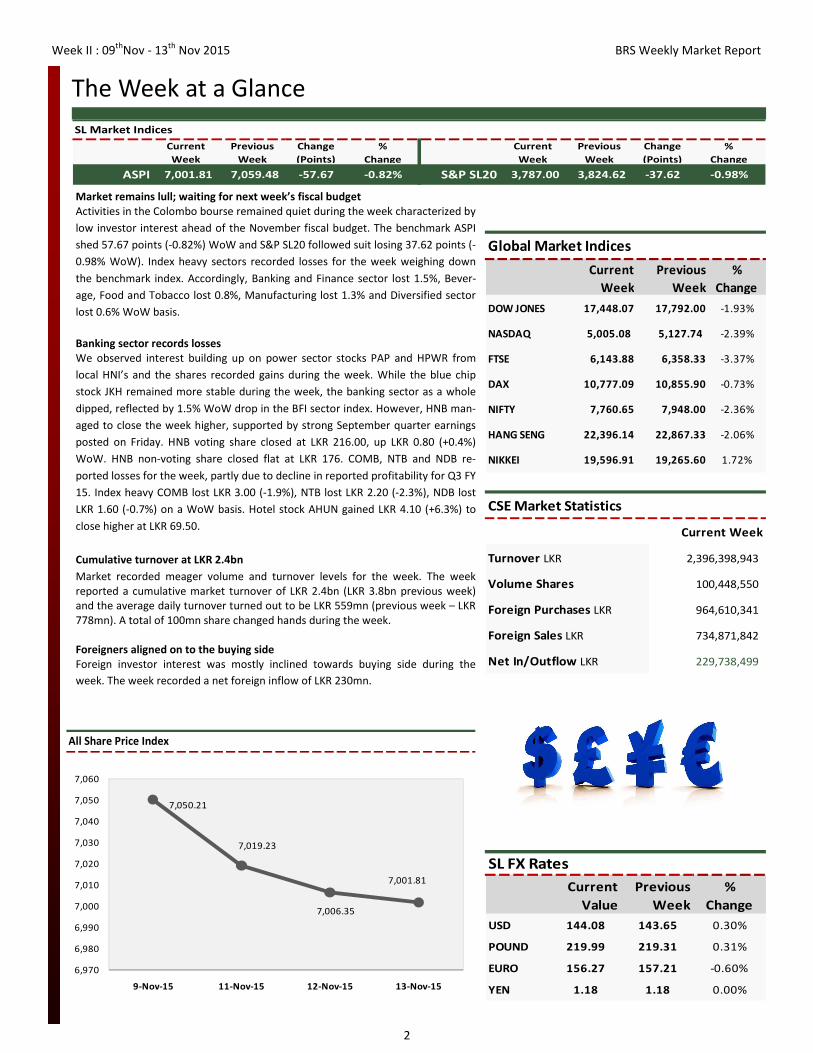
Market remains lull; waiting for next week’s fiscal budget
Activities in the Colombo bourse remained quiet during the week characterized by
low investor interest ahead of the November fiscal budget. The benchmark ASPI
shed 57.67 points (-0.82%) WoW and S&P SL20 followed suit losing 37.62 points (-
0.98% WoW). Index heavy sectors recorded losses for the week weighing down
the benchmark index. Accordingly, Banking and Finance sector lost 1.5%, Bever-
age, Food and Tobacco lost 0.8%, Manufacturing lost 1.3% and Diversified sector
lost 0.6% WoW basis.
Banking sector records losses
We observed interest building up on power sector stocks PAP and HPWR from
local HNI’s and the shares recorded gains during the week. While the blue chip
stock JKH remained more stable during the week, the banking sector as a whole
dipped, reflected by 1.5% WoW drop in the BFI sector index. However, HNB man-
aged to close the week higher, supported by strong September quarter earnings
posted on Friday. HNB voting share closed at LKR 216.00, up LKR 0.80 (+0.4%)
WoW. HNB non-voting share closed flat at LKR 176. COMB, NTB and NDB re-
ported losses for the week, partly due to decline in reported profitability for Q3 FY
15. Index heavy COMB lost LKR 3.00 (-1.9%), NTB lost LKR 2.20 (-2.3%), NDB lost
LKR 1.60 (-0.7%) on a WoW basis. Hotel stock AHUN gained LKR 4.10 (+6.3%) to
close higher at LKR 69.50.
Cumulative turnover at LKR 2.4bn
Market recorded meager volume and turnover levels for the week. The week
reported a cumulative market turnover of LKR 2.4bn (LKR 3.8bn previous week)
and the average daily turnover turned out to be LKR 559mn (previous week – LKR
778mn). A total of 100mn share changed hands during the week.
Foreigners aligned on to the buying side
Foreign investor interest was mostly inclined towards buying side during the
week. The week recorded a net foreign inflow of LKR 230mn.
All Share Price Index
Current
Week
Previous
Week
%
Change
DOW JONES 17,448.07 17,792.00 -1.93%
NASDAQ 5,005.08 5,127.74 -2.39%
FTSE 6,143.88 6,358.33 -3.37%
DAX 10,777.09 10,855.90 -0.73%
NIFTY 7,760.65 7,948.00 -2.36%
HANG SENG 22,396.14 22,867.33 -2.06%
NIKKEI 19,596.91 19,265.60 1.72%
Global Market Indices
CSE Market Statistics
Current Week
Turnover LKR 2,396,398,943
Volume Shares 100,448,550
Foreign Purchases LKR 964,610,341
Foreign Sales LKR 734,871,842
Net In/Outflow LKR 229,738,499
Current
Value
Previous
Week
%
Change
USD 144.08 143.65 0.30%
POUND 219.99 219.31 0.31%
EURO 156.27 157.21 -0.60%
YEN 1.18 1.18 0.00%
SL FX Rates
7,050.21
7,019.23
7,006.35
7,001.81
6,970
6,980
6,990
7,000
7,010
7,020
7,030
7,040
7,050
7,060
9-Nov-15 11-Nov-15 12-Nov-15 13-Nov-15
SL Market Indices
Current
Week
Previous
Week
Change
(Points)
%
Change
Current
Week
Previous
Week
Change
(Points)
%
Change
ASPI 7,001.81 7,059.48 -57.67 -0.82% S&P SL20 3,787.00 3,824.62 -37.62 -0.98%
3
Week II : 09th
Nov - 13th
Nov 2015 BRS Weekly Market Report
The Week at a Glance
WEEKLY CSE ANNOUNCEMENTS
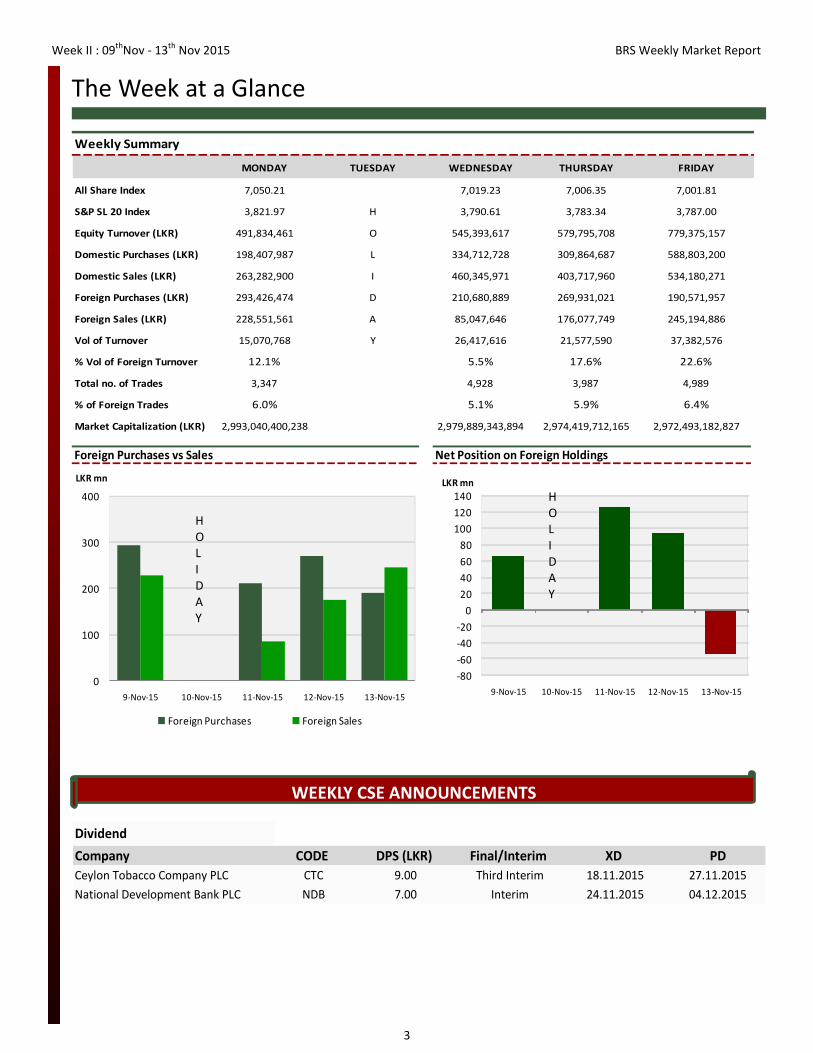
MONDAY TUESDAY WEDNESDAY THURSDAY FRIDAY
All Share Index 7,050.21 7,019.23 7,006.35 7,001.81
S&P SL 20 Index 3,821.97 H 3,790.61 3,783.34 3,787.00
Equity Turnover (LKR) 491,834,461 O 545,393,617 579,795,708 779,375,157
Domestic Purchases (LKR) 198,407,987 L 334,712,728 309,864,687 588,803,200
Domestic Sales (LKR) 263,282,900 I 460,345,971 403,717,960 534,180,271
Foreign Purchases (LKR) 293,426,474 D 210,680,889 269,931,021 190,571,957
Foreign Sales (LKR) 228,551,561 A 85,047,646 176,077,749 245,194,886
Vol of Turnover 15,070,768 Y 26,417,616 21,577,590 37,382,576
% Vol of Foreign Turnover 12.1% 5.5% 17.6% 22.6%
Total no. of Trades 3,347 4,928 3,987 4,989
% of Foreign Trades 6.0% 5.1% 5.9% 6.4%
Market Capitalization (LKR) 2,993,040,400,238 2,979,889,343,894 2,974,419,712,165 2,972,493,182,827
Weekly Summary
Foreign Purchases vs Sales Net Position on Foreign Holdings
0
100
200
300
400
9-Nov-15 10-Nov-15 11-Nov-15 12-Nov-15 13-Nov-15
LKR mn
Foreign Purchases Foreign Sales
-80
-60
-40
-20
0
20
40
60
80
100
120
140
9-Nov-15 10-Nov-15 11-Nov-15 12-Nov-15 13-Nov-15
LKR mn
Dividend
Company CODE DPS (LKR) Final/Interim XD PD
Ceylon Tobacco Company PLC CTC 9.00 Third Interim 18.11.2015 27.11.2015
National Development Bank PLC NDB 7.00 Interim 24.11.2015 04.12.2015
H
O
L
I
D
A
Y
H
O
L
I
D
A
Y
4
Week II : 09th
Nov - 13th
Nov 2015 BRS Weekly Market Report
The Week at a Glance
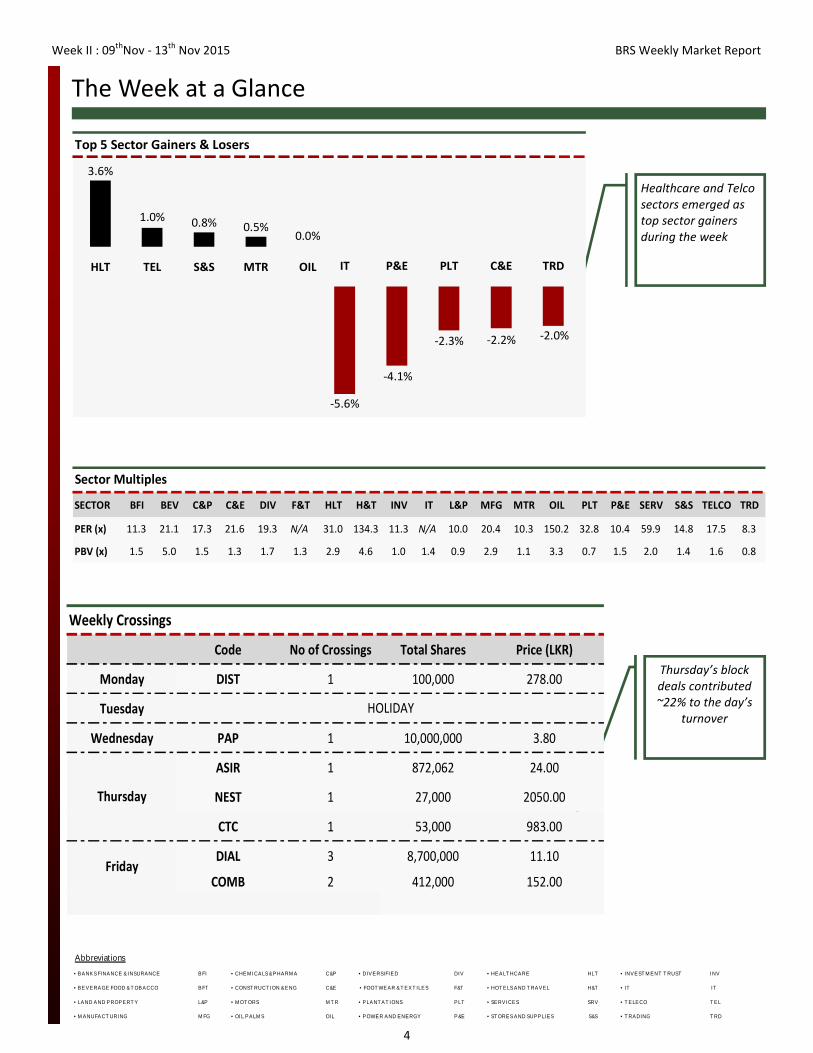
Healthcare and Telco
sectors emerged as
top sector gainers
during the week
Abbreviations
• BANKS FINANCE & I NSURANCE BFI • CHEM I CALS & PHARM A C&P • DIVERSIFI ED DIV • HEALT HCARE HLT • INVEST M ENT T RUST I NV
• BEVERAGE FOOD & T OBACCO BFT • CONST RUCT ION & ENG C&E • FOOT WEAR & T EXT ILES F&T • HOT ELS AND T RAVEL H&T • IT IT
• LAND AND PROPERT Y L&P • M OT ORS M T R • PLANT AT I ONS PLT • SERVI CES SRV • T ELECO T EL
• M ANUFACT URI NG M FG • OI L PALM S OIL • POWER AND ENERGY P&E • ST ORES AND SUPPLIES S&S • T RADING T RD
Thursday’s block
deals contributed
~22% to the day’s
turnover
Weekly Crossings
Code No of Crossings Total Shares Price (LKR)
Monday DIST 1 100,000 278.00
Tuesday
Wednesday PAP 1 10,000,000 3.80
ASIR 1 872,062 24.00
NEST 1 27,000 2050.00
CTC 1 53,000 983.00
DIAL 3 8,700,000 11.10
COMB 2 412,000 152.00Friday
HOLIDAY
Thursday
Top 5 Sector Gainers & Losers
3.6%
1.0% 0.8% 0.5%0.0%
HLT TEL S&S MTR OIL
-5.6%
-4.1%
-2.3% -2.2% -2.0%
IT P&E PLT C&E TRD
SECTOR BFI BEV C&P C&E DIV F&T HLT H&T INV IT L&P MFG MTR OIL PLT P&E SERV S&S TELCO TRD
PER (x) 11.3 21.1 17.3 21.6 19.3 N/A 31.0 134.3 11.3 N/A 10.0 20.4 10.3 150.2 32.8 10.4 59.9 14.8 17.5 8.3
PBV (x) 1.5 5.0 1.5 1.3 1.7 1.3 2.9 4.6 1.0 1.4 0.9 2.9 1.1 3.3 0.7 1.5 2.0 1.4 1.6 0.8
Sector Multiples
5
Week II : 09th
Nov - 13th
Nov 2015 BRS Weekly Market Report
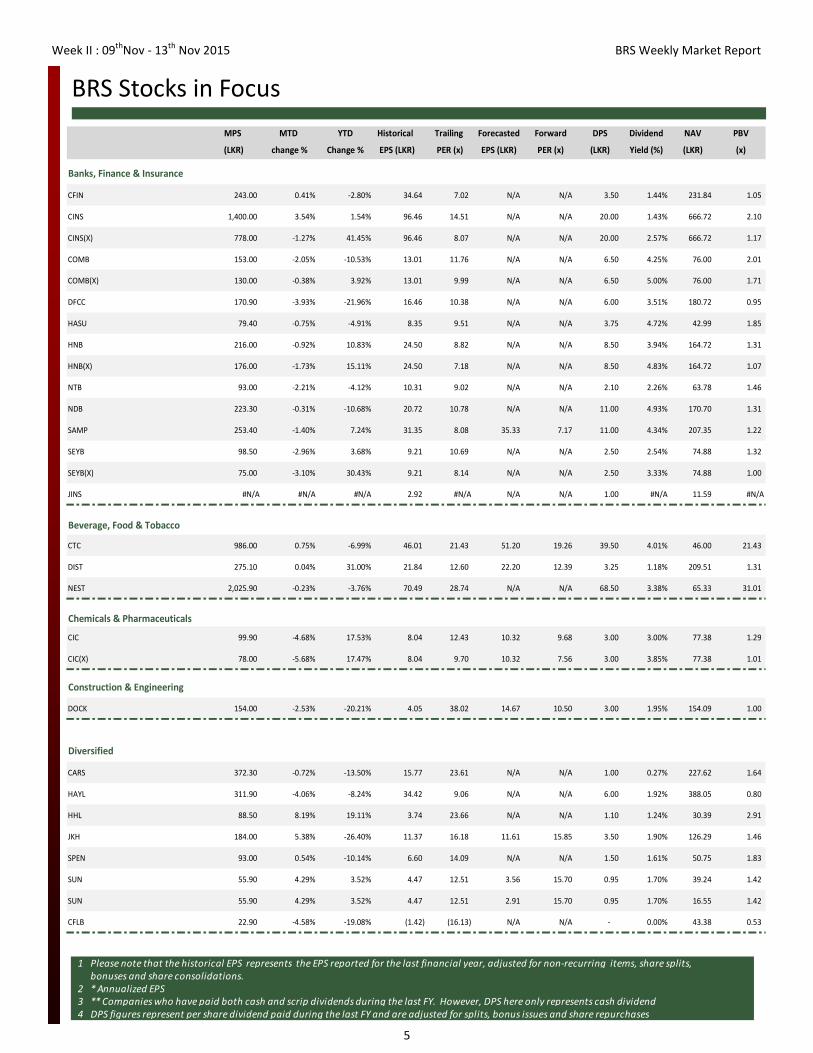
BRS Stocks in Focus
1 Please note that the historical EPS represents the EPS reported for the last financial year, adjusted for non-recurring items, share splits,
bonuses and share consolidations.
2 * Annualized EPS
3 ** Companies who have paid both cash and scrip dividends during the last FY. However, DPS here only represents cash dividend
4 DPS figures represent per share dividend paid during the last FY and are adjusted for splits, bonus issues and share repurchases
MPS MTD YTD Historical Trailing Forecasted Forward DPS Dividend NAV PBV
(LKR) change % Change % EPS (LKR) PER (x) EPS (LKR) PER (x) (LKR) Yield (%) (LKR) (x)
CFIN 243.00 0.41% -2.80% 34.64 7.02 N/A N/A 3.50 1.44% 231.84 1.05
CINS 1,400.00 3.54% 1.54% 96.46 14.51 N/A N/A 20.00 1.43% 666.72 2.10
CINS(X) 778.00 -1.27% 41.45% 96.46 8.07 N/A N/A 20.00 2.57% 666.72 1.17
COMB 153.00 -2.05% -10.53% 13.01 11.76 N/A N/A 6.50 4.25% 76.00 2.01
COMB(X) 130.00 -0.38% 3.92% 13.01 9.99 N/A N/A 6.50 5.00% 76.00 1.71
DFCC 170.90 -3.93% -21.96% 16.46 10.38 N/A N/A 6.00 3.51% 180.72 0.95
HASU 79.40 -0.75% -4.91% 8.35 9.51 N/A N/A 3.75 4.72% 42.99 1.85
HNB 216.00 -0.92% 10.83% 24.50 8.82 N/A N/A 8.50 3.94% 164.72 1.31
HNB(X) 176.00 -1.73% 15.11% 24.50 7.18 N/A N/A 8.50 4.83% 164.72 1.07
NTB 93.00 -2.21% -4.12% 10.31 9.02 N/A N/A 2.10 2.26% 63.78 1.46
NDB 223.30 -0.31% -10.68% 20.72 10.78 N/A N/A 11.00 4.93% 170.70 1.31
SAMP 253.40 -1.40% 7.24% 31.35 8.08 35.33 7.17 11.00 4.34% 207.35 1.22
SEYB 98.50 -2.96% 3.68% 9.21 10.69 N/A N/A 2.50 2.54% 74.88 1.32
SEYB(X) 75.00 -3.10% 30.43% 9.21 8.14 N/A N/A 2.50 3.33% 74.88 1.00
JINS #N/A #N/A #N/A 2.92 #N/A N/A N/A 1.00 #N/A 11.59 #N/A
CTC 986.00 0.75% -6.99% 46.01 21.43 51.20 19.26 39.50 4.01% 46.00 21.43
DIST 275.10 0.04% 31.00% 21.84 12.60 22.20 12.39 3.25 1.18% 209.51 1.31
NEST 2,025.90 -0.23% -3.76% 70.49 28.74 N/A N/A 68.50 3.38% 65.33 31.01
CIC 99.90 -4.68% 17.53% 8.04 12.43 10.32 9.68 3.00 3.00% 77.38 1.29
CIC(X) 78.00 -5.68% 17.47% 8.04 9.70 10.32 7.56 3.00 3.85% 77.38 1.01
DOCK 154.00 -2.53% -20.21% 4.05 38.02 14.67 10.50 3.00 1.95% 154.09 1.00
CARS 372.30 -0.72% -13.50% 15.77 23.61 N/A N/A 1.00 0.27% 227.62 1.64
HAYL 311.90 -4.06% -8.24% 34.42 9.06 N/A N/A 6.00 1.92% 388.05 0.80
HHL 88.50 8.19% 19.11% 3.74 23.66 N/A N/A 1.10 1.24% 30.39 2.91
JKH 184.00 5.38% -26.40% 11.37 16.18 11.61 15.85 3.50 1.90% 126.29 1.46
SPEN 93.00 0.54% -10.14% 6.60 14.09 N/A N/A 1.50 1.61% 50.75 1.83
SUN 55.90 4.29% 3.52% 4.47 12.51 3.56 15.70 0.95 1.70% 39.24 1.42
SUN 55.90 4.29% 3.52% 4.47 12.51 2.91 15.70 0.95 1.70% 16.55 1.42
CFLB 22.90 -4.58% -19.08% (1.42) (16.13) N/A N/A - 0.00% 43.38 0.53
Banks, Finance & Insurance
Beverage, Food & Tobacco
Chemicals & Pharmaceuticals
Construction & Engineering
Diversified
6
Week II : 09th
Nov - 13th
Nov 2015 BRS Weekly Market Report
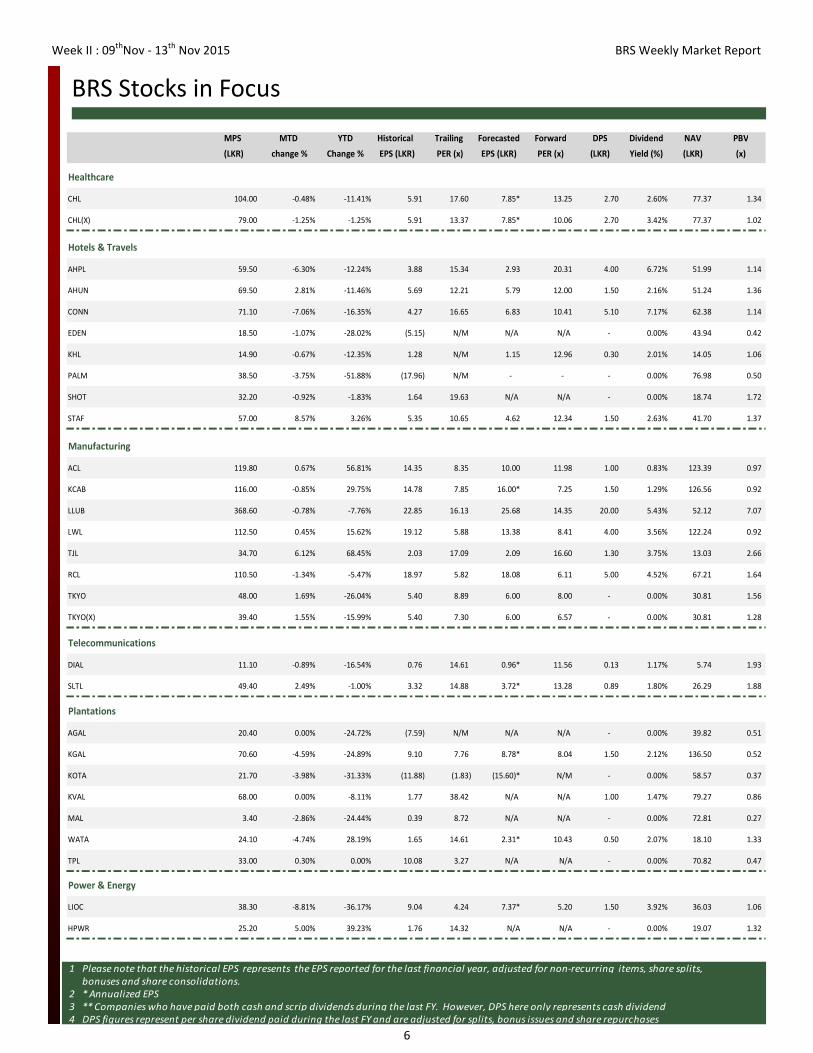
BRS Stocks in Focus
1 Please note that the historical EPS represents the EPS reported for the last financial year, adjusted for non-recurring items, share splits,
bonuses and share consolidations.
2 * Annualized EPS
3 ** Companies who have paid both cash and scrip dividends during the last FY. However, DPS here only represents cash dividend
4 DPS figures represent per share dividend paid during the last FY and are adjusted for splits, bonus issues and share repurchases
MPS MTD YTD Historical Trailing Forecasted Forward DPS Dividend NAV PBV
(LKR) change % Change % EPS (LKR) PER (x) EPS (LKR) PER (x) (LKR) Yield (%) (LKR) (x)
CHL 104.00 -0.48% -11.41% 5.91 17.60 7.85* 13.25 2.70 2.60% 77.37 1.34
CHL(X) 79.00 -1.25% -1.25% 5.91 13.37 7.85* 10.06 2.70 3.42% 77.37 1.02
AHPL 59.50 -6.30% -12.24% 3.88 15.34 2.93 20.31 4.00 6.72% 51.99 1.14
AHUN 69.50 2.81% -11.46% 5.69 12.21 5.79 12.00 1.50 2.16% 51.24 1.36
CONN 71.10 -7.06% -16.35% 4.27 16.65 6.83 10.41 5.10 7.17% 62.38 1.14
EDEN 18.50 -1.07% -28.02% (5.15) N/M N/A N/A - 0.00% 43.94 0.42
KHL 14.90 -0.67% -12.35% 1.28 N/M 1.15 12.96 0.30 2.01% 14.05 1.06
PALM 38.50 -3.75% -51.88% (17.96) N/M - - - 0.00% 76.98 0.50
SHOT 32.20 -0.92% -1.83% 1.64 19.63 N/A N/A - 0.00% 18.74 1.72
STAF 57.00 8.57% 3.26% 5.35 10.65 4.62 12.34 1.50 2.63% 41.70 1.37
ACL 119.80 0.67% 56.81% 14.35 8.35 10.00 11.98 1.00 0.83% 123.39 0.97
KCAB 116.00 -0.85% 29.75% 14.78 7.85 16.00* 7.25 1.50 1.29% 126.56 0.92
LLUB 368.60 -0.78% -7.76% 22.85 16.13 25.68 14.35 20.00 5.43% 52.12 7.07
LWL 112.50 0.45% 15.62% 19.12 5.88 13.38 8.41 4.00 3.56% 122.24 0.92
TJL 34.70 6.12% 68.45% 2.03 17.09 2.09 16.60 1.30 3.75% 13.03 2.66
RCL 110.50 -1.34% -5.47% 18.97 5.82 18.08 6.11 5.00 4.52% 67.21 1.64
TKYO 48.00 1.69% -26.04% 5.40 8.89 6.00 8.00 - 0.00% 30.81 1.56
TKYO(X) 39.40 1.55% -15.99% 5.40 7.30 6.00 6.57 - 0.00% 30.81 1.28
DIAL 11.10 -0.89% -16.54% 0.76 14.61 0.96* 11.56 0.13 1.17% 5.74 1.93
SLTL 49.40 2.49% -1.00% 3.32 14.88 3.72* 13.28 0.89 1.80% 26.29 1.88
AGAL 20.40 0.00% -24.72% (7.59) N/M N/A N/A - 0.00% 39.82 0.51
KGAL 70.60 -4.59% -24.89% 9.10 7.76 8.78* 8.04 1.50 2.12% 136.50 0.52
KOTA 21.70 -3.98% -31.33% (11.88) (1.83) (15.60)* N/M - 0.00% 58.57 0.37
KVAL 68.00 0.00% -8.11% 1.77 38.42 N/A N/A 1.00 1.47% 79.27 0.86
MAL 3.40 -2.86% -24.44% 0.39 8.72 N/A N/A - 0.00% 72.81 0.27
WATA 24.10 -4.74% 28.19% 1.65 14.61 2.31* 10.43 0.50 2.07% 18.10 1.33
TPL 33.00 0.30% 0.00% 10.08 3.27 N/A N/A - 0.00% 70.82 0.47
LIOC 38.30 -8.81% -36.17% 9.04 4.24 7.37* 5.20 1.50 3.92% 36.03 1.06
HPWR 25.20 5.00% 39.23% 1.76 14.32 N/A N/A - 0.00% 19.07 1.32
Healthcare
Hotels & Travels
Manufacturing
Telecommunications
Plantations
Power & Energy
7
Week II : 09th
Nov - 13th
Nov 2015 BRS Weekly Market Report
Contact Us
DISCLAIMER: In compiling this report, Bartleet Religare Securities (Pvt) Ltd has made every endeavour to ensure its accuracy but cannot hold ourselves
responsible for any errors that may be found herein. We further disclaim all responsibility for any loss or damage which may be suffered by any person
relying upon such information or any options, conclusions or recommendations herein whether that loss or damage is caused by any fault or negligence
in the part of Bartleet Religare Securities (Pvt) Limited.
HOTLINE +94 (0) 115 220 200
FAX +94 (0) 112 434 985
Or visit us @ www.bartleetreligare.com
Murali (011)5220201/212 [email protected] Vajira (011)5220217 [email protected]
Angelo (011)5220207/214 [email protected] Yusri (011)5220224 [email protected]
Sujeewa (011)5220213 [email protected] Dhanushka (011)5220222 [email protected]
Yadhavan (011)5220215 [email protected] Muditha (011)5220226 [email protected]
Ahmadeen (011)5220218 [email protected] Asitha (011)5220209 [email protected]
Dilusha (011)5220219 [email protected]
Hiral (011)5220275 [email protected]
Nikita (011)5260204 [email protected] Iresh (011)5220274 [email protected]
Nusrath (011)5260210 [email protected] Waruna (011)5220277 [email protected]
Jennita (011)5260207 [email protected]
Thilini (011)5260208 [email protected]
Ishan (011)5260206 [email protected] Suren (011)5220216 [email protected]
Sonali (011)5260211 [email protected]
Vajirapanie (011)5260206 [email protected]
Lasan (011)5260205 [email protected]
INSTITUTIONAL SALES RETAIL SALES
RESEARCH
BUSINESS DEVELOPMENT
Bandarwela (0575)675083 (057)2225537 [email protected]
Batticalo (065)5679525 gireesan @bartleetreligare.com
Galle (091)5633512 [email protected]
Jaffna (021)2221800 (021)2220145 (021)5671115 [email protected]
Kandy (081)5622779 (081)5622781 (081)2203710 [email protected]
Kiribathgoda (011)5238065 (011)2916711 [email protected]
Matara (041)5410005 (041)5410006 (041)2232985 (041)2234926 [email protected]
Negombo (031)5677838 [email protected]
Panadura (038)2239610 (038)5678617 [email protected]
Polonnaruwa (027)5678995 [email protected]
Vauniya (024)5679544 [email protected]
Wellawatta (011)5633733 [email protected]
BRANCHES