broward boulevard corridor transit study
TRANSCRIPT
BROWARD BOULEVARDCORRIDOR TRANSIT STUDY FM # 42802411201
FINAL REPORTJuly 2012
GOBROWARD
Broward BoulevardCorridor Transit Study
FM # 42802411201
Prepared For:Ms. Khalilah Ffrench, PE, Project ManagerFlorida Department of Transportation, District 43400 West Commercial BoulevardFort Lauderdale, Florida 33309
Prepared By:Kittelson & Associates, Inc.110 E. Broward Boulevard, Suite 2410Ft. Lauderdale, FL 33301
July 2012
July 2012
I
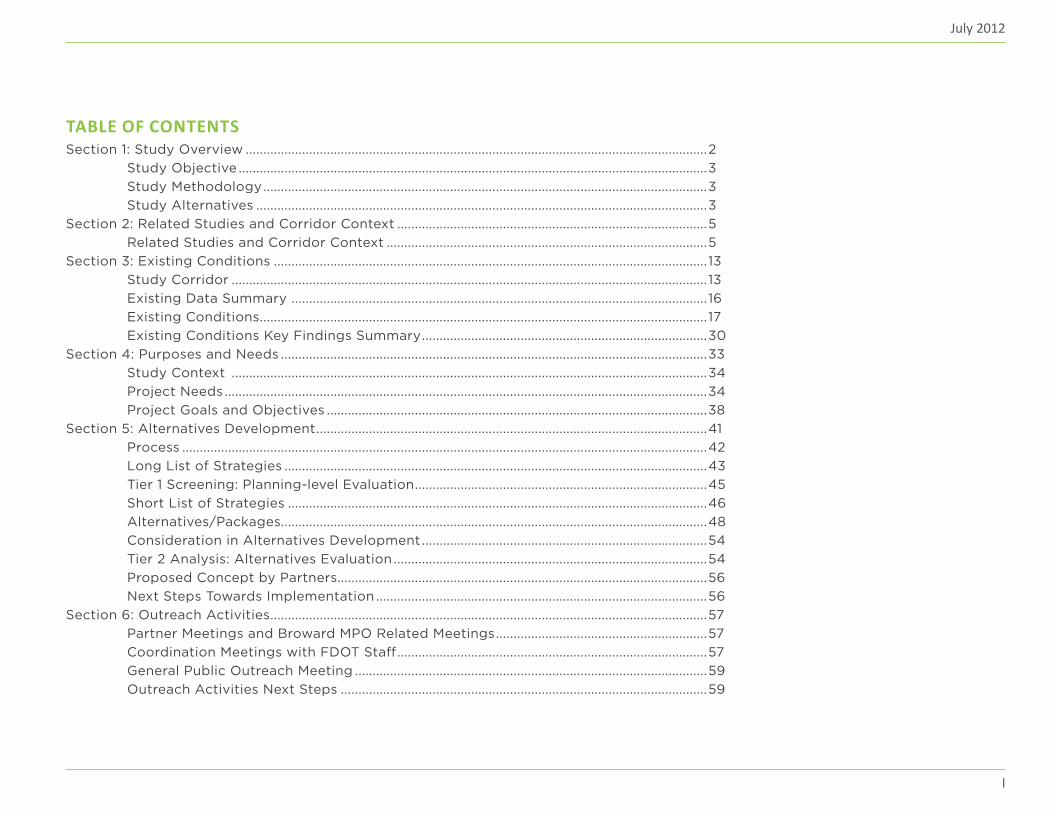
TABLE OF CONTENTSSection 1: Study Overview ...................................................................................................................................2 Study Objective .....................................................................................................................................3 Study Methodology ..............................................................................................................................3 Study Alternatives ................................................................................................................................3Section 2: Related Studies and Corridor Context ........................................................................................5 Related Studies and Corridor Context ...........................................................................................5 Section 3: Existing Conditions ...........................................................................................................................13 Study Corridor .......................................................................................................................................13 Existing Data Summary ......................................................................................................................16 Existing Conditions ...............................................................................................................................17 Existing Conditions Key Findings Summary .................................................................................30 Section 4: Purposes and Needs .........................................................................................................................33 Study Context .......................................................................................................................................34 Project Needs .........................................................................................................................................34 Project Goals and Objectives ............................................................................................................38Section 5: Alternatives Development ...............................................................................................................41 Process .....................................................................................................................................................42 Long List of Strategies ........................................................................................................................43 Tier 1 Screening: Planning-level Evaluation ...................................................................................45 Short List of Strategies .......................................................................................................................46 Alternatives/Packages.........................................................................................................................48 Consideration in Alternatives Development .................................................................................54 Tier 2 Analysis: Alternatives Evaluation .........................................................................................54 Proposed Concept by Partners.........................................................................................................56 Next Steps Towards Implementation ..............................................................................................56Section 6: Outreach Activities ............................................................................................................................57 Partner Meetings and Broward MPO Related Meetings ............................................................57 Coordination Meetings with FDOT Staff ........................................................................................57 General Public Outreach Meeting ....................................................................................................59 Outreach Activities Next Steps ........................................................................................................59
II | Kittelson & Associates, Inc.
Broward Boulevard Corridor Transit Study
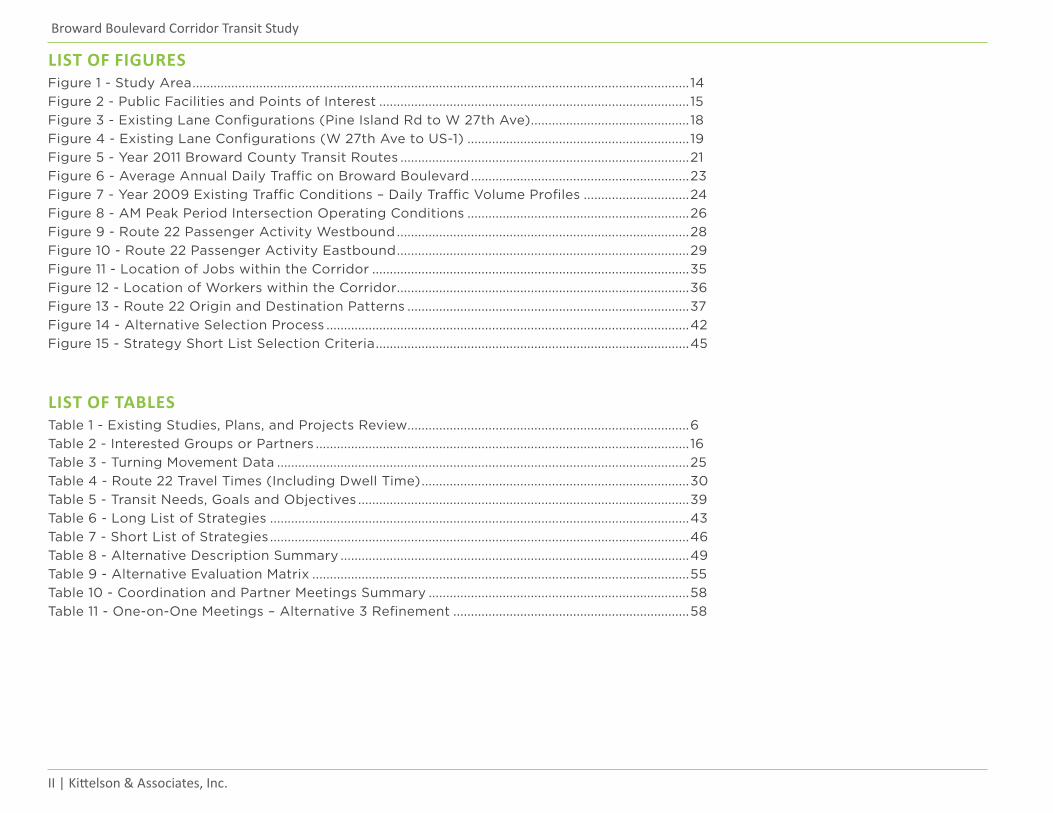
LIST OF FIGURESFigure 1 - Study Area .............................................................................................................................................14Figure 2 - Public Facilities and Points of Interest ........................................................................................15Figure 3 - Existing Lane Configurations (Pine Island Rd to W 27th Ave) ............................................. 18Figure 4 - Existing Lane Configurations (W 27th Ave to US-1) ............................................................... 19Figure 5 - Year 2011 Broward County Transit Routes ..................................................................................21Figure 6 - Average Annual Daily Traffic on Broward Boulevard ..............................................................23Figure 7 - Year 2009 Existing Traffic Conditions – Daily Traffic Volume Profiles ..............................24Figure 8 - AM Peak Period Intersection Operating Conditions ...............................................................26Figure 9 - Route 22 Passenger Activity Westbound ...................................................................................28Figure 10 - Route 22 Passenger Activity Eastbound ...................................................................................29Figure 11 - Location of Jobs within the Corridor ..........................................................................................35Figure 12 - Location of Workers within the Corridor ...................................................................................36Figure 13 - Route 22 Origin and Destination Patterns ................................................................................37Figure 14 - Alternative Selection Process .......................................................................................................42Figure 15 - Strategy Short List Selection Criteria .........................................................................................45
LIST OF TABLESTable 1 - Existing Studies, Plans, and Projects Review................................................................................6Table 2 - Interested Groups or Partners ..........................................................................................................16Table 3 - Turning Movement Data .....................................................................................................................25Table 4 - Route 22 Travel Times (Including Dwell Time) ............................................................................30Table 5 - Transit Needs, Goals and Objectives ..............................................................................................39Table 6 - Long List of Strategies .......................................................................................................................43Table 7 - Short List of Strategies .......................................................................................................................46Table 8 - Alternative Description Summary ...................................................................................................49Table 9 - Alternative Evaluation Matrix ...........................................................................................................55Table 10 - Coordination and Partner Meetings Summary ..........................................................................58Table 11 - One-on-One Meetings – Alternative 3 Refinement ...................................................................58

1
SECTION 1Study Overview

July 2012
33
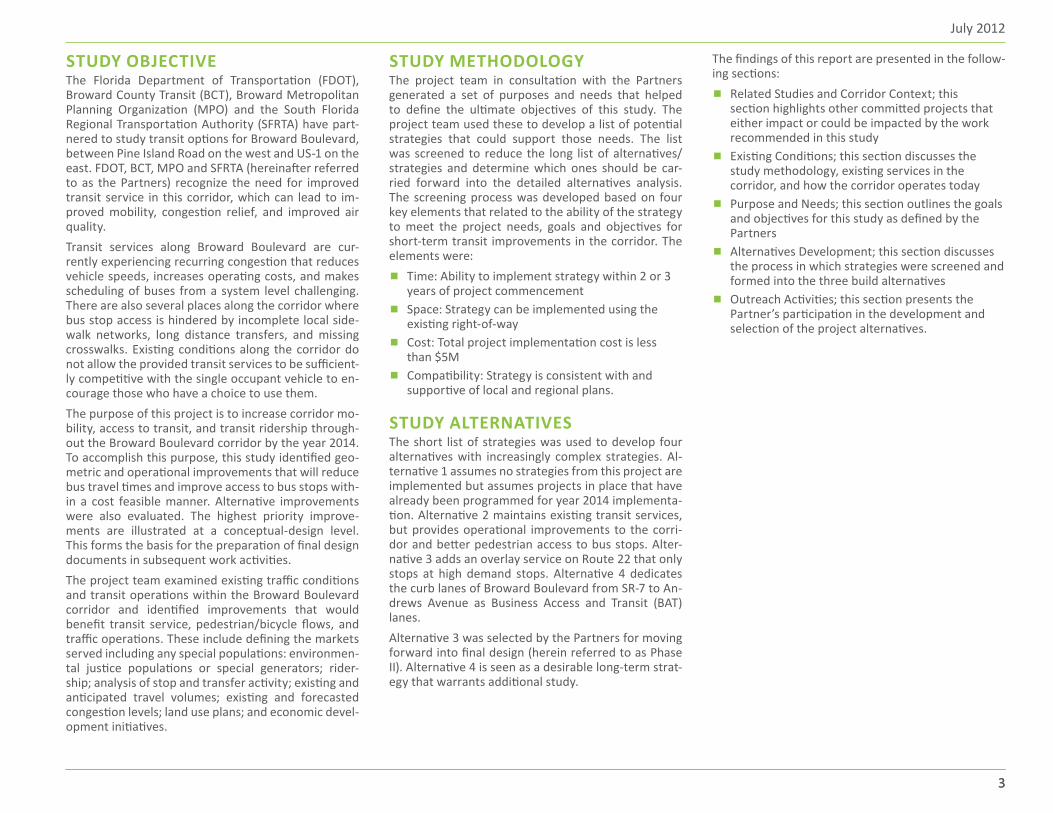
STUDY OBJECTIVEThe Florida Department of Transportation (FDOT), Broward County Transit (BCT), Broward Metropolitan Planning Organization (MPO) and the South Florida Regional Transportation Authority (SFRTA) have part-nered to study transit options for Broward Boulevard, between Pine Island Road on the west and US-1 on the east. FDOT, BCT, MPO and SFRTA (hereinafter referred to as the Partners) recognize the need for improved transit service in this corridor, which can lead to im-proved mobility, congestion relief, and improved air quality.Transit services along Broward Boulevard are cur-rently experiencing recurring congestion that reduces vehicle speeds, increases operating costs, and makes scheduling of buses from a system level challenging. There are also several places along the corridor where bus stop access is hindered by incomplete local side-walk networks, long distance transfers, and missing crosswalks. Existing conditions along the corridor do not allow the provided transit services to be sufficient-ly competitive with the single occupant vehicle to en-courage those who have a choice to use them.The purpose of this project is to increase corridor mo-bility, access to transit, and transit ridership through-out the Broward Boulevard corridor by the year 2014. To accomplish this purpose, this study identified geo-metric and operational improvements that will reduce bus travel times and improve access to bus stops with-in a cost feasible manner. Alternative improvements were also evaluated. The highest priority improve-ments are illustrated at a conceptual-design level. This forms the basis for the preparation of final design documents in subsequent work activities.The project team examined existing traffic conditions and transit operations within the Broward Boulevard corridor and identified improvements that would benefit transit service, pedestrian/bicycle flows, and traffic operations. These include defining the markets served including any special populations: environmen-tal justice populations or special generators; rider-ship; analysis of stop and transfer activity; existing and anticipated travel volumes; existing and forecasted congestion levels; land use plans; and economic devel-opment initiatives.
STUDY METHODOLOGYThe project team in consultation with the Partners generated a set of purposes and needs that helped to define the ultimate objectives of this study. The project team used these to develop a list of potential strategies that could support those needs. The list was screened to reduce the long list of alternatives/strategies and determine which ones should be car-ried forward into the detailed alternatives analysis. The screening process was developed based on four key elements that related to the ability of the strategy to meet the project needs, goals and objectives for short-term transit improvements in the corridor. The elements were:
▪ Time: Ability to implement strategy within 2 or 3 years of project commencement
▪ Space: Strategy can be implemented using the existing right-of-way
▪ Cost: Total project implementation cost is less than $5M
▪ Compatibility: Strategy is consistent with and supportive of local and regional plans.
STUDY ALTERNATIVESThe short list of strategies was used to develop four alternatives with increasingly complex strategies. Al-ternative 1 assumes no strategies from this project are implemented but assumes projects in place that have already been programmed for year 2014 implementa-tion. Alternative 2 maintains existing transit services, but provides operational improvements to the corri-dor and better pedestrian access to bus stops. Alter-native 3 adds an overlay service on Route 22 that only stops at high demand stops. Alternative 4 dedicates the curb lanes of Broward Boulevard from SR-7 to An-drews Avenue as Business Access and Transit (BAT) lanes.Alternative 3 was selected by the Partners for moving forward into final design (herein referred to as Phase II). Alternative 4 is seen as a desirable long-term strat-egy that warrants additional study.
The findings of this report are presented in the follow-ing sections:
▪ Related Studies and Corridor Context; this section highlights other committed projects that either impact or could be impacted by the work recommended in this study
▪ Existing Conditions; this section discusses the study methodology, existing services in the corridor, and how the corridor operates today
▪ Purpose and Needs; this section outlines the goals and objectives for this study as defined by the Partners
▪ Alternatives Development; this section discusses the process in which strategies were screened and formed into the three build alternatives
▪ Outreach Activities; this section presents the Partner’s participation in the development and selection of the project alternatives.

5
Related Studies and Corridor Context
SECTION 2
RELATED STUDIES AND CORRIDOR CONTEXTBroward Boulevard has been studied continuously for nearly 30 years and therefore a great deal of data has been collected and made available. A key component of this project was to distill the various data and identify the primary issues affecting the corridor and how each relates to the goals of im-proving transit service. A review of existing plans and studies was conduct-ed to compile a list of planned improvements and visions for the Broward Boulevard corridor and the surrounding region. The March 2010 Task 2 – Data Collection Technical Memorandum of the Broward Boulevard Transit Master Plan Phase 1, prepared by HDR Engineering, Inc., was used to draft a base-line list of existing studies and for its plan reviews. Additional studies and projects were identified by the Partners and through research. Table 1 sum-marizes the collective lists of studies and plans re-lated to the Broward Boulevard corridor as of June 2012.
For each study, general categories of content were identified. The categories included data collection, land use, traffic operations, transit, right-of-way, in-tersection/roadway improvements and pedestrian and bicycle information. Many of the documents had content pertaining to multiple categories. Key elements for each study were also summarized for information relevant to Broward Boulevard. The scopes for studies and projects that have direct im-pacts on the Broward Boulevard Corridor are pro-vided in Appendix A.
6 | Kittelson & Associates, Inc.
Broward Boulevard Corridor Transit Study
Lead
Agen
cy
Study
/Plan
/Pro
ject T
itle
Date
of St
udy/
Proje
ct
Data
Colle
ction
Land
Use
Traffi
c Ope
ratio
ns
Trans
it
Righ
t-of-W
ay
Inter
secti
on/R
oadw
ay Im
prov
emen
ts
Pede
strian
Bicyc
le
Key Elements
Florid
a Dep
artm
ent o
f Tra
nspo
rtatio
n
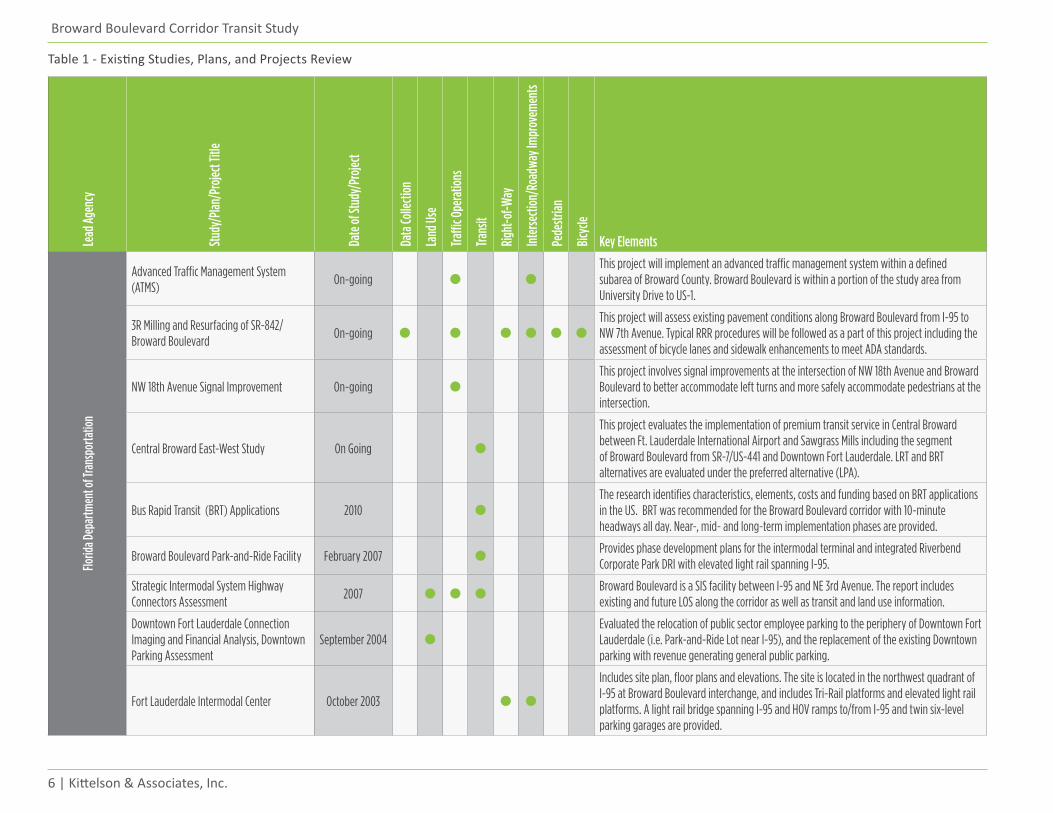
Advanced Traffic Management System (ATMS)
On-goingThis project will implement an advanced traffic management system within a defined subarea of Broward County. Broward Boulevard is within a portion of the study area from University Drive to US-1.
3R Milling and Resurfacing of SR-842/Broward Boulevard
On-goingThis project will assess existing pavement conditions along Broward Boulevard from I-95 to NW 7th Avenue. Typical RRR procedures will be followed as a part of this project including the assessment of bicycle lanes and sidewalk enhancements to meet ADA standards.
NW 18th Avenue Signal Improvement On-goingThis project involves signal improvements at the intersection of NW 18th Avenue and Broward Boulevard to better accommodate left turns and more safely accommodate pedestrians at the intersection.
Central Broward East-West Study On Going
This project evaluates the implementation of premium transit service in Central Broward between Ft. Lauderdale International Airport and Sawgrass Mills including the segment of Broward Boulevard from SR-7/US-441 and Downtown Fort Lauderdale. LRT and BRT alternatives are evaluated under the preferred alternative (LPA).
Bus Rapid Transit (BRT) Applications 2010The research identifies characteristics, elements, costs and funding based on BRT applications in the US. BRT was recommended for the Broward Boulevard corridor with 10-minute headways all day. Near-, mid- and long-term implementation phases are provided.
Broward Boulevard Park-and-Ride Facility February 2007Provides phase development plans for the intermodal terminal and integrated Riverbend Corporate Park DRI with elevated light rail spanning I-95.
Strategic Intermodal System Highway Connectors Assessment
2007Broward Boulevard is a SIS facility between I-95 and NE 3rd Avenue. The report includes existing and future LOS along the corridor as well as transit and land use information.
Downtown Fort Lauderdale Connection Imaging and Financial Analysis, Downtown Parking Assessment
September 2004Evaluated the relocation of public sector employee parking to the periphery of Downtown Fort Lauderdale (i.e. Park-and-Ride Lot near I-95), and the replacement of the existing Downtown parking with revenue generating general public parking.
Fort Lauderdale Intermodal Center October 2003
Includes site plan, floor plans and elevations. The site is located in the northwest quadrant of I-95 at Broward Boulevard interchange, and includes Tri-Rail platforms and elevated light rail platforms. A light rail bridge spanning I-95 and HOV ramps to/from I-95 and twin six-level parking garages are provided.
Table 1 - Existing Studies, Plans, and Projects Review
July 2012
7
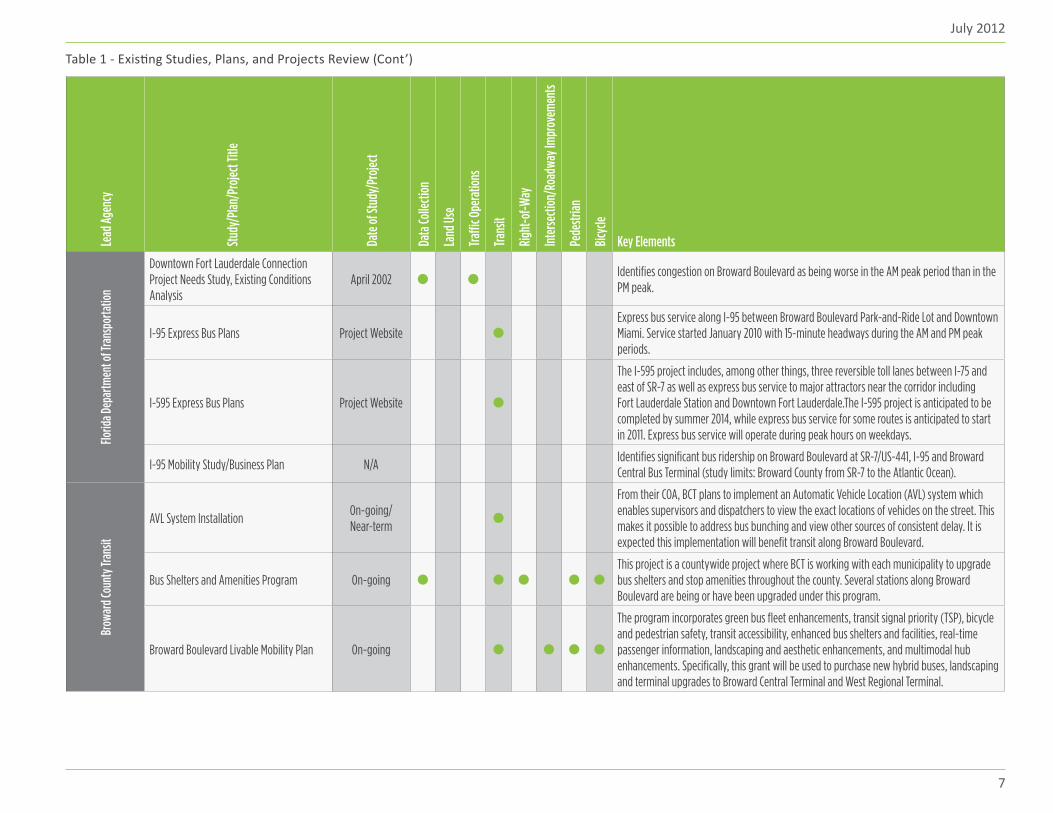
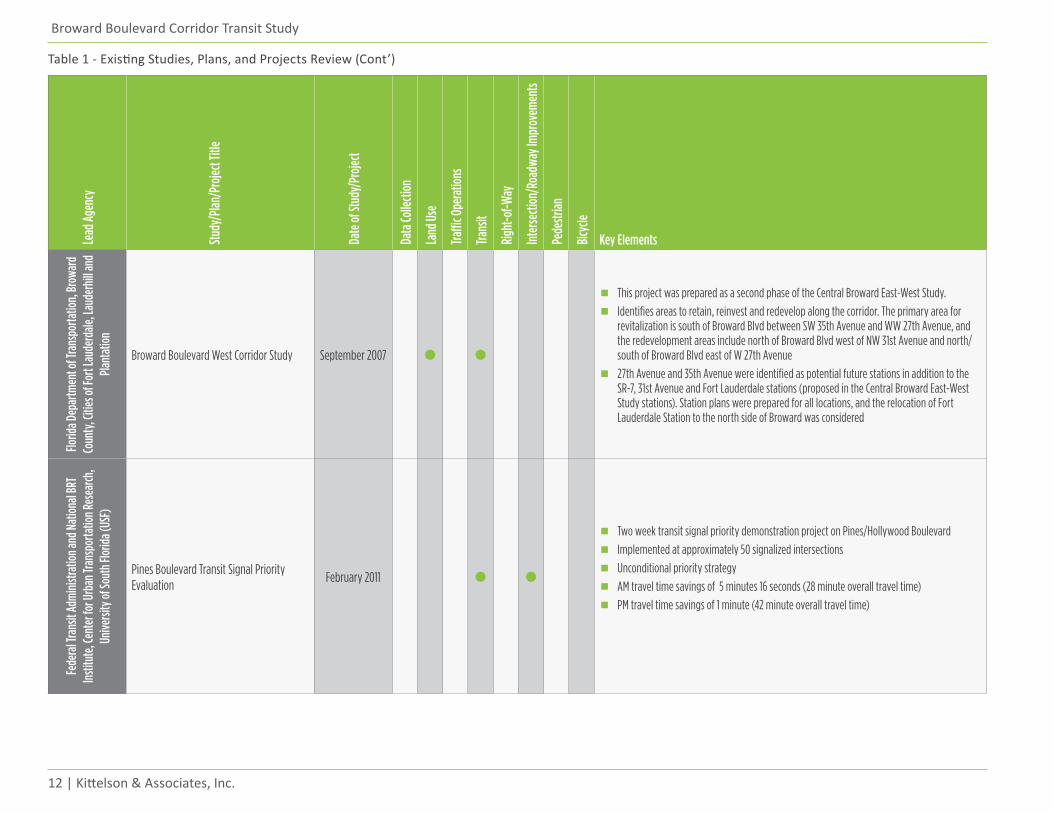
Table 1 - Existing Studies, Plans, and Projects Review (Cont’)
Lead
Agen
cy
Study
/Plan
/Pro
ject T
itle
Date
of St
udy/
Proje
ct
Data
Colle
ction
Land
Use
Traffi
c Ope
ratio
ns
Trans
it
Righ
t-of-W
ay
Inter
secti
on/R
oadw
ay Im
prov
emen
ts
Pede
strian
Bicyc
le
Key Elements
Florid
a Dep
artm
ent o
f Tra
nspo
rtatio
n
Downtown Fort Lauderdale Connection Project Needs Study, Existing Conditions Analysis
April 2002Identifies congestion on Broward Boulevard as being worse in the AM peak period than in the PM peak.
I-95 Express Bus Plans Project WebsiteExpress bus service along I-95 between Broward Boulevard Park-and-Ride Lot and Downtown Miami. Service started January 2010 with 15-minute headways during the AM and PM peak periods.
I-595 Express Bus Plans Project Website
The I-595 project includes, among other things, three reversible toll lanes between I-75 and east of SR-7 as well as express bus service to major attractors near the corridor including Fort Lauderdale Station and Downtown Fort Lauderdale.The I-595 project is anticipated to be completed by summer 2014, while express bus service for some routes is anticipated to start in 2011. Express bus service will operate during peak hours on weekdays.
I-95 Mobility Study/Business Plan N/AIdentifies significant bus ridership on Broward Boulevard at SR-7/US-441, I-95 and Broward Central Bus Terminal (study limits: Broward County from SR-7 to the Atlantic Ocean).
Brow
ard C
ount
y Tra
nsit
AVL System InstallationOn-going/ Near-term
From their COA, BCT plans to implement an Automatic Vehicle Location (AVL) system which enables supervisors and dispatchers to view the exact locations of vehicles on the street. This makes it possible to address bus bunching and view other sources of consistent delay. It is expected this implementation will benefit transit along Broward Boulevard.
Bus Shelters and Amenities Program On-goingThis project is a countywide project where BCT is working with each municipality to upgrade bus shelters and stop amenities throughout the county. Several stations along Broward Boulevard are being or have been upgraded under this program.
Broward Boulevard Livable Mobility Plan On-going
The program incorporates green bus fleet enhancements, transit signal priority (TSP), bicycle and pedestrian safety, transit accessibility, enhanced bus shelters and facilities, real-time passenger information, landscaping and aesthetic enhancements, and multimodal hub enhancements. Specifically, this grant will be used to purchase new hybrid buses, landscaping and terminal upgrades to Broward Central Terminal and West Regional Terminal.
8 | Kittelson & Associates, Inc.
Broward Boulevard Corridor Transit Study
Lead
Agen
cy
Study
/Plan
/Pro
ject T
itle
Date
of St
udy/
Proje
ct
Data
Colle
ction
Land
Use
Traffi
c Ope
ratio
ns
Trans
it
Righ
t-of-W
ay
Inter
secti
on/R
oadw
ay Im
prov
emen
ts
Pede
strian
Bicyc
le
Key Elements
Brow
ard C
ount
y Tra
nsit
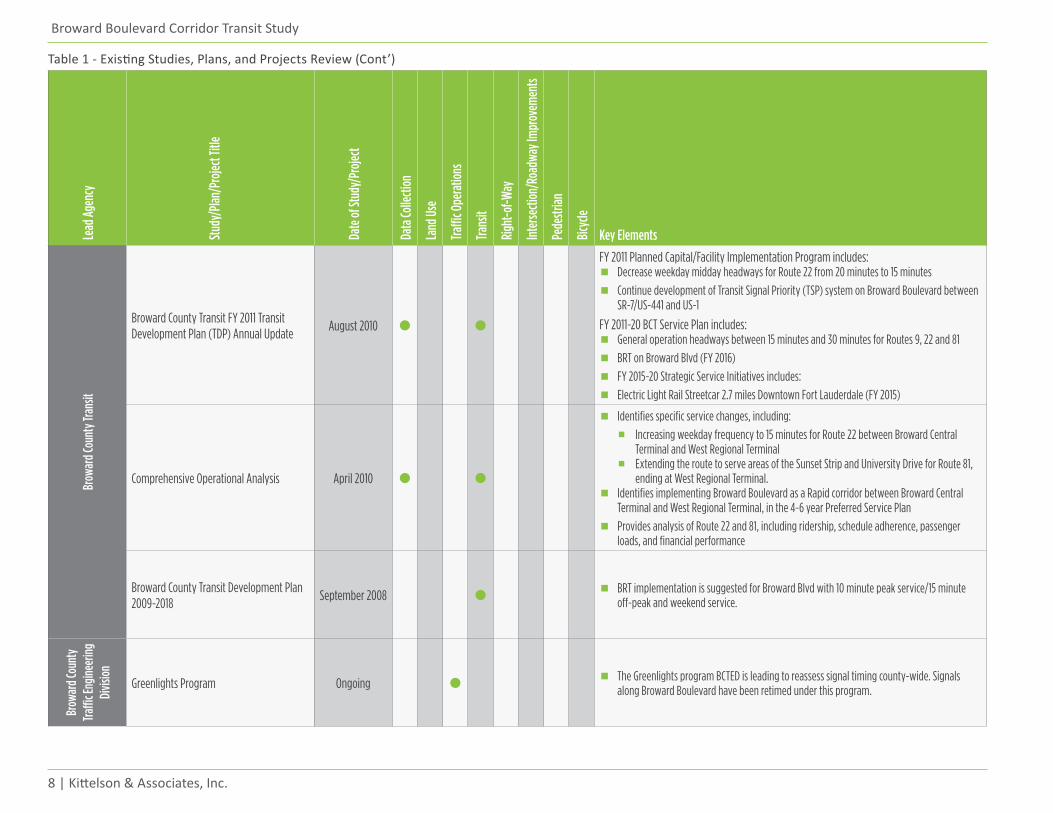
Broward County Transit FY 2011 Transit Development Plan (TDP) Annual Update
August 2010
FY 2011 Planned Capital/Facility Implementation Program includes:
▪ Decrease weekday midday headways for Route 22 from 20 minutes to 15 minutes
▪ Continue development of Transit Signal Priority (TSP) system on Broward Boulevard between SR-7/US-441 and US-1
FY 2011-20 BCT Service Plan includes:
▪ General operation headways between 15 minutes and 30 minutes for Routes 9, 22 and 81
▪ BRT on Broward Blvd (FY 2016)
▪ FY 2015-20 Strategic Service Initiatives includes:
▪ Electric Light Rail Streetcar 2.7 miles Downtown Fort Lauderdale (FY 2015)
Comprehensive Operational Analysis April 2010
▪ Identifies specific service changes, including:
▪ Increasing weekday frequency to 15 minutes for Route 22 between Broward Central Terminal and West Regional Terminal
▪ Extending the route to serve areas of the Sunset Strip and University Drive for Route 81, ending at West Regional Terminal.
▪ Identifies implementing Broward Boulevard as a Rapid corridor between Broward Central Terminal and West Regional Terminal, in the 4-6 year Preferred Service Plan
▪ Provides analysis of Route 22 and 81, including ridership, schedule adherence, passenger loads, and financial performance
Broward County Transit Development Plan 2009-2018
September 2008 ▪ BRT implementation is suggested for Broward Blvd with 10 minute peak service/15 minute off-peak and weekend service.
Brow
ard C
ount
y Tra
ffic E
ngine
ering
Di
vision
Greenlights Program Ongoing ▪ The Greenlights program BCTED is leading to reassess signal timing county-wide. Signals along Broward Boulevard have been retimed under this program.
Table 1 - Existing Studies, Plans, and Projects Review (Cont’)
July 2012
9
Lead
Agen
cy
Study
/Plan
/Pro
ject T
itle
Date
of St
udy/
Proje
ct
Data
Colle
ction
Land
Use
Traffi
c Ope
ratio
ns
Trans
it
Righ
t-of-W
ay
Inter
secti
on/R
oadw
ay Im
prov
emen
ts
Pede
strian
Bicyc
le
Key Elements
Brow
ard C
ount
y Plan
ning
and Z
oning
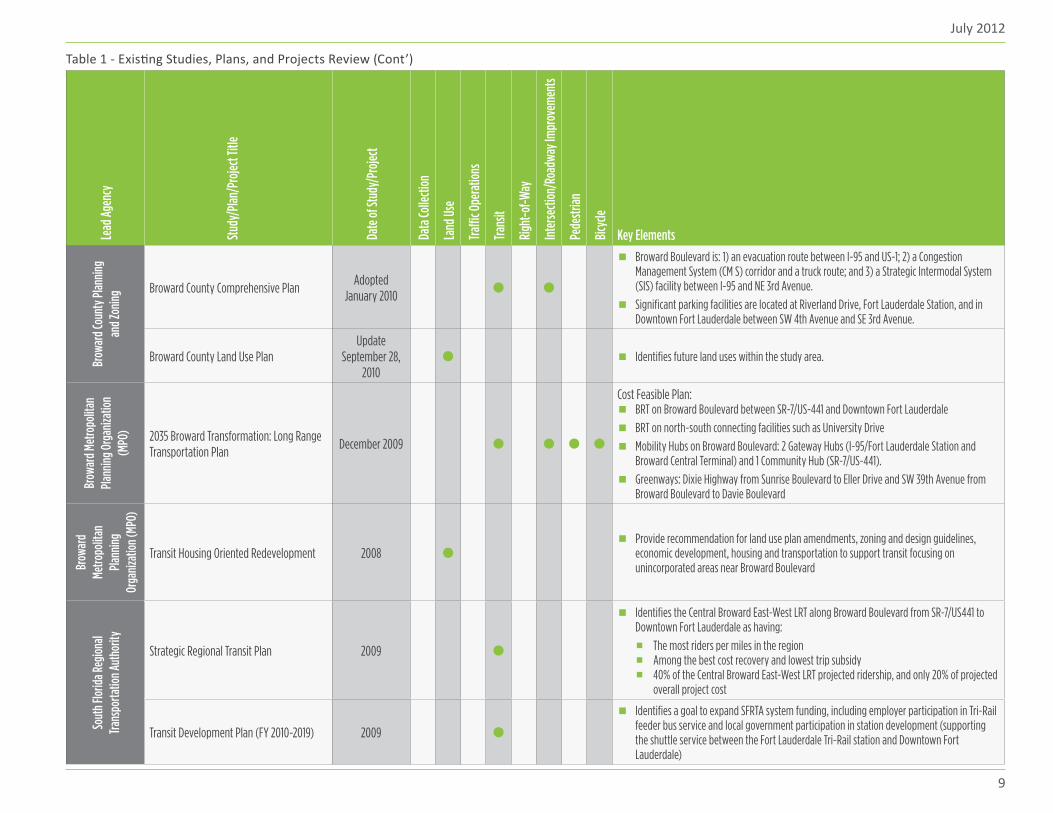
Broward County Comprehensive PlanAdopted
January 2010
▪ Broward Boulevard is: 1) an evacuation route between I-95 and US-1; 2) a Congestion Management System (CM S) corridor and a truck route; and 3) a Strategic Intermodal System (SIS) facility between I-95 and NE 3rd Avenue.
▪ Significant parking facilities are located at Riverland Drive, Fort Lauderdale Station, and in Downtown Fort Lauderdale between SW 4th Avenue and SE 3rd Avenue.
Broward County Land Use PlanUpdate
September 28, 2010
▪ Identifies future land uses within the study area.
Brow
ard M
etro
polit
an
Plann
ing O
rgan
izatio
n (M
PO) 2035 Broward Transformation: Long Range
Transportation PlanDecember 2009
Cost Feasible Plan:
▪ BRT on Broward Boulevard between SR-7/US-441 and Downtown Fort Lauderdale
▪ BRT on north-south connecting facilities such as University Drive
▪ Mobility Hubs on Broward Boulevard: 2 Gateway Hubs (I-95/Fort Lauderdale Station and Broward Central Terminal) and 1 Community Hub (SR-7/US-441).
▪ Greenways: Dixie Highway from Sunrise Boulevard to Eller Drive and SW 39th Avenue from Broward Boulevard to Davie Boulevard
Brow
ard
Metro
polit
an
Plann
ing
Orga
nizat
ion (M
PO)
Transit Housing Oriented Redevelopment 2008 ▪ Provide recommendation for land use plan amendments, zoning and design guidelines,
economic development, housing and transportation to support transit focusing on unincorporated areas near Broward Boulevard
Sout
h Flor
ida Re
giona
l Tra
nspo
rtatio
n Aut
horit
y
Strategic Regional Transit Plan 2009
▪ Identifies the Central Broward East-West LRT along Broward Boulevard from SR-7/US441 to Downtown Fort Lauderdale as having:
▪ The most riders per miles in the region ▪ Among the best cost recovery and lowest trip subsidy ▪ 40% of the Central Broward East-West LRT projected ridership, and only 20% of projected
overall project cost
Transit Development Plan (FY 2010-2019) 2009 ▪ Identifies a goal to expand SFRTA system funding, including employer participation in Tri-Rail
feeder bus service and local government participation in station development (supporting the shuttle service between the Fort Lauderdale Tri-Rail station and Downtown Fort Lauderdale)
Table 1 - Existing Studies, Plans, and Projects Review (Cont’)
10 | Kittelson & Associates, Inc.
Broward Boulevard Corridor Transit Study
Lead
Agen
cy
Study
/Plan
/Pro
ject T
itle
Date
of St
udy/
Proje
ct
Data
Colle
ction
Land
Use
Traffi
c Ope
ratio
ns
Trans
it
Righ
t-of-W
ay
Inter
secti
on/R
oadw
ay Im
prov
emen
ts
Pede
strian
Bicyc
le
Key Elements
Sout
h Flor
ida
Regio
nal
Trans
porta
tion
Auth
ority
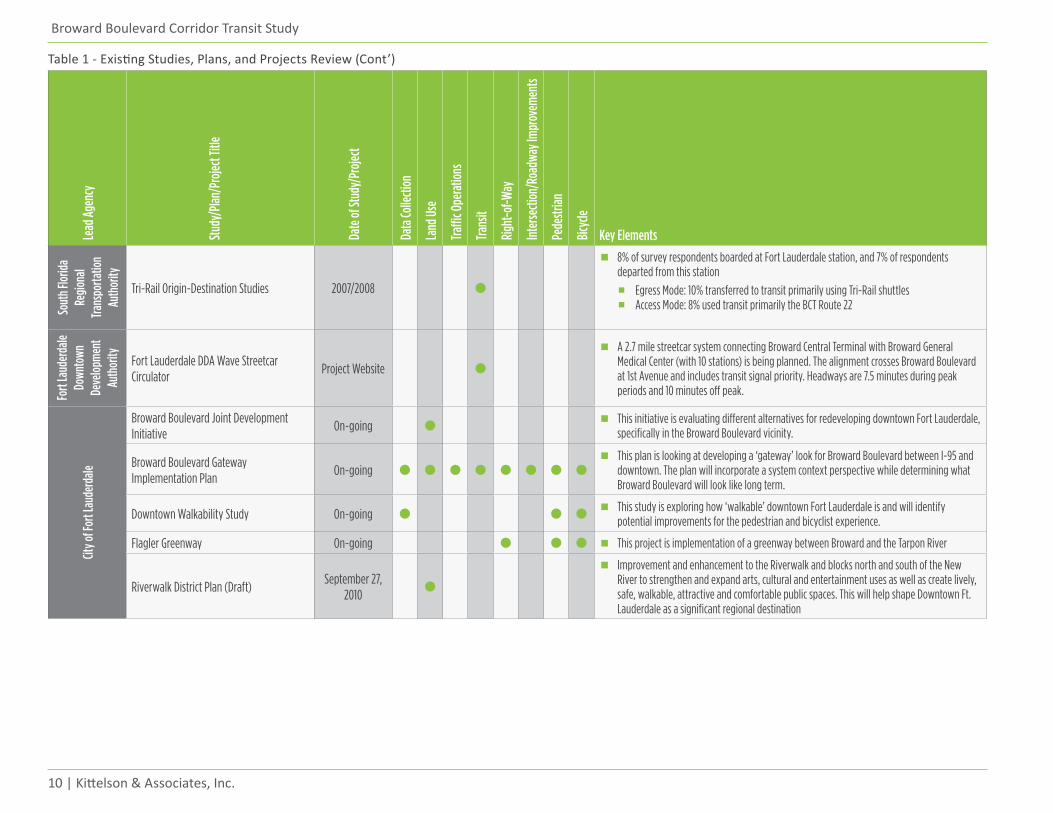
Tri-Rail Origin-Destination Studies 2007/2008
▪ 8% of survey respondents boarded at Fort Lauderdale station, and 7% of respondents departed from this station
▪ Egress Mode: 10% transferred to transit primarily using Tri-Rail shuttles ▪ Access Mode: 8% used transit primarily the BCT Route 22
Fort
Laud
erda
le Do
wnto
wn
Deve
lopm
ent
Auth
ority Fort Lauderdale DDA Wave Streetcar
CirculatorProject Website
▪ A 2.7 mile streetcar system connecting Broward Central Terminal with Broward General Medical Center (with 10 stations) is being planned. The alignment crosses Broward Boulevard at 1st Avenue and includes transit signal priority. Headways are 7.5 minutes during peak periods and 10 minutes off peak.
City o
f For
t Lau
derd
ale
Broward Boulevard Joint Development Initiative
On-going ▪ This initiative is evaluating different alternatives for redeveloping downtown Fort Lauderdale, specifically in the Broward Boulevard vicinity.
Broward Boulevard Gateway Implementation Plan
On-going ▪ This plan is looking at developing a ‘gateway’ look for Broward Boulevard between I-95 and
downtown. The plan will incorporate a system context perspective while determining what Broward Boulevard will look like long term.
Downtown Walkability Study On-going ▪ This study is exploring how ‘walkable’ downtown Fort Lauderdale is and will identify potential improvements for the pedestrian and bicyclist experience.
Flagler Greenway On-going ▪ This project is implementation of a greenway between Broward and the Tarpon River
Riverwalk District Plan (Draft) September 27,
2010
▪ Improvement and enhancement to the Riverwalk and blocks north and south of the New River to strengthen and expand arts, cultural and entertainment uses as well as create lively, safe, walkable, attractive and comfortable public spaces. This will help shape Downtown Ft. Lauderdale as a significant regional destination
Table 1 - Existing Studies, Plans, and Projects Review (Cont’)
July 2012
11
Lead
Agen
cy
Study
/Plan
/Pro
ject T
itle
Date
of St
udy/
Proje
ct
Data
Colle
ction
Land
Use
Traffi
c Ope
ratio
ns
Trans
it
Righ
t-of-W
ay
Inter
secti
on/R
oadw
ay Im
prov
emen
ts
Pede
strian
Bicyc
le
Key Elements
City o
f For
t Lau
derd
ale
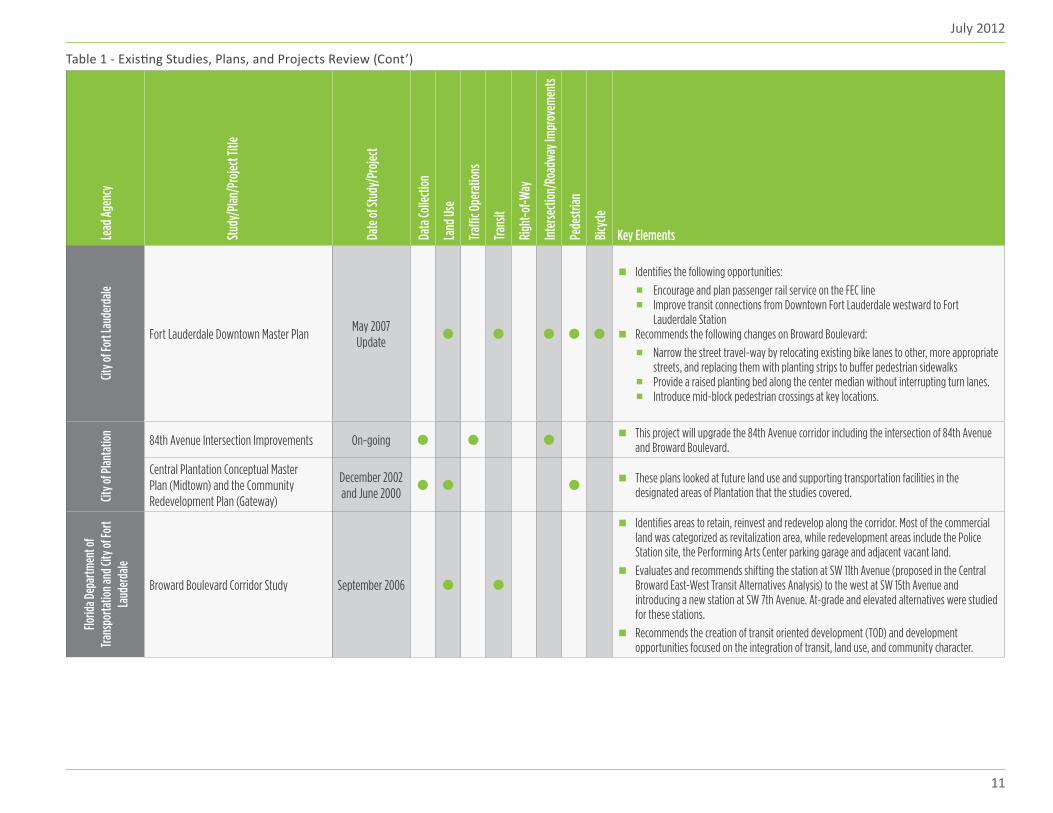
Fort Lauderdale Downtown Master PlanMay 2007 Update
▪ Identifies the following opportunities:
▪ Encourage and plan passenger rail service on the FEC line ▪ Improve transit connections from Downtown Fort Lauderdale westward to Fort
Lauderdale Station
▪ Recommends the following changes on Broward Boulevard:
▪ Narrow the street travel-way by relocating existing bike lanes to other, more appropriate streets, and replacing them with planting strips to buffer pedestrian sidewalks
▪ Provide a raised planting bed along the center median without interrupting turn lanes. ▪ Introduce mid-block pedestrian crossings at key locations.
City o
f Plan
tatio
n
84th Avenue Intersection Improvements On-going ▪ This project will upgrade the 84th Avenue corridor including the intersection of 84th Avenue and Broward Boulevard.
Central Plantation Conceptual Master Plan (Midtown) and the Community Redevelopment Plan (Gateway)
December 2002 and June 2000
▪ These plans looked at future land use and supporting transportation facilities in the designated areas of Plantation that the studies covered.
Florid
a Dep
artm
ent o
f Tra
nspo
rtatio
n and
City
of Fo
rt La
uder
dale
Broward Boulevard Corridor Study September 2006
▪ Identifies areas to retain, reinvest and redevelop along the corridor. Most of the commercial land was categorized as revitalization area, while redevelopment areas include the Police Station site, the Performing Arts Center parking garage and adjacent vacant land.
▪ Evaluates and recommends shifting the station at SW 11th Avenue (proposed in the Central Broward East-West Transit Alternatives Analysis) to the west at SW 15th Avenue and introducing a new station at SW 7th Avenue. At-grade and elevated alternatives were studied for these stations.
▪ Recommends the creation of transit oriented development (TOD) and development opportunities focused on the integration of transit, land use, and community character.
Table 1 - Existing Studies, Plans, and Projects Review (Cont’)
12 | Kittelson & Associates, Inc.
Broward Boulevard Corridor Transit Study
Lead
Agen
cy
Study
/Plan
/Pro
ject T
itle
Date
of St
udy/
Proje
ct
Data
Colle
ction
Land
Use
Traffi
c Ope
ratio
ns
Trans
it
Righ
t-of-W
ay
Inter
secti
on/R
oadw
ay Im
prov
emen
ts
Pede
strian
Bicyc
le
Key Elements
Florid
a Dep
artm
ent o
f Tra
nspo
rtatio
n, Br
owar
d Co
unty,
Citie
s of F
ort L
aude
rdale
, Lau
derh
ill an
d Pla
ntat
ion
Broward Boulevard West Corridor Study September 2007
▪ This project was prepared as a second phase of the Central Broward East-West Study.
▪ Identifies areas to retain, reinvest and redevelop along the corridor. The primary area for revitalization is south of Broward Blvd between SW 35th Avenue and WW 27th Avenue, and the redevelopment areas include north of Broward Blvd west of NW 31st Avenue and north/south of Broward Blvd east of W 27th Avenue
▪ 27th Avenue and 35th Avenue were identified as potential future stations in addition to the SR-7, 31st Avenue and Fort Lauderdale stations (proposed in the Central Broward East-West Study stations). Station plans were prepared for all locations, and the relocation of Fort Lauderdale Station to the north side of Broward was considered
Fede
ral T
rans
it Ad
mini
strat
ion an
d Nat
ional
BRT
Insti
tute
, Cen
ter f
or U
rban
Tran
spor
tatio
n Res
earch
, Un
iversi
ty of
Sout
h Flor
ida (U
SF)
Pines Boulevard Transit Signal Priority Evaluation
February 2011
▪ Two week transit signal priority demonstration project on Pines/Hollywood Boulevard
▪ Implemented at approximately 50 signalized intersections
▪ Unconditional priority strategy
▪ AM travel time savings of 5 minutes 16 seconds (28 minute overall travel time)
▪ PM travel time savings of 1 minute (42 minute overall travel time)
Table 1 - Existing Studies, Plans, and Projects Review (Cont’)
13
Existing ConditionsSECTION 3
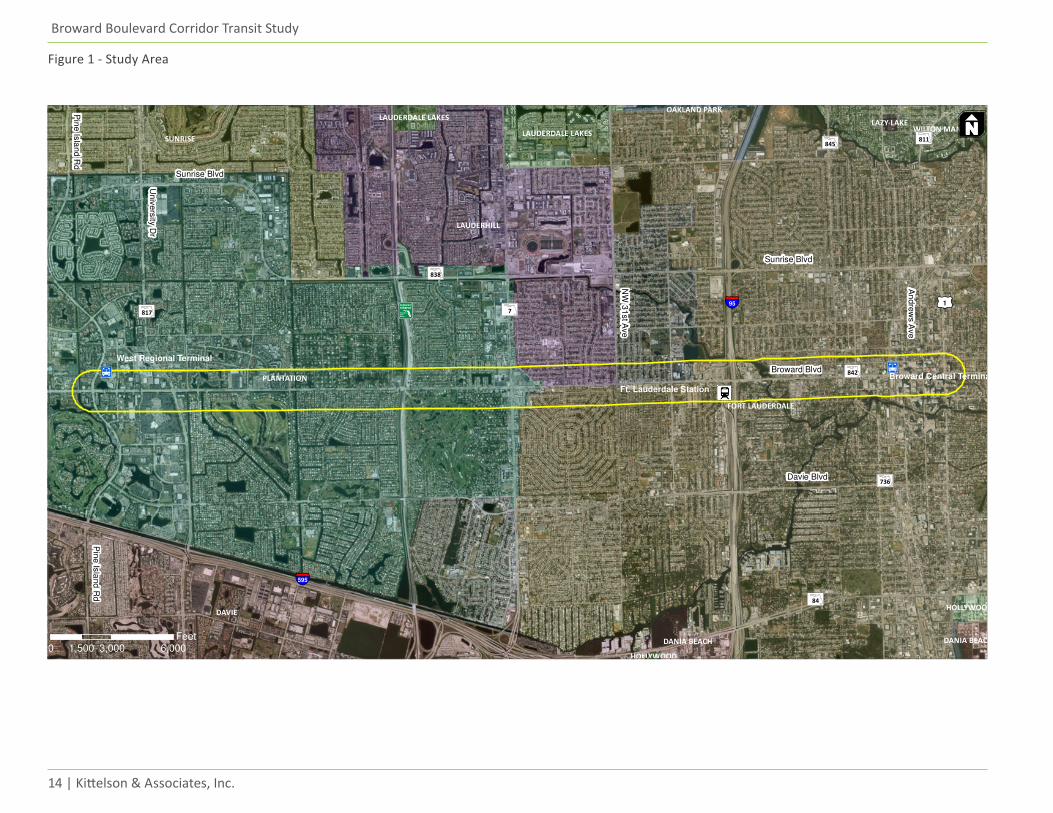
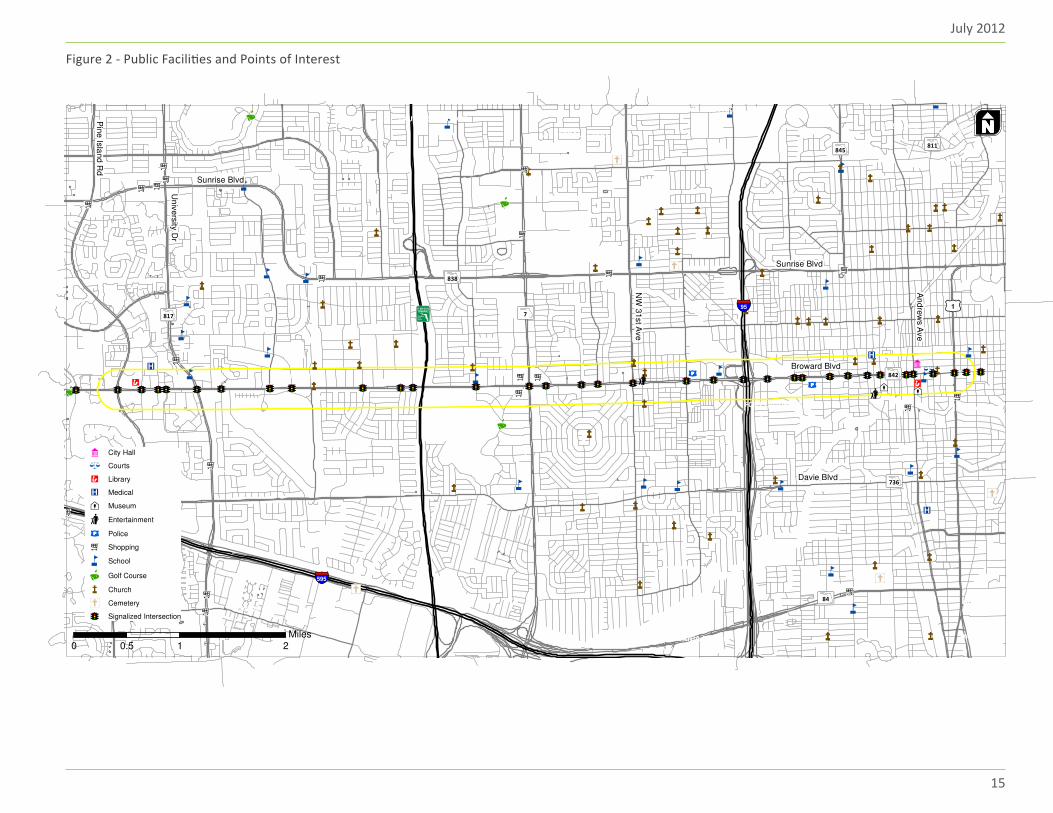
STUDY CORRIDORBroward Boulevard provides east/west connec-tion between US-1 and N Flamingo Road. There are over 30 signalized intersections and dozens of unsignalized access points serving businesses and residential areas along the study corridor. Figure 1 illustrates the study area. Figure 2 illustrates the existing travel destinations along and in the region of the corridor.The portion of the Broward Boulevard corridor that is the focus of this study is the 8-mile section be-tween Pine Island Road and US-1 (Federal Highway). The eastern portion of the corridor between US-1 and I-95 is a Central Business District (Downtown Fort Lauderdale) with a high concentration of com-mercial and offices uses and has buildings situated up to the right-of-way, eliminating the possibility of transportation facility expansion. The portion be-tween I-95 and SR-7/US-441 is a transition/subur-ban area with strip mall and residential uses. The western portion of the corridor between SR-7/US-441 and Pine Island Road is primarily residential with commercial uses located near major intersec-tions. Although the western section is in a more suburban-like setting, there are still constraints preventing easy expansion of transportation facili-ties beyond the existing right-of-way due to nearby canals and the existing built environment.
The 8-mile study corridor is a six-lane facility with a posted speed limit of 35 miles per hour (mph) along the eastern portion of the corridor (between US-1 and NW 9th Avenue), 40 mph along the mid portion of the corridor (between NW 9th Avenue and SR-7/US-441), and 45 mph along the western portion of the corridor (between SR-7/US-441 and Pine Island Road). The study corridor is owned and maintained by two agencies. The Florida Department of Trans-portation (FDOT) owns and maintains the section between US-1 and SR-817 (University Drive) which is designated as SR-842. Broward County owns and maintains the section between SR-817 and Pine Is-land Road.
14 | Kittelson & Associates, Inc.
Broward Boulevard Corridor Transit Study
Figure 1 - Study Area
PLANTATION
FORT LAUDERDALE
DAVIE
LAUDERHILL
SUNRISEWILTON MANORSLAUDERDALE LAKES
DANIA BEACH DANIA BEACH
HOLLYWOOD
OAKLAND PARKLAUDERDALE LAKES LAZY LAKE
HOLLYWOOD
1FIGURE
595
95 17
845
817
838
736
842
84
Broward Blvd
Davie Blvd
Sunrise Blvd
Un
ive
rsity
Dr
An
dre
ws A
ve
NW
31
st A
ve
Sunrise Blvd
Pin
e Is
lan
d R
d
Pin
e Is
lan
d R
d
0 3,000 6,0001,500Feet
811
West Regional Terminal
Broward Central Terminal
Ft. Lauderdale Station
July 2012
15
Figure 2 - Public Facilities and Points of Interest
ÆP
ÆP
ÆP
PLANTATION
FORT LAUDERDALE
DAVIE
LAUDERHILL
SUNRISEWILTON MANORSLAUDERDALE LAKES
DANIA BEACH DANIA BEACH
OAKLAND PARK
HOLLYWOOD
LAUDERDALE LAKESLAZY LAKE
HOLLYWOOD
2FIGURE
595
95 17
845
817
838
736
842
84
Broward Blvd
Davie Blvd
Sunrise Blvd
Un
ive
rsity
Dr
An
dre
ws A
ve
NW
31
st A
ve
Sunrise Blvd
Pin
e Is
lan
d R
d
Pin
e Is
lan
d R
d
0 1 20.5Miles
811
City Hall
Courts
Library
ÆP Medical
Museum
Entertainment
Police
Shopping
School
Golf Course
Church
Cemetery
Signalized Intersection
16 | Kittelson & Associates, Inc.
Broward Boulevard Corridor Transit Study
16 | Kittelson & Associates, Inc.
EXISTING DATA SUMMARYThe data collection effort for this project was estab-lished with the Broward Boulevard Transit Master Plan Phase 1 study by HDR Engineering, Inc. This study re-lied on data that had been collected for other stud-ies as its starting point. New data was collected or updated only as necessary. The following steps were followed:1. Build upon the previous Broward Boulevard Tran-
sit Master Plan Phase 1 (2010), Task 2 – Data Col-lection Technical Memorandum (March 2010)
2. Compare scope of Transit Master Plan with scope of project
3. Identify areas where data was missing4. Identify new and supplemental information.
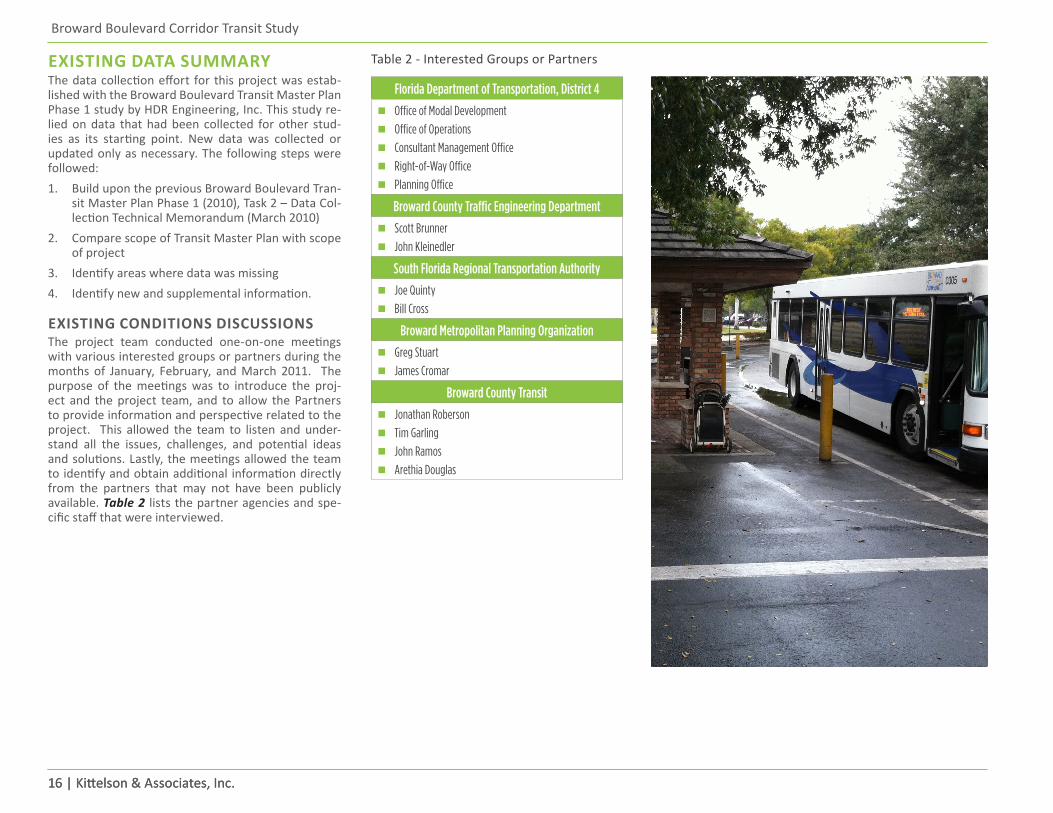
EXISTING CONDITIONS DISCUSSIONSThe project team conducted one-on-one meetings with various interested groups or partners during the months of January, February, and March 2011. The purpose of the meetings was to introduce the proj-ect and the project team, and to allow the Partners to provide information and perspective related to the project. This allowed the team to listen and under-stand all the issues, challenges, and potential ideas and solutions. Lastly, the meetings allowed the team to identify and obtain additional information directly from the partners that may not have been publicly available. Table 2 lists the partner agencies and spe-cific staff that were interviewed.
Table 2 - Interested Groups or Partners
Florida Department of Transportation, District 4
▪ Office of Modal Development
▪ Office of Operations
▪ Consultant Management Office
▪ Right-of-Way Office
▪ Planning Office
Broward County Traffic Engineering Department
▪ Scott Brunner
▪ John Kleinedler
South Florida Regional Transportation Authority
▪ Joe Quinty
▪ Bill Cross
Broward Metropolitan Planning Organization
▪ Greg Stuart
▪ James Cromar
Broward County Transit
▪ Jonathan Roberson
▪ Tim Garling
▪ John Ramos
▪ Arethia Douglas
July 2012
1717
FIELD VISIT The Broward Boulevard corridor was inventoried and traffic operations were observed in January, February, and March 2011. The field review includes the follow-ing:
▪ Roadway Characteristics
▪ Traffic Characteristics
▪ Peak AM and PM peak hours and non-peak times
▪ Location and extent of congestion and delay ▪ Transit Characteristics
▪ Routes ▪ Bus Stops ▪ Transfer locations
TRAFFIC COUNTSTurning movement counts, 24-hour traffic volume counts, and pedestrian data were obtained and re-viewed along the corridor. Following is a summary of each type of count data.Turning Movement CountsBroward County Traffic Engineering Department (BCTED) provided Synchro files and turning movement counts for Broward Boulevard. The turning movement counts are for the signalized intersections from Uni-versity Drive (SR-817) to US-1 and were collected dur-ing the AM and midday peak hours in late 2008 and early 2009. Neither PM nor evening peak hour turning movement volumes were provided.In 2010, manual turning movement counts were con-ducted by FDOT District 4 for some of the existing study intersections along Broward Boulevard in association with the Central Broward East-West Transit Study. All of the counts used in this analysis were conducted on a typical mid-week day in April 2010 during the AM (7:00 to 9:00) and PM (4:00 to 6:00) peak periods. The counts were done at intersections from SR-7/US-441 to US-1. In addition, 2011 turning movement counts were also collected as part of the Broward Boulevard East-West Study in the vicinity of the I-95 ramps, Fort Lauderdale Station, and the Park-and-Ride Lot in the month of April during the AM (7:00 to 9:00) and PM (4:30 to 6:30) peak periods.
24-Hour Traffic Volume ProfilesHistoric AADTs were obtained from FDOT for 13 loca-tions along the corridor from University Drive to US-1. These counts were conducted as recently as 2009.Pedestrian and Bicycle CountsPedestrian counts were collected by FDOT District 4 at the same study intersections as the April 2010 turn-ing movement counts. These counts were taken dur-ing the weekday AM and PM peak hours on a typical weekday.Bicycle counts were not collected.
TRANSIT ROUTE AND RIDERSHIP DATABroward County Transit (BCT) routes and schedules were reviewed to inventory transit service along Bro-ward Boulevard. Detailed ridership transaction data collected by BCT during the summer 2009 for the Comprehensive Operational Analysis was provided for all routes, including Routes 1, 10, and 20, in downtown Fort Lauderdale and Routes 9, 22 and 81 which oper-ate along portions of Broward Boulevard within the study area.Information was also gathered for a number of other transit options on Broward Boulevard that provide di-rect service and transfer connections along the cor-ridor. These include rail service (Tri-Rail and Amtrak) and bus service (Broward County Transit fixed route, Breeze, Sun Trolley, I 95 Express, Tri-Rail Shuttle, and Tri-Rail NW Community Link). There are a number of major transfer facilities, including the West Regional Terminal, the Ft. Lauderdale Station, and the Broward Central Terminal.
TRAFFIC OPERATIONS MODELBCTED provided weekday AM and mid-day peak hour Synchro models for Broward Boulevard. These mod-els contained lane configurations, signal timings, and historic (2008) traffic volumes at most signalized in-tersections along the corridor. The lane configurations and traffic operations were verified through field vis-its, and traffic volumes were updated with April 2010 counts.
EXISTING CONDITIONSThe existing conditions analysis identifies the study area conditions of the Broward Boulevard corridor. The analysis includes roadway and transit facilities, traffic volumes for vehicles, transit ridership and travel times data. The purpose of this section is to set the stage for a basis of comparison to future conditions. Detailed information on traffic and transit conditions are provided in Appendix B.
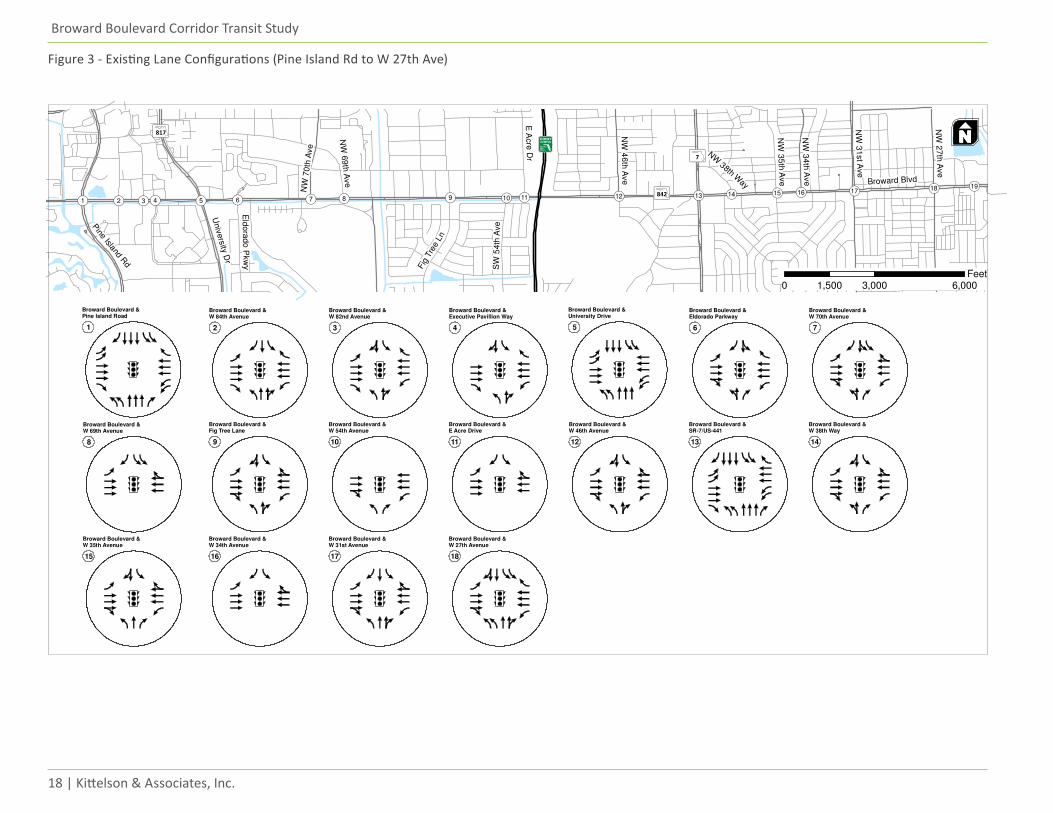
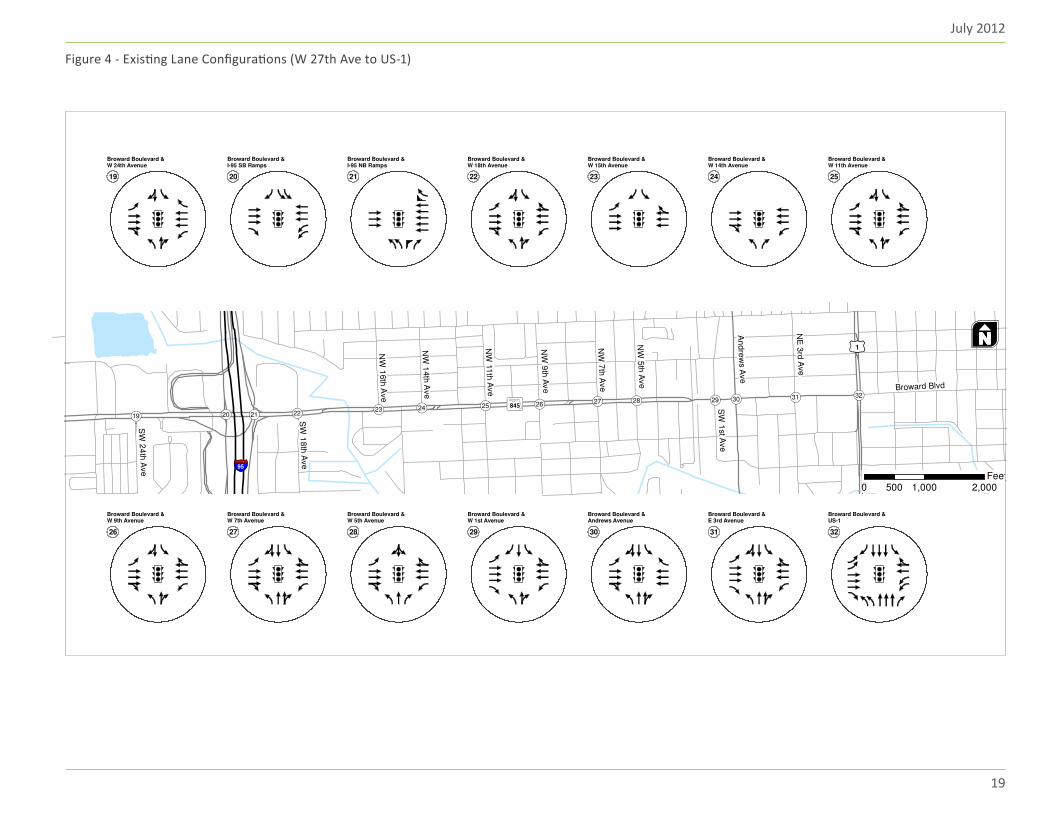
STUDY AREA CHARACTERISTICSThis section provides a description of the roadway and transit facilities that exist today.Roadway FacilitiesThe cross-section of Broward Boulevard is consistently six-lanes along the corridor. A landscaped median is established along the entire corridor. The median lim-its left-turns to unsignalized intersections at certain lo-cations, while left-turns from unsignalized side streets and driveways are prohibited. There are sidewalks and interrupted bike lanes on both sides of the corridor. On-street parking is not permitted. There are 32 signalized intersections within the study corridor. Figures 3 and 4 illustrate the existing lane configurations and traffic control devices at the study intersections and corresponding number of lanes on the corridor and adjacent roadways for the 28 inter-sections included in the FDOT owned portion of the corridor.
Signal TimingSignal timing and coordination data for Broward Boulevard (between University Drive and US-1) was provided by BCTED in a number of formats. The infor-mation provided is reflective of timing changes BCTED implemented in the fall 2010, under their Green Lights program. The 2008 AM and mid-day Synchro models contain timing and phasing information that is consistent throughout the entire day. The key timing and phas-ing information in the Synchro files were not modified during recent timing updates. Additionally, BCTED provide the updated cycle length, split times, and co-ordination plans for all time periods. The cycle length during the AM, mid-day and PM peak periods is 160 seconds throughout the entire corridor.
18 | Kittelson & Associates, Inc.
Broward Boulevard Corridor Transit Study
Figure 3 - Existing Lane Configurations (Pine Island Rd to W 27th Ave)
1 2 3 4 9876519181716151413121110
FIGURE
7
817
842
Broward Blvd
Univ
ers
ity D
r
Pine Island R
d
0 3,000 6,0001,500Feet
5
Broward Boulevard &University Drive
6
Broward Boulevard &Eldorado Parkway
7
Broward Boulevard &W 70th Avenue
8
Broward Boulevard &W 69th Avenue
9
Broward Boulevard &Fig Tree Lane
10
Broward Boulevard &W 54th Avenue
11
Broward Boulevard &E Acre Drive
12
Broward Boulevard &W 46th Avenue
13
Broward Boulevard &SR-7/US-441
14
Broward Boulevard &W 38th Way
15
Broward Boulevard &W 35th Avenue
16
Broward Boulevard &W 34th Avenue
17
Broward Boulevard &W 31st Avenue
18
Broward Boulevard &W 27th Avenue
Eld
or a
do
Pkw
y
NW
70
th A
ve
NW
69
th A
ve
Fig
Tre
e L
n
SW
54
th A
ve
E A
cr e
Dr
NW
46
th A
ve
NW
38th Way
NW
35
t h A
ve
NW
34
t h A
ve
NW
31
st A
ve
NW
27
t h A
ve
1
Broward Boulevard &Pine Island Road
2
Broward Boulevard &W 84th Avenue
3
Broward Boulevard &W 82nd Avenue
4
Broward Boulevard &Executive Pavillion Way
July 2012
19
Figure 4 - Existing Lane Configurations (W 27th Ave to US-1)
3231302928272625242322212019
FIGURE
95
1
845
Broward Blvd
An
dre
ws A
ve
0 1,000 2,000500Feet
19
Broward Boulevard &W 24th Avenue
20
Broward Boulevard &I-95 SB Ramps
21
Broward Boulevard &I-95 NB Ramps
22
Broward Boulevard &W 18th Avenue
23
Broward Boulevard &W 15th Avenue
24
Broward Boulevard &W 14th Avenue
25
Broward Boulevard &W 11th Avenue
26
Broward Boulevard &W 9th Avenue
27
Broward Boulevard &W 7th Avenue
28
Broward Boulevard &W 5th Avenue
29
Broward Boulevard &W 1st Avenue
30
Broward Boulevard &Andrews Avenue
31
Broward Boulevard &E 3rd Avenue
32
Broward Boulevard &US-1
NE
3rd
Ave
SW
1st A
ve
NW
5t h
Ave
NW
7t h
Ave
NW
9t h
Ave
NW
11
t h A
ve
NW
14th
Ave
NW
16th
Ave
SW
18
th A
ve
SW
24
t h A
ve
20 | Kittelson & Associates, Inc.
Broward Boulevard Corridor Transit Study
20 | Kittelson & Associates, Inc.
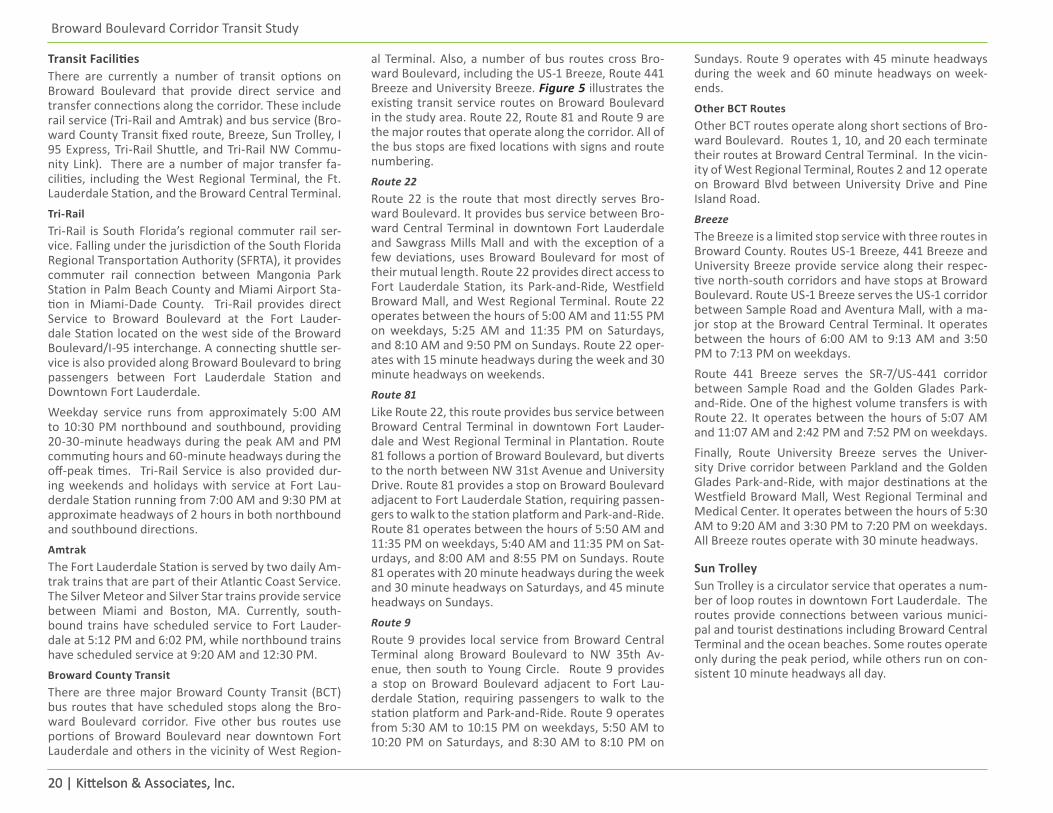
Transit FacilitiesThere are currently a number of transit options on Broward Boulevard that provide direct service and transfer connections along the corridor. These include rail service (Tri-Rail and Amtrak) and bus service (Bro-ward County Transit fixed route, Breeze, Sun Trolley, I 95 Express, Tri-Rail Shuttle, and Tri-Rail NW Commu-nity Link). There are a number of major transfer fa-cilities, including the West Regional Terminal, the Ft. Lauderdale Station, and the Broward Central Terminal.Tri-RailTri-Rail is South Florida’s regional commuter rail ser-vice. Falling under the jurisdiction of the South Florida Regional Transportation Authority (SFRTA), it provides commuter rail connection between Mangonia Park Station in Palm Beach County and Miami Airport Sta-tion in Miami-Dade County. Tri-Rail provides direct Service to Broward Boulevard at the Fort Lauder-dale Station located on the west side of the Broward Boulevard/I-95 interchange. A connecting shuttle ser-vice is also provided along Broward Boulevard to bring passengers between Fort Lauderdale Station and Downtown Fort Lauderdale.Weekday service runs from approximately 5:00 AM to 10:30 PM northbound and southbound, providing 20-30-minute headways during the peak AM and PM commuting hours and 60-minute headways during the off-peak times. Tri-Rail Service is also provided dur-ing weekends and holidays with service at Fort Lau-derdale Station running from 7:00 AM and 9:30 PM at approximate headways of 2 hours in both northbound and southbound directions.AmtrakThe Fort Lauderdale Station is served by two daily Am-trak trains that are part of their Atlantic Coast Service. The Silver Meteor and Silver Star trains provide service between Miami and Boston, MA. Currently, south-bound trains have scheduled service to Fort Lauder-dale at 5:12 PM and 6:02 PM, while northbound trains have scheduled service at 9:20 AM and 12:30 PM.Broward County Transit There are three major Broward County Transit (BCT) bus routes that have scheduled stops along the Bro-ward Boulevard corridor. Five other bus routes use portions of Broward Boulevard near downtown Fort Lauderdale and others in the vicinity of West Region-
al Terminal. Also, a number of bus routes cross Bro-ward Boulevard, including the US-1 Breeze, Route 441 Breeze and University Breeze. Figure 5 illustrates the existing transit service routes on Broward Boulevard in the study area. Route 22, Route 81 and Route 9 are the major routes that operate along the corridor. All of the bus stops are fixed locations with signs and route numbering.Route 22 Route 22 is the route that most directly serves Bro-ward Boulevard. It provides bus service between Bro-ward Central Terminal in downtown Fort Lauderdale and Sawgrass Mills Mall and with the exception of a few deviations, uses Broward Boulevard for most of their mutual length. Route 22 provides direct access to Fort Lauderdale Station, its Park-and-Ride, Westfield Broward Mall, and West Regional Terminal. Route 22 operates between the hours of 5:00 AM and 11:55 PM on weekdays, 5:25 AM and 11:35 PM on Saturdays, and 8:10 AM and 9:50 PM on Sundays. Route 22 oper-ates with 15 minute headways during the week and 30 minute headways on weekends. Route 81Like Route 22, this route provides bus service between Broward Central Terminal in downtown Fort Lauder-dale and West Regional Terminal in Plantation. Route 81 follows a portion of Broward Boulevard, but diverts to the north between NW 31st Avenue and University Drive. Route 81 provides a stop on Broward Boulevard adjacent to Fort Lauderdale Station, requiring passen-gers to walk to the station platform and Park-and-Ride. Route 81 operates between the hours of 5:50 AM and 11:35 PM on weekdays, 5:40 AM and 11:35 PM on Sat-urdays, and 8:00 AM and 8:55 PM on Sundays. Route 81 operates with 20 minute headways during the week and 30 minute headways on Saturdays, and 45 minute headways on Sundays. Route 9Route 9 provides local service from Broward Central Terminal along Broward Boulevard to NW 35th Av-enue, then south to Young Circle. Route 9 provides a stop on Broward Boulevard adjacent to Fort Lau-derdale Station, requiring passengers to walk to the station platform and Park-and-Ride. Route 9 operates from 5:30 AM to 10:15 PM on weekdays, 5:50 AM to 10:20 PM on Saturdays, and 8:30 AM to 8:10 PM on
Sundays. Route 9 operates with 45 minute headways during the week and 60 minute headways on week-ends. Other BCT RoutesOther BCT routes operate along short sections of Bro-ward Boulevard. Routes 1, 10, and 20 each terminate their routes at Broward Central Terminal. In the vicin-ity of West Regional Terminal, Routes 2 and 12 operate on Broward Blvd between University Drive and Pine Island Road.BreezeThe Breeze is a limited stop service with three routes in Broward County. Routes US-1 Breeze, 441 Breeze and University Breeze provide service along their respec-tive north-south corridors and have stops at Broward Boulevard. Route US-1 Breeze serves the US-1 corridor between Sample Road and Aventura Mall, with a ma-jor stop at the Broward Central Terminal. It operates between the hours of 6:00 AM to 9:13 AM and 3:50 PM to 7:13 PM on weekdays. Route 441 Breeze serves the SR-7/US-441 corridor between Sample Road and the Golden Glades Park-and-Ride. One of the highest volume transfers is with Route 22. It operates between the hours of 5:07 AM and 11:07 AM and 2:42 PM and 7:52 PM on weekdays. Finally, Route University Breeze serves the Univer-sity Drive corridor between Parkland and the Golden Glades Park-and-Ride, with major destinations at the Westfield Broward Mall, West Regional Terminal and Medical Center. It operates between the hours of 5:30 AM to 9:20 AM and 3:30 PM to 7:20 PM on weekdays. All Breeze routes operate with 30 minute headways.
Sun TrolleySun Trolley is a circulator service that operates a num-ber of loop routes in downtown Fort Lauderdale. The routes provide connections between various munici-pal and tourist destinations including Broward Central Terminal and the ocean beaches. Some routes operate only during the peak period, while others run on con-sistent 10 minute headways all day.
July 2012
21
Figure 5 - Year 2011 Broward County Transit Routes
Broward Central TerminalWest Regional Terminal
Park-and-Ride
Ft. Lauderdale Station
922
81
9
22
1 6 9 10 11 14 20 22 30 31 40 50 60 81 US 1 Breeze
2 12 22 30 56 81 88
81
Breeze
Breeze
18Breeze
95
1
842Broward Blvd
An
dre
ws A
ve
NW
31
st A
ve
0 3,000 6,0001,500Feet
7817
FIGURE
22 | Kittelson & Associates, Inc.
Broward Boulevard Corridor Transit Study
22 | Kittelson & Associates, Inc.
Miami-Dade Route 95 Dade Broward ExpressMiami-Dade County operates the 95 Dade Broward Ex-press limited stop service between downtown Miami, and the Park-and-Ride Lot adjacent to Fort Lauderdale Station. The service runs via I-95. Route 95 operates during the weekday AM and PM peak hours only with headways of approximately 15 minutes.
Tri-Rail ShuttlesSFRTA provides shuttle services on weekdays (Route FL 1 and Sun Trolley NW Community Link) and week-ends (Route FL 3). Route FL 1 operates between Fort Lauderdale Station and Downtown Fort Lauderdale with stops on Broward Boulevard at SE 3rd Avenue and Broward Central Terminal. The hours of operation are 5:10 AM to 10:44 PM with 20-30 minute headways during the peak and 60 minute headways off-peak. Route FL 3 operates a standard service between Fort Lauderdale Station and Broward Medical Center, and an express loop between the Fort Lauderdale Station and Downtown Fort Lauderdale. The shuttle stops on Broward Boulevard at NE 7th Avenue (standard ser-vice) and at Broward Central Terminal (express loop). The standard service operates between 6:15 AM and 9:00 PM with 2 hour headways, while the express loop operates between 7:05 AM and 7:05 PM with 2 hour headways until 3:05 PM and 4 hour headway for the final loop. The Sun Trolley NW Community Link, which serve key destinations between Broward Boulevard and NW 19th Street including service between Fort Lauderdale Station and Broward Central Terminal. The shuttle operates between 7:00 AM and 5:00 PM on weekdays.
Broward Central TerminalBroward Central Terminal has the largest boarding vol-umes in the BCT network, with approximately 8,300 daily boardings. The terminal is located on the north-west corner of the intersection of Broward Boulevard and NW 1st Avenue. A total of 15 routes stop at this terminal, including Routes 1, 6, 9, 10, 11, 14, 20, 22, 30, 31, 40, 50, 60, 81 and US-1 Breeze.
West Regional TerminalThe West Regional Terminal is a high boarding loca-tion in the BCT system, with approximately 1,500 daily boardings. The terminal is located just north of Bro-ward Boulevard and east of Pine Island Road. A total
of 6 routes stop at this terminal including Routes 2, 12, 22, 30, 56 and 88.
Fort Lauderdale StationThe Fort Lauderdale Station, located on the west side of the Broward Boulevard/I-95 interchange, provides access to the Broward Boulevard corridor and Down-town Fort Lauderdale. The station serves Tri-Rail and Amtrak. It is the station in Broward County with the second highest volume of Tri-Rail boardings and alight-ings. BCT Route 22 and Tri-Rail shuttles provide direct access to and from this station.
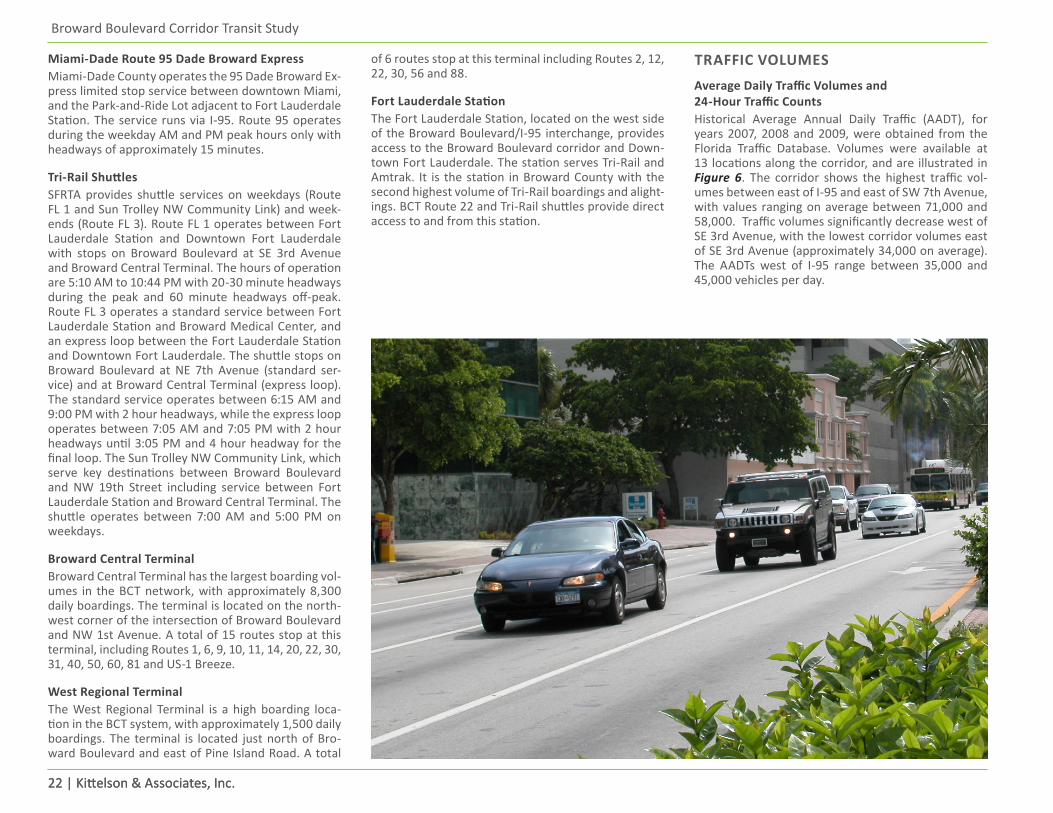
TRAFFIC VOLUMESAverage Daily Traffic Volumes and 24-Hour Traffic CountsHistorical Average Annual Daily Traffic (AADT), for years 2007, 2008 and 2009, were obtained from the Florida Traffic Database. Volumes were available at 13 locations along the corridor, and are illustrated in Figure 6. The corridor shows the highest traffic vol-umes between east of I-95 and east of SW 7th Avenue, with values ranging on average between 71,000 and 58,000. Traffic volumes significantly decrease west of SE 3rd Avenue, with the lowest corridor volumes east of SE 3rd Avenue (approximately 34,000 on average). The AADTs west of I-95 range between 35,000 and 45,000 vehicles per day.
July 2012
2323
Figure 6 - Average Annual Daily Traffic on Broward Boulevard
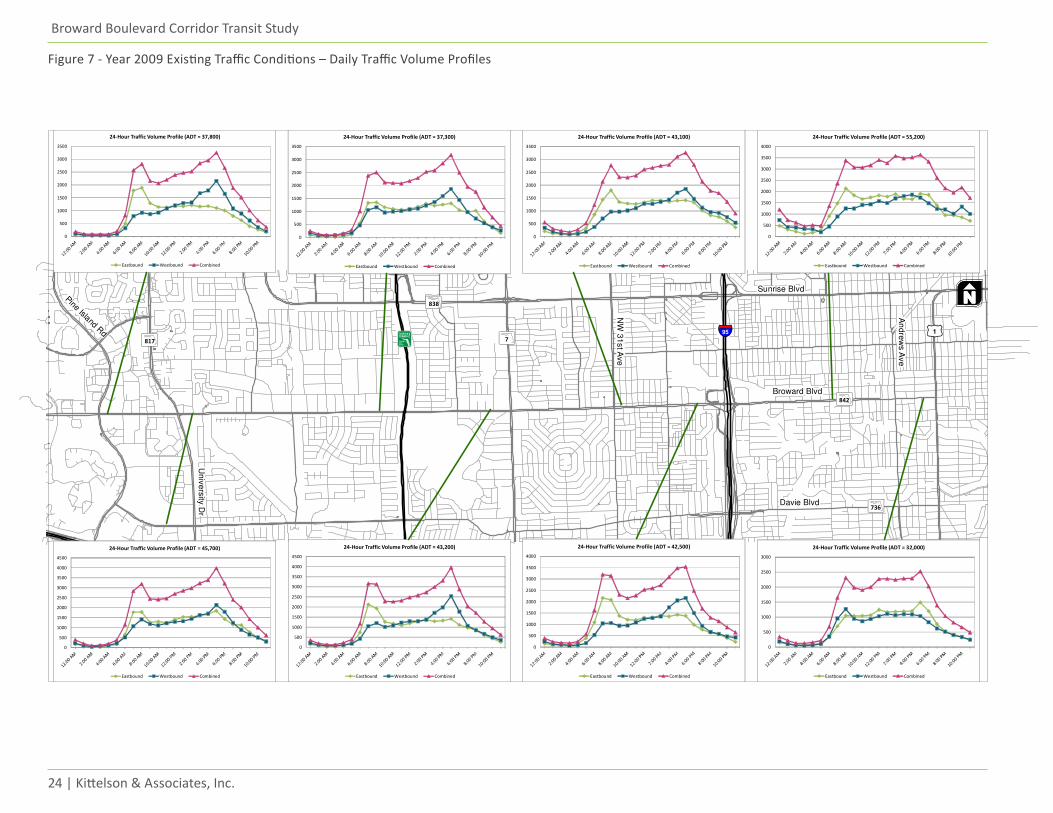
On the following page, Figure 7 shows 24-Hour traffic volumes profiles at 8 loca-tions along the corridor based on counts conducted in 2009 and obtained from the Florida Traffic Database. The highest total traffic volumes for locations west of I-95 were collected during the PM peak period (approximately 4:00 – 6:00), while for lo-cations east of I-95 the highest traffic volumes were generally collected during both AM and PM peak periods (approximately 7:00 – 9:00 and 4:00 – 6:00). It should be noted that the count locations directly to the east and west of SW 7th Avenue show fairly steady total traffic volumes from 7:00 AM to 6:00 PM.
Figure 7 also illustrates that the heavier traffic flow is eastbound in the AM peak period and westbound in the PM peak period with the exception of the corridor portion between east of SW 7th Ave and US-1, where traffic flows are more even split between the eastbound and westbound directions during the PM peak period.
24 | Kittelson & Associates, Inc.
Broward Boulevard Corridor Transit Study
Figure 7 - Year 2009 Existing Traffic Conditions – Daily Traffic Volume Profiles
FIGURE
95 17817
838
736
842Broward Blvd
Davie Blvd
Sunrise Blvd
Un
ive
rsity
Dr
An
dre
ws A
ve
NW
31
st A
ve
Pine Island Rd
0 3,000 6,0001,500Feet
0
500
1000
1500
2000
2500
3000
3500
24-Hour Traffic Volume Profile (ADT = 37,800)
Eastbound Westbound Combined
0
500
1000
1500
2000
2500
3000
3500
4000
4500
24-Hour Traffic Volume Profile (ADT = 45,700)
Eastbound Westbound Combined
0
500
1000
1500
2000
2500
3000
3500
24-Hour Traffic Volume Profile (ADT = 37,300)
Eastbound Westbound Combined
0
500
1000
1500
2000
2500
3000
3500
4000
4500
24-Hour Traffic Volume Profile (ADT = 43,200)
Eastbound Westbound Combined
0
500
1000
1500
2000
2500
3000
24-Hour Traffic Volume Profile (ADT = 32,000)
Eastbound Westbound Combined
0
500
1000
1500
2000
2500
3000
3500
4000
24-Hour Traffic Volume Profile (ADT = 55,200)
Eastbound Westbound Combined
0
500
1000
1500
2000
2500
3000
3500
4000
24-Hour Traffic Volume Profile (ADT = 42,500)
Eastbound Westbound Combined
0
500
1000
1500
2000
2500
3000
3500
24-Hour Traffic Volume Profile (ADT = 43,100)
Eastbound Westbound Combined
July 2012
2525
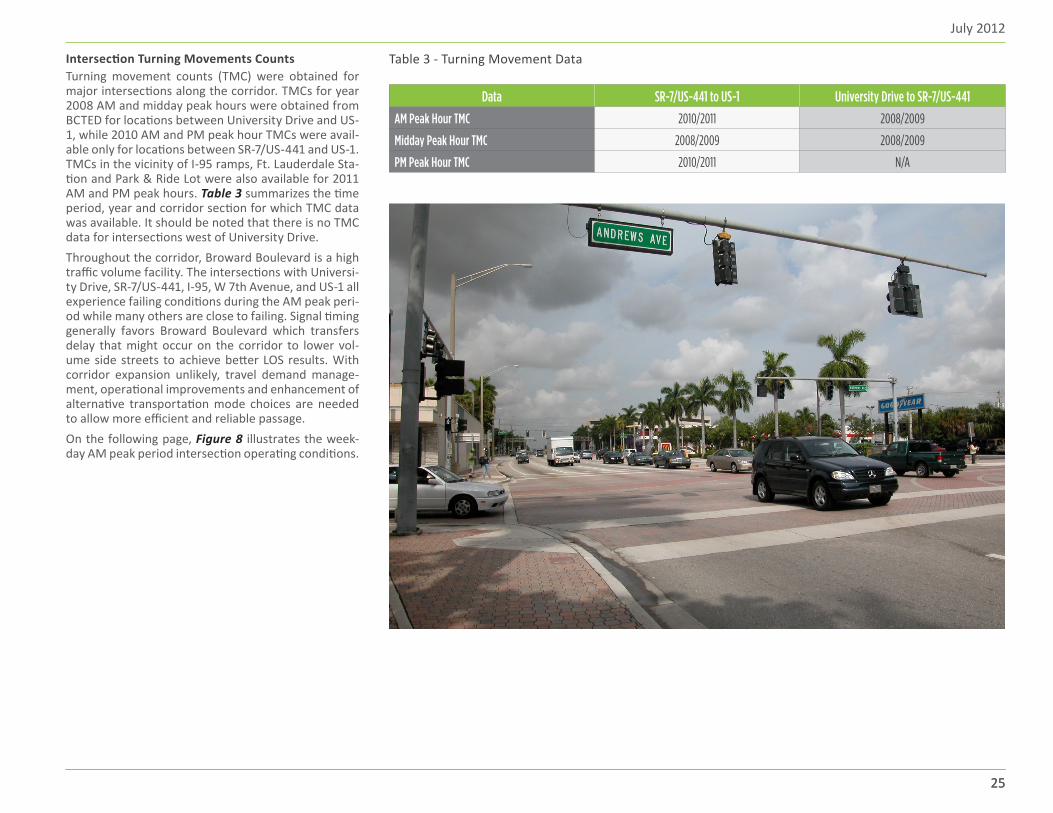
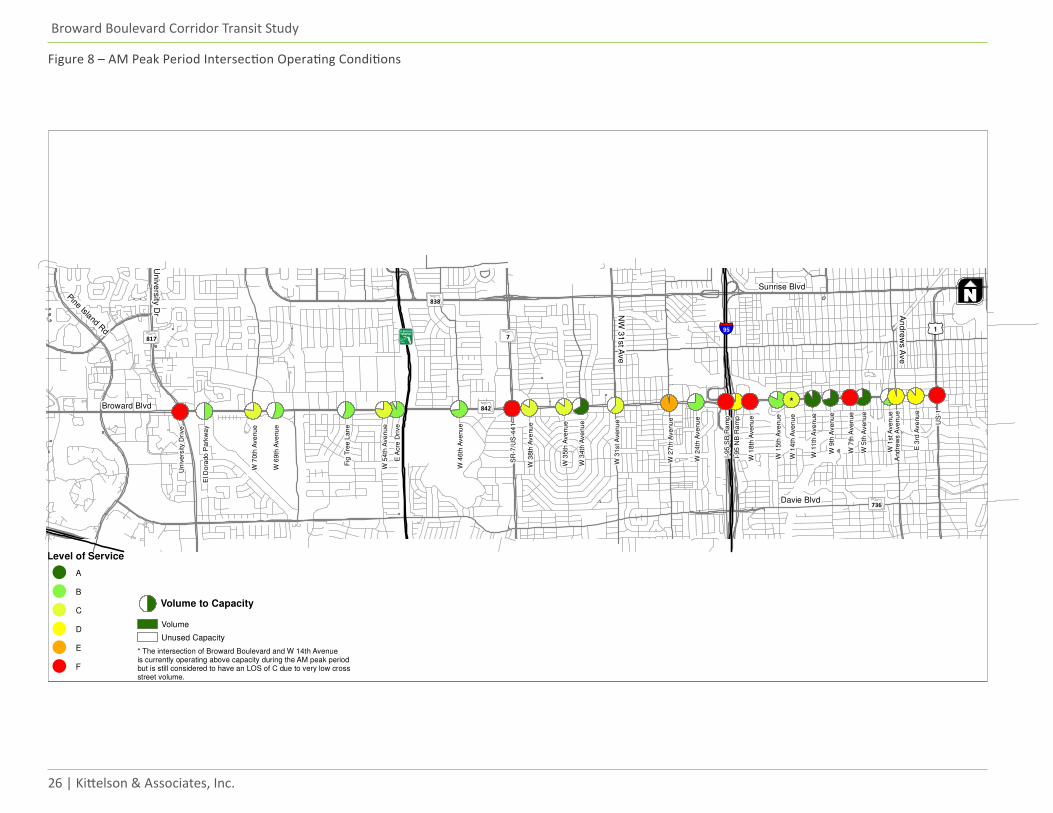
Intersection Turning Movements CountsTurning movement counts (TMC) were obtained for major intersections along the corridor. TMCs for year 2008 AM and midday peak hours were obtained from BCTED for locations between University Drive and US-1, while 2010 AM and PM peak hour TMCs were avail-able only for locations between SR-7/US-441 and US-1. TMCs in the vicinity of I-95 ramps, Ft. Lauderdale Sta-tion and Park & Ride Lot were also available for 2011 AM and PM peak hours. Table 3 summarizes the time period, year and corridor section for which TMC data was available. It should be noted that there is no TMC data for intersections west of University Drive. Throughout the corridor, Broward Boulevard is a high traffic volume facility. The intersections with Universi-ty Drive, SR-7/US-441, I-95, W 7th Avenue, and US-1 all experience failing conditions during the AM peak peri-od while many others are close to failing. Signal timing generally favors Broward Boulevard which transfers delay that might occur on the corridor to lower vol-ume side streets to achieve better LOS results. With corridor expansion unlikely, travel demand manage-ment, operational improvements and enhancement of alternative transportation mode choices are needed to allow more efficient and reliable passage.On the following page, Figure 8 illustrates the week-day AM peak period intersection operating conditions.
Table 3 - Turning Movement Data
Data SR-7/US-441 to US-1 University Drive to SR-7/US-441
AM Peak Hour TMC 2010/2011 2008/2009
Midday Peak Hour TMC 2008/2009 2008/2009
PM Peak Hour TMC 2010/2011 N/A
26 | Kittelson & Associates, Inc.
Broward Boulevard Corridor Transit Study
Figure 8 – AM Peak Period Intersection Operating Conditions
W 5
th A
ven
ue
W 9
th A
ven
ue
W 1
1th
Aven
ue
W 3
4th
Ave
nu
e
W 1
st A
ven
ue
E A
cre
Dri
ve
W 1
5th
Ave
nu
e
W 2
4th
Ave
nu
e
W 4
6th
Ave
nu
e
Fig
Tre
e L
an
e
W 6
9th
Ave
nu
e
El D
ora
do
Park
wa
y
W 1
4th
Ave
nu
e
W 3
1st A
ve
nu
e
W 3
5th
Ave
nu
e
W 3
8th
Ave
nu
e
W 5
4th
Ave
nu
e
W 7
0th
Ave
nu
e
E 3
rd A
ve
nu
e
I-95
NB
Ra
mp
W 2
7th
Ave
nu
e
US
-1
SR
-7/U
S-4
41
W 7
th A
ven
ue
W 1
8th
Ave
nu
e
Univ
ers
ity D
rive
And
rew
s A
ve
nu
e
I-95
SB
Ra
mp
FIGURE
95 17817
838
736
842Broward Blvd
Davie Blvd
Sunrise Blvd
Un
ive
rsity
Dr A
nd
rew
s A
ve
NW
31
st A
ve
Pine Island Rd
0 3,000 6,0001,500Feet
Volume
Unused Capacity
Level of Service
A
B
C
D
E
F
Volume to Capacity
*
* The intersection of Broward Boulevard and W 14th Avenueis currently operating above capacity during the AM peak periodbut is still considered to have an LOS of C due to very low crossstreet volume.
July 2012
2727
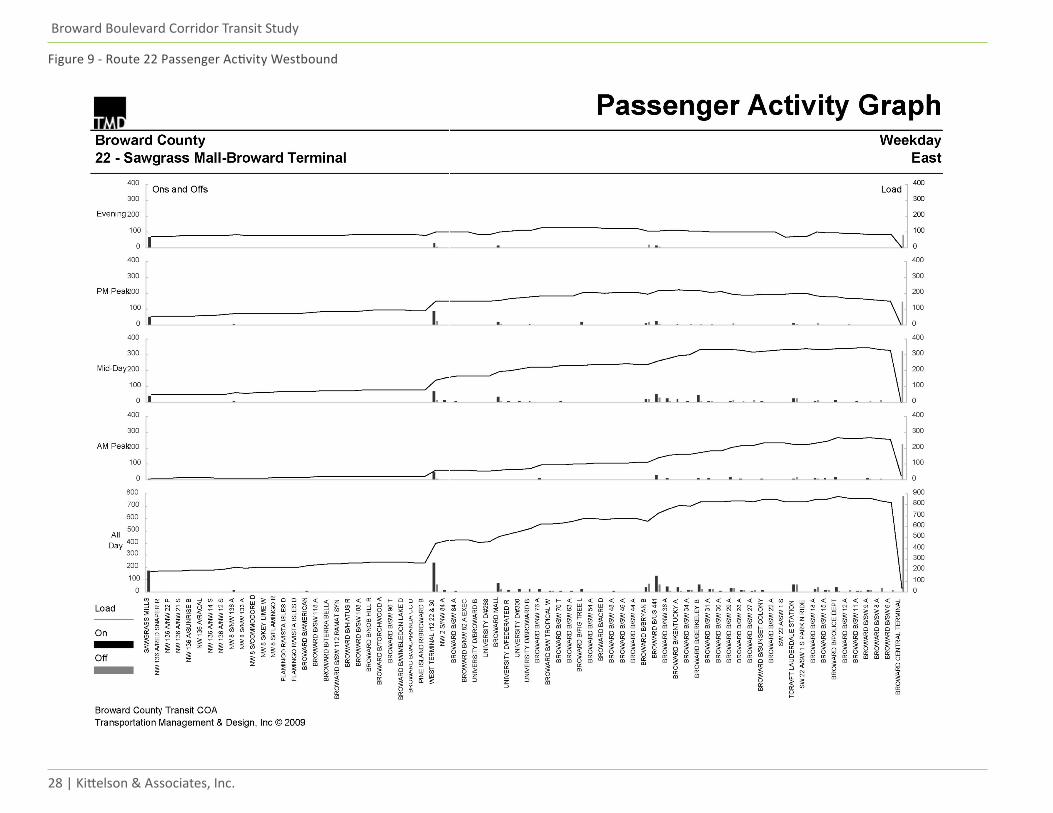
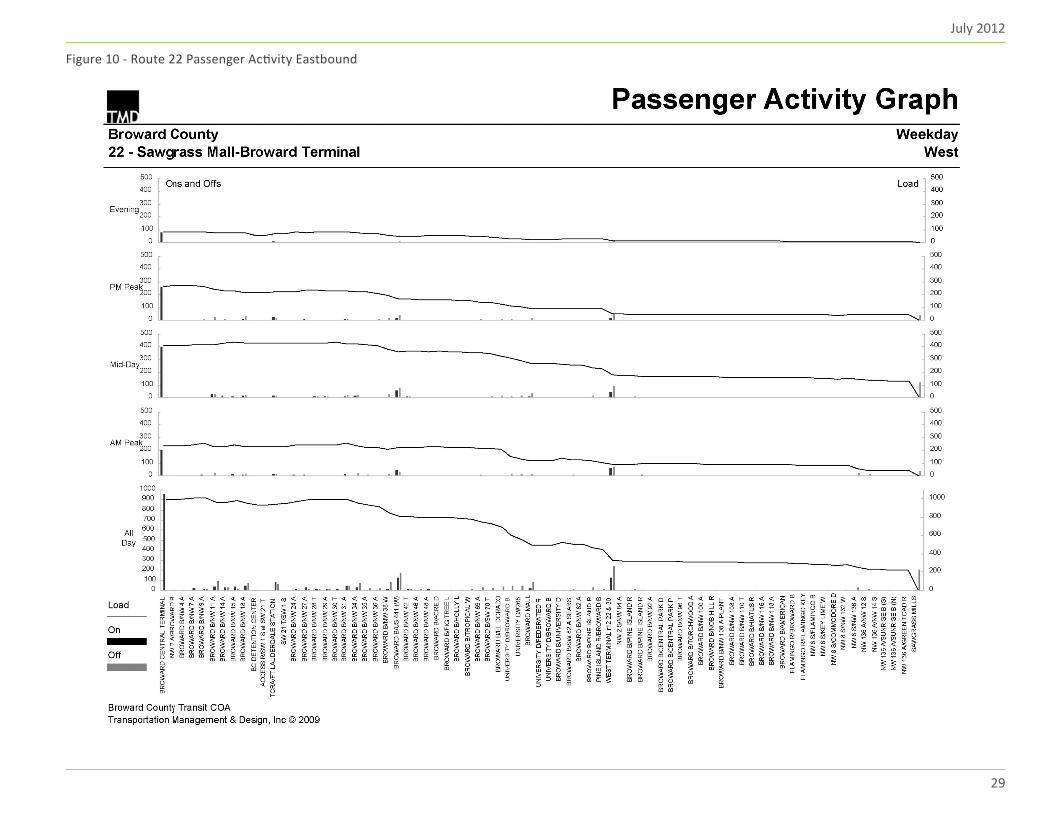
TRANSIT RIDERSHIPRidership analysis was primarily focused on Route 22 because it serves as the through service for the cor-ridor. Route 22 has a weekday ridership of approximately 3,580. It shows one of the highest system levels of Saturday ridership of about 3,560. Sunday ridership is less than half of Saturday ridership (1,330 passengers). Route 22 has the most passenger activity at Broward Central Terminal, Sawgrass Mills Mall, West Regional Terminal, and SR-7/US-441. Weekday westbound boardings are highest at Bro-ward Central Terminal (200 AM peak, 400 midday, and 250 PM peak), while the stops with most alightings are the West Regional Terminal (80 in both the AM and PM peaks, and 100 midday) and Sawgrass Mills (40 AM peak, 120 midday, and 50 PM peak). The stop at SR-7/US-441 also shows significant alightings on the westbound direction at midday (80) and PM peak pe-riod (50). Eastbound weekday boardings at the West Regional Terminal (50 AM peak, 80 midday and PM peak) and Sawgrass Mills (50 at both the midday and PM peaks) are the highest, while the stops with most alightings are Broward Central Terminal (220 AM peak, 320 midday, and 150 PM peak) and SR-7/US-441 (50 midday, and 20 PM peak). The highest passenger ac-tivity at Westfield Broward Mall is in the westbound direction at midday, with approximately 40 alightings, and on the eastbound direction at midday and PM peak periods with 50 and 20 boardings, respectively. All boardings and alightings noted above are approxi-mate values. Figures 9 and 10 further illustrate Route 22 passenger activity for the westbound and east-bound directions.
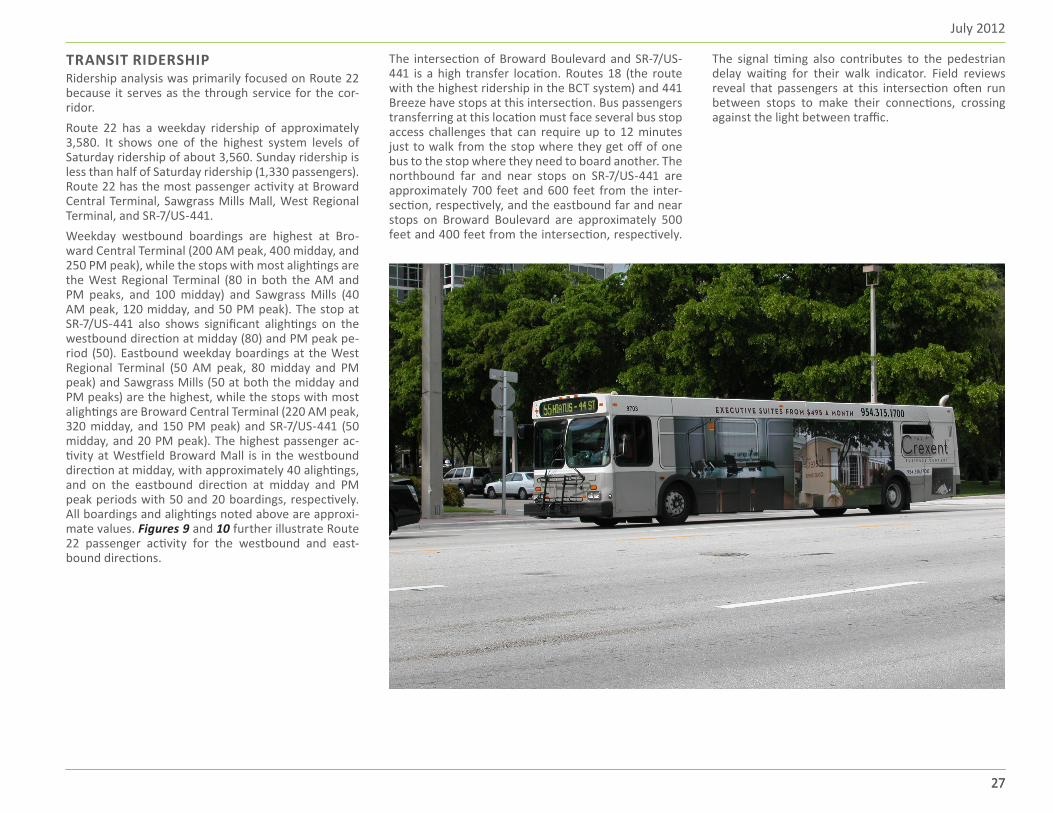
The intersection of Broward Boulevard and SR-7/US-441 is a high transfer location. Routes 18 (the route with the highest ridership in the BCT system) and 441 Breeze have stops at this intersection. Bus passengers transferring at this location must face several bus stop access challenges that can require up to 12 minutes just to walk from the stop where they get off of one bus to the stop where they need to board another. The northbound far and near stops on SR-7/US-441 are approximately 700 feet and 600 feet from the inter-section, respectively, and the eastbound far and near stops on Broward Boulevard are approximately 500 feet and 400 feet from the intersection, respectively.
The signal timing also contributes to the pedestrian delay waiting for their walk indicator. Field reviews reveal that passengers at this intersection often run between stops to make their connections, crossing against the light between traffic.
28 | Kittelson & Associates, Inc.
Broward Boulevard Corridor Transit Study
Figure 9 - Route 22 Passenger Activity Westbound
July 2012
29
Figure 10 - Route 22 Passenger Activity Eastbound
30 | Kittelson & Associates, Inc.
Broward Boulevard Corridor Transit Study
30 | Kittelson & Associates, Inc.
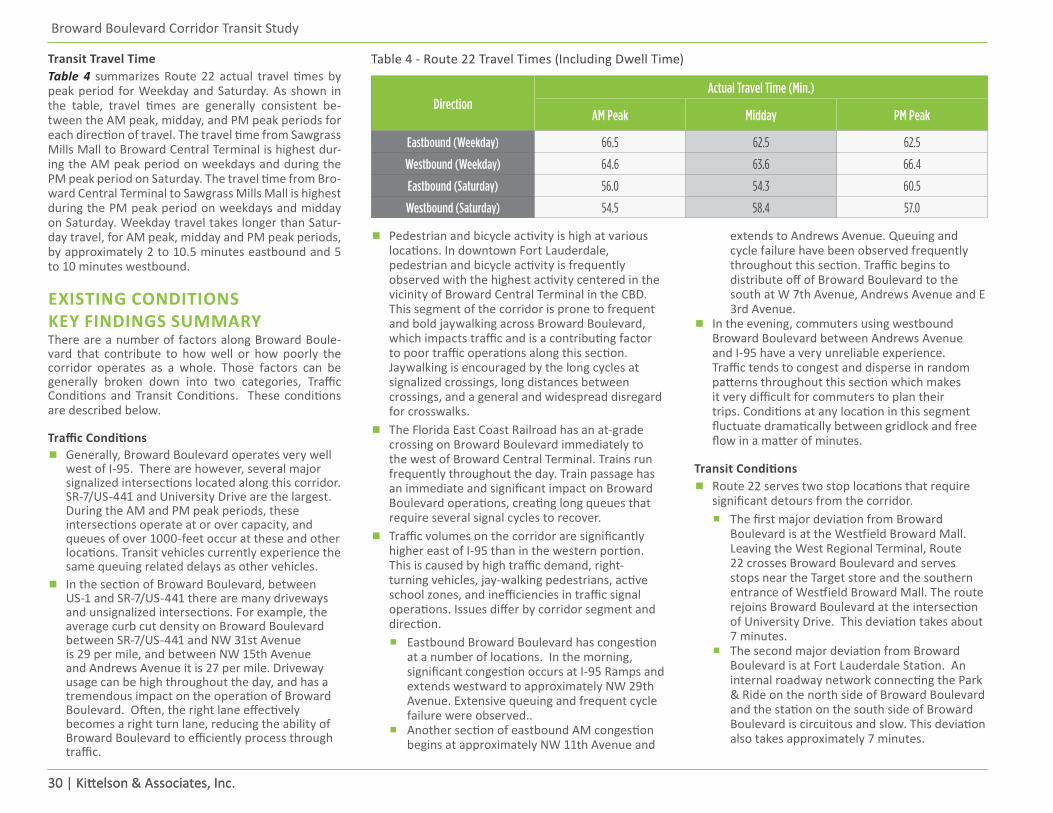
Transit Travel TimeTable 4 summarizes Route 22 actual travel times by peak period for Weekday and Saturday. As shown in the table, travel times are generally consistent be-tween the AM peak, midday, and PM peak periods for each direction of travel. The travel time from Sawgrass Mills Mall to Broward Central Terminal is highest dur-ing the AM peak period on weekdays and during the PM peak period on Saturday. The travel time from Bro-ward Central Terminal to Sawgrass Mills Mall is highest during the PM peak period on weekdays and midday on Saturday. Weekday travel takes longer than Satur-day travel, for AM peak, midday and PM peak periods, by approximately 2 to 10.5 minutes eastbound and 5 to 10 minutes westbound.
EXISTING CONDITIONS KEY FINDINGS SUMMARYThere are a number of factors along Broward Boule-vard that contribute to how well or how poorly the corridor operates as a whole. Those factors can be generally broken down into two categories, Traffic Conditions and Transit Conditions. These conditions are described below.
Traffic Conditions
▪ Generally, Broward Boulevard operates very well west of I-95. There are however, several major signalized intersections located along this corridor. SR-7/US-441 and University Drive are the largest. During the AM and PM peak periods, these intersections operate at or over capacity, and queues of over 1000-feet occur at these and other locations. Transit vehicles currently experience the same queuing related delays as other vehicles.
▪ In the section of Broward Boulevard, between US-1 and SR-7/US-441 there are many driveways and unsignalized intersections. For example, the average curb cut density on Broward Boulevard between SR-7/US-441 and NW 31st Avenue is 29 per mile, and between NW 15th Avenue and Andrews Avenue it is 27 per mile. Driveway usage can be high throughout the day, and has a tremendous impact on the operation of Broward Boulevard. Often, the right lane effectively becomes a right turn lane, reducing the ability of Broward Boulevard to efficiently process through traffic.
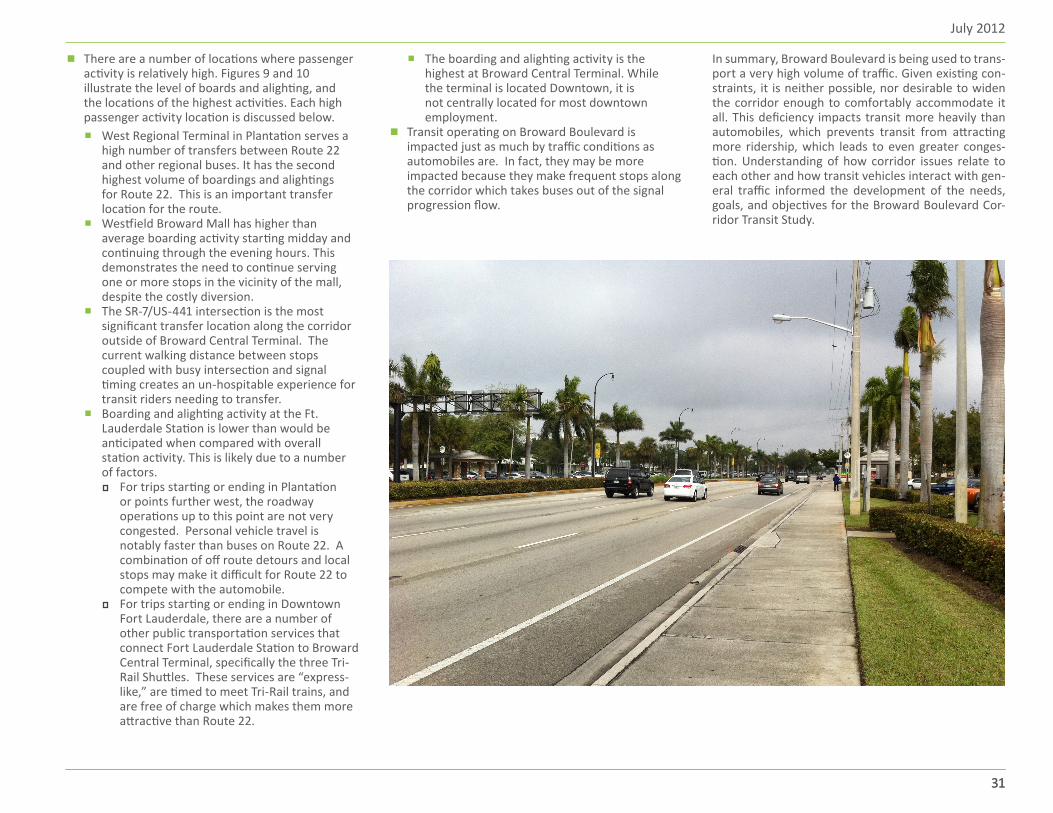
▪ Pedestrian and bicycle activity is high at various locations. In downtown Fort Lauderdale, pedestrian and bicycle activity is frequently observed with the highest activity centered in the vicinity of Broward Central Terminal in the CBD. This segment of the corridor is prone to frequent and bold jaywalking across Broward Boulevard, which impacts traffic and is a contributing factor to poor traffic operations along this section. Jaywalking is encouraged by the long cycles at signalized crossings, long distances between crossings, and a general and widespread disregard for crosswalks.
▪ The Florida East Coast Railroad has an at-grade crossing on Broward Boulevard immediately to the west of Broward Central Terminal. Trains run frequently throughout the day. Train passage has an immediate and significant impact on Broward Boulevard operations, creating long queues that require several signal cycles to recover.
▪ Traffic volumes on the corridor are significantly higher east of I-95 than in the western portion. This is caused by high traffic demand, right-turning vehicles, jay-walking pedestrians, active school zones, and inefficiencies in traffic signal operations. Issues differ by corridor segment and direction.
▪ Eastbound Broward Boulevard has congestion at a number of locations. In the morning, significant congestion occurs at I-95 Ramps and extends westward to approximately NW 29th Avenue. Extensive queuing and frequent cycle failure were observed..
▪ Another section of eastbound AM congestion begins at approximately NW 11th Avenue and
extends to Andrews Avenue. Queuing and cycle failure have been observed frequently throughout this section. Traffic begins to distribute off of Broward Boulevard to the south at W 7th Avenue, Andrews Avenue and E 3rd Avenue.
▪ In the evening, commuters using westbound Broward Boulevard between Andrews Avenue and I-95 have a very unreliable experience. Traffic tends to congest and disperse in random patterns throughout this section which makes it very difficult for commuters to plan their trips. Conditions at any location in this segment fluctuate dramatically between gridlock and free flow in a matter of minutes.
Transit Conditions
▪ Route 22 serves two stop locations that require significant detours from the corridor.
▪ The first major deviation from Broward Boulevard is at the Westfield Broward Mall. Leaving the West Regional Terminal, Route 22 crosses Broward Boulevard and serves stops near the Target store and the southern entrance of Westfield Broward Mall. The route rejoins Broward Boulevard at the intersection of University Drive. This deviation takes about 7 minutes.
▪ The second major deviation from Broward Boulevard is at Fort Lauderdale Station. An internal roadway network connecting the Park & Ride on the north side of Broward Boulevard and the station on the south side of Broward Boulevard is circuitous and slow. This deviation also takes approximately 7 minutes.
Table 4 - Route 22 Travel Times (Including Dwell Time)
DirectionActual Travel Time (Min.)
AM Peak Midday PM Peak
Eastbound (Weekday) 66.5 62.5 62.5
Westbound (Weekday) 64.6 63.6 66.4
Eastbound (Saturday) 56.0 54.3 60.5
Westbound (Saturday) 54.5 58.4 57.0
July 2012
3131
▪ There are a number of locations where passenger activity is relatively high. Figures 9 and 10 illustrate the level of boards and alighting, and the locations of the highest activities. Each high passenger activity location is discussed below.
▪ West Regional Terminal in Plantation serves a high number of transfers between Route 22 and other regional buses. It has the second highest volume of boardings and alightings for Route 22. This is an important transfer location for the route.
▪ Westfield Broward Mall has higher than average boarding activity starting midday and continuing through the evening hours. This demonstrates the need to continue serving one or more stops in the vicinity of the mall, despite the costly diversion.
▪ The SR-7/US-441 intersection is the most significant transfer location along the corridor outside of Broward Central Terminal. The current walking distance between stops coupled with busy intersection and signal timing creates an un-hospitable experience for transit riders needing to transfer.
▪ Boarding and alighting activity at the Ft. Lauderdale Station is lower than would be anticipated when compared with overall station activity. This is likely due to a number of factors.
For trips starting or ending in Plantation or points further west, the roadway operations up to this point are not very congested. Personal vehicle travel is notably faster than buses on Route 22. A combination of off route detours and local stops may make it difficult for Route 22 to compete with the automobile. For trips starting or ending in Downtown Fort Lauderdale, there are a number of other public transportation services that connect Fort Lauderdale Station to Broward Central Terminal, specifically the three Tri-Rail Shuttles. These services are “express-like,” are timed to meet Tri-Rail trains, and are free of charge which makes them more attractive than Route 22.
▪ The boarding and alighting activity is the highest at Broward Central Terminal. While the terminal is located Downtown, it is not centrally located for most downtown employment.
▪ Transit operating on Broward Boulevard is impacted just as much by traffic conditions as automobiles are. In fact, they may be more impacted because they make frequent stops along the corridor which takes buses out of the signal progression flow.
In summary, Broward Boulevard is being used to trans-port a very high volume of traffic. Given existing con-straints, it is neither possible, nor desirable to widen the corridor enough to comfortably accommodate it all. This deficiency impacts transit more heavily than automobiles, which prevents transit from attracting more ridership, which leads to even greater conges-tion. Understanding of how corridor issues relate to each other and how transit vehicles interact with gen-eral traffic informed the development of the needs, goals, and objectives for the Broward Boulevard Cor-ridor Transit Study.


33
Purpose and NeedsSECTION 4
34 | Kittelson & Associates, Inc.
Broward Boulevard Corridor Transit Study
34 | Kittelson & Associates, Inc.
STUDY CONTEXTThe Broward Boulevard Corridor Transit Study is being conducted to identify and evaluate short-term tran-sit improvements along Broward Boulevard between Pine Island Road and US-1. The purpose of these tran-sit improvements is to:
▪ Increase corridor transit mobility,
▪ Increase corridor transit ridership,
▪ Increase access to transit (bicycle, pedestrian, vehicular), and
▪ Improve quality of transit service.This study is being conducted independently of other studies that are being conducted to identify and evalu-ate long-term transit investments in the Broward Bou-levard Corridor. This purpose and need statement includes informa-tion gained through data collection and analysis of existing conditions, input received during stakeholder interviews, and data and input received during partner coordination meetings through May 13, 2011.Broward Boulevard provides east/west connection between US-1 and N. Flamingo Road. Broward Bou-levard carries traffic between downtown Ft. Lauder-dale and the communities of Plantation, Lauderhill, and Sunrise. Broward County Transit (BCT) operates Bus Route 22 which serves the entire study corridor; this study will mainly base analysis and comparison of existing and future conditions on this route. Figure 10 illustrates the study area and the location of Broward Boulevard.
PROJECT NEEDS Based on the information collected and analyzed, the transit needs, or problems, in the Broward Boulevard Corridor are listed below and described in more detail in the following sections:
▪ Poor transit travel time
▪ Poor transfer coordination
▪ Poor pedestrian and bicycle access to bus stops
▪ Poor ridership compared to bus capacity
Poor Transit Travel TimeNot all transit passengers are travelling the length of the study corridor. To identify the major trip patterns in the corridor, Longitudinal Employer- Household Dy-namics (LEHD) data was used. This data is collected by the U.S. Census Bureau and provides information on where residents work and employees live in a given area. This data identified 19,600 people live in the study area (defined as ½-mile wide along the length of the corridor) and 53,400 people work in the corri-dor. Of the 53,400 people that work in the study area, only 2,300 people, or 4.2%, also live in the corridor. Figure 11 shows the location of jobs within the cor-ridor. These jobs are generally located in four areas of the corridor, near University Drive, near SR7/US-441, just west of I-95, and in Downtown Fort Lauderdale. Figure 12 shows the household location of corridor workers. These data are helpful to understand the trip origins and destinations within the corridor. In April and May of 2010, Broward County Transit (BCT) and FDOT conducted a survey of transit passengers to determine where they are coming from (origins) and where they are going (destinations). This on-board survey was used to further understand the transit trip patterns of Route 22. Approximately 315 surveys were used in the analysis. An overview of trip progression along Broward Boulevard from the three primary ac-tivity centers (Broward Central Terminal, SR-7/US-441, and the West Regional Terminal) is shown on Figure 13. Broward Central Terminal near the eastern edge of the study area was confirmed as the busiest activity cen-ter. Nearly 20% of passengers surveyed boarded the system there. Trips that started at Broward Central Terminal ended at alighting points throughout the cor-ridor. Only about 10% of trips starting at Broward Cen-tral Terminal continued all the way to West Regional Terminal.Stops at the intersection of Broward Boulevard and SR-7/US-441 compose the second busiest activity cen-ter. Approximately 10% of the surveyed passengers boarded the system at this intersection. The most sig-nificant destination for passengers at this location (ap-proximately 40%) was University Drive and Westfield Broward Mall. Only 26% were destined for Downtown Fort Lauderdale and about 15% for the West Regional Terminal.
Nearly 8% of passengers boarded the system at the West Regional Terminal. Of these passengers, roughly 30% headed further west towards Sawgrass Mills. The remaining 70% traveled east. Trips starting at the West Regional Terminal average to be much longer than those starting at Broward Central Terminal. Nearly 50% of all passengers boarding at the West Regional Terminal were destined for Downtown Fort Lauder-dale.
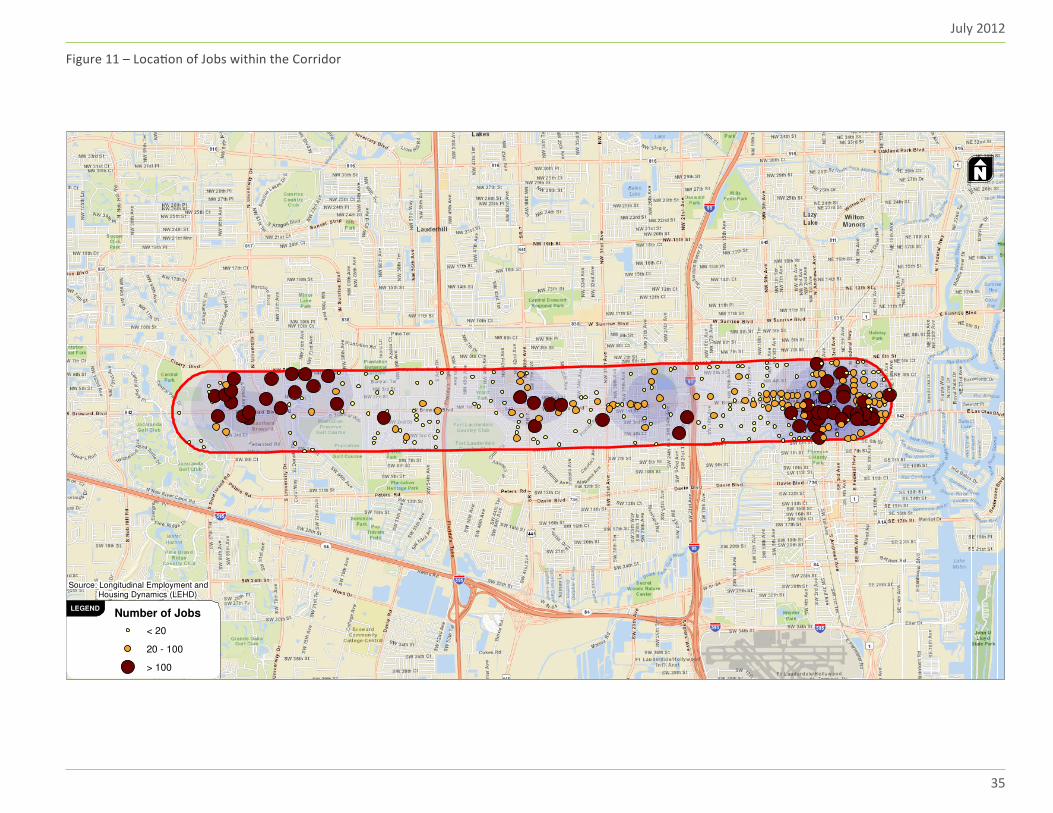
July 2012
35
Figure 11 – Location of Jobs within the Corridor
FIGURE
LEGEND
Number of Jobs
< 20
20 - 100
> 100
Source: Longitudinal Employment and Housing Dynamics (LEHD)
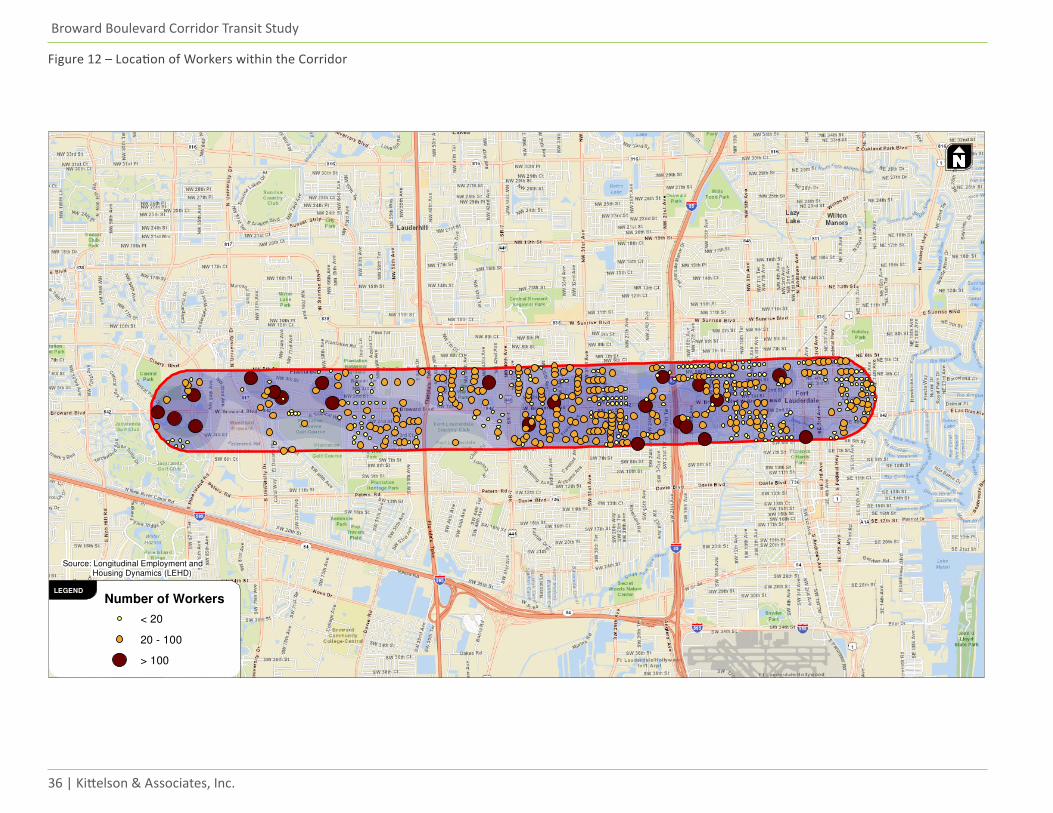
36 | Kittelson & Associates, Inc.
Broward Boulevard Corridor Transit Study
Figure 12 – Location of Workers within the Corridor
LEGEND
Source: Longitudinal Employment and Housing Dynamics (LEHD)
Number of Workers
< 20
20 - 100
> 100
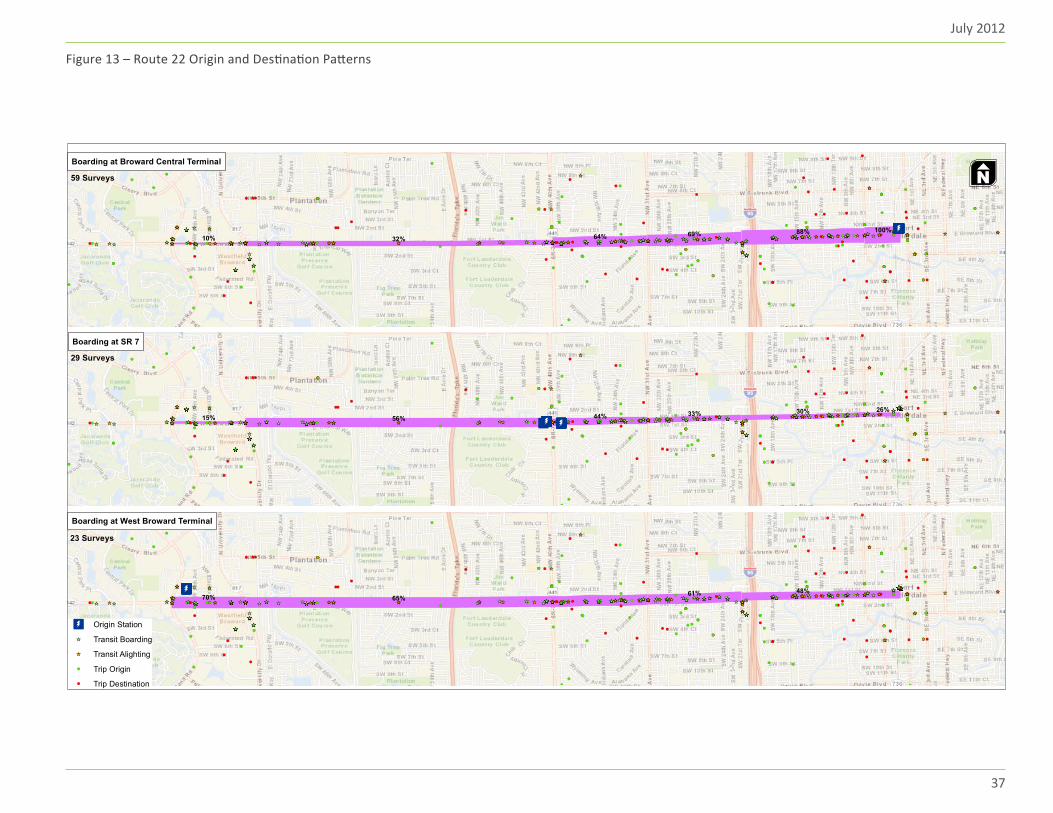
July 2012
37
Figure 13 – Route 22 Origin and Destination Patterns
!(
!(
!(
!(
!(
!(
!(
!(
!(
!(
!(
!(!(
!(
!(
!(
!(
!(
!(
!(
!(
!(
!(
!(
!(
!(!(!(
!(
!(
!(
!(
!(
!(
!(
!(
!(!(
!(
!(!(
!(
!(
!(
!(!(
!(
!(
!(
!(
!(!(
!(
!(
!(
!( !( !(
!(!(
!(
!(
!(
!(
!(
!(
!(
!(
!(!(
!(
!(
!(
!(
!(
!( !(
!(!(
!( !(
!(!(
!(
!( !(
!(
!(
!(
!(!(!(
!(
!(
!(
!(
!(
!(!(
!(
!(
!(
!(
!(
!(
!(
!(
!(
!(
!(!(
!(
!(
!(!(
!( !(
!(
!(!(
!(
!(
!(
!(
!( !(!(
!(
!(
!(
!(!(!(!(!(
!(
!(
!(
!(!( !(!(
!(
!(
!(
!(!(
!(
!(
!( !(!(
!(
!(
!(
!(
!(
!(
!(
!(!(!(
!(
!(
!(
!(
!(!(
!(
!(
!(
!(
!(
!(
!(
!(
!(
!(
!(
!(
!( !(
!(
!(!( !(
!(
!(
!(
!(
!(
!(
!(
!( !(
!(
!(!(
!(
!(
!(
!(
!( !(!(!(
!(
!(
!(
!(
!(
!(
!(
!(
!(
!(
!(!(
!(
!(
!(
!(!(
!(
!(
!(
!(
!(
!(
!(
!(
!(
!(
!(
!(
!(
!(
!(
!(
!(
!(!(
!(
!(
!(
!(
!(!(
!(
!(
!(
!(
!(
!(
!(
!(
!(
!(
!(
!(
!(
!(
!(
!(
!(
!(!(
!(!(
!( !(
!(
!(
!(
!(
!(
!(
!(
!(
!(
!(
!(
!(!(
!(
!(
!(
!(
!(!(
!(
!(
!(
!(
!(!( !(!( !(!(!( !(
!(
!(
[_[_[_
[_
[_
[_[_
[_[_
[_[_[_
[_ [_
[_[_ [_
[_[_[_[_
[_
[_[_
[_ [_
[_[_[_
[_
[_
[_
[_ [_
[_
[_
[_[_
[_
[_ [_
[_[_
[_[_[_[_[_
[_
[_
[_[_[_
[_
[_
[_
[_
[_
[_[_ [_[_
[_
[_
[_
[_
[_[_[_
[_
[_
[_ [_[_
[_ [_ [_[_ [_[_
[_
[_
[_
[_[_
[_
[_
[_ [_
[_
[_
[_
[_
[_[_
[_ [_
[_
[_
[_
[_[_
[_
[_ [_ [_[_
[_
[_[_[_
[_[_
[_[_
[_
[_[_
[_[_[_[_
[_
[_[_[_[_[_[_
[_[_ [_ [_[_[_
[_
[_
[_
[_
[_
[_[_[_
[_ [_
[_[_[_[_[_[_
[_[_ [_
[_
[_
[_
[_
[_[_
[_
[_
[_
[_
[_[_[_ [_
[_
[_
[_
[_
[_
[_
[_[_
[_
[_[_
[_
[_[_[_
[_[_
[_
[_ [_[_
[_[_
[_
[_ [_[_
[_[_
[_ [_ [_[_
[_[_[_[_
[_[_[_[_
[_[_ [_
[_[_[_
[_
[_
[_[_[_
[_
[_[_[_[_
[_
[_
[_[_
[_ [_
[_
[_[_ [_
[_[_[_
[_
[_[_[_ [_[_
[_[_[_ [_
[_[_
[_[_[_
[_[_[_[_[_[_
[_[_
[_[_[_
[_[_[_
[_[_
[_[_[_
[_[_[_
[_ [_[_[_ [_[_ [_
[_[_[_
[_[_[_
[_
[_
[_
[_[_
[_
[_
[_[_
[_
[_[_
[_[_[_[_
[_
[_[_[_[_[_[_
[_[_
[_
[_[_[_[_
[_
[_
[_[_[_
[_[_[_
[_[_
[_[_[_
[_
[_[_[_[_
[_[_
[_[_[_[_
[_
[_ [_
[_
[_[_[_
[_[_
[_
[_[_[_
[_
[_[_
[_
[_[_
[_ [_[_[_[_
[_[_
[_ [_
[_[_[_[_
[_[_ [_ [_
[_
[_
[_ [_
[_[_[_[_[_
[_[_
[_[_
[_ [_ [_
[_[_[_[_
[_[_
[_[_[_[_
[_ [_ [_ [_
[_[_[_[_[_[_
[_
[_[_[_
[_[_[_[_
[_
[_
[_
[_ [_[_[_
[_
[_[_
[_[_
[_
[_[_
[_
[_ [_ [_
[_
[_[_
[_ [_[_ [_ [_[_
[_[_[_[_
[_[_[_ [_
[_
[_
[_
[_
[_
[_
[_
[_[_[_
[_ [_[_
[_[_
[_
[_[_
[_[_
[_[_[_[_
[_[_[_[_[_[_ [_
[_[_[_
[_[_[_[_[_[_[_ [_[_
[_
[_[_[_[_[_
[_
[_
[_[_[_
[_
[_[_
[_
aaaaaaaaaaaaaaaaaaaaaaaaaaaaaaaaaaaaaaaaaaaaaaaaaaaaaaaaaaa
59 Surveys
Boarding at Broward Central Terminal
32%100%88%
64% 69%10%
FIGURE
N
!(
!(
!(
!(
!(
!(
!(
!(
!(
!(
!(
!(!(
!(
!(
!(
!(
!(
!(
!(
!(
!(
!(
!(
!(
!(!(!(
!(
!(
!(
!(
!(
!(
!(
!(
!(!(
!(
!(!(
!(
!(
!(
!(!(
!(
!(
!(
!(
!(!(
!(
!(
!(
!( !( !(
!(!(
!(
!(
!(
!(
!(
!(
!(
!(
!(!(
!(
!(
!(
!(
!(
!( !(
!(!(
!( !(
!(!(
!(
!( !(
!(
!(
!(
!(!(!(
!(
!(
!(
!(
!(
!(!(
!(
!(
!(
!(
!(
!(
!(
!(
!(
!(
!(!(
!(
!(
!(!(
!( !(
!(
!(!(
!(
!(
!(
!(
!( !(!(
!(
!(
!(
!(!(!(!(!(
!(
!(
!(
!(!( !(!(
!(
!(
!(
!(!(
!(
!(
!( !(!(
!(
!(
!(
!(
!(
!(
!(
!(!(!(
!(
!(
!(
!(
!(!(
!(
!(
!(
!(
!(
!(
!(
!(
!(
!(
!(
!(
!( !(
!(
!(!( !(
!(
!(
!(
!(
!(
!(
!(
!( !(
!(
!(!(
!(
!(
!(
!(
!( !(!(!(
!(
!(
!(
!(
!(
!(
!(
!(
!(
!(
!(!(
!(
!(
!(
!(!(
!(
!(
!(
!(
!(
!(
!(
!(
!(
!(
!(
!(
!(
!(
!(
!(
!(
!(!(
!(
!(
!(
!(
!(!(
!(
!(
!(
!(
!(
!(
!(
!(
!(
!(
!(
!(
!(
!(
!(
!(
!(
!(!(
!(!(
!( !(
!(
!(
!(
!(
!(
!(
!(
!(
!(
!(
!(
!(!(
!(
!(
!(
!(
!(!(
!(
!(
!(
!(
!(!( !(!( !(!(!( !(
!(
!(
[_[_[_
[_
[_
[_[_
[_[_
[_[_[_
[_ [_
[_[_ [_
[_[_[_[_
[_
[_[_
[_ [_
[_[_[_
[_
[_
[_
[_ [_
[_
[_
[_[_
[_
[_ [_
[_[_
[_[_[_[_[_
[_
[_
[_[_[_
[_
[_
[_
[_
[_
[_[_ [_[_
[_
[_
[_
[_
[_[_[_
[_
[_
[_ [_[_
[_ [_ [_[_ [_[_
[_
[_
[_
[_[_
[_
[_
[_ [_
[_
[_
[_
[_
[_[_
[_ [_
[_
[_
[_
[_[_
[_
[_ [_ [_[_
[_
[_[_[_
[_[_
[_[_
[_
[_[_
[_[_[_[_
[_
[_[_[_[_[_[_
[_[_ [_ [_[_[_
[_
[_
[_
[_
[_
[_[_[_
[_ [_
[_[_[_[_[_[_
[_[_ [_
[_
[_
[_
[_
[_[_
[_
[_
[_
[_
[_[_[_ [_
[_
[_
[_
[_
[_
[_
[_[_
[_
[_[_
[_
[_[_[_
[_[_
[_
[_ [_[_
[_[_
[_
[_ [_[_
[_[_
[_ [_ [_[_
[_[_[_[_
[_[_[_[_
[_[_ [_
[_[_[_
[_
[_
[_[_[_
[_
[_[_[_[_
[_
[_
[_[_
[_ [_
[_
[_[_ [_
[_[_[_
[_
[_[_[_ [_[_
[_[_[_ [_
[_[_
[_[_[_
[_[_[_[_[_[_
[_[_
[_[_[_
[_[_[_
[_[_
[_[_[_
[_[_[_
[_ [_[_[_ [_[_ [_
[_[_[_
[_[_[_
[_
[_
[_
[_[_
[_
[_
[_[_
[_
[_[_
[_[_[_[_
[_
[_[_[_[_[_[_
[_[_
[_
[_[_[_[_
[_
[_
[_[_[_
[_[_[_
[_[_
[_[_[_
[_
[_[_[_[_
[_[_
[_[_[_[_
[_
[_ [_
[_
[_[_[_
[_[_
[_
[_[_[_
[_
[_[_
[_
[_[_
[_ [_[_[_[_
[_[_
[_ [_
[_[_[_[_
[_[_ [_ [_
[_
[_
[_ [_
[_[_[_[_[_
[_[_
[_[_
[_ [_ [_
[_[_[_[_
[_[_
[_[_[_[_
[_ [_ [_ [_
[_[_[_[_[_[_
[_
[_[_[_
[_[_[_[_
[_
[_
[_
[_ [_[_[_
[_
[_[_
[_[_
[_
[_[_
[_
[_ [_ [_
[_
[_[_
[_ [_[_ [_ [_[_
[_[_[_[_
[_[_[_ [_
[_
[_
[_
[_
[_
[_
[_
[_[_[_
[_ [_[_
[_[_
[_
[_[_
[_[_
[_[_[_[_
[_[_[_[_[_[_ [_
[_[_[_
[_[_[_[_[_[_[_ [_[_
[_
[_[_[_[_[_
[_
[_
[_[_[_
[_
[_[_
[_aaa aaaaa aaaaaaaa aaa aaaa aaaaaa
29 Surveys
Boarding at SR 7
56%30%
44% 33%15%26%
!(
!(
!(
!(
!(
!(
!(
!(
!(
!(
!(
!(!(
!(
!(
!(
!(
!(
!(
!(
!(
!(
!(
!(
!(
!(!(!(
!(
!(
!(
!(
!(
!(
!(
!(
!(!(
!(
!(!(
!(
!(
!(
!(!(
!(
!(
!(
!(
!(!(
!(
!(
!(
!( !( !(
!(!(
!(
!(
!(
!(
!(
!(
!(
!(
!(!(
!(
!(
!(
!(
!(
!( !(
!(!(
!( !(
!(!(
!(
!( !(
!(
!(
!(
!(!(!(
!(
!(
!(
!(
!(
!(!(
!(
!(
!(
!(
!(
!(
!(
!(
!(
!(
!(!(
!(
!(
!(!(
!( !(
!(
!(!(
!(
!(
!(
!(
!( !(!(
!(
!(
!(
!(!(!(!(!(
!(
!(
!(
!(!( !(!(
!(
!(
!(
!(!(
!(
!(
!( !(!(
!(
!(
!(
!(
!(
!(
!(
!(!(!(
!(
!(
!(
!(
!(!(
!(
!(
!(
!(
!(
!(
!(
!(
!(
!(
!(
!(
!( !(
!(
!(!( !(
!(
!(
!(
!(
!(
!(
!(
!( !(
!(
!(!(
!(
!(
!(
!(
!( !(!(!(
!(
!(
!(
!(
!(
!(
!(
!(
!(
!(
!(!(
!(
!(
!(
!(!(
!(
!(
!(
!(
!(
!(
!(
!(
!(
!(
!(
!(
!(
!(
!(
!(
!(
!(!(
!(
!(
!(
!(
!(!(
!(
!(
!(
!(
!(
!(
!(
!(
!(
!(
!(
!(
!(
!(
!(
!(
!(
!(!(
!(!(
!( !(
!(
!(
!(
!(
!(
!(
!(
!(
!(
!(
!(
!(!(
!(
!(
!(
!(
!(!(
!(
!(
!(
!(
!(!( !(!( !(!(!( !(
!(
!(
[_[_[_
[_
[_
[_[_
[_[_
[_[_[_
[_ [_
[_[_ [_
[_[_[_[_
[_
[_[_
[_ [_
[_[_[_
[_
[_
[_
[_ [_
[_
[_
[_[_
[_
[_ [_
[_[_
[_[_[_[_[_
[_
[_
[_[_[_
[_
[_
[_
[_
[_
[_[_ [_[_
[_
[_
[_
[_
[_[_[_
[_
[_
[_ [_[_
[_ [_ [_[_ [_[_
[_
[_
[_
[_[_
[_
[_
[_ [_
[_
[_
[_
[_
[_[_
[_ [_
[_
[_
[_
[_[_
[_
[_ [_ [_[_
[_
[_[_[_
[_[_
[_[_
[_
[_[_
[_[_[_[_
[_
[_[_[_[_[_[_
[_[_ [_ [_[_[_
[_
[_
[_
[_
[_
[_[_[_
[_ [_
[_[_[_[_[_[_
[_[_ [_
[_
[_
[_
[_
[_[_
[_
[_
[_
[_
[_[_[_ [_
[_
[_
[_
[_
[_
[_
[_[_
[_
[_[_
[_
[_[_[_
[_[_
[_
[_ [_[_
[_[_
[_
[_ [_[_
[_[_
[_ [_ [_[_
[_[_[_[_
[_[_[_[_
[_[_ [_
[_[_[_
[_
[_
[_[_[_
[_
[_[_[_[_
[_
[_
[_[_
[_ [_
[_
[_[_ [_
[_[_[_
[_
[_[_[_ [_[_
[_[_[_ [_
[_[_
[_[_[_
[_[_[_[_[_[_
[_[_
[_[_[_
[_[_[_
[_[_
[_[_[_
[_[_[_
[_ [_[_[_ [_[_ [_
[_[_[_
[_[_[_
[_
[_
[_
[_[_
[_
[_
[_[_
[_
[_[_
[_[_[_[_
[_
[_[_[_[_[_[_
[_[_
[_
[_[_[_[_
[_
[_
[_[_[_
[_[_[_
[_[_
[_[_[_
[_
[_[_[_[_
[_[_
[_[_[_[_
[_
[_ [_
[_
[_[_[_
[_[_
[_
[_[_[_
[_
[_[_
[_
[_[_
[_ [_[_[_[_
[_[_
[_ [_
[_[_[_[_
[_[_ [_ [_
[_
[_
[_ [_
[_[_[_[_[_
[_[_
[_[_
[_ [_ [_
[_[_[_[_
[_[_
[_[_[_[_
[_ [_ [_ [_
[_[_[_[_[_[_
[_
[_[_[_
[_[_[_[_
[_
[_
[_
[_ [_[_[_
[_
[_[_
[_[_
[_
[_[_
[_
[_ [_ [_
[_
[_[_
[_ [_[_ [_ [_[_
[_[_[_[_
[_[_[_ [_
[_
[_
[_
[_
[_
[_
[_
[_[_[_
[_ [_[_
[_[_
[_
[_[_
[_[_
[_[_[_[_
[_[_[_[_[_[_ [_
[_[_[_
[_[_[_[_[_[_[_ [_[_
[_
[_[_[_[_[_
[_
[_
[_[_[_
[_
[_[_
[_
aaaaaaaaaaaaaaaaaaaaaaa
23 Surveys
Boarding at West Broward Terminal
65%48%61%70%
a Origin Station
[_ Transit Boarding
[_ Transit Alighting
!( Trip Origin!( Trip Destination
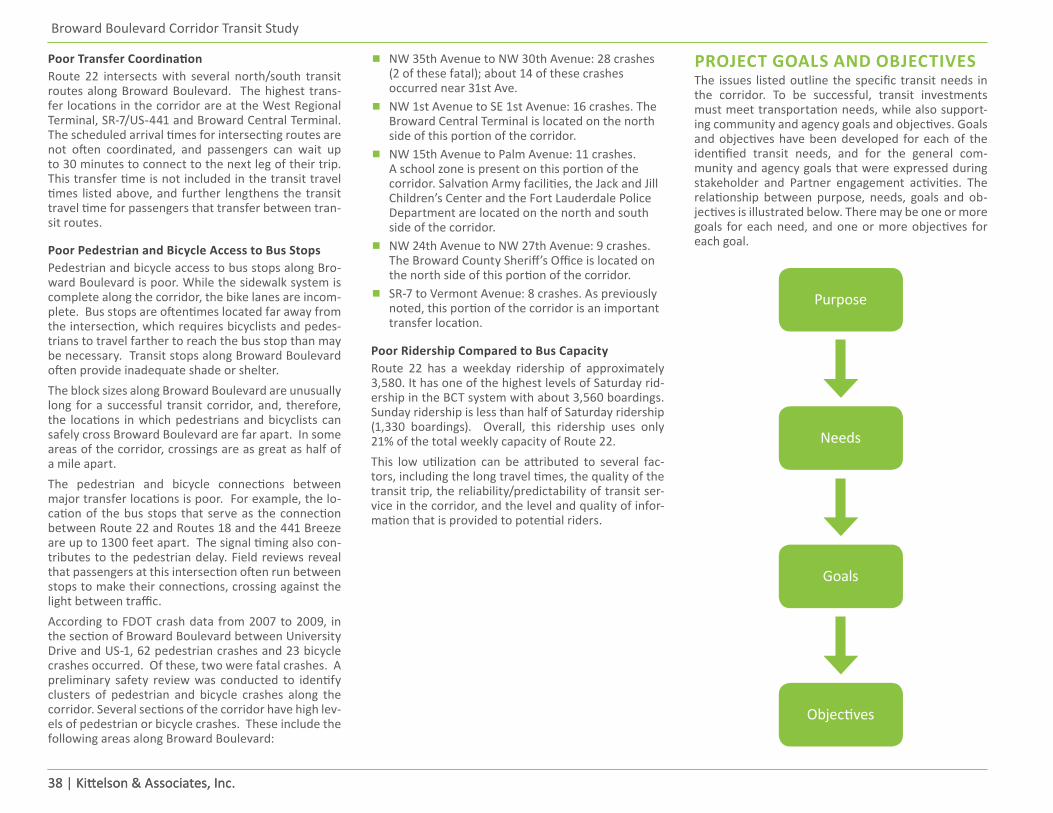
38 | Kittelson & Associates, Inc.
Broward Boulevard Corridor Transit Study
38 | Kittelson & Associates, Inc.
Poor Transfer CoordinationRoute 22 intersects with several north/south transit routes along Broward Boulevard. The highest trans-fer locations in the corridor are at the West Regional Terminal, SR-7/US-441 and Broward Central Terminal. The scheduled arrival times for intersecting routes are not often coordinated, and passengers can wait up to 30 minutes to connect to the next leg of their trip. This transfer time is not included in the transit travel times listed above, and further lengthens the transit travel time for passengers that transfer between tran-sit routes.
Poor Pedestrian and Bicycle Access to Bus StopsPedestrian and bicycle access to bus stops along Bro-ward Boulevard is poor. While the sidewalk system is complete along the corridor, the bike lanes are incom-plete. Bus stops are oftentimes located far away from the intersection, which requires bicyclists and pedes-trians to travel farther to reach the bus stop than may be necessary. Transit stops along Broward Boulevard often provide inadequate shade or shelter. The block sizes along Broward Boulevard are unusually long for a successful transit corridor, and, therefore, the locations in which pedestrians and bicyclists can safely cross Broward Boulevard are far apart. In some areas of the corridor, crossings are as great as half of a mile apart. The pedestrian and bicycle connections between major transfer locations is poor. For example, the lo-cation of the bus stops that serve as the connection between Route 22 and Routes 18 and the 441 Breeze are up to 1300 feet apart. The signal timing also con-tributes to the pedestrian delay. Field reviews reveal that passengers at this intersection often run between stops to make their connections, crossing against the light between traffic.According to FDOT crash data from 2007 to 2009, in the section of Broward Boulevard between University Drive and US-1, 62 pedestrian crashes and 23 bicycle crashes occurred. Of these, two were fatal crashes. A preliminary safety review was conducted to identify clusters of pedestrian and bicycle crashes along the corridor. Several sections of the corridor have high lev-els of pedestrian or bicycle crashes. These include the following areas along Broward Boulevard:
▪ NW 35th Avenue to NW 30th Avenue: 28 crashes (2 of these fatal); about 14 of these crashes occurred near 31st Ave.
▪ NW 1st Avenue to SE 1st Avenue: 16 crashes. The Broward Central Terminal is located on the north side of this portion of the corridor.
▪ NW 15th Avenue to Palm Avenue: 11 crashes. A school zone is present on this portion of the corridor. Salvation Army facilities, the Jack and Jill Children’s Center and the Fort Lauderdale Police Department are located on the north and south side of the corridor.
▪ NW 24th Avenue to NW 27th Avenue: 9 crashes. The Broward County Sheriff’s Office is located on the north side of this portion of the corridor.
▪ SR-7 to Vermont Avenue: 8 crashes. As previously noted, this portion of the corridor is an important transfer location.
Poor Ridership Compared to Bus CapacityRoute 22 has a weekday ridership of approximately 3,580. It has one of the highest levels of Saturday rid-ership in the BCT system with about 3,560 boardings. Sunday ridership is less than half of Saturday ridership (1,330 boardings). Overall, this ridership uses only 21% of the total weekly capacity of Route 22. This low utilization can be attributed to several fac-tors, including the long travel times, the quality of the transit trip, the reliability/predictability of transit ser-vice in the corridor, and the level and quality of infor-mation that is provided to potential riders.
PROJECT GOALS AND OBJECTIVES The issues listed outline the specific transit needs in the corridor. To be successful, transit investments must meet transportation needs, while also support-ing community and agency goals and objectives. Goals and objectives have been developed for each of the identified transit needs, and for the general com-munity and agency goals that were expressed during stakeholder and Partner engagement activities. The relationship between purpose, needs, goals and ob-jectives is illustrated below. There may be one or more goals for each need, and one or more objectives for each goal.
Purpose
Needs
Goals
Objectives
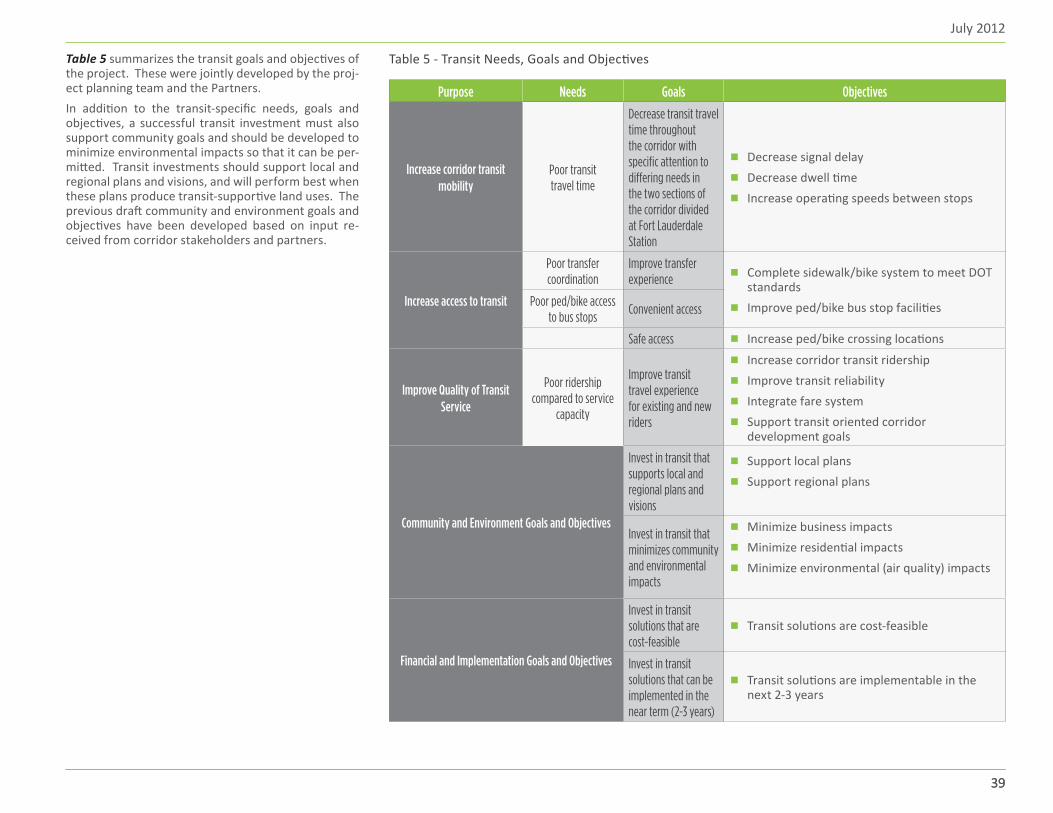
July 2012
3939
Table 5 summarizes the transit goals and objectives of the project. These were jointly developed by the proj-ect planning team and the Partners. In addition to the transit-specific needs, goals and objectives, a successful transit investment must also support community goals and should be developed to minimize environmental impacts so that it can be per-mitted. Transit investments should support local and regional plans and visions, and will perform best when these plans produce transit-supportive land uses. The previous draft community and environment goals and objectives have been developed based on input re-ceived from corridor stakeholders and partners.
Purpose Needs Goals Objectives
Increase corridor transit mobility
Poor transit travel time
Decrease transit travel time throughout the corridor with specific attention to differing needs in the two sections of the corridor divided at Fort Lauderdale Station
▪ Decrease signal delay
▪ Decrease dwell time
▪ Increase operating speeds between stops
Increase access to transit
Poor transfer coordination
Improve transfer experience ▪ Complete sidewalk/bike system to meet DOT
standards
▪ Improve ped/bike bus stop facilitiesPoor ped/bike access to bus stops
Convenient access
Safe access ▪ Increase ped/bike crossing locations
Improve Quality of Transit Service
Poor ridership compared to service
capacity
Improve transit travel experience for existing and new riders
▪ Increase corridor transit ridership
▪ Improve transit reliability
▪ Integrate fare system
▪ Support transit oriented corridor development goals
Community and Environment Goals and Objectives
Invest in transit that supports local and regional plans and visions
▪ Support local plans
▪ Support regional plans
Invest in transit that minimizes community and environmental impacts
▪ Minimize business impacts
▪ Minimize residential impacts
▪ Minimize environmental (air quality) impacts
Financial and Implementation Goals and Objectives
Invest in transit solutions that are cost-feasible
▪ Transit solutions are cost-feasible
Invest in transit solutions that can be implemented in the near term (2-3 years)
▪ Transit solutions are implementable in the next 2-3 years
Table 5 - Transit Needs, Goals and Objectives


41
Alternatives DevelopmentSECTION 5
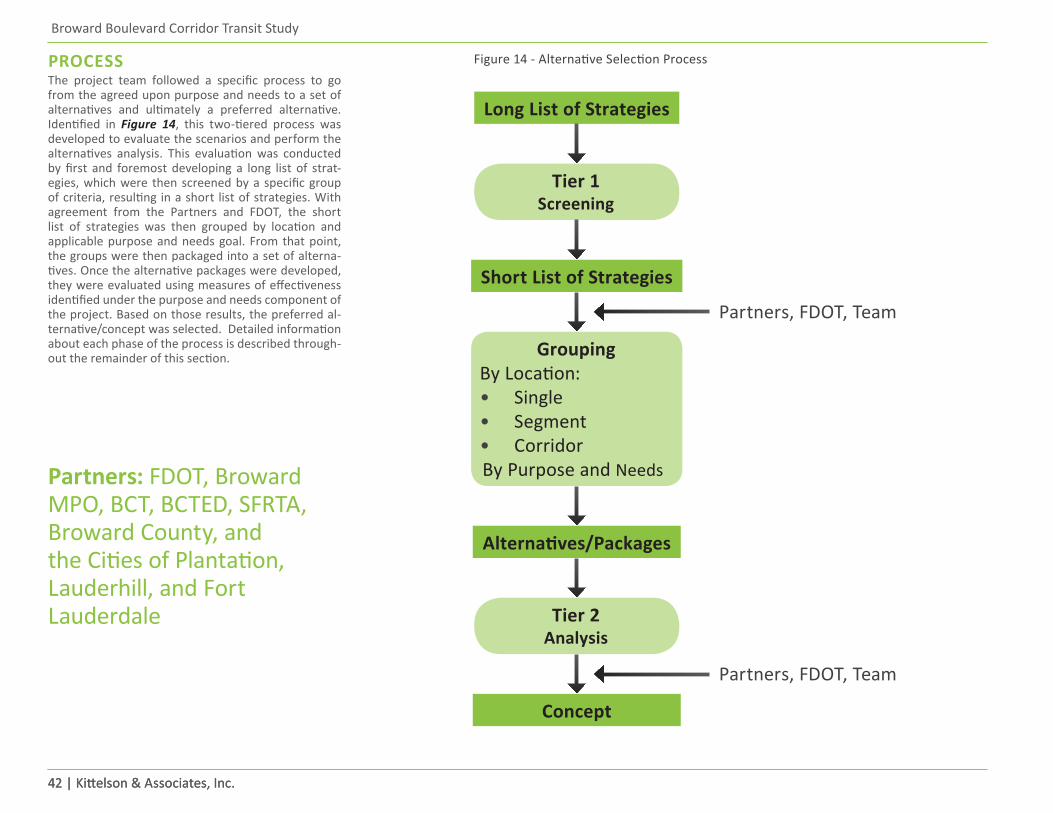
42 | Kittelson & Associates, Inc.
Broward Boulevard Corridor Transit Study
42 | Kittelson & Associates, Inc.
PROCESSThe project team followed a specific process to go from the agreed upon purpose and needs to a set of alternatives and ultimately a preferred alternative. Identified in Figure 14, this two-tiered process was developed to evaluate the scenarios and perform the alternatives analysis. This evaluation was conducted by first and foremost developing a long list of strat-egies, which were then screened by a specific group of criteria, resulting in a short list of strategies. With agreement from the Partners and FDOT, the short list of strategies was then grouped by location and applicable purpose and needs goal. From that point, the groups were then packaged into a set of alterna-tives. Once the alternative packages were developed, they were evaluated using measures of effectiveness identified under the purpose and needs component of the project. Based on those results, the preferred al-ternative/concept was selected. Detailed information about each phase of the process is described through-out the remainder of this section.
Partners: FDOT, Broward MPO, BCT, BCTED, SFRTA, Broward County, and the Cities of Plantation, Lauderhill, and Fort Lauderdale
Figure 14 - Alternative Selection Process
Long List of Strategies
Short List of Strategies
Alternatives/Packages
Concept
GroupingBy Location:• Single• Segment• CorridorBy Purpose and Needs
Tier 1Screening
Tier 2Analysis
Partners, FDOT, Team
Partners, FDOT, Team
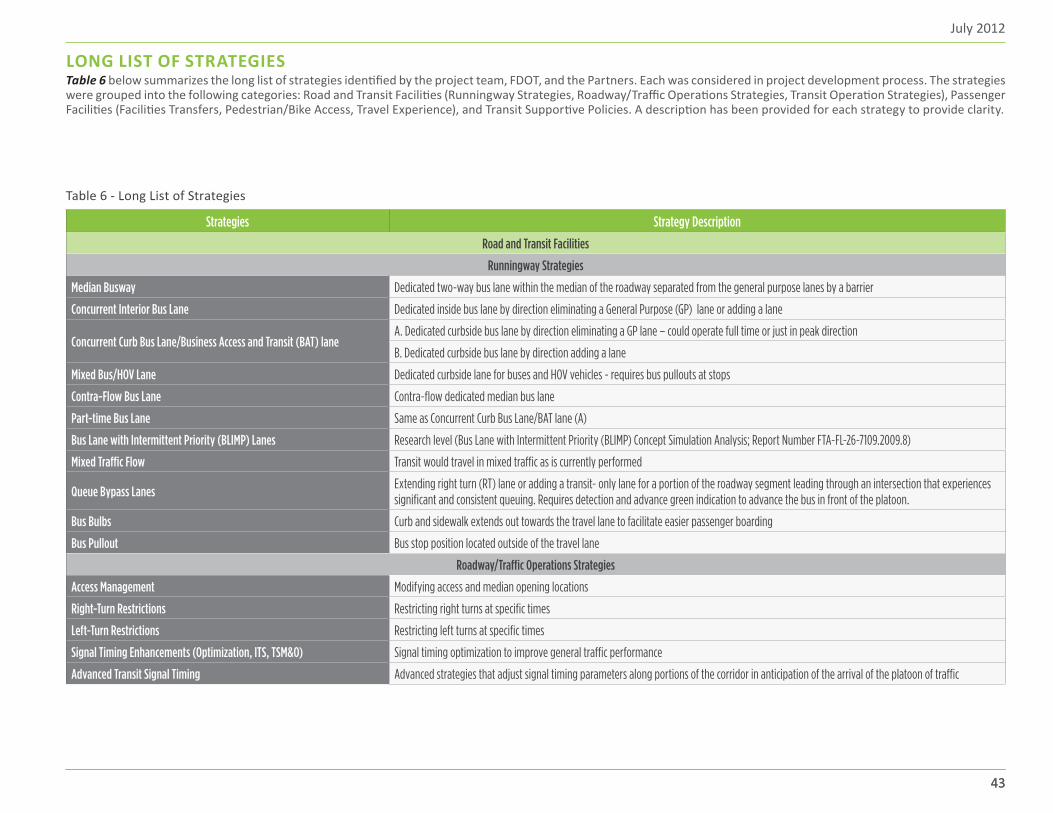
July 2012
4343
LONG LIST OF STRATEGIESTable 6 below summarizes the long list of strategies identified by the project team, FDOT, and the Partners. Each was considered in project development process. The strategies were grouped into the following categories: Road and Transit Facilities (Runningway Strategies, Roadway/Traffic Operations Strategies, Transit Operation Strategies), Passenger Facilities (Facilities Transfers, Pedestrian/Bike Access, Travel Experience), and Transit Supportive Policies. A description has been provided for each strategy to provide clarity.
Strategies Strategy Description
Road and Transit Facilities
Runningway Strategies
Median Busway Dedicated two-way bus lane within the median of the roadway separated from the general purpose lanes by a barrier
Concurrent Interior Bus Lane Dedicated inside bus lane by direction eliminating a General Purpose (GP) lane or adding a lane
Concurrent Curb Bus Lane/Business Access and Transit (BAT) laneA. Dedicated curbside bus lane by direction eliminating a GP lane – could operate full time or just in peak direction
B. Dedicated curbside bus lane by direction adding a lane
Mixed Bus/HOV Lane Dedicated curbside lane for buses and HOV vehicles - requires bus pullouts at stops
Contra-Flow Bus Lane Contra-flow dedicated median bus lane
Part-time Bus Lane Same as Concurrent Curb Bus Lane/BAT lane (A)
Bus Lane with Intermittent Priority (BLIMP) Lanes Research level (Bus Lane with Intermittent Priority (BLIMP) Concept Simulation Analysis; Report Number FTA-FL-26-7109.2009.8)
Mixed Traffic Flow Transit would travel in mixed traffic as is currently performed
Queue Bypass Lanes Extending right turn (RT) lane or adding a transit- only lane for a portion of the roadway segment leading through an intersection that experiences significant and consistent queuing. Requires detection and advance green indication to advance the bus in front of the platoon.
Bus Bulbs Curb and sidewalk extends out towards the travel lane to facilitate easier passenger boarding
Bus Pullout Bus stop position located outside of the travel lane
Roadway/Traffic Operations Strategies
Access Management Modifying access and median opening locations
Right-Turn Restrictions Restricting right turns at specific times
Left-Turn Restrictions Restricting left turns at specific times
Signal Timing Enhancements (Optimization, ITS, TSM&O) Signal timing optimization to improve general traffic performance
Advanced Transit Signal Timing Advanced strategies that adjust signal timing parameters along portions of the corridor in anticipation of the arrival of the platoon of traffic
Table 6 - Long List of Strategies
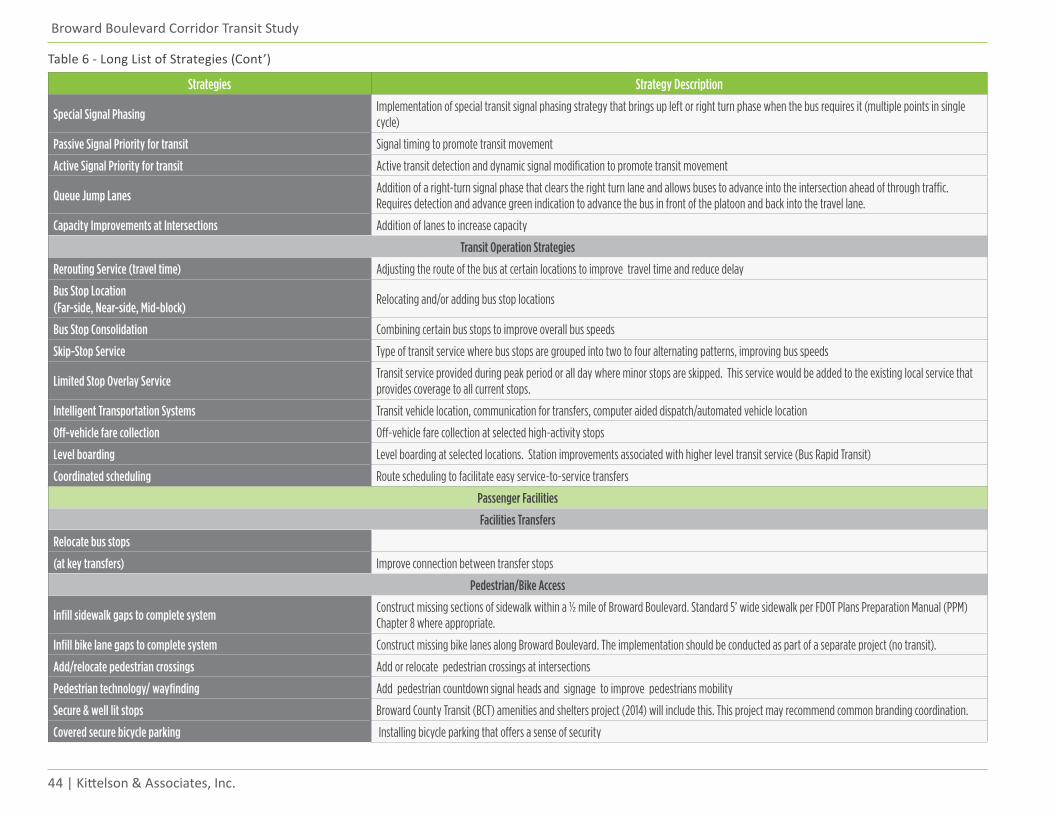
44 | Kittelson & Associates, Inc.
Broward Boulevard Corridor Transit Study
Strategies Strategy Description
Special Signal Phasing Implementation of special transit signal phasing strategy that brings up left or right turn phase when the bus requires it (multiple points in single cycle)
Passive Signal Priority for transit Signal timing to promote transit movement
Active Signal Priority for transit Active transit detection and dynamic signal modification to promote transit movement
Queue Jump Lanes Addition of a right-turn signal phase that clears the right turn lane and allows buses to advance into the intersection ahead of through traffic. Requires detection and advance green indication to advance the bus in front of the platoon and back into the travel lane.
Capacity Improvements at Intersections Addition of lanes to increase capacity
Transit Operation Strategies
Rerouting Service (travel time) Adjusting the route of the bus at certain locations to improve travel time and reduce delay
Bus Stop Location (Far-side, Near-side, Mid-block)
Relocating and/or adding bus stop locations
Bus Stop Consolidation Combining certain bus stops to improve overall bus speeds
Skip-Stop Service Type of transit service where bus stops are grouped into two to four alternating patterns, improving bus speeds
Limited Stop Overlay Service Transit service provided during peak period or all day where minor stops are skipped. This service would be added to the existing local service that provides coverage to all current stops.
Intelligent Transportation Systems Transit vehicle location, communication for transfers, computer aided dispatch/automated vehicle location
Off-vehicle fare collection Off-vehicle fare collection at selected high-activity stops
Level boarding Level boarding at selected locations. Station improvements associated with higher level transit service (Bus Rapid Transit)
Coordinated scheduling Route scheduling to facilitate easy service-to-service transfers
Passenger Facilities
Facilities Transfers
Relocate bus stops
(at key transfers) Improve connection between transfer stops
Pedestrian/Bike Access
Infill sidewalk gaps to complete system Construct missing sections of sidewalk within a ½ mile of Broward Boulevard. Standard 5’ wide sidewalk per FDOT Plans Preparation Manual (PPM) Chapter 8 where appropriate.
Infill bike lane gaps to complete system Construct missing bike lanes along Broward Boulevard. The implementation should be conducted as part of a separate project (no transit).
Add/relocate pedestrian crossings Add or relocate pedestrian crossings at intersections
Pedestrian technology/ wayfinding Add pedestrian countdown signal heads and signage to improve pedestrians mobility
Secure & well lit stops Broward County Transit (BCT) amenities and shelters project (2014) will include this. This project may recommend common branding coordination.
Covered secure bicycle parking Installing bicycle parking that offers a sense of security
Table 6 - Long List of Strategies (Cont’)
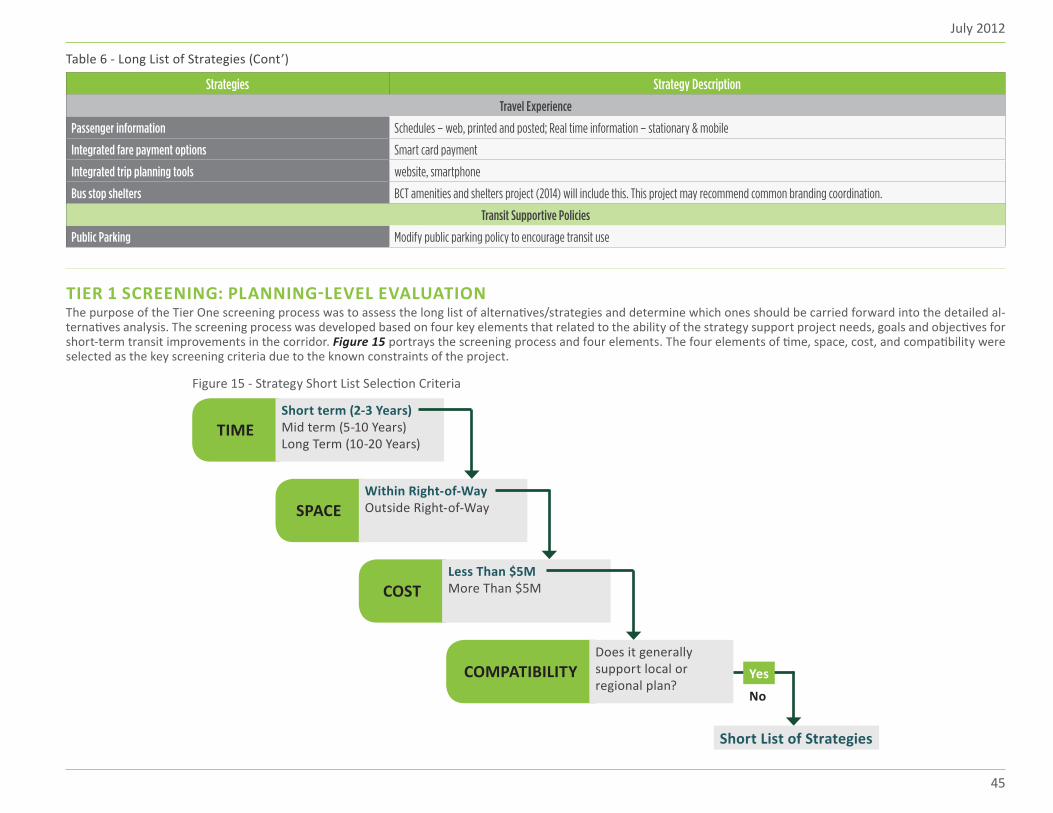
July 2012
45
Strategies Strategy Description
Travel Experience
Passenger information Schedules – web, printed and posted; Real time information – stationary & mobile
Integrated fare payment options Smart card payment
Integrated trip planning tools website, smartphone
Bus stop shelters BCT amenities and shelters project (2014) will include this. This project may recommend common branding coordination.
Transit Supportive Policies
Public Parking Modify public parking policy to encourage transit use
TIER 1 SCREENING: PLANNING-LEVEL EVALUATIONThe purpose of the Tier One screening process was to assess the long list of alternatives/strategies and determine which ones should be carried forward into the detailed al-ternatives analysis. The screening process was developed based on four key elements that related to the ability of the strategy support project needs, goals and objectives for short-term transit improvements in the corridor. Figure 15 portrays the screening process and four elements. The four elements of time, space, cost, and compatibility were selected as the key screening criteria due to the known constraints of the project.
Figure 15 - Strategy Short List Selection Criteria
TIME
SPACE
COST
COMPATIBILITY
Short term (2-3 Years)Mid term (5-10 Years)Long Term (10-20 Years)
Within Right-of-WayOutside Right-of-Way
Less Than $5MMore Than $5M
Does it generally support local or regional plan?
Short List of Strategies
Yes
No
Table 6 - Long List of Strategies (Cont’)
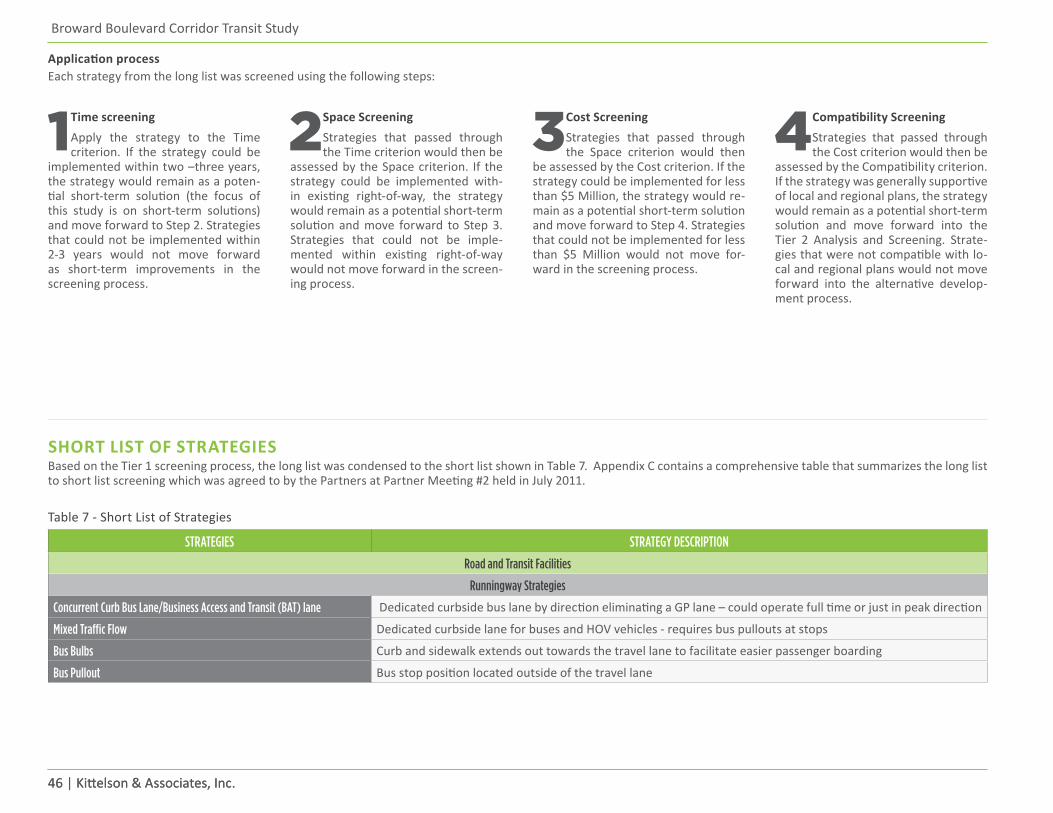
46 | Kittelson & Associates, Inc.
Broward Boulevard Corridor Transit Study
46 | Kittelson & Associates, Inc.
Application process Each strategy from the long list was screened using the following steps:
1Time screeningApply the strategy to the Time criterion. If the strategy could be
implemented within two –three years, the strategy would remain as a poten-tial short-term solution (the focus of this study is on short-term solutions) and move forward to Step 2. Strategies that could not be implemented within 2-3 years would not move forward as short-term improvements in the screening process.
2 Space ScreeningStrategies that passed through the Time criterion would then be
assessed by the Space criterion. If the strategy could be implemented with-in existing right-of-way, the strategy would remain as a potential short-term solution and move forward to Step 3. Strategies that could not be imple-mented within existing right-of-way would not move forward in the screen-ing process.
3Cost ScreeningStrategies that passed through the Space criterion would then
be assessed by the Cost criterion. If the strategy could be implemented for less than $5 Million, the strategy would re-main as a potential short-term solution and move forward to Step 4. Strategies that could not be implemented for less than $5 Million would not move for-ward in the screening process.
4 Compatibility ScreeningStrategies that passed through the Cost criterion would then be
assessed by the Compatibility criterion. If the strategy was generally supportive of local and regional plans, the strategy would remain as a potential short-term solution and move forward into the Tier 2 Analysis and Screening. Strate-gies that were not compatible with lo-cal and regional plans would not move forward into the alternative develop-ment process.
SHORT LIST OF STRATEGIESBased on the Tier 1 screening process, the long list was condensed to the short list shown in Table 7. Appendix C contains a comprehensive table that summarizes the long list to short list screening which was agreed to by the Partners at Partner Meeting #2 held in July 2011.
Table 7 - Short List of Strategies
STRATEGIES STRATEGY DESCRIPTION
Road and Transit Facilities
Runningway Strategies
Concurrent Curb Bus Lane/Business Access and Transit (BAT) lane Dedicated curbside bus lane by direction eliminating a GP lane – could operate full time or just in peak direction
Mixed Traffic Flow Dedicated curbside lane for buses and HOV vehicles - requires bus pullouts at stops
Bus Bulbs Curb and sidewalk extends out towards the travel lane to facilitate easier passenger boarding
Bus Pullout Bus stop position located outside of the travel lane
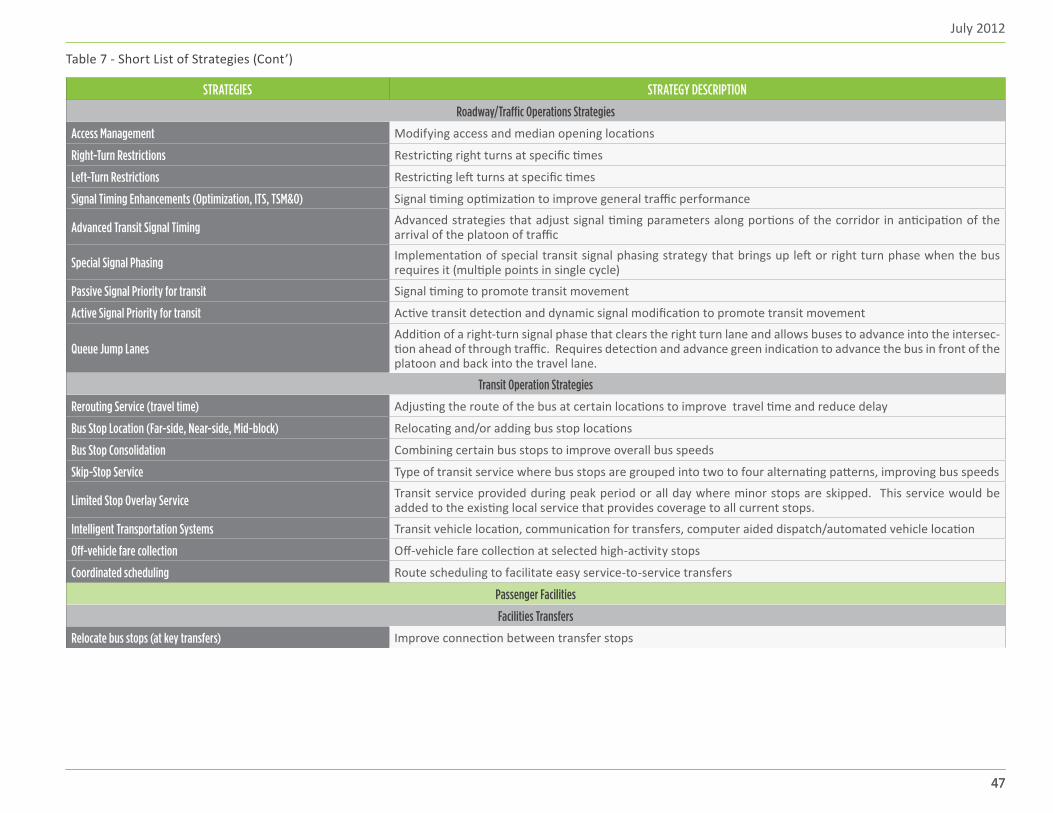
July 2012
4747
Table 7 - Short List of Strategies (Cont’)
STRATEGIES STRATEGY DESCRIPTION
Roadway/Traffic Operations Strategies
Access Management Modifying access and median opening locations
Right-Turn Restrictions Restricting right turns at specific times
Left-Turn Restrictions Restricting left turns at specific times
Signal Timing Enhancements (Optimization, ITS, TSM&O) Signal timing optimization to improve general traffic performance
Advanced Transit Signal Timing Advanced strategies that adjust signal timing parameters along portions of the corridor in anticipation of the arrival of the platoon of traffic
Special Signal Phasing Implementation of special transit signal phasing strategy that brings up left or right turn phase when the bus requires it (multiple points in single cycle)
Passive Signal Priority for transit Signal timing to promote transit movement
Active Signal Priority for transit Active transit detection and dynamic signal modification to promote transit movement
Queue Jump LanesAddition of a right-turn signal phase that clears the right turn lane and allows buses to advance into the intersec-tion ahead of through traffic. Requires detection and advance green indication to advance the bus in front of the platoon and back into the travel lane.
Transit Operation Strategies
Rerouting Service (travel time) Adjusting the route of the bus at certain locations to improve travel time and reduce delay
Bus Stop Location (Far-side, Near-side, Mid-block) Relocating and/or adding bus stop locations
Bus Stop Consolidation Combining certain bus stops to improve overall bus speeds
Skip-Stop Service Type of transit service where bus stops are grouped into two to four alternating patterns, improving bus speeds
Limited Stop Overlay Service Transit service provided during peak period or all day where minor stops are skipped. This service would be added to the existing local service that provides coverage to all current stops.
Intelligent Transportation Systems Transit vehicle location, communication for transfers, computer aided dispatch/automated vehicle location
Off-vehicle fare collection Off-vehicle fare collection at selected high-activity stops
Coordinated scheduling Route scheduling to facilitate easy service-to-service transfers
Passenger Facilities
Facilities Transfers
Relocate bus stops (at key transfers) Improve connection between transfer stops
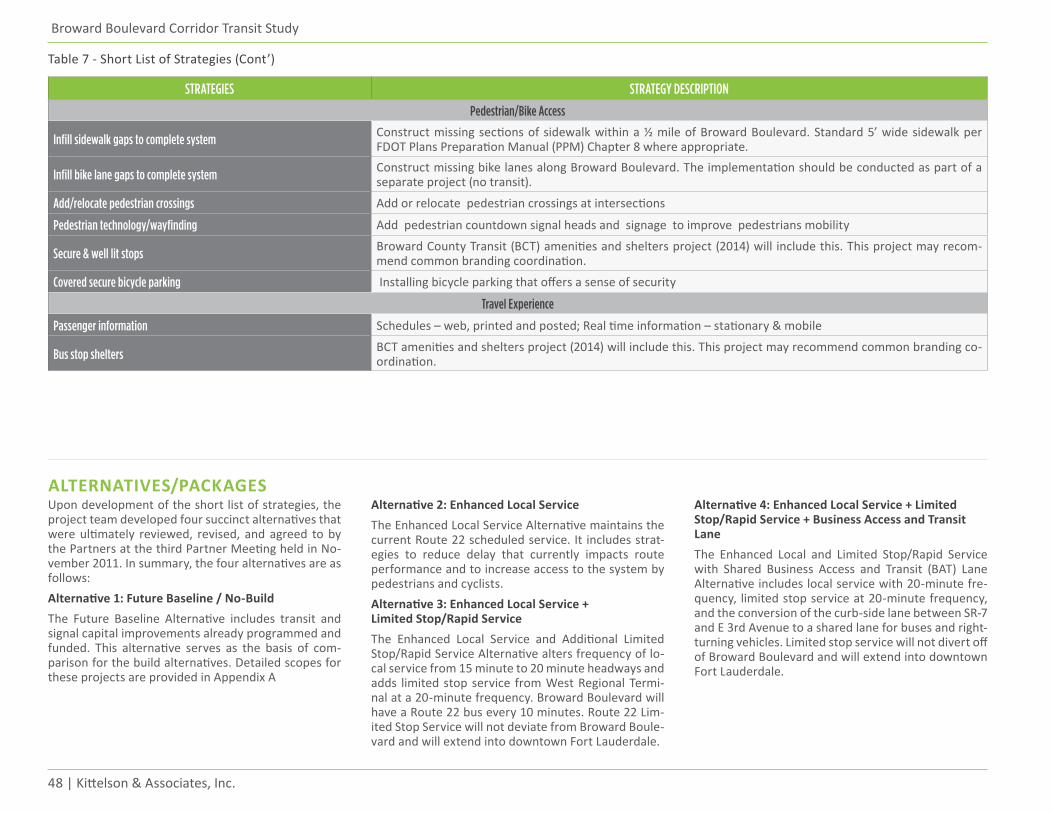
48 | Kittelson & Associates, Inc.
Broward Boulevard Corridor Transit Study
ALTERNATIVES/PACKAGES Upon development of the short list of strategies, the project team developed four succinct alternatives that were ultimately reviewed, revised, and agreed to by the Partners at the third Partner Meeting held in No-vember 2011. In summary, the four alternatives are as follows:Alternative 1: Future Baseline / No-BuildThe Future Baseline Alternative includes transit and signal capital improvements already programmed and funded. This alternative serves as the basis of com-parison for the build alternatives. Detailed scopes for these projects are provided in Appendix A
Alternative 2: Enhanced Local ServiceThe Enhanced Local Service Alternative maintains the current Route 22 scheduled service. It includes strat-egies to reduce delay that currently impacts route performance and to increase access to the system by pedestrians and cyclists.Alternative 3: Enhanced Local Service + Limited Stop/Rapid ServiceThe Enhanced Local Service and Additional Limited Stop/Rapid Service Alternative alters frequency of lo-cal service from 15 minute to 20 minute headways and adds limited stop service from West Regional Termi-nal at a 20-minute frequency. Broward Boulevard will have a Route 22 bus every 10 minutes. Route 22 Lim-ited Stop Service will not deviate from Broward Boule-vard and will extend into downtown Fort Lauderdale.
Alternative 4: Enhanced Local Service + Limited Stop/Rapid Service + Business Access and Transit LaneThe Enhanced Local and Limited Stop/Rapid Service with Shared Business Access and Transit (BAT) Lane Alternative includes local service with 20-minute fre-quency, limited stop service at 20-minute frequency, and the conversion of the curb-side lane between SR-7 and E 3rd Avenue to a shared lane for buses and right-turning vehicles. Limited stop service will not divert off of Broward Boulevard and will extend into downtown Fort Lauderdale.
STRATEGIES STRATEGY DESCRIPTION
Pedestrian/Bike Access
Infill sidewalk gaps to complete system Construct missing sections of sidewalk within a ½ mile of Broward Boulevard. Standard 5’ wide sidewalk per FDOT Plans Preparation Manual (PPM) Chapter 8 where appropriate.
Infill bike lane gaps to complete system Construct missing bike lanes along Broward Boulevard. The implementation should be conducted as part of a separate project (no transit).
Add/relocate pedestrian crossings Add or relocate pedestrian crossings at intersections
Pedestrian technology/wayfinding Add pedestrian countdown signal heads and signage to improve pedestrians mobility
Secure & well lit stops Broward County Transit (BCT) amenities and shelters project (2014) will include this. This project may recom-mend common branding coordination.
Covered secure bicycle parking Installing bicycle parking that offers a sense of security
Travel Experience
Passenger information Schedules – web, printed and posted; Real time information – stationary & mobile
Bus stop shelters BCT amenities and shelters project (2014) will include this. This project may recommend common branding co-ordination.
Table 7 - Short List of Strategies (Cont’)
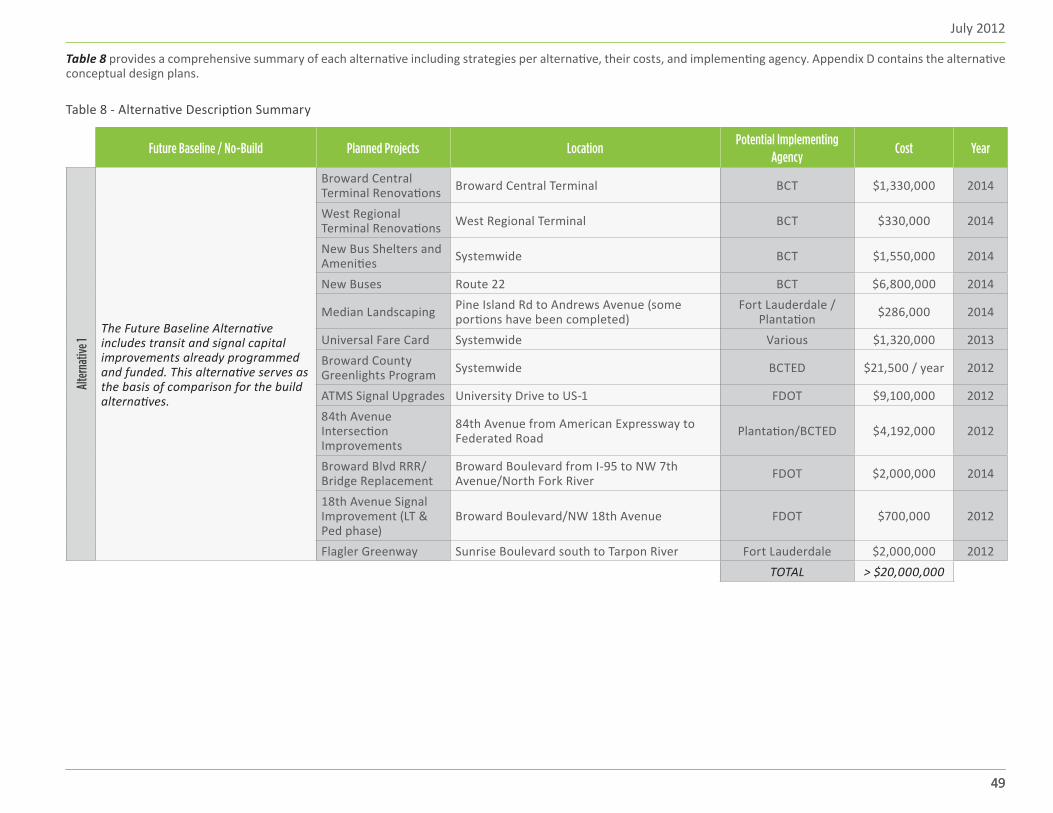
July 2012
4949
Future Baseline / No-Build Planned Projects LocationPotential Implementing
AgencyCost Year
Alte
rnat
ive 1
The Future Baseline Alternative includes transit and signal capital improvements already programmed and funded. This alternative serves as the basis of comparison for the build alternatives.
Broward Central Terminal Renovations Broward Central Terminal BCT $1,330,000 2014
West Regional Terminal Renovations West Regional Terminal BCT $330,000 2014
New Bus Shelters and Amenities Systemwide BCT $1,550,000 2014
New Buses Route 22 BCT $6,800,000 2014
Median Landscaping Pine Island Rd to Andrews Avenue (some portions have been completed)
Fort Lauderdale /Plantation $286,000 2014
Universal Fare Card Systemwide Various $1,320,000 2013Broward County Greenlights Program Systemwide BCTED $21,500 / year 2012
ATMS Signal Upgrades University Drive to US-1 FDOT $9,100,000 201284th Avenue Intersection Improvements
84th Avenue from American Expressway to Federated Road Plantation/BCTED $4,192,000 2012
Broward Blvd RRR/Bridge Replacement
Broward Boulevard from I-95 to NW 7th Avenue/North Fork River FDOT $2,000,000 2014
18th Avenue Signal Improvement (LT & Ped phase)
Broward Boulevard/NW 18th Avenue FDOT $700,000 2012
Flagler Greenway Sunrise Boulevard south to Tarpon River Fort Lauderdale $2,000,000 2012TOTAL > $20,000,000
Table 8 - Alternative Description Summary
Table 8 provides a comprehensive summary of each alternative including strategies per alternative, their costs, and implementing agency. Appendix D contains the alternative conceptual design plans.
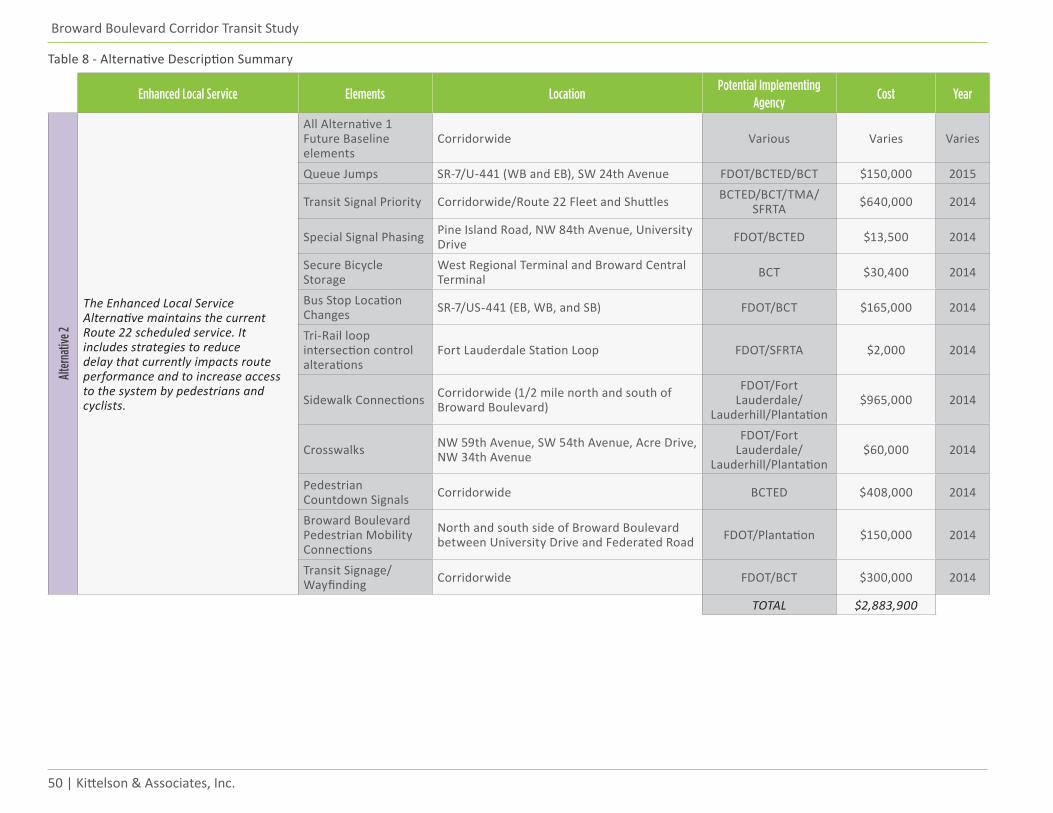
50 | Kittelson & Associates, Inc.
Broward Boulevard Corridor Transit Study
Enhanced Local Service Elements LocationPotential Implementing
AgencyCost Year
Alte
rnat
ive 2
The Enhanced Local Service Alternative maintains the current Route 22 scheduled service. It includes strategies to reduce delay that currently impacts route performance and to increase access to the system by pedestrians and cyclists.
All Alternative 1 Future Baseline elements
Corridorwide Various Varies Varies
Queue Jumps SR-7/U-441 (WB and EB), SW 24th Avenue FDOT/BCTED/BCT $150,000 2015
Transit Signal Priority Corridorwide/Route 22 Fleet and Shuttles BCTED/BCT/TMA/SFRTA $640,000 2014
Special Signal Phasing Pine Island Road, NW 84th Avenue, University Drive FDOT/BCTED $13,500 2014
Secure Bicycle Storage
West Regional Terminal and Broward Central Terminal BCT $30,400 2014
Bus Stop Location Changes SR-7/US-441 (EB, WB, and SB) FDOT/BCT $165,000 2014
Tri-Rail loop intersection control alterations
Fort Lauderdale Station Loop FDOT/SFRTA $2,000 2014
Sidewalk Connections Corridorwide (1/2 mile north and south of Broward Boulevard)
FDOT/Fort Lauderdale/
Lauderhill/Plantation$965,000 2014
Crosswalks NW 59th Avenue, SW 54th Avenue, Acre Drive, NW 34th Avenue
FDOT/Fort Lauderdale/
Lauderhill/Plantation$60,000 2014
Pedestrian Countdown Signals Corridorwide BCTED $408,000 2014
Broward Boulevard Pedestrian Mobility Connections
North and south side of Broward Boulevard between University Drive and Federated Road FDOT/Plantation $150,000 2014
Transit Signage/Wayfinding Corridorwide FDOT/BCT $300,000 2014
TOTAL $2,883,900
Table 8 - Alternative Description Summary
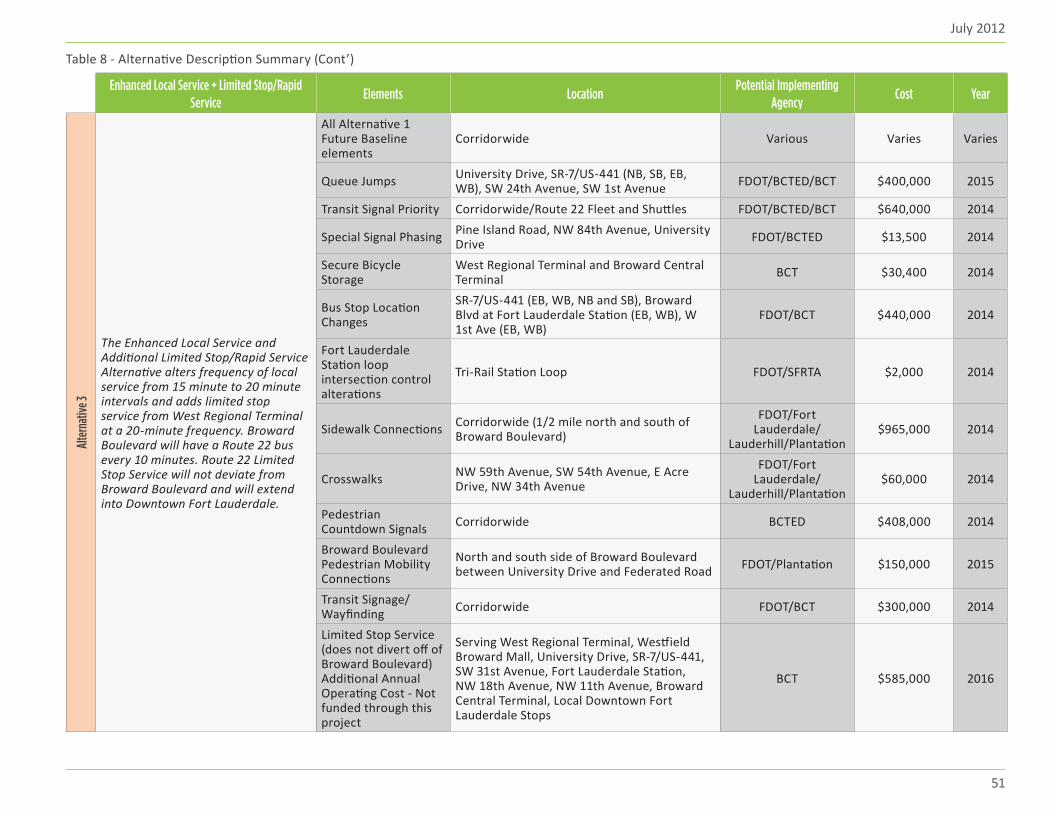
July 2012
51
Enhanced Local Service + Limited Stop/Rapid Service
Elements LocationPotential Implementing
AgencyCost Year
Alte
rnat
ive 3
The Enhanced Local Service and Additional Limited Stop/Rapid Service Alternative alters frequency of local service from 15 minute to 20 minute intervals and adds limited stop service from West Regional Terminal at a 20-minute frequency. Broward Boulevard will have a Route 22 bus every 10 minutes. Route 22 Limited Stop Service will not deviate from Broward Boulevard and will extend into Downtown Fort Lauderdale.
All Alternative 1 Future Baseline elements
Corridorwide Various Varies Varies
Queue Jumps University Drive, SR-7/US-441 (NB, SB, EB, WB), SW 24th Avenue, SW 1st Avenue FDOT/BCTED/BCT $400,000 2015
Transit Signal Priority Corridorwide/Route 22 Fleet and Shuttles FDOT/BCTED/BCT $640,000 2014
Special Signal Phasing Pine Island Road, NW 84th Avenue, University Drive FDOT/BCTED $13,500 2014
Secure Bicycle Storage
West Regional Terminal and Broward Central Terminal BCT $30,400 2014
Bus Stop Location Changes
SR-7/US-441 (EB, WB, NB and SB), Broward Blvd at Fort Lauderdale Station (EB, WB), W 1st Ave (EB, WB)
FDOT/BCT $440,000 2014
Fort Lauderdale Station loop intersection control alterations
Tri-Rail Station Loop FDOT/SFRTA $2,000 2014
Sidewalk Connections Corridorwide (1/2 mile north and south of Broward Boulevard)
FDOT/Fort Lauderdale/
Lauderhill/Plantation$965,000 2014
Crosswalks NW 59th Avenue, SW 54th Avenue, E Acre Drive, NW 34th Avenue
FDOT/Fort Lauderdale/
Lauderhill/Plantation$60,000 2014
Pedestrian Countdown Signals Corridorwide BCTED $408,000 2014
Broward Boulevard Pedestrian Mobility Connections
North and south side of Broward Boulevard between University Drive and Federated Road FDOT/Plantation $150,000 2015
Transit Signage/Wayfinding Corridorwide FDOT/BCT $300,000 2014
Limited Stop Service (does not divert off of Broward Boulevard) Additional Annual Operating Cost - Not funded through this project
Serving West Regional Terminal, Westfield Broward Mall, University Drive, SR-7/US-441, SW 31st Avenue, Fort Lauderdale Station, NW 18th Avenue, NW 11th Avenue, Broward Central Terminal, Local Downtown Fort Lauderdale Stops
BCT $585,000 2016
Table 8 - Alternative Description Summary (Cont’)
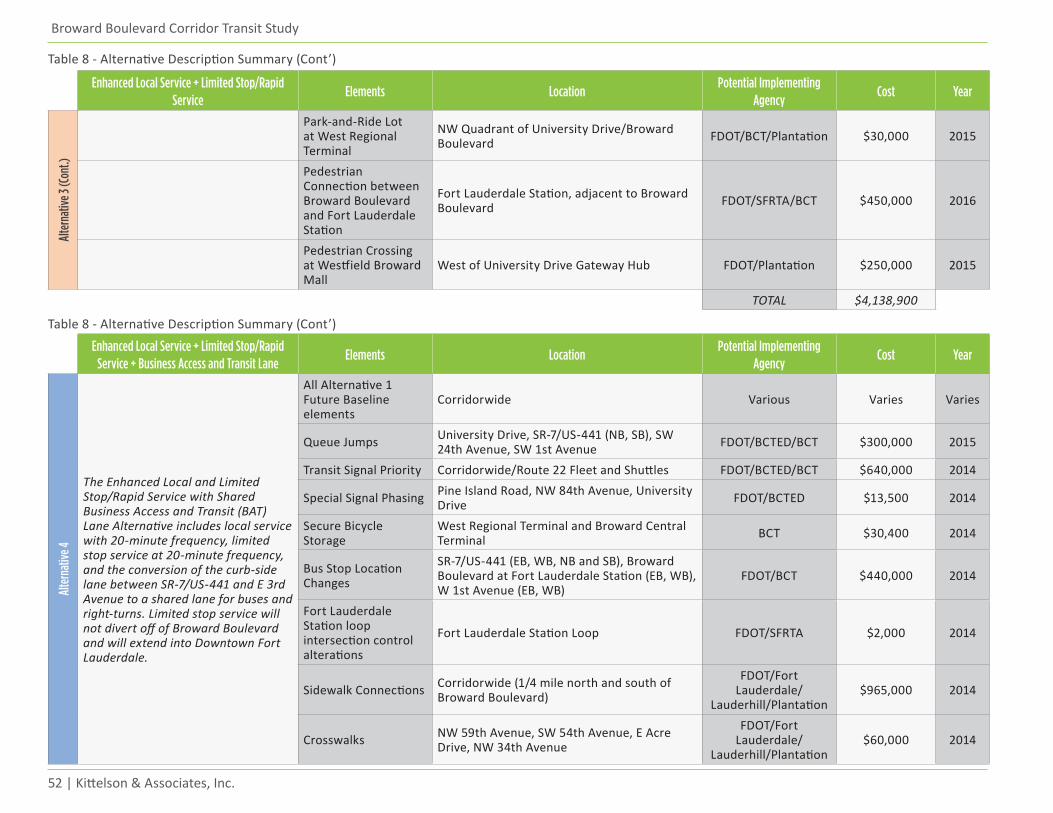
52 | Kittelson & Associates, Inc.
Broward Boulevard Corridor Transit Study
Enhanced Local Service + Limited Stop/Rapid Service
Elements LocationPotential Implementing
AgencyCost Year
Alte
rnat
ive 3
(Con
t.)
Park-and-Ride Lot at West Regional Terminal
NW Quadrant of University Drive/Broward Boulevard FDOT/BCT/Plantation $30,000 2015
Pedestrian Connection between Broward Boulevard and Fort Lauderdale Station
Fort Lauderdale Station, adjacent to Broward Boulevard FDOT/SFRTA/BCT $450,000 2016
Pedestrian Crossing at Westfield Broward Mall
West of University Drive Gateway Hub FDOT/Plantation $250,000 2015
TOTAL $4,138,900
Enhanced Local Service + Limited Stop/Rapid Service + Business Access and Transit Lane
Elements LocationPotential Implementing
AgencyCost Year
Alte
rnat
ive 4
The Enhanced Local and Limited Stop/Rapid Service with Shared Business Access and Transit (BAT) Lane Alternative includes local service with 20-minute frequency, limited stop service at 20-minute frequency, and the conversion of the curb-side lane between SR-7/US-441 and E 3rd Avenue to a shared lane for buses and right-turns. Limited stop service will not divert off of Broward Boulevard and will extend into Downtown Fort Lauderdale.
All Alternative 1 Future Baseline elements
Corridorwide Various Varies Varies
Queue Jumps University Drive, SR-7/US-441 (NB, SB), SW 24th Avenue, SW 1st Avenue FDOT/BCTED/BCT $300,000 2015
Transit Signal Priority Corridorwide/Route 22 Fleet and Shuttles FDOT/BCTED/BCT $640,000 2014
Special Signal Phasing Pine Island Road, NW 84th Avenue, University Drive FDOT/BCTED $13,500 2014
Secure Bicycle Storage
West Regional Terminal and Broward Central Terminal BCT $30,400 2014
Bus Stop Location Changes
SR-7/US-441 (EB, WB, NB and SB), Broward Boulevard at Fort Lauderdale Station (EB, WB), W 1st Avenue (EB, WB)
FDOT/BCT $440,000 2014
Fort Lauderdale Station loop intersection control alterations
Fort Lauderdale Station Loop FDOT/SFRTA $2,000 2014
Sidewalk Connections Corridorwide (1/4 mile north and south of Broward Boulevard)
FDOT/Fort Lauderdale/
Lauderhill/Plantation$965,000 2014
Crosswalks NW 59th Avenue, SW 54th Avenue, E Acre Drive, NW 34th Avenue
FDOT/Fort Lauderdale/
Lauderhill/Plantation$60,000 2014
Table 8 - Alternative Description Summary (Cont’)
Table 8 - Alternative Description Summary (Cont’)
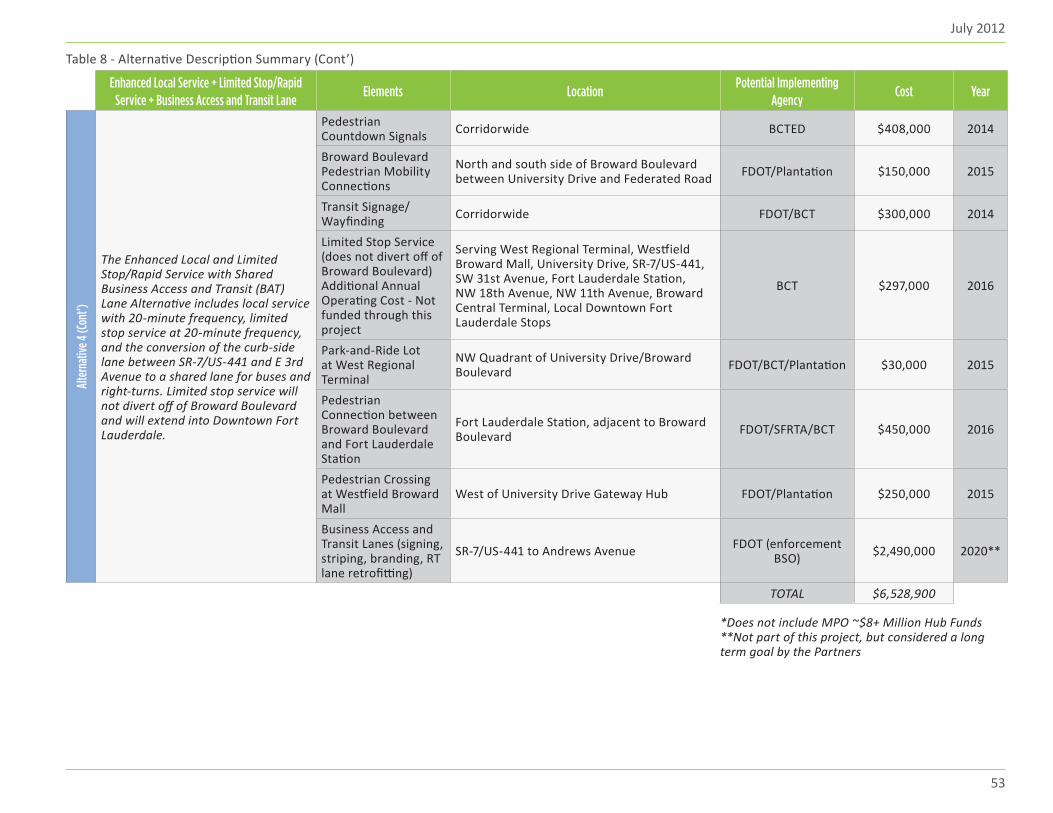
July 2012
53
Enhanced Local Service + Limited Stop/Rapid Service + Business Access and Transit Lane
Elements LocationPotential Implementing
AgencyCost Year
Alte
rnat
ive 4
(Con
t’)
The Enhanced Local and Limited Stop/Rapid Service with Shared Business Access and Transit (BAT) Lane Alternative includes local service with 20-minute frequency, limited stop service at 20-minute frequency, and the conversion of the curb-side lane between SR-7/US-441 and E 3rd Avenue to a shared lane for buses and right-turns. Limited stop service will not divert off of Broward Boulevard and will extend into Downtown Fort Lauderdale.
Pedestrian Countdown Signals Corridorwide BCTED $408,000 2014
Broward Boulevard Pedestrian Mobility Connections
North and south side of Broward Boulevard between University Drive and Federated Road FDOT/Plantation $150,000 2015
Transit Signage/Wayfinding Corridorwide FDOT/BCT $300,000 2014
Limited Stop Service (does not divert off of Broward Boulevard) Additional Annual Operating Cost - Not funded through this project
Serving West Regional Terminal, Westfield Broward Mall, University Drive, SR-7/US-441, SW 31st Avenue, Fort Lauderdale Station, NW 18th Avenue, NW 11th Avenue, Broward Central Terminal, Local Downtown Fort Lauderdale Stops
BCT $297,000 2016
Park-and-Ride Lot at West Regional Terminal
NW Quadrant of University Drive/Broward Boulevard FDOT/BCT/Plantation $30,000 2015
Pedestrian Connection between Broward Boulevard and Fort Lauderdale Station
Fort Lauderdale Station, adjacent to Broward Boulevard FDOT/SFRTA/BCT $450,000 2016
Pedestrian Crossing at Westfield Broward Mall
West of University Drive Gateway Hub FDOT/Plantation $250,000 2015
Business Access and Transit Lanes (signing, striping, branding, RT lane retrofitting)
SR-7/US-441 to Andrews Avenue FDOT (enforcement BSO) $2,490,000 2020**
TOTAL $6,528,900
Table 8 - Alternative Description Summary (Cont’)
*Does not include MPO ~$8+ Million Hub Funds**Not part of this project, but considered a long term goal by the Partners
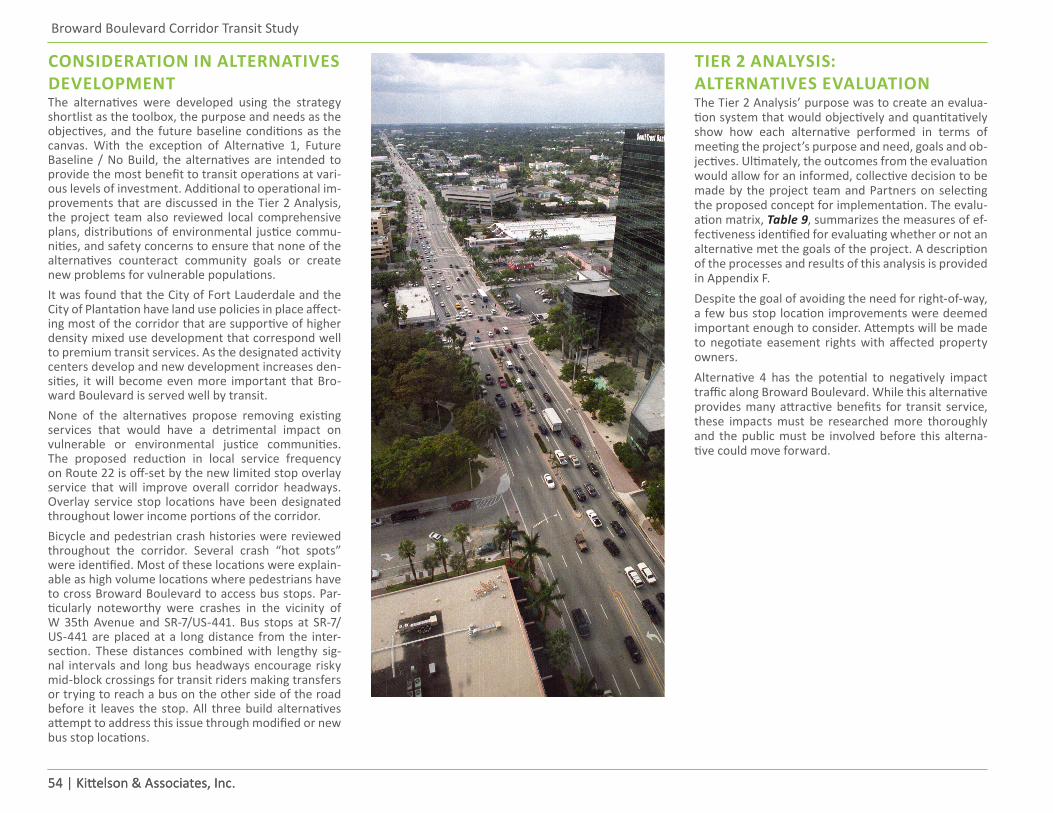
54 | Kittelson & Associates, Inc.
Broward Boulevard Corridor Transit Study
54 | Kittelson & Associates, Inc.
CONSIDERATION IN ALTERNATIVES DEVELOPMENTThe alternatives were developed using the strategy shortlist as the toolbox, the purpose and needs as the objectives, and the future baseline conditions as the canvas. With the exception of Alternative 1, Future Baseline / No Build, the alternatives are intended to provide the most benefit to transit operations at vari-ous levels of investment. Additional to operational im-provements that are discussed in the Tier 2 Analysis, the project team also reviewed local comprehensive plans, distributions of environmental justice commu-nities, and safety concerns to ensure that none of the alternatives counteract community goals or create new problems for vulnerable populations. It was found that the City of Fort Lauderdale and the City of Plantation have land use policies in place affect-ing most of the corridor that are supportive of higher density mixed use development that correspond well to premium transit services. As the designated activity centers develop and new development increases den-sities, it will become even more important that Bro-ward Boulevard is served well by transit. None of the alternatives propose removing existing services that would have a detrimental impact on vulnerable or environmental justice communities. The proposed reduction in local service frequency on Route 22 is off-set by the new limited stop overlay service that will improve overall corridor headways. Overlay service stop locations have been designated throughout lower income portions of the corridor.Bicycle and pedestrian crash histories were reviewed throughout the corridor. Several crash “hot spots” were identified. Most of these locations were explain-able as high volume locations where pedestrians have to cross Broward Boulevard to access bus stops. Par-ticularly noteworthy were crashes in the vicinity of W 35th Avenue and SR-7/US-441. Bus stops at SR-7/US-441 are placed at a long distance from the inter-section. These distances combined with lengthy sig-nal intervals and long bus headways encourage risky mid-block crossings for transit riders making transfers or trying to reach a bus on the other side of the road before it leaves the stop. All three build alternatives attempt to address this issue through modified or new bus stop locations.
TIER 2 ANALYSIS: ALTERNATIVES EVALUATIONThe Tier 2 Analysis’ purpose was to create an evalua-tion system that would objectively and quantitatively show how each alternative performed in terms of meeting the project’s purpose and need, goals and ob-jectives. Ultimately, the outcomes from the evaluation would allow for an informed, collective decision to be made by the project team and Partners on selecting the proposed concept for implementation. The evalu-ation matrix, Table 9, summarizes the measures of ef-fectiveness identified for evaluating whether or not an alternative met the goals of the project. A description of the processes and results of this analysis is provided in Appendix F.Despite the goal of avoiding the need for right-of-way, a few bus stop location improvements were deemed important enough to consider. Attempts will be made to negotiate easement rights with affected property owners.Alternative 4 has the potential to negatively impact traffic along Broward Boulevard. While this alternative provides many attractive benefits for transit service, these impacts must be researched more thoroughly and the public must be involved before this alterna-tive could move forward.
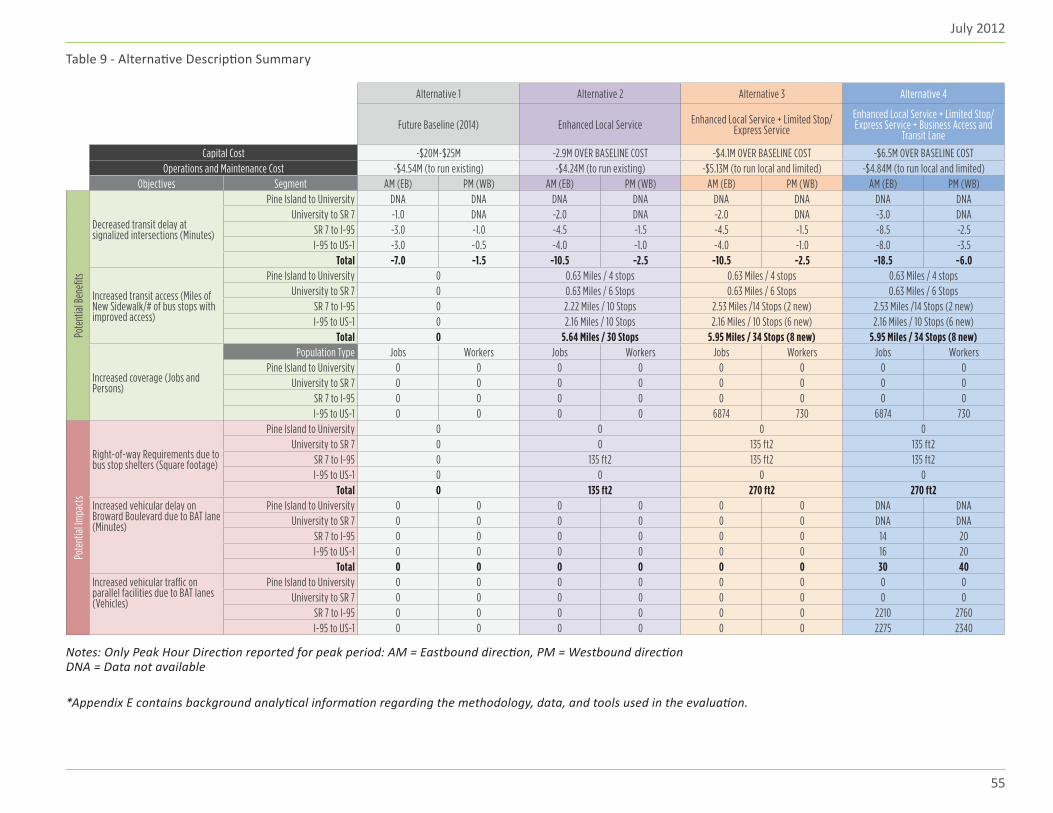
July 2012
55
Table 9 - Alternative Description Summary
*Appendix E contains background analytical information regarding the methodology, data, and tools used in the evaluation.
Notes: Only Peak Hour Direction reported for peak period: AM = Eastbound direction, PM = Westbound directionDNA = Data not available
Alternative 1 Alternative 2 Alternative 3 Alternative 4
Future Baseline (2014) Enhanced Local Service Enhanced Local Service + Limited Stop/Express Service
Enhanced Local Service + Limited Stop/Express Service + Business Access and
Transit Lane
Capital Cost ~$20M-$25M ~2.9M OVER BASELINE COST ~$4.1M OVER BASELINE COST ~$6.5M OVER BASELINE COSTOperations and Maintenance Cost ~$4.54M (to run existing) ~$4.24M (to run existing) ~$5.13M (to run local and limited) ~$4.84M (to run local and limited)
Objectives Segment AM (EB) PM (WB) AM (EB) PM (WB) AM (EB) PM (WB) AM (EB) PM (WB)
Pote
ntial
Ben
efits
Decreased transit delay at signalized intersections (Minutes)
Pine Island to University DNA DNA DNA DNA DNA DNA DNA DNAUniversity to SR 7 -1.0 DNA -2.0 DNA -2.0 DNA -3.0 DNA
SR 7 to I-95 -3.0 -1.0 -4.5 -1.5 -4.5 -1.5 -8.5 -2.5I-95 to US-1 -3.0 -0.5 -4.0 -1.0 -4.0 -1.0 -8.0 -3.5
Total -7.0 -1.5 -10.5 -2.5 -10.5 -2.5 -18.5 -6.0
Increased transit access (Miles of New Sidewalk/# of bus stops with improved access)
Pine Island to University 0 0.63 Miles / 4 stops 0.63 Miles / 4 stops 0.63 Miles / 4 stopsUniversity to SR 7 0 0.63 Miles / 6 Stops 0.63 Miles / 6 Stops 0.63 Miles / 6 Stops
SR 7 to I-95 0 2.22 Miles / 10 Stops 2.53 Miles /14 Stops (2 new) 2.53 Miles /14 Stops (2 new)I-95 to US-1 0 2.16 Miles / 10 Stops 2.16 Miles / 10 Stops (6 new) 2.16 Miles / 10 Stops (6 new)
Total 0 5.64 Miles / 30 Stops 5.95 Miles / 34 Stops (8 new) 5.95 Miles / 34 Stops (8 new)
Increased coverage (Jobs and Persons)
Population Type Jobs Workers Jobs Workers Jobs Workers Jobs WorkersPine Island to University 0 0 0 0 0 0 0 0
University to SR 7 0 0 0 0 0 0 0 0SR 7 to I-95 0 0 0 0 0 0 0 0I-95 to US-1 0 0 0 0 6874 730 6874 730
Pote
ntial
Impa
cts
Right-of-way Requirements due to bus stop shelters (Square footage)
Pine Island to University 0 0 0 0University to SR 7 0 0 135 ft2 135 ft2
SR 7 to I-95 0 135 ft2 135 ft2 135 ft2I-95 to US-1 0 0 0 0
Total 0 135 ft2 270 ft2 270 ft2Increased vehicular delay on Broward Boulevard due to BAT lane (Minutes)
Pine Island to University 0 0 0 0 0 0 DNA DNAUniversity to SR 7 0 0 0 0 0 0 DNA DNA
SR 7 to I-95 0 0 0 0 0 0 14 20I-95 to US-1 0 0 0 0 0 0 16 20
Total 0 0 0 0 0 0 30 40Increased vehicular traffic on parallel facilities due to BAT lanes (Vehicles)
Pine Island to University 0 0 0 0 0 0 0 0University to SR 7 0 0 0 0 0 0 0 0
SR 7 to I-95 0 0 0 0 0 0 2210 2760I-95 to US-1 0 0 0 0 0 0 2275 2340
56 | Kittelson & Associates, Inc.
Broward Boulevard Corridor Transit Study
56 | Kittelson & Associates, Inc.
PROPOSED CONCEPT BY PARTNERSBased on the evaluation results, the project team and Partners collectively agreed to move forward with Al-ternative 3: Enhanced Local Service + Limited Stop/Rapid Service. The Partners agreed that this alterna-tive met the projects goals and pushed the region to try something new without needing to invest a signifi-cant amount of money in infrastructure. Alternative 4: Enhanced Local Service + Limited Stop/Rapid Service + Business Access and Transit Lane was also agreed to by the Partners as being a long-term potential solu-tion. The group determined that additional analysis and significant public involvement would be needed in order to truly understand the benefits and impacts of removing a general purpose traffic lane from Broward Boulevard. It was determined that this option could be discussed and assessed as part of the Broward Boule-vard Gateway Implementation Project being conduct-ed by the Broward MPO and other various agencies in the Spring of 2012.Although Alternative 3 was selected by the Partners at a conceptual level, it was voiced that several details must be worked on collaboratively in the design phase of the project in order for a successful, operational, and safe implementation. Some of these elements in-clude but are not limited to:
▪ Bus stop locations and design
▪ Park-and-Ride at West Regional Terminal
▪ Fort Lauderdale Station Pedestrian Connection
▪ Branding and Wayfinding
▪ Westfield Broward Mall Pedestrian Crossing
▪ Plantation Greenway
▪ Downtown Fort Lauderdale Loop
▪ Funding for Route 22 Limited Stop/Rapid Service
▪ Scheduling for the Local Route 22 and the Limited Stop/Rapid Service
NEXT STEPS TOWARDS IMPLEMENTATIONThe following initiatives are being pursued by FDOT and the Partners:
▪ Continue close coordination and collaboration amongst the Partners on the future baseline projects and how those interact with one another and with the Broward Boulevard Corridor Transit Study proposed concept.
▪ Continue working with the FDOT Planning Office on the ridership projections being prepared in parallel to this project.
▪ Prepare a Scope of Services for the design elements necessary to successfully implement Alternative 3. This scope should first be developed by the project team with the FDOT Project Manager. Once a draft has been prepared, the scope should be sent to the Partners for review and comment. A face-to-face meeting is ideal for the agencies dealing with corridor-wide elements; this would include the Broward MPO, BCT, FDOT and BCTED.
▪ Once a scope has been agreed upon, coordination is critical to the success of the proposed concept. The Partners should work together and agree to a phased implementation timeline for the proposed concept and its individual elements. A suggested implementation strategy and timeline is found in Appendix G.
▪ Operations funding for Route 22 Limited Stop/Rapid Service is critical to the implementation of the proposed concept. A discussion between BCT, FDOT, and the Broward MPO should occur in the near-term to determine how the service will be funded.
All other elements listed in Alternative 3 (defined in the previous section ‘Proposed Concept by Partners’) need to be collaboratively taken from a conceptual level to a design level, with support from the Partners. The responsibility for each of these elements should be identified and tracked by the Partners and the im-plementing agencies.
57
SECTION 6Outreach Activities
PARTNER MEETINGS AND BROWARD MPO RELATED MEETINGSFor the Phase I outreach activities, the project team was in close coordination with the Partners. Three Partner meetings and nine one-on-one discussions with specific agencies were held. The Partners de-fined for this project included: Broward Metropoli-tan Planning Organization (MPO), Broward County Transit (BCT), South Florida Regional Transporta-tion Authority (SFRTA), Broward County Traffic En-gineering Division (BCTED), Broward County, and the Cities of Fort Lauderdale, Lauderhill and Plan-tation. The purpose of the Partner meetings was to as a group determine and agree to the method-ologies applied and the solutions identified by the project team. Since not all of the project elements affected each Partner, we also held one-on-one meetings where a smaller group could focus on specific elements within the project. In addition to these Partner meetings and discussions, the project team presented to the Broward MPO Community Involvement Roundtable (CIR), Technical Coordi-nating Committee (TCC), and the MPO Board at the beginning and end of the project (June 2011 and March/April 2012, respectively). Lastly, the project
team has made themselves available to present to individual City Boards as requested in the spring of 2012. Meeting minutes were recorded for each Partner Meeting and can be found in Appendix H. Meeting materials for the Partner Meetings are also located in Appendix H.
COORDINATION MEETINGS WITH FDOT STAFFAside from coordination with non-DOT agencies, the project team closely coordinated with other DOT offices and project managers to ensure effi-ciencies were created where possible due to mul-tiple activities occurring and planned for along the corridor over the next 5+ years. It is necessary to look beyond the horizon of this project to ensure that its elements remain compatible with other corridor initiatives with further out horizons. An-other incentive for this coordination was to give the opportunity for DOT peers to share past ex-periences and knowledge for potential benefit to the Broward Boulevard Corridor Transit Study. Nine Coordination Meetings occurred through-out the project, in addition to three one-one-one meetings with specific offices. The DOT involved in these meetings included the Office of Modal De-
velopment for Transit Signal Priority and queue jump related activities, the Office of Operations for Advanced Traffic Management System related activities, and the Office of Design/Consultant Management for sidewalk, resurfacing, and bridge reconstruction activities. Meeting minutes were recorded for each Coordination Meeting and can be found in Appendix H.
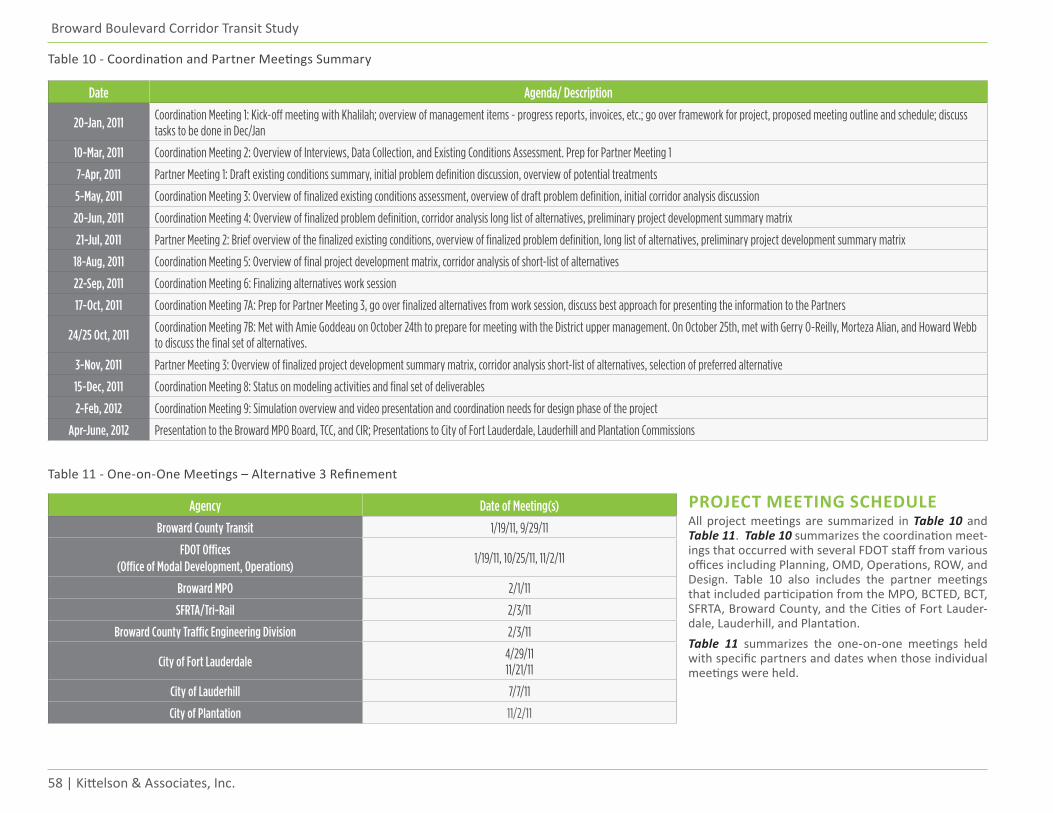
58 | Kittelson & Associates, Inc.
Broward Boulevard Corridor Transit Study
Date Agenda/ Description
20-Jan, 2011 Coordination Meeting 1: Kick-off meeting with Khalilah; overview of management items - progress reports, invoices, etc.; go over framework for project, proposed meeting outline and schedule; discuss tasks to be done in Dec/Jan
10-Mar, 2011 Coordination Meeting 2: Overview of Interviews, Data Collection, and Existing Conditions Assessment. Prep for Partner Meeting 1
7-Apr, 2011 Partner Meeting 1: Draft existing conditions summary, initial problem definition discussion, overview of potential treatments
5-May, 2011 Coordination Meeting 3: Overview of finalized existing conditions assessment, overview of draft problem definition, initial corridor analysis discussion
20-Jun, 2011 Coordination Meeting 4: Overview of finalized problem definition, corridor analysis long list of alternatives, preliminary project development summary matrix
21-Jul, 2011 Partner Meeting 2: Brief overview of the finalized existing conditions, overview of finalized problem definition, long list of alternatives, preliminary project development summary matrix
18-Aug, 2011 Coordination Meeting 5: Overview of final project development matrix, corridor analysis of short-list of alternatives
22-Sep, 2011 Coordination Meeting 6: Finalizing alternatives work session
17-Oct, 2011 Coordination Meeting 7A: Prep for Partner Meeting 3, go over finalized alternatives from work session, discuss best approach for presenting the information to the Partners
24/25 Oct, 2011 Coordination Meeting 7B: Met with Amie Goddeau on October 24th to prepare for meeting with the District upper management. On October 25th, met with Gerry O-Reilly, Morteza Alian, and Howard Webb to discuss the final set of alternatives.
3-Nov, 2011 Partner Meeting 3: Overview of finalized project development summary matrix, corridor analysis short-list of alternatives, selection of preferred alternative
15-Dec, 2011 Coordination Meeting 8: Status on modeling activities and final set of deliverables
2-Feb, 2012 Coordination Meeting 9: Simulation overview and video presentation and coordination needs for design phase of the project
Apr-June, 2012 Presentation to the Broward MPO Board, TCC, and CIR; Presentations to City of Fort Lauderdale, Lauderhill and Plantation Commissions
Table 10 - Coordination and Partner Meetings Summary
Table 11 - One-on-One Meetings – Alternative 3 Refinement
Agency Date of Meeting(s)
Broward County Transit 1/19/11, 9/29/11
FDOT Offices (Office of Modal Development, Operations)
1/19/11, 10/25/11, 11/2/11
Broward MPO 2/1/11
SFRTA/Tri-Rail 2/3/11
Broward County Traffic Engineering Division 2/3/11
City of Fort Lauderdale 4/29/1111/21/11
City of Lauderhill 7/7/11
City of Plantation 11/2/11
PROJECT MEETING SCHEDULEAll project meetings are summarized in Table 10 and Table 11. Table 10 summarizes the coordination meet-ings that occurred with several FDOT staff from various offices including Planning, OMD, Operations, ROW, and Design. Table 10 also includes the partner meetings that included participation from the MPO, BCTED, BCT, SFRTA, Broward County, and the Cities of Fort Lauder-dale, Lauderhill, and Plantation. Table 11 summarizes the one-on-one meetings held with specific partners and dates when those individual meetings were held.
July 2012
5959
GENERAL PUBLIC OUTREACH MEETINGA final decision was made by the project team and the Florida Department of Transportation that the public involvement component of the Broward Bou-levard Corridor Transit Study should and will occur during Phase II of the project between July 2012 and November 2013. Because of this, the Phase 1 project funds associated with public involvement will be tran-sitioned into the Phase II scope and fee.It was decided that it was most appropriate to hold the public information meeting for the project when the 60% plans have been prepared for the preferred alter-native (Alternative 3 – Enhanced Local Service + Limit-ed Service/Rapid Service). Public involvement related activities associated with Alternative 4, which con-siders designating the curb side lanes along Broward Boulevard from SR-7 to Andrews Avenue into Business Access and Transit only lanes, will be coordinated and considered under the Broward MPO Broward Boule-vard Gateway Implementation Project.
OUTREACH ACTIVITIES NEXT STEPSIn addition to conducting the public involvement un-der Phase II of the project, it is expected that frequent and effective coordination with the multiple DOT of-fices and the non-DOT partner agencies will continue into Phase II of the project and at a greater detail and depth than what occurred in Phase I due to the nature of the work being performed (i.e., planning level ver-sus design).

Kittelson & Associates, Inc.
110 E Broward Blvd, Suite 2410Fort Lauderdale, Florida 33301 United Statesp 954.828.1730 f 954.828.1787