broken mirrors ii - amazon s3 · latino student representation at public state colleges and...
TRANSCRIPT

Latino Student Representation at Public State Colleges and Universities
BROKEN MIRRORS II
EdTrust.org • #BrokenMirrors
BROKEN MIRRORS II | THE EDUCATION TRUST | SEPTEMBER 2019 | #BROKENMIRRORS
1BROKEN MIRRORS II | THE EDUCATION TRUST | SEPTEMBER 2019 | #BROKENMIRRORS
B
State of Higher Education Equity This report is part of a broader body of state-focused research and policy analysis aimed at advancing educational equity and justice for students of color and students from low-income families by engaging issues that affect public colleges and universities. We place a specific emphasis on public institutions, since they educate more than 75 percent of undergraduate students; produce roughly 70 percent of undergraduate degrees; and provide state leaders with greater opportunities to examine, influence, and develop legislation and policies that influence the postsecondary experiences of students of color and students from low-income families. Visit edtrust.org to learn more about this report. To access the grades and data in this report, visit the State Equity Report Card (www.stateequity.org), an Education Trust web tool that assesses states’ commitment to equitable college opportunity and success for Black Americans and Latinos.
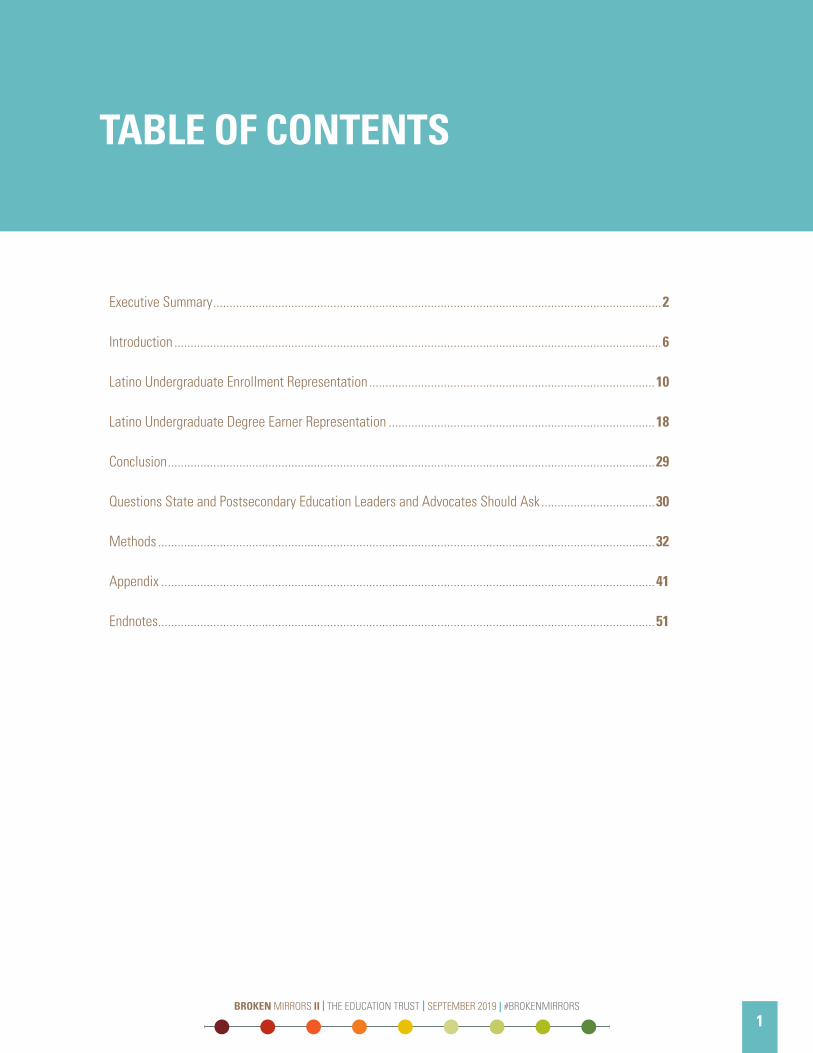
Executive Summary ..........................................................................................................................................2
Introduction ......................................................................................................................................................6
Latino Undergraduate Enrollment Representation ........................................................................................10
Latino Undergraduate Degree Earner Representation ..................................................................................18
Conclusion ......................................................................................................................................................29
Questions State and Postsecondary Education Leaders and Advocates Should Ask ...................................30
Methods .........................................................................................................................................................32
Appendix ........................................................................................................................................................41
Endnotes.........................................................................................................................................................51
TABLE OF CONTENTS
1BROKEN MIRRORS II | THE EDUCATION TRUST | SEPTEMBER 2019 | #BROKENMIRRORS
Latino Student Representation at Public State Colleges and Universities
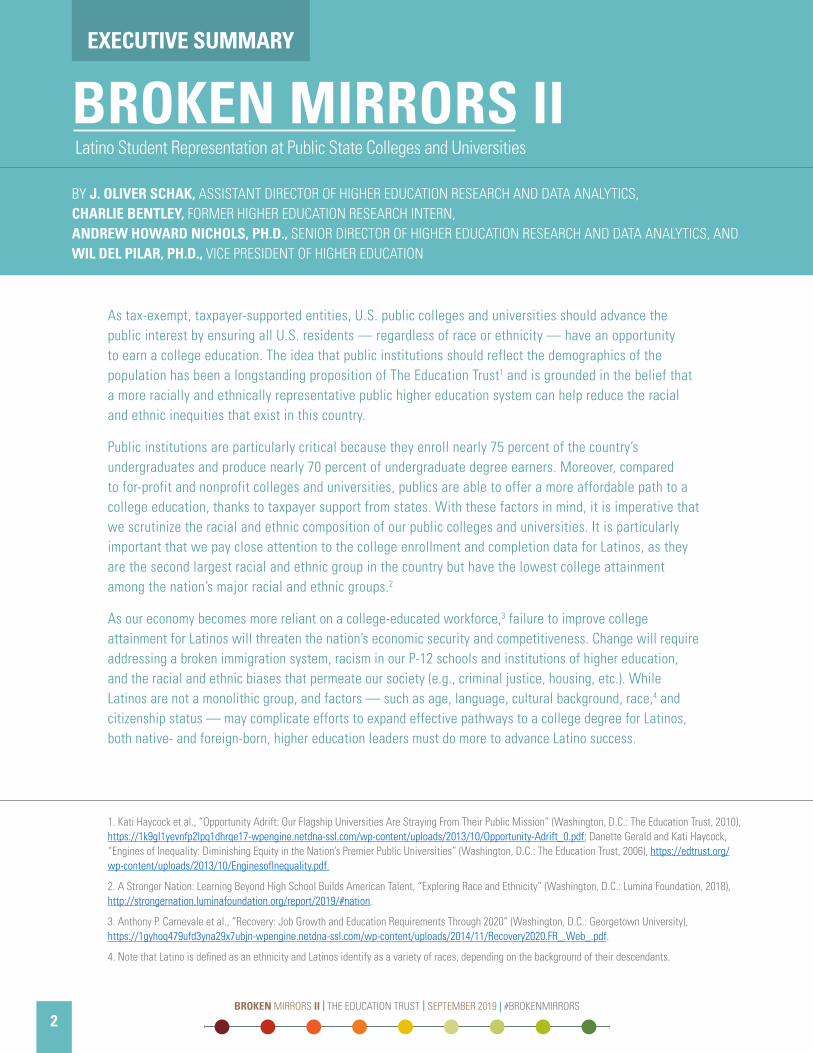
BROKEN MIRRORS IIBY J. OLIVER SCHAK, ASSISTANT DIRECTOR OF HIGHER EDUCATION RESEARCH AND DATA ANALYTICS,CHARLIE BENTLEY, FORMER HIGHER EDUCATION RESEARCH INTERN,ANDREW HOWARD NICHOLS, PH.D., SENIOR DIRECTOR OF HIGHER EDUCATION RESEARCH AND DATA ANALYTICS, ANDWIL DEL PILAR, PH.D., VICE PRESIDENT OF HIGHER EDUCATION
EXECUTIVE SUMMARY
As tax-exempt, taxpayer-supported entities, U.S. public colleges and universities should advance the public interest by ensuring all U.S. residents — regardless of race or ethnicity — have an opportunity to earn a college education. The idea that public institutions should reflect the demographics of the population has been a longstanding proposition of The Education Trust1 and is grounded in the belief that a more racially and ethnically representative public higher education system can help reduce the racial and ethnic inequities that exist in this country.
Public institutions are particularly critical because they enroll nearly 75 percent of the country’s undergraduates and produce nearly 70 percent of undergraduate degree earners. Moreover, compared to for-profit and nonprofit colleges and universities, publics are able to offer a more affordable path to a college education, thanks to taxpayer support from states. With these factors in mind, it is imperative that we scrutinize the racial and ethnic composition of our public colleges and universities. It is particularly important that we pay close attention to the college enrollment and completion data for Latinos, as they are the second largest racial and ethnic group in the country but have the lowest college attainment among the nation’s major racial and ethnic groups.2
As our economy becomes more reliant on a college-educated workforce,3 failure to improve college attainment for Latinos will threaten the nation’s economic security and competitiveness. Change will require addressing a broken immigration system, racism in our P-12 schools and institutions of higher education, and the racial and ethnic biases that permeate our society (e.g., criminal justice, housing, etc.). While Latinos are not a monolithic group, and factors — such as age, language, cultural background, race,4 and citizenship status — may complicate efforts to expand effective pathways to a college degree for Latinos, both native- and foreign-born, higher education leaders must do more to advance Latino success.
1. Kati Haycock et al., “Opportunity Adrift: Our Flagship Universities Are Straying From Their Public Mission” (Washington, D.C.: The Education Trust, 2010), https://1k9gl1yevnfp2lpq1dhrqe17-wpengine.netdna-ssl.com/wp-content/uploads/2013/10/Opportunity-Adrift_0.pdf; Danette Gerald and Kati Haycock, “Engines of Inequality: Diminishing Equity in the Nation’s Premier Public Universities” (Washington, D.C.: The Education Trust, 2006), https://edtrust.org/wp-content/uploads/2013/10/EnginesofInequality.pdf.
2. A Stronger Nation: Learning Beyond High School Builds American Talent, “Exploring Race and Ethnicity” (Washington, D.C.: Lumina Foundation, 2018), http://strongernation.luminafoundation.org/report/2019/#nation.
3. Anthony P. Carnevale et al., “Recovery: Job Growth and Education Requirements Through 2020” (Washington, D.C.: Georgetown University), https://1gyhoq479ufd3yna29x7ubjn-wpengine.netdna-ssl.com/wp-content/uploads/2014/11/Recovery2020.FR_.Web_.pdf.
4. Note that Latino is defined as an ethnicity and Latinos identify as a variety of races, depending on the background of their descendants.
BROKEN MIRRORS II | THE EDUCATION TRUST | SEPTEMBER 2019 | #BROKENMIRRORS
3BROKEN MIRRORS II | THE EDUCATION TRUST | SEPTEMBER 2019 | #BROKENMIRRORS
2
1 4
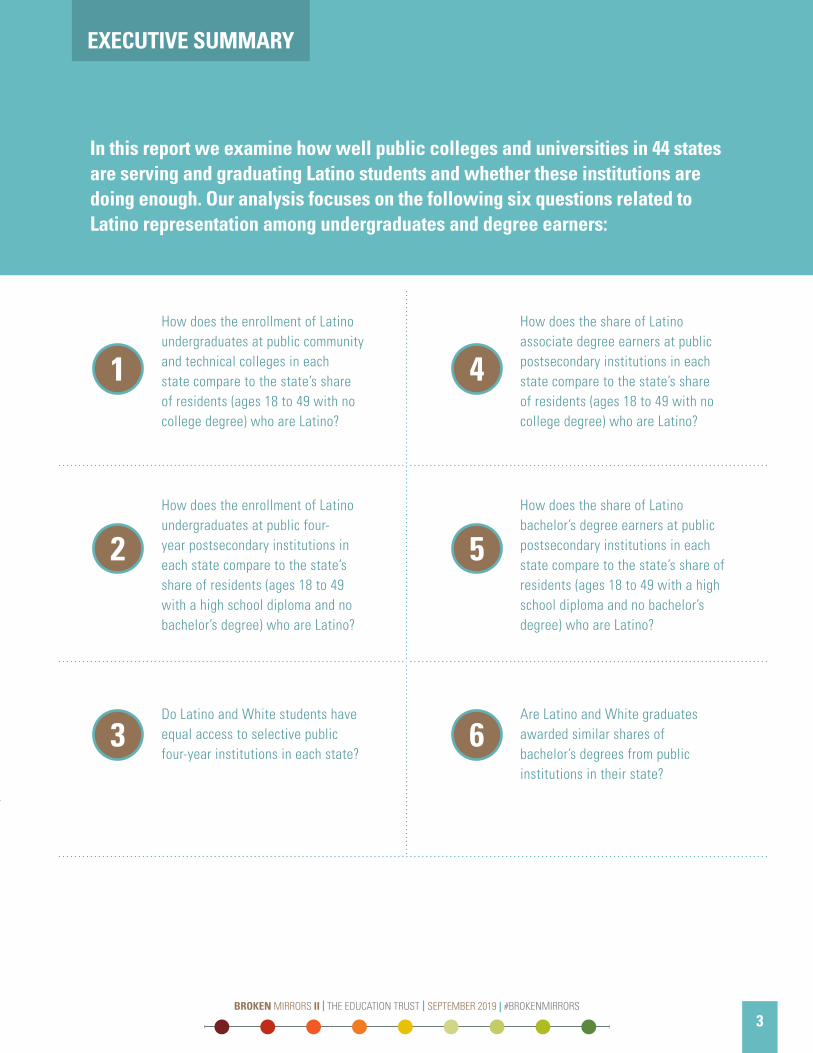
How does the enrollment of Latino undergraduates at public community and technical colleges in each state compare to the state’s share of residents (ages 18 to 49 with no college degree) who are Latino?
How does the share of Latino associate degree earners at public postsecondary institutions in each state compare to the state’s share of residents (ages 18 to 49 with no college degree) who are Latino?
2 5How does the enrollment of Latino undergraduates at public four-year postsecondary institutions in each state compare to the state’s share of residents (ages 18 to 49 with a high school diploma and no bachelor’s degree) who are Latino?
How does the share of Latino bachelor’s degree earners at public postsecondary institutions in each state compare to the state’s share of residents (ages 18 to 49 with a high school diploma and no bachelor’s degree) who are Latino?
Do Latino and White students have equal access to selective public four-year institutions in each state?
Are Latino and White graduates awarded similar shares of bachelor’s degrees from public institutions in their state?
3 6
EXECUTIVE SUMMARY
In this report we examine how well public colleges and universities in 44 states are serving and graduating Latino students and whether these institutions are doing enough. Our analysis focuses on the following six questions related to Latino representation among undergraduates and degree earners:
3BROKEN MIRRORS II | THE EDUCATION TRUST | SEPTEMBER 2019 | #BROKENMIRRORS
Latino students are underrepresented at public colleges and universities, especially community and technical colleges, in the vast majority of states.
• Latinos are underrepresented at community and technical colleges in 40 of the 44 states we examined (or 90 percent).
• In 33 of the 44 states (or 75 percent), Latino enrollment at four-year public institutions is not on par with the state’s proportion of Latino residents.
• While some states that are home to large Latino populations — such as New York and Florida — have public four-year college enrollments that roughly mirror the state’s Latino share of Latinos, California, Illinois, and Texas are nowhere near equitable enrollment.
The states with the largest Latino populations fail to provide Latinos with the same access to selective public four-year institutions as their White peers.
(For this metric, we only examined 37 states with four or more public four-year institutions.)
• Eight states have enrollment gaps between Latino and White students of 10 percentage points or more: California, Colorado, Florida, Nebraska, New York, North Carolina, Massachusetts, and Texas.
• In Texas, California, New York, and Florida — home to just over 60 percent of all Latino students — the share of Latino students at public four-year institutions who are attending a selective institution is at least 10 percentage points lower than that of their White peers.
Our answers to these six questions clearly illustrate that public institutions in many states are falling short of their obligation to enroll and graduate Latinos. Below are key high-level findings:
EXECUTIVE SUMMARY
Latinos are underrepresented among associate and bachelor’s degree earners in every state.
• Latinos are underrepresented among associate degree and bachelor’s degree earners in all 44 states.
• Underrepresentation was worse at the associate degree level, where Latinos are more underrepresented among associate degree earners than among bachelor’s degree earners in nearly two-thirds of states (29 out of 44).
• Underrepresentation was worse at the bachelor’s degree level in 14 states, which are home to approximately 68 percent of Latino adults without a college degree.
• Although all states have room to improve, Florida and New Mexico stand out among states with large Latino populations as having higher marks on both associate degree earner and bachelor’s degree earner representation.
Latino graduates are less likely to receive a bachelor’s degree than their White peers in most states, but the gaps are typically in the single digits.
• In 28 out of 44 states (or 64 percent), there is a gap of at least five percentage points between the share of Latinos and the share of Whites awarded a bachelor’s degree.
• Nine states (roughly 20 percent) have double-digit gaps between the shares of Latino and White graduates who are awarded a bachelor’s degree: Arizona, Colorado, Connecticut, Hawaii, Kansas, Massachusetts, Minnesota, Nebraska, and Texas.
More state-specific results can be found in the full report and our web tool, The State Equity Report Card. Within the report are benchmarks for each state that specify what percentage of undergraduates and degree earners would be Latino if their a) community and technical colleges; and b) four-year institutions mirrored the state’s racial and ethnic composition. At the end of the report, we also provide state higher education leaders and advocates with additional questions that may help focus their efforts on areas of need while pursuing educational justice.
BROKEN MIRRORS II | THE EDUCATION TRUST | SEPTEMBER 2019 | #BROKENMIRRORS
5BROKEN MIRRORS II | THE EDUCATION TRUST | SEPTEMBER 2019 | #BROKENMIRRORS
4
5 5BROKEN MIRRORS II | THE EDUCATION TRUST | SEPTEMBER 2019 | #BROKENMIRRORS
Broken Mirrors II:Latino Student Representation at Public State Colleges and Universities
INTRODUCTION
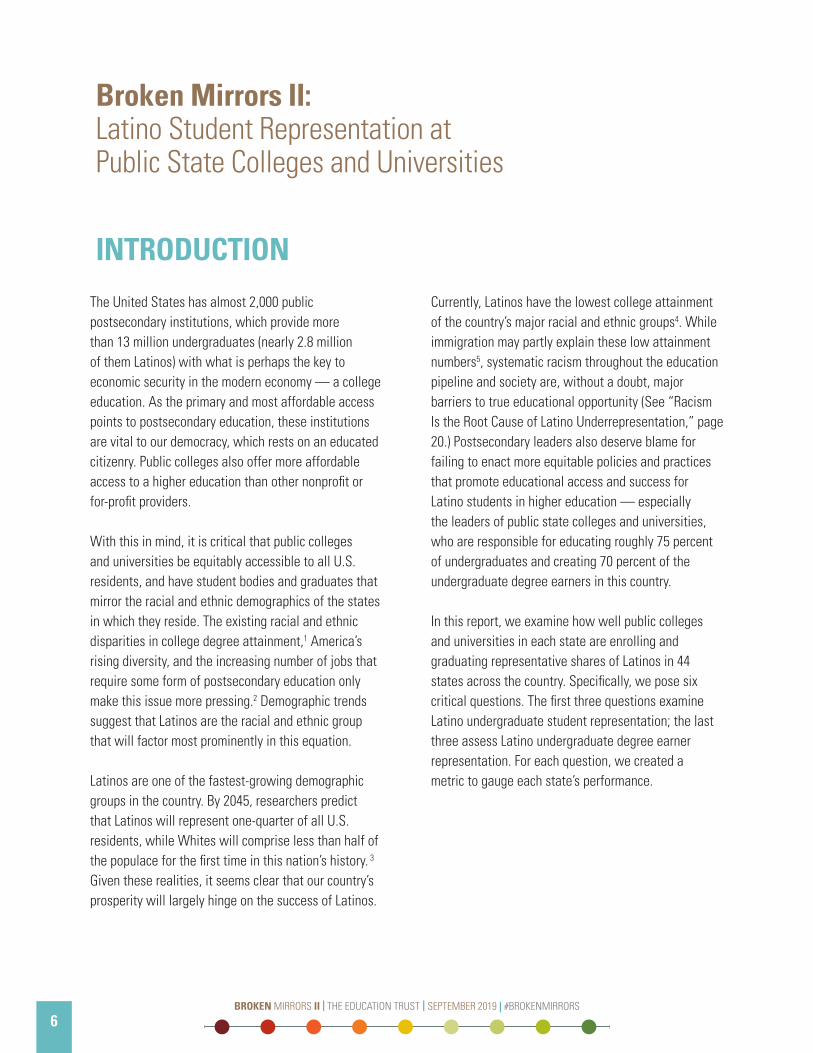
The United States has almost 2,000 public postsecondary institutions, which provide more than 13 million undergraduates (nearly 2.8 million of them Latinos) with what is perhaps the key to economic security in the modern economy — a college education. As the primary and most affordable access points to postsecondary education, these institutions are vital to our democracy, which rests on an educated citizenry. Public colleges also offer more affordable access to a higher education than other nonprofit or for-profit providers.
With this in mind, it is critical that public colleges and universities be equitably accessible to all U.S. residents, and have student bodies and graduates that mirror the racial and ethnic demographics of the states in which they reside. The existing racial and ethnic disparities in college degree attainment,1 America’s rising diversity, and the increasing number of jobs that require some form of postsecondary education only make this issue more pressing.2 Demographic trends suggest that Latinos are the racial and ethnic group that will factor most prominently in this equation.
Latinos are one of the fastest-growing demographic groups in the country. By 2045, researchers predict that Latinos will represent one-quarter of all U.S. residents, while Whites will comprise less than half of the populace for the first time in this nation’s history. 3 Given these realities, it seems clear that our country’s prosperity will largely hinge on the success of Latinos.
Currently, Latinos have the lowest college attainment of the country’s major racial and ethnic groups4. While immigration may partly explain these low attainment numbers5, systematic racism throughout the education pipeline and society are, without a doubt, major barriers to true educational opportunity (See “Racism Is the Root Cause of Latino Underrepresentation,” page 20.) Postsecondary leaders also deserve blame for failing to enact more equitable policies and practices that promote educational access and success for Latino students in higher education — especially the leaders of public state colleges and universities, who are responsible for educating roughly 75 percent of undergraduates and creating 70 percent of the undergraduate degree earners in this country.
In this report, we examine how well public colleges and universities in each state are enrolling and graduating representative shares of Latinos in 44 states across the country. Specifically, we pose six critical questions. The first three questions examine Latino undergraduate student representation; the last three assess Latino undergraduate degree earner representation. For each question, we created a metric to gauge each state’s performance.
BROKEN MIRRORS II | THE EDUCATION TRUST | SEPTEMBER 2019 | #BROKENMIRRORS
7BROKEN MIRRORS II | THE EDUCATION TRUST | SEPTEMBER 2019 | #BROKENMIRRORS
6
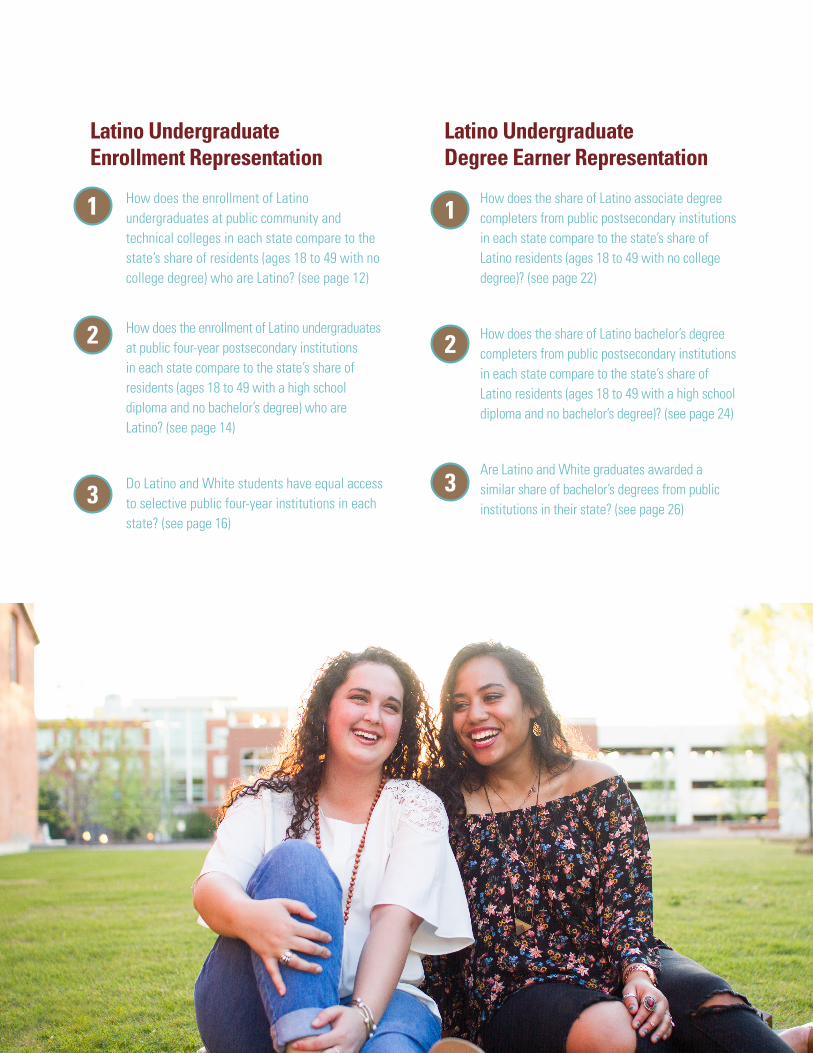
Latino Undergraduate Enrollment Representation
How does the enrollment of Latino undergraduates at public community and technical colleges in each state compare to the state’s share of residents (ages 18 to 49 with no college degree) who are Latino? (see page 12)
How does the enrollment of Latino undergraduates at public four-year postsecondary institutions in each state compare to the state’s share of residents (ages 18 to 49 with a high school diploma and no bachelor’s degree) who are Latino? (see page 14)
Do Latino and White students have equal access to selective public four-year institutions in each state? (see page 16)
Latino Undergraduate Degree Earner Representation
How does the share of Latino associate degree completers from public postsecondary institutions in each state compare to the state’s share of Latino residents (ages 18 to 49 with no college degree)? (see page 22)
How does the share of Latino bachelor’s degree completers from public postsecondary institutions in each state compare to the state’s share of Latino residents (ages 18 to 49 with a high school diploma and no bachelor’s degree)? (see page 24)
Are Latino and White graduates awarded a similar share of bachelor’s degrees from public institutions in their state? (see page 26)
1
2
3
1
2
3
7BROKEN MIRRORS II | THE EDUCATION TRUST | SEPTEMBER 2019 | #BROKENMIRRORS
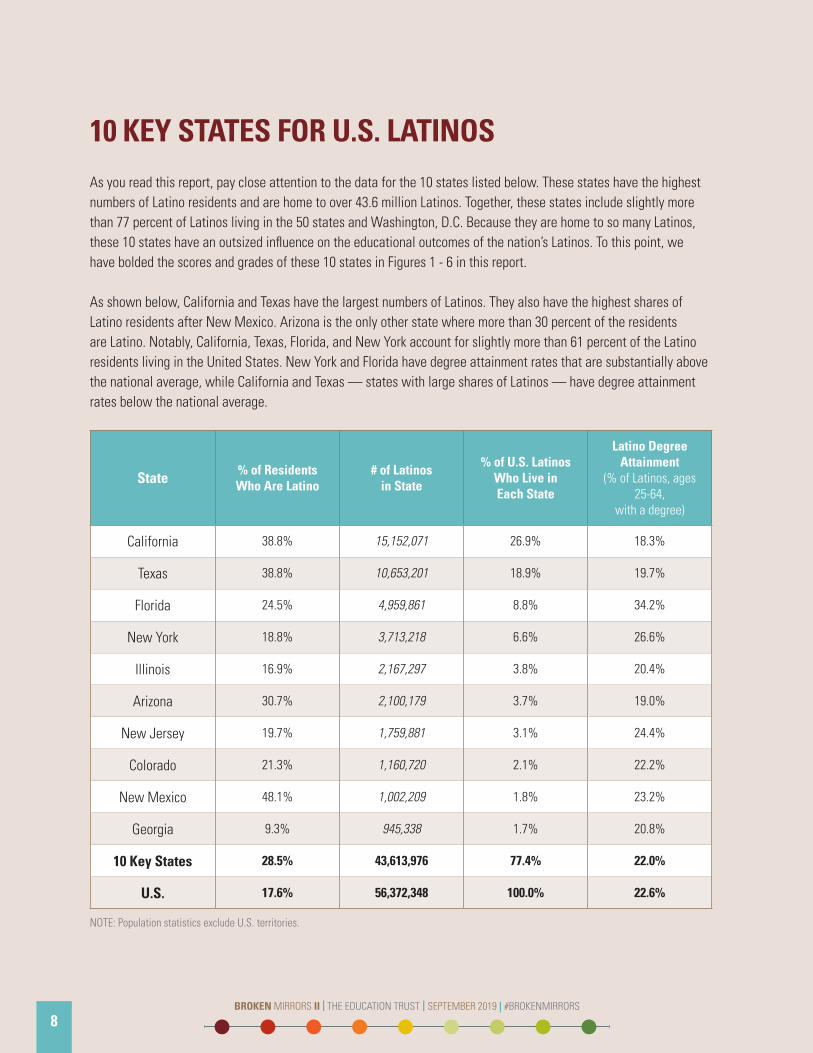
10 KEY STATES FOR U.S. LATINOSAs you read this report, pay close attention to the data for the 10 states listed below. These states have the highest numbers of Latino residents and are home to over 43.6 million Latinos. Together, these states include slightly more than 77 percent of Latinos living in the 50 states and Washington, D.C. Because they are home to so many Latinos, these 10 states have an outsized influence on the educational outcomes of the nation’s Latinos. To this point, we have bolded the scores and grades of these 10 states in Figures 1 - 6 in this report.
As shown below, California and Texas have the largest numbers of Latinos. They also have the highest shares of Latino residents after New Mexico. Arizona is the only other state where more than 30 percent of the residents are Latino. Notably, California, Texas, Florida, and New York account for slightly more than 61 percent of the Latino residents living in the United States. New York and Florida have degree attainment rates that are substantially above the national average, while California and Texas — states with large shares of Latinos — have degree attainment rates below the national average.
State % of Residents Who Are Latino
# of Latinos in State
% of U.S. Latinos Who Live in Each State
Latino Degree Attainment
(% of Latinos, ages 25-64,
with a degree)
California 38.8% 15,152,071 26.9% 18.3%
Texas 38.8% 10,653,201 18.9% 19.7%
Florida 24.5% 4,959,861 8.8% 34.2%
New York 18.8% 3,713,218 6.6% 26.6%
Illinois 16.9% 2,167,297 3.8% 20.4%
Arizona 30.7% 2,100,179 3.7% 19.0%
New Jersey 19.7% 1,759,881 3.1% 24.4%
Colorado 21.3% 1,160,720 2.1% 22.2%
New Mexico 48.1% 1,002,209 1.8% 23.2%
Georgia 9.3% 945,338 1.7% 20.8%
10 Key States 28.5% 43,613,976 77.4% 22.0%
U.S. 17.6% 56,372,348 100.0% 22.6%
NOTE: Population statistics exclude U.S. territories.
BROKEN MIRRORS II | THE EDUCATION TRUST | SEPTEMBER 2019 | #BROKENMIRRORS
9BROKEN MIRRORS II | THE EDUCATION TRUST | SEPTEMBER 2019 | #BROKENMIRRORS
8
WHAT IS EQUITABLE REPRESENTATION? IDENTIFYING STATE BENCHMARKS
It is difficult to determine how racially or ethnically diverse a public college and its graduates should be. While some say the racial demographics of the state’s graduating high school cohort should be a guiding benchmark, others suggest that the overall racial or ethnic mix of the state in which the institution resides is a credible standard. Each solution has benefits as well as drawbacks, but in this report, we define equitable representation as the racial and ethnic mix of the state’s population (ages 18 to 49) that could potentially benefit from attending college and receiving an undergraduate degree. This approach led us to develop two enrollment and degree earner benchmarks for each state: one for public community and technical colleges and another for public four-year institutions. The specific benchmarks for each state can be found inthe Appendix (Table 3).
For community and technical colleges, the enrollment and degree earner benchmark is the percentage of Latino state residents ages 18 to 49 with no college degree (i.e., no associate or bachelor’s degree). Since a high school diploma or GED is not required in all states for community college enrollment, we excluded it from our criteria. The benchmark for four-year institutions is slightly different. It is the percentage of Latino state residents ages 18 to 49 with a high school diploma (or GED) and no bachelor’s degree. In this instance, we include a high school diploma (or GED) in the criteria because it is generally required to enroll at a four-year institution. We identified an age range of 18 to 49 because improving Latino representation among undergraduates and degree earners will necessitate engaging students who are not recent high school graduates who could benefit from a college degree, as well as improving college-going and completion rates for recent high school graduates.
In most states, the community and technical college benchmark and the four-year institution benchmark are similar, but in some large states or states with high percentages of Latino residents, differences between the two benchmarks could represent thousands or even tens of thousands of students. For example, in California, the benchmark for community and technical colleges is 54.5 percent, compared with 45.7 percent for public four-year institutions. To meet their higher benchmark (54.5 percent versus 45.7 percent), community and technical colleges would need to enroll roughly 130,000 more Latino students than if they had to meet the public four-year benchmark. The benchmarks for community and technical colleges are usually higher because they count the 27 percent of Latino adults (ages 18 to 49) without a high school diploma or GED.
Finally, it is important to note that these enrollment and degree earner benchmarks are minimum performance thresholds. Over time, achieving these benchmarks will help improve degree attainment rates for Latino residents and close the Latino-White degree attainment gap. But we hope states will work to exceed these thresholds, as that would raise attainment rates and close gaps much faster. Also, in states with little racial diversity (e.g., New Hampshire), it may be prudent to significantly exceed these benchmarks to create a racially diverse learning environment. Research indicates that more racially diverse campuses are more welcoming for students of color and produce a wide array of positive learning outcomes for all students.6
9BROKEN MIRRORS II | THE EDUCATION TRUST | SEPTEMBER 2019 | #BROKENMIRRORS
LATINO UNDERGRADUATE ENROLLMENT REPRESENTATION
We developed three metrics to examine the questions related to undergraduate enrollment representation for Latino students in our analysis. Two of these metrics capture how well enrollment at public colleges and universities reflects the racial and ethnic composition of the state. The first metric compares the percentage of a state’s community and technical college students who are Latino to that state’s benchmark for community and technical colleges. The second metric compares the percentage of undergraduates at a state’s four-year public institutions who are Latino to that state’s benchmark for four-year public colleges and universities. (For a more detailed discussion of data and methods, see page 32.)
The third metric does not use a benchmark. Instead, we calculated the percentage of all public four-year Latino undergraduates who attend selective public institutions and compared that to the same percentage of all White undergraduates who attend selective public institutions. For our analysis, selective institutions include institutions that are either public flagship universities or institutions that mostly accept students with relatively high SAT/ACT scores. We understand that the percentage of students who have the opportunity to enroll at selective public colleges and universities varies according to the state context and needs. However, this metric focuses on whether Latino public four-year students have the same opportunity to attend selective institutions as their White peers, which is best communicated by a gap score. Prior research by The Education Trust shows that Latino students are severely underrepresented at selective institutions.7
Ideally, states’ scores on the first two metrics would approximate or exceed 100, meaning the share of Latino enrollment (at community and technical colleges or four-year institutions) equals or exceeds the percentage of Latino state residents who meet
our criteria. In most instances, scores over 100 should be viewed as positive outcomes, since all states have large degree attainment gaps between Latino and White adults8 and closing gaps will require enrolling more Latino students, and, ultimately, awarding a disproportionate share of degrees to Latino residents. However, scores well above 100 on community and technical college representation could signal that access to four-year institutions is limited by affordability considerations, failure to academically prepare students in P-12, or stagnation in progress toward degree or transfer goals.
An ideal score on the third metric should be close to or less than zero. This means that the percentage of Latino public four-year students attending selective institutions is equivalent to or higher than the share of their White peers attending these institutions. Like the first two metrics, instances in which Latino students have more favorable outcomes than their White peers (i.e., negative gaps or scores below zero) should not be viewed negatively given the historical and current underrepresentation of Latino students at selective institutions.9
Finally, we assigned grades that correspond to states’ scores on each metric. The grades for the first two metrics are based on a traditional grading scale (e.g., 75 = C). All numbers exceeding 100 received A+ grades. The grading scheme for the third metric is on a different scale that is based on the size of the gap. Smaller gaps received A’s and B’s, while larger gaps received C’s and D’s. Gaps greater than or equal to 15 received F grades. We assigned grades on the first and second metrics for the 44 states that have at least 15,000 Latino adults, ages 25 to 64. For the third metric, we graded 37 of these 44 states that have at least four public four-year colleges and universities.
BROKEN MIRRORS II | THE EDUCATION TRUST | SEPTEMBER 2019 | #BROKENMIRRORS
11BROKEN MIRRORS II | THE EDUCATION TRUST | SEPTEMBER 2019 | #BROKENMIRRORS
10
11BROKEN MIRRORS II | THE EDUCATION TRUST | SEPTEMBER 2019 | #BROKENMIRRORS
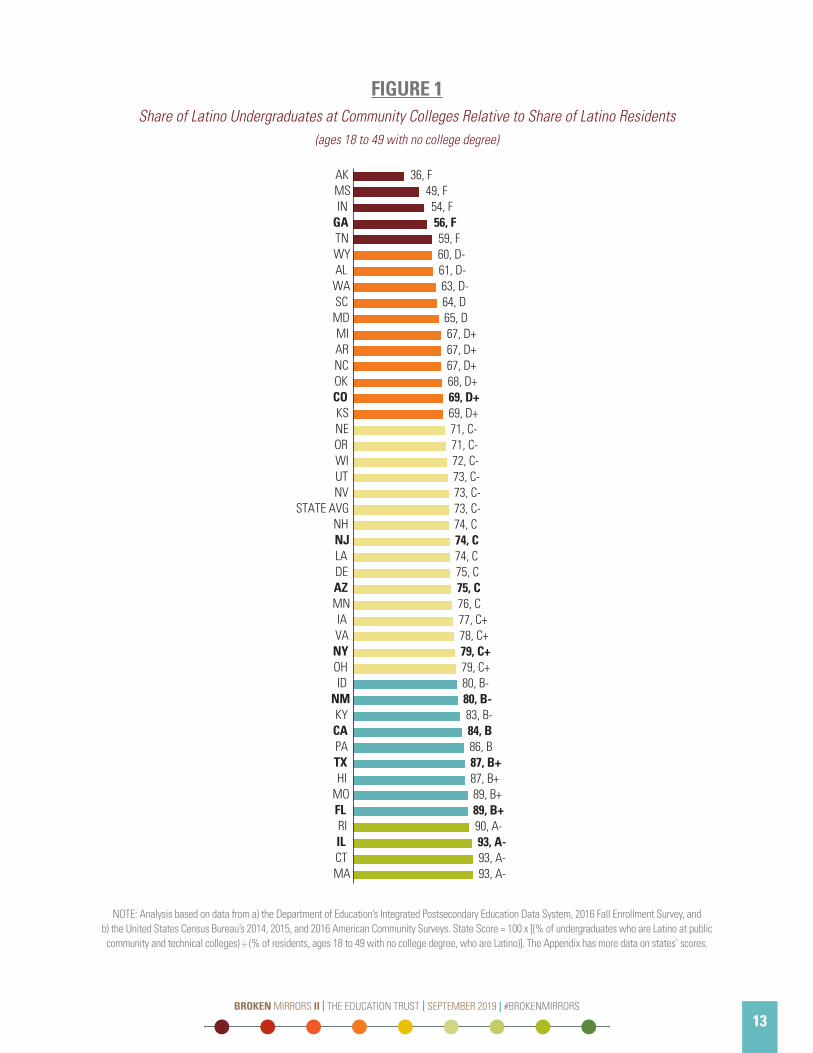
Latino students are underrepresented at community and technical colleges in 40 of 44 states. These 40 states have scores below 90, suggesting that an increase in Latino enrollment is needed in almost every state. Only four states — Massachusetts, Connecticut, Illinois, and Rhode Island — scored 90 or above on this metric (see Figure 1). Their performance is worth noting because their populations are approximately 20 percent Latino. Furthermore, 16 states scored lower than 70 on this metric, well below the state average of 73.
Several states stand out as having particularly low ratings on this metric. Mississippi, Indiana, Georgia, and Tennessee have enrollment representation scores below 60, meaning that these states received an F on this metric. In Georgia, for example, Latino residents make up 13.4 percent of the population we examined. But with only 7.5 percent of community and technical college students identifying as Latino, Georgia received an enrollment representation score of 56 [(7.5% ÷ 13.4%) × 100 = 56]. Alaska has the lowest score (36) for this metric, but this state
has a very small community and technical college system, with only 1,400 students compared with nearly 25,000 undergraduates at public four-year institutions.
Also notable are California, Texas, and Florida, which have larger Latino populations and scored above the state average (B grades), yet still fail to enroll equitable shares of Latino residents at public community and technical colleges. The highest score among these states went to Florida, with a representation score of 89 (nearly an A).
Metric 1: Latino Enrollment Representation at Community and Technical Colleges
How does the enrollment of Latino undergraduates at public community and technical colleges in each state compare to the state’s share of residents — ages 18 to 49 with no college degree — who are Latino?
BROKEN MIRRORS II | THE EDUCATION TRUST | SEPTEMBER 2019 | #BROKENMIRRORS
13BROKEN MIRRORS II | THE EDUCATION TRUST | SEPTEMBER 2019 | #BROKENMIRRORS
12
36, F49, F54, F56, F59, F60, D-61, D-63, D-64, D65, D67, D+67, D+67, D+68, D+69, D+69, D+71, C-71, C-72, C-73, C-73, C-73, C-74, C74, C74, C75, C75, C76, C77, C+78, C+79, C+79, C+80, B-80, B-83, B-84, B86, B87, B+87, B+89, B+89, B+90, A-93, A-93, A-93, A-
AKMSIN
GATNWYALWASCMDMIARNCOKCOKSNEORWIUTNV
STATE AVGNHNJLADEAZMNIAVANYOHID
NMKYCAPATXHI
MOFLRIILCTMA
FIGURE 1Share of Latino Undergraduates at Community Colleges Relative to Share of Latino Residents
(ages 18 to 49 with no college degree)
NOTE: Analysis based on data from a) the Department of Education’s Integrated Postsecondary Education Data System, 2016 Fall Enrollment Survey, and b) the United States Census Bureau’s 2014, 2015, and 2016 American Community Surveys. State Score = 100 x [(% of undergraduates who are Latino at public community and technical colleges) ÷ (% of residents, ages 18 to 49 with no college degree, who are Latino)]. The Appendix has more data on states’ scores.
13BROKEN MIRRORS II | THE EDUCATION TRUST | SEPTEMBER 2019 | #BROKENMIRRORS
Latino undergraduates are underrepresented at public four-year institutions in 33 of the 44 states. Across the 44 states included in this analysis, the average score was 80, with the majority of states falling within one letter grade of this score (see Figure 2). This indicates that almost every state has a sizeable underrepresentation of Latino undergraduates at public four-year institutions, but most could achieve equitable representation with fairly modest increases in the share of Latinos.
Though a large number of states have inequitable enrollment of Latino undergraduates at public four-year institutions, none of the states in this analysis received an F on this metric. However, nine states scored a D on this metric, including Arizona, Colorado, and Massachusetts — states in which 15 percent or more of the residents are Latino. Arizona has the largest share of Latino residents among these states, at 35.5 percent. Yet Arizona received an enrollment representation score of 63 [(22.5% ÷ 33.5%) × 100 = 63], since only 22.5 percent of its undergraduates are Latino. New Jersey and Illinois also are notable, since their respective shares of Latino residents meeting our benchmark criteria exceed 20 percent, and both states barely earned a C-.
The highest performers on this metric are Kentucky, Iowa, Florida, Arkansas, and New York, which all have Latino enrollment shares that approach or exceed their benchmarks. However, with the exception of Florida and New York, Latinos comprise less than 10 percent of residents in these states. An honorable mention goes to New Mexico, which has the largest share of Latino residents among the 50 U.S. states (at 53 percent), and falls just outside the A range.
Metric 2:Latino Enrollment Representation at Public Four-Year Institutions
How does the enrollment of Latino undergraduates at public four-year postsecondary institutions in each state compare to the state’s share of residents — ages 18 to 49 with a high school diploma and no bachelor’s degree — who are Latino?
BROKEN MIRRORS II | THE EDUCATION TRUST | SEPTEMBER 2019 | #BROKENMIRRORS
15BROKEN MIRRORS II | THE EDUCATION TRUST | SEPTEMBER 2019 | #BROKENMIRRORS
14
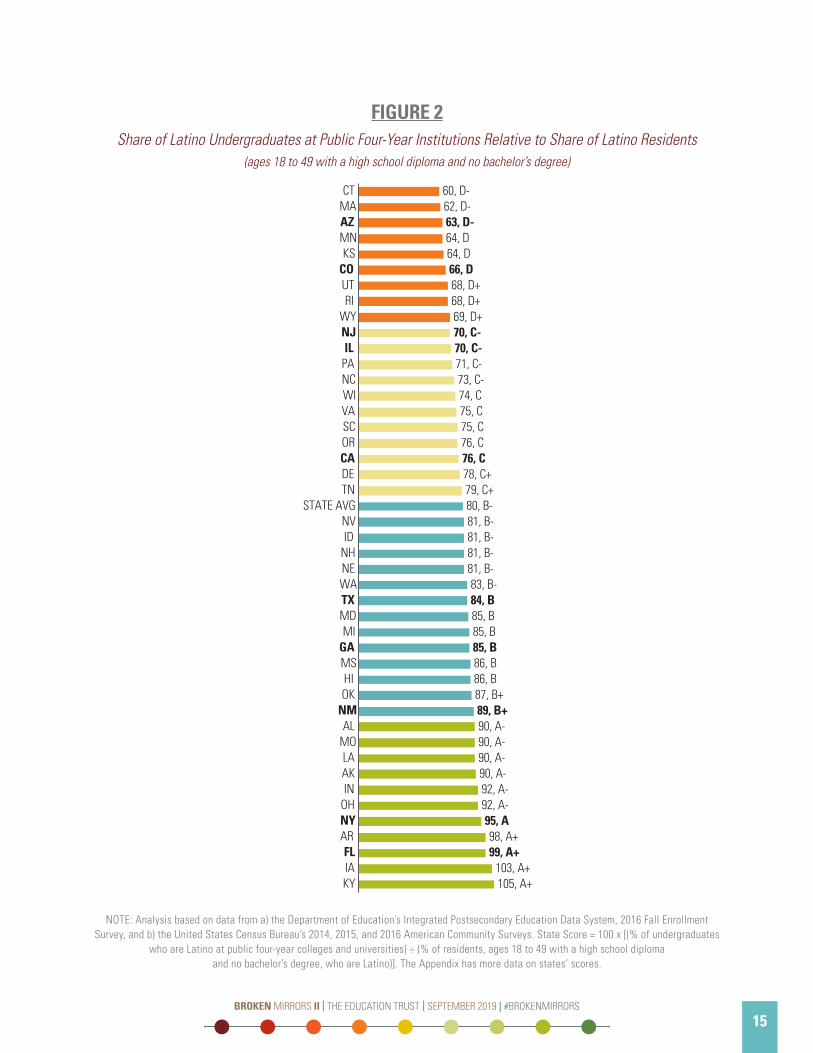
FIGURE 2Share of Latino Undergraduates at Public Four-Year Institutions Relative to Share of Latino Residents
(ages 18 to 49 with a high school diploma and no bachelor’s degree)
NOTE: Analysis based on data from a) the Department of Education’s Integrated Postsecondary Education Data System, 2016 Fall Enrollment Survey, and b) the United States Census Bureau’s 2014, 2015, and 2016 American Community Surveys. State Score = 100 x [(% of undergraduates
who are Latino at public four-year colleges and universities) ÷ (% of residents, ages 18 to 49 with a high school diploma and no bachelor’s degree, who are Latino)]. The Appendix has more data on states’ scores.
60, D-62, D-63, D-64, D 64, D 66, D68, D+68, D+69, D+70, C-70, C-71, C-73, C-74, C75, C75, C76, C 76, C 78, C+79, C+80, B-81, B-81, B-81, B-81, B-83, B-84, B 85, B85, B85, B86, B 86, B 87, B+89, B+90, A-90, A-90, A-90, A-92, A-92, A-95, A98, A+99, A+
103, A+105, A+
CTMAAZMNKS
COUTRI
WYNJIL
PANCWIVASCORCADETN
STATE AVGNVID
NHNEWATXMDMI
GAMSHIOK
NMAL
MOLAAKIN
OHNYARFLIAKY
15BROKEN MIRRORS II | THE EDUCATION TRUST | SEPTEMBER 2019 | #BROKENMIRRORS
While Latino students in 18 of the 37 states we examined have equitable access to selective public institutions, the vast majority of Latino undergraduates at public four-year institutions are concentrated in eight states where they have substantially less access to selective colleges and universities than their White peers. In California, Florida, New York, and Texas — four states that together are home to more than 60 percent of all Latinos nationwide — the gap between the shares of Latino and White undergraduates at selective public institutions exceeds 10 percentage points. In Texas, for example, 35.9 percent of White undergraduates attend one of the state’s selective public four-year institutions, but just 17.2 percent of Latino students do (35.9% – 17.2% = an 18.7 percentage point gap). The four other states with double-digit gaps are Colorado, Massachusetts, Nebraska, North Carolina.
There is undeniably a high level of stratification in the states in which the vast majority of Latinos reside, but our analysis also found many states with smaller Latino communities in which Latino undergraduates have access to selective public four-year institutions that is similar to their White peers. Eighteen states have little or no gap between Latino and White students and received A grades. Notably, however,
with the exception of Oregon, Arizona, Utah, and Illinois, less than 10 percent of public four-year undergraduates in these states identify as Latino. The 18 states with A grades account for only about 16 percent of the Latino undergraduates enrolled at public four-year institutions.
Illinois and Arizona are high performers on this metric that also have sizable percentages of Latino residents. Among the selective institutions found in Illinois and Arizona, two are Hispanic-Serving Institutions (HSIs), which enroll higher percentages of Latinos than other selective institutions. This highlights the critical role that HSIs can play in granting Latinos access to selective institutions.10 However, the enrollment stratification found in virtually every other state with large Latino communities suggests that public higher education is not giving Latino students the same opportunities as White students to attend selective public colleges and universities.
Metric 3: Gap Between Latino and White Undergraduates Attending Selective Public Institutions
Do Latino and White students have equal access to selective public four-year institutions in each state?
BROKEN MIRRORS II | THE EDUCATION TRUST | SEPTEMBER 2019 | #BROKENMIRRORS
17BROKEN MIRRORS II | THE EDUCATION TRUST | SEPTEMBER 2019 | #BROKENMIRRORS
16
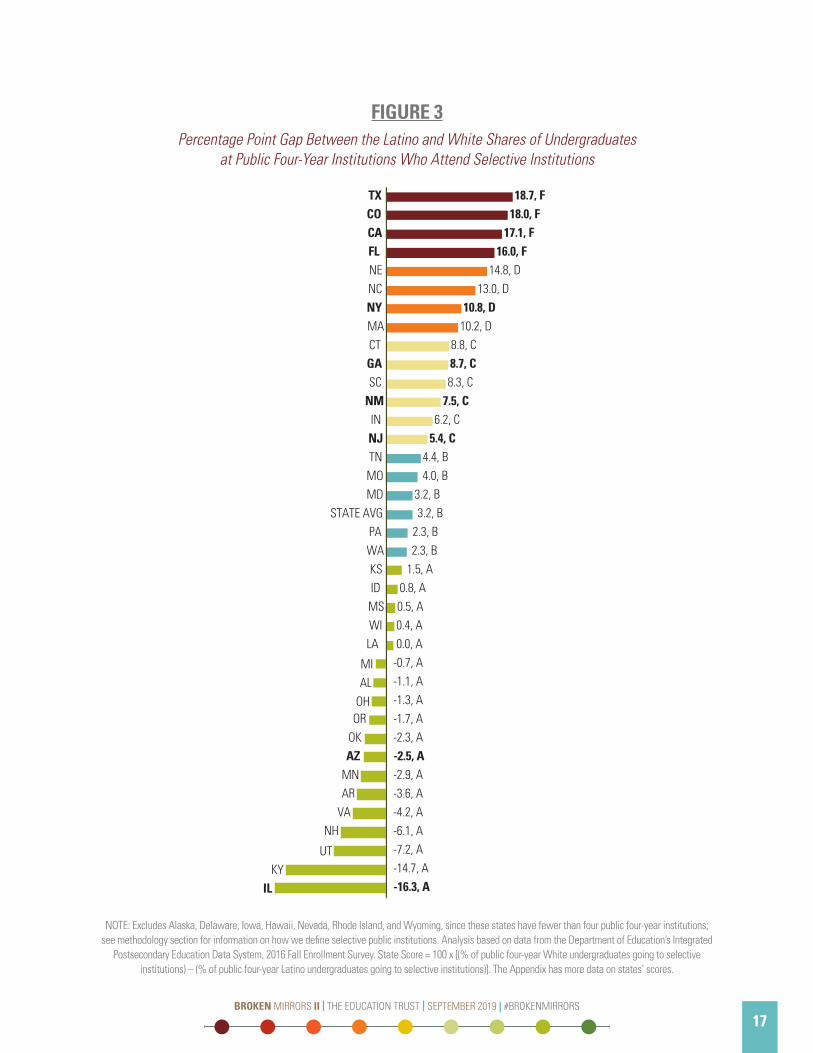
FIGURE 3Percentage Point Gap Between the Latino and White Shares of Undergraduates
at Public Four-Year Institutions Who Attend Selective Institutions
NOTE: Excludes Alaska, Delaware, Iowa, Hawaii, Nevada, Rhode Island, and Wyoming, since these states have fewer than four public four-year institutions; see methodology section for information on how we define selective public institutions. Analysis based on data from the Department of Education’s Integrated
Postsecondary Education Data System, 2016 Fall Enrollment Survey. State Score = 100 x [(% of public four-year White undergraduates going to selective institutions) – (% of public four-year Latino undergraduates going to selective institutions)]. The Appendix has more data on states’ scores.
18.7, F18.0, F
17.1, F16.0, F
14.8, D13.0, D
10.8, D10.2, D
8.8, C8.7, C8.3, C
7.5, C6.2, C
5.4, C4.4, B4.0, B
3.2, B3.2, B
2.3, B2.3, B
1.5, A0.8, A0.5, A0.4, A0.0, A
-0.7, A-1.1, A-1.3, A-1.7, A-2.3, A-2.5, A-2.9, A-3.6, A-4.2, A-6.1, A-7.2, A-14.7, A-16.3, A
TXCOCAFLNENCNYMACTGASC
NMINNJTNMOMD
STATE AVGPAWAKSIDMSWILA
MIAL
OHOR
OKAZ
MNAR
VANH
UTKY
IL
17BROKEN MIRRORS II | THE EDUCATION TRUST | SEPTEMBER 2019 | #BROKENMIRRORS
BROKEN MIRRORS | THE EDUCATION TRUST | MARCH 2019 | #BROKENMIRRORS
Undergraduate Enrollment Representation Summary
Alabama, and Kentucky), and have Latino populations that comprise less than 3 percent of Latino adults who do not have a degree.
In each of these 15 states, the proportion of Latinos at public four-year colleges and universities better reflects the state’s demographic benchmark than does the proportion of Latinos at community and technical colleges. That’s, in part, because the benchmark for community and technical colleges is typically higher, since it (metric 1) includes adults with no high school diploma, whereas the benchmark for four-year public colleges and universities (metric 2) excludes those without a diploma. Approximately 45 percent of all adults, ages 18 to 49 with no high school diploma (or GED), are Latino, which explains why the enrollment targets for community technical colleges tend to be much higher and result in lower scores. A large share of Latino adults lack a high school diploma because, in many cases, they grew up outside the U.S. and had limited access to a formal education.11 Although earning a bachelor’s degree is the surest way for Latinos to attain greater upward mobility and economic security, community and technical colleges remain crucial in helping Latino residents who have had less access to a formal education gain a foothold in postsecondary education.
The increasing number and share of Latinos at public four-year institutions also suggests that a sizable share of Latino high school graduates are now taking the most direct path to a bachelor’s degree and beyond. That’s good news, as completion rates are much higher for students who initially enroll at four-year institutions than at community colleges.12 But the benefits are not limited to Latino students. Research shows that while more diverse campuses are more welcoming to students of color, they also offer more opportunities for cross-racial
The three enrollment representation metrics indicate that Latinos are frequently underrepresented at community and technical colleges, as well as at public four-year institutions. Sixteen states received a D or F on enrollment representation at community and technical colleges, and nine states earned below a C- on enrollment representation at public four-year institutions (Table 1 in the Appendix). Although Latino students tend to be more severely underrepresented at community and technical colleges (the state average is 73 on metric 1), Latino students are still broadly underrepresented at public four-year colleges and universities (the state average is 80 on metric 2), and the vast majority of states are still falling short of our benchmarks for public four-year enrollment.
In 15 of 44 states, which are home to roughly two-thirds of Latinos without a college degree, Latino students are more substantially underrepresented at four-year universities than at community and technical colleges. These states include California, Texas, Arizona, Colorado, and New Jersey, which have sizable Latino populations and lower performance scores at public four-year institutions than at community and technical colleges. In Connecticut and Massachusetts, where Latino residents comprise nearly 20 percent of residents with no college degree, Latino students are far more prevalent at community and technical colleges compared with public four-year institutions.
At the other extreme, 15 states have enrollment representation scores at community and technical colleges (metric 1) that are at least 15 points (one and a half letter grades) lower than those at public four-year institutions (metric 2). These differences are starkest in Alaska, Indiana, Mississippi, Arkansas, Georgia, Alabama, Iowa, and Kentucky, where they range from 54 to 23 points. Five of these eight states are in the South (i.e., Mississippi, Arkansas, Georgia,
BROKEN MIRRORS II | THE EDUCATION TRUST | SEPTEMBER 2019 | #BROKENMIRRORS
19BROKEN MIRRORS II | THE EDUCATION TRUST | SEPTEMBER 2019 | #BROKENMIRRORS
18
19BROKEN MIRRORS | THE EDUCATION TRUST | MARCH 2019 | #BROKENMIRRORS
interactions among students, which are associated with an array of positive learning outcomes for all students.13
Although some states scored better on Latino enrollment representation at public four-year institutions, that’s hardly cause for celebration. Latinos are underrepresented at both community colleges and public four-year institutions in the vast majority of states. In fact, a number of states have a long way to go to achieve equitable Latino enrollment. Fourteen of 44 states scored a C or lower on both Latino enrollment representation at community colleges (metric 1) and Latino enrollment representation at public four-year institutions (metric 2) — among them Colorado, Arizona, and New Jersey, where approximately one-third of state residents without a degree are Latino.
To make matters worse, the enrollment patterns of Latino and White students show that public four-year
colleges are severely stratified by race and ethnicity in states with the largest Latino communities. And while only eight states received a D or F on metric 3, those states are home to the bulk of Latino undergraduates. Admissions policies are likely to blame for some of this stratification. California and Florida have bans on the consideration of race in admissions, which limit opportunities for students of color. These two states, plus Texas, rely on alternatives to race-based affirmative action or race-neutral approaches, which have not been terribly effective at improving racial and ethnic diversity at public selective four-year institutions in these states or others.14 This stratification between Latino and White students (some of which may be related to undermatching) contributes to lower completion rates and completion gaps. 15 Increasing both enrollment representation and opportunities for Latino students to attend selective public four-year institutions is, therefore, critical to addressing Latino underrepresentation and achieving a critical mass among degree earners.
19BROKEN MIRRORS II | THE EDUCATION TRUST | SEPTEMBER 2019 | #BROKENMIRRORS
RACISM IS THE ROOT CAUSE OF LATINO UNDERREPRESENTATION
While our findings reveal that Latinos are grossly underrepresented among undergraduates and degree earners in most states, these disparities are not byproducts of any deficits in the talents or aspirations of Latinos but rather the result of structural racism and injustices throughout the education pipeline. Although most Latino children and young adults were born here and are U.S. citizens, 16 discrimination and hostility towards Latinos born elsewhere — especially those who are undocumented — is particularly problematic.17
That said, a lot of Latinos, regardless of where they were born or how integrated they are, have to contend with a host of inequities that can make it harder to pursue a college education.
For starters, Latino K-12 students receive far less support than their White peers. Many attend segregated, high-poverty schools,18 with less effective and less experienced teachers,19 low expectations and limited access to advanced coursework,20 and higher and harsher levels of discipline.21 An Ed Trust report found that districts serving large percentages of Black, Latino, and Native American students get $1,800 less per student, on average, than those serving less diverse student populations.22
College costs are one of the biggest hurdles for Latinos, who have eight times less wealth, on average, than their White counterparts23. Latinos who are cost-conscious and debt-averse may choose a community college over a four-year college (or forgo higher education altogether). But the cheaper option is not always best. While two-year colleges often have low tuition, they generally have fewer resources and more students — making it harder to finish. This cost issue is compounded for undocumented Latinos, who are ineligible for federal student aid24 and some tuition
and fee reductions, such as in-state tuition, which can amount to tens of thousands of dollars per year. They are also far less likely to have college-educated parents. Fewer than 1 in 4 Latinos has a college degree.25 Those that do are likelier to attend and complete college, since their parents are better positioned to offer advice, encouragement, and financial support.26
Admissions policies at four-year colleges are not helping matters. According to a recent survey of admissions officers, their top considerations are grades, strength of high school curriculum, and admissions test scores.27 Less than 10 percent of respondents said race is a “considerable” or “moderate” factor in admissions decisions, even though it would mitigate disparities and expand Latino student access. Meanwhile, Arizona, California, Florida, Michigan, Nebraska, New Hampshire, and Oklahoma banned the use of race in admissions, thereby hampering some efforts to recruit students of color.28
But the inequities don’t end at the campus gates. Once admitted, Latinos may find still more obstacles to crossing the finish line. Latinos at four-year institutions are more likely to graduate than those at community colleges, but barely half of the former finish within six years29 — in no small part because states provide less funding for public colleges that enroll more students of color,30 while funneling them into costly, noncredit, developmental education courses that delay progress toward a degree.31
BROKEN MIRRORS II | THE EDUCATION TRUST | SEPTEMBER 2019 | #BROKENMIRRORS
21BROKEN MIRRORS II | THE EDUCATION TRUST | SEPTEMBER 2019 | #BROKENMIRRORS
20
LATINO UNDERGRADUATE DEGREE EARNER REPRESENTATION
We created three additional metrics to examine the three questions related to undergraduate degree earner representation for Latino students in the states in our analysis. Metrics 4 and 5 capture how well the degrees awarded by public higher education institutions match the demographics of the state. Metric 4 compares the percentage of a state’s associate degree earners who are Latino to the state’s benchmark for community and technical colleges. Metric 5 compares the percentage of a state’s bachelor’s degree earners who are Latino to the state’s benchmark for four-year public colleges and universities. (For a more detailed discussion of data and methods, see page 32.)
Metric 6 does not include a benchmark. Instead, we measured the percentage point gap in the shares of Latino and White college graduates who earn bachelor’s degrees. This metric addresses concerns about Latino student underrepresentation among bachelor’s degree earners and overrepresentation among associate degree and certificate earners, who generally have lower wages and employment rates than individuals with bachelor’s or graduate degrees.32 We understand that the need for various levels of postsecondary education varies across states depending on labor market demands. In some states, the demand for certificates and associate degrees may be much higher than in others. This metric measures the extent to which Latino students are earning different credentials than their White peers, which is best communicated by the gap between the share of graduates earning a bachelor’s degree versus an associate degree or certificate.
Ideally, states’ scores on metrics 4 and 5 would approximate or exceed 100. A score of 100 means the share of degrees awarded to Latino students either equals or exceeds the percentage of Latino state residents who meet our criteria. Scores greater than 100 should be viewed as positive outcomes since all states have large gaps in degree attainment between Latino and White adults33 and closing gaps will require awarding a disproportionate share of degrees to Latino residents.
For metric 6, the ideal score should be less than or equal to zero. This indicates that Latino graduates earn an equal or higher share of bachelor’s degrees than White students. Like the prior two metrics, instances in which Latino students have more favorable outcomes than their White peers (i.e., negative gaps or scores below zero) should not be viewed negatively, since the largest gaps in degree attainment between Latino and White adults are typically at the bachelor’s degree level and, again, closing those gaps will necessitate awarding a disproportionate share of degrees to Latino residents.
Finally, we assigned grades that correspond to states’ scores on each metric. The grades for metrics 4 and 5 are based on a traditional grading scale (e.g., 75 = C). All numbers that exceeded 100 were given A+ grades. The grading scheme for metric 6 is on a different scale that is based on the size of the gap. Smaller gaps received higher grades (A’s and B’s), while larger gaps received lower grades (C’s and D’s). Gaps greater than or equal to 15 received F grades. We assigned grades on metrics 4, 5, and 6 for the 44 states that have at least 15,000 Latino adults, ages 25 to 64.
21BROKEN MIRRORS II | THE EDUCATION TRUST | SEPTEMBER 2019 | #BROKENMIRRORS
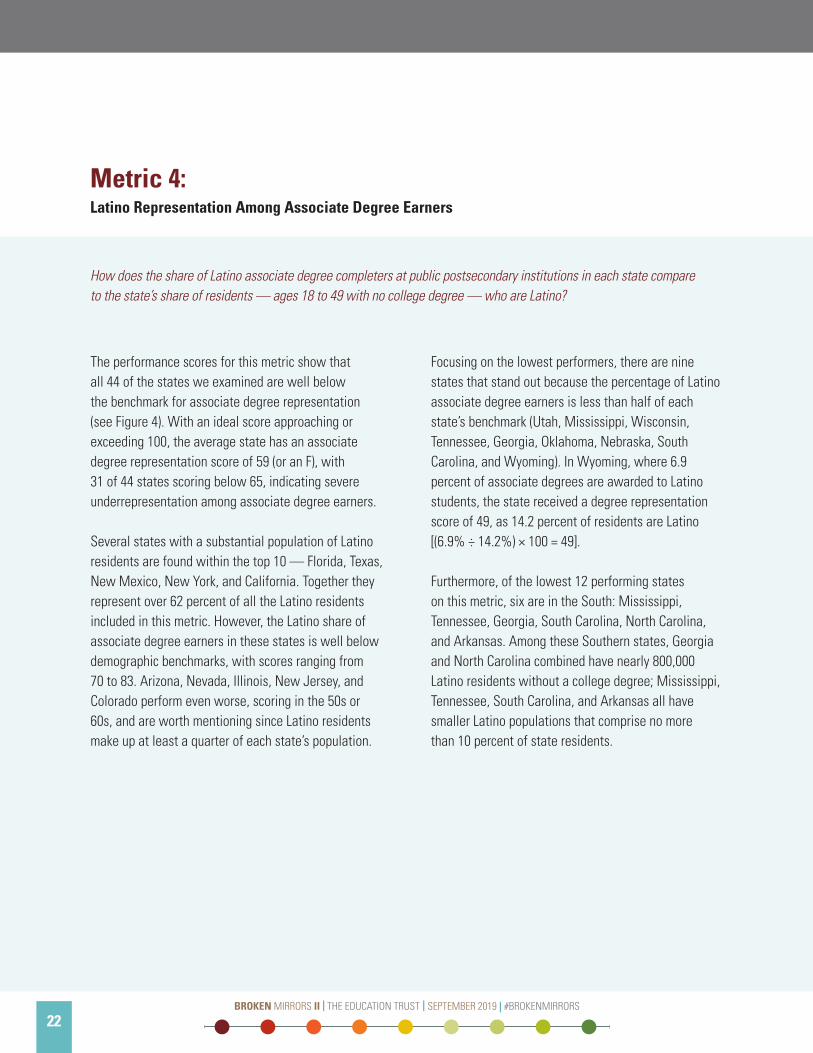
The performance scores for this metric show that all 44 of the states we examined are well below the benchmark for associate degree representation (see Figure 4). With an ideal score approaching or exceeding 100, the average state has an associate degree representation score of 59 (or an F), with 31 of 44 states scoring below 65, indicating severe underrepresentation among associate degree earners.
Several states with a substantial population of Latino residents are found within the top 10 — Florida, Texas, New Mexico, New York, and California. Together they represent over 62 percent of all the Latino residents included in this metric. However, the Latino share of associate degree earners in these states is well below demographic benchmarks, with scores ranging from 70 to 83. Arizona, Nevada, Illinois, New Jersey, and Colorado perform even worse, scoring in the 50s or 60s, and are worth mentioning since Latino residents make up at least a quarter of each state’s population.
Focusing on the lowest performers, there are nine states that stand out because the percentage of Latino associate degree earners is less than half of each state’s benchmark (Utah, Mississippi, Wisconsin, Tennessee, Georgia, Oklahoma, Nebraska, South Carolina, and Wyoming). In Wyoming, where 6.9 percent of associate degrees are awarded to Latino students, the state received a degree representation score of 49, as 14.2 percent of residents are Latino [(6.9% ÷ 14.2%) × 100 = 49].
Furthermore, of the lowest 12 performing states on this metric, six are in the South: Mississippi, Tennessee, Georgia, South Carolina, North Carolina, and Arkansas. Among these Southern states, Georgia and North Carolina combined have nearly 800,000 Latino residents without a college degree; Mississippi, Tennessee, South Carolina, and Arkansas all have smaller Latino populations that comprise no more than 10 percent of state residents.
Metric 4: Latino Representation Among Associate Degree Earners
How does the share of Latino associate degree completers at public postsecondary institutions in each state compare to the state’s share of residents — ages 18 to 49 with no college degree — who are Latino?
BROKEN MIRRORS II | THE EDUCATION TRUST | SEPTEMBER 2019 | #BROKENMIRRORS
23BROKEN MIRRORS II | THE EDUCATION TRUST | SEPTEMBER 2019 | #BROKENMIRRORS
22
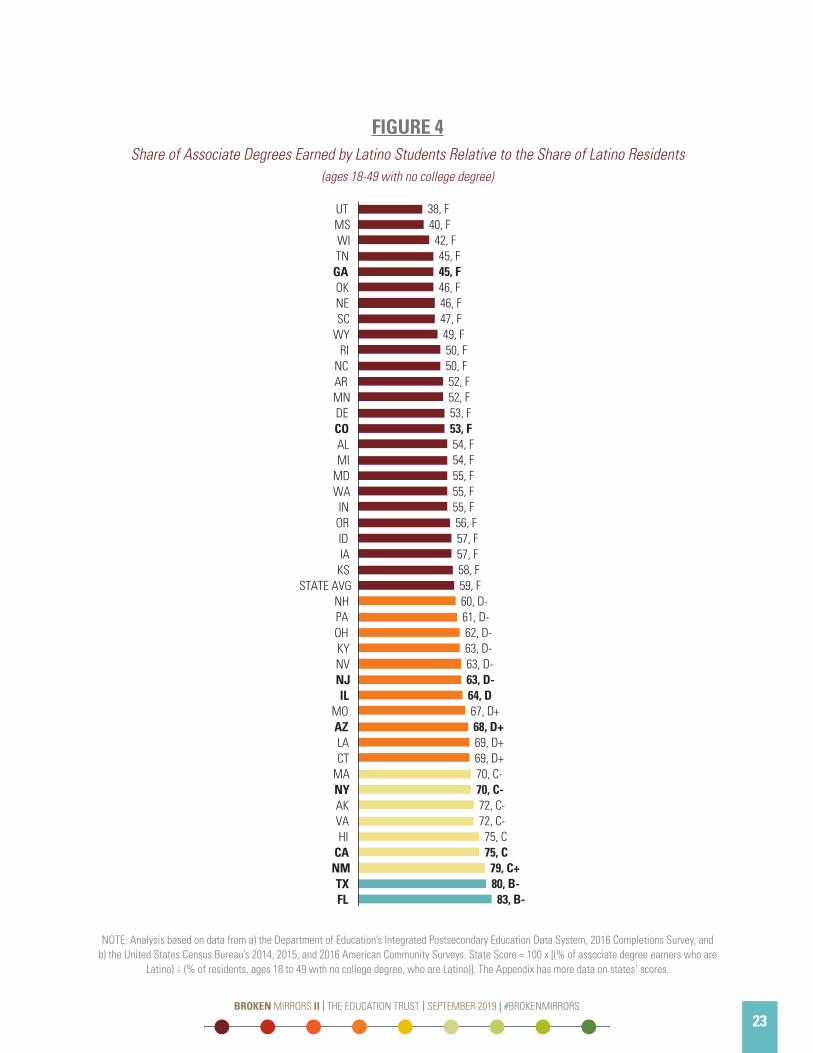
FIGURE 4Share of Associate Degrees Earned by Latino Students Relative to the Share of Latino Residents
(ages 18-49 with no college degree)
NOTE: Analysis based on data from a) the Department of Education’s Integrated Postsecondary Education Data System, 2016 Completions Survey, and b) the United States Census Bureau’s 2014, 2015, and 2016 American Community Surveys. State Score = 100 x [(% of associate degree earners who are
Latino) ÷ (% of residents, ages 18 to 49 with no college degree, who are Latino)]. The Appendix has more data on states’ scores.
38, F40, F42, F45, F45, F46, F46, F47, F49, F50, F50, F52, F52, F53, F53, F54, F54, F55, F55, F55, F56, F57, F57, F58, F59, F60, D-61, D-62, D-63, D-63, D-63, D-64, D67, D+68, D+69, D+69, D+70, C-70, C-72, C-72, C-75, C75, C79, C+80, B-83, B-
UTMSWITN
GAOKNESC
WYRI
NCARMNDECOALMI
MDWAINORIDIAKS
STATE AVGNHPAOHKYNVNJIL
MOAZLACT
MANYAKVAHI
CANMTXFL
23BROKEN MIRRORS II | THE EDUCATION TRUST | SEPTEMBER 2019 | #BROKENMIRRORS
The performance scores for this metric show considerable underrepresentation of Latino students among bachelor’s degree earners. The average state score was 64, or a D. All 44 states have significant room for improvement, as none of them even came close to hitting their benchmark (see Figure 5).
Most states had bachelor’s representation scores ranging from the 50s to mid 70s. However, four states (Utah, Nebraska, Connecticut, and Kansas) had extremely low scores, ranging from 43 to 49. Connecticut, with a bachelor’s degree representation score of 48, awarded only 10 percent of its bachelor’s degrees to Latino students, even though the state’s percentage of Latino residents who fit our criteria topped 21 percent [(10.0% ÷ 21.0%) × 100 = a score of 48]. Utah, Nebraska, and Kansas likewise got low representation scores, though less than 15 percent of their state residents are Latino.
Of the top 10 performers, only Florida and New Mexico have a sizable share of Latino residents. Yet despite leading the pack, neither Florida nor New Mexico — which scored 88 and 83, respectively — met their state benchmark. Thus, all states have a long way to go before they truly reflect the diversity of the population they serve.
Metric 5: Latino Representation Among Bachelor’s Degree Earners
How does the share of Latino bachelor’s degree completers at public postsecondary institutions in each state compare to the state’s share of residents — ages 18 to 49 with a high school diploma and no bachelor’s degree — who are Latino?
BROKEN MIRRORS II | THE EDUCATION TRUST | SEPTEMBER 2019 | #BROKENMIRRORS
25BROKEN MIRRORS II | THE EDUCATION TRUST | SEPTEMBER 2019 | #BROKENMIRRORS
24
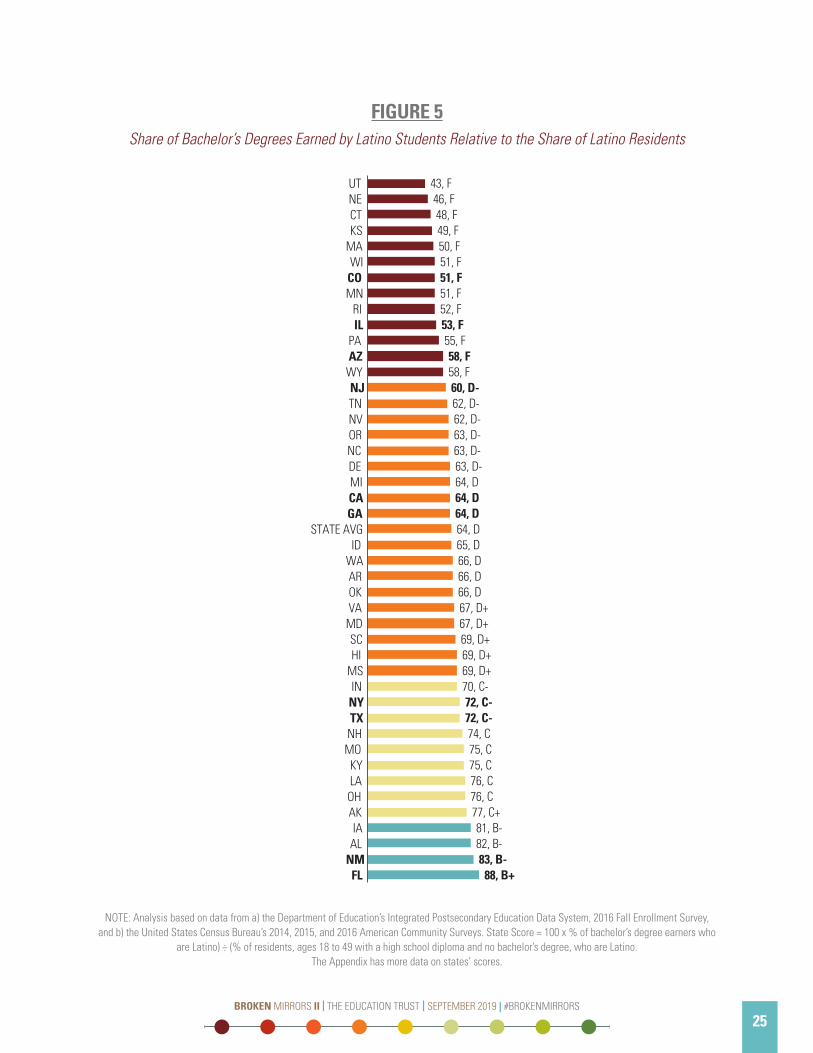
FIGURE 5Share of Bachelor’s Degrees Earned by Latino Students Relative to the Share of Latino Residents
NOTE: Analysis based on data from a) the Department of Education’s Integrated Postsecondary Education Data System, 2016 Fall Enrollment Survey, and b) the United States Census Bureau’s 2014, 2015, and 2016 American Community Surveys. State Score = 100 x % of bachelor’s degree earners who
are Latino) ÷ (% of residents, ages 18 to 49 with a high school diploma and no bachelor’s degree, who are Latino. The Appendix has more data on states’ scores.
43, F46, F48, F49, F50, F51, F51, F51, F52, F53, F55, F58, F58, F60, D-62, D-62, D-63, D-63, D-63, D-64, D64, D64, D64, D65, D66, D66, D66, D67, D+67, D+69, D+69, D+69, D+70, C-72, C-72, C-74, C75, C75, C76, C76, C77, C+81, B-82, B-83, B-88, B+
UTNECTKS
MAWICOMN
RIIL
PAAZWYNJTNNVORNCDEMICAGA
STATE AVGID
WAAROKVAMDSCHI
MSINNYTXNHMOKYLAOHAKIAAL
NMFL
25BROKEN MIRRORS II | THE EDUCATION TRUST | SEPTEMBER 2019 | #BROKENMIRRORS
Latino graduates are less likely to receive a bachelor’s degree than their White peers in most states, but the gaps are typically in the single digits. The vast majority of states (28 out of 44 states) have a gap of at least five percentage points between the shares of Latino and White undergraduates awarded a bachelor’s degree. While an ideal score is close to or less than zero, the average gap among states is 6.5 percentage points. That said, since Latino graduates are similarly underrepresented among associate degree earners (the state average is 59) and bachelor’s degree earners (the state average is 64), gaps are less than 10 percentage points in all but nine states and slightly more than 70 percent of Latinos graduated in states where there is a single-digit gap.
Sixteen of the 44 states we analyzed received an A or B on this metric. States such as Florida, New York, and New Mexico stand out among the top performers as having a large number of Latino graduates but a narrow gap that’s well below average. However, these states still award bachelor’s degrees to Latino students at a slightly lower rate than White students. Seven states have virtually no gap on this metric (Maryland, Alabama, Arkansas, Tennessee, New Hampshire, Ohio, and Mississippi), yet they account for less than 3 percent of all Latino certificate or degree earners.
Almost half the states earned a C grade, indicating that the gaps between Latino and White graduates in most states are modest. Several of these states are worth noting. Chief among them are California, New Jersey, Illinois, and Nevada, which have higher percentages of Latino residents. California — a state that is home to over a quarter of Latino degree or certificate earners — has a 6.8 percentage point gap between White and Latino bachelor’s degree earners, which is near the national average of 6.5 percentage points.
While most states have single-digit gaps on this metric, nine states have double-digits gaps: Nebraska, Connecticut, Massachusetts, Kansas, Hawaii, Minnesota, Arizona, Colorado, and Texas. Among these states, Arizona, Colorado, and Texas represent about a quarter of Latino degree and certificate earners and have gaps that are greater than or equal to 11 percentage points. For example, Texas has an 11.8 percentage point gap between White and Latino bachelor’s degree earners. While 52.1 percent of Texas’ White graduates earn a bachelor’s degree, only 40.4 percent of the state’s Latino graduates walk away with a bachelor’s degree (52.1% — 40.4% = 11.8 percentage points).34
Metric 6: Gap Between Shares of White and Latino Graduates With Bachelor’s Degrees
Are Latino and White graduates awarded a similar share of bachelor’s degrees from public institutions in their state?
BROKEN MIRRORS II | THE EDUCATION TRUST | SEPTEMBER 2019 | #BROKENMIRRORS
27BROKEN MIRRORS II | THE EDUCATION TRUST | SEPTEMBER 2019 | #BROKENMIRRORS
26
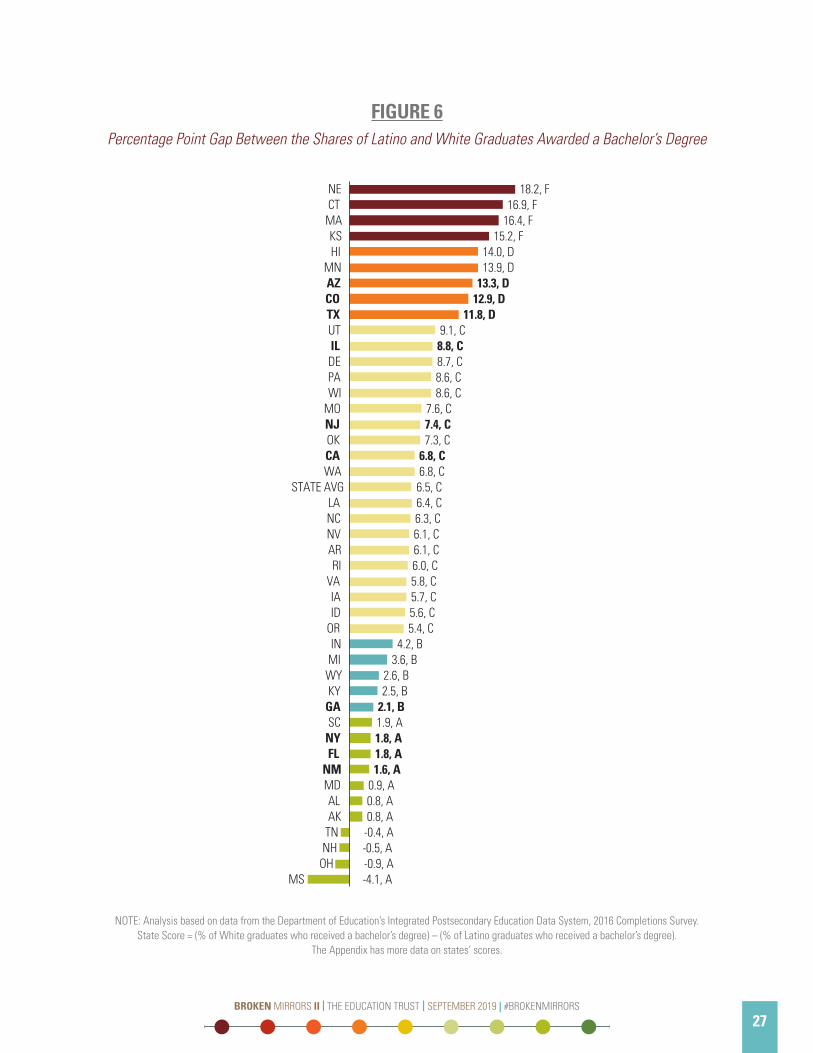
FIGURE 6Percentage Point Gap Between the Shares of Latino and White Graduates Awarded a Bachelor’s Degree
NOTE: Analysis based on data from the Department of Education’s Integrated Postsecondary Education Data System, 2016 Completions Survey. State Score = (% of White graduates who received a bachelor’s degree) – (% of Latino graduates who received a bachelor’s degree).
The Appendix has more data on states’ scores.
18.2, F16.9, F
16.4, F15.2, F
14.0, D13.9, D
13.3, D12.9, D
11.8, D9.1, C8.8, C8.7, C8.6, C8.6, C
7.6, C7.4, C7.3, C
6.8, C6.8, C6.5, C6.4, C6.3, C6.1, C6.1, C6.0, C5.8, C5.7, C5.6, C5.4, C
4.2, B3.6, B
2.6, B2.5, B
2.1, B1.9, A1.8, A1.8, A1.6, A
0.9, A0.8, A0.8, A
-0.4, A-0.5, A-0.9, A-4.1, A
NECTMAKSHI
MNAZCOTXUTILDEPAWI
MONJOKCAWA
STATE AVGLANCNVARRI
VAIAID
ORINMIWYKY
GASC
NYFL
NMMDALAK
TNNH
OHMS
27BROKEN MIRRORS II | THE EDUCATION TRUST | SEPTEMBER 2019 | #BROKENMIRRORS
Undergraduate Degree Earner Representation Summary
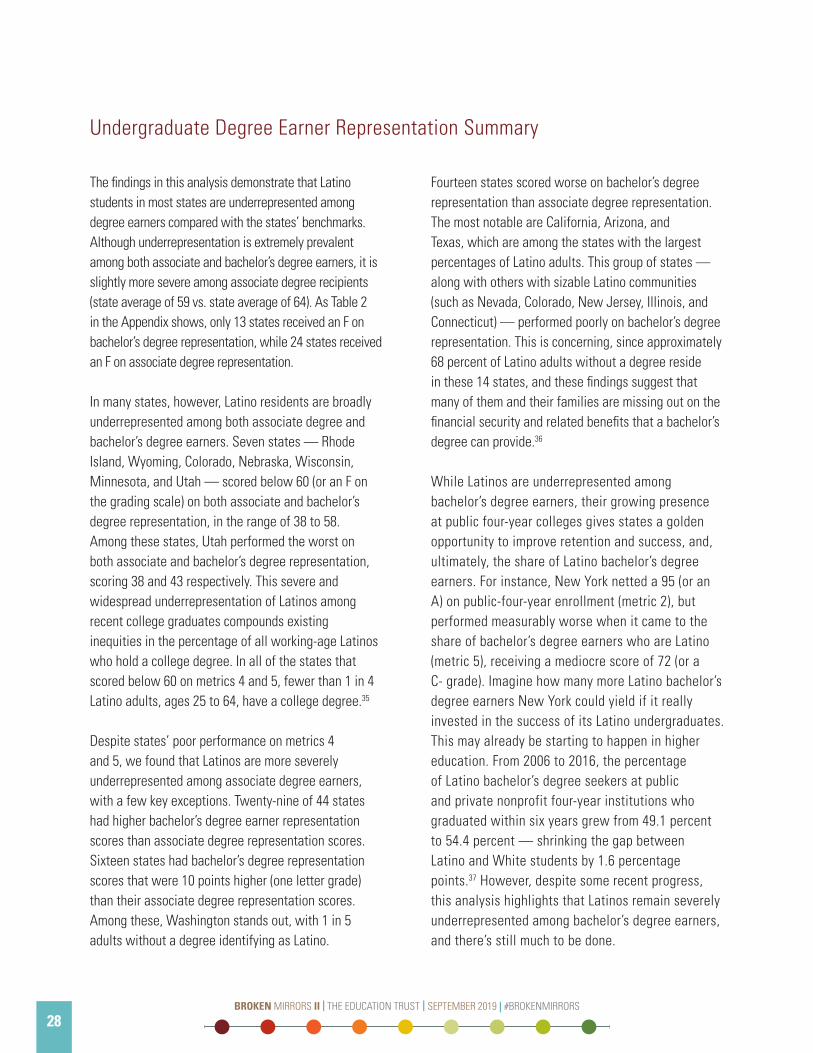
The findings in this analysis demonstrate that Latino students in most states are underrepresented among degree earners compared with the states’ benchmarks. Although underrepresentation is extremely prevalent among both associate and bachelor’s degree earners, it is slightly more severe among associate degree recipients (state average of 59 vs. state average of 64). As Table 2 in the Appendix shows, only 13 states received an F on bachelor’s degree representation, while 24 states received an F on associate degree representation.
In many states, however, Latino residents are broadly underrepresented among both associate degree and bachelor’s degree earners. Seven states — Rhode Island, Wyoming, Colorado, Nebraska, Wisconsin, Minnesota, and Utah — scored below 60 (or an F on the grading scale) on both associate and bachelor’s degree representation, in the range of 38 to 58. Among these states, Utah performed the worst on both associate and bachelor’s degree representation, scoring 38 and 43 respectively. This severe and widespread underrepresentation of Latinos among recent college graduates compounds existing inequities in the percentage of all working-age Latinos who hold a college degree. In all of the states that scored below 60 on metrics 4 and 5, fewer than 1 in 4 Latino adults, ages 25 to 64, have a college degree.35
Despite states’ poor performance on metrics 4 and 5, we found that Latinos are more severely underrepresented among associate degree earners, with a few key exceptions. Twenty-nine of 44 states had higher bachelor’s degree earner representation scores than associate degree representation scores. Sixteen states had bachelor’s degree representation scores that were 10 points higher (one letter grade) than their associate degree representation scores. Among these, Washington stands out, with 1 in 5 adults without a degree identifying as Latino.
Fourteen states scored worse on bachelor’s degree representation than associate degree representation. The most notable are California, Arizona, and Texas, which are among the states with the largest percentages of Latino adults. This group of states — along with others with sizable Latino communities (such as Nevada, Colorado, New Jersey, Illinois, and Connecticut) — performed poorly on bachelor’s degree representation. This is concerning, since approximately 68 percent of Latino adults without a degree reside in these 14 states, and these findings suggest that many of them and their families are missing out on the financial security and related benefits that a bachelor’s degree can provide.36
While Latinos are underrepresented among bachelor’s degree earners, their growing presence at public four-year colleges gives states a golden opportunity to improve retention and success, and, ultimately, the share of Latino bachelor’s degree earners. For instance, New York netted a 95 (or an A) on public-four-year enrollment (metric 2), but performed measurably worse when it came to the share of bachelor’s degree earners who are Latino (metric 5), receiving a mediocre score of 72 (or a C- grade). Imagine how many more Latino bachelor’s degree earners New York could yield if it really invested in the success of its Latino undergraduates. This may already be starting to happen in higher education. From 2006 to 2016, the percentage of Latino bachelor’s degree seekers at public and private nonprofit four-year institutions who graduated within six years grew from 49.1 percent to 54.4 percent — shrinking the gap between Latino and White students by 1.6 percentage points.37 However, despite some recent progress, this analysis highlights that Latinos remain severely underrepresented among bachelor’s degree earners, and there’s still much to be done.
BROKEN MIRRORS II | THE EDUCATION TRUST | SEPTEMBER 2019 | #BROKENMIRRORS
29BROKEN MIRRORS II | THE EDUCATION TRUST | SEPTEMBER 2019 | #BROKENMIRRORS
28

CONCLUSIONOur analysis of Latino representation among undergraduates and degree earners at public institutions in 44 states leads us to conclude that public institutions must do far more to reduce inequities based on race and ethnicity, and ensure that all residents — whatever their race or ethnicity — have an equal opportunity to benefit from a postsecondary education. To achieve this end, our nation’s public colleges and universities must reflect the racial and ethnic diversity of the population they profess to serve. We posed and answered six questions about Latino representation in higher education. Our findings show that, with few exceptions, Latino representation in public colleges and universities is anything but a mirror image of states’ racial and ethnic composition.
We found that underrepresentation is endemic at both community and technical colleges and public four-year institutions in nearly every state. It was even worse at selective public institutions in states with sizable Latino populations, where Latino students are disproportionately enrolled in less selective state colleges with more limited resources. We also found that Latino students were severely underrepresented among associate and bachelor’s degree earners in every state we analyzed. While Latino student representation tended to be lowest among associate degree earners, representation among bachelor’s degree earners was also far below state benchmarks in the vast majority of states. These findings suggest that public institutions in the overwhelming majority of states are broken mirrors that fail to accurately reflect America’s rich racial and ethnic diversity.
On a more positive note, public institutions in several key states are close to meeting our standards for equitably serving and graduating Latinos. For example, several states with sizeable Latino populations scored relatively well on metrics 2 and 5, which measure Latino enrollment and bachelor’s degree earner representation at public four-year institutions. These states — Florida, New York, New Mexico, Georgia, and Texas — received at least a B grade for Latino enrollment at public four-year institutions (metric 2) and are home to nearly 38 percent of all Latinos. These states can meet or surpass their equity benchmarks
with relatively small, incremental increases in the number of Latinos attending college. Florida and New Mexico also received B-range grades for their shares of Latino bachelor’s degree earners (metric 5), meaning that their college graduates are close to mirroring their respective state populations. Although the majority of states in our analysis received far worse marks, the states with sizeable Latino communities show that Latinos can (and do) thrive in college.
If state leaders would commit to addressing systemic racism and barriers throughout the educational pipeline, that might go a long way toward ensuring that public colleges and universities serve and support all state residents. But aggressive measures to enroll and graduate more Latino residents are also required, so they may have an equal chance to benefit from the increased earnings, economic stability, and employment opportunities that a college degree generally affords. Although Latinos are underrepresented at both public four-year institutions and community colleges, state leaders should emphasize opening up more opportunities for Latinos to thrive at four-year colleges and universities. Four-year institutions are crucial because these institutions not only have greater student resources, but the return on a bachelor’s degree from a four-year college is often greater.
A stronger commitment to serving higher numbers of Latino residents will not only empower states’ Latino residents, but bolster states economically. When residents have higher levels of degree attainment, and degree holders reflect the diverse populations of their states, economies become more robust, tax revenues rise, and reliance on social safety net programs falls. These are just a few of the reasons why more than 40 states have adopted goals to boost the ranks of the college-educated. But, in many states, including those in which the vast number of Latinos live, these goals will not be met without a deliberate and concerted effort to get more Latinos to and through college. Below are questions for state and postsecondary education leaders and advocates to help them focus their efforts on areas of need while pursuing educational justice.
29BROKEN MIRRORS II | THE EDUCATION TRUST | SEPTEMBER 2019 | #BROKENMIRRORS
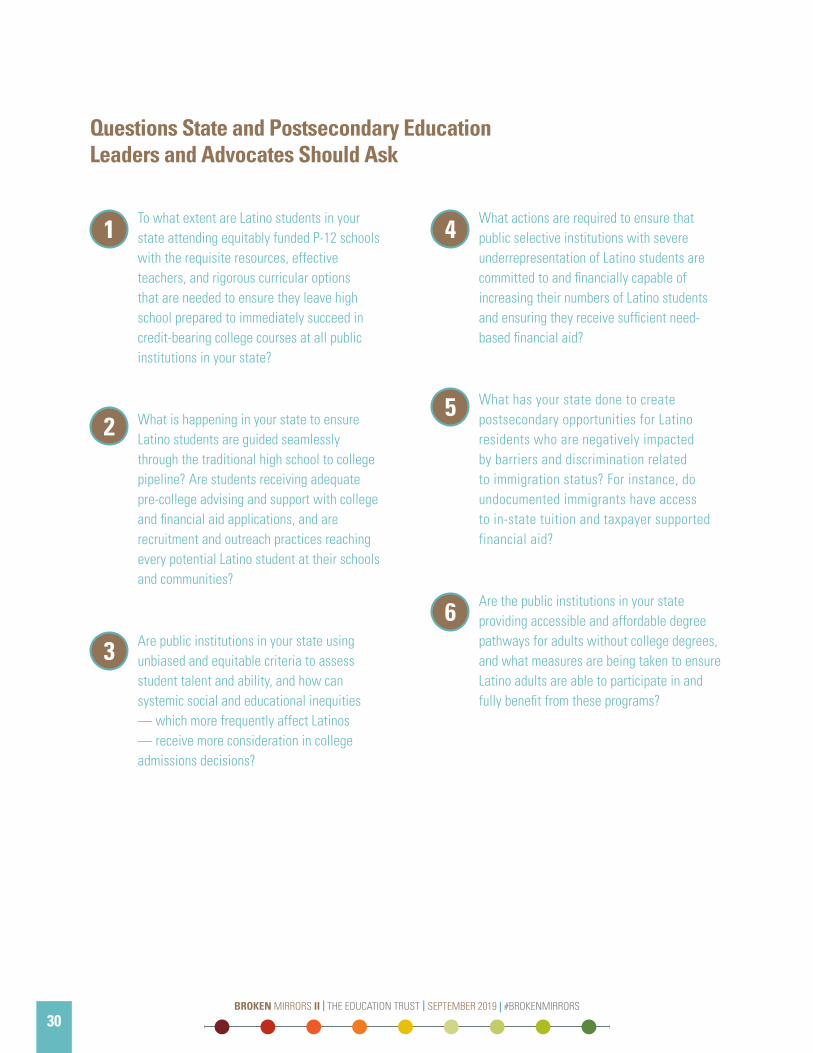
What actions are required to ensure that public selective institutions with severe underrepresentation of Latino students are committed to and financially capable of increasing their numbers of Latino students and ensuring they receive sufficient need-based financial aid?
What has your state done to create postsecondary opportunities for Latino residents who are negatively impacted by barriers and discrimination related to immigration status? For instance, do undocumented immigrants have access to in-state tuition and taxpayer supported financial aid?
Are the public institutions in your state providing accessible and affordable degree pathways for adults without college degrees, and what measures are being taken to ensure Latino adults are able to participate in and fully benefit from these programs?
To what extent are Latino students in your state attending equitably funded P-12 schools with the requisite resources, effective teachers, and rigorous curricular options that are needed to ensure they leave high school prepared to immediately succeed in credit-bearing college courses at all public institutions in your state?
What is happening in your state to ensure Latino students are guided seamlessly through the traditional high school to college pipeline? Are students receiving adequate pre-college advising and support with college and financial aid applications, and are recruitment and outreach practices reaching every potential Latino student at their schools and communities?
Are public institutions in your state using unbiased and equitable criteria to assess student talent and ability, and how can systemic social and educational inequities — which more frequently affect Latinos — receive more consideration in college admissions decisions?
1 4
25
3
6
Questions State and Postsecondary Education Leaders and Advocates Should Ask
BROKEN MIRRORS II | THE EDUCATION TRUST | SEPTEMBER 2019 | #BROKENMIRRORS
31BROKEN MIRRORS II | THE EDUCATION TRUST | SEPTEMBER 2019 | #BROKENMIRRORS
30
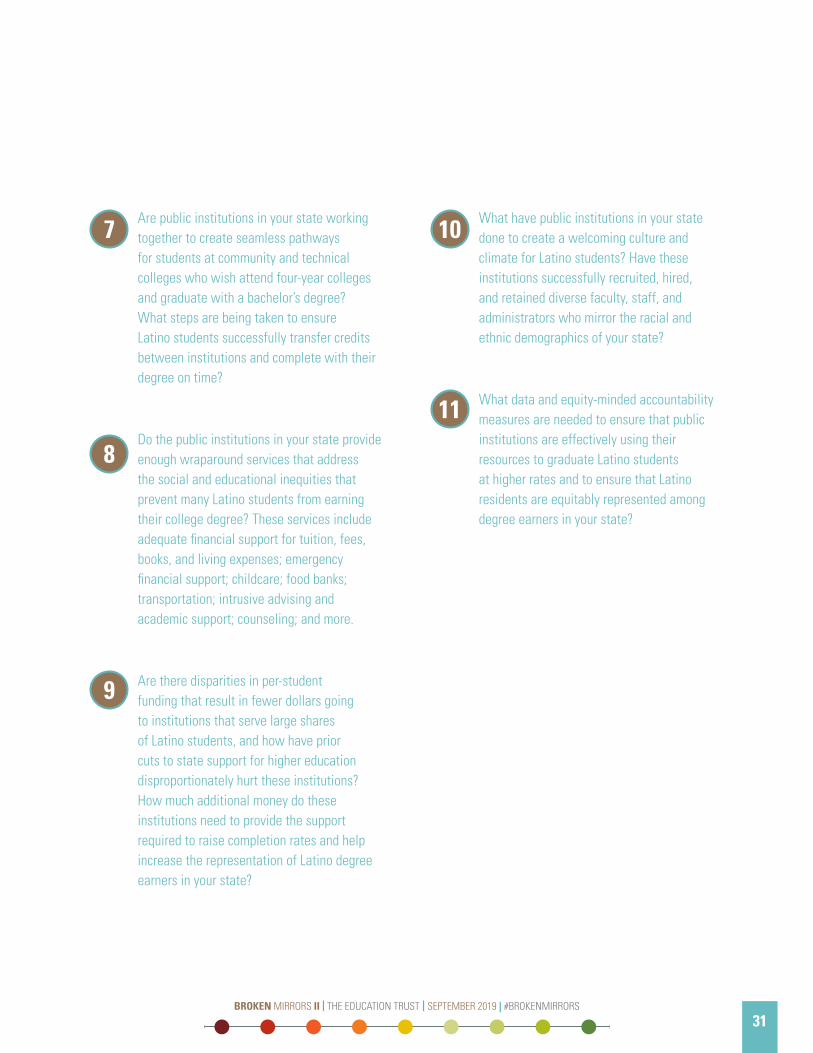
Are public institutions in your state working together to create seamless pathways for students at community and technical colleges who wish attend four-year colleges and graduate with a bachelor’s degree? What steps are being taken to ensure Latino students successfully transfer credits between institutions and complete with their degree on time?
Do the public institutions in your state provide enough wraparound services that address the social and educational inequities that prevent many Latino students from earning their college degree? These services include adequate financial support for tuition, fees, books, and living expenses; emergency financial support; childcare; food banks; transportation; intrusive advising and academic support; counseling; and more.
Are there disparities in per-student funding that result in fewer dollars going to institutions that serve large shares of Latino students, and how have prior cuts to state support for higher education disproportionately hurt these institutions? How much additional money do these institutions need to provide the support required to raise completion rates and help increase the representation of Latino degree earners in your state?
7
8
What have public institutions in your state done to create a welcoming culture and climate for Latino students? Have these institutions successfully recruited, hired, and retained diverse faculty, staff, and administrators who mirror the racial and ethnic demographics of your state?
What data and equity-minded accountability measures are needed to ensure that public institutions are effectively using their resources to graduate Latino students at higher rates and to ensure that Latino residents are equitably represented among degree earners in your state?
9
10
11
31BROKEN MIRRORS II | THE EDUCATION TRUST | SEPTEMBER 2019 | #BROKENMIRRORS
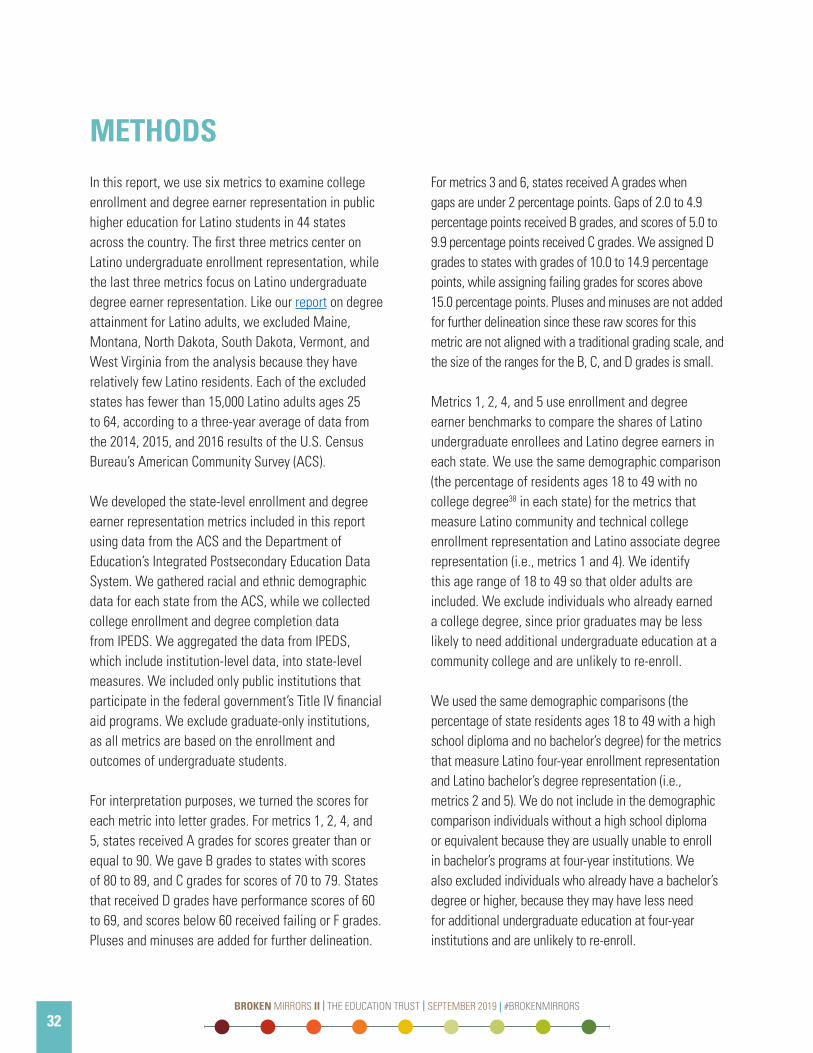
METHODSIn this report, we use six metrics to examine college enrollment and degree earner representation in public higher education for Latino students in 44 states across the country. The first three metrics center on Latino undergraduate enrollment representation, while the last three metrics focus on Latino undergraduate degree earner representation. Like our report on degree attainment for Latino adults, we excluded Maine, Montana, North Dakota, South Dakota, Vermont, and West Virginia from the analysis because they have relatively few Latino residents. Each of the excluded states has fewer than 15,000 Latino adults ages 25 to 64, according to a three-year average of data from the 2014, 2015, and 2016 results of the U.S. Census Bureau’s American Community Survey (ACS).
We developed the state-level enrollment and degree earner representation metrics included in this report using data from the ACS and the Department of Education’s Integrated Postsecondary Education Data System. We gathered racial and ethnic demographic data for each state from the ACS, while we collected college enrollment and degree completion data from IPEDS. We aggregated the data from IPEDS, which include institution-level data, into state-level measures. We included only public institutions that participate in the federal government’s Title IV financial aid programs. We exclude graduate-only institutions, as all metrics are based on the enrollment and outcomes of undergraduate students.
For interpretation purposes, we turned the scores for each metric into letter grades. For metrics 1, 2, 4, and 5, states received A grades for scores greater than or equal to 90. We gave B grades to states with scores of 80 to 89, and C grades for scores of 70 to 79. States that received D grades have performance scores of 60 to 69, and scores below 60 received failing or F grades. Pluses and minuses are added for further delineation.
For metrics 3 and 6, states received A grades when gaps are under 2 percentage points. Gaps of 2.0 to 4.9 percentage points received B grades, and scores of 5.0 to 9.9 percentage points received C grades. We assigned D grades to states with grades of 10.0 to 14.9 percentage points, while assigning failing grades for scores above 15.0 percentage points. Pluses and minuses are not added for further delineation since these raw scores for this metric are not aligned with a traditional grading scale, and the size of the ranges for the B, C, and D grades is small.
Metrics 1, 2, 4, and 5 use enrollment and degree earner benchmarks to compare the shares of Latino undergraduate enrollees and Latino degree earners in each state. We use the same demographic comparison (the percentage of residents ages 18 to 49 with no college degree38 in each state) for the metrics that measure Latino community and technical college enrollment representation and Latino associate degree representation (i.e., metrics 1 and 4). We identify this age range of 18 to 49 so that older adults are included. We exclude individuals who already earned a college degree, since prior graduates may be less likely to need additional undergraduate education at a community college and are unlikely to re-enroll.
We used the same demographic comparisons (the percentage of state residents ages 18 to 49 with a high school diploma and no bachelor’s degree) for the metrics that measure Latino four-year enrollment representation and Latino bachelor’s degree representation (i.e., metrics 2 and 5). We do not include in the demographic comparison individuals without a high school diploma or equivalent because they are usually unable to enroll in bachelor’s programs at four-year institutions. We also excluded individuals who already have a bachelor’s degree or higher, because they may have less need for additional undergraduate education at four-year institutions and are unlikely to re-enroll.
BROKEN MIRRORS II | THE EDUCATION TRUST | SEPTEMBER 2019 | #BROKENMIRRORS
33BROKEN MIRRORS II | THE EDUCATION TRUST | SEPTEMBER 2019 | #BROKENMIRRORS
32
33BROKEN MIRRORS II | THE EDUCATION TRUST | SEPTEMBER 2019 | #BROKENMIRRORS
LATINO ENROLLMENT REPRESENTATION METRICS
Metric 1: Latino Enrollment Representation at Community and Technical Colleges
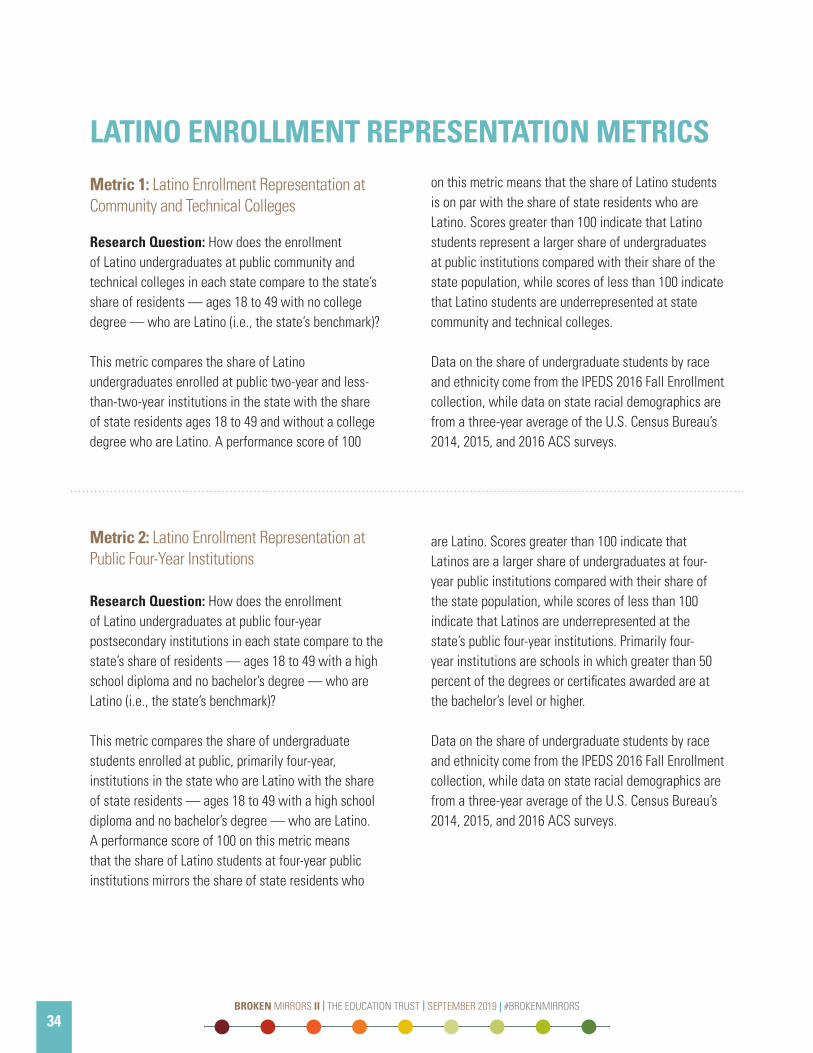
Research Question: How does the enrollment of Latino undergraduates at public community and technical colleges in each state compare to the state’s share of residents — ages 18 to 49 with no college degree — who are Latino (i.e., the state’s benchmark)?
This metric compares the share of Latino undergraduates enrolled at public two-year and less-than-two-year institutions in the state with the share of state residents ages 18 to 49 and without a college degree who are Latino. A performance score of 100
on this metric means that the share of Latino students is on par with the share of state residents who are Latino. Scores greater than 100 indicate that Latino students represent a larger share of undergraduates at public institutions compared with their share of the state population, while scores of less than 100 indicate that Latino students are underrepresented at state community and technical colleges.
Data on the share of undergraduate students by race and ethnicity come from the IPEDS 2016 Fall Enrollment collection, while data on state racial demographics are from a three-year average of the U.S. Census Bureau’s 2014, 2015, and 2016 ACS surveys.
Metric 2: Latino Enrollment Representation at Public Four-Year Institutions
Research Question: How does the enrollment of Latino undergraduates at public four-year postsecondary institutions in each state compare to the state’s share of residents — ages 18 to 49 with a high school diploma and no bachelor’s degree — who are Latino (i.e., the state’s benchmark)?
This metric compares the share of undergraduate students enrolled at public, primarily four-year, institutions in the state who are Latino with the share of state residents — ages 18 to 49 with a high school diploma and no bachelor’s degree — who are Latino. A performance score of 100 on this metric means that the share of Latino students at four-year public institutions mirrors the share of state residents who
are Latino. Scores greater than 100 indicate that Latinos are a larger share of undergraduates at four-year public institutions compared with their share of the state population, while scores of less than 100 indicate that Latinos are underrepresented at the state’s public four-year institutions. Primarily four-year institutions are schools in which greater than 50 percent of the degrees or certificates awarded are at the bachelor’s level or higher.
Data on the share of undergraduate students by race and ethnicity come from the IPEDS 2016 Fall Enrollment collection, while data on state racial demographics are from a three-year average of the U.S. Census Bureau’s 2014, 2015, and 2016 ACS surveys.
BROKEN MIRRORS II | THE EDUCATION TRUST | SEPTEMBER 2019 | #BROKENMIRRORS
35BROKEN MIRRORS II | THE EDUCATION TRUST | SEPTEMBER 2019 | #BROKENMIRRORS
34
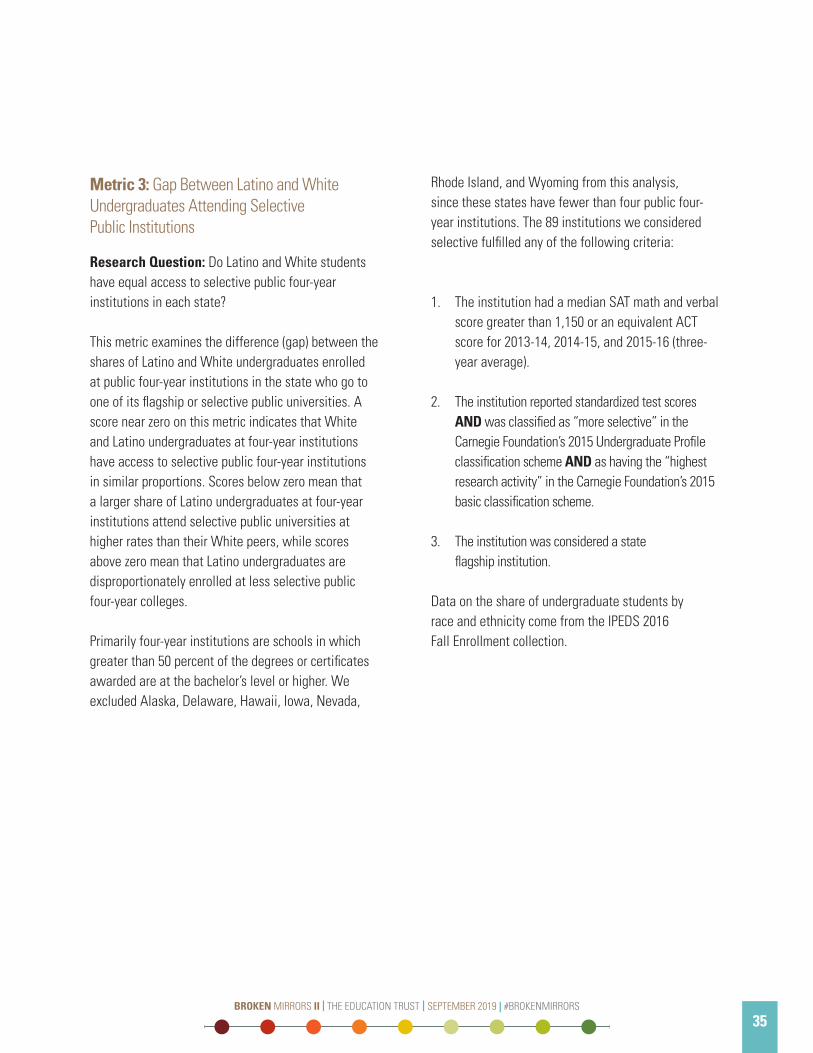
Metric 3: Gap Between Latino and White Undergraduates Attending Selective Public Institutions
Research Question: Do Latino and White students have equal access to selective public four-year institutions in each state?
This metric examines the difference (gap) between the shares of Latino and White undergraduates enrolled at public four-year institutions in the state who go to one of its flagship or selective public universities. A score near zero on this metric indicates that White and Latino undergraduates at four-year institutions have access to selective public four-year institutions in similar proportions. Scores below zero mean that a larger share of Latino undergraduates at four-year institutions attend selective public universities at higher rates than their White peers, while scores above zero mean that Latino undergraduates are disproportionately enrolled at less selective public four-year colleges.
Primarily four-year institutions are schools in which greater than 50 percent of the degrees or certificates awarded are at the bachelor’s level or higher. We excluded Alaska, Delaware, Hawaii, Iowa, Nevada,
Rhode Island, and Wyoming from this analysis, since these states have fewer than four public four-year institutions. The 89 institutions we considered selective fulfilled any of the following criteria:
1. The institution had a median SAT math and verbal score greater than 1,150 or an equivalent ACT score for 2013-14, 2014-15, and 2015-16 (three-year average).
2. The institution reported standardized test scores AND was classified as “more selective” in the Carnegie Foundation’s 2015 Undergraduate Profile classification scheme AND as having the “highest research activity” in the Carnegie Foundation’s 2015 basic classification scheme.
3. The institution was considered a state flagship institution.
Data on the share of undergraduate students by race and ethnicity come from the IPEDS 2016 Fall Enrollment collection.
35BROKEN MIRRORS II | THE EDUCATION TRUST | SEPTEMBER 2019 | #BROKENMIRRORS
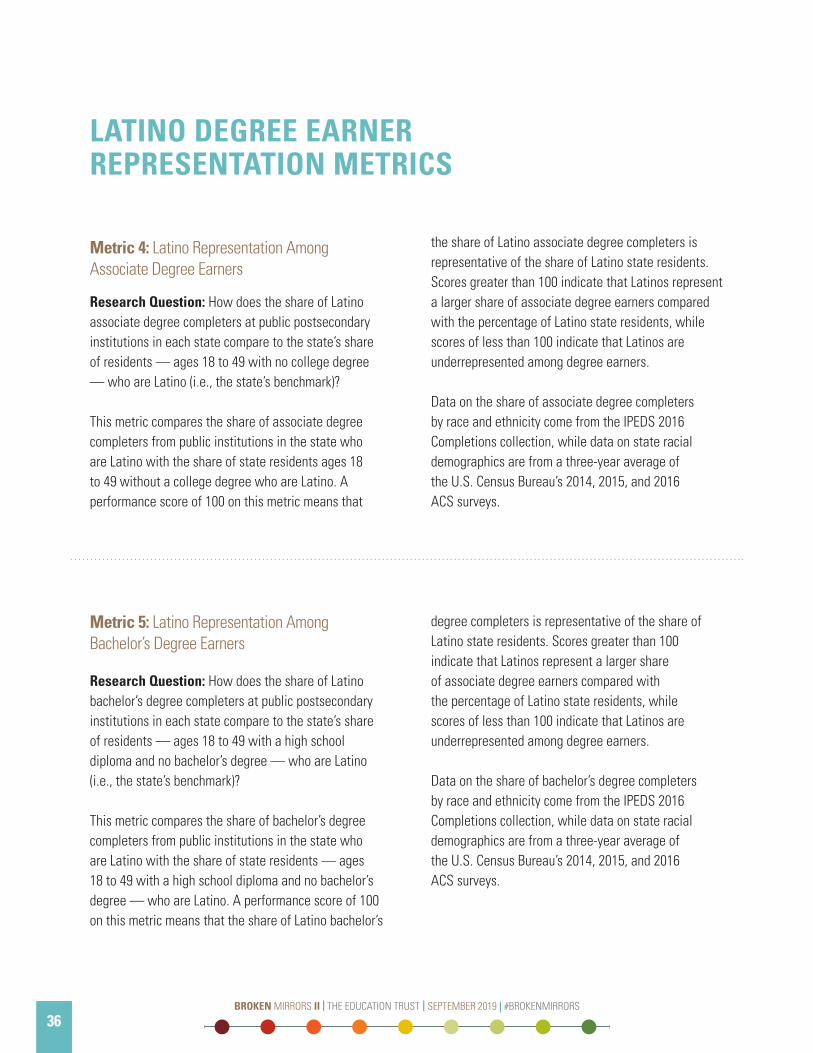
36
LATINO DEGREE EARNER REPRESENTATION METRICS
Metric 4: Latino Representation Among Associate Degree Earners
Research Question: How does the share of Latino associate degree completers at public postsecondary institutions in each state compare to the state’s share of residents — ages 18 to 49 with no college degree — who are Latino (i.e., the state’s benchmark)?
This metric compares the share of associate degree completers from public institutions in the state who are Latino with the share of state residents ages 18 to 49 without a college degree who are Latino. A performance score of 100 on this metric means that
the share of Latino associate degree completers is representative of the share of Latino state residents. Scores greater than 100 indicate that Latinos represent a larger share of associate degree earners compared with the percentage of Latino state residents, while scores of less than 100 indicate that Latinos are underrepresented among degree earners.
Data on the share of associate degree completers by race and ethnicity come from the IPEDS 2016 Completions collection, while data on state racial demographics are from a three-year average of the U.S. Census Bureau’s 2014, 2015, and 2016 ACS surveys.
Metric 5: Latino Representation Among Bachelor’s Degree Earners
Research Question: How does the share of Latino bachelor’s degree completers at public postsecondary institutions in each state compare to the state’s share of residents — ages 18 to 49 with a high school diploma and no bachelor’s degree — who are Latino (i.e., the state’s benchmark)?
This metric compares the share of bachelor’s degree completers from public institutions in the state who are Latino with the share of state residents — ages 18 to 49 with a high school diploma and no bachelor’s degree — who are Latino. A performance score of 100 on this metric means that the share of Latino bachelor’s
degree completers is representative of the share of Latino state residents. Scores greater than 100 indicate that Latinos represent a larger share of associate degree earners compared with the percentage of Latino state residents, while scores of less than 100 indicate that Latinos are underrepresented among degree earners.
Data on the share of bachelor’s degree completers by race and ethnicity come from the IPEDS 2016 Completions collection, while data on state racial demographics are from a three-year average of the U.S. Census Bureau’s 2014, 2015, and 2016 ACS surveys.
BROKEN MIRRORS II | THE EDUCATION TRUST | SEPTEMBER 2019 | #BROKENMIRRORS
37BROKEN MIRRORS II | THE EDUCATION TRUST | SEPTEMBER 2019 | #BROKENMIRRORS
36
Metric 6: Gap Between Shares of Latino and White Graduates With Bachelor’s Degrees
Research Question: Are Latino and White graduates awarded a similar share of bachelor’s degrees from public institutions in their state?
This metric compares the difference between the shares of Latino and White graduates who receive bachelor’s degrees in each state. We define graduates as students who earn one of the following postsecondary credentials: a bachelor’s degree, an associate degree, or a certificate. An ideal score on this metric should be less than or equal to zero, which
indicates that Latino graduates earn an equal or higher share of bachelor’s degrees than White students. Scores greater than zero on this metric indicate that Latinos earn considerably lower shares of bachelor’s degrees than their White counterparts. Negative scores (i.e., scores of less than zero) indicate that higher proportions of Latino graduates earn bachelor’s degrees. The data on degree completers comes from the IPEDS 2016 Completions collection.
37BROKEN MIRRORS II | THE EDUCATION TRUST | SEPTEMBER 2019 | #BROKENMIRRORS
WHAT ABOUT THE GRADUATION RATE?
Throughout the years, much of The Education Trust’s higher education work has focused on analyzing the institutional graduation rates reported annually in the Department of Education’s Integrated Postsecondary Education Data System (IPEDS), which indicate how well a specific institution performs at graduating a new cohort of students who begin as full-time students. For four-year institutions, the metric measures the percentage of new bachelor’s-degree-seeking students who initially enroll full time and complete a bachelor’s degree within six years at the institution in which they initially enrolled. Although this metric is valuable, it has some limitations that make it less informative for some institutions.
The IPEDS graduation rate does not include part-time students or account for the outcomes of students who transfer from one school to another. These limitations make the graduation rate less useful as a holistic measure of institutional success for four-year colleges and universities that serve a high percentage of students who are not “first-time, full-time” attendees, such as older adults who work and attend classes on a part-time basis, or students who transfer from another four-year institution or a community college. When outcomes for these students are not included, a significant piece of an institution’s mission is not taken into account. For example, at San Diego State University, which in 2016 had the second highest Latino graduation rate (70 percent) of any public Hispanic-Serving Institution, the percentage of new students that were included in the graduation rate cohort was only 56 percent. Stated differently, almost half of their new students were transfer students or enrolled part time.
For many community colleges, the graduation rate metric provides even less insight. In addition to
excluding part-time students and students who are not first-time students, the graduation rate does not account for the outcomes of students who transfer from community colleges and continue their education elsewhere. By not counting the outcomes of these students, the graduation rate metric does not capture or measure a core aspect of the community college mission: preparing students to transfer to four-year institutions.
Although The Education Trust still believes the graduation rate is a valuable institutional performance metric when presented and interpreted in the right context, we did not aggregate these institutional rates into statewide rates and include them in the core suite of metrics for this report. State policymakers may use the IPEDS institutional graduation rates to assess individual state performance, but at the macro level, which is the focus of this report, state policymakers are more interested in whether students finish their degrees and are less concerned with whether they complete their degree at the institution of initial enrollment. Because the statewide IPEDS graduation rate aggregations do not capture transfer outcomes, these rates are much less useful in this context.
Even though we did not include the statewide IPEDS graduation rate aggregations in the report, we provide the rates for four-year institutions in the Appendix. Despite the limitations, the data reveal a significant gap in bachelor’s degree completion in the vast majority of states. Thirty-three of the 44 states have gaps above five percentage points, and 19 states have gaps above 10 percentage points. We decided not to include the statewide graduation rates for community colleges given the significant limitations described above.
BROKEN MIRRORS II | THE EDUCATION TRUST | SEPTEMBER 2019 | #BROKENMIRRORS
39BROKEN MIRRORS II | THE EDUCATION TRUST | SEPTEMBER 2019 | #BROKENMIRRORS
38
39BROKEN MIRRORS II | THE EDUCATION TRUST | SEPTEMBER 2019 | #BROKENMIRRORS

WHY DIDN’T WE GRADE STATES ON LATINO CERTIFICATE REPRESENTATION?
Many states count certificates in their degree attainment rates in the hope that these certificates will lead to greater economic opportunity. However, the publicly available data we used for this project do not enable us to differentiate between certificates that genuinely enhance mobility and those that do not. Broadly speaking, certificate holders earn only the same amount as individuals with some college experience and no degree, typically only $5,750 more than a high school graduate.39 Until better data allow us to be more discerning about certificate quality and economic utility, we remain far more confident about the economic and labor-market returns afforded to associate and bachelor’s degree earners.
Moreover, an analysis from the Center for American Progress found that nearly 51 percent of Latino certificate completers defaulted on their student loans within 12 years.40 While the default rates were still fairly high for bachelor’s and associate degree earners (14 percent and 21 percent, respectively), the default rates were far lower than they were for certificate completers. This is troubling given that many Latino students earn certificates instead of a degree — nearly 22 percent of Latino graduates are awarded a certificate each year.
Beyond our concerns about the value of certificates, especially as terminal credentials, we also know that the number of certificates awarded varies greatly by state. In some states, such as Georgia and Louisiana, certificates represent more than 40 percent of all credentials (degrees and certificates) awarded by public institutions. And, according to research from the Georgetown Center for Education and the Workforce, certificates are more common in Southern states.41 On the other hand, in states like Delaware, New Jersey, New York, and Rhode Island, certificates are scarce, accounting for fewer than 5 percent of the credentials awarded by public institutions. These stark differences in certificate awards across states, along with our concerns about their value, led us to exclude Latino certificate representation from this analysis.
BROKEN MIRRORS II | THE EDUCATION TRUST | SEPTEMBER 2019 | #BROKENMIRRORS
41BROKEN MIRRORS II | THE EDUCATION TRUST | SEPTEMBER 2019 | #BROKENMIRRORS
40
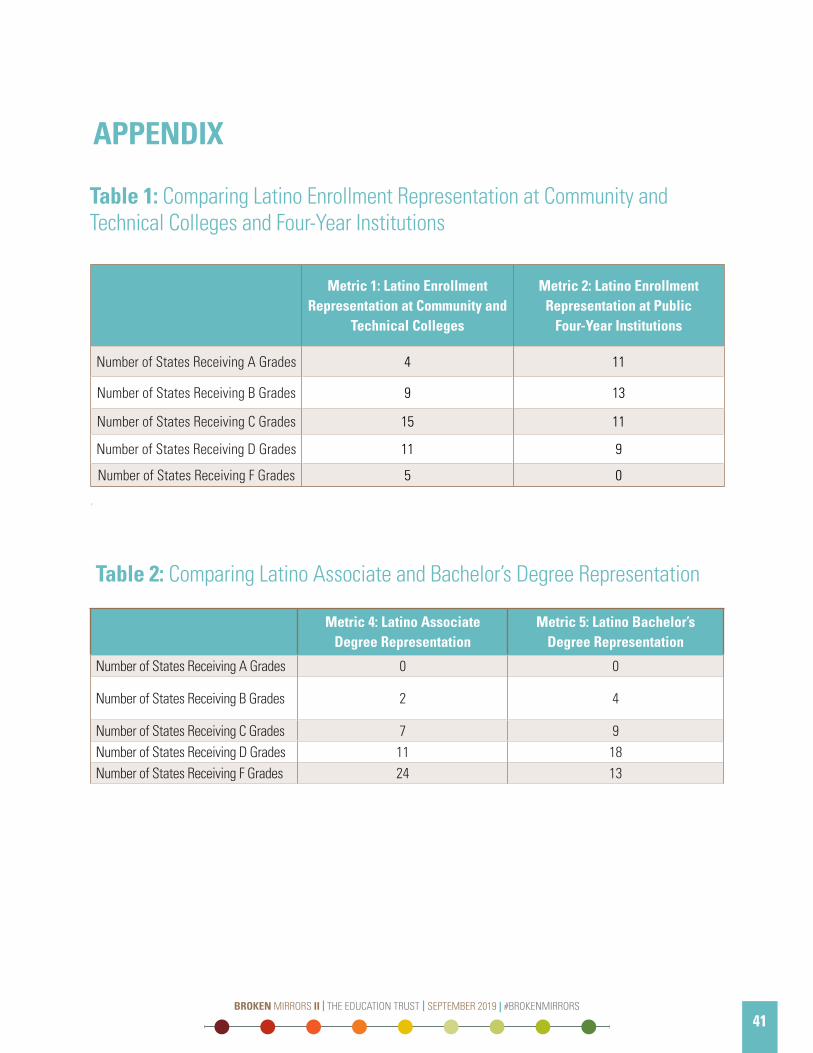
APPENDIX
Metric 1: Latino Enrollment Representation at Community and
Technical Colleges
Metric 2: Latino Enrollment Representation at Public
Four-Year Institutions
Number of States Receiving A Grades 4 11
Number of States Receiving B Grades 9 13
Number of States Receiving C Grades 15 11
Number of States Receiving D Grades 11 9
Number of States Receiving F Grades 5 0
.
Table 1: Comparing Latino Enrollment Representation at Community and Technical Colleges and Four-Year Institutions
Table 2: Comparing Latino Associate and Bachelor’s Degree Representation
Metric 4: Latino Associate Degree Representation
Metric 5: Latino Bachelor’sDegree Representation
Number of States Receiving A Grades 0 0
Number of States Receiving B Grades 2 4
Number of States Receiving C Grades 7 9Number of States Receiving D Grades 11 18Number of States Receiving F Grades 24 13
41BROKEN MIRRORS II | THE EDUCATION TRUST | SEPTEMBER 2019 | #BROKENMIRRORS
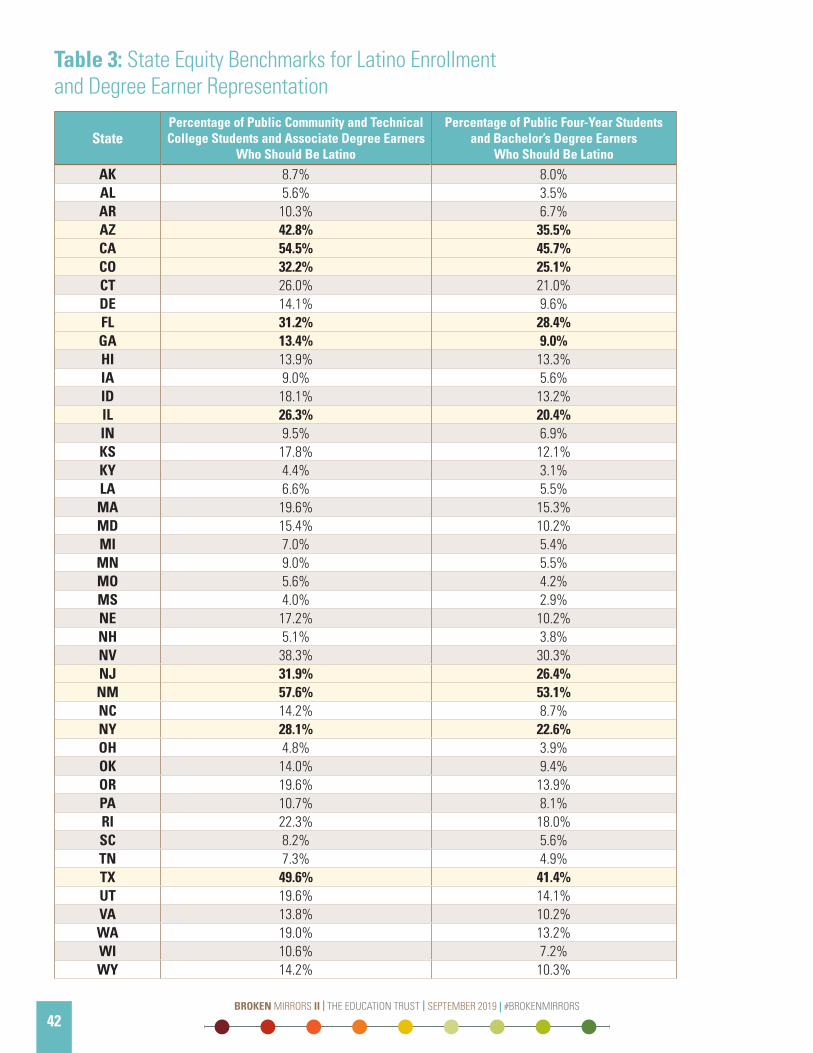
Table 3: State Equity Benchmarks for Latino Enrollment and Degree Earner Representation
StatePercentage of Public Community and Technical College Students and Associate Degree Earners
Who Should Be Latino
Percentage of Public Four-Year Students and Bachelor’s Degree Earners
Who Should Be Latino
AK 8.7% 8.0%AL 5.6% 3.5%AR 10.3% 6.7%AZ 42.8% 35.5%CA 54.5% 45.7%CO 32.2% 25.1%CT 26.0% 21.0%DE 14.1% 9.6%FL 31.2% 28.4%GA 13.4% 9.0%HI 13.9% 13.3%IA 9.0% 5.6%ID 18.1% 13.2%IL 26.3% 20.4%IN 9.5% 6.9%KS 17.8% 12.1%KY 4.4% 3.1%LA 6.6% 5.5%MA 19.6% 15.3%MD 15.4% 10.2%MI 7.0% 5.4%MN 9.0% 5.5%MO 5.6% 4.2%MS 4.0% 2.9%NE 17.2% 10.2%NH 5.1% 3.8%NV 38.3% 30.3%NJ 31.9% 26.4%NM 57.6% 53.1%NC 14.2% 8.7%NY 28.1% 22.6%OH 4.8% 3.9%OK 14.0% 9.4%OR 19.6% 13.9%PA 10.7% 8.1%RI 22.3% 18.0%SC 8.2% 5.6%TN 7.3% 4.9%TX 49.6% 41.4%UT 19.6% 14.1%VA 13.8% 10.2%WA 19.0% 13.2%WI 10.6% 7.2%WY 14.2% 10.3%
BROKEN MIRRORS II | THE EDUCATION TRUST | SEPTEMBER 2019 | #BROKENMIRRORS
43BROKEN MIRRORS II | THE EDUCATION TRUST | SEPTEMBER 2019 | #BROKENMIRRORS
42
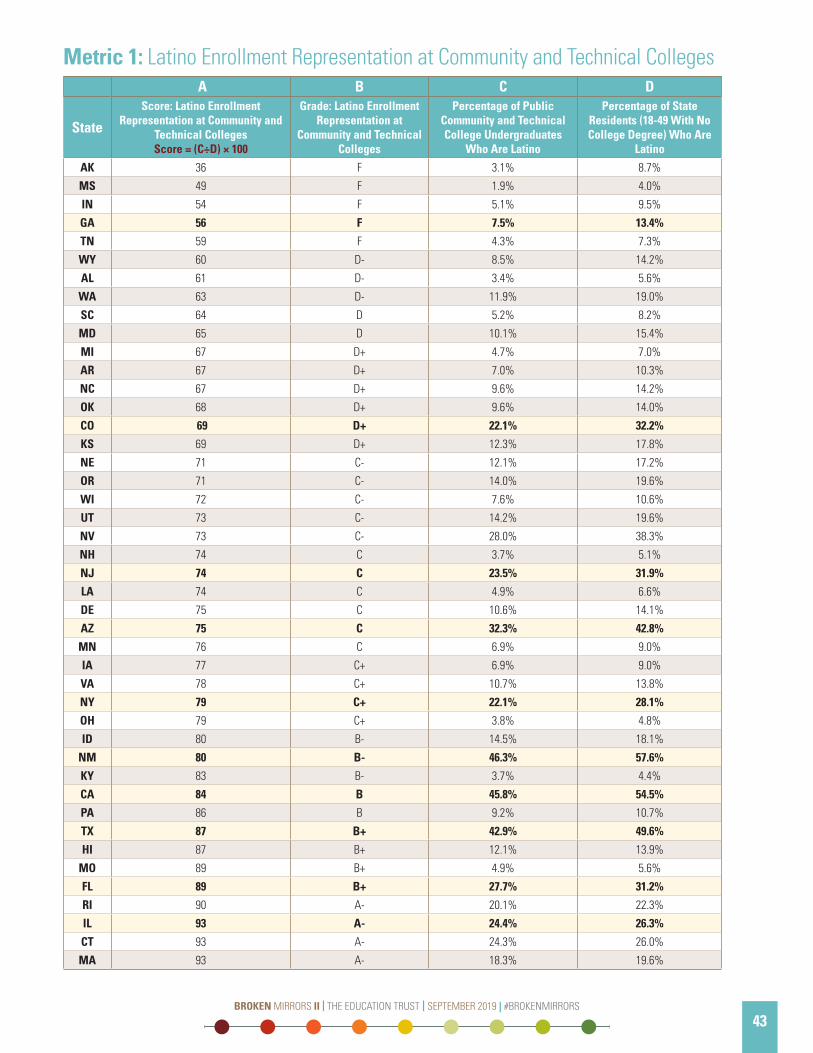
Metric 1: Latino Enrollment Representation at Community and Technical Colleges A B C D
State
Score: Latino Enrollment Representation at Community and
Technical Colleges Score = (C÷D) × 100
Grade: Latino Enrollment Representation at
Community and Technical Colleges
Percentage of Public Community and Technical College Undergraduates
Who Are Latino
Percentage of State Residents (18-49 With No College Degree) Who Are
Latino
AK 36 F 3.1% 8.7%
MS 49 F 1.9% 4.0%
IN 54 F 5.1% 9.5%
GA 56 F 7.5% 13.4%
TN 59 F 4.3% 7.3%
WY 60 D- 8.5% 14.2%
AL 61 D- 3.4% 5.6%
WA 63 D- 11.9% 19.0%
SC 64 D 5.2% 8.2%
MD 65 D 10.1% 15.4%
MI 67 D+ 4.7% 7.0%
AR 67 D+ 7.0% 10.3%
NC 67 D+ 9.6% 14.2%
OK 68 D+ 9.6% 14.0%
CO 69 D+ 22.1% 32.2%
KS 69 D+ 12.3% 17.8%
NE 71 C- 12.1% 17.2%
OR 71 C- 14.0% 19.6%
WI 72 C- 7.6% 10.6%
UT 73 C- 14.2% 19.6%
NV 73 C- 28.0% 38.3%
NH 74 C 3.7% 5.1%
NJ 74 C 23.5% 31.9%
LA 74 C 4.9% 6.6%
DE 75 C 10.6% 14.1%
AZ 75 C 32.3% 42.8%
MN 76 C 6.9% 9.0%
IA 77 C+ 6.9% 9.0%
VA 78 C+ 10.7% 13.8%
NY 79 C+ 22.1% 28.1%
OH 79 C+ 3.8% 4.8%
ID 80 B- 14.5% 18.1%
NM 80 B- 46.3% 57.6%
KY 83 B- 3.7% 4.4%
CA 84 B 45.8% 54.5%
PA 86 B 9.2% 10.7%
TX 87 B+ 42.9% 49.6%
HI 87 B+ 12.1% 13.9%
MO 89 B+ 4.9% 5.6%
FL 89 B+ 27.7% 31.2%
RI 90 A- 20.1% 22.3%
IL 93 A- 24.4% 26.3%
CT 93 A- 24.3% 26.0%
MA 93 A- 18.3% 19.6%
43BROKEN MIRRORS II | THE EDUCATION TRUST | SEPTEMBER 2019 | #BROKENMIRRORS
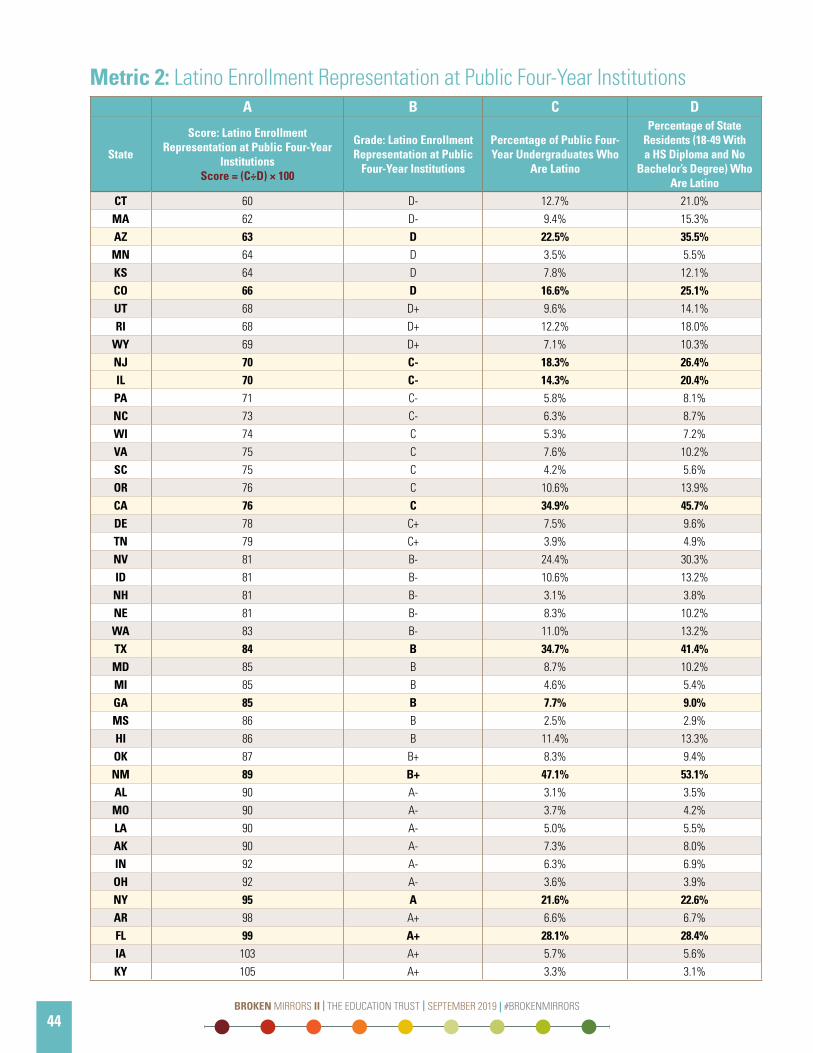
Metric 2: Latino Enrollment Representation at Public Four-Year InstitutionsA B C D
State
Score: Latino Enrollment Representation at Public Four-Year
Institutions Score = (C÷D) × 100
Grade: Latino Enrollment Representation at Public
Four-Year Institutions
Percentage of Public Four-Year Undergraduates Who
Are Latino
Percentage of State Residents (18-49 With a HS Diploma and No
Bachelor’s Degree) Who Are Latino
CT 60 D- 12.7% 21.0%MA 62 D- 9.4% 15.3%AZ 63 D 22.5% 35.5%MN 64 D 3.5% 5.5%KS 64 D 7.8% 12.1%CO 66 D 16.6% 25.1%UT 68 D+ 9.6% 14.1%RI 68 D+ 12.2% 18.0%
WY 69 D+ 7.1% 10.3%NJ 70 C- 18.3% 26.4%IL 70 C- 14.3% 20.4%PA 71 C- 5.8% 8.1%NC 73 C- 6.3% 8.7%WI 74 C 5.3% 7.2%VA 75 C 7.6% 10.2%SC 75 C 4.2% 5.6%OR 76 C 10.6% 13.9%CA 76 C 34.9% 45.7%DE 78 C+ 7.5% 9.6%TN 79 C+ 3.9% 4.9%NV 81 B- 24.4% 30.3%ID 81 B- 10.6% 13.2%NH 81 B- 3.1% 3.8%NE 81 B- 8.3% 10.2%WA 83 B- 11.0% 13.2%TX 84 B 34.7% 41.4%MD 85 B 8.7% 10.2%MI 85 B 4.6% 5.4%GA 85 B 7.7% 9.0%MS 86 B 2.5% 2.9%HI 86 B 11.4% 13.3%OK 87 B+ 8.3% 9.4%NM 89 B+ 47.1% 53.1%AL 90 A- 3.1% 3.5%MO 90 A- 3.7% 4.2%LA 90 A- 5.0% 5.5%AK 90 A- 7.3% 8.0%IN 92 A- 6.3% 6.9%OH 92 A- 3.6% 3.9%NY 95 A 21.6% 22.6%AR 98 A+ 6.6% 6.7%FL 99 A+ 28.1% 28.4%IA 103 A+ 5.7% 5.6%KY 105 A+ 3.3% 3.1%
BROKEN MIRRORS II | THE EDUCATION TRUST | SEPTEMBER 2019 | #BROKENMIRRORS
45BROKEN MIRRORS II | THE EDUCATION TRUST | SEPTEMBER 2019 | #BROKENMIRRORS
44
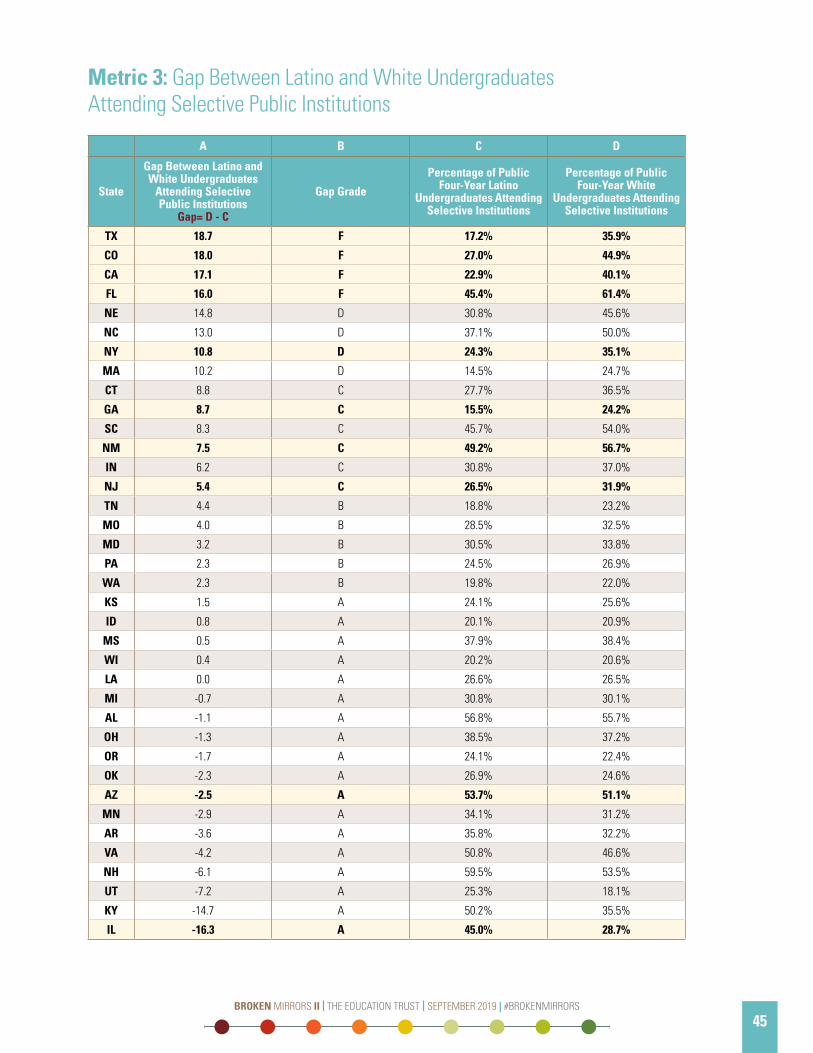
Metric 3: Gap Between Latino and White Undergraduates Attending Selective Public Institutions
A B C D
State
Gap Between Latino and White Undergraduates
Attending Selective Public Institutions
Gap= D - C
Gap Grade
Percentage of Public Four-Year Latino
Undergraduates Attending Selective Institutions
Percentage of Public Four-Year White
Undergraduates Attending Selective Institutions
TX 18.7 F 17.2% 35.9%
CO 18.0 F 27.0% 44.9%
CA 17.1 F 22.9% 40.1%
FL 16.0 F 45.4% 61.4%
NE 14.8 D 30.8% 45.6%
NC 13.0 D 37.1% 50.0%
NY 10.8 D 24.3% 35.1%
MA 10.2 D 14.5% 24.7%
CT 8.8 C 27.7% 36.5%
GA 8.7 C 15.5% 24.2%
SC 8.3 C 45.7% 54.0%
NM 7.5 C 49.2% 56.7%
IN 6.2 C 30.8% 37.0%
NJ 5.4 C 26.5% 31.9%
TN 4.4 B 18.8% 23.2%
MO 4.0 B 28.5% 32.5%
MD 3.2 B 30.5% 33.8%
PA 2.3 B 24.5% 26.9%
WA 2.3 B 19.8% 22.0%
KS 1.5 A 24.1% 25.6%
ID 0.8 A 20.1% 20.9%
MS 0.5 A 37.9% 38.4%
WI 0.4 A 20.2% 20.6%
LA 0.0 A 26.6% 26.5%
MI -0.7 A 30.8% 30.1%
AL -1.1 A 56.8% 55.7%
OH -1.3 A 38.5% 37.2%
OR -1.7 A 24.1% 22.4%
OK -2.3 A 26.9% 24.6%
AZ -2.5 A 53.7% 51.1%
MN -2.9 A 34.1% 31.2%
AR -3.6 A 35.8% 32.2%
VA -4.2 A 50.8% 46.6%
NH -6.1 A 59.5% 53.5%
UT -7.2 A 25.3% 18.1%
KY -14.7 A 50.2% 35.5%
IL -16.3 A 45.0% 28.7%
45BROKEN MIRRORS II | THE EDUCATION TRUST | SEPTEMBER 2019 | #BROKENMIRRORS
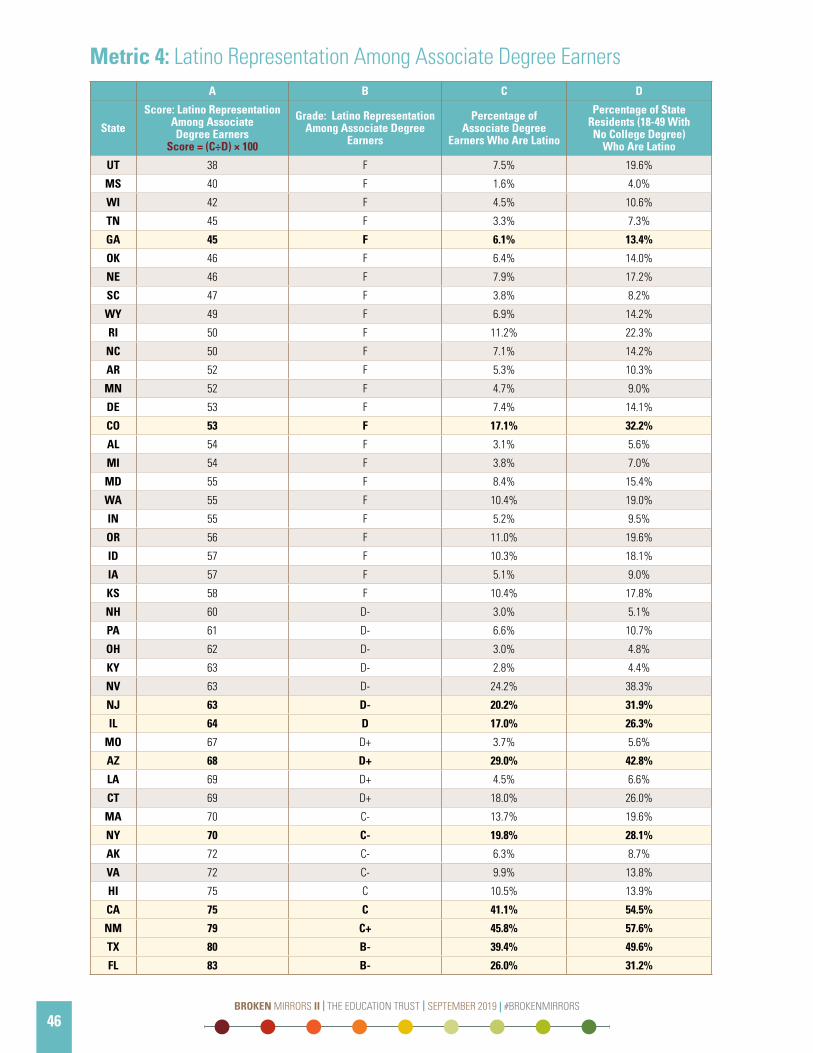
Metric 4: Latino Representation Among Associate Degree EarnersA B C D
State
Score: Latino Representation Among Associate Degree Earners
Score = (C÷D) × 100
Grade: Latino Representation Among Associate Degree
Earners
Percentage of Associate Degree
Earners Who Are Latino
Percentage of State Residents (18-49 With No College Degree)
Who Are Latino
UT 38 F 7.5% 19.6%
MS 40 F 1.6% 4.0%
WI 42 F 4.5% 10.6%
TN 45 F 3.3% 7.3%
GA 45 F 6.1% 13.4%
OK 46 F 6.4% 14.0%
NE 46 F 7.9% 17.2%
SC 47 F 3.8% 8.2%
WY 49 F 6.9% 14.2%
RI 50 F 11.2% 22.3%
NC 50 F 7.1% 14.2%
AR 52 F 5.3% 10.3%
MN 52 F 4.7% 9.0%
DE 53 F 7.4% 14.1%
CO 53 F 17.1% 32.2%
AL 54 F 3.1% 5.6%
MI 54 F 3.8% 7.0%
MD 55 F 8.4% 15.4%
WA 55 F 10.4% 19.0%
IN 55 F 5.2% 9.5%
OR 56 F 11.0% 19.6%
ID 57 F 10.3% 18.1%
IA 57 F 5.1% 9.0%
KS 58 F 10.4% 17.8%
NH 60 D- 3.0% 5.1%
PA 61 D- 6.6% 10.7%
OH 62 D- 3.0% 4.8%
KY 63 D- 2.8% 4.4%
NV 63 D- 24.2% 38.3%
NJ 63 D- 20.2% 31.9%
IL 64 D 17.0% 26.3%
MO 67 D+ 3.7% 5.6%
AZ 68 D+ 29.0% 42.8%
LA 69 D+ 4.5% 6.6%
CT 69 D+ 18.0% 26.0%
MA 70 C- 13.7% 19.6%
NY 70 C- 19.8% 28.1%
AK 72 C- 6.3% 8.7%
VA 72 C- 9.9% 13.8%
HI 75 C 10.5% 13.9%
CA 75 C 41.1% 54.5%
NM 79 C+ 45.8% 57.6%
TX 80 B- 39.4% 49.6%
FL 83 B- 26.0% 31.2%
BROKEN MIRRORS II | THE EDUCATION TRUST | SEPTEMBER 2019 | #BROKENMIRRORS
47BROKEN MIRRORS II | THE EDUCATION TRUST | SEPTEMBER 2019 | #BROKENMIRRORS
46
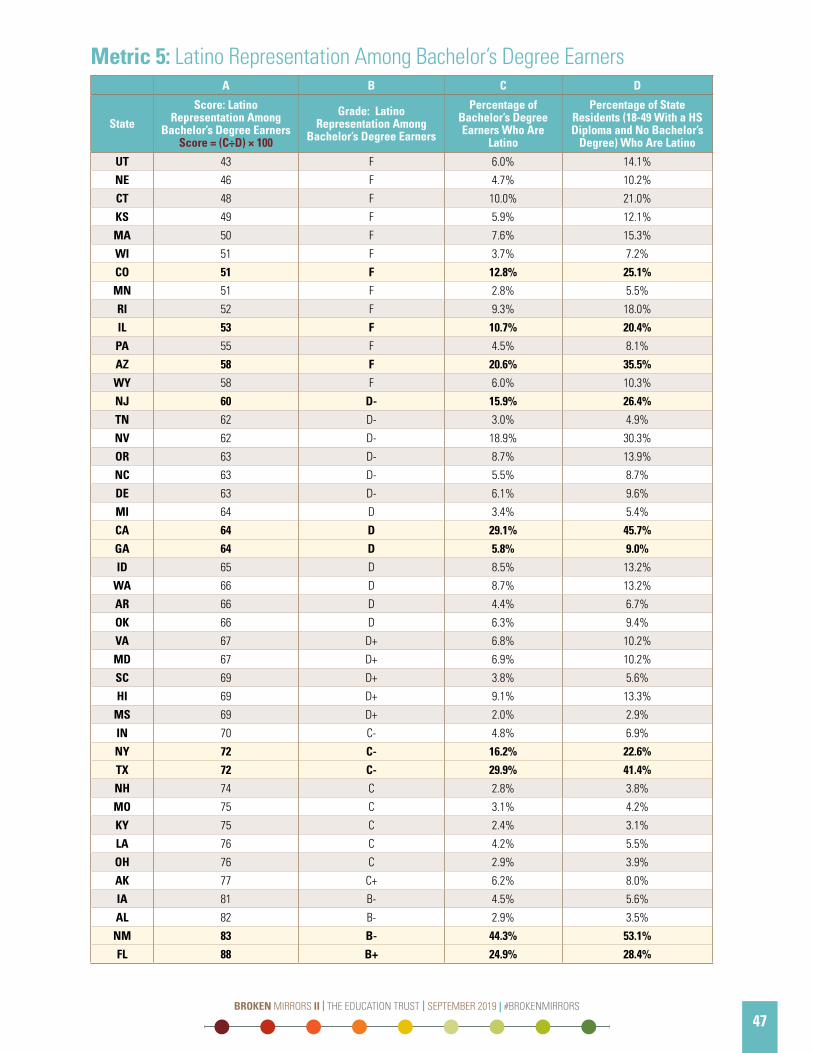
Metric 5: Latino Representation Among Bachelor’s Degree EarnersA B C D
State
Score: Latino Representation Among
Bachelor’s Degree EarnersScore = (C÷D) × 100
Grade: Latino Representation Among
Bachelor’s Degree Earners
Percentage of Bachelor’s Degree Earners Who Are
Latino
Percentage of State Residents (18-49 With a HS Diploma and No Bachelor’s
Degree) Who Are Latino
UT 43 F 6.0% 14.1%
NE 46 F 4.7% 10.2%
CT 48 F 10.0% 21.0%
KS 49 F 5.9% 12.1%
MA 50 F 7.6% 15.3%
WI 51 F 3.7% 7.2%
CO 51 F 12.8% 25.1%
MN 51 F 2.8% 5.5%
RI 52 F 9.3% 18.0%
IL 53 F 10.7% 20.4%
PA 55 F 4.5% 8.1%
AZ 58 F 20.6% 35.5%
WY 58 F 6.0% 10.3%
NJ 60 D- 15.9% 26.4%
TN 62 D- 3.0% 4.9%
NV 62 D- 18.9% 30.3%
OR 63 D- 8.7% 13.9%
NC 63 D- 5.5% 8.7%
DE 63 D- 6.1% 9.6%
MI 64 D 3.4% 5.4%
CA 64 D 29.1% 45.7%
GA 64 D 5.8% 9.0%
ID 65 D 8.5% 13.2%
WA 66 D 8.7% 13.2%
AR 66 D 4.4% 6.7%
OK 66 D 6.3% 9.4%
VA 67 D+ 6.8% 10.2%
MD 67 D+ 6.9% 10.2%
SC 69 D+ 3.8% 5.6%
HI 69 D+ 9.1% 13.3%
MS 69 D+ 2.0% 2.9%
IN 70 C- 4.8% 6.9%
NY 72 C- 16.2% 22.6%
TX 72 C- 29.9% 41.4%
NH 74 C 2.8% 3.8%
MO 75 C 3.1% 4.2%
KY 75 C 2.4% 3.1%
LA 76 C 4.2% 5.5%
OH 76 C 2.9% 3.9%
AK 77 C+ 6.2% 8.0%
IA 81 B- 4.5% 5.6%
AL 82 B- 2.9% 3.5%
NM 83 B- 44.3% 53.1%
FL 88 B+ 24.9% 28.4%
47BROKEN MIRRORS II | THE EDUCATION TRUST | SEPTEMBER 2019 | #BROKENMIRRORS
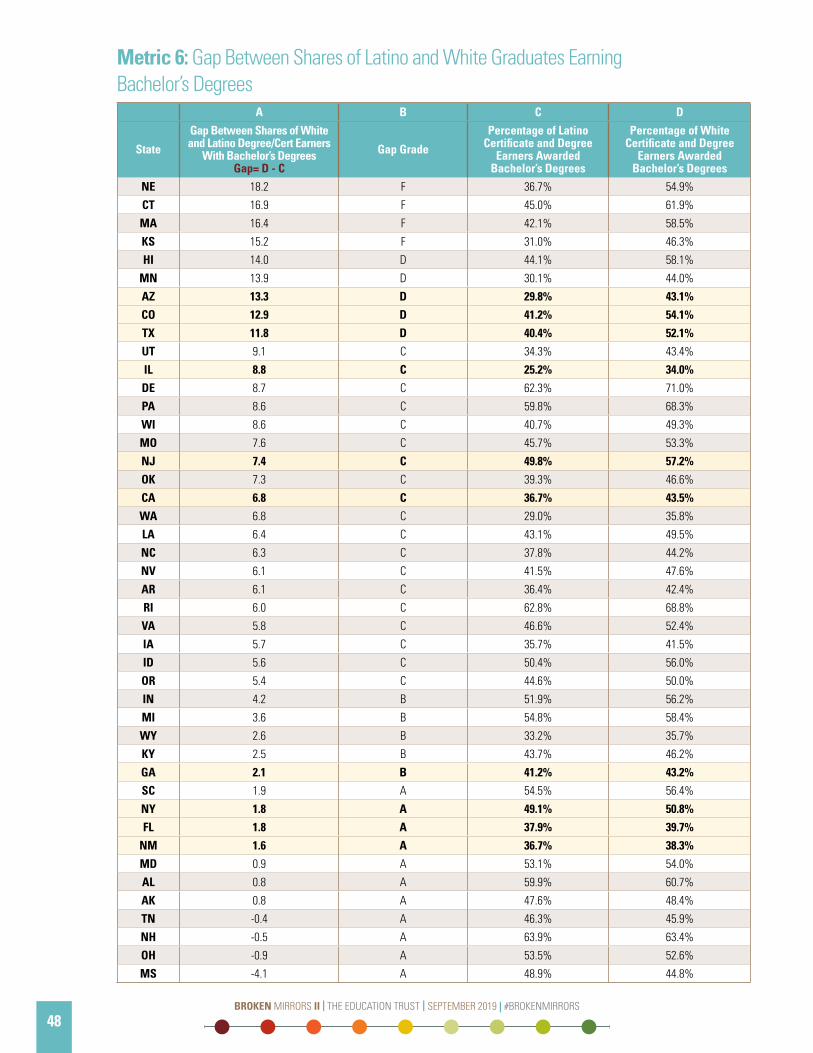
Metric 6: Gap Between Shares of Latino and White Graduates Earning Bachelor’s Degrees
A B C D
State
Gap Between Shares of White and Latino Degree/Cert Earners
With Bachelor’s Degrees Gap= D - C
Gap Grade
Percentage of Latino Certificate and Degree
Earners Awarded Bachelor’s Degrees
Percentage of White Certificate and Degree
Earners Awarded Bachelor’s Degrees
NE 18.2 F 36.7% 54.9%
CT 16.9 F 45.0% 61.9%
MA 16.4 F 42.1% 58.5%
KS 15.2 F 31.0% 46.3%
HI 14.0 D 44.1% 58.1%
MN 13.9 D 30.1% 44.0%
AZ 13.3 D 29.8% 43.1%
CO 12.9 D 41.2% 54.1%
TX 11.8 D 40.4% 52.1%
UT 9.1 C 34.3% 43.4%
IL 8.8 C 25.2% 34.0%
DE 8.7 C 62.3% 71.0%
PA 8.6 C 59.8% 68.3%
WI 8.6 C 40.7% 49.3%
MO 7.6 C 45.7% 53.3%
NJ 7.4 C 49.8% 57.2%
OK 7.3 C 39.3% 46.6%
CA 6.8 C 36.7% 43.5%
WA 6.8 C 29.0% 35.8%
LA 6.4 C 43.1% 49.5%
NC 6.3 C 37.8% 44.2%
NV 6.1 C 41.5% 47.6%
AR 6.1 C 36.4% 42.4%
RI 6.0 C 62.8% 68.8%
VA 5.8 C 46.6% 52.4%
IA 5.7 C 35.7% 41.5%
ID 5.6 C 50.4% 56.0%
OR 5.4 C 44.6% 50.0%
IN 4.2 B 51.9% 56.2%
MI 3.6 B 54.8% 58.4%
WY 2.6 B 33.2% 35.7%
KY 2.5 B 43.7% 46.2%
GA 2.1 B 41.2% 43.2%
SC 1.9 A 54.5% 56.4%
NY 1.8 A 49.1% 50.8%
FL 1.8 A 37.9% 39.7%
NM 1.6 A 36.7% 38.3%
MD 0.9 A 53.1% 54.0%
AL 0.8 A 59.9% 60.7%
AK 0.8 A 47.6% 48.4%
TN -0.4 A 46.3% 45.9%
NH -0.5 A 63.9% 63.4%
OH -0.9 A 53.5% 52.6%
MS -4.1 A 48.9% 44.8%
BROKEN MIRRORS II | THE EDUCATION TRUST | SEPTEMBER 2019 | #BROKENMIRRORS
49BROKEN MIRRORS II | THE EDUCATION TRUST | SEPTEMBER 2019 | #BROKENMIRRORS
48
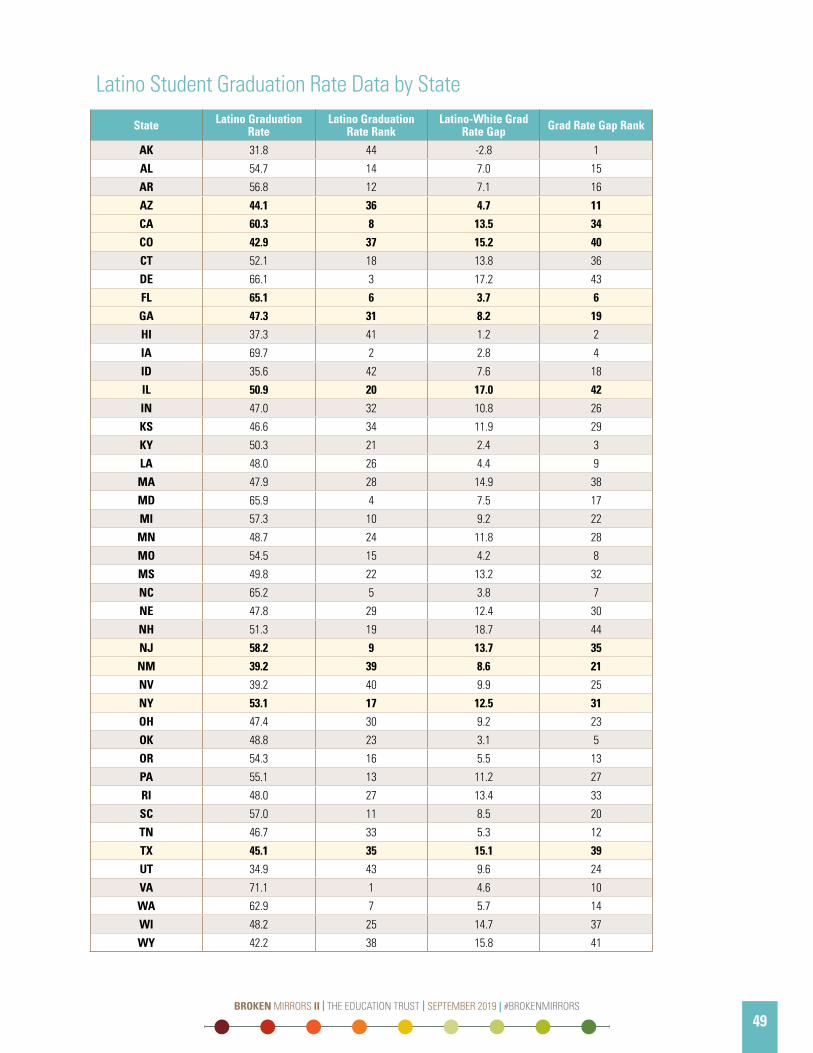
Latino Student Graduation Rate Data by State
State Latino Graduation Rate
Latino Graduation Rate Rank
Latino-White Grad Rate Gap Grad Rate Gap Rank
AK 31.8 44 -2.8 1
AL 54.7 14 7.0 15
AR 56.8 12 7.1 16
AZ 44.1 36 4.7 11
CA 60.3 8 13.5 34
CO 42.9 37 15.2 40
CT 52.1 18 13.8 36
DE 66.1 3 17.2 43
FL 65.1 6 3.7 6
GA 47.3 31 8.2 19
HI 37.3 41 1.2 2
IA 69.7 2 2.8 4
ID 35.6 42 7.6 18
IL 50.9 20 17.0 42
IN 47.0 32 10.8 26
KS 46.6 34 11.9 29
KY 50.3 21 2.4 3
LA 48.0 26 4.4 9
MA 47.9 28 14.9 38
MD 65.9 4 7.5 17
MI 57.3 10 9.2 22
MN 48.7 24 11.8 28
MO 54.5 15 4.2 8
MS 49.8 22 13.2 32
NC 65.2 5 3.8 7
NE 47.8 29 12.4 30
NH 51.3 19 18.7 44
NJ 58.2 9 13.7 35
NM 39.2 39 8.6 21
NV 39.2 40 9.9 25
NY 53.1 17 12.5 31
OH 47.4 30 9.2 23
OK 48.8 23 3.1 5
OR 54.3 16 5.5 13
PA 55.1 13 11.2 27
RI 48.0 27 13.4 33
SC 57.0 11 8.5 20
TN 46.7 33 5.3 12
TX 45.1 35 15.1 39
UT 34.9 43 9.6 24
VA 71.1 1 4.6 10
WA 62.9 7 5.7 14
WI 48.2 25 14.7 37
WY 42.2 38 15.8 41
49BROKEN MIRRORS II | THE EDUCATION TRUST | SEPTEMBER 2019 | #BROKENMIRRORS
Selective Public Four-Year Institutions Used for Metric No. 3 Gap Between Latino and White Undergraduates Attending Selective Public InstitutionsAL: Auburn University (100858), The University of Alabama (100751), University of Alabama in Huntsville (100706), AR: University of Arkansas (106397), Arizona State University-Tempe (104151), AZ: University of Arizona (104179),
CA: Cal Poly-San Luis Obispo (110422), University of California-Berkeley (110635), University of California-Davis (110644), University of California-Irvine (110653), University of California-Los Angeles (110662), University of California-Riverside (110671), University of California-San Diego (110680), University of California-Santa Barbara (110705), University of California-Santa Cruz (110714), CO: Colorado School of Mines (126775), Colorado State University-Fort Collins (126818), University of Colorado Boulder (126614), CT: University of Connecticut (129020),
FL: Florida State University (134097), New College of Florida (262129), University of Florida (134130), University of Central Florida (132903), University of South Florida-Main Campus (137351),
GA: Georgia Institute of Technology-Main Campus (139755), University of Georgia (139959),
ID: University of Idaho (142285), IL: University of Illinois at Chicago (145600), University of Illinois at Urbana-Champaign (145637), IN: Indiana University-Bloomington (151351), Purdue University-Main Campus (243780),
KS: University of Kansas (55317), KY: University of Kentucky (157085), University of Louisville (157289),
LA: Louisiana State University (159391),
MA: University of Massachusetts-Amherst (166629), MD: St Mary’s College of Maryland (163912), University of Maryland-Baltimore County (163268), University of Maryland-College Park (163286), MI: Michigan State University (171100), Michigan Technological University (171128), University of Michigan-Ann Arbor (170976), MN: University of Minnesota-Morris (174251), University of Minnesota-Twin Cities (174066), MO: Missouri University of Science and Technology (178411), Truman State University (178615), University of Missouri-Columbia (178396), MS: University of Mississippi (176017),
NC: Appalachian State University (197869), North Carolina State University at Raleigh (199193), University of North Carolina at Chapel Hill (199120), University of North Carolina Wilmington (199218), NE: University of Nebraska-Lincoln (181464), NH: University of New Hampshire (183044), NJ: New Jersey Institute of Technology (185828), Rutgers University-New Brunswick (186380), The College of New Jersey (187134), NM: New Mexico Institute of Mining and Technology (187967), University of New Mexico-Main Campus (187985), NY: CUNY Bernard M Baruch College (190512), CUNY Hunter College (190594), Stony Brook University (196097), SUNY at Albany (196060), SUNY at Binghamton (196079), SUNY College at Geneseo (196167), SUNY College of Environmental Science and Forestry (196103), University at Buffalo (196088),
OH: Miami University-Oxford (204024), Ohio State University-Main Campus (204796), University of Cincinnati-Main Campus (201885), OK: University of Oklahoma-Norman Campus (207500), OR: University of Oregon (209551),
PA: Pennsylvania State University-Main Campus (214777), University of Pittsburgh-Pittsburgh Campus (215293),
SC: Clemson University (217882), University of South Carolina-Columbia (218663),
TN: The University of Tennessee-Knoxville (221759), TX: Texas A & M University-College Station (228723), Texas Tech University (229115), The University of Texas at Austin (228778), The University of Texas at Dallas (228787),
UT: University of Utah (230764),
VA: Christopher Newport University (231712), College of William and Mary (231624), George Mason University (232186), University of Virginia-Main Campus (234076), Virginia Polytechnic Institute and State University (233921),
WA: University of Washington-Seattle Campus (236948), WI: University of Wisconsin-Madison (240444).
BROKEN MIRRORS II | THE EDUCATION TRUST | SEPTEMBER 2019 | #BROKENMIRRORS
51BROKEN MIRRORS II | THE EDUCATION TRUST | SEPTEMBER 2019 | #BROKENMIRRORS
50
ENDNOTES1: A Stronger Nation: Learning Beyond High School Builds
American Talent, “Exploring Race and Ethnicity.”
2. Carnevale et al., “Recovery: Job Growth and Education Requirements Through 2020.”
3. William H. Frey, “The US Will Become ‘Minority White’ in 2045, Census Projects: Youthful Minorities Are the Engine of Future Growth” (Washington, D.C., Brookings Institution), https://www.brookings.edu/blog/the-avenue/2018/03/14/the-us-will-become-minority-white-in-2045-census-projects/.
4. A Stronger Nation: Learning Beyond High School Builds American Talent, “Exploring Race and Ethnicity.”
5. J. Oliver Schak and Andrew H. Nichols, “Degree Attainment for Latino Adults: National and State Trends” (Washington D.C.: The Education Trust, 2018), https://edtrust.org/wp-content/uploads/2014/09/Latino-Degree-Attainment_FINAL_4-1.pdf.
6. Jeffrey F. Milem, Mitchell J. Chang, and Anthony Lising Antonio, “Making Diversity Work on Campus: A Research-Based Perspective” (Washington D.C.: American Colleges and Universities, 2005), https://www.aacu.org/sites/default/files/files/mei/MakingDiversityWork.pdf.
7. Andrew H. Nichols, “A Look at Latino Student Success” (Washington, DC: The Education Trust, 2017), https://s3-us-east-2.amazonaws.com/edtrustmain/wp-content/uploads/2018/10/02135855/Latino_Success_Report_Final_HR.pdf.
8. Schak and Nichols, “Degree Attainment for Latino Adults: National and State Trends.”
9. Jeremy Ashkenas, Haeyoun Park, and Adam Pearce, “Even With Affirmative Action, Blacks and Hispanics Are More Underrepresented at Top Colleges Than 35 Years Ago,” The New York Times, August 24, 2017, https://www.nytimes.com/interactive/2017/08/24/us/affirmative-action.html.
10. Excelencia in Education, “Hispanic-Serving Institutions (HSIs): 2016-2017” (Washington D.C.: Excelencia in Education, 2018), https://www.edexcelencia.org/research/data/hispanic-serving-institutions-hsis-2016-2017.
11. Schak and Nichols, “Degree Attainment for Latino Adults: National and State Trends.”
12. Digest of Education Statistics, “Tables 326.10 and 326.20” (Washington D.C.: National Center for Education Statistics, 2017).
13. Milem, Chang, and Antonio, “Making Diversity Work on Campus: A Research-Based Perspective.”
14. Sean Reardon, et al., “Can Socioeconomic Status Substitute for Race in Affirmative Action College Admissions Policies? Evidence from a Simulation Model,” (Educational Testing Service, 2015); Catherine Horn and Stella Flores, “Percent Plans in College Admissions: A Comparative Analyst of Three States’ Experiences,” Cambridge, MA; (The Civil Rights Project at Harvard University, 2003); Jessica Howell, “Assessing the Impact of Eliminative Affirmative Action in Higher Education,” Journal of Labor Economics 28 (October 2009): 1-58.
15. Nichols, “A Look at Latino Student Success.”
16. Eileen Patten, “The Nation’s Latino Population Is Defined by Its Youth,” Hispanic Trends, Pew Research Center, April 20, 2016, https://www.pewhispanic.org/2016/04/20/the-nations-latino-population-is-defined-by-its-youth/.
17. J. Oliver Schak, “Degree Attainment of Latinos Lags Far Behind That of Whites,” Equity Lens, The Education Trust, April 1, 2019, https://edtrust.org/resource/degree-attainment-of-latinos-lags-far-behind-that-of-whites/; Mark Hugo Lopez, Ana Gonzalez-Barrera, and Jens Manuel Krogstad, “More Latinos Have Serious Concerns About Their Place in America Under Trump,” Pew Research Center, October 25, 2018, https://www.pewhispanic.org/2018/10/25/more-latinos-have-serious-concerns-about-their-place-in-america-under-trump/.
18. Martin Carnoy and Emma Garcia, “Five Key Trends in U.S. Student Performance” (Washington D.C.: The Economic Policy Institute, 2017), https://www.epi.org/files/pdf/113217.pdf.
19. Jenny DeMonte and Robert Hanna, “Looking at the Best Teachers and Who They Teach” (Washington D.C.: Center for American Progress, 2014), https://www.americanprogress.org/wp-content/uploads/2014/04/TeacherDistributionBrief1.pdf; Civil Rights Data Collection, Data Snapshot: Teacher Equity, Issue Brief No. 4 (Washington, D.C.: U.S. Department of Education Office for Civil Rights, March 2014), https://www2.ed.gov/about/offices/list/ocr/docs/crdc-teacher-equity-snapshot.pdf.
20. U.S. Department of Education, Office for Civil Rights, “STEM Course Taking: Data Highlights on Science, Technology, Engineering, and Mathematics Course Taking in Our Nation’s Public Schools,” Civil Rights Data Collection (Washington D.C.: U.S. Department of Education, 2018), https://www2.ed.gov/about/offices/list/ocr/docs/stem-course-taking.pdf.
21. Seth Gershenson, Stephen B. Holt, and Nicholas Papageorge, “Who Believes in Me? The Effect of Student-Teacher Demographic Match on Teacher Expectations,” Economics Education Review 52 (June 2016): 209-224.
51BROKEN MIRRORS II | THE EDUCATION TRUST | SEPTEMBER 2019 | #BROKENMIRRORS
22. Ivy Morgan and Ary Amerikaner, “Funding Gaps 2018” (Washington, D.C.: The Education Trust, February 27, 2018), https://edtrust.org/resource/funding-gaps-2018/.
23 Angela Hanks, Danyelle Solomon, and Christian E. Weller, “Systematic Inequality: How America’s Structural Racism Helped Create the Black-White Wealth Gap,” (Washington, D.C.: Center for American Progress, 2018), https://www.americanprogress.org/issues/race/reports/2018/02/21/447051/systematic-inequality/.
24. Schak and Nichols, “Degree Attainment for Latino Adults: National and State Trends.”
25. Schak and Nichols, “Degree Attainment for Latino Adults: National and State Trends.”
26. U.S. Department of Education, “Advancing Diversity and Inclusion in Higher Education,” Office of Planning, Evaluation and Policy Development and Office of the Under Secretary (Washington D.C.:, U.S. Department of Education, 2016), https://www2.ed.gov/rschstat/research/pubs/advancing-diversity-inclusion.pdf.
27. Melissa Clinedinst and Anna-Maria Koranteng, “2017 State of College Admission” (Washington D.C.: National Association for College Admission Counseling, 2017), https://www.nacacnet.org/globalassets/documents/publications/research/soca17final.pdf.
28. Halley Potter, “What Can We Learn From States That Ban Affirmative Action?” (Commentary, The Century Foundation, June 26, 2014), https://tcf.org/content/commentary/what-can-we-learn-from-states-that-ban-affirmative-action/.
29. Shapiro et al., “Completing College: A National View of Student Completion Rates – Fall 2011 Cohort.”
30. Sara Garcia, “Gaps in College Spending Shortchange Students of Color” (Washington D.C.: Center for American Progress, 2018), https://cdn.americanprogress.org/content/uploads/2018/04/03090823/Gaps-in-College-Spending-brief.pdf; CJ Libassi, “The Neglected College Race Gap: Race Disparities Among College Completers” (Washington D.C.: Center for American Progress, 2018), https://cdn.americanprogress.org/content/uploads/2018/05/22135501/CollegeCompletions-Brief1.pdf.
31. U.S. Department of Education, “Developmental Education: Challenges and Strategies for Reform,” NCES 2016-405, (Washington D.C.: U.S. Department of Education, 2016); Complete College America, Corequisite Remediation: Spanning the Completion Divide, https://completecollege.org/spanningthedivide/.
32. U.S. Department of Labor, Bureau of Labor Statistics, Employment Projections, https://www.bls.gov/emp/tables/unemployment-earnings-education.htm; Jennifer Ma, Matea Pender, and Meredith Welch, “Education Pays 2016,” Trends in Higher Education Series, (Washington, D.C.: College Board, 2016), https://trends.collegeboard.org/sites/default/files/education-pays-2016-full-report.pdf.
33. Schak and Nichols, “Degree Attainment for Latino Adults: National and State Trends.”
34. Note that percentage point gap does not equal the difference in the Latino and White percentages due to rounding.
35. Schak and Nichols, “Degree Attainment for Latino Adults: National and State Trends.”
36. Schak and Nichols, “Degree Attainment for Latino Adults: National and State Trends.”
37. Digest of Education Statistics, “Table 326.10,” (Washington, D.C.: National Center for Education Statistics, 2017), https://nces.ed.gov/programs/digest/d17/tables/dt17_326.10.asp.
38. Benchmark excludes residents with either an associate or bachelor’s.
39. Anthony Carnevale, Stephen J. Rose, and Andrew R. Hanson, “Certificates: Gateway to Gainful Employment and College Degrees,” Center on Education and the Workforce, (Washington, D.C.: Georgetown University, 2012), https://cew.georgetown.edu/wp-content/uploads/2014/11/Certificates.FullReport.061812.pdf.
40. Ben Miller, “New Federal Data Show a Student Loan Crisis for African American Borrowers,” Center for American Progress: Postsecondary Education, October 16, 2017, https://www.americanprogress.org/issues/education-postsecondary/news/2017/10/16/440711/new-federal-data-show-student-loan-crisis-african-american-borrowers/.
41. Carnevale et al., “Certificates: Gateway to Gainful Employment and College Degrees.”
BROKEN MIRRORS II | THE EDUCATION TRUST | SEPTEMBER 2019 | #BROKENMIRRORS
53BROKEN MIRRORS II | THE EDUCATION TRUST | SEPTEMBER 2019 | #BROKENMIRRORS
52
53BROKEN MIRRORS II | THE EDUCATION TRUST | SEPTEMBER 2019 | #BROKENMIRRORS
BROKEN MIRRORS II | THE EDUCATION TRUST | SEPTEMBER 2019 | #BROKENMIRRORS
PBBROKEN MIRRORS II | THE EDUCATION TRUST | SEPTEMBER 2019 | #BROKENMIRRORS
54
ABOUT THE EDUCATION TRUST
The Education Trust is a national nonprofit that works to close opportunity gaps that disproportionately affect students of color and students from low-income families. Through our research and advocacy, Ed Trust supports efforts that expand excellence and equity in education from preschool through college; increase college access and completion, particularly for historically underserved students; engage diverse communities dedicated to education equity; and increase political and public will to act on equity issues.
ACKNOWLEDGMENTS This publication was supported by Lumina Foundation.
Lumina Foundation is an independent, private foundation in Indianapolis that is committed to making opportunities for learning beyond high school available to all. The foundation envisions a system that is easy to navigate, delivers fair results, and meets the nation’s need for talent through a broad range of credentials. Lumina’s goal is to prepare people for informed citizenship and for success in a global economy.
The views expressed in this publication are those of the authors and do not necessarily represent those of Lumina Foundation, its officers or employees.
V/EdTrust B/EdTrust D/EdTrust A@EdTrust
www.EdTrust.org