british columbia hydro and power authority
TRANSCRIPT
British Columbia Hydro and Power Authority
2020/21
FIRST QUARTER REPORT
British Columbia Hydro and Power Authority
2020/21 – First Quarter Report 2
Management’s Discussion and Analysis
This Management’s Discussion and Analysis (MD&A) reports on British Columbia Hydro and Power Authority’s (BC Hydro or the Company) consolidated results and financial position for the three months ended June 30, 2020 and should be read in conjunction with the MD&A presented in the 2019/20 Annual Service Plan Report, the 2019/20 Audited Consolidated Financial Statements and related notes of the Company, and the Unaudited Condensed Consolidated Interim Financial Statements and related notes of the Company for the three months ended June 30, 2020. All financial information is expressed in Canadian dollars unless otherwise specified. This report contains forward-looking statements, including statements regarding the business and anticipated financial performance of the Company. These statements are subject to a number of risks and uncertainties that may cause actual results to differ from those contemplated in the forward-looking statements. Highlights
• Net income for the three months ended June 30, 2020 was $6 million, $19 million lower than the
same period in the prior fiscal year.
• COVID-19 had a large impact on BC Hydro’s financial results for the three months ended June 30, 2020. The most significant impact was seen in domestic revenues where there was a decrease of $97 million (or 8 per cent) compared to the same period in the prior fiscal year. The decrease in revenue was due to a combination of lower domestic customer demand for electricity primarily due to COVID-19 (4 per cent lower compared to the same period in the prior fiscal year and 7 per cent lower than plan), BC Hydro’s COVID-19 relief programs which were introduced on April 2, 2020 and provided $38 million in bill reductions to residential and commercial customers during the quarter, and lower average rates that reflect the 1.01 per cent interim rate decrease as approved by the British Columbia Utilities Commission (BCUC) effective April 1, 2020. Variances in revenues compared to plan are deferred to regulatory accounts and will be recovered from ratepayers in the future. There continues to be a high degree of uncertainty with respect to the future impacts of COVID-19 and the financial impacts to BC Hydro. The impacts will depend on the speed and nature of both the near-term economic downturn caused by COVID-19, and the mid-to-long-term recovery and lasting effects.
• Capital expenditures, before contributions in aid of construction, for the three months ended June 30, 2020 were $698 million, a $73 million increase over the same period in the prior fiscal year. The increase in capital expenditures was primarily due to higher Site C Project and Distribution capital expenditures due to higher volumes of customer driven work. This was partially offset by a decrease in Transmission lines and substation replacements and expansion expenditures primarily due to lower Peace Region Electricity Supply (PRES) construction and lower Transmission Wood Structure and Framing program work. BC Hydro continues to invest significantly in capital projects/programs to upgrade its existing assets and build new infrastructure, including the Site C Project, Bridge River 2 Upgrade Units 7 and 8, PRES, LNG Canada Load Interconnection, and Distribution Wood Poles Replacements.
British Columbia Hydro and Power Authority
2020/21 – First Quarter Report 3
Consolidated Results of Operations
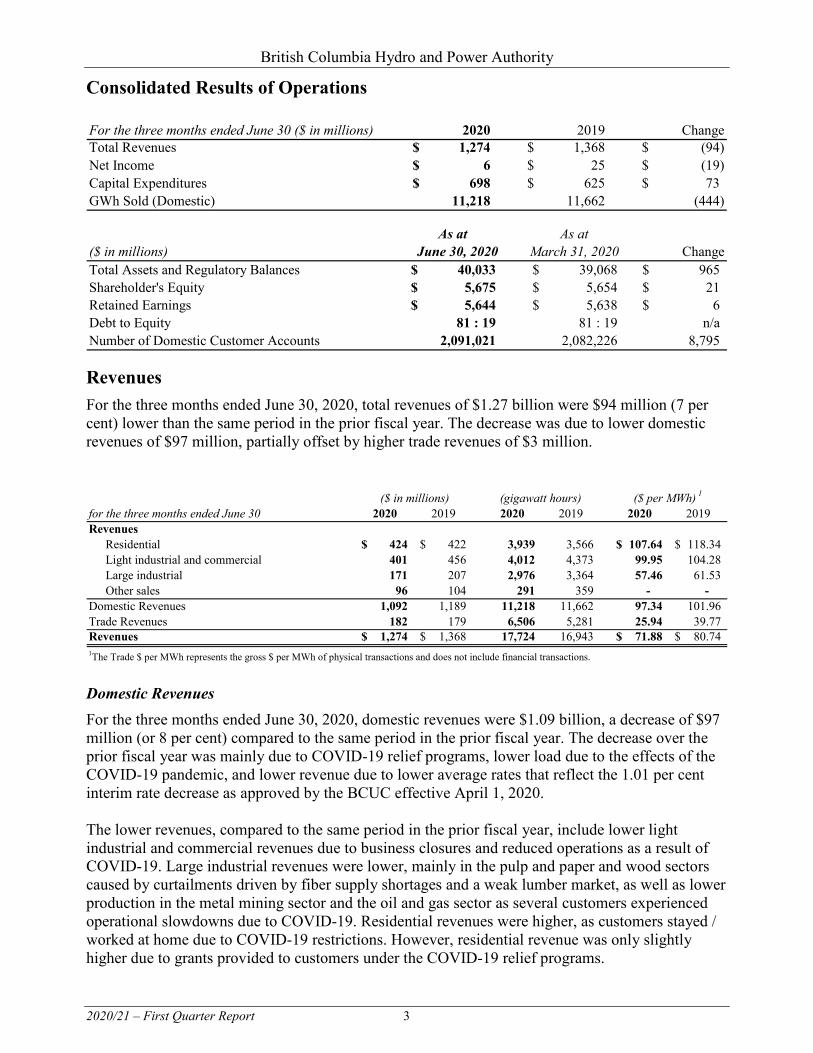
Revenues For the three months ended June 30, 2020, total revenues of $1.27 billion were $94 million (7 per cent) lower than the same period in the prior fiscal year. The decrease was due to lower domestic revenues of $97 million, partially offset by higher trade revenues of $3 million.
Domestic Revenues For the three months ended June 30, 2020, domestic revenues were $1.09 billion, a decrease of $97 million (or 8 per cent) compared to the same period in the prior fiscal year. The decrease over the prior fiscal year was mainly due to COVID-19 relief programs, lower load due to the effects of the COVID-19 pandemic, and lower revenue due to lower average rates that reflect the 1.01 per cent interim rate decrease as approved by the BCUC effective April 1, 2020. The lower revenues, compared to the same period in the prior fiscal year, include lower light industrial and commercial revenues due to business closures and reduced operations as a result of COVID-19. Large industrial revenues were lower, mainly in the pulp and paper and wood sectors caused by curtailments driven by fiber supply shortages and a weak lumber market, as well as lower production in the metal mining sector and the oil and gas sector as several customers experienced operational slowdowns due to COVID-19. Residential revenues were higher, as customers stayed / worked at home due to COVID-19 restrictions. However, residential revenue was only slightly higher due to grants provided to customers under the COVID-19 relief programs.
For the three months ended June 30 ($ in millions) 2020 2019 ChangeTotal Revenues 1,274$ 1,368$ (94)$ Net Income 6$ 25$ (19)$ Capital Expenditures 698$ 625$ 73$ GWh Sold (Domestic) 11,218 11,662 (444)
As at As at($ in millions) June 30, 2020 March 31, 2020 ChangeTotal Assets and Regulatory Balances 40,033$ 39,068$ 965$ Shareholder's Equity 5,675$ 5,654$ 21$ Retained Earnings 5,644$ 5,638$ 6$ Debt to Equity 81 : 19 81 : 19 n/aNumber of Domestic Customer Accounts 2,091,021 2,082,226 8,795
for the three months ended June 30 2020 2019 2020 2019 2020 2019Revenues
Residential 424$ 422$ 3,939 3,566 107.64$ 118.34$ Light industrial and commercial 401 456 4,012 4,373 99.95 104.28Large industrial 171 207 2,976 3,364 57.46 61.53Other sales 96 104 291 359 - -
Domestic Revenues 1,092 1,189 11,218 11,662 97.34 101.96Trade Revenues 182 179 6,506 5,281 25.94 39.77 Revenues 1,274$ 1,368$ 17,724 16,943 71.88$ 80.74$
($ in millions) (gigawatt hours) ($ per MWh) 1
1The Trade $ per MWh represents the gross $ per MWh of physical transactions and does not include financial transactions.
British Columbia Hydro and Power Authority
2020/21 – First Quarter Report 4
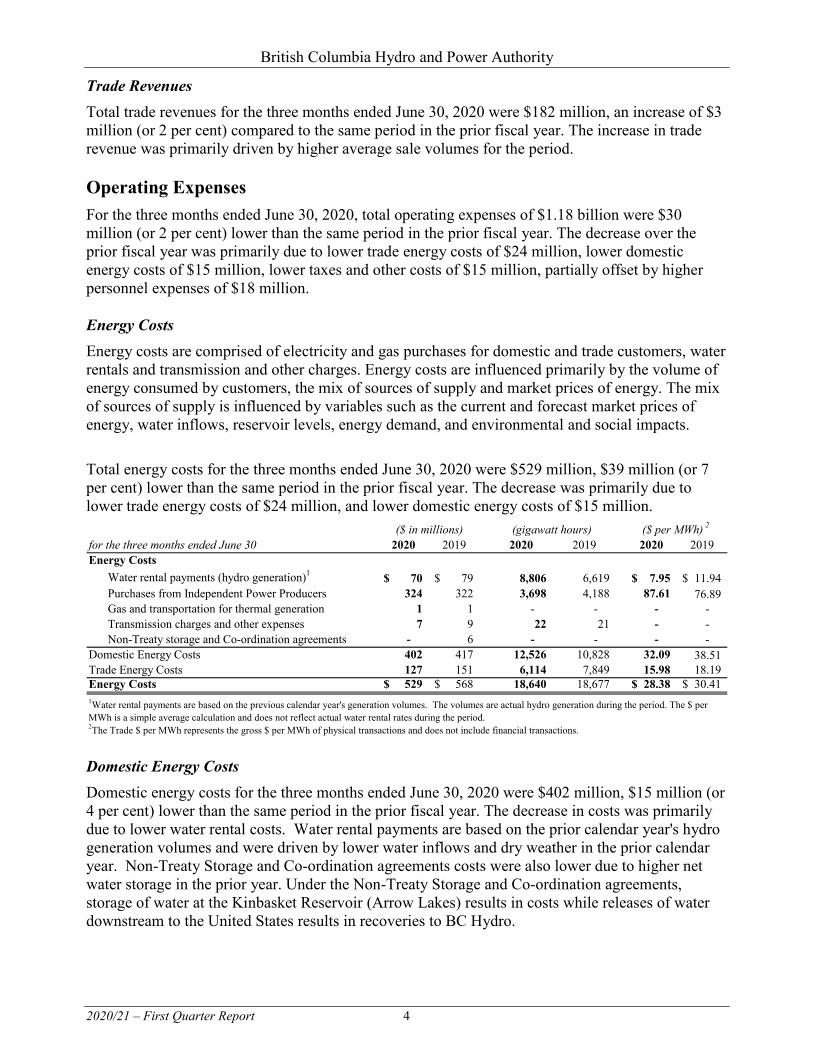
Trade Revenues Total trade revenues for the three months ended June 30, 2020 were $182 million, an increase of $3 million (or 2 per cent) compared to the same period in the prior fiscal year. The increase in trade revenue was primarily driven by higher average sale volumes for the period. Operating Expenses For the three months ended June 30, 2020, total operating expenses of $1.18 billion were $30 million (or 2 per cent) lower than the same period in the prior fiscal year. The decrease over the prior fiscal year was primarily due to lower trade energy costs of $24 million, lower domestic energy costs of $15 million, lower taxes and other costs of $15 million, partially offset by higher personnel expenses of $18 million. Energy Costs Energy costs are comprised of electricity and gas purchases for domestic and trade customers, water rentals and transmission and other charges. Energy costs are influenced primarily by the volume of energy consumed by customers, the mix of sources of supply and market prices of energy. The mix of sources of supply is influenced by variables such as the current and forecast market prices of energy, water inflows, reservoir levels, energy demand, and environmental and social impacts. Total energy costs for the three months ended June 30, 2020 were $529 million, $39 million (or 7 per cent) lower than the same period in the prior fiscal year. The decrease was primarily due to lower trade energy costs of $24 million, and lower domestic energy costs of $15 million.
Domestic Energy Costs Domestic energy costs for the three months ended June 30, 2020 were $402 million, $15 million (or 4 per cent) lower than the same period in the prior fiscal year. The decrease in costs was primarily due to lower water rental costs. Water rental payments are based on the prior calendar year's hydro generation volumes and were driven by lower water inflows and dry weather in the prior calendar year. Non-Treaty Storage and Co-ordination agreements costs were also lower due to higher net water storage in the prior year. Under the Non-Treaty Storage and Co-ordination agreements, storage of water at the Kinbasket Reservoir (Arrow Lakes) results in costs while releases of water downstream to the United States results in recoveries to BC Hydro.
for the three months ended June 30 2020 2019 2020 2019 2020 2019Energy Costs
Water rental payments (hydro generation)1 70$ 79$ 8,806 6,619 7.95$ 11.94$ Purchases from Independent Power Producers 324 322 3,698 4,188 87.61 76.89Gas and transportation for thermal generation 1 1 - - - - Transmission charges and other expenses 7 9 22 21 - - Non-Treaty storage and Co-ordination agreements - 6 - - - -
Domestic Energy Costs 402 417 12,526 10,828 32.09 38.51Trade Energy Costs 127 151 6,114 7,849 15.98 18.19 Energy Costs 529$ 568$ 18,640 18,677 28.38$ 30.41$ 1Water rental payments are based on the previous calendar year's generation volumes. The volumes are actual hydro generation during the period. The $ per MWh is a simple average calculation and does not reflect actual water rental rates during the period.2The Trade $ per MWh represents the gross $ per MWh of physical transactions and does not include financial transactions.
($ in millions) (gigawatt hours) ($ per MWh) 2
British Columbia Hydro and Power Authority
2020/21 – First Quarter Report 5
Trade Energy Costs Total trade energy costs for the three months ended June 30, 2020 were $127 million, $24 million (or 16 per cent) lower than the same period in the prior fiscal year. The decrease in trade energy costs was primarily driven by lower volumes and lower average purchase prices. Water Inflows and Reservoir Storage Water inflows (energy equivalent) to the system for the three months ended June 30, 2020 were above average and higher than the same period in the prior fiscal year. The above average water inflows during the three months ending June 30, 2020 were due to above average snowmelt in both the Kinbasket (Columbia River basin) and Williston (Peace River basin) Reservoirs and above average precipitation to the Columbia basin in June.
System energy storage, previously below average, is tracking near the ten year historic average due to above average inflows. System energy storage at June 30, 2020 was higher than at June 30, 2019. Personnel Expenses Personnel expenses include salaries and wages, benefits and post-employment benefits. Personnel expenses for the three months ended June 30, 2020 were $196 million, $18 million (or 10 per cent) higher than the same period in the prior fiscal year primarily due to impacts caused by COVID-19, including less time off taken and lower capitalization of personnel expenses as some employees were unable to charge their time to capital projects as this work wasn’t able to be done. Materials and External Services Materials and External Services primarily include materials, supplies, and contractor fees. Materials and external services for the three months ended June 30, 2020 were $135 million, comparable to the $139 million in the prior fiscal year. Amortization and Depreciation Amortization and depreciation expense includes the depreciation of property, plant and equipment, amortization of intangible assets, and depreciation of right-of-use assets. Amortization and depreciation expense for the three months ended June 30, 2020 was $249 million, $8 million (3 per cent) higher than the same period in the prior fiscal year primarily due to additional property, plant and equipment placed in service. Grants, Taxes and Other Costs The Company is a Crown corporation and therefore no Canadian provincial or federal income tax is payable. However, the Company pays provincial and local government taxes and grants in lieu of property taxes to municipalities, regional districts, and rural area jurisdictions. In addition, Powerex, a subsidiary of BC Hydro, pays taxes relating to trading activity in the United States. Other costs, net of recoveries primarily includes gains and losses on the disposal of assets, certain cost recoveries related to operating costs, and dismantling costs. Total grants, taxes and other costs for the three months ended June 30, 2020 were $86 million, $15 million (15 per cent) lower than the same period in the prior fiscal year primarily due to lower dismantling costs related to the decommissioning of assets.
British Columbia Hydro and Power Authority
2020/21 – First Quarter Report 6
Capitalized Costs Capitalized costs consist of costs directly attributable to capital expenditures that are transferred from operating costs to Property, Plant & Equipment. Capitalized costs for the three months ended June 30, 2020 were $16 million, comparable to the $18 million in the prior fiscal year. Finance Charges Finance charges for the three months ended June 30, 2020 were $314 million, $146 million (or 32 per cent) lower than the same period in the prior fiscal year. The decrease was primarily due to lower unrealized losses on future debt hedges used to economically hedge the interest rates on future debt issuances and higher interest during construction costs which were capitalized. The unrealized losses on future debt hedges will be offset by lower interest costs when the future debt is issued. Regulatory Transfers In accordance with IFRS 14, Regulatory Deferral Accounts, the Company separately presents regulatory balances and related net movements on the Condensed Consolidated Interim Statements of Financial Position and the Condensed Consolidated Interim Statements of Comprehensive Income. The Company has established various regulatory accounts through rate regulation and with the approval of the BCUC. The use of regulatory accounts is common amongst regulated utility industries throughout North America. BC Hydro uses various regulatory accounts, in compliance with BCUC orders, including to better match costs and benefits for different generations of customers, and to defer to future periods differences between forecast and actual costs or revenues. Deferred amounts are included in customer rates in future periods, subject to approval by the BCUC and have the effect of adjusting net income. Net regulatory account transfers are comprised of the following:
British Columbia Hydro and Power Authority
2020/21 – First Quarter Report 7
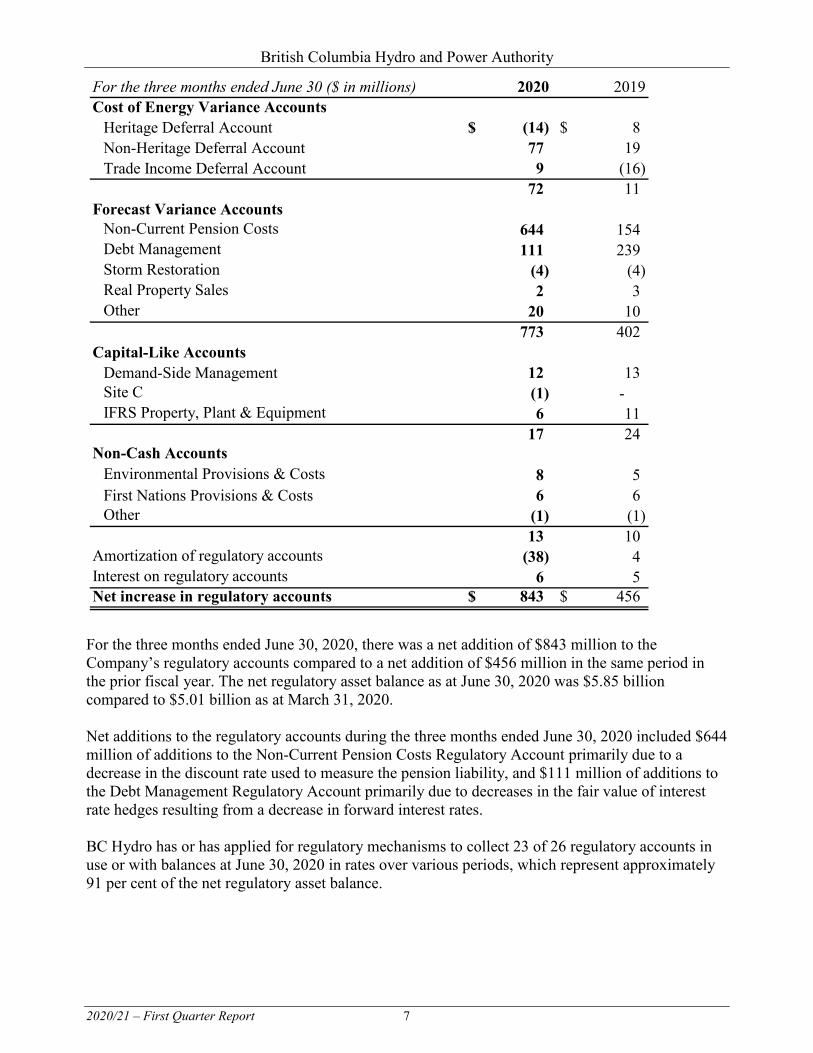
For the three months ended June 30, 2020, there was a net addition of $843 million to the Company’s regulatory accounts compared to a net addition of $456 million in the same period in the prior fiscal year. The net regulatory asset balance as at June 30, 2020 was $5.85 billion compared to $5.01 billion as at March 31, 2020. Net additions to the regulatory accounts during the three months ended June 30, 2020 included $644 million of additions to the Non-Current Pension Costs Regulatory Account primarily due to a decrease in the discount rate used to measure the pension liability, and $111 million of additions to the Debt Management Regulatory Account primarily due to decreases in the fair value of interest rate hedges resulting from a decrease in forward interest rates. BC Hydro has or has applied for regulatory mechanisms to collect 23 of 26 regulatory accounts in use or with balances at June 30, 2020 in rates over various periods, which represent approximately 91 per cent of the net regulatory asset balance.
For the three months ended June 30 ($ in millions) 2020 2019Cost of Energy Variance Accounts
Heritage Deferral Account (14)$ 8$ Non-Heritage Deferral Account 77 19Trade Income Deferral Account 9 (16)
72 11 Forecast Variance Accounts
Non-Current Pension Costs 644 154 Debt Management 111 239 Storm Restoration (4) (4) Real Property Sales 2 3Other 20 10
773 402 Capital-Like Accounts
Demand-Side Management 12 13 Site C (1) - IFRS Property, Plant & Equipment 6 11
17 24 Non-Cash Accounts
Environmental Provisions & Costs 8 5 First Nations Provisions & Costs 6 6 Other (1) (1)
13 10 Amortization of regulatory accounts (38) 4 Interest on regulatory accounts 6 5 Net increase in regulatory accounts 843$ 456$
British Columbia Hydro and Power Authority
2020/21 – First Quarter Report 8
Impact of COVID-19 In April 2020, BC Hydro announced COVID-19 relief programs for residential and commercial customers with billing relief amounts and incremental costs related to those programs to be deferred to two existing regulatory accounts in accordance with Order in Council No. 159/2020 issued on April 2, 2020. COVID-19 relief provided to residential customers is deferred to the Customer Crisis Fund Regulatory Account and COVID-19 relief provided to commercial customers is deferred to the Mining Customer Payment Plan Regulatory Account. For the three months ended June 30, 2020, transfers into these regulatory accounts were $40 million and are included in the Forecast Variance Accounts – Other balance. In addition, BC Hydro announced three new tariff supplements to provide COVID-19 relief to industrial customers allowing certain industrial customers to temporarily defer payment of a portion of their electricity bills, to be repaid in the future with interest. In accordance with Order in Council No. 159/2020, any impaired amounts owed by customers participating in the industrial COVID-19 relief programs are deferred to the Mining Customer Payment Plan Regulatory Account. BC Hydro is also experiencing lower revenues caused by lower customer demand, especially in the commercial and industrial sectors, as a result of the COVID-19 pandemic. Pursuant to existing regulatory orders, these revenue variances are deferred to the Non-Heritage Deferral Account. Liquidity and Capital Resources Cash flow provided by operating activities for the three months ended June 30, 2020 was $53 million, compared to $249 million in the same period in the prior fiscal year. The decrease was mainly due to lower domestic revenues and slower collection of accounts receivables, including the deferral of payment of certain industrial customers’ accounts receivables. The long-term debt balance net of sinking funds as at June 30, 2020 was $24.12 billion compared to $23.47 billion as at March 31, 2020. The increase was mainly as a result of an increase in net long-term bond issuances for net proceeds of $1.27 billion. This increase was partially offset by lower revolving borrowings of $573 million and net foreign exchange gains of $42 million. The increase was primarily to fund capital expenditures and to manage working capital.
British Columbia Hydro and Power Authority
2020/21 – First Quarter Report 9
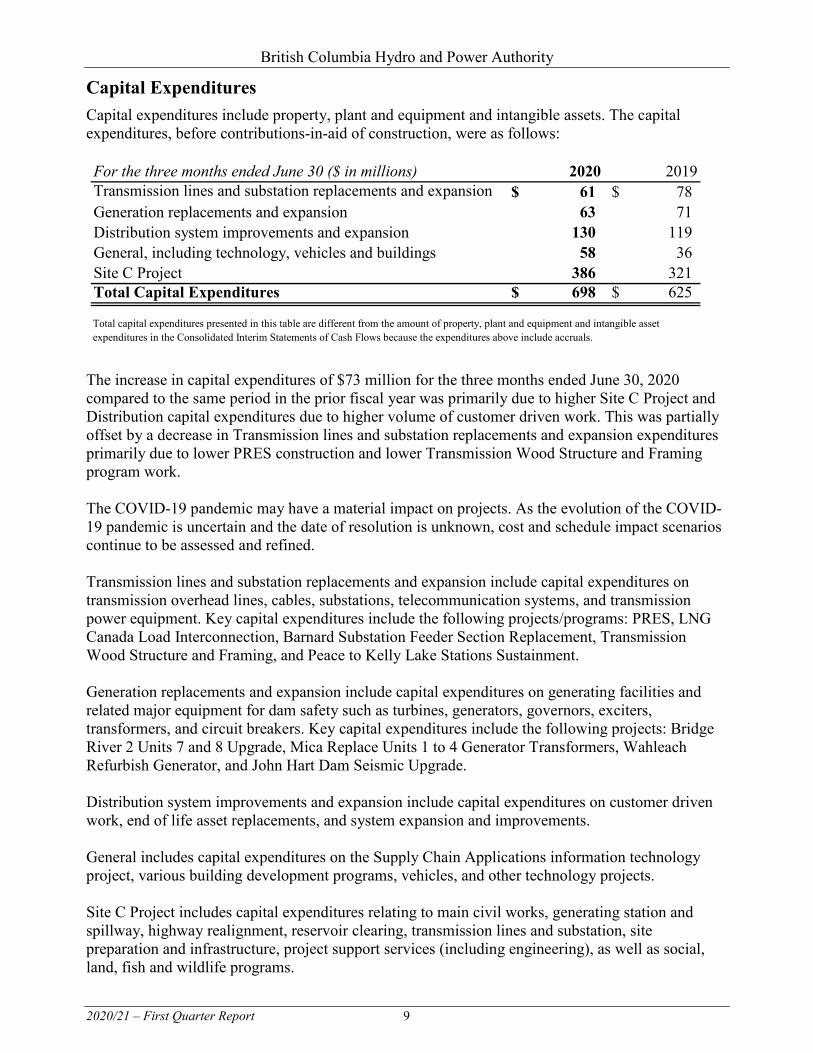
Capital Expenditures Capital expenditures include property, plant and equipment and intangible assets. The capital expenditures, before contributions-in-aid of construction, were as follows:
The increase in capital expenditures of $73 million for the three months ended June 30, 2020 compared to the same period in the prior fiscal year was primarily due to higher Site C Project and Distribution capital expenditures due to higher volume of customer driven work. This was partially offset by a decrease in Transmission lines and substation replacements and expansion expenditures primarily due to lower PRES construction and lower Transmission Wood Structure and Framing program work. The COVID-19 pandemic may have a material impact on projects. As the evolution of the COVID-19 pandemic is uncertain and the date of resolution is unknown, cost and schedule impact scenarios continue to be assessed and refined. Transmission lines and substation replacements and expansion include capital expenditures on transmission overhead lines, cables, substations, telecommunication systems, and transmission power equipment. Key capital expenditures include the following projects/programs: PRES, LNG Canada Load Interconnection, Barnard Substation Feeder Section Replacement, Transmission Wood Structure and Framing, and Peace to Kelly Lake Stations Sustainment. Generation replacements and expansion include capital expenditures on generating facilities and related major equipment for dam safety such as turbines, generators, governors, exciters, transformers, and circuit breakers. Key capital expenditures include the following projects: Bridge River 2 Units 7 and 8 Upgrade, Mica Replace Units 1 to 4 Generator Transformers, Wahleach Refurbish Generator, and John Hart Dam Seismic Upgrade. Distribution system improvements and expansion include capital expenditures on customer driven work, end of life asset replacements, and system expansion and improvements. General includes capital expenditures on the Supply Chain Applications information technology project, various building development programs, vehicles, and other technology projects. Site C Project includes capital expenditures relating to main civil works, generating station and spillway, highway realignment, reservoir clearing, transmission lines and substation, site preparation and infrastructure, project support services (including engineering), as well as social, land, fish and wildlife programs.
For the three months ended June 30 ($ in millions) 2020 2019Transmission lines and substation replacements and expansion 61$ 78$ Generation replacements and expansion 63 71 Distribution system improvements and expansion 130 119 General, including technology, vehicles and buildings 58 36 Site C Project 386 321 Total Capital Expenditures 698$ 625$
Total capital expenditures presented in this table are different from the amount of property, plant and equipment and intangible asset expenditures in the Consolidated Interim Statements of Cash Flows because the expenditures above include accruals.
British Columbia Hydro and Power Authority
2020/21 – First Quarter Report 10
Rate Regulation In the process of regulating and setting rates for BC Hydro, the BCUC must ensure that the rates are sufficient to allow BC Hydro to provide reliable electricity service, meet its financial obligations, comply with government policy, and earn an annual rate of return. Fiscal 2020 to Fiscal 2021 Revenue Requirements Application In June 2020, BC Hydro completed the evidence phase of the BCUC review of our Fiscal 2020 to Fiscal 2021 Revenue Requirements Application. BC Hydro is expecting the BCUC to issue its decision by early fall. Transfer Pricing Agreement Application On April 1, 2020 a new Transfer Pricing Agreement (TPA) between BC hydro and Powerex came into effect, replacing the previous TPA which was established in 2003. The TPA is an energy supply contract that governs the transfer of energy between the two parties and establishes a price for that energy. The new TPA enables BC Hydro to cost effectively meet our Domestic Requirements while maximizing the value of our Residual System Capability. BC Hydro filed the new TPA with the BCUC for acceptance as an energy supply contract on May 29, 2020 and a regulatory timetable for review of the new TPA is in the process of being finalized. Risk Management BC Hydro is exposed to numerous risks, which can result in safety, environmental, financial, reliability and reputational impacts. This section of the MD&A discusses risks that may impact financial performance. The impact of many financial risks associated with uncontrollable external influences on BC Hydro’s net income is mitigated through the use of BCUC-approved regulatory accounts. Regulatory accounts assist in matching costs and benefits for different generations of customers and to defer for future recovery in rates the differences between planned and actual costs or revenues that arise due to uncontrollable events. BC Hydro’s approach to the recovery of its regulatory accounts is included in the Fiscal 2020 to Fiscal 2021 Revenue Requirements Application. Significant Financial Risks The largest sources of variability in BC Hydro’s financial performance are typically domestic and trade revenue, domestic and trade cost of energy, and finance charges. These are influenced by several elements, which generally fall into the following five categories: hydro generation, customer load, electricity/gas trade margins, deliveries from electricity purchase agreement contracts, and interest rates. Neither a high nor a low value of any of these individual drivers is intrinsically positive or negative for BC Hydro’s financial results. It is the specific combination of these drivers in any given year which has an impact. While meeting domestic demand, environmental regulations and treaty obligations, BC Hydro attempts to operate the system to take maximum advantage of market energy prices – buying from the markets when prices are low and selling when prices are high. In doing so, BC Hydro seeks to optimize the combined effects of these elements and reduce the net cost of energy for our customers.

British Columbia Hydro and Power Authority
2020/21 – First Quarter Report 11
Demand for Electricity
BC Hydro has seen a shift in customer demand with potential long-term implications, particularly in the industrial and commercial sectors. Domestic load for the three months ended June 30, 2020 was approximately 4 per cent lower compared the same period in the prior fiscal year and 7 per cent lower than plan. Much of this decline is due to the effects of COVID-19. While there is significant uncertainty associated with pandemic’s impacts on electricity demand, the current decline in demand is expected to continue for a period of time. The impacts will depend on the speed and nature of both the near-term economic downturn caused by COVID-19, and the mid-to-long-term recovery and lasting effects. This section should be read in conjunction with the risks disclosed in the Risk Management section in the Management’s Discussion and Analysis presented in the 2019/20 Annual Service Plan Report for the year ended March 31, 2020. In addition, information on risks and opportunities that could significantly impact BC Hydro meeting its objectives is outlined at www.bchydro.com/serviceplan. Future Outlook The Budget Transparency and Accountability Act requires that BC Hydro file a Service Plan each year. BC Hydro’s Service Plan filed in February 2020 forecast net income for 2020/21 at $712 million which is consistent with the amount required by Order in Council No. 051. The Company’s earnings can fluctuate significantly due to the factors discussed in the preceding section, many of which are non-controllable. The impact to net income of these non-controllable factors is largely mitigated through the use of regulatory accounts. The Service Plan forecast for 2020/21 assumes average water inflows (100 per cent of average), domestic sales of 53,656 GWh, average market energy prices of US $27.67/MWh, short-term interest rates of 1.47 per cent, and a Canadian to US dollar exchange rate of US $0.7616. The COVID-19 pandemic continues to adversely impact global activity and has contributed to significant volatility in financial markets. The pandemic could have a sustained adverse impact on economic and market conditions and could adversely impact BC Hydro’s future performance if it were to cause a prolonged decrease in customer load, volatility in electricity/gas trade margins and interest rates, difficulty accessing debt, project delays and project cost escalations. While BC Hydro engages in emergency preparedness (including business continuity planning) to mitigate risks, the persisting uncertainty of this situation limits the ability to predict the ultimate adverse impact of COVID-19 on BC Hydro’s performance, financial condition, results of operations and cash flows. BC Hydro filed an updated financial forecast with the Province in August 2020. The financial forecast continues to forecast net income for 2020/21 at $712 million and assumes above average water inflows (106 percent of average), domestic sales of 47,186 GWh, average market energy prices of U.S. $24.08/MWh, short-term interest rates of 0.37 per cent and a Canadian to US dollar exchange rate of US $0.7326.
British Columbia Hydro and Power Authority
2020/21 – First Quarter Report 12
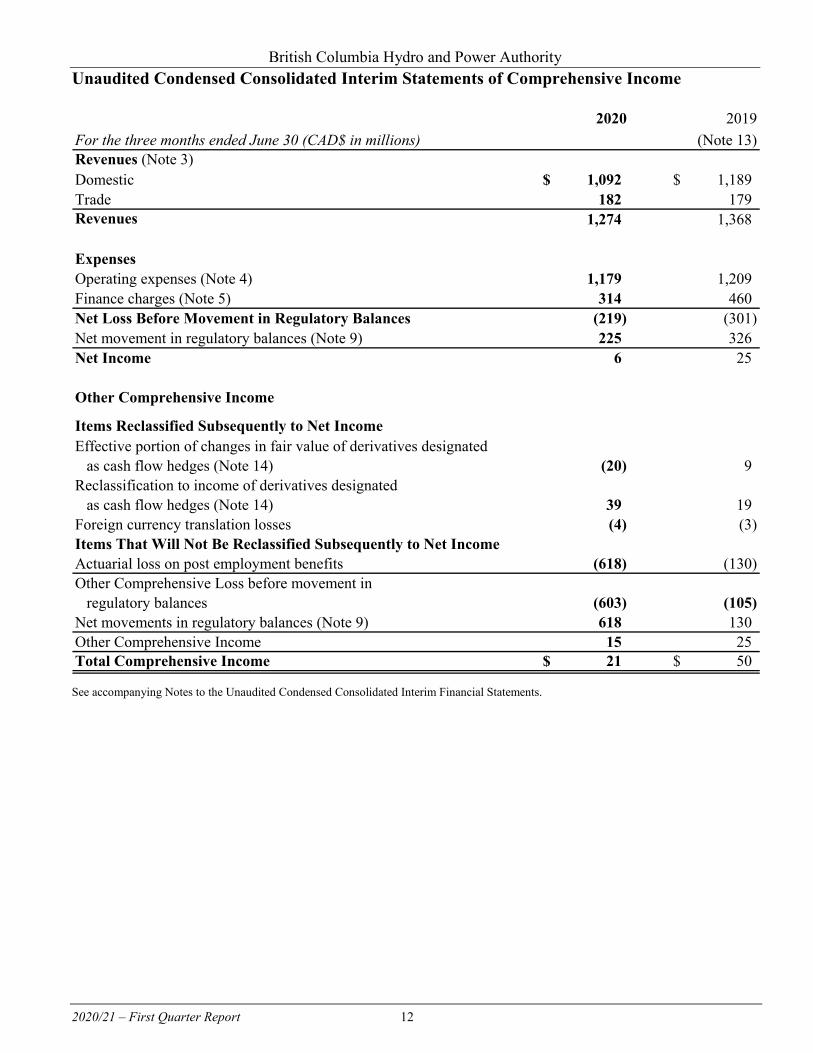
Unaudited Condensed Consolidated Interim Statements of Comprehensive Income
See accompanying Notes to the Unaudited Condensed Consolidated Interim Financial Statements.
2020 2019For the three months ended June 30 (CAD$ in millions) (Note 13)Revenues (Note 3)Domestic 1,092$ 1,189$ Trade 182 179 Revenues 1,274 1,368
ExpensesOperating expenses (Note 4) 1,179 1,209 Finance charges (Note 5) 314 460 Net Loss Before Movement in Regulatory Balances (219) (301) Net movement in regulatory balances (Note 9) 225 326 Net Income 6 25
Other Comprehensive Income
Items Reclassified Subsequently to Net IncomeEffective portion of changes in fair value of derivatives designated as cash flow hedges (Note 14) (20) 9 Reclassification to income of derivatives designated as cash flow hedges (Note 14) 39 19 Foreign currency translation losses (4) (3) Items That Will Not Be Reclassified Subsequently to Net IncomeActuarial loss on post employment benefits (618) (130) Other Comprehensive Loss before movement in regulatory balances (603) (105) Net movements in regulatory balances (Note 9) 618 130 Other Comprehensive Income 15 25 Total Comprehensive Income 21$ 50$
British Columbia Hydro and Power Authority
2020/21 – First Quarter Report 13
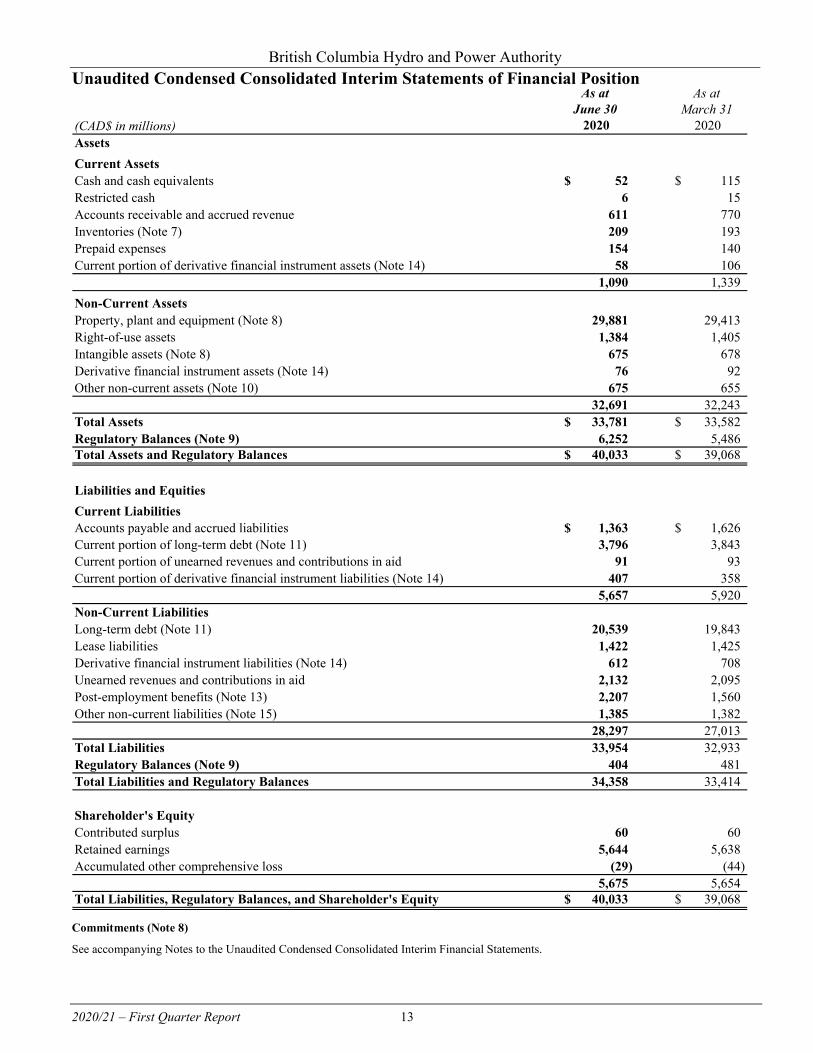
Unaudited Condensed Consolidated Interim Statements of Financial Position
Commitments (Note 8)
See accompanying Notes to the Unaudited Condensed Consolidated Interim Financial Statements.
As at As atJune 30 March 31
(CAD$ in millions) 2020 2020AssetsCurrent AssetsCash and cash equivalents 52$ 115$ Restricted cash 6 15 Accounts receivable and accrued revenue 611 770 Inventories (Note 7) 209 193 Prepaid expenses 154 140 Current portion of derivative financial instrument assets (Note 14) 58 106
1,090 1,339 Non-Current Assets Property, plant and equipment (Note 8) 29,881 29,413 Right-of-use assets 1,384 1,405 Intangible assets (Note 8) 675 678 Derivative financial instrument assets (Note 14) 76 92 Other non-current assets (Note 10) 675 655
32,691 32,243 Total Assets 33,781$ 33,582$ Regulatory Balances (Note 9) 6,252 5,486 Total Assets and Regulatory Balances 40,033$ 39,068$
Liabilities and EquitiesCurrent LiabilitiesAccounts payable and accrued liabilities 1,363$ 1,626$ Current portion of long-term debt (Note 11) 3,796 3,843 Current portion of unearned revenues and contributions in aid 91 93 Current portion of derivative financial instrument liabilities (Note 14) 407 358
5,657 5,920 Non-Current LiabilitiesLong-term debt (Note 11) 20,539 19,843 Lease liabilities 1,422 1,425 Derivative financial instrument liabilities (Note 14) 612 708 Unearned revenues and contributions in aid 2,132 2,095 Post-employment benefits (Note 13) 2,207 1,560 Other non-current liabilities (Note 15) 1,385 1,382
28,297 27,013 Total Liabilities 33,954 32,933 Regulatory Balances (Note 9) 404 481 Total Liabilities and Regulatory Balances 34,358 33,414
Shareholder's EquityContributed surplus 60 60 Retained earnings 5,644 5,638 Accumulated other comprehensive loss (29) (44)
5,675 5,654 Total Liabilities, Regulatory Balances, and Shareholder's Equity 40,033$ 39,068$
British Columbia Hydro and Power Authority
2020/21 – First Quarter Report 14
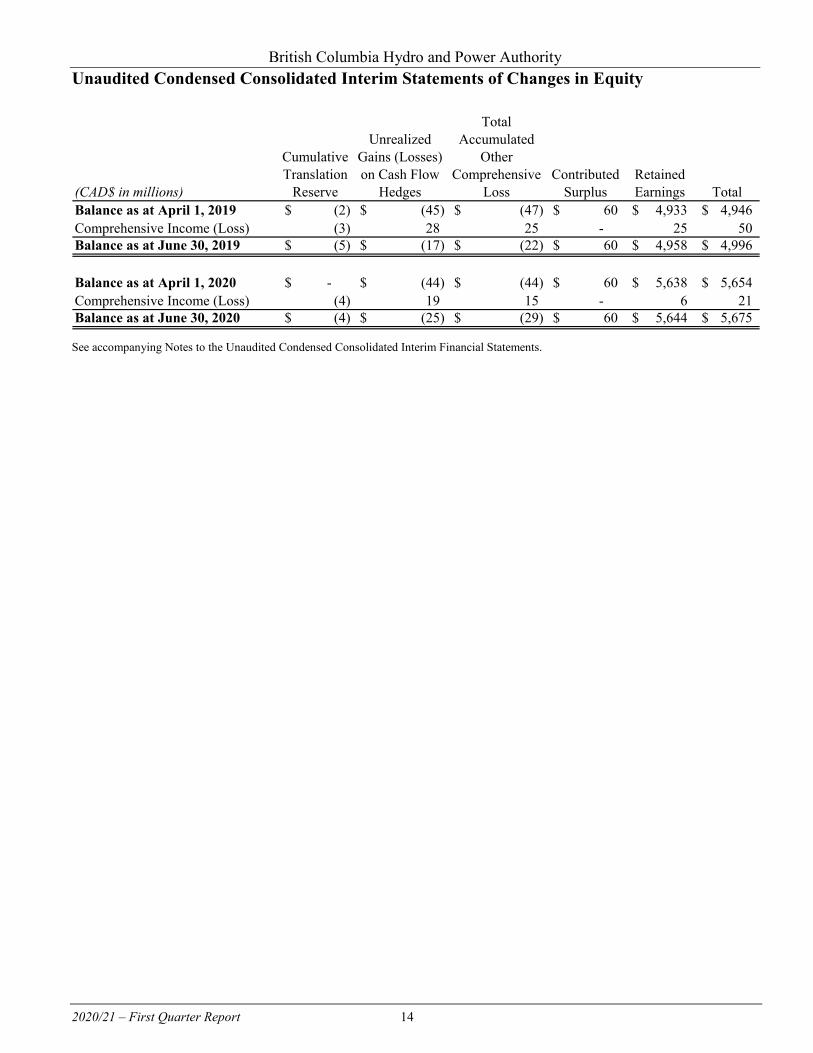
Unaudited Condensed Consolidated Interim Statements of Changes in Equity
See accompanying Notes to the Unaudited Condensed Consolidated Interim Financial Statements.
(CAD$ in millions)Balance as at April 1, 2019 (2)$ (45)$ (47)$ 60$ 4,933$ 4,946$ Comprehensive Income (Loss) (3) 28 25 - 25 50 Balance as at June 30, 2019 (5)$ (17)$ (22)$ 60$ 4,958$ 4,996$
Balance as at April 1, 2020 -$ (44)$ (44)$ 60$ 5,638$ 5,654$ Comprehensive Income (Loss) (4) 19 15 - 6 21 Balance as at June 30, 2020 (4)$ (25)$ (29)$ 60$ 5,644$ 5,675$
Contributed Surplus
Retained Earnings Total
CumulativeTranslation
Reserve
Unrealized Gains (Losses) on Cash Flow
Hedges
Total Accumulated
Other Comprehensive
Loss
British Columbia Hydro and Power Authority
2020/21 – First Quarter Report 15
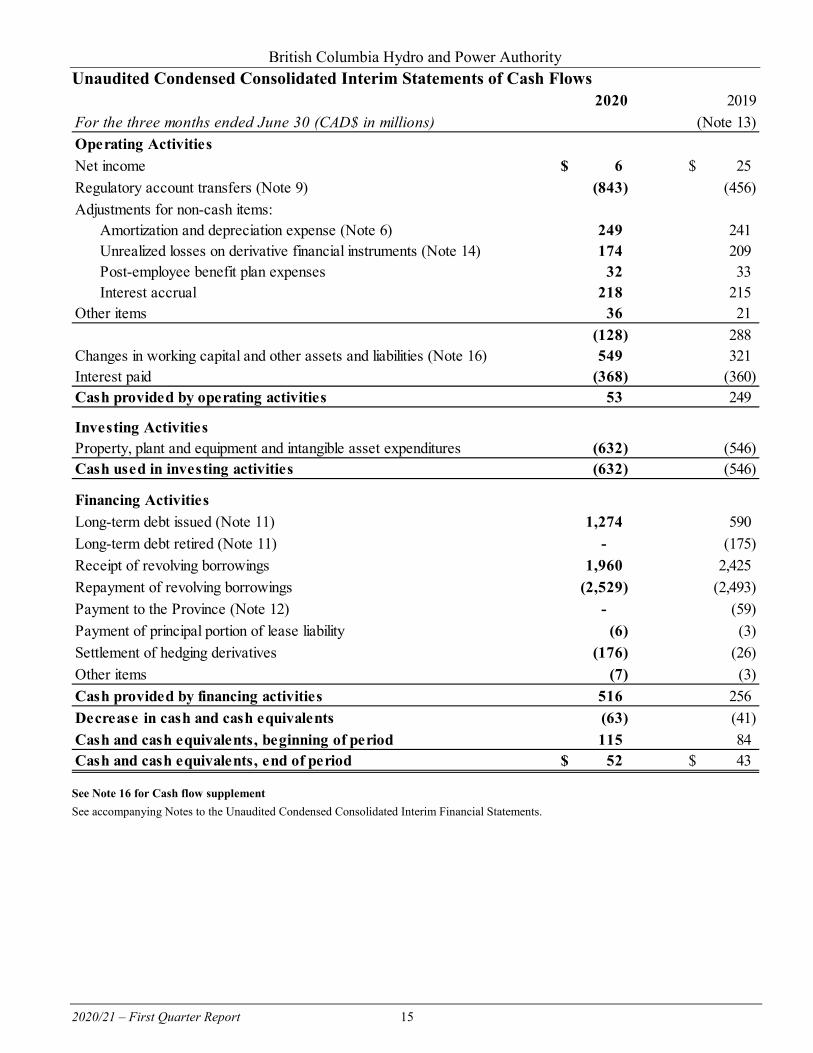
Unaudited Condensed Consolidated Interim Statements of Cash Flows
See Note 16 for Cash flow supplement See accompanying Notes to the Unaudited Condensed Consolidated Interim Financial Statements.
2020 2019For the three months ended June 30 (CAD$ in millions) (Note 13)Operating ActivitiesNet income 6$ 25$ Regulatory account transfers (Note 9) (843) (456) Adjustments for non-cash items:
Amortization and depreciation expense (Note 6) 249 241 Unrealized losses on derivative financial instruments (Note 14) 174 209 Post-employee benefit plan expenses 32 33 Interest accrual 218 215
Other items 36 21 (128) 288
Changes in working capital and other assets and liabilities (Note 16) 549 321 Interest paid (368) (360) Cash provided by operating activities 53 249
Investing ActivitiesProperty, plant and equipment and intangible asset expenditures (632) (546) Cash used in investing activities (632) (546)
Financing ActivitiesLong-term debt issued (Note 11) 1,274 590 Long-term debt retired (Note 11) - (175) Receipt of revolving borrowings 1,960 2,425 Repayment of revolving borrowings (2,529) (2,493) Payment to the Province (Note 12) - (59) Payment of principal portion of lease liability (6) (3) Settlement of hedging derivatives (176) (26) Other items (7) (3) Cash provided by financing activities 516 256 Decrease in cash and cash equivalents (63) (41) Cash and cash equivalents, beginning of period 115 84 Cash and cash equivalents, end of period 52$ 43$
British Columbia Hydro and Power Authority NOTES TO THE UNAUDITED CONDENSED CONSOLIDATED INTERIM FINANCIAL STATEMENTS FOR THE THREE MONTHS ENDED JUNE 30, 2020
2020/21 – First Quarter Report 16
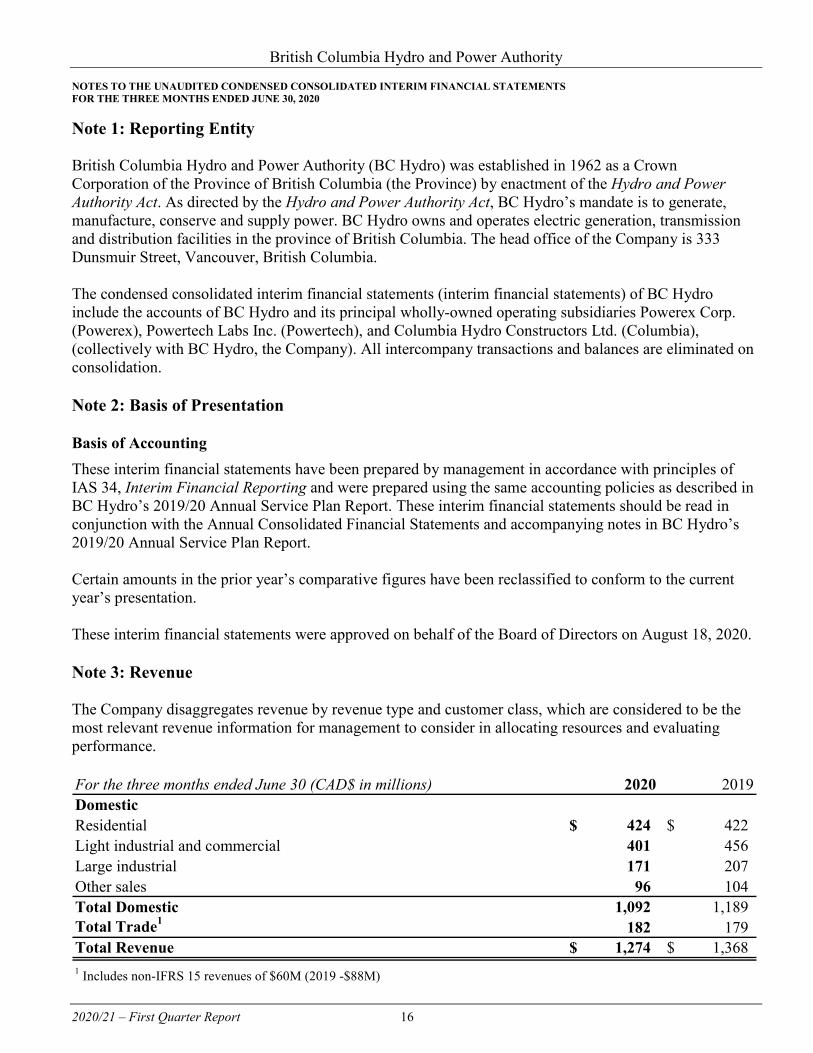
Note 1: Reporting Entity British Columbia Hydro and Power Authority (BC Hydro) was established in 1962 as a Crown Corporation of the Province of British Columbia (the Province) by enactment of the Hydro and Power Authority Act. As directed by the Hydro and Power Authority Act, BC Hydro’s mandate is to generate, manufacture, conserve and supply power. BC Hydro owns and operates electric generation, transmission and distribution facilities in the province of British Columbia. The head office of the Company is 333 Dunsmuir Street, Vancouver, British Columbia. The condensed consolidated interim financial statements (interim financial statements) of BC Hydro include the accounts of BC Hydro and its principal wholly-owned operating subsidiaries Powerex Corp. (Powerex), Powertech Labs Inc. (Powertech), and Columbia Hydro Constructors Ltd. (Columbia), (collectively with BC Hydro, the Company). All intercompany transactions and balances are eliminated on consolidation. Note 2: Basis of Presentation Basis of Accounting These interim financial statements have been prepared by management in accordance with principles of IAS 34, Interim Financial Reporting and were prepared using the same accounting policies as described in BC Hydro’s 2019/20 Annual Service Plan Report. These interim financial statements should be read in conjunction with the Annual Consolidated Financial Statements and accompanying notes in BC Hydro’s 2019/20 Annual Service Plan Report. Certain amounts in the prior year’s comparative figures have been reclassified to conform to the current year’s presentation. These interim financial statements were approved on behalf of the Board of Directors on August 18, 2020. Note 3: Revenue The Company disaggregates revenue by revenue type and customer class, which are considered to be the most relevant revenue information for management to consider in allocating resources and evaluating performance.
For the three months ended June 30 (CAD$ in millions) 2020 2019DomesticResidential 424$ 422$ Light industrial and commercial 401 456 Large industrial 171 207 Other sales 96 104 Total Domestic 1,092 1,189 Total Trade1 182 179 Total Revenue 1,274$ 1,368$ 1 Includes non-IFRS 15 revenues of $60M (2019 -$88M)

British Columbia Hydro and Power Authority NOTES TO THE UNAUDITED CONDENSED CONSOLIDATED INTERIM FINANCIAL STATEMENTS FOR THE THREE MONTHS ENDED JUNE 30, 2020
2020/21 – First Quarter Report 17
Note 4: Operating Expenses
Note 5: Finance Charges
For the three months ended June 30 (CAD$ in millions) 2020 2019Electricity and gas purchases 408$ 443$ Water rentals 70 79 Transmission charges 51 46 Personnel expenses 196 178 Materials and external services 135 139 Amortization and depreciation (Note 6) 249 241 Grants, taxes and other costs 86 101 Less: Capitalized costs (16) (18)
1,179$ 1,209$
For the three months ended June 30 (CAD$ in millions) 2020 2019Interest on long-term debt 218$ 215$ Interest on lease liabilities 12 15 Interest on defined benefit plan obligations 16 16 Mark-to-market losses on derivative financial instruments 109 239 Capitalized interest (54) (37) Other 13 12
314$ 460$
British Columbia Hydro and Power Authority NOTES TO THE UNAUDITED CONDENSED CONSOLIDATED INTERIM FINANCIAL STATEMENTS FOR THE THREE MONTHS ENDED JUNE 30, 2020
2020/21 – First Quarter Report 18
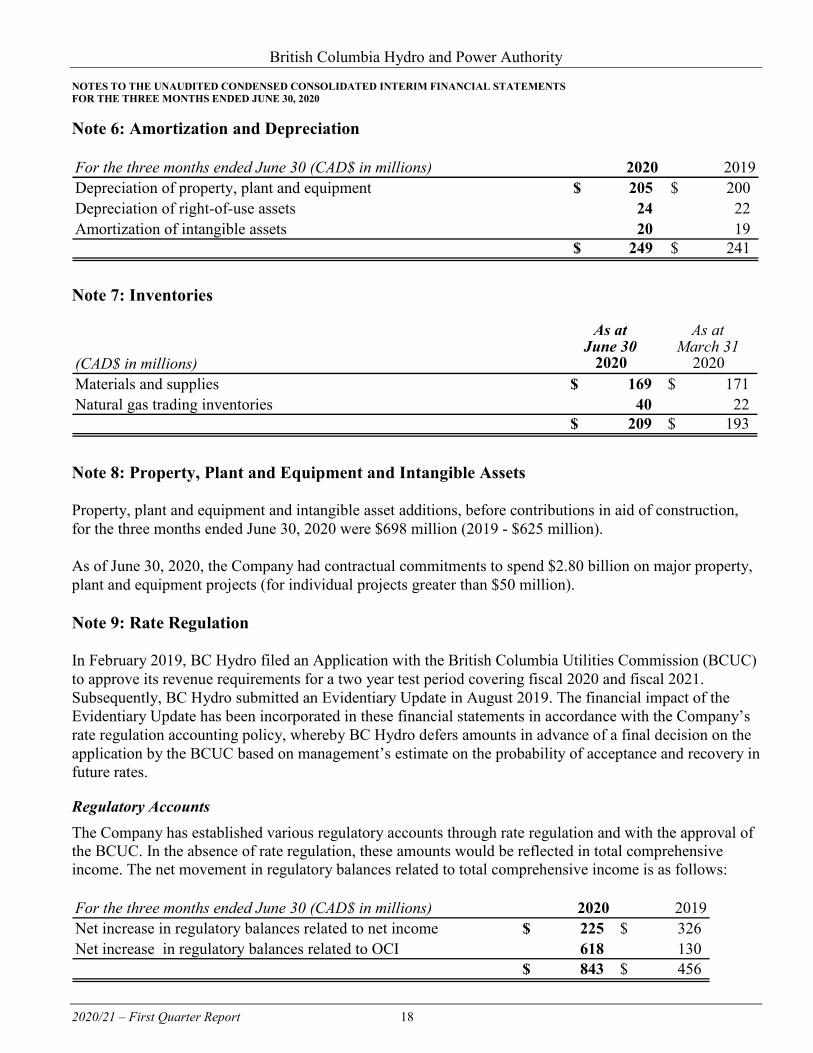
Note 6: Amortization and Depreciation
Note 7: Inventories
Note 8: Property, Plant and Equipment and Intangible Assets Property, plant and equipment and intangible asset additions, before contributions in aid of construction, for the three months ended June 30, 2020 were $698 million (2019 - $625 million). As of June 30, 2020, the Company had contractual commitments to spend $2.80 billion on major property, plant and equipment projects (for individual projects greater than $50 million). Note 9: Rate Regulation In February 2019, BC Hydro filed an Application with the British Columbia Utilities Commission (BCUC) to approve its revenue requirements for a two year test period covering fiscal 2020 and fiscal 2021. Subsequently, BC Hydro submitted an Evidentiary Update in August 2019. The financial impact of the Evidentiary Update has been incorporated in these financial statements in accordance with the Company’s rate regulation accounting policy, whereby BC Hydro defers amounts in advance of a final decision on the application by the BCUC based on management’s estimate on the probability of acceptance and recovery in future rates.
Regulatory Accounts The Company has established various regulatory accounts through rate regulation and with the approval of the BCUC. In the absence of rate regulation, these amounts would be reflected in total comprehensive income. The net movement in regulatory balances related to total comprehensive income is as follows:
For the three months ended June 30 (CAD$ in millions) 2020 2019Depreciation of property, plant and equipment 205$ 200$ Depreciation of right-of-use assets 24 22 Amortization of intangible assets 20 19
249$ 241$
As at As atJune 30 March 31
(CAD$ in millions) 2020 2020Materials and supplies 169$ 171$ Natural gas trading inventories 40 22
209$ 193$
For the three months ended June 30 (CAD$ in millions) 2020 2019Net increase in regulatory balances related to net income 225$ 326$ Net increase in regulatory balances related to OCI 618 130
843$ 456$
British Columbia Hydro and Power Authority NOTES TO THE UNAUDITED CONDENSED CONSOLIDATED INTERIM FINANCIAL STATEMENTS FOR THE THREE MONTHS ENDED JUNE 30, 2020
2020/21 – First Quarter Report 19
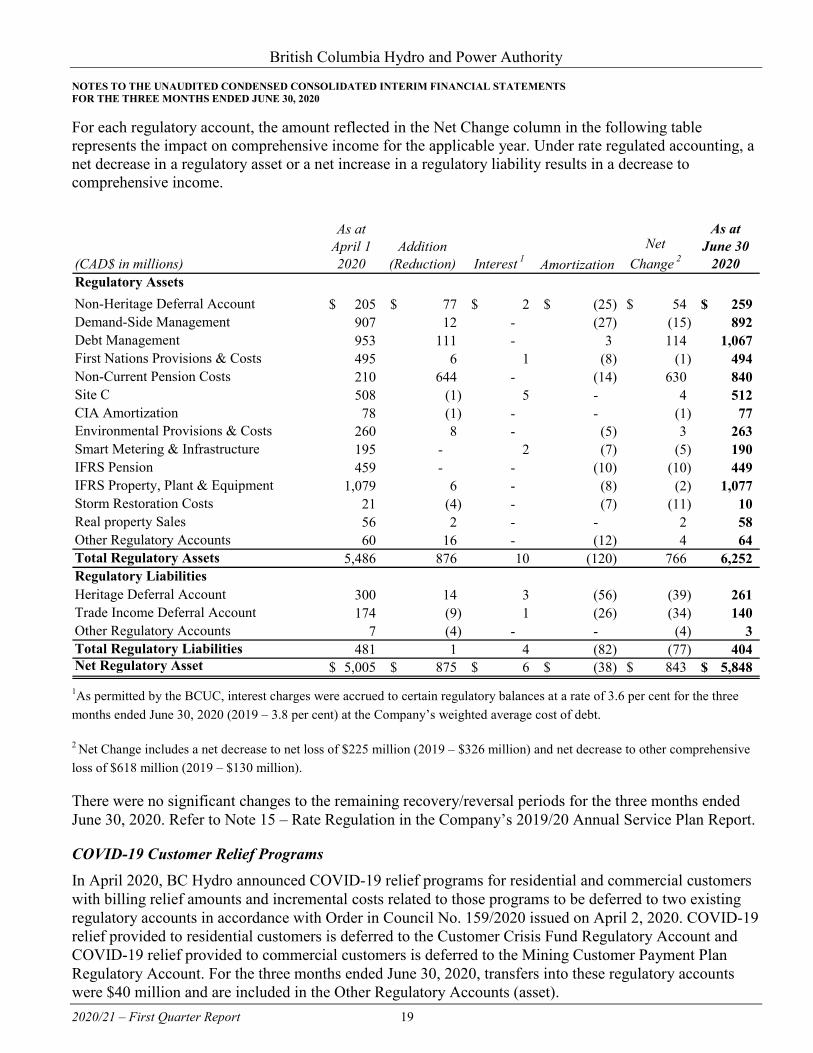
For each regulatory account, the amount reflected in the Net Change column in the following table represents the impact on comprehensive income for the applicable year. Under rate regulated accounting, a net decrease in a regulatory asset or a net increase in a regulatory liability results in a decrease to comprehensive income.
1As permitted by the BCUC, interest charges were accrued to certain regulatory balances at a rate of 3.6 per cent for the three months ended June 30, 2020 (2019 – 3.8 per cent) at the Company’s weighted average cost of debt.
2 Net Change includes a net decrease to net loss of $225 million (2019 – $326 million) and net decrease to other comprehensive loss of $618 million (2019 – $130 million).
There were no significant changes to the remaining recovery/reversal periods for the three months ended June 30, 2020. Refer to Note 15 – Rate Regulation in the Company’s 2019/20 Annual Service Plan Report.
COVID-19 Customer Relief Programs In April 2020, BC Hydro announced COVID-19 relief programs for residential and commercial customers with billing relief amounts and incremental costs related to those programs to be deferred to two existing regulatory accounts in accordance with Order in Council No. 159/2020 issued on April 2, 2020. COVID-19 relief provided to residential customers is deferred to the Customer Crisis Fund Regulatory Account and COVID-19 relief provided to commercial customers is deferred to the Mining Customer Payment Plan Regulatory Account. For the three months ended June 30, 2020, transfers into these regulatory accounts were $40 million and are included in the Other Regulatory Accounts (asset).
(CAD$ in millions)
As at April 1 2020
Addition(Reduction) Interest 1 Amortization
NetChange 2
As at June 30
2020Regulatory AssetsNon-Heritage Deferral Account 205$ 77$ 2$ (25)$ 54$ 259$ Demand-Side Management 907 12 - (27) (15) 892 Debt Management 953 111 - 3 114 1,067 First Nations Provisions & Costs 495 6 1 (8) (1) 494 Non-Current Pension Costs 210 644 - (14) 630 840 Site C 508 (1) 5 - 4 512 CIA Amortization 78 (1) - - (1) 77 Environmental Provisions & Costs 260 8 - (5) 3 263 Smart Metering & Infrastructure 195 - 2 (7) (5) 190 IFRS Pension 459 - - (10) (10) 449 IFRS Property, Plant & Equipment 1,079 6 - (8) (2) 1,077 Storm Restoration Costs 21 (4) - (7) (11) 10 Real property Sales 56 2 - - 2 58 Other Regulatory Accounts 60 16 - (12) 4 64 Total Regulatory Assets 5,486 876 10 (120) 766 6,252 Regulatory LiabilitiesHeritage Deferral Account 300 14 3 (56) (39) 261 Trade Income Deferral Account 174 (9) 1 (26) (34) 140 Other Regulatory Accounts 7 (4) - - (4) 3 Total Regulatory Liabilities 481 1 4 (82) (77) 404 Net Regulatory Asset 5,005$ 875$ 6$ (38)$ 843$ 5,848$
British Columbia Hydro and Power Authority NOTES TO THE UNAUDITED CONDENSED CONSOLIDATED INTERIM FINANCIAL STATEMENTS FOR THE THREE MONTHS ENDED JUNE 30, 2020
2020/21 – First Quarter Report 20
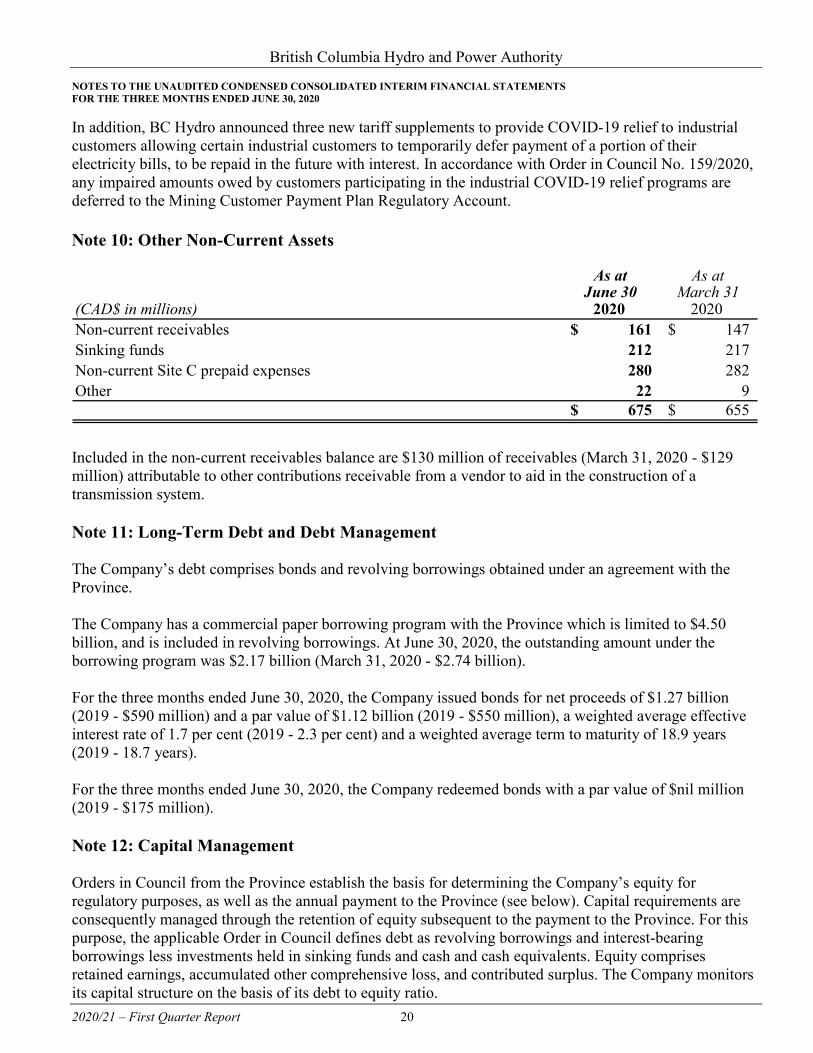
In addition, BC Hydro announced three new tariff supplements to provide COVID-19 relief to industrial customers allowing certain industrial customers to temporarily defer payment of a portion of their electricity bills, to be repaid in the future with interest. In accordance with Order in Council No. 159/2020, any impaired amounts owed by customers participating in the industrial COVID-19 relief programs are deferred to the Mining Customer Payment Plan Regulatory Account. Note 10: Other Non-Current Assets
Included in the non-current receivables balance are $130 million of receivables (March 31, 2020 - $129 million) attributable to other contributions receivable from a vendor to aid in the construction of a transmission system. Note 11: Long-Term Debt and Debt Management The Company’s debt comprises bonds and revolving borrowings obtained under an agreement with the Province. The Company has a commercial paper borrowing program with the Province which is limited to $4.50 billion, and is included in revolving borrowings. At June 30, 2020, the outstanding amount under the borrowing program was $2.17 billion (March 31, 2020 - $2.74 billion). For the three months ended June 30, 2020, the Company issued bonds for net proceeds of $1.27 billion (2019 - $590 million) and a par value of $1.12 billion (2019 - $550 million), a weighted average effective interest rate of 1.7 per cent (2019 - 2.3 per cent) and a weighted average term to maturity of 18.9 years (2019 - 18.7 years). For the three months ended June 30, 2020, the Company redeemed bonds with a par value of $nil million (2019 - $175 million). Note 12: Capital Management Orders in Council from the Province establish the basis for determining the Company’s equity for regulatory purposes, as well as the annual payment to the Province (see below). Capital requirements are consequently managed through the retention of equity subsequent to the payment to the Province. For this purpose, the applicable Order in Council defines debt as revolving borrowings and interest-bearing borrowings less investments held in sinking funds and cash and cash equivalents. Equity comprises retained earnings, accumulated other comprehensive loss, and contributed surplus. The Company monitors its capital structure on the basis of its debt to equity ratio.
As at As atJune 30 March 31
(CAD$ in millions) 2020 2020Non-current receivables 161$ 147$ Sinking funds 212 217 Non-current Site C prepaid expenses 280 282 Other 22 9
675$ 655$
British Columbia Hydro and Power Authority NOTES TO THE UNAUDITED CONDENSED CONSOLIDATED INTERIM FINANCIAL STATEMENTS FOR THE THREE MONTHS ENDED JUNE 30, 2020
2020/21 – First Quarter Report 21
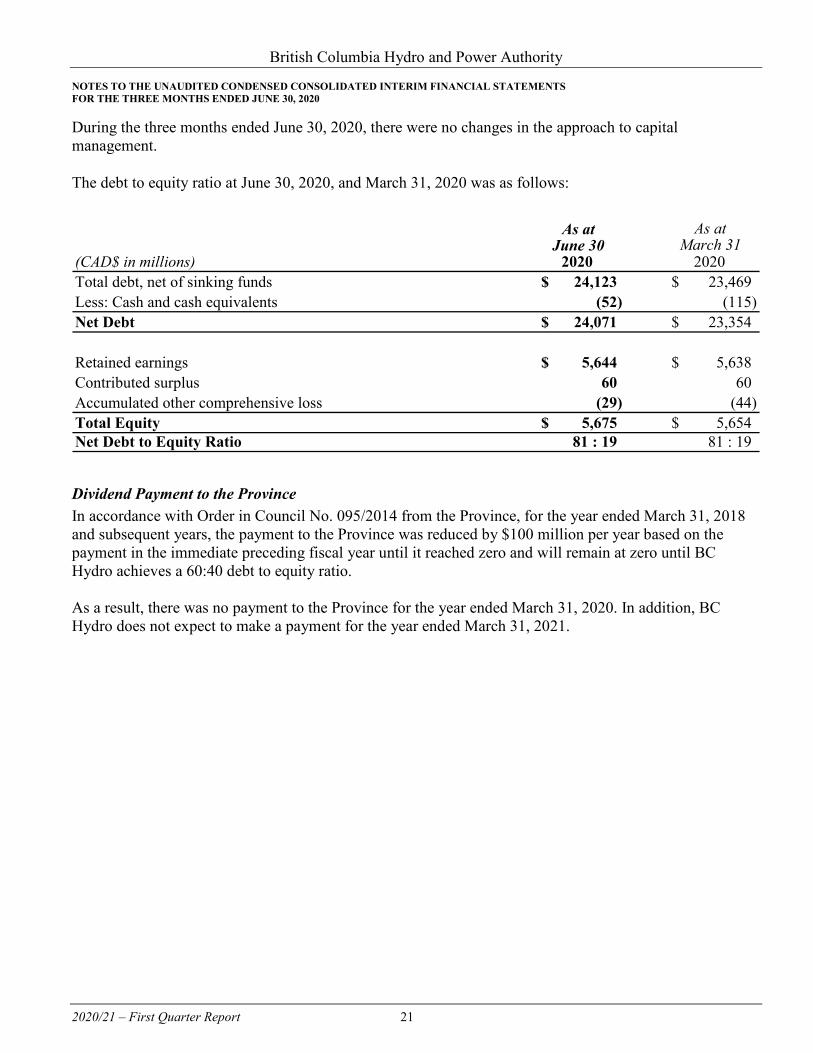
During the three months ended June 30, 2020, there were no changes in the approach to capital management. The debt to equity ratio at June 30, 2020, and March 31, 2020 was as follows:
Dividend Payment to the Province In accordance with Order in Council No. 095/2014 from the Province, for the year ended March 31, 2018 and subsequent years, the payment to the Province was reduced by $100 million per year based on the payment in the immediate preceding fiscal year until it reached zero and will remain at zero until BC Hydro achieves a 60:40 debt to equity ratio. As a result, there was no payment to the Province for the year ended March 31, 2020. In addition, BC Hydro does not expect to make a payment for the year ended March 31, 2021.
As at As atJune 30 March 31
(CAD$ in millions) 2020 2020Total debt, net of sinking funds 24,123$ 23,469$ Less: Cash and cash equivalents (52) (115) Net Debt 24,071$ 23,354$
Retained earnings 5,644$ 5,638$ Contributed surplus 60 60 Accumulated other comprehensive loss (29) (44) Total Equity 5,675$ 5,654$ Net Debt to Equity Ratio 81 : 19 81 : 19
British Columbia Hydro and Power Authority NOTES TO THE UNAUDITED CONDENSED CONSOLIDATED INTERIM FINANCIAL STATEMENTS FOR THE THREE MONTHS ENDED JUNE 30, 2020
2020/21 – First Quarter Report 22
Note 13: Post-Employment Benefits The expense recognized for the Company’s defined benefit plans prior to any capitalization of employment costs attributable to property, plant and equipment and intangible asset additions for the three months ended June 30, 2020 was $47 million (2019 - $48 million). Company contributions to the registered defined benefit pension plans for the three months ended June 30, 2020 were $12 million (2019 - $11 million). BC Hydro did not recognize plan remeasurements due to market fluctuations from changes in the market rate of return on plan assets and liability discount rate at the end of the comparative quarter. The comparatives have been restated to reflect this amount. The plan remeasurements used a discount rate of 2.76 per cent as at June 30, 2020 (June 30, 2019 - 3.01 per cent) and a rate of return on plan assets of 6.65 per cent as at June 30, 2020 (June 30, 2019 - 1.60 per cent).
British Columbia Hydro and Power Authority NOTES TO THE UNAUDITED CONDENSED CONSOLIDATED INTERIM FINANCIAL STATEMENTS FOR THE THREE MONTHS ENDED JUNE 30, 2020
2020/21 – First Quarter Report 23
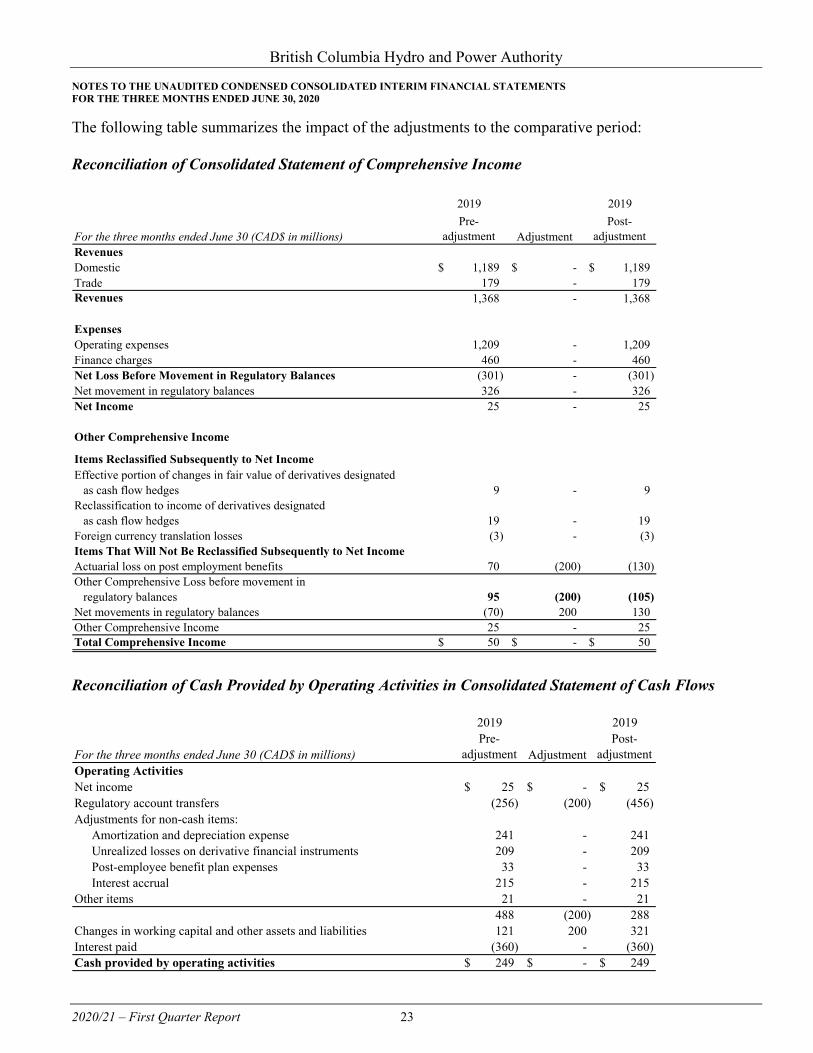
The following table summarizes the impact of the adjustments to the comparative period: Reconciliation of Consolidated Statement of Comprehensive Income
Reconciliation of Cash Provided by Operating Activities in Consolidated Statement of Cash Flows
2019 2019
For the three months ended June 30 (CAD$ in millions)Pre-
adjustmentPost-
adjustmentRevenuesDomestic 1,189$ $ - 1,189$ Trade 179 - 179 Revenues 1,368 - 1,368
ExpensesOperating expenses 1,209 - 1,209 Finance charges 460 - 460 Net Loss Before Movement in Regulatory Balances (301) - (301) Net movement in regulatory balances 326 - 326 Net Income 25 - 25
Other Comprehensive Income
Items Reclassified Subsequently to Net IncomeEffective portion of changes in fair value of derivatives designated as cash flow hedges 9 - 9 Reclassification to income of derivatives designated as cash flow hedges 19 - 19 Foreign currency translation losses (3) - (3) Items That Will Not Be Reclassified Subsequently to Net IncomeActuarial loss on post employment benefits 70 (200) (130) Other Comprehensive Loss before movement in regulatory balances 95 (200) (105) Net movements in regulatory balances (70) 200 130 Other Comprehensive Income 25 - 25 Total Comprehensive Income 50$ $ - 50$
Adjustment
2019 2019
For the three months ended June 30 (CAD$ in millions)Pre-
adjustmentPost-
adjustmentOperating ActivitiesNet income 25$ $ - 25$ Regulatory account transfers (256) (200) (456) Adjustments for non-cash items:
Amortization and depreciation expense 241 - 241 Unrealized losses on derivative financial instruments 209 - 209 Post-employee benefit plan expenses 33 - 33 Interest accrual 215 - 215
Other items 21 - 21 488 (200) 288
Changes in working capital and other assets and liabilities 121 200 321 Interest paid (360) - (360) Cash provided by operating activities 249$ $ - 249$
Adjustment
British Columbia Hydro and Power Authority NOTES TO THE UNAUDITED CONDENSED CONSOLIDATED INTERIM FINANCIAL STATEMENTS FOR THE THREE MONTHS ENDED JUNE 30, 2020
2020/21 – First Quarter Report 24
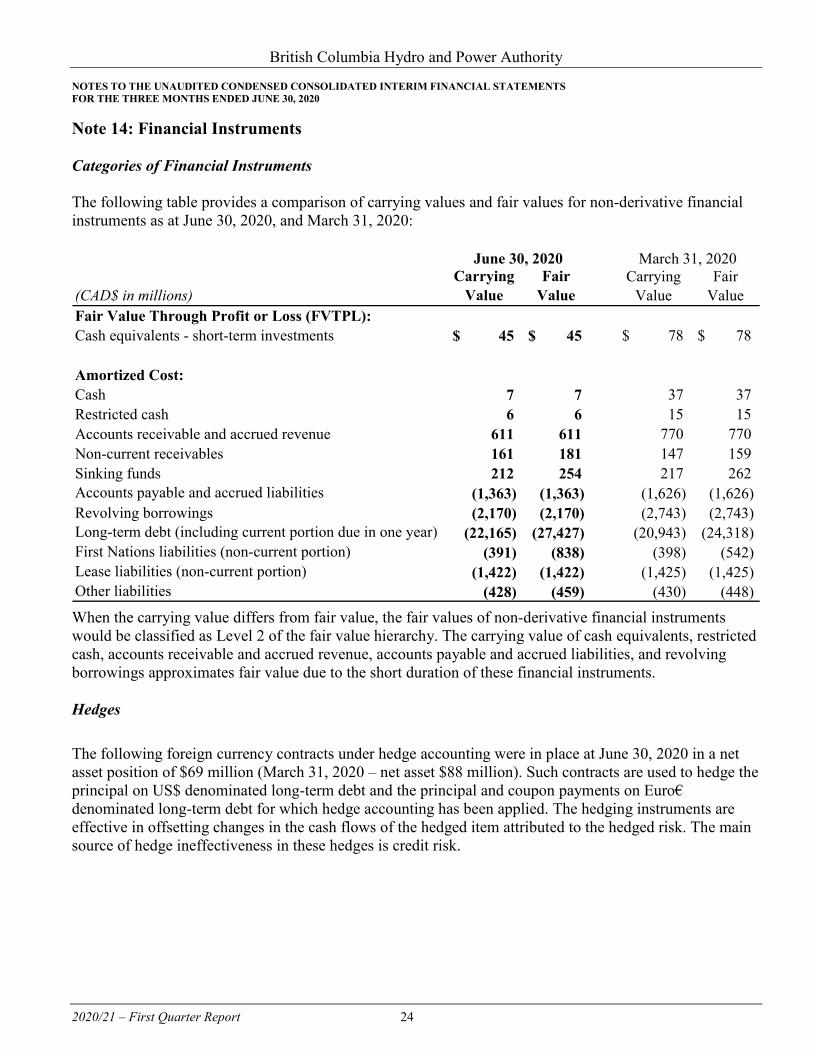
Note 14: Financial Instruments Categories of Financial Instruments The following table provides a comparison of carrying values and fair values for non-derivative financial instruments as at June 30, 2020, and March 31, 2020:
When the carrying value differs from fair value, the fair values of non-derivative financial instruments would be classified as Level 2 of the fair value hierarchy. The carrying value of cash equivalents, restricted cash, accounts receivable and accrued revenue, accounts payable and accrued liabilities, and revolving borrowings approximates fair value due to the short duration of these financial instruments. Hedges The following foreign currency contracts under hedge accounting were in place at June 30, 2020 in a net asset position of $69 million (March 31, 2020 – net asset $88 million). Such contracts are used to hedge the principal on US$ denominated long-term debt and the principal and coupon payments on Euro€ denominated long-term debt for which hedge accounting has been applied. The hedging instruments are effective in offsetting changes in the cash flows of the hedged item attributed to the hedged risk. The main source of hedge ineffectiveness in these hedges is credit risk.
(CAD$ in millions)Carrying
ValueFair
ValueCarrying
ValueFair
ValueFair Value Through Profit or Loss (FVTPL):Cash equivalents - short-term investments $ 45 $ 45 $ 78 $ 78
Amortized Cost:Cash 7 7 37 37 Restricted cash 6 6 15 15 Accounts receivable and accrued revenue 611 611 770 770 Non-current receivables 161 181 147 159 Sinking funds 212 254 217 262 Accounts payable and accrued liabilities (1,363) (1,363) (1,626) (1,626)Revolving borrowings (2,170) (2,170) (2,743) (2,743)Long-term debt (including current portion due in one year) (22,165) (27,427) (20,943) (24,318)First Nations liabilities (non-current portion) (391) (838) (398) (542)Lease liabilities (non-current portion) (1,422) (1,422) (1,425) (1,425)Other liabilities (428) (459) (430) (448)
June 30, 2020 March 31, 2020
British Columbia Hydro and Power Authority NOTES TO THE UNAUDITED CONDENSED CONSOLIDATED INTERIM FINANCIAL STATEMENTS FOR THE THREE MONTHS ENDED JUNE 30, 2020
2020/21 – First Quarter Report 25
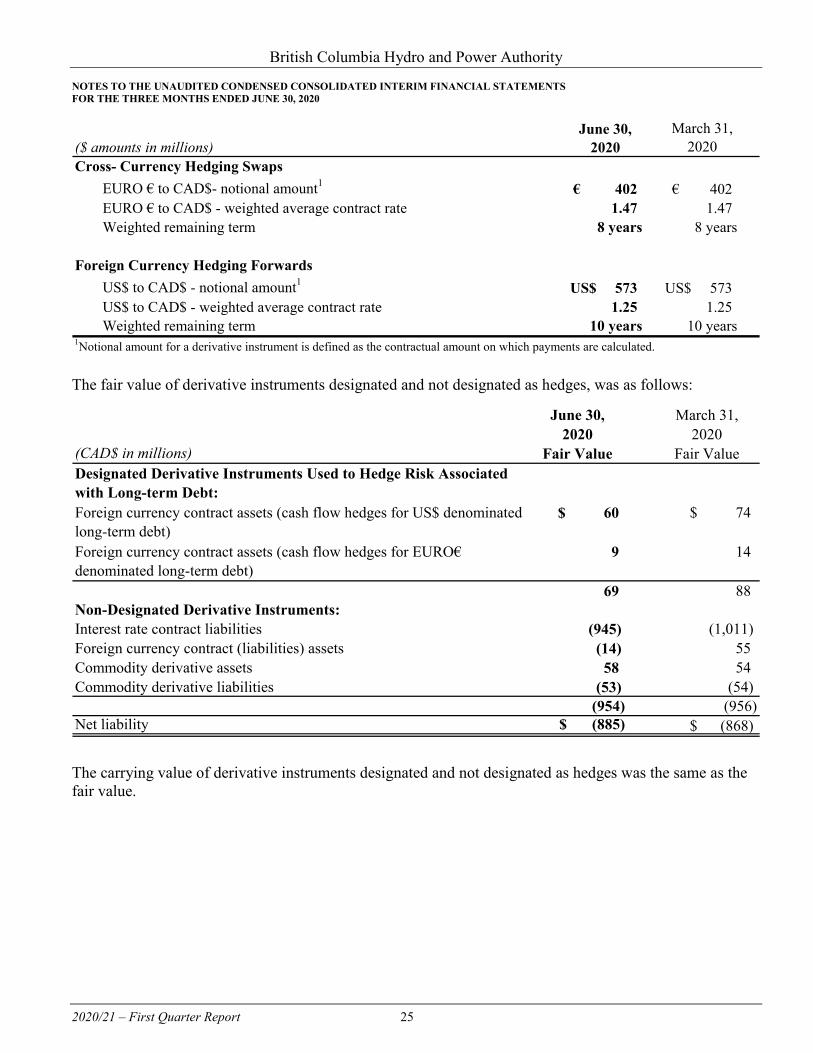
The fair value of derivative instruments designated and not designated as hedges, was as follows:
The carrying value of derivative instruments designated and not designated as hedges was the same as the fair value.
($ amounts in millions)June 30,
2020March 31,
2020Cross- Currency Hedging Swaps
EURO € to CAD$- notional amount1 402€ 402€ EURO € to CAD$ - weighted average contract rate 1.47 1.47 Weighted remaining term 8 years 8 years
Foreign Currency Hedging ForwardsUS$ to CAD$ - notional amount1 US$ 573 US$ 573US$ to CAD$ - weighted average contract rate 1.25 1.25 Weighted remaining term 10 years 10 years
1Notional amount for a derivative instrument is defined as the contractual amount on which payments are calculated.
(CAD$ in millions)Designated Derivative Instruments Used to Hedge Risk Associated with Long-term Debt:Foreign currency contract assets (cash flow hedges for US$ denominated long-term debt)
$ 60 $ 74
Foreign currency contract assets (cash flow hedges for EURO€ denominated long-term debt)
9 14
69 88 Non-Designated Derivative Instruments:Interest rate contract liabilities (945) (1,011)Foreign currency contract (liabilities) assets (14) 55 Commodity derivative assets 58 54 Commodity derivative liabilities (53) (54)
(954) (956) Net liability (885)$ $ (868)
June 30,
Fair Value2020
March 31,2020
Fair Value
British Columbia Hydro and Power Authority NOTES TO THE UNAUDITED CONDENSED CONSOLIDATED INTERIM FINANCIAL STATEMENTS FOR THE THREE MONTHS ENDED JUNE 30, 2020
2020/21 – First Quarter Report 26
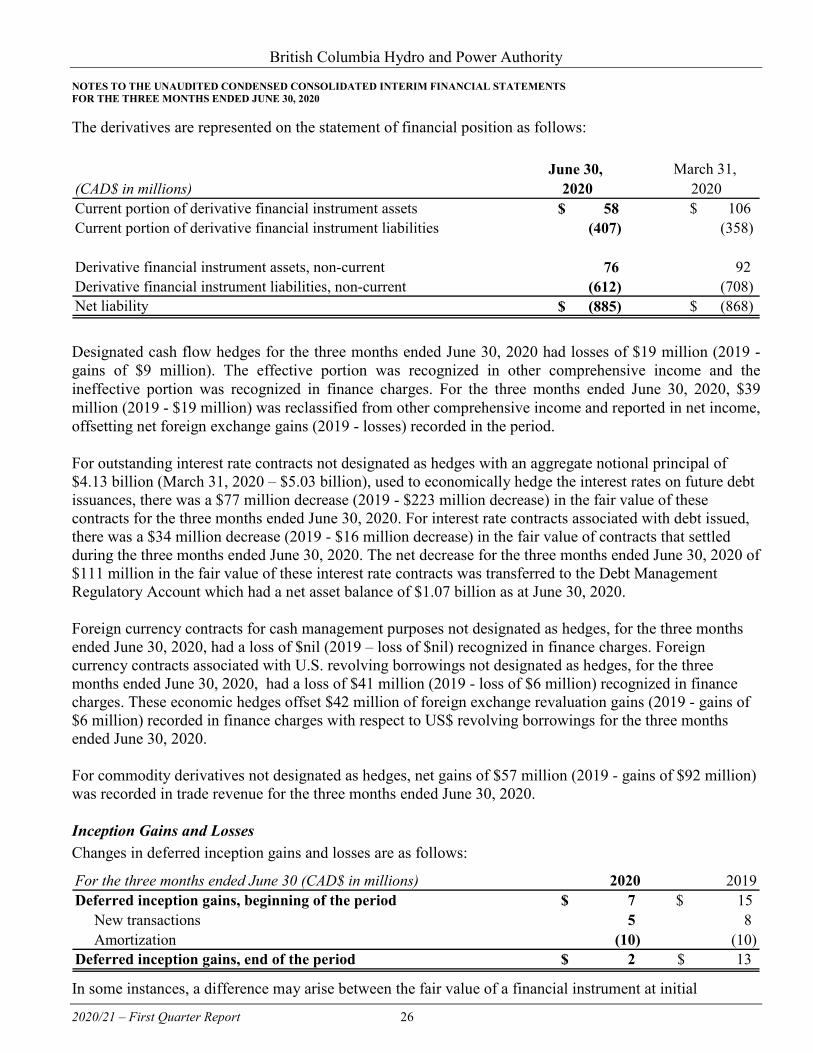
The derivatives are represented on the statement of financial position as follows:
Designated cash flow hedges for the three months ended June 30, 2020 had losses of $19 million (2019 - gains of $9 million). The effective portion was recognized in other comprehensive income and the ineffective portion was recognized in finance charges. For the three months ended June 30, 2020, $39 million (2019 - $19 million) was reclassified from other comprehensive income and reported in net income, offsetting net foreign exchange gains (2019 - losses) recorded in the period. For outstanding interest rate contracts not designated as hedges with an aggregate notional principal of $4.13 billion (March 31, 2020 – $5.03 billion), used to economically hedge the interest rates on future debt issuances, there was a $77 million decrease (2019 - $223 million decrease) in the fair value of these contracts for the three months ended June 30, 2020. For interest rate contracts associated with debt issued, there was a $34 million decrease (2019 - $16 million decrease) in the fair value of contracts that settled during the three months ended June 30, 2020. The net decrease for the three months ended June 30, 2020 of $111 million in the fair value of these interest rate contracts was transferred to the Debt Management Regulatory Account which had a net asset balance of $1.07 billion as at June 30, 2020. Foreign currency contracts for cash management purposes not designated as hedges, for the three months ended June 30, 2020, had a loss of $nil (2019 – loss of $nil) recognized in finance charges. Foreign currency contracts associated with U.S. revolving borrowings not designated as hedges, for the three months ended June 30, 2020, had a loss of $41 million (2019 - loss of $6 million) recognized in finance charges. These economic hedges offset $42 million of foreign exchange revaluation gains (2019 - gains of $6 million) recorded in finance charges with respect to US$ revolving borrowings for the three months ended June 30, 2020. For commodity derivatives not designated as hedges, net gains of $57 million (2019 - gains of $92 million) was recorded in trade revenue for the three months ended June 30, 2020. Inception Gains and Losses Changes in deferred inception gains and losses are as follows:
In some instances, a difference may arise between the fair value of a financial instrument at initial
(CAD$ in millions)Current portion of derivative financial instrument assets $ 58 $ 106 Current portion of derivative financial instrument liabilities (407) (358)
Derivative financial instrument assets, non-current 76 92 Derivative financial instrument liabilities, non-current (612) (708)Net liability $ (885) $ (868)
March 31, 20202020
June 30,
For the three months ended June 30 (CAD$ in millions) 2020 2019Deferred inception gains, beginning of the period 7$ $ 15 New transactions 5 8 Amortization (10) (10) Deferred inception gains, end of the period 2$ 13$
British Columbia Hydro and Power Authority NOTES TO THE UNAUDITED CONDENSED CONSOLIDATED INTERIM FINANCIAL STATEMENTS FOR THE THREE MONTHS ENDED JUNE 30, 2020
2020/21 – First Quarter Report 27
recognition, as defined by its transaction price, and the fair value calculated by a valuation technique or model (inception gain or loss). In addition, the Company’s inception gain or loss on a contract may arise as a result of embedded derivatives which are recorded at fair value, with the remainder of the contract recorded on an accrual basis. In these circumstances, the unrealized inception gain or loss is not recognized in income immediately, but is deferred and amortized into income over the full term of the underlying financial instrument. Credit Risk As a result of the COVID-19 pandemic and material disruptions to businesses and the economy, the Company’s credit risk due to customers not being able to pay their electricity bills when due has increased.
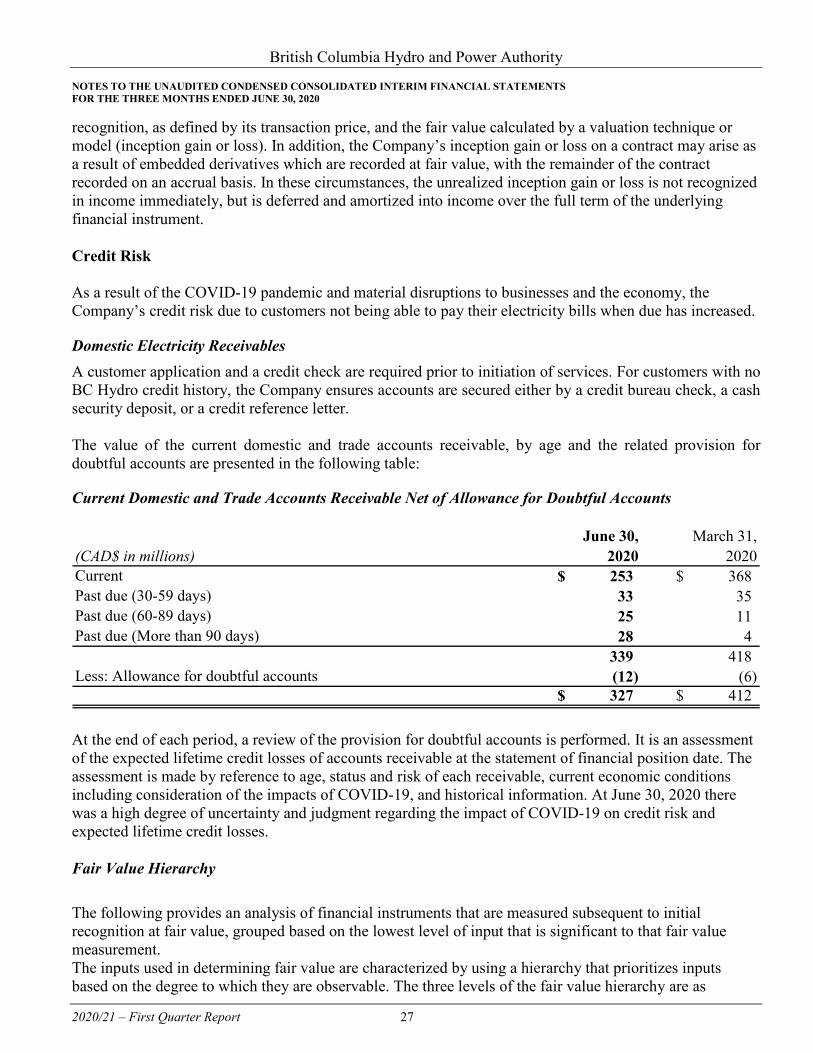
Domestic Electricity Receivables A customer application and a credit check are required prior to initiation of services. For customers with no BC Hydro credit history, the Company ensures accounts are secured either by a credit bureau check, a cash security deposit, or a credit reference letter. The value of the current domestic and trade accounts receivable, by age and the related provision for doubtful accounts are presented in the following table:
Current Domestic and Trade Accounts Receivable Net of Allowance for Doubtful Accounts
At the end of each period, a review of the provision for doubtful accounts is performed. It is an assessment of the expected lifetime credit losses of accounts receivable at the statement of financial position date. The assessment is made by reference to age, status and risk of each receivable, current economic conditions including consideration of the impacts of COVID-19, and historical information. At June 30, 2020 there was a high degree of uncertainty and judgment regarding the impact of COVID-19 on credit risk and expected lifetime credit losses. Fair Value Hierarchy The following provides an analysis of financial instruments that are measured subsequent to initial recognition at fair value, grouped based on the lowest level of input that is significant to that fair value measurement. The inputs used in determining fair value are characterized by using a hierarchy that prioritizes inputs based on the degree to which they are observable. The three levels of the fair value hierarchy are as
June 30, March 31,(CAD$ in millions) 2020 2020Current 253$ 368$ Past due (30-59 days) 33 35 Past due (60-89 days) 25 11 Past due (More than 90 days) 28 4
339 418 Less: Allowance for doubtful accounts (12) (6)
327$ 412$
British Columbia Hydro and Power Authority NOTES TO THE UNAUDITED CONDENSED CONSOLIDATED INTERIM FINANCIAL STATEMENTS FOR THE THREE MONTHS ENDED JUNE 30, 2020
2020/21 – First Quarter Report 28
follows:
• Level 1 - values are quoted prices (unadjusted) in active markets for identical assets and liabilities.
• Level 2 - inputs are those other than quoted prices included within Level 1 that are observable for the asset or liability, either directly or indirectly, as of the reporting date. The Company determines Level 2 fair values for debt securities and derivatives using discounted cash flow techniques, which use contractual cash flows and market-related discount rates. Level 2 fair values for commodity derivatives are determined using inputs other than unadjusted quoted prices that are observable for the asset or liability, either directly (i.e. as prices) or indirectly (i.e., derived from prices). Level 2 includes bilateral and over-the-counter contracts valued using interpolation from observable forward curves or broker quotes from active markets for similar instruments and other publicly available data, and options valued using industry-standard and accepted models incorporating only observable data inputs.
• Level 3 - inputs are those that are not based on observable market data. Level 3 fair values for
commodity derivatives are determined using inputs that are based on significant unobservable inputs.
Level 3 includes instruments valued using observable prices adjusted for unobservable basis differentials such as delivery location and product quality, instruments which are valued by extrapolation of observable market information into periods for which observable market information is not yet available, and instruments valued using internally developed or non-standard valuation models.
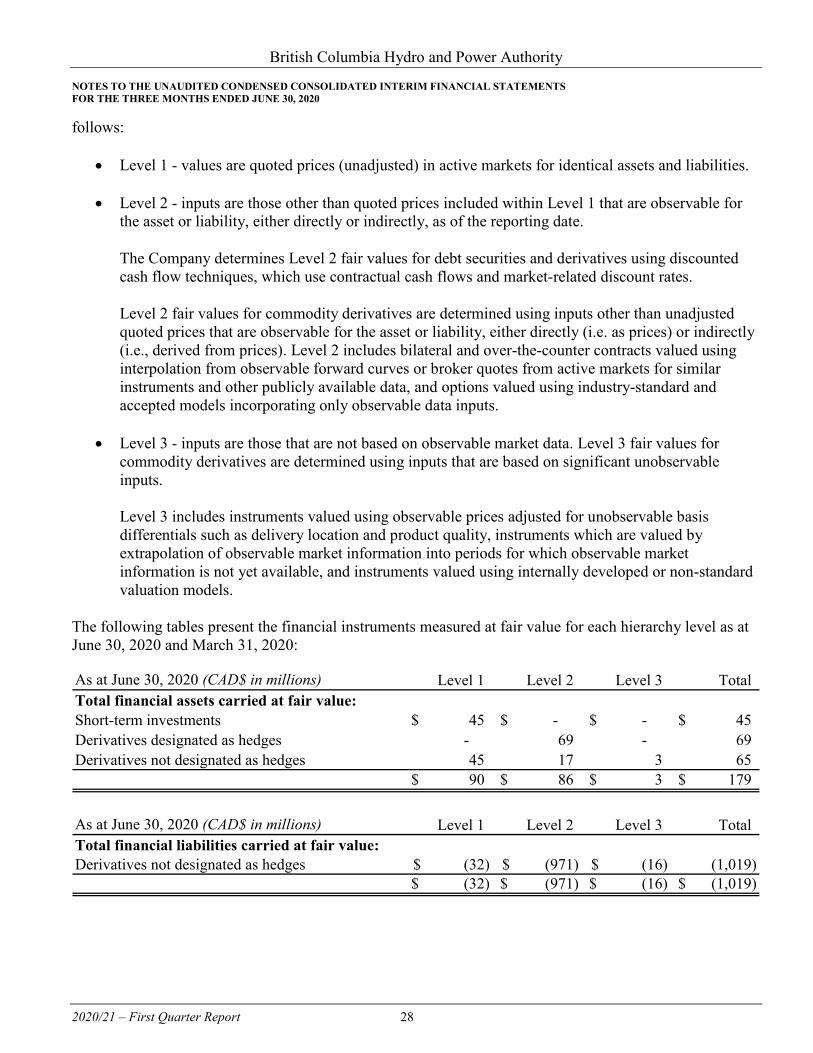
The following tables present the financial instruments measured at fair value for each hierarchy level as at June 30, 2020 and March 31, 2020:
As at June 30, 2020 (CAD$ in millions) Level 1 Level 2 Level 3 TotalTotal financial assets carried at fair value:Short-term investments 45$ -$ -$ 45$ Derivatives designated as hedges - 69 - 69 Derivatives not designated as hedges 45 17 3 65
90$ 86$ 3$ 179$
As at June 30, 2020 (CAD$ in millions) Level 1 Level 2 Level 3 TotalTotal financial liabilities carried at fair value:Derivatives not designated as hedges (32)$ (971)$ (16)$ (1,019)
(32)$ (971)$ (16)$ (1,019)$
British Columbia Hydro and Power Authority NOTES TO THE UNAUDITED CONDENSED CONSOLIDATED INTERIM FINANCIAL STATEMENTS FOR THE THREE MONTHS ENDED JUNE 30, 2020
2020/21 – First Quarter Report 29
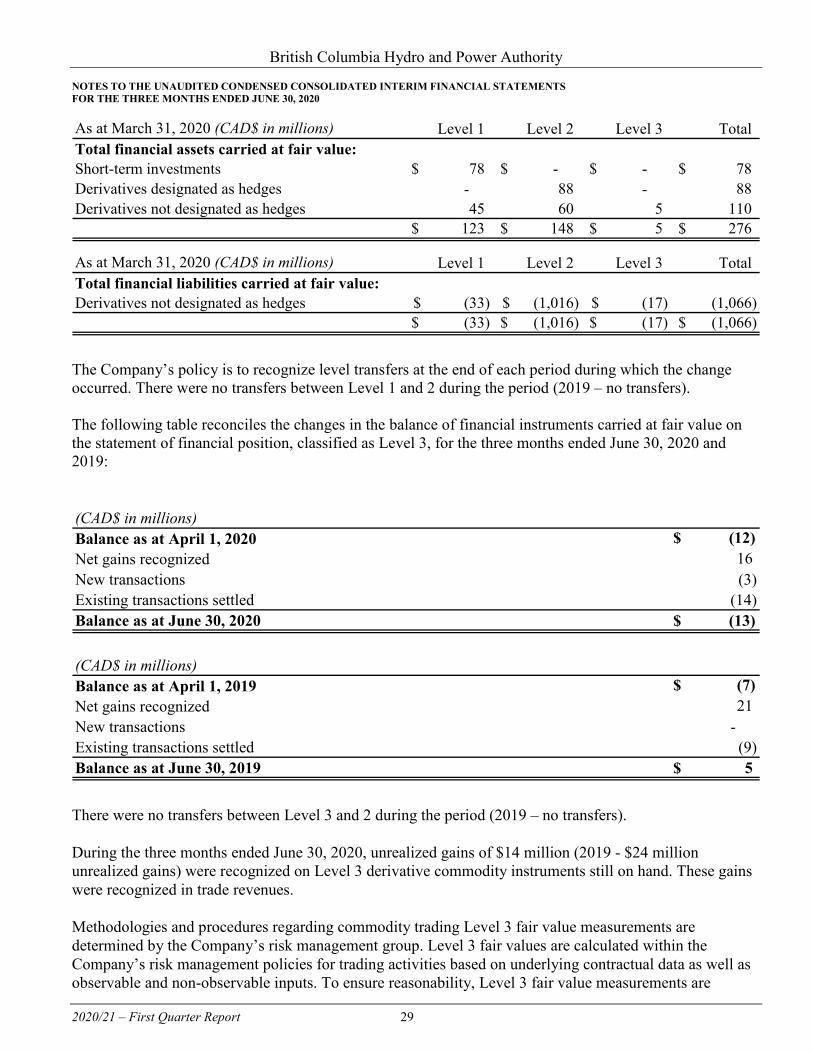
The Company’s policy is to recognize level transfers at the end of each period during which the change occurred. There were no transfers between Level 1 and 2 during the period (2019 – no transfers). The following table reconciles the changes in the balance of financial instruments carried at fair value on the statement of financial position, classified as Level 3, for the three months ended June 30, 2020 and 2019:
There were no transfers between Level 3 and 2 during the period (2019 – no transfers). During the three months ended June 30, 2020, unrealized gains of $14 million (2019 - $24 million unrealized gains) were recognized on Level 3 derivative commodity instruments still on hand. These gains were recognized in trade revenues. Methodologies and procedures regarding commodity trading Level 3 fair value measurements are determined by the Company’s risk management group. Level 3 fair values are calculated within the Company’s risk management policies for trading activities based on underlying contractual data as well as observable and non-observable inputs. To ensure reasonability, Level 3 fair value measurements are
As at March 31, 2020 (CAD$ in millions) Level 1 Level 2 Level 3 TotalTotal financial assets carried at fair value:Short-term investments 78$ -$ -$ 78$ Derivatives designated as hedges - 88 - 88 Derivatives not designated as hedges 45 60 5 110
123$ 148$ 5$ 276$
As at March 31, 2020 (CAD$ in millions) Level 1 Level 2 Level 3 TotalTotal financial liabilities carried at fair value:Derivatives not designated as hedges (33)$ (1,016)$ (17)$ (1,066)
(33)$ (1,016)$ (17)$ (1,066)$
(CAD$ in millions)Balance as at April 1, 2020 $ (12)Net gains recognized 16 New transactions (3) Existing transactions settled (14) Balance as at June 30, 2020 $ (13)
(CAD$ in millions)Balance as at April 1, 2019 $ (7)Net gains recognized 21 New transactions - Existing transactions settled (9) Balance as at June 30, 2019 $ 5
British Columbia Hydro and Power Authority NOTES TO THE UNAUDITED CONDENSED CONSOLIDATED INTERIM FINANCIAL STATEMENTS FOR THE THREE MONTHS ENDED JUNE 30, 2020
2020/21 – First Quarter Report 30
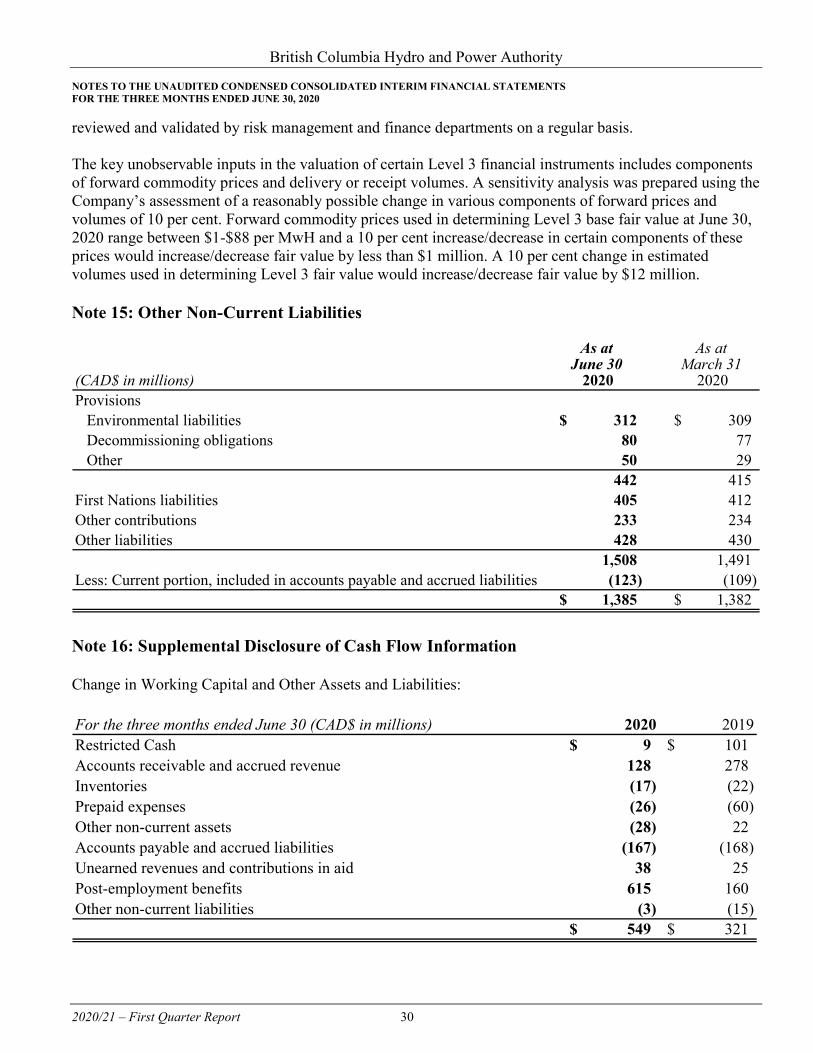
reviewed and validated by risk management and finance departments on a regular basis. The key unobservable inputs in the valuation of certain Level 3 financial instruments includes components of forward commodity prices and delivery or receipt volumes. A sensitivity analysis was prepared using the Company’s assessment of a reasonably possible change in various components of forward prices and volumes of 10 per cent. Forward commodity prices used in determining Level 3 base fair value at June 30, 2020 range between $1-$88 per MwH and a 10 per cent increase/decrease in certain components of these prices would increase/decrease fair value by less than $1 million. A 10 per cent change in estimated volumes used in determining Level 3 fair value would increase/decrease fair value by $12 million. Note 15: Other Non-Current Liabilities
Note 16: Supplemental Disclosure of Cash Flow Information Change in Working Capital and Other Assets and Liabilities:
As at As atJune 30 March 31
(CAD$ in millions) 2020 2020Provisions Environmental liabilities 312$ 309$ Decommissioning obligations 80 77 Other 50 29
442 415 First Nations liabilities 405 412 Other contributions 233 234 Other liabilities 428 430
1,508 1,491 Less: Current portion, included in accounts payable and accrued liabilities (123) (109)
1,385$ 1,382$
For the three months ended June 30 (CAD$ in millions) 2020 2019Restricted Cash 9$ 101$ Accounts receivable and accrued revenue 128 278 Inventories (17) (22) Prepaid expenses (26) (60) Other non-current assets (28) 22 Accounts payable and accrued liabilities (167) (168) Unearned revenues and contributions in aid 38 25 Post-employment benefits 615 160 Other non-current liabilities (3) (15)
549$ 321$
British Columbia Hydro and Power Authority NOTES TO THE UNAUDITED CONDENSED CONSOLIDATED INTERIM FINANCIAL STATEMENTS FOR THE THREE MONTHS ENDED JUNE 30, 2020
2020/21 – First Quarter Report 31
Non-Cash Investing Transactions:
Note 17: Seasonality of Operating Results Due to the seasonal nature of the Company’s operations, the condensed consolidated interim statement of comprehensive income is not indicative of operations on an annual basis. Seasonal impacts of weather, including its impact on water inflows, energy consumption within the region and market prices of energy, can have a significant impact on the Company’s operating results.
For the three months ended June 30 (CAD$ in millions) 2020 2019Contributions in kind received for property, plant and equipment 13$ 10$