brisbane city council - brisbane.qld.gov.au · brisbane city council ... are adjusted in the...
TRANSCRIPT
Brisbane City Council
Quarterly Financial Report
September 2006
Prepared by:
Corporate Finance
Corporate Services
PAGE
2
Section 1
4
9
Section 2
21
2.1 City Governance 26
2.2 Economic Development 30
2.3 Customer Focus 34
2.4 Your Brisbane 38
2.5 Public Health and Safety 42
2.6 Future Brisbane 46
2.7 Moving Brisbane 50
2.8 Accessible Brisbane 54
2.9 Natural Environment, Sustainability and Parks 58
2.10 Healthy Waterways 64
2.11 Water Supply and Sewerage 70
2.12 Organisational Capability 74
2.13 Information and Communications Technology 78
Section 3
Brisbane Water 83
Brisbane Transport 89
Brisbane City Works 95
101
BRISBANE CITY COUNCIL
Council Financial Statements
COUNCIL RESULTS
Overview of the Financial Statements
QUARTERLY FINANCIAL REPORT
PERIOD ENDED SEPTEMBER 2006
TABLE OF CONTENTS
Special Notes
City Business
BUSINESS UNIT RESULTS
CORE SERVICES RESULTS
Core Services Program Summaries
SPECIAL NOTES
h This is a Special Purpose Financial Report.
h This report has been prepared to show the approved budget against the year to date financial position. In addition, this report gives an overview of the commercial operations and financial well-being of the Council’s business units.
h This report shows the financial performance of Council in three separate sections:
Section 1 - Council Results (including the Business Units)
Section 2 - Core Services Results (Council Results excluding Business Unit Results)
Section 3 - Business Unit Results
h This report has been prepared using figures from the accounting systems, which closed on 29 September 2006.
h Australian equivalents to International Financial Reporting Standards (AIFRS) are effective from 1 July 2005 and have been adopted by Council.
h Detailed explanations are contained in this report for activity variances more than $100,000 plus any variance explanations that are considered appropriate by the Divisional Managers.
h The Appropriations and Reserve Transfers Statement reflects the required appropriation for the reduction in debt principal and for the acquisition of property, plant and equipment funded from revenues raised for the period to September 2006.
h The Revised Budget approved on 14th September 2006 has been used to determine the activity, outcome and program variances and the Business Unit report submissions for this Quarterly Report.
h The City Business Report in section 3 includes all activities of the business unit. However, some City Business activities operate in programs other than the Business Group and Other Services program. Explanations for these variances are reported in Section 2.
h
Council level because of internal trading imbalances. These imbalances are addressed through management of the budget at a divisional level. For the purpose of the Quarterly Report, imbalances are adjusted in the budgeted Income Statement.
h Permanent vs timing difference classification:
Permanent and timing differences are classified with reference to the budget position for the total activity.
A permanent difference is defined as a current variance that:
- is not offset by other variances within the same activity budget, and - will result in a periodic budget review submission.
For the purpose of the Quarterly Financial Report, a permanent difference will only relate to the total activity budget.
Differences not expected to give rise to permanent differences at the end of the financial year are classified as timing differences.
All differences in the final Quarterly Financial Report for each year are considered permanent.
The budget by Program and the budget by Income Statement may not agree at a whole of
2
Section 1
Council Results
3
Section 1
BRISBANE CITY COUNCILOverview of the Financial Statements
For the Period Ended September 2006
Ratios
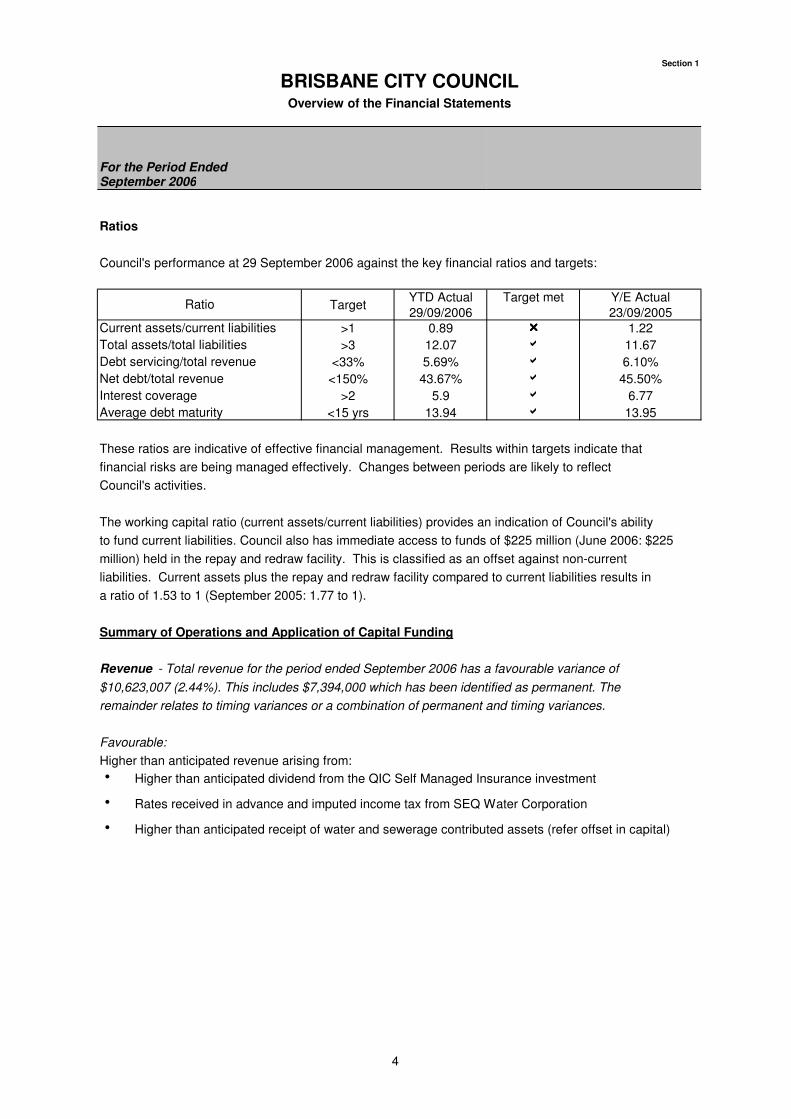
Council's performance at 29 September 2006 against the key financial ratios and targets:
TargetYTD Actual 29/09/2006
Target met Y/E Actual 23/09/2005
>1 0.89 rrrr 1.22
>3 12.07 a 11.67
<33% 5.69% a 6.10%
<150% 43.67% a 45.50%
>2 5.9 a 6.77
<15 yrs 13.94 a 13.95
These ratios are indicative of effective financial management. Results within targets indicate that
financial risks are being managed effectively. Changes between periods are likely to reflect
Council's activities.
The working capital ratio (current assets/current liabilities) provides an indication of Council's ability
to fund current liabilities. Council also has immediate access to funds of $225 million (June 2006: $225
million) held in the repay and redraw facility. This is classified as an offset against non-current
liabilities. Current assets plus the repay and redraw facility compared to current liabilities results in
a ratio of 1.53 to 1 (September 2005: 1.77 to 1).
Summary of Operations and Application of Capital Funding
Revenue - Total revenue for the period ended September 2006 has a favourable variance of
$10,623,007 (2.44%). This includes $7,394,000 which has been identified as permanent. The
remainder relates to timing variances or a combination of permanent and timing variances.
Favourable:
Higher than anticipated revenue arising from:
h Higher than anticipated dividend from the QIC Self Managed Insurance investment
h Rates received in advance and imputed income tax from SEQ Water Corporation
h Higher than anticipated receipt of water and sewerage contributed assets (refer offset in capital)
Ratio
Current assets/current liabilities
Net debt/total revenue
Average debt maturity
Total assets/total liabilities
Debt servicing/total revenue
Interest coverage
4
Section 1
Overview of the Financial Statements
For the Period Ended September 2006
Overview (Continued)
Summary of Operations and Application of Capital Funding (Continued)
Expenses - Total operating expenditure for the period ended September 2006 has a favourable
variance of $8,759,105 (2.31%). This includes an unfavourable variance of $13,837,000 which has
been identified as permanent. The offsetting favourable difference relates to a combination of
permanent and timing variances.
Favourable:
Lower than anticipated expenses arising from:
h Later than anticipated progress of the Airport Link and Hale Street Link projects
h Lower than anticipated bus depreciation resulting from deferral of capitalisations
h Lower than anticipated billing by the 21 Councils participating in the South-East Queensland
Regulation Reduction Incentive Fund project
Unfavourable:
Higher than anticipated expenses arising from:
h Lower than anticipated depreciation and increased capital works relating to Water & Sewerage
Assets
Capital - Total capital expenditure for the period ended September 2006 is under budget by
$1,822,708 (1.23%). This includes an unfavourable variance of $8,902,000 which has been identified
as permanent. The offsetting favourable difference relates to timing variances and a combination of
permanent and timing variances.
Under Budget:
h Later than anticipated progress on the Brisbane Square Accommodation project
h Later than anticipated commencement of the Zillman Road and Bertha Street Hendra projects
Over Budget:
h Higher than anticipated receipt of water and sewerage contributed assets (refer offset in revenue)
Balance Sheet
Since September 2005 Council’s total equity (wealth) has increased from $13.4 billion to $14.4 billion.
This is mainly due to increases in the Asset Revaluation Reserve of $800 million refer corresponding
increase in property, plant and equipment.
Cash and deposits have decreased by $31 million to $131 million since September 2005. Council
continues to closely monitor its cash flow position on a daily basis and using monthly forecasts.
BRISBANE CITY COUNCIL
5
Section 1
BRISBANE CITY COUNCILOverview of the Financial Statements
For the Period Ended September 2006
Overview (Continued)
Balance Sheet (continued)
Trade and other receivables have increased by $22 million which is mainly due to changes in the levying and billing of commercial customers as a result of the implementation of the Billing Optimisation Project.
Property, plant and equipment have increased by $1 billion since September 2005. This relatesmainly to the asset revaluation process, in particular infrastructure assets. Capital work in progress hasdecreased by $46 million due to an increase in capitalisation activity following completion of projects during the year. The capitalised balances have increased property, plant and equipment.
Trade and other payables have increased $54 million which is mainly due to the accrual of land resumptions in relation to the North South Bypass Tunnel.
Other financial liabilities have decreased by $39 million which is mainly due to an increase in the repay and redraw facility. The facility is offset against the balance of non-current debt with QueenslandTreasury Corporation.
Defined benefit superannuation plan (asset and liability) has increased overall by $4.8 million. This is due to an increase in the performance of the plan and the return to a positive position in 2006.
Statement of Capital Funding
This statement indicates that for the period ended September 2006, $68 million has been appropriatedfrom the increase in operating capability to fund asset acquisitions and principal loan repayments.
6
Section 1
BRISBANE CITY COUNCILCouncil Summary of Operations and Application of Capital Funding
For the Period Ended
Actual to
Date
Approved
YTD Budget
Variance
Over(Under)
to DateSeptember 2006 $ $ $
PROGRAMS
Revenue
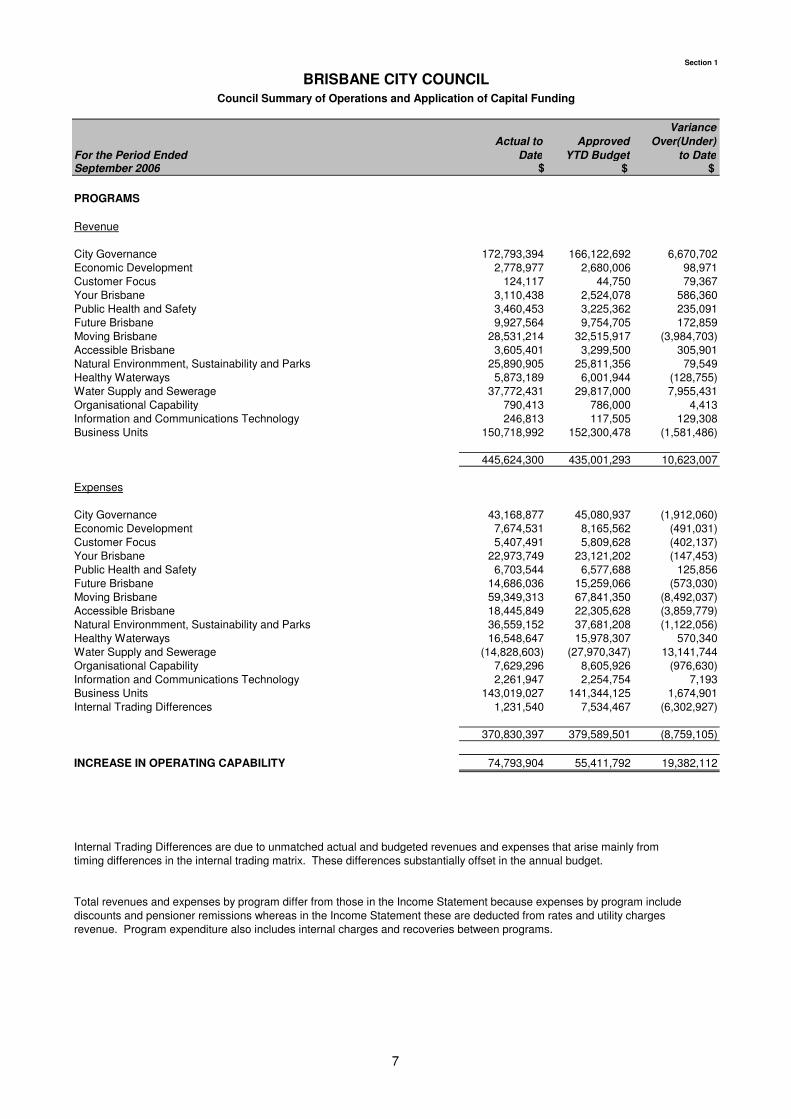
City Governance 172,793,394 166,122,692 6,670,702Economic Development 2,778,977 2,680,006 98,971Customer Focus 124,117 44,750 79,367Your Brisbane 3,110,438 2,524,078 586,360Public Health and Safety 3,460,453 3,225,362 235,091Future Brisbane 9,927,564 9,754,705 172,859Moving Brisbane 28,531,214 32,515,917 (3,984,703)Accessible Brisbane 3,605,401 3,299,500 305,901Natural Environmment, Sustainability and Parks 25,890,905 25,811,356 79,549Healthy Waterways 5,873,189 6,001,944 (128,755)Water Supply and Sewerage 37,772,431 29,817,000 7,955,431Organisational Capability 790,413 786,000 4,413Information and Communications Technology 246,813 117,505 129,308Business Units 150,718,992 152,300,478 (1,581,486)
445,624,300 435,001,293 10,623,007
Expenses
City Governance 43,168,877 45,080,937 (1,912,060)Economic Development 7,674,531 8,165,562 (491,031)Customer Focus 5,407,491 5,809,628 (402,137)Your Brisbane 22,973,749 23,121,202 (147,453)Public Health and Safety 6,703,544 6,577,688 125,856Future Brisbane 14,686,036 15,259,066 (573,030)Moving Brisbane 59,349,313 67,841,350 (8,492,037)Accessible Brisbane 18,445,849 22,305,628 (3,859,779)Natural Environmment, Sustainability and Parks 36,559,152 37,681,208 (1,122,056)Healthy Waterways 16,548,647 15,978,307 570,340Water Supply and Sewerage (14,828,603) (27,970,347) 13,141,744Organisational Capability 7,629,296 8,605,926 (976,630)Information and Communications Technology 2,261,947 2,254,754 7,193Business Units 143,019,027 141,344,125 1,674,901Internal Trading Differences 1,231,540 7,534,467 (6,302,927)
370,830,397 379,589,501 (8,759,105)
INCREASE IN OPERATING CAPABILITY 74,793,904 55,411,792 19,382,112
Internal Trading Differences are due to unmatched actual and budgeted revenues and expenses that arise mainly from timing differences in the internal trading matrix. These differences substantially offset in the annual budget.
Total revenues and expenses by program differ from those in the Income Statement because expenses by program includediscounts and pensioner remissions whereas in the Income Statement these are deducted from rates and utility chargesrevenue. Program expenditure also includes internal charges and recoveries between programs.
7

Section 1
BRISBANE CITY COUNCILCouncil Summary of Operations and Application of Capital Funding
For the Period Ended
Actual to
Date
Approved
YTD Budget
Variance
Over(Under)
to DateSeptember 2006 $ $ $
APPLICATION OF CAPITAL FUNDING
(Acquisition of non-current assets)
City Governance 4,604,088 9,385,000 (4,780,912)Economic Development - - -Customer Focus 1,665 51,000 (49,335)Your Brisbane 1,125,147 1,101,250 23,897Public Health and Safety 2,506 - 2,506Future Brisbane 1,075,575 1,680,000 (604,425)Moving Brisbane 62,957,568 64,772,336 (1,814,768)Accessible Brisbane 17,977,662 18,152,766 (175,104)Natural Environmment, Sustainability and Parks 3,173,575 4,309,400 (1,135,825)Healthy Waterways 9,760,635 12,114,000 (2,353,365)Water Supply and Sewerage 44,118,461 32,883,200 11,235,261Organisational Capability - - -Information and Communications Technology 299,451 1,088,000 (788,549)Business Units 809,710 2,191,799 (1,382,089)
145,906,043 147,728,751 (1,822,708)
Council Summary (continued)
PROGRAMS (continued)
8
For the Period Ended
Actual
to Date
Anticipated
Position
Jun 2007
Actual
Sept 2005
$000 $000 $000
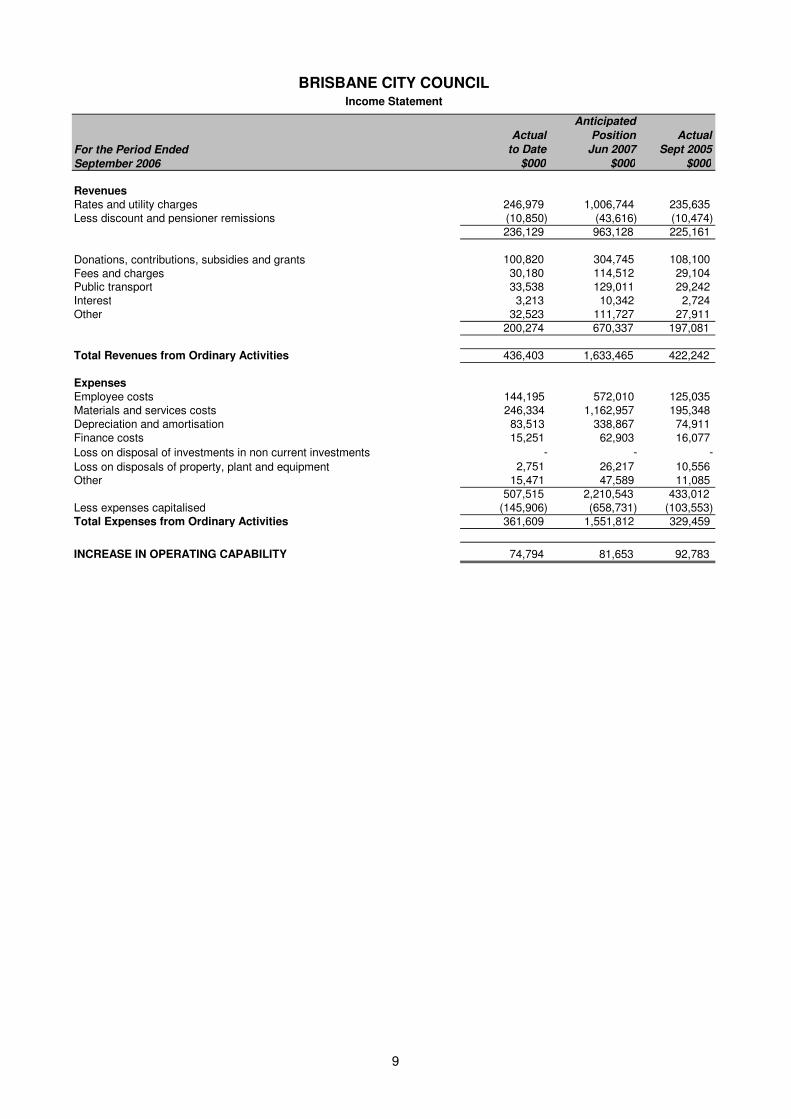
RevenuesRates and utility charges 246,979 1,006,744 235,635 Less discount and pensioner remissions (10,850) (43,616) (10,474)
236,129 963,128 225,161
100,820 304,745 108,100 30,180 114,512 29,104
Public transport 33,538 129,011 29,242 Interest 3,213 10,342 2,724 Other 32,523 111,727 27,911
200,274 670,337 197,081
Total Revenues from Ordinary Activities 436,403 1,633,465 422,242
ExpensesEmployee costs 144,195 572,010 125,035 Materials and services costs 246,334 1,162,957 195,348 Depreciation and amortisation 83,513 338,867 74,911 Finance costs 15,251 62,903 16,077
- - -
2,751 26,217 10,556 Other 15,471 47,589 11,085
507,515 2,210,543 433,012Less expenses capitalised (145,906) (658,731) (103,553)Total Expenses from Ordinary Activities 361,609 1,551,812 329,459
INCREASE IN OPERATING CAPABILITY 74,794 81,653 92,783
Loss on disposal of investments in non current investments
Loss on disposals of property, plant and equipment
BRISBANE CITY COUNCILIncome Statement
Fees and charges
September 2006
Donations, contributions, subsidies and grants
9
Actual
to Date
Anticipated
Position
Jun 2007
Actual
Sept 2005
September 2006 $000 $000 $000
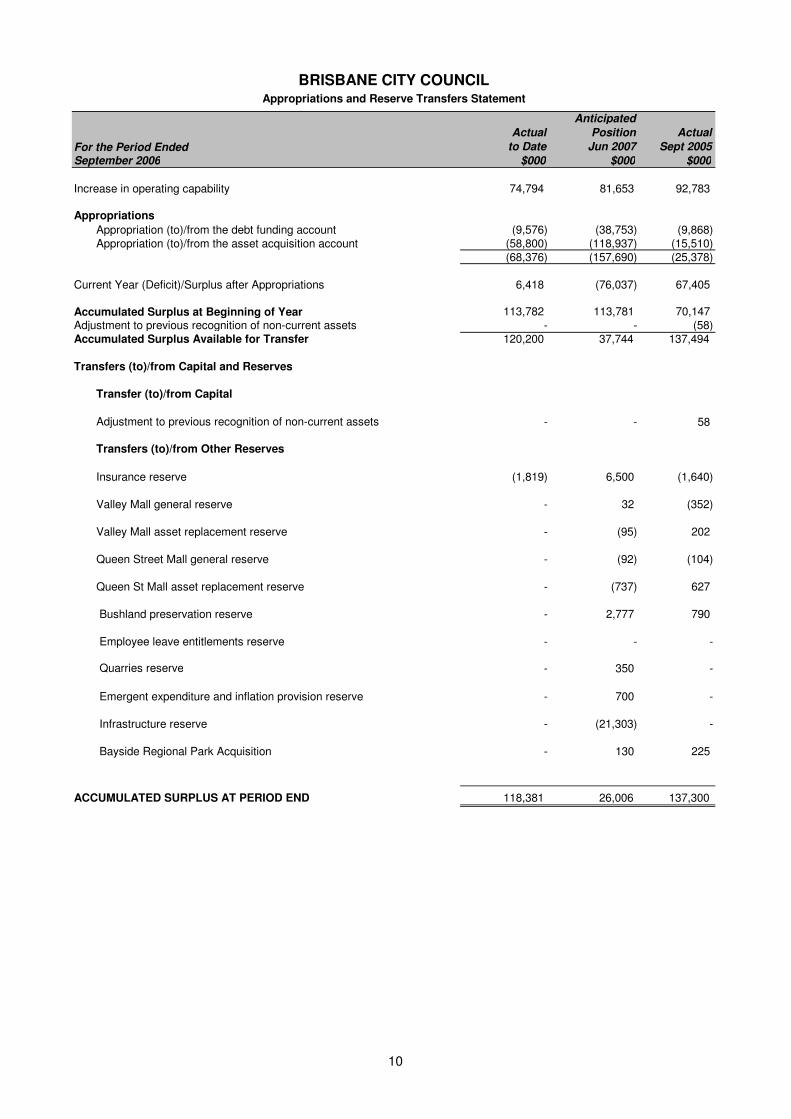
Increase in operating capability 74,794 81,653 92,783
Appropriations
Appropriation (to)/from the debt funding account (9,576) (38,753) (9,868) Appropriation (to)/from the asset acquisition account (58,800) (118,937) (15,510)
(68,376) (157,690) (25,378)
Current Year (Deficit)/Surplus after Appropriations 6,418 (76,037) 67,405
113,782 113,781 70,147 Adjustment to previous recognition of non-current assets - - (58)Accumulated Surplus Available for Transfer 120,200 37,744 137,494
Transfers (to)/from Capital and Reserves
Transfer (to)/from Capital
- - 58
Transfers (to)/from Other Reserves
Insurance reserve (1,819) 6,500 (1,640)
Valley Mall general reserve - 32 (352)
Valley Mall asset replacement reserve - (95) 202
Queen Street Mall general reserve - (92) (104)
Queen St Mall asset replacement reserve - (737) 627
Bushland preservation reserve - 2,777 790
Employee leave entitlements reserve - - -
Quarries reserve - 350 -
Emergent expenditure and inflation provision reserve - 700 -
Infrastructure reserve - (21,303) -
Bayside Regional Park Acquisition - 130 225
ACCUMULATED SURPLUS AT PERIOD END 118,381 26,006 137,300
BRISBANE CITY COUNCILAppropriations and Reserve Transfers Statement
Accumulated Surplus at Beginning of Year
For the Period Ended
Adjustment to previous recognition of non-current assets
10
Actual
to Date
Anticipated
Position
Jun 2007
Actual
Sept 2005
September 2006 $000 $000 $000
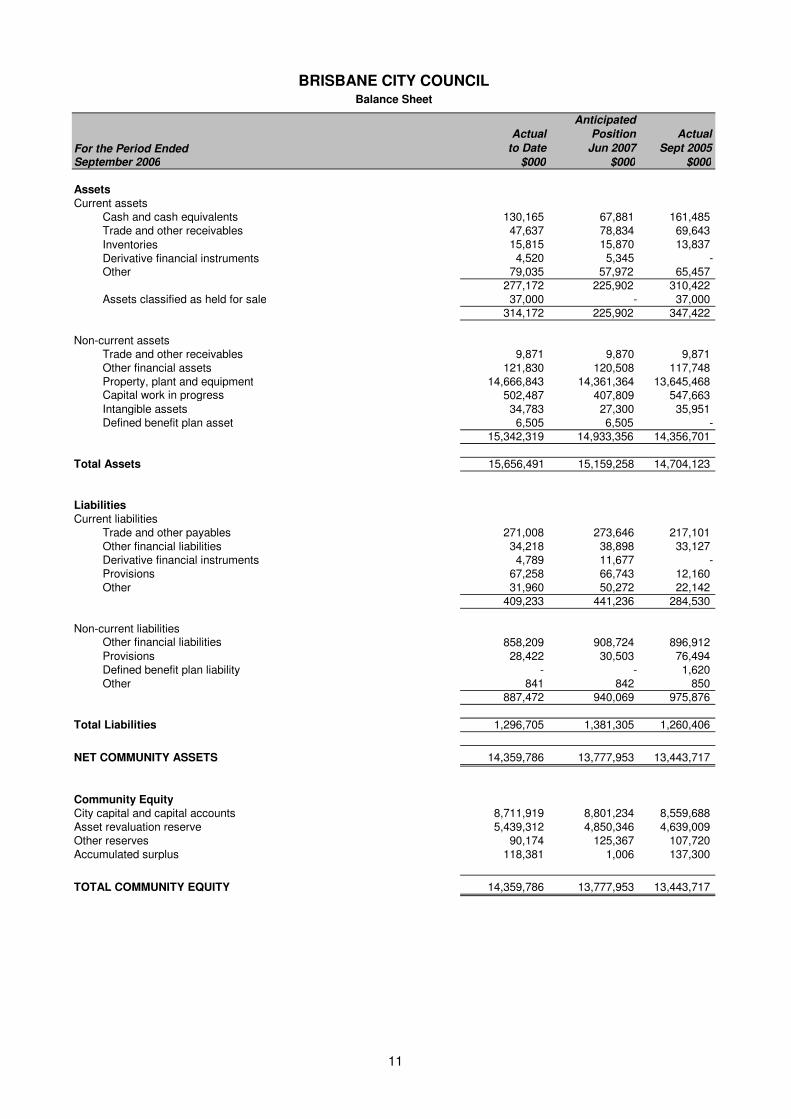
AssetsCurrent assets Cash and cash equivalents 130,165 67,881 161,485 Trade and other receivables 47,637 78,834 69,643
15,815 15,870 13,837 4,520 5,345 -
Other 79,035 57,972 65,457 277,172 225,902 310,422
Assets classified as held for sale 37,000 - 37,000 314,172 225,902 347,422
Non-current assets Trade and other receivables 9,871 9,870 9,871 Other financial assets 121,830 120,508 117,748 Property, plant and equipment 14,666,843 14,361,364 13,645,468 Capital work in progress 502,487 407,809 547,663 Intangible assets 34,783 27,300 35,951 Defined benefit plan asset 6,505 6,505 -
15,342,319 14,933,356 14,356,701
Total Assets 15,656,491 15,159,258 14,704,123
LiabilitiesCurrent liabilities Trade and other payables 271,008 273,646 217,101 Other financial liabilities 34,218 38,898 33,127 Derivative financial instruments 4,789 11,677 - Provisions 67,258 66,743 12,160 Other 31,960 50,272 22,142
409,233 441,236 284,530
Non-current liabilities Other financial liabilities 858,209 908,724 896,912 Provisions 28,422 30,503 76,494 Defined benefit plan liability - - 1,620 Other 841 842 850
887,472 940,069 975,876
Total Liabilities 1,296,705 1,381,305 1,260,406
NET COMMUNITY ASSETS 14,359,786 13,777,953 13,443,717
Community EquityCity capital and capital accounts 8,711,919 8,801,234 8,559,688 Asset revaluation reserve 5,439,312 4,850,346 4,639,009 Other reserves 90,174 125,367 107,720 Accumulated surplus 118,381 1,006 137,300
TOTAL COMMUNITY EQUITY 14,359,786 13,777,953 13,443,717
BRISBANE CITY COUNCILBalance Sheet
Inventories
For the Period Ended
Derivative financial instruments
11
Total
Accumulated
Surplus
City Capital
and Capital
Accounts
Asset
Revaluation
Reserve
Other
Reserves
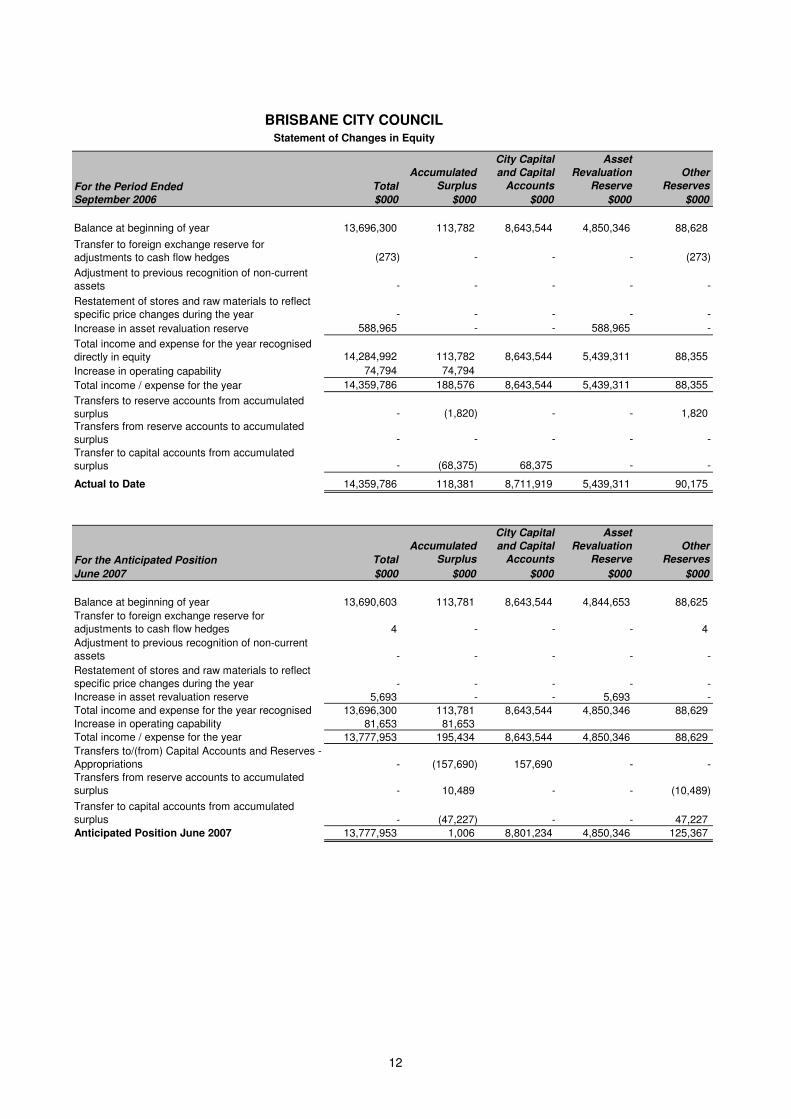
September 2006 $000 $000 $000 $000 $000
Balance at beginning of year 13,696,300 113,782 8,643,544 4,850,346 88,628
(273) - - - (273)
- - - - -
- - - - -
588,965 - - 588,965 -
14,284,992 113,782 8,643,544 5,439,311 88,355
74,794 74,794
14,359,786 188,576 8,643,544 5,439,311 88,355
- (1,820) - - 1,820
- - - - -
- (68,375) 68,375 - -
Actual to Date 14,359,786 118,381 8,711,919 5,439,311 90,175
Total
Accumulated
Surplus
City Capital
and Capital
Accounts
Asset
Revaluation
Reserve
Other
Reserves
June 2007 $000 $000 $000 $000 $000
Balance at beginning of year 13,690,603 113,781 8,643,544 4,844,653 88,625
4 - - - 4
- - - - -
- - - - -
5,693 - - 5,693 -
13,696,300 113,781 8,643,544 4,850,346 88,629
81,653 81,653
13,777,953 195,434 8,643,544 4,850,346 88,629
- (157,690) 157,690 - -
- 10,489 - - (10,489)
- (47,227) - - 47,227
Anticipated Position June 2007 13,777,953 1,006 8,801,234 4,850,346 125,367
Total income / expense for the year
Transfers to reserve accounts from accumulated surplusTransfers from reserve accounts to accumulated surplus
Transfer to capital accounts from accumulated surplus
Restatement of stores and raw materials to reflect specific price changes during the year
Increase in asset revaluation reserve
Total income and expense for the year recognised directly in equity
Increase in operating capability
Adjustment to previous recognition of non-current assets
BRISBANE CITY COUNCILStatement of Changes in Equity
For the Period Ended
Transfer to foreign exchange reserve for adjustments to cash flow hedges
For the Anticipated Position
Transfer to foreign exchange reserve for adjustments to cash flow hedges
Adjustment to previous recognition of non-current assets
Restatement of stores and raw materials to reflect specific price changes during the year
Transfers to/(from) Capital Accounts and Reserves - Appropriations
Transfers from reserve accounts to accumulated surplus
Transfer to capital accounts from accumulated surplus
Increase in asset revaluation reserve
Total income and expense for the year recognised
Increase in operating capability
Total income / expense for the year
12
Actual
to Date
Anticipated
Position
Jun 2007
Actual
Sept 2005
September 2006 $000 $000 $000
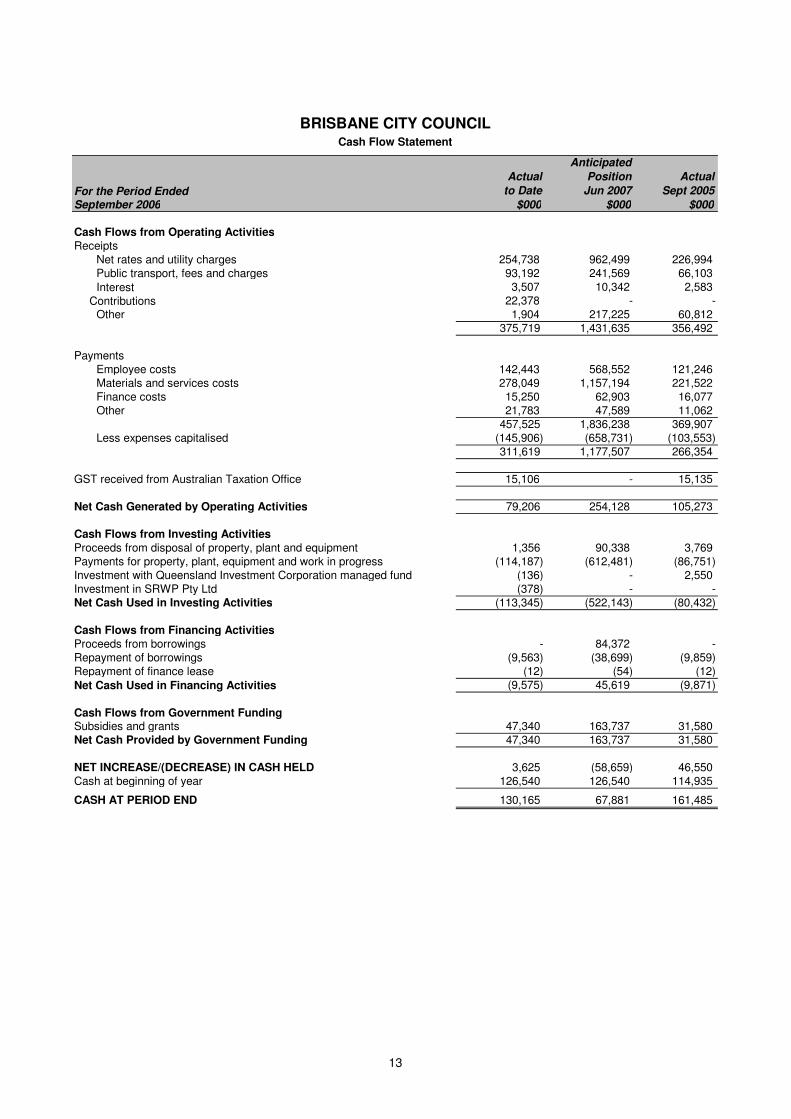
Cash Flows from Operating ActivitiesReceipts Net rates and utility charges 254,738 962,499 226,994 Public transport, fees and charges 93,192 241,569 66,103
3,507 10,342 2,583 22,378 - -
Other 1,904 217,225 60,812 375,719 1,431,635 356,492
Payments Employee costs 142,443 568,552 121,246 Materials and services costs 278,049 1,157,194 221,522 Finance costs 15,250 62,903 16,077 Other 21,783 47,589 11,062
457,525 1,836,238 369,907 Less expenses capitalised (145,906) (658,731) (103,553)
311,619 1,177,507 266,354
GST received from Australian Taxation Office 15,106 - 15,135
Net Cash Generated by Operating Activities 79,206 254,128 105,273
Cash Flows from Investing ActivitiesProceeds from disposal of property, plant and equipment 1,356 90,338 3,769 Payments for property, plant, equipment and work in progress (114,187) (612,481) (86,751)Investment with Queensland Investment Corporation managed fund (136) - 2,550 Investment in SRWP Pty Ltd (378) - -Net Cash Used in Investing Activities (113,345) (522,143) (80,432)
Cash Flows from Financing ActivitiesProceeds from borrowings - 84,372 -Repayment of borrowings (9,563) (38,699) (9,859)Repayment of finance lease (12) (54) (12)
(9,575) 45,619 (9,871)
Subsidies and grants 47,340 163,737 31,580 Net Cash Provided by Government Funding 47,340 163,737 31,580
NET INCREASE/(DECREASE) IN CASH HELD 3,625 (58,659) 46,550 Cash at beginning of year 126,540 126,540 114,935
CASH AT PERIOD END 130,165 67,881 161,485
Net Cash Used in Financing Activities
Cash Flows from Government Funding
BRISBANE CITY COUNCILCash Flow Statement
For the Period Ended
InterestContributions
13
Actual
to Date
Actual
Sept 2005
September 2006 $000 $000
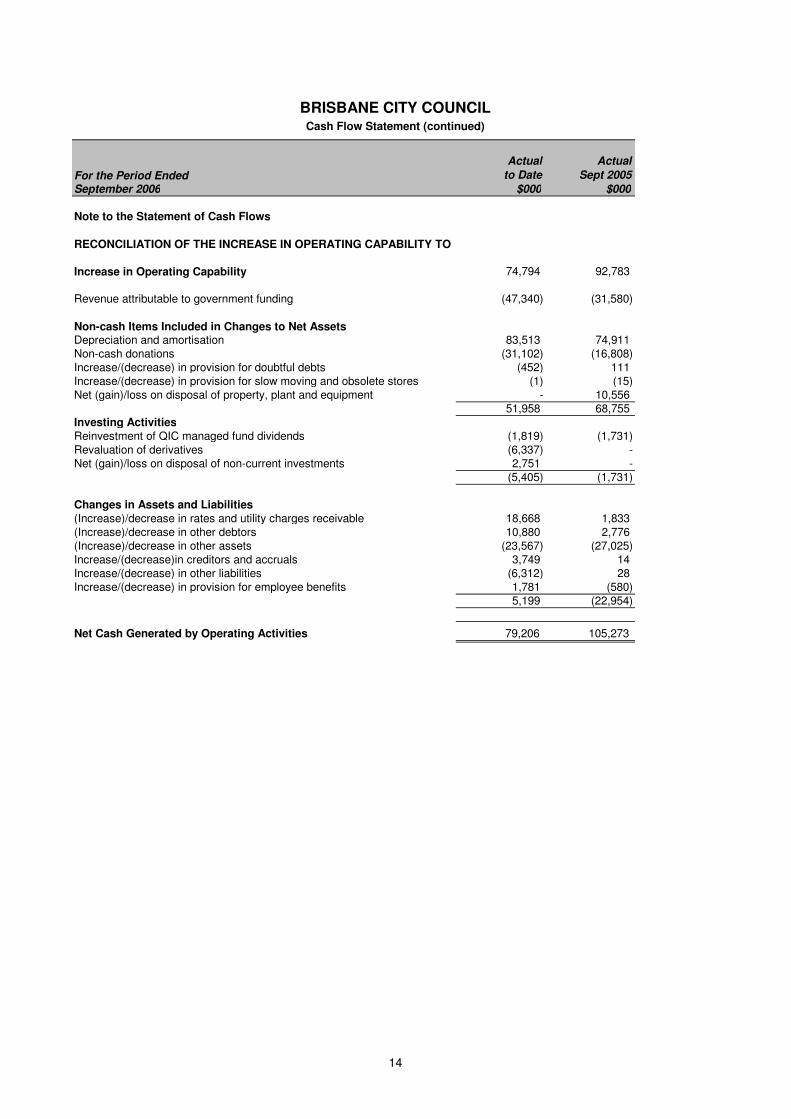
Note to the Statement of Cash Flows
74,794 92,783
Revenue attributable to government funding (47,340) (31,580)
Depreciation and amortisation 83,513 74,911 Non-cash donations (31,102) (16,808)Increase/(decrease) in provision for doubtful debts (452) 111 Increase/(decrease) in provision for slow moving and obsolete stores (1) (15)Net (gain)/loss on disposal of property, plant and equipment - 10,556
51,958 68,755 Investing ActivitiesReinvestment of QIC managed fund dividends (1,819) (1,731)Revaluation of derivatives (6,337) -Net (gain)/loss on disposal of non-current investments 2,751 -
(5,405) (1,731)
Changes in Assets and Liabilities(Increase)/decrease in rates and utility charges receivable 18,668 1,833 (Increase)/decrease in other debtors 10,880 2,776 (Increase)/decrease in other assets (23,567) (27,025)Increase/(decrease)in creditors and accruals 3,749 14 Increase/(decrease) in other liabilities (6,312) 28 Increase/(decrease) in provision for employee benefits 1,781 (580)
5,199 (22,954)
Net Cash Generated by Operating Activities 79,206 105,273
Cash Flow Statement (continued)
For the Period Ended
RECONCILIATION OF THE INCREASE IN OPERATING CAPABILITY TO
Increase in Operating Capability
Non-cash Items Included in Changes to Net Assets
BRISBANE CITY COUNCIL
14
Actual
to Date
Anticipated
Position
Jun 2007
Actual
Sept 2005
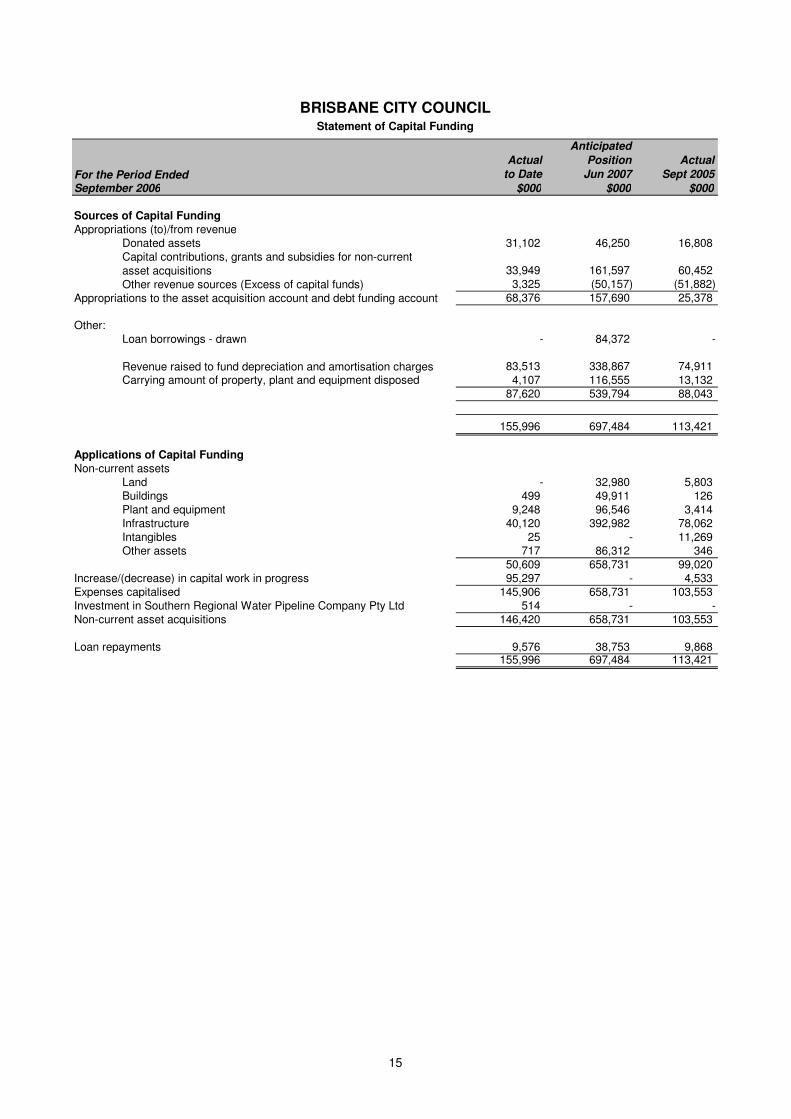
September 2006 $000 $000 $000
Sources of Capital FundingAppropriations (to)/from revenue
Donated assets 31,102 46,250 16,808
33,949 161,597 60,452 3,325 (50,157) (51,882)
68,376 157,690 25,378
Other:Loan borrowings - drawn - 84,372 -
83,513 338,867 74,911 Carrying amount of property, plant and equipment disposed 4,107 116,555 13,132
87,620 539,794 88,043
155,996 697,484 113,421
Applications of Capital FundingNon-current assets
Land - 32,980 5,803 Buildings 499 49,911 126
Plant and equipment 9,248 96,546 3,414 Infrastructure 40,120 392,982 78,062 Intangibles 25 - 11,269 Other assets 717 86,312 346
50,609 658,731 99,020 Increase/(decrease) in capital work in progress 95,297 - 4,533 Expenses capitalised 145,906 658,731 103,553 Investment in Southern Regional Water Pipeline Company Pty Ltd 514 - -Non-current asset acquisitions 146,420 658,731 103,553
Loan repayments 9,576 38,753 9,868 155,996 697,484 113,421
Capital contributions, grants and subsidies for non-current asset acquisitions
Appropriations to the asset acquisition account and debt funding account
Revenue raised to fund depreciation and amortisation charges
Other revenue sources (Excess of capital funds)
Statement of Capital Funding
For the Period Ended
BRISBANE CITY COUNCIL
15
Section 1
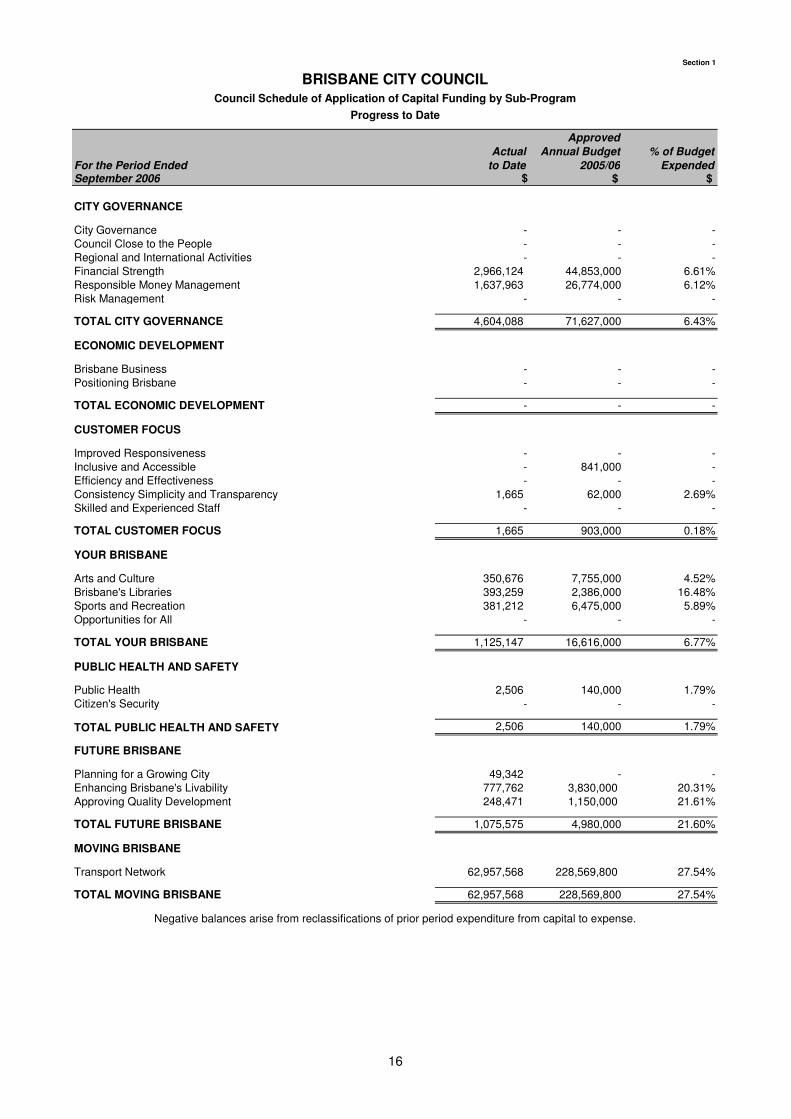
BRISBANE CITY COUNCILCouncil Schedule of Application of Capital Funding by Sub-Program
For the Period Ended
Actual
to Date
Approved
Annual Budget
2005/06
% of Budget
ExpendedSeptember 2006 $ $ $
CITY GOVERNANCE
City Governance - - -Council Close to the People - - -Regional and International Activities - - -Financial Strength 2,966,124 44,853,000 6.61%Responsible Money Management 1,637,963 26,774,000 6.12%Risk Management - - -
TOTAL CITY GOVERNANCE 4,604,088 71,627,000 6.43%
ECONOMIC DEVELOPMENT
Brisbane Business - - -Positioning Brisbane - - -
TOTAL ECONOMIC DEVELOPMENT - - -
CUSTOMER FOCUS
Improved Responsiveness - - -Inclusive and Accessible - 841,000 -Efficiency and Effectiveness - - -Consistency Simplicity and Transparency 1,665 62,000 2.69%Skilled and Experienced Staff - - -
TOTAL CUSTOMER FOCUS 1,665 903,000 0.18%
YOUR BRISBANE
Arts and Culture 350,676 7,755,000 4.52%Brisbane's Libraries 393,259 2,386,000 16.48%Sports and Recreation 381,212 6,475,000 5.89%Opportunities for All - - -
TOTAL YOUR BRISBANE 1,125,147 16,616,000 6.77%
Public Health 2,506 140,000 1.79%Citizen's Security - - -
2,506 140,000 1.79%
FUTURE BRISBANE
Planning for a Growing City 49,342 - -Enhancing Brisbane's Livability 777,762 3,830,000 20.31%Approving Quality Development 248,471 1,150,000 21.61%
TOTAL FUTURE BRISBANE 1,075,575 4,980,000 21.60%
MOVING BRISBANE
Transport Network 62,957,568 228,569,800 27.54%
TOTAL MOVING BRISBANE 62,957,568 228,569,800 27.54%
Negative balances arise from reclassifications of prior period expenditure from capital to expense.
Progress to Date
PUBLIC HEALTH AND SAFETY
TOTAL PUBLIC HEALTH AND SAFETY
16
Section 1
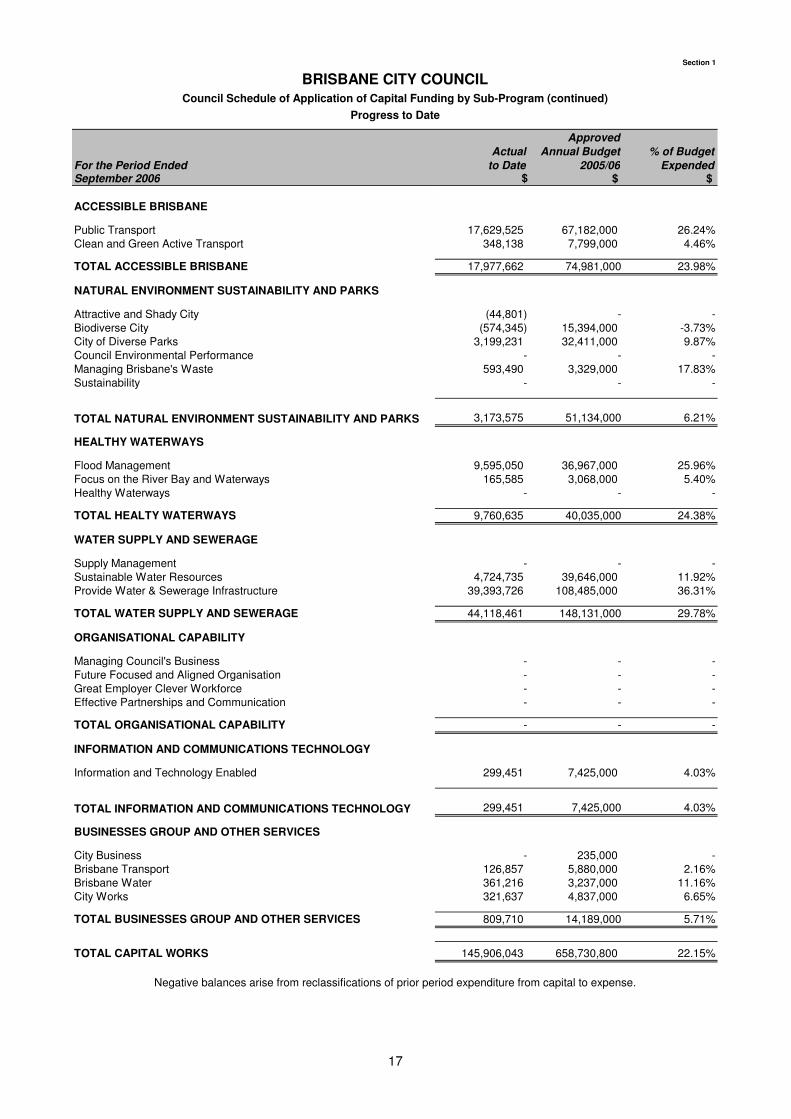
BRISBANE CITY COUNCILCouncil Schedule of Application of Capital Funding by Sub-Program (continued)
For the Period Ended
Actual
to Date
Approved
Annual Budget
2005/06
% of Budget
ExpendedSeptember 2006 $ $ $
ACCESSIBLE BRISBANE
Public Transport 17,629,525 67,182,000 26.24%Clean and Green Active Transport 348,138 7,799,000 4.46%
TOTAL ACCESSIBLE BRISBANE 17,977,662 74,981,000 23.98%
NATURAL ENVIRONMENT SUSTAINABILITY AND PARKS
Attractive and Shady City (44,801) - -Biodiverse City (574,345) 15,394,000 -3.73%City of Diverse Parks 3,199,231 32,411,000 9.87%Council Environmental Performance - - -Managing Brisbane's Waste 593,490 3,329,000 17.83%Sustainability - - -
3,173,575 51,134,000 6.21%
HEALTHY WATERWAYS
Flood Management 9,595,050 36,967,000 25.96%Focus on the River Bay and Waterways 165,585 3,068,000 5.40%Healthy Waterways - - -
TOTAL HEALTY WATERWAYS 9,760,635 40,035,000 24.38%
WATER SUPPLY AND SEWERAGE
Supply Management - - -Sustainable Water Resources 4,724,735 39,646,000 11.92%Provide Water & Sewerage Infrastructure 39,393,726 108,485,000 36.31%
TOTAL WATER SUPPLY AND SEWERAGE 44,118,461 148,131,000 29.78%
ORGANISATIONAL CAPABILITY
Managing Council's Business - - -Future Focused and Aligned Organisation - - -Great Employer Clever Workforce - - -Effective Partnerships and Communication - - -
TOTAL ORGANISATIONAL CAPABILITY - - -
INFORMATION AND COMMUNICATIONS TECHNOLOGY
Information and Technology Enabled 299,451 7,425,000 4.03%
299,451 7,425,000 4.03%
BUSINESSES GROUP AND OTHER SERVICES
City Business - 235,000 -Brisbane Transport 126,857 5,880,000 2.16%Brisbane Water 361,216 3,237,000 11.16%City Works 321,637 4,837,000 6.65%
TOTAL BUSINESSES GROUP AND OTHER SERVICES 809,710 14,189,000 5.71%
TOTAL CAPITAL WORKS 145,906,043 658,730,800 22.15%
Progress to Date
Negative balances arise from reclassifications of prior period expenditure from capital to expense.
TOTAL INFORMATION AND COMMUNICATIONS TECHNOLOGY
TOTAL NATURAL ENVIRONMENT SUSTAINABILITY AND PARKS
17
THIS PAGE IS DELIBERATELY BLANK
18
Section 2
Core Services Results
19

THIS PAGE IS DELIBERATELY BLANK
20
Section 2
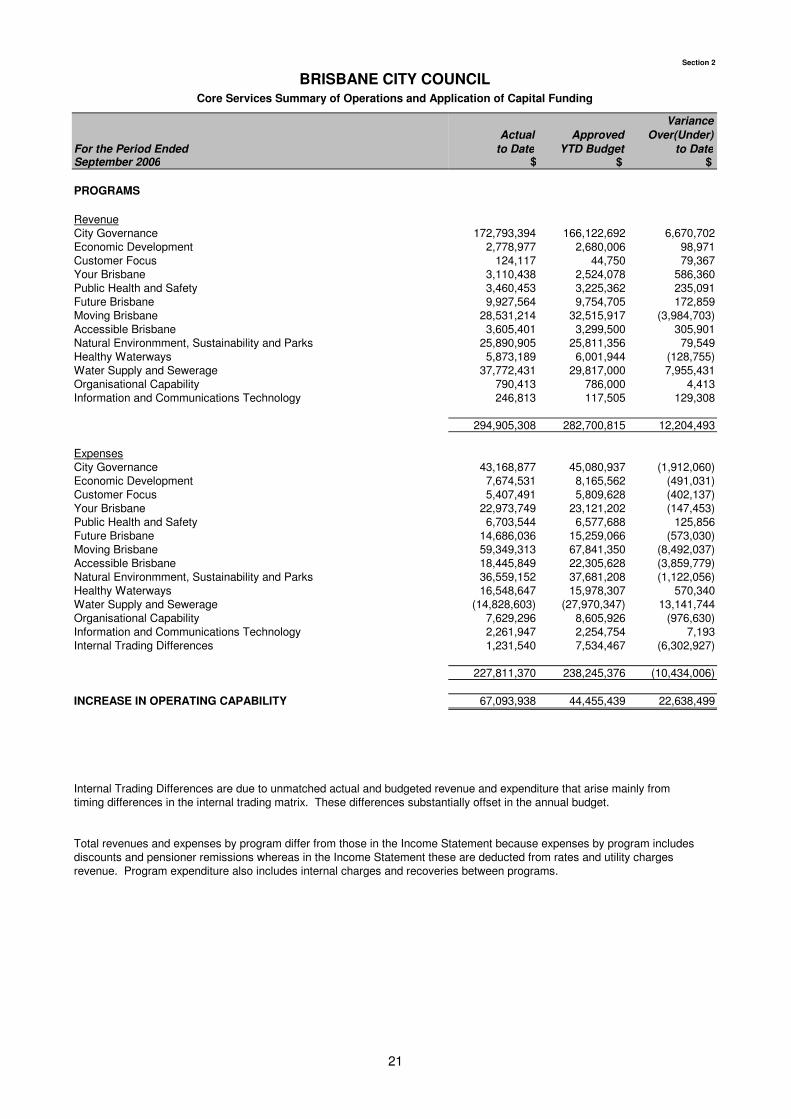
BRISBANE CITY COUNCILCore Services Summary of Operations and Application of Capital Funding
For the Period Ended
Actual
to Date
Approved
YTD Budget
Variance
Over(Under)
to DateSeptember 2006 $ $ $
PROGRAMS
RevenueCity Governance 172,793,394 166,122,692 6,670,702Economic Development 2,778,977 2,680,006 98,971Customer Focus 124,117 44,750 79,367Your Brisbane 3,110,438 2,524,078 586,360Public Health and Safety 3,460,453 3,225,362 235,091Future Brisbane 9,927,564 9,754,705 172,859Moving Brisbane 28,531,214 32,515,917 (3,984,703)Accessible Brisbane 3,605,401 3,299,500 305,901Natural Environmment, Sustainability and Parks 25,890,905 25,811,356 79,549Healthy Waterways 5,873,189 6,001,944 (128,755)Water Supply and Sewerage 37,772,431 29,817,000 7,955,431Organisational Capability 790,413 786,000 4,413Information and Communications Technology 246,813 117,505 129,308
294,905,308 282,700,815 12,204,493
ExpensesCity Governance 43,168,877 45,080,937 (1,912,060)Economic Development 7,674,531 8,165,562 (491,031)Customer Focus 5,407,491 5,809,628 (402,137)Your Brisbane 22,973,749 23,121,202 (147,453)Public Health and Safety 6,703,544 6,577,688 125,856Future Brisbane 14,686,036 15,259,066 (573,030)Moving Brisbane 59,349,313 67,841,350 (8,492,037)Accessible Brisbane 18,445,849 22,305,628 (3,859,779)Natural Environmment, Sustainability and Parks 36,559,152 37,681,208 (1,122,056)Healthy Waterways 16,548,647 15,978,307 570,340Water Supply and Sewerage (14,828,603) (27,970,347) 13,141,744Organisational Capability 7,629,296 8,605,926 (976,630)Information and Communications Technology 2,261,947 2,254,754 7,193Internal Trading Differences 1,231,540 7,534,467 (6,302,927)
227,811,370 238,245,376 (10,434,006)
INCREASE IN OPERATING CAPABILITY 67,093,938 44,455,439 22,638,499
Internal Trading Differences are due to unmatched actual and budgeted revenue and expenditure that arise mainly from timing differences in the internal trading matrix. These differences substantially offset in the annual budget.
Total revenues and expenses by program differ from those in the Income Statement because expenses by program includesdiscounts and pensioner remissions whereas in the Income Statement these are deducted from rates and utility chargesrevenue. Program expenditure also includes internal charges and recoveries between programs.
21
Section 1
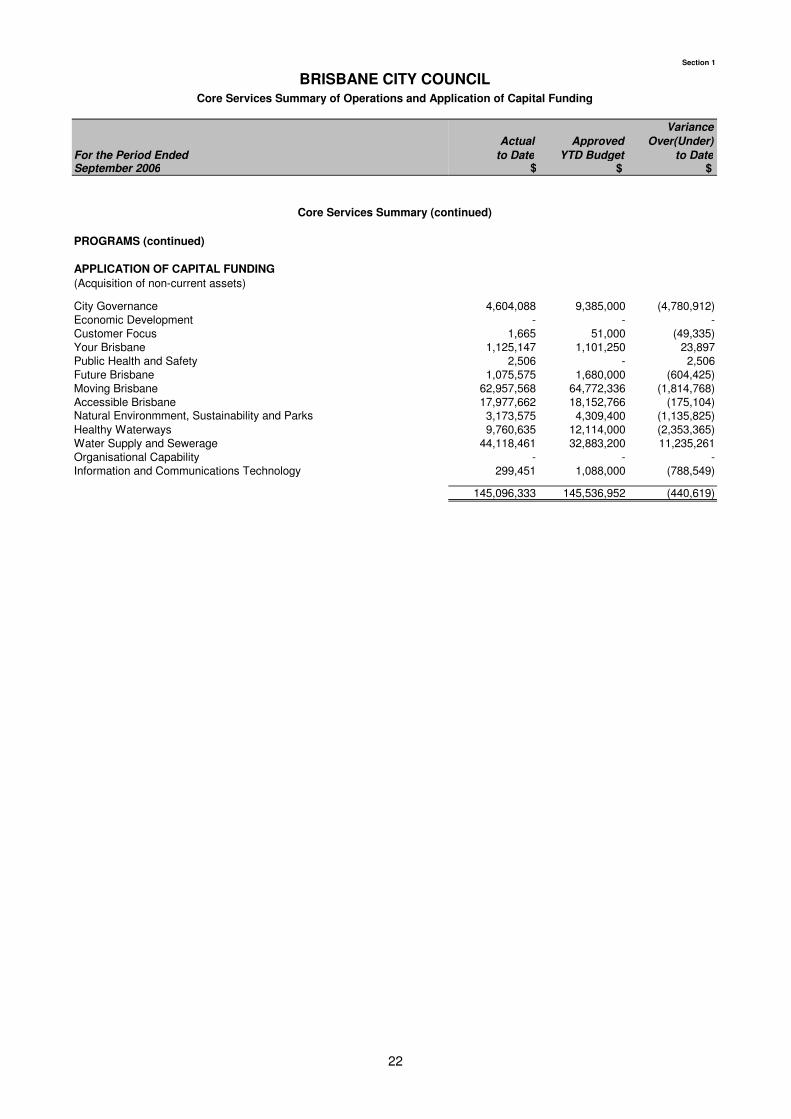
BRISBANE CITY COUNCILCore Services Summary of Operations and Application of Capital Funding
For the Period Ended
Actual
to Date
Approved
YTD Budget
Variance
Over(Under)
to DateSeptember 2006 $ $ $
APPLICATION OF CAPITAL FUNDING
(Acquisition of non-current assets)
City Governance 4,604,088 9,385,000 (4,780,912)Economic Development - - -Customer Focus 1,665 51,000 (49,335)Your Brisbane 1,125,147 1,101,250 23,897Public Health and Safety 2,506 - 2,506Future Brisbane 1,075,575 1,680,000 (604,425)Moving Brisbane 62,957,568 64,772,336 (1,814,768)Accessible Brisbane 17,977,662 18,152,766 (175,104)
3,173,575 4,309,400 (1,135,825)Healthy Waterways 9,760,635 12,114,000 (2,353,365)Water Supply and Sewerage 44,118,461 32,883,200 11,235,261Organisational Capability - - -Information and Communications Technology 299,451 1,088,000 (788,549)
145,096,333 145,536,952 (440,619)
Natural Environmment, Sustainability and Parks
Core Services Summary (continued)
PROGRAMS (continued)
22
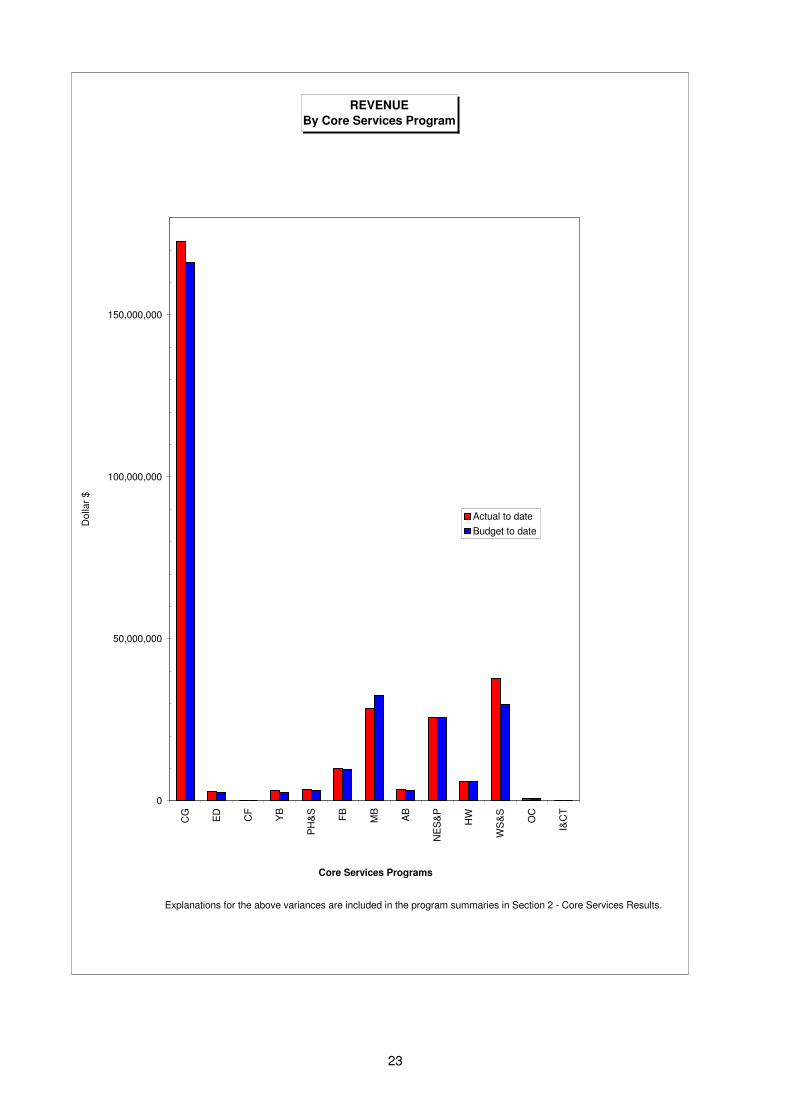
REVENUE
By Core Services Program
0
50,000,000
100,000,000
150,000,000
CG
ED
CF
YB
PH
&S
FB
MB
AB
NE
S&
P
HW
WS
&S
OC
I&C
T
Core Services Programs
Do
llar
$
Actual to date
Budget to date
Explanations for the above variances are included in the program summaries in Section 2 - Core Services Results.
23
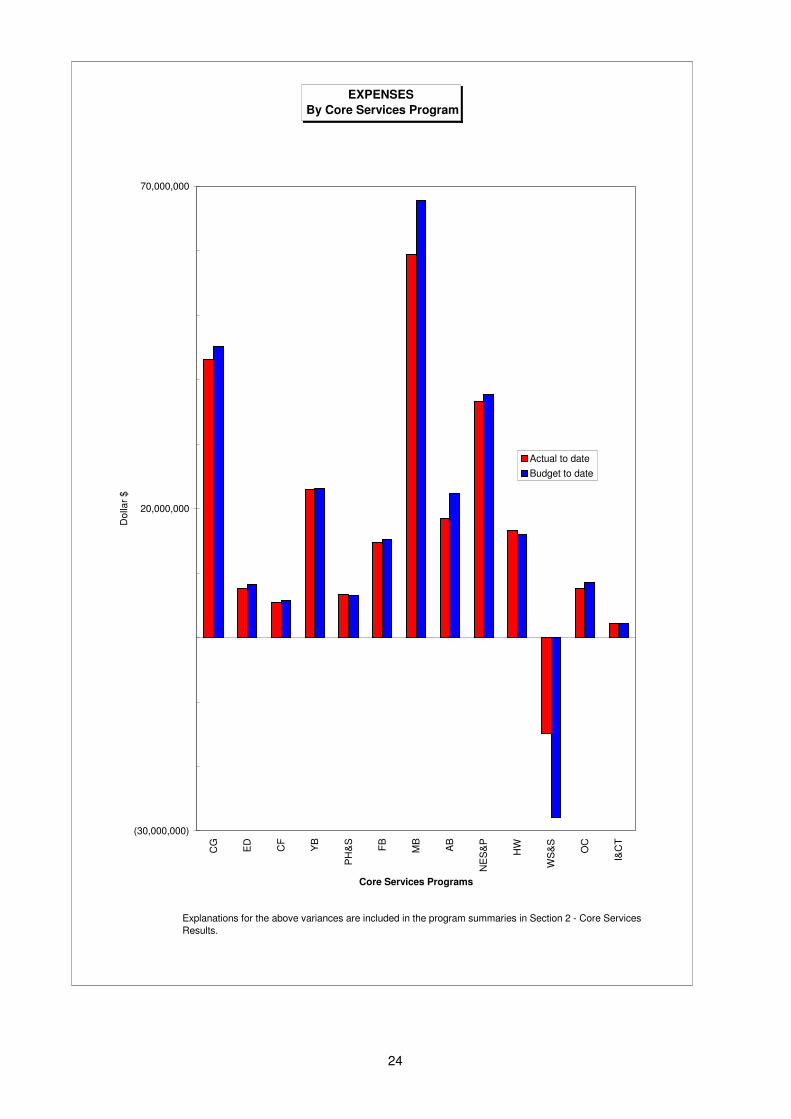
EXPENSES
By Core Services Program
(30,000,000)
20,000,000
70,000,000
CG
ED
CF
YB
PH
&S
FB
MB
AB
NE
S&
P
HW
WS
&S
OC
I&C
T
Core Services Programs
Do
llar
$
Actual to date
Budget to date
Explanations for the above variances are included in the program summaries in Section 2 - Core Services
Results.
24
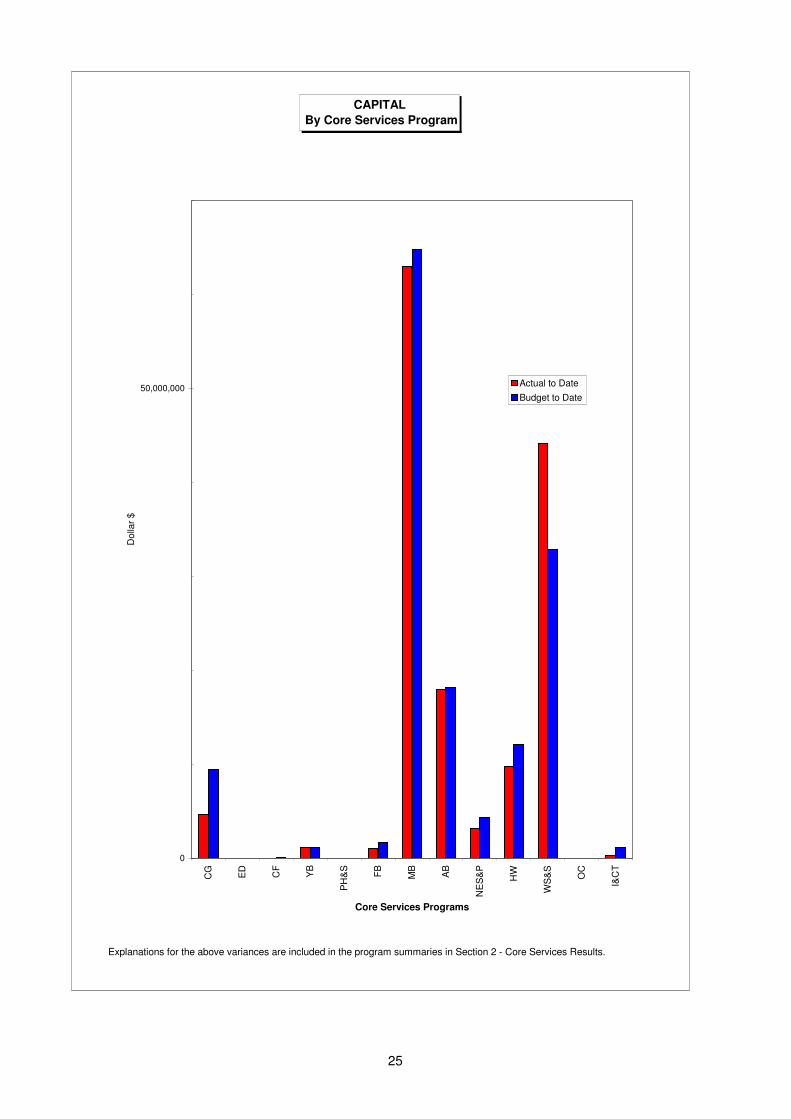
CAPITAL
By Core Services Program
0
50,000,000
CG
ED
CF
YB
PH
&S
FB
MB
AB
NE
S&
P
HW
WS
&S
OC
I&C
T
Core Services Programs
Do
llar
$
Actual to Date
Budget to Date
Explanations for the above variances are included in the program summaries in Section 2 - Core Services Results.
25
Section 2.1
BRISBANE CITY COUNCILCity Governance Program
For the Period Ended
Actual
to Date
Approved
YTD Budget
Variance
Over(Under)
to Date
Variance
Over(Under)
to Date
Approved
Budget
2006/07September 2006 $ $ $ % $
OUTCOMES
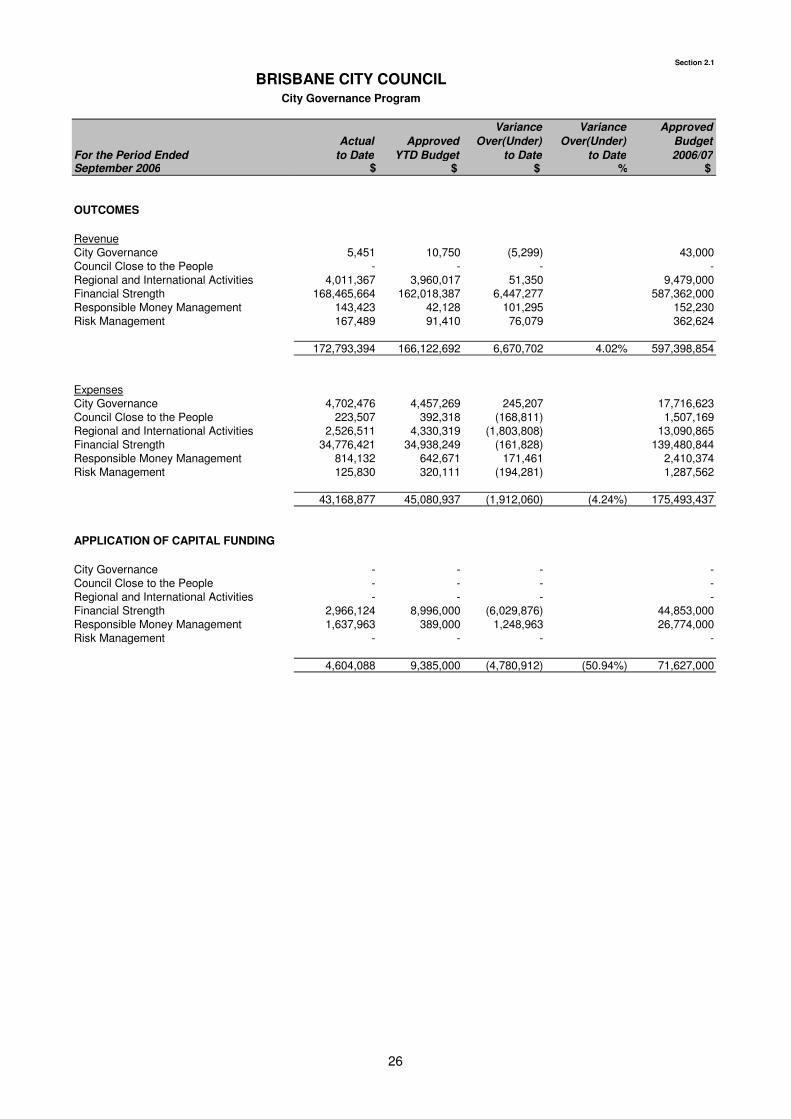
RevenueCity Governance 5,451 10,750 (5,299) 43,000Council Close to the People - - - -Regional and International Activities 4,011,367 3,960,017 51,350 9,479,000Financial Strength 168,465,664 162,018,387 6,447,277 587,362,000Responsible Money Management 143,423 42,128 101,295 152,230Risk Management 167,489 91,410 76,079 362,624
172,793,394 166,122,692 6,670,702 4.02% 597,398,854
ExpensesCity Governance 4,702,476 4,457,269 245,207 17,716,623Council Close to the People 223,507 392,318 (168,811) 1,507,169Regional and International Activities 2,526,511 4,330,319 (1,803,808) 13,090,865Financial Strength 34,776,421 34,938,249 (161,828) 139,480,844Responsible Money Management 814,132 642,671 171,461 2,410,374Risk Management 125,830 320,111 (194,281) 1,287,562
43,168,877 45,080,937 (1,912,060) (4.24%) 175,493,437
APPLICATION OF CAPITAL FUNDING
City Governance - - - -Council Close to the People - - - -Regional and International Activities - - - -Financial Strength 2,966,124 8,996,000 (6,029,876) 44,853,000Responsible Money Management 1,637,963 389,000 1,248,963 26,774,000Risk Management - - - -
4,604,088 9,385,000 (4,780,912) (50.94%) 71,627,000
26
Section 2.1
BRISBANE CITY COUNCILReview of City Governance Program
Revenue
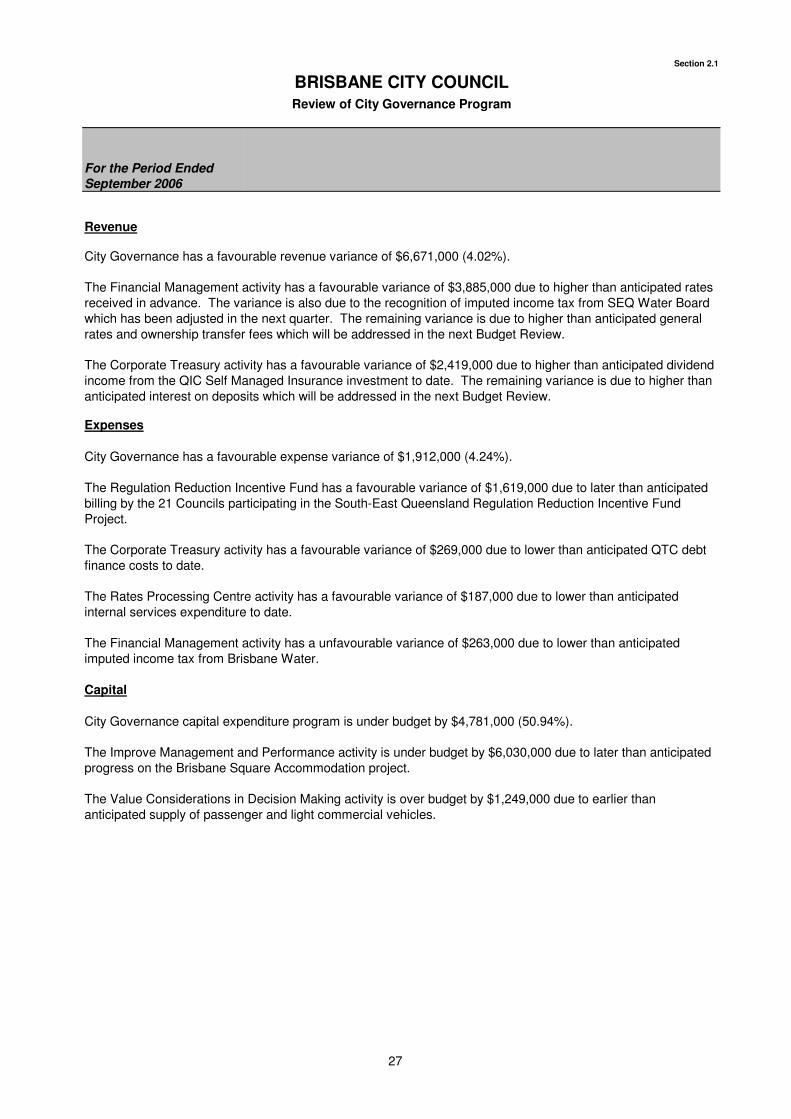
City Governance has a favourable revenue variance of $6,671,000 (4.02%).
Expenses
Capital
The Financial Management activity has a unfavourable variance of $263,000 due to lower than anticipated imputed income tax from Brisbane Water.
City Governance capital expenditure program is under budget by $4,781,000 (50.94%).
The Improve Management and Performance activity is under budget by $6,030,000 due to later than anticipated progress on the Brisbane Square Accommodation project.
The Value Considerations in Decision Making activity is over budget by $1,249,000 due to earlier than anticipated supply of passenger and light commercial vehicles.
The Regulation Reduction Incentive Fund has a favourable variance of $1,619,000 due to later than anticipated billing by the 21 Councils participating in the South-East Queensland Regulation Reduction Incentive Fund Project.
The Corporate Treasury activity has a favourable variance of $269,000 due to lower than anticipated QTC debt finance costs to date.
The Rates Processing Centre activity has a favourable variance of $187,000 due to lower than anticipated internal services expenditure to date.
For the Period Ended September 2006
The Financial Management activity has a favourable variance of $3,885,000 due to higher than anticipated rates received in advance. The variance is also due to the recognition of imputed income tax from SEQ Water Board which has been adjusted in the next quarter. The remaining variance is due to higher than anticipated general rates and ownership transfer fees which will be addressed in the next Budget Review.
The Corporate Treasury activity has a favourable variance of $2,419,000 due to higher than anticipated dividend income from the QIC Self Managed Insurance investment to date. The remaining variance is due to higher than anticipated interest on deposits which will be addressed in the next Budget Review.
City Governance has a favourable expense variance of $1,912,000 (4.24%).
27
SECTION 2.1
CITY GOVERNANCE PROGRAM Explanation of Variances
OUTCOME
ACTIVITY DIVISION VARIANCE F/U R/E/C T/P THE FOLLOWING VARIANCES ARE MAINLY DUE TO:
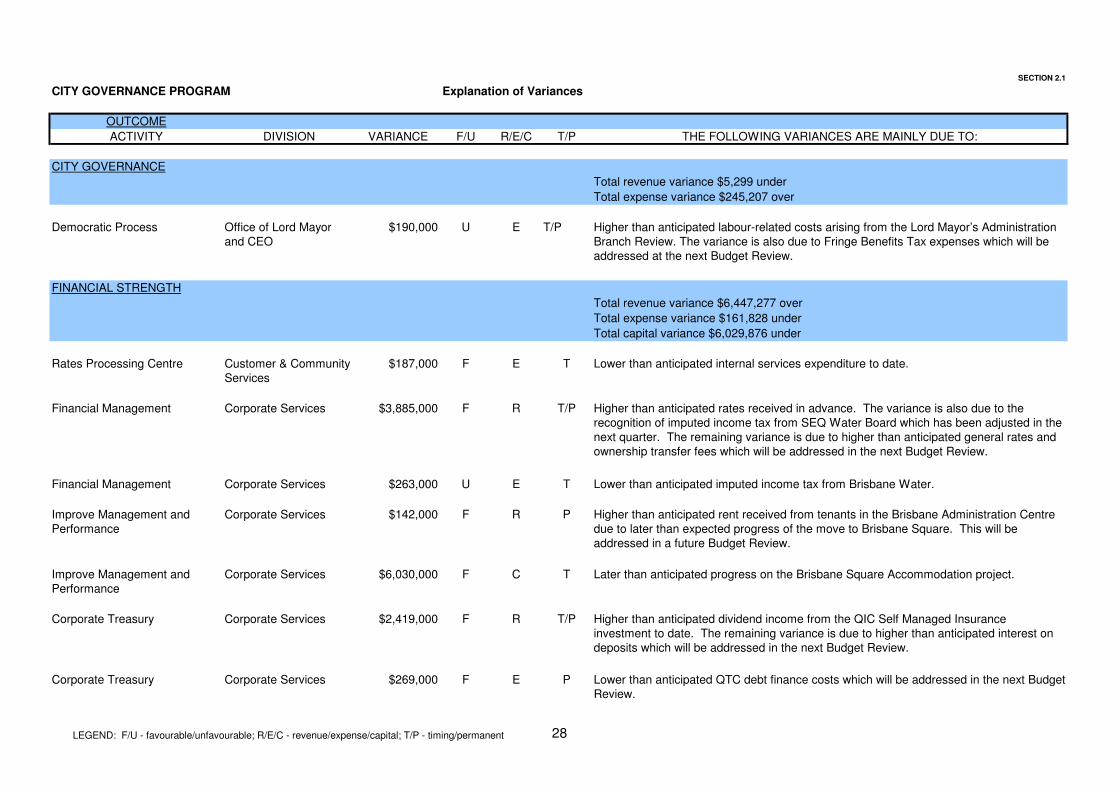
CITY GOVERNANCE
Total revenue variance $5,299 under
Total expense variance $245,207 over
Democratic Process Office of Lord Mayor and CEO
$190,000 U E T/P Higher than anticipated labour-related costs arising from the Lord Mayor’s Administration Branch Review. The variance is also due to Fringe Benefits Tax expenses which will be addressed at the next Budget Review.
FINANCIAL STRENGTH
Total revenue variance $6,447,277 over
Total expense variance $161,828 under
Total capital variance $6,029,876 under
Rates Processing Centre Customer & Community Services
$187,000 F E T Lower than anticipated internal services expenditure to date.
Financial Management Corporate Services $3,885,000 F R T/P Higher than anticipated rates received in advance. The variance is also due to the recognition of imputed income tax from SEQ Water Board which has been adjusted in the next quarter. The remaining variance is due to higher than anticipated general rates and ownership transfer fees which will be addressed in the next Budget Review.
Financial Management Corporate Services $263,000 U E T Lower than anticipated imputed income tax from Brisbane Water.
Improve Management and Performance
Corporate Services $142,000 F R P Higher than anticipated rent received from tenants in the Brisbane Administration Centre due to later than expected progress of the move to Brisbane Square. This will be addressed in a future Budget Review.
Improve Management and Performance
Corporate Services $6,030,000 F C T Later than anticipated progress on the Brisbane Square Accommodation project.
Corporate Treasury Corporate Services $2,419,000 F R T/P Higher than anticipated dividend income from the QIC Self Managed Insurance investment to date. The remaining variance is due to higher than anticipated interest on deposits which will be addressed in the next Budget Review.
Corporate Treasury Corporate Services $269,000 F E P Lower than anticipated QTC debt finance costs which will be addressed in the next Budget Review.
LEGEND: F/U - favourable/unfavourable; R/E/C - revenue/expense/capital; T/P - timing/permanent 28
SECTION 2.1
CITY GOVERNANCE PROGRAM Explanation of Variances
OUTCOME
ACTIVITY DIVISION VARIANCE F/U R/E/C T/P THE FOLLOWING VARIANCES ARE MAINLY DUE TO:
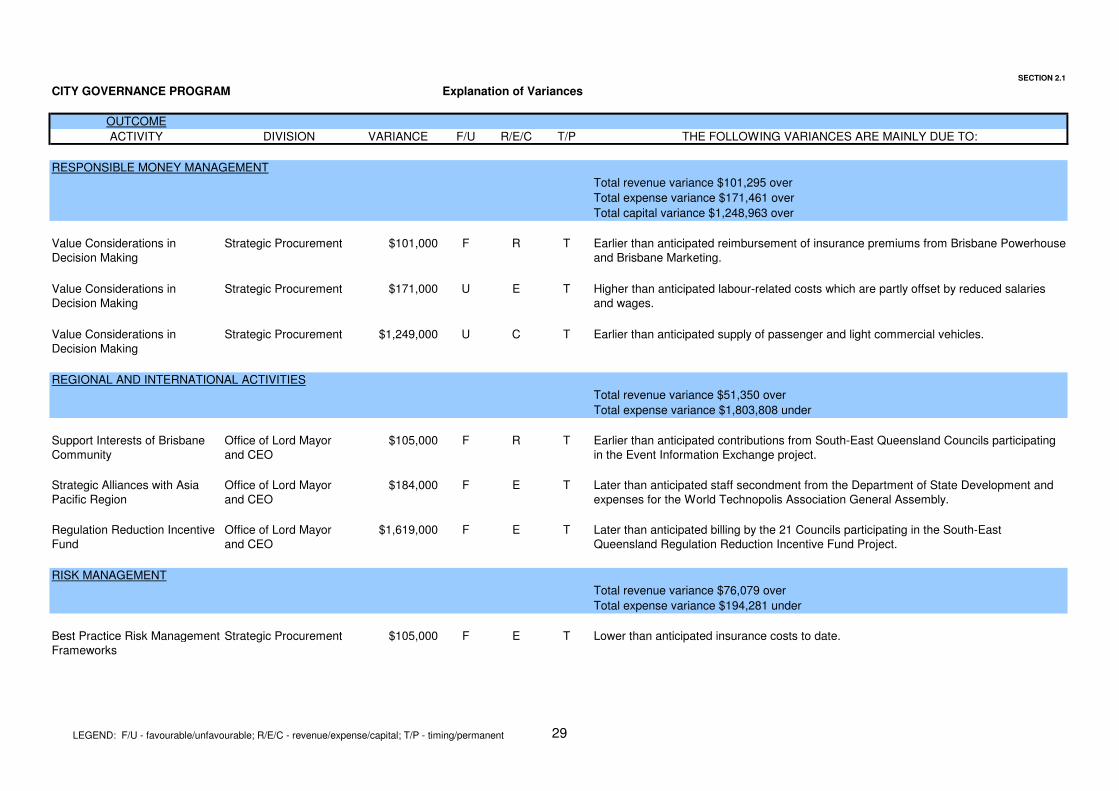
RESPONSIBLE MONEY MANAGEMENT
Total revenue variance $101,295 over
Total expense variance $171,461 over
Total capital variance $1,248,963 over
Value Considerations in Decision Making
Strategic Procurement $101,000 F R T Earlier than anticipated reimbursement of insurance premiums from Brisbane Powerhouse and Brisbane Marketing.
Value Considerations in Decision Making
Strategic Procurement $171,000 U E T Higher than anticipated labour-related costs which are partly offset by reduced salaries and wages.
Value Considerations in Decision Making
Strategic Procurement $1,249,000 U C T Earlier than anticipated supply of passenger and light commercial vehicles.
REGIONAL AND INTERNATIONAL ACTIVITIES
Total revenue variance $51,350 over
Total expense variance $1,803,808 under
Support Interests of Brisbane Community
Office of Lord Mayor and CEO
$105,000 F R T Earlier than anticipated contributions from South-East Queensland Councils participating in the Event Information Exchange project.
Strategic Alliances with Asia Pacific Region
Office of Lord Mayor and CEO
$184,000 F E T Later than anticipated staff secondment from the Department of State Development and expenses for the World Technopolis Association General Assembly.
Regulation Reduction Incentive Fund
Office of Lord Mayor and CEO
$1,619,000 F E T Later than anticipated billing by the 21 Councils participating in the South-East Queensland Regulation Reduction Incentive Fund Project.
RISK MANAGEMENT
Total revenue variance $76,079 over
Total expense variance $194,281 under
Best Practice Risk Management Frameworks
Strategic Procurement $105,000 F E T Lower than anticipated insurance costs to date.
LEGEND: F/U - favourable/unfavourable; R/E/C - revenue/expense/capital; T/P - timing/permanent 29
Section 2.2
BRISBANE CITY COUNCILEconomic Development Program
For the Period Ended
Actual
to Date
Approved
YTD Budget
Variance
Over(Under)
to Date
Variance
Over(Under)
to Date
Approved
Budget
2006/07September 2006 $ $ $ % $
OUTCOMES
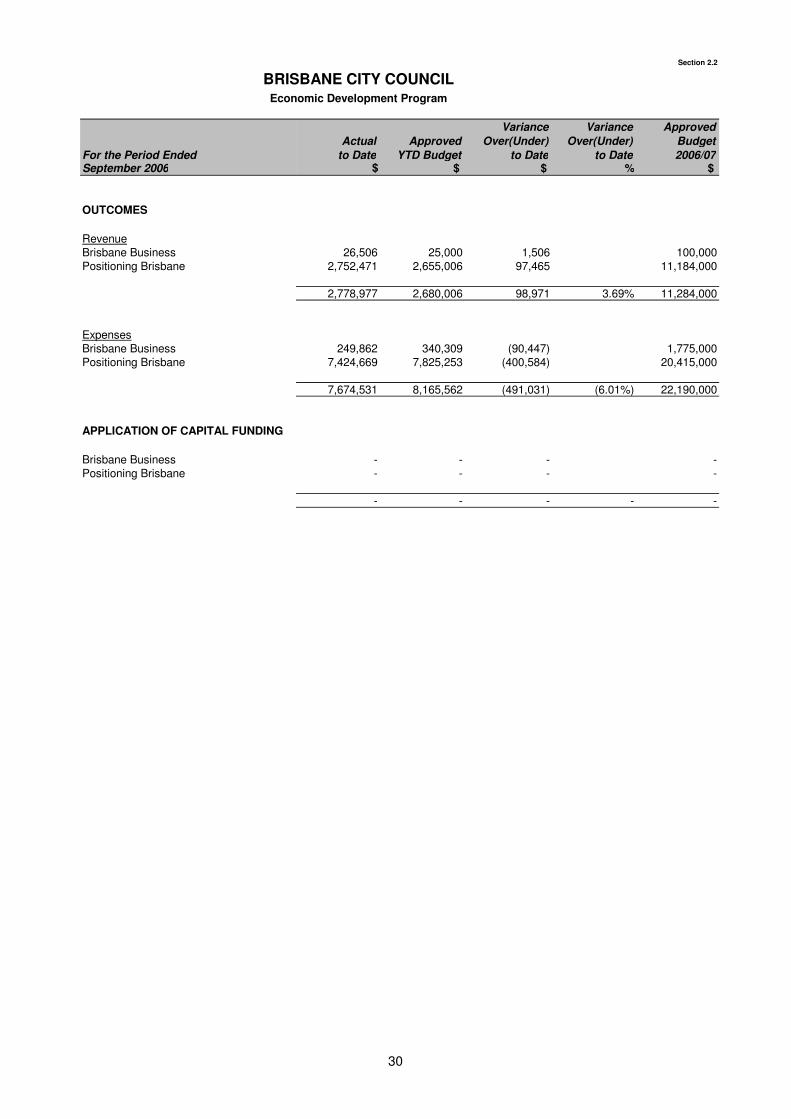
RevenueBrisbane Business 26,506 25,000 1,506 100,000Positioning Brisbane 2,752,471 2,655,006 97,465 11,184,000
2,778,977 2,680,006 98,971 3.69% 11,284,000
ExpensesBrisbane Business 249,862 340,309 (90,447) 1,775,000Positioning Brisbane 7,424,669 7,825,253 (400,584) 20,415,000
7,674,531 8,165,562 (491,031) (6.01%) 22,190,000
APPLICATION OF CAPITAL FUNDING
Brisbane Business - - - -Positioning Brisbane - - - -
- - - - -
30
Section 2.2
BRISBANE CITY COUNCILReview of Economic Development Program
Revenue
Expenses
Economic Development has a favourable expense variance of $491,000 (6.01%).
Capital
Economic Development capital expenditure program had no significant components.
The ourBrisbane.com activity has a favourable variance of $190,000 due to lower than anticipated billing of rent costs and vacant positions under recruitment.
For the Period Ended September 2006
Economic Development has a favourable revenue variance of $99,000 (3.69%). There are no significant components.
31
SECTION 2.2
ECONOMIC DEVELOPMENT PROGRAM Explanation of Variances
OUTCOME
ACTIVITY DIVISION VARIANCE F/U R/E/C T/P THE FOLLOWING VARIANCES ARE MAINLY DUE TO:
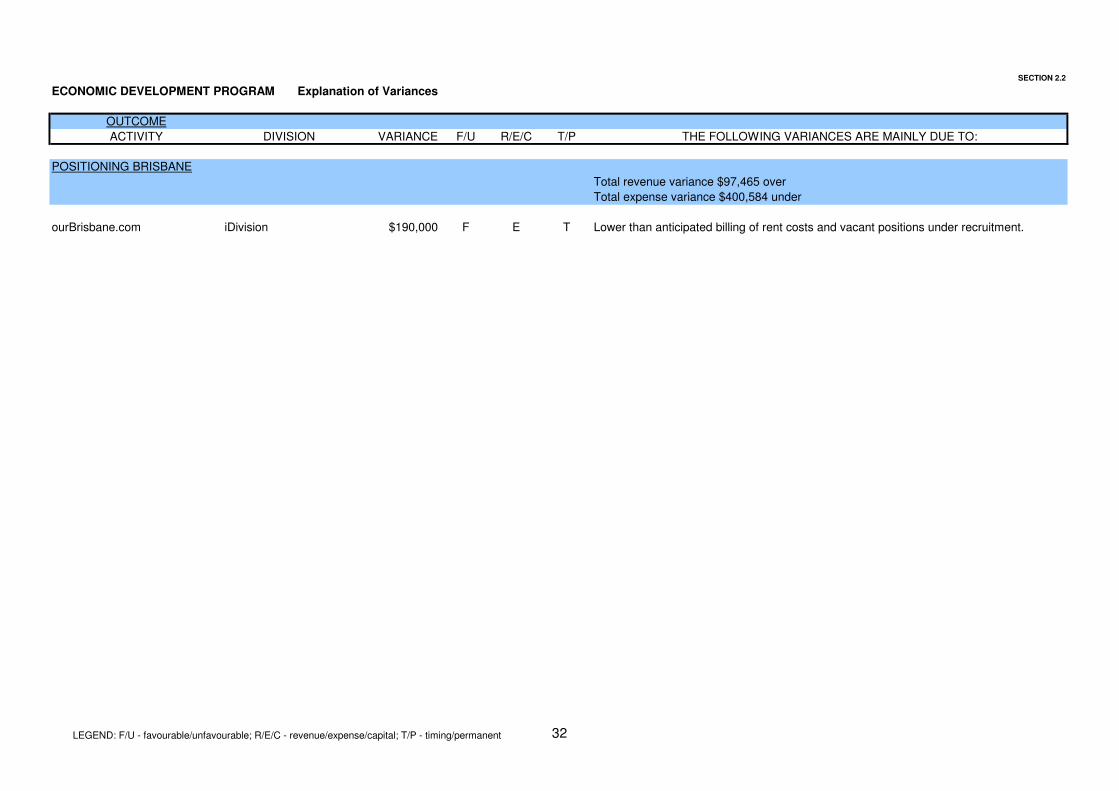
POSITIONING BRISBANE
Total revenue variance $97,465 over
Total expense variance $400,584 under
ourBrisbane.com iDivision $190,000 F E T Lower than anticipated billing of rent costs and vacant positions under recruitment.
LEGEND: F/U - favourable/unfavourable; R/E/C - revenue/expense/capital; T/P - timing/permanent 32

THIS PAGE IS DELIBERATELY BLANK
33
Section 2.3
For the Period Ended
Actual
to Date
Approved
YTD Budget
Variance
Over(Under)
to Date
Variance
Over(Under)
to Date
Approved
Budget
2006/07September 2006 $ $ $ % $
OUTCOMES
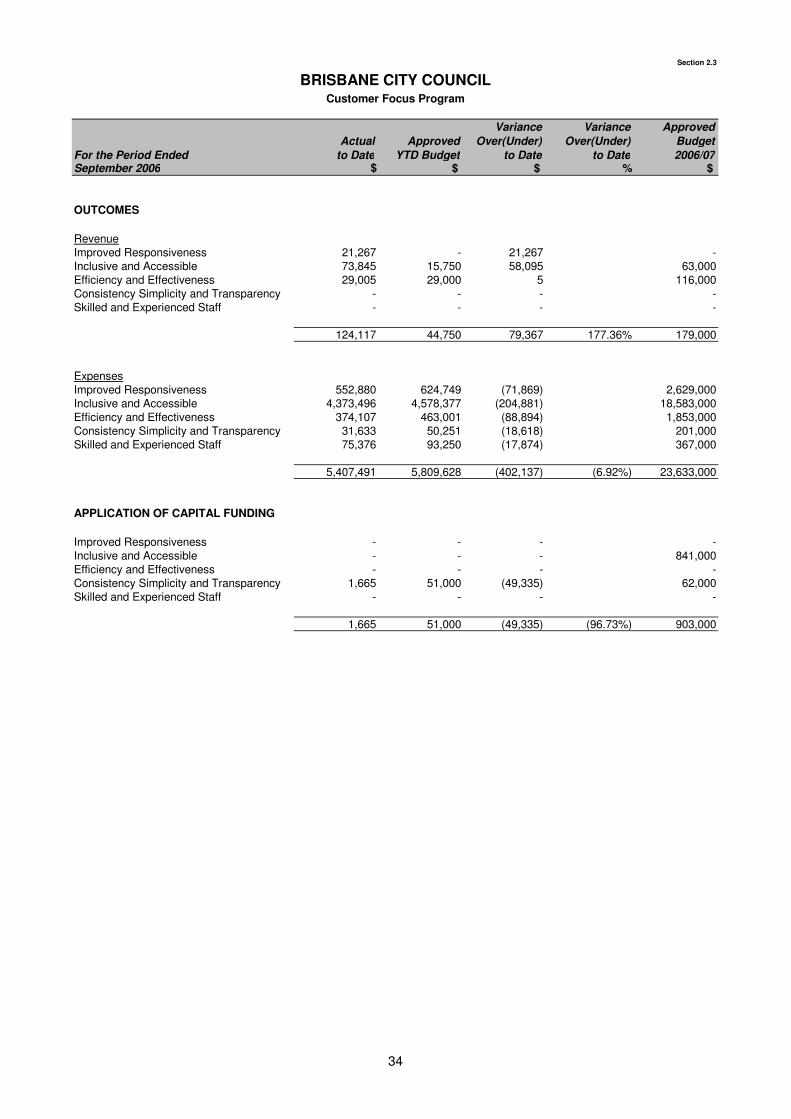
RevenueImproved Responsiveness 21,267 - 21,267 -Inclusive and Accessible 73,845 15,750 58,095 63,000Efficiency and Effectiveness 29,005 29,000 5 116,000Consistency Simplicity and Transparency - - - -Skilled and Experienced Staff - - - -
124,117 44,750 79,367 177.36% 179,000
ExpensesImproved Responsiveness 552,880 624,749 (71,869) 2,629,000Inclusive and Accessible 4,373,496 4,578,377 (204,881) 18,583,000Efficiency and Effectiveness 374,107 463,001 (88,894) 1,853,000Consistency Simplicity and Transparency 31,633 50,251 (18,618) 201,000Skilled and Experienced Staff 75,376 93,250 (17,874) 367,000
5,407,491 5,809,628 (402,137) (6.92%) 23,633,000
APPLICATION OF CAPITAL FUNDING
Improved Responsiveness - - - -Inclusive and Accessible - - - 841,000Efficiency and Effectiveness - - - -Consistency Simplicity and Transparency 1,665 51,000 (49,335) 62,000Skilled and Experienced Staff - - - -
1,665 51,000 (49,335) (96.73%) 903,000
BRISBANE CITY COUNCILCustomer Focus Program
34
Section 2.3
BRISBANE CITY COUNCILReview of Customer Focus Program
Revenue
Expenses
Capital
Customer Focus capital expenditure program is under budget by $49,000 (96.73%). There are no significant components.
For the Period Ended September 2006
Customer Focus has a favourable revenue variance of $79,000 (177.36%). There are no significant components.
Customer Focus has a favourable expense variance of $402,000 (6.92%).
The Council Call Centre activity has a favourable variance of $174,000 due to costs that have been reallocated in the next period.
35
SECTION 2.3
CUSTOMER FOCUS PROGRAM Explanation of Variances
OUTCOME
ACTIVITY DIVISION VARIANCE F/U R/E/C T/P THE FOLLOWING VARIANCES ARE MAINLY DUE TO:
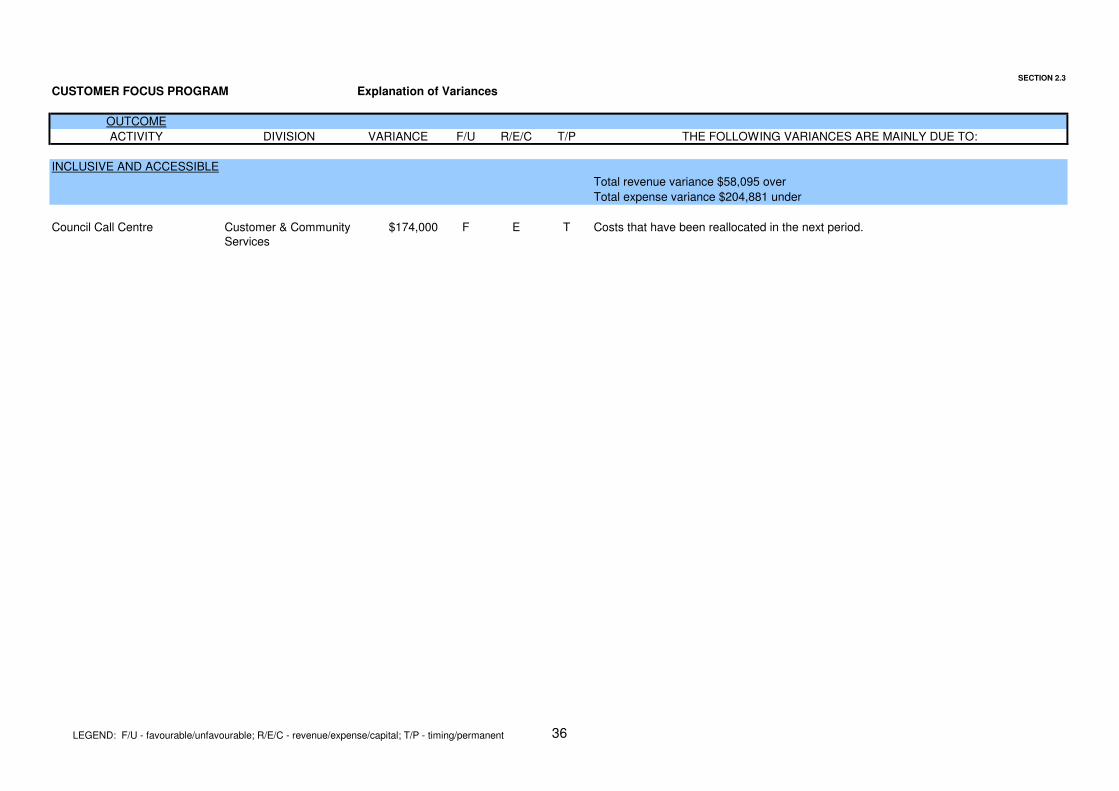
INCLUSIVE AND ACCESSIBLE
Total revenue variance $58,095 over
Total expense variance $204,881 under
Council Call Centre Customer & Community Services
$174,000 F E T Costs that have been reallocated in the next period.
LEGEND: F/U - favourable/unfavourable; R/E/C - revenue/expense/capital; T/P - timing/permanent 36

THIS PAGE IS DELIBERATELY BLANK
37
Section 2.4
For the Period Ended
Actual
to Date
Approved
YTD Budget
Variance
Over(Under)
to Date
Variance
Over(Under)
to Date
Approved
Budget
2006/07September 2006 $ $ $ % $
OUTCOMES
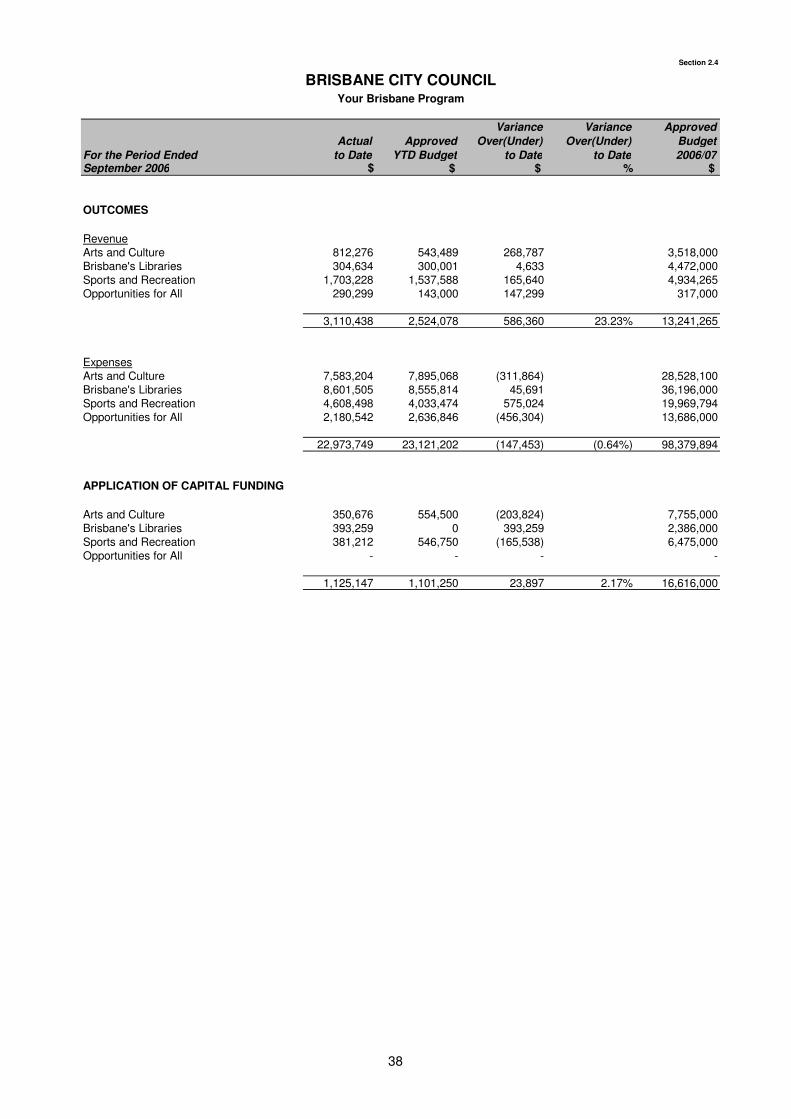
RevenueArts and Culture 812,276 543,489 268,787 3,518,000Brisbane's Libraries 304,634 300,001 4,633 4,472,000Sports and Recreation 1,703,228 1,537,588 165,640 4,934,265Opportunities for All 290,299 143,000 147,299 317,000
3,110,438 2,524,078 586,360 23.23% 13,241,265
ExpensesArts and Culture 7,583,204 7,895,068 (311,864) 28,528,100Brisbane's Libraries 8,601,505 8,555,814 45,691 36,196,000Sports and Recreation 4,608,498 4,033,474 575,024 19,969,794Opportunities for All 2,180,542 2,636,846 (456,304) 13,686,000
22,973,749 23,121,202 (147,453) (0.64%) 98,379,894
APPLICATION OF CAPITAL FUNDING
Arts and Culture 350,676 554,500 (203,824) 7,755,000Brisbane's Libraries 393,259 0 393,259 2,386,000Sports and Recreation 381,212 546,750 (165,538) 6,475,000Opportunities for All - - - -
1,125,147 1,101,250 23,897 2.17% 16,616,000
BRISBANE CITY COUNCILYour Brisbane Program
38
Section 2.4
BRISBANE CITY COUNCILReview of Your Brisbane Program
Revenue
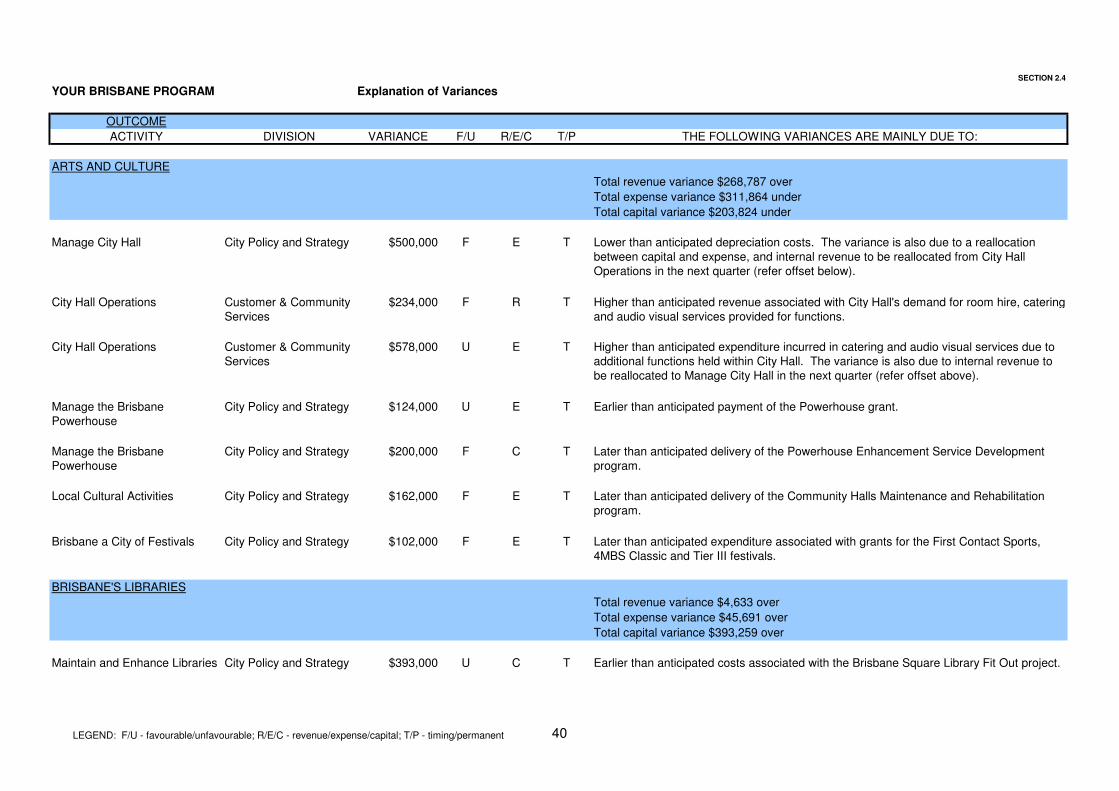
Your Brisbane has a favourable revenue variance of $586,000 (23.23%).
Expenses
Your Brisbane has a favourable expense variance of $147,000 (0.64%).
Capital
Your Brisbane capital expenditure program is over budget by $24,000 (2.17%).
The Manage the Brisbane Powerhouse activity is under budget by $200,000 due to later than anticipated delivery of the Powerhouse Enhancement Service Development program.
The Manage City Pools activity is under budget by $169,000 due to later than anticipated progress of the New City Pools project.
For the Period Ended September 2006
The City Hall Operations activity has a favourable variance of $234,000 due to higher than anticipated revenue associated with City Hall's demand for room hire, catering and audio visual services provided for functions.
The Community Development Teams activity has a favourable variance of $139,000 due to higher than anticipated grants received for the Social Isolation and Warren Ritchie Park Upgrade projects. This will be addressed at the next Budget Review.
The Manage City Hall activity has a favourable variance of $500,000 due to lower than anticipated depreciation costs. The variance is also due to a reallocation between capital and expense, and internal revenue to be reallocated from City Hall Operations in the next quarter (refer offset below).
The City Hall Operations activity has an unfavourable variance of $578,000 due to higher than anticipated expenditure incurred in catering and audio visual services due to additional functions held within City Hall. The variance is also due to internal revenue to be reallocated to Manage City Hall in the next quarter (refer offset above).
The Maintain and Enhance Libraries activity is over budget by $393,000 due to earlier than anticipated costs associated with the Brisbane Square Library Fit Out project.
39
SECTION 2.4
YOUR BRISBANE PROGRAM Explanation of Variances
OUTCOME
ACTIVITY DIVISION VARIANCE F/U R/E/C T/P THE FOLLOWING VARIANCES ARE MAINLY DUE TO:
ARTS AND CULTURE
Total revenue variance $268,787 over
Total expense variance $311,864 under
Total capital variance $203,824 under
Manage City Hall City Policy and Strategy $500,000 F E T Lower than anticipated depreciation costs. The variance is also due to a reallocation between capital and expense, and internal revenue to be reallocated from City Hall Operations in the next quarter (refer offset below).
City Hall Operations Customer & Community Services
$234,000 F R T Higher than anticipated revenue associated with City Hall's demand for room hire, catering and audio visual services provided for functions.
City Hall Operations Customer & Community Services
$578,000 U E T Higher than anticipated expenditure incurred in catering and audio visual services due to additional functions held within City Hall. The variance is also due to internal revenue to be reallocated to Manage City Hall in the next quarter (refer offset above).
Manage the Brisbane Powerhouse
City Policy and Strategy $124,000 U E T Earlier than anticipated payment of the Powerhouse grant.
Manage the Brisbane Powerhouse
City Policy and Strategy $200,000 F C T Later than anticipated delivery of the Powerhouse Enhancement Service Development program.
Local Cultural Activities City Policy and Strategy $162,000 F E T Later than anticipated delivery of the Community Halls Maintenance and Rehabilitation program.
Brisbane a City of Festivals City Policy and Strategy $102,000 F E T Later than anticipated expenditure associated with grants for the First Contact Sports, 4MBS Classic and Tier III festivals.
BRISBANE'S LIBRARIES
Total revenue variance $4,633 over
Total expense variance $45,691 over
Total capital variance $393,259 over
Maintain and Enhance Libraries City Policy and Strategy $393,000 U C T Earlier than anticipated costs associated with the Brisbane Square Library Fit Out project.
LEGEND: F/U - favourable/unfavourable; R/E/C - revenue/expense/capital; T/P - timing/permanent 40
SECTION 2.4
YOUR BRISBANE PROGRAM Explanation of Variances
OUTCOME
ACTIVITY DIVISION VARIANCE F/U R/E/C T/P THE FOLLOWING VARIANCES ARE MAINLY DUE TO:
BRISBANE'S LIBRARIES (Cont)
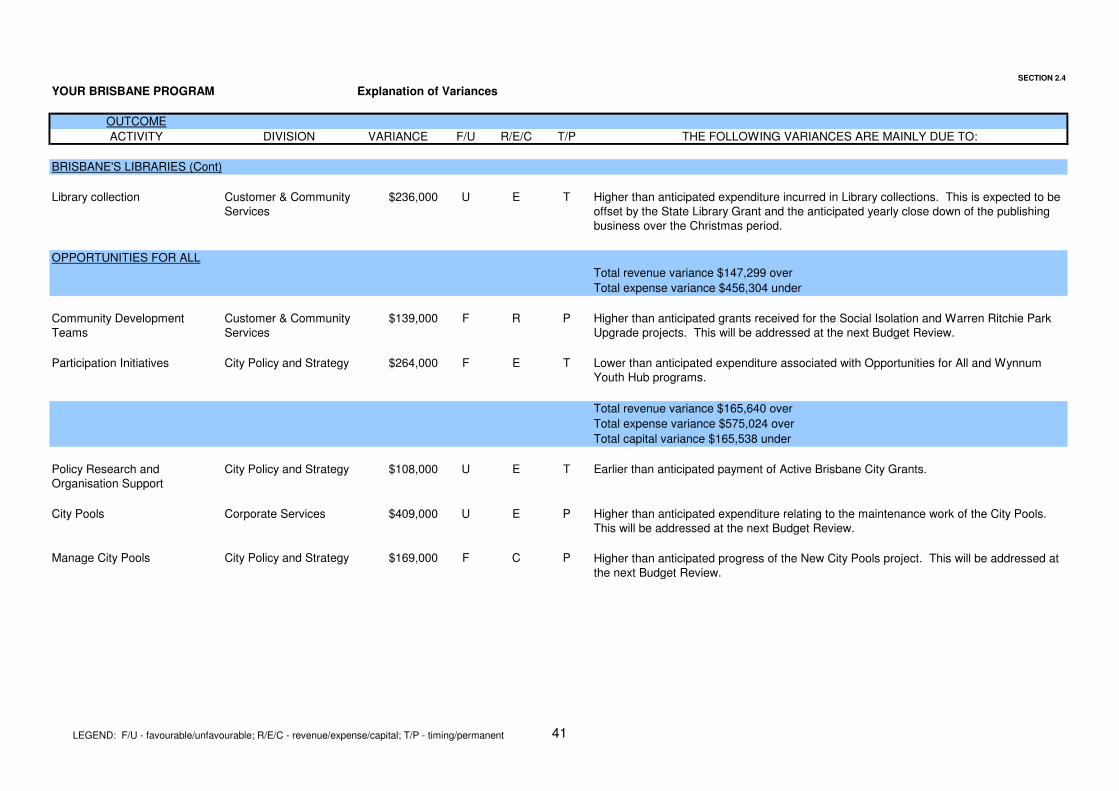
Library collection Customer & Community Services
$236,000 U E T Higher than anticipated expenditure incurred in Library collections. This is expected to be offset by the State Library Grant and the anticipated yearly close down of the publishing business over the Christmas period.
OPPORTUNITIES FOR ALL
Total revenue variance $147,299 over
Total expense variance $456,304 under
Community Development Teams
Customer & Community Services
$139,000 F R P Higher than anticipated grants received for the Social Isolation and Warren Ritchie Park Upgrade projects. This will be addressed at the next Budget Review.
Participation Initiatives City Policy and Strategy $264,000 F E T Lower than anticipated expenditure associated with Opportunities for All and Wynnum Youth Hub programs.
Total revenue variance $165,640 over
Total expense variance $575,024 over
Total capital variance $165,538 under
Policy Research and Organisation Support
City Policy and Strategy $108,000 U E T Earlier than anticipated payment of Active Brisbane City Grants.
City Pools Corporate Services $409,000 U E P Higher than anticipated expenditure relating to the maintenance work of the City Pools. This will be addressed at the next Budget Review.
Manage City Pools City Policy and Strategy $169,000 F C P Higher than anticipated progress of the New City Pools project. This will be addressed at the next Budget Review.
LEGEND: F/U - favourable/unfavourable; R/E/C - revenue/expense/capital; T/P - timing/permanent 41
Section 2.5
For the Period Ended
Actual
to Date
Approved
YTD Budget
Variance
Over(Under)
to Date
Variance
Over(Under)
to Date
Approved
Budget
2006/07September 2006 $ $ $ % $
OUTCOMES
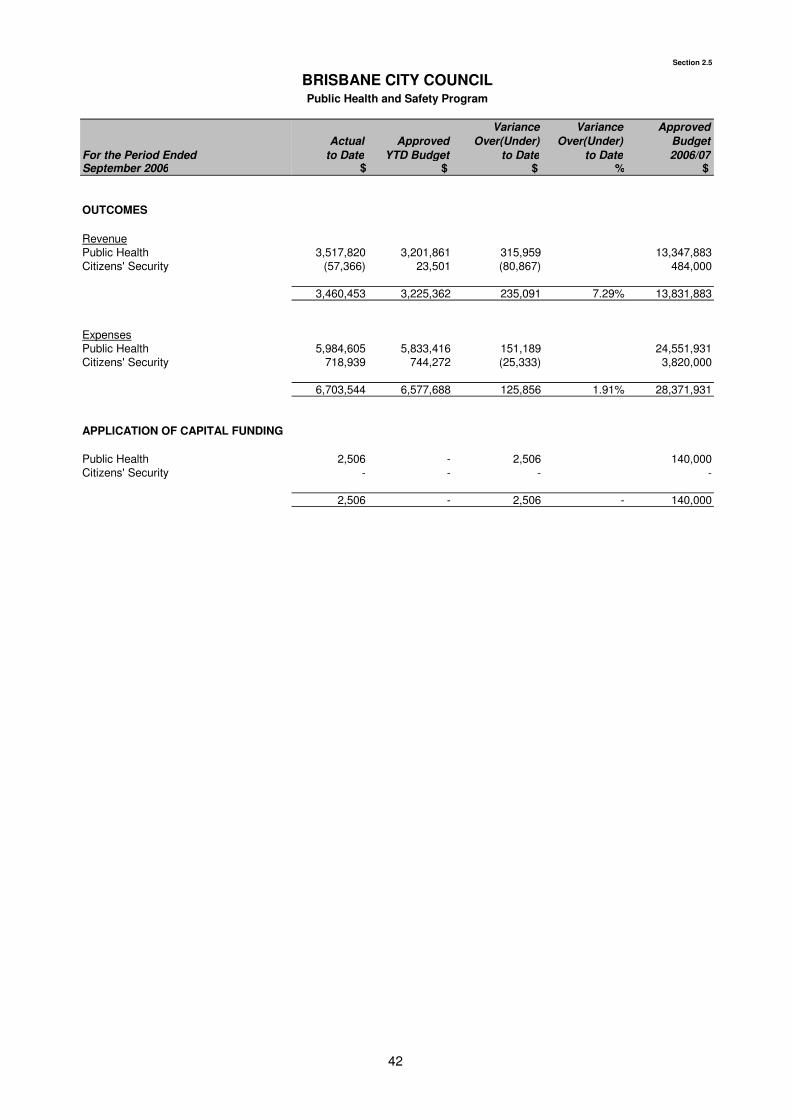
RevenuePublic Health 3,517,820 3,201,861 315,959 13,347,883Citizens' Security (57,366) 23,501 (80,867) 484,000
3,460,453 3,225,362 235,091 7.29% 13,831,883
ExpensesPublic Health 5,984,605 5,833,416 151,189 24,551,931Citizens' Security 718,939 744,272 (25,333) 3,820,000
6,703,544 6,577,688 125,856 1.91% 28,371,931
APPLICATION OF CAPITAL FUNDING
Public Health 2,506 - 2,506 140,000Citizens' Security - - - -
2,506 - 2,506 - 140,000
BRISBANE CITY COUNCILPublic Health and Safety Program
42
Section 2.5
BRISBANE CITY COUNCILReview of Public Health and Safety Program
Revenue
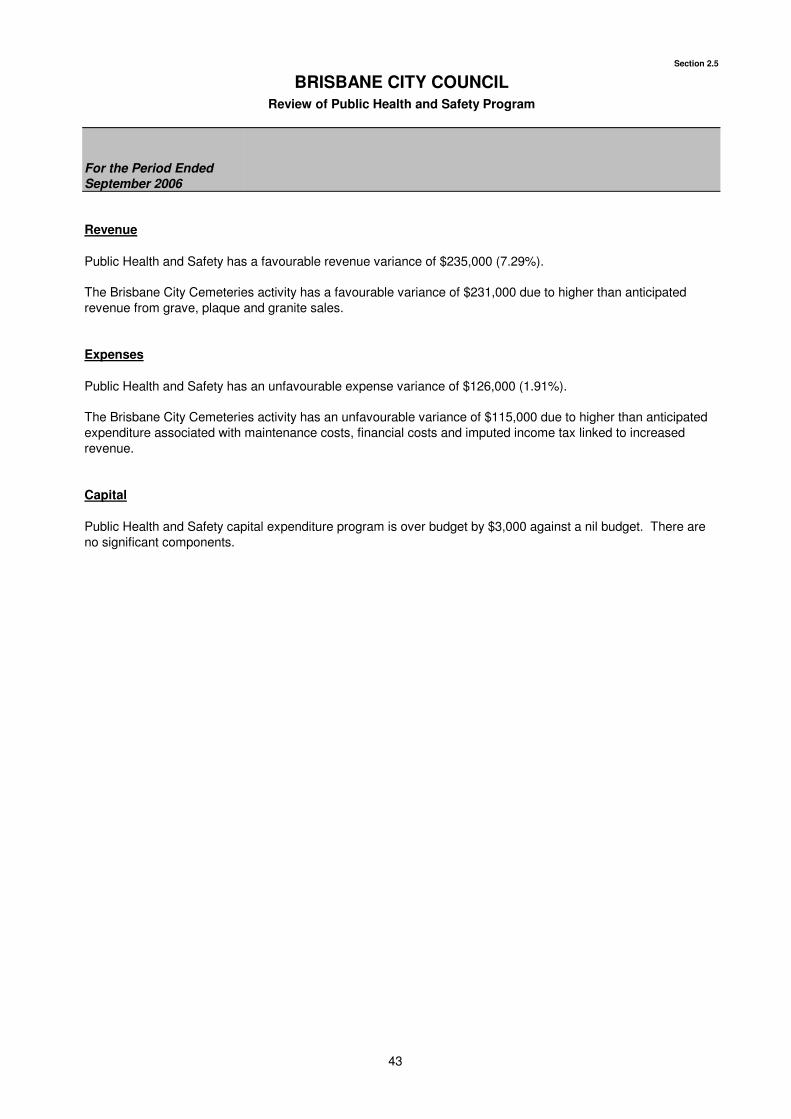
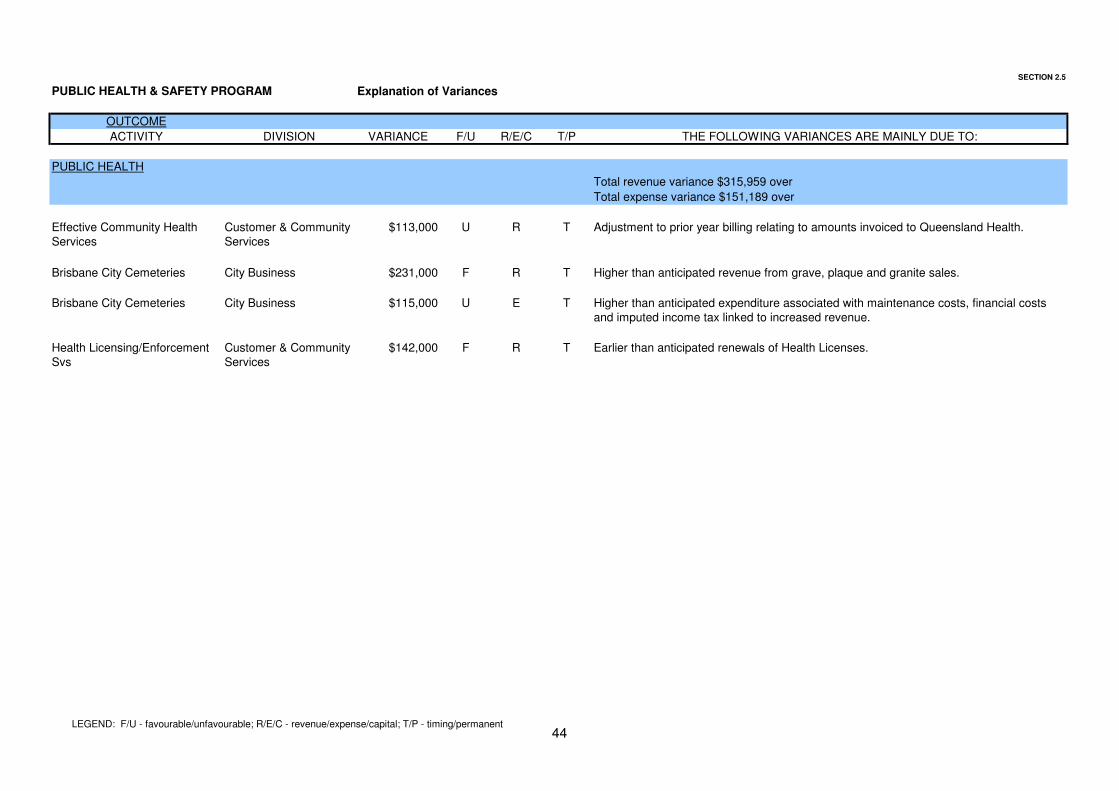
Public Health and Safety has a favourable revenue variance of $235,000 (7.29%).
Expenses
Public Health and Safety has an unfavourable expense variance of $126,000 (1.91%).
Capital
The Brisbane City Cemeteries activity has an unfavourable variance of $115,000 due to higher than anticipated expenditure associated with maintenance costs, financial costs and imputed income tax linked to increased revenue.
Public Health and Safety capital expenditure program is over budget by $3,000 against a nil budget. There are no significant components.
For the Period Ended September 2006
The Brisbane City Cemeteries activity has a favourable variance of $231,000 due to higher than anticipated revenue from grave, plaque and granite sales.
43
SECTION 2.5
PUBLIC HEALTH & SAFETY PROGRAM Explanation of Variances
OUTCOME
ACTIVITY DIVISION VARIANCE F/U R/E/C T/P THE FOLLOWING VARIANCES ARE MAINLY DUE TO:
PUBLIC HEALTH
Total revenue variance $315,959 over
Total expense variance $151,189 over
Effective Community Health Services
Customer & Community Services
$113,000 U R T Adjustment to prior year billing relating to amounts invoiced to Queensland Health.
Brisbane City Cemeteries City Business $231,000 F R T Higher than anticipated revenue from grave, plaque and granite sales.
Brisbane City Cemeteries City Business $115,000 U E T Higher than anticipated expenditure associated with maintenance costs, financial costs and imputed income tax linked to increased revenue.
Health Licensing/Enforcement Svs
Customer & Community Services
$142,000 F R T Earlier than anticipated renewals of Health Licenses.
LEGEND: F/U - favourable/unfavourable; R/E/C - revenue/expense/capital; T/P - timing/permanent44
THIS PAGE IS DELIBERATELY BLANK
45
Section 2.6
For the Period Ended
Actual
to Date
Approved
YTD Budget
Variance
Over(Under)
to Date
Variance
Over(Under)
to Date
Approved
Budget
2006/07September 2006 $ $ $ % $
OUTCOMES
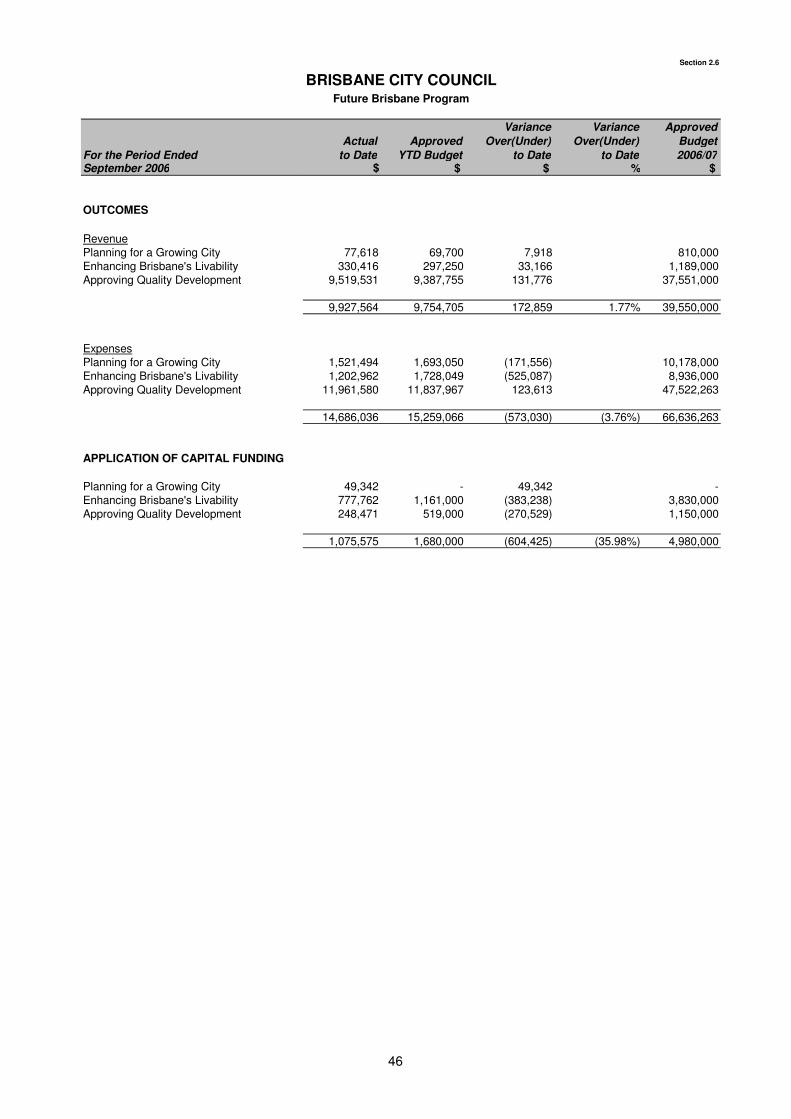
RevenuePlanning for a Growing City 77,618 69,700 7,918 810,000Enhancing Brisbane's Livability 330,416 297,250 33,166 1,189,000Approving Quality Development 9,519,531 9,387,755 131,776 37,551,000
9,927,564 9,754,705 172,859 1.77% 39,550,000
ExpensesPlanning for a Growing City 1,521,494 1,693,050 (171,556) 10,178,000Enhancing Brisbane's Livability 1,202,962 1,728,049 (525,087) 8,936,000Approving Quality Development 11,961,580 11,837,967 123,613 47,522,263
14,686,036 15,259,066 (573,030) (3.76%) 66,636,263
APPLICATION OF CAPITAL FUNDING
Planning for a Growing City 49,342 - 49,342 -Enhancing Brisbane's Livability 777,762 1,161,000 (383,238) 3,830,000Approving Quality Development 248,471 519,000 (270,529) 1,150,000
1,075,575 1,680,000 (604,425) (35.98%) 4,980,000
BRISBANE CITY COUNCILFuture Brisbane Program
46
Section 2.6
BRISBANE CITY COUNCILReview of Future Brisbane Program
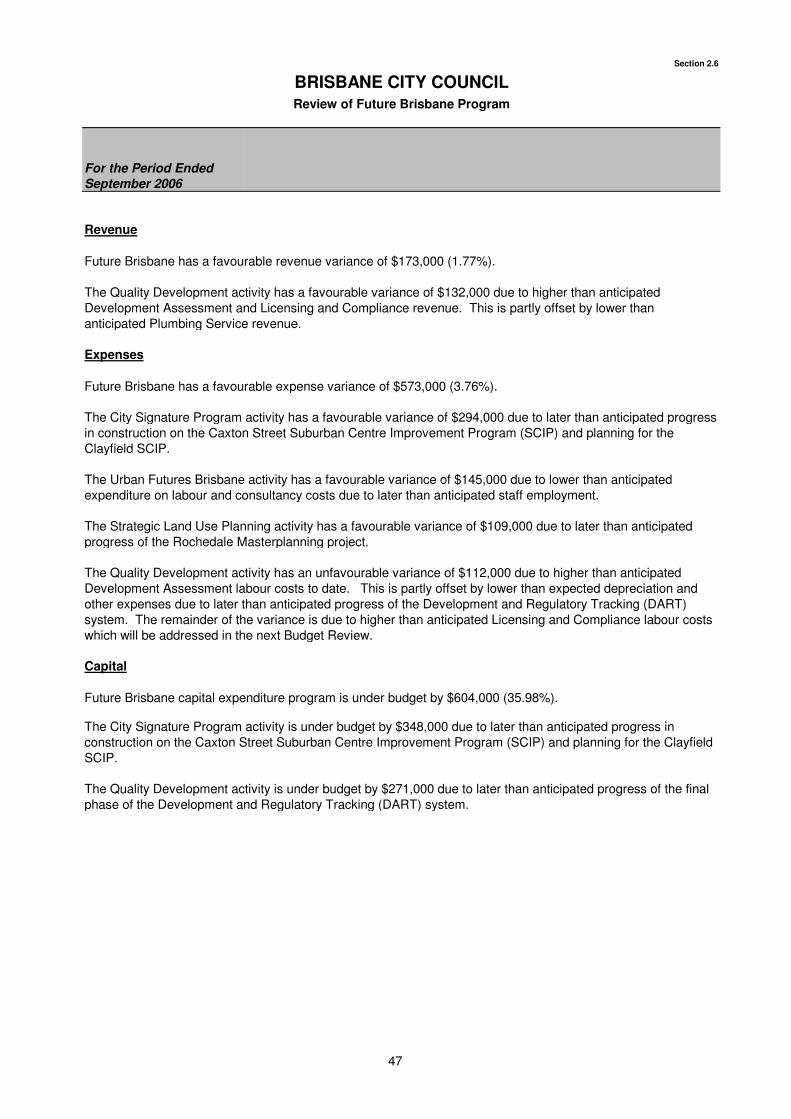
Revenue
Expenses
Capital
Future Brisbane has a favourable expense variance of $573,000 (3.76%).
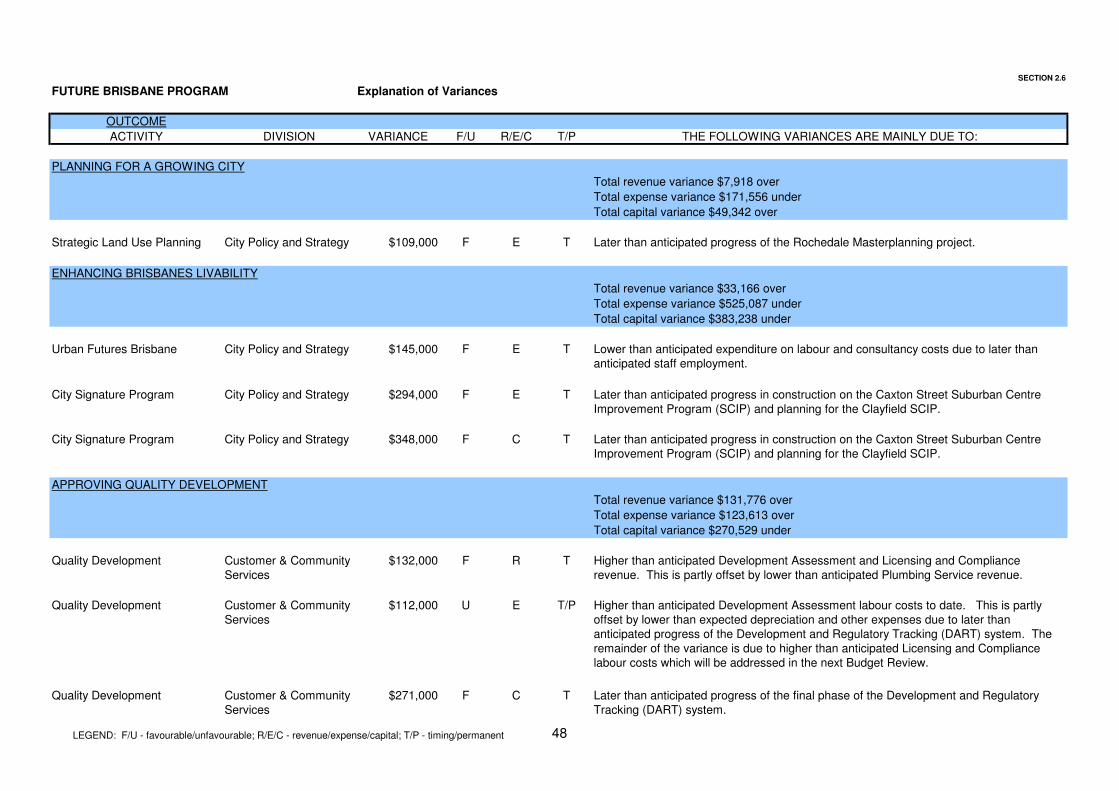
The City Signature Program activity has a favourable variance of $294,000 due to later than anticipated progress in construction on the Caxton Street Suburban Centre Improvement Program (SCIP) and planning for the Clayfield SCIP.
The Urban Futures Brisbane activity has a favourable variance of $145,000 due to lower than anticipated expenditure on labour and consultancy costs due to later than anticipated staff employment.
The Quality Development activity is under budget by $271,000 due to later than anticipated progress of the final phase of the Development and Regulatory Tracking (DART) system.
The Strategic Land Use Planning activity has a favourable variance of $109,000 due to later than anticipated progress of the Rochedale Masterplanning project.
The Quality Development activity has an unfavourable variance of $112,000 due to higher than anticipated Development Assessment labour costs to date. This is partly offset by lower than expected depreciation and other expenses due to later than anticipated progress of the Development and Regulatory Tracking (DART) system. The remainder of the variance is due to higher than anticipated Licensing and Compliance labour costs which will be addressed in the next Budget Review.
Future Brisbane capital expenditure program is under budget by $604,000 (35.98%).
The City Signature Program activity is under budget by $348,000 due to later than anticipated progress in construction on the Caxton Street Suburban Centre Improvement Program (SCIP) and planning for the Clayfield SCIP.
For the Period Ended September 2006
Future Brisbane has a favourable revenue variance of $173,000 (1.77%).
The Quality Development activity has a favourable variance of $132,000 due to higher than anticipated Development Assessment and Licensing and Compliance revenue. This is partly offset by lower than anticipated Plumbing Service revenue.
47
SECTION 2.6
FUTURE BRISBANE PROGRAM Explanation of Variances
OUTCOME
ACTIVITY DIVISION VARIANCE F/U R/E/C T/P THE FOLLOWING VARIANCES ARE MAINLY DUE TO:
PLANNING FOR A GROWING CITY
Total revenue variance $7,918 over
Total expense variance $171,556 under
Total capital variance $49,342 over
Strategic Land Use Planning City Policy and Strategy $109,000 F E T Later than anticipated progress of the Rochedale Masterplanning project.
ENHANCING BRISBANES LIVABILITY
Total revenue variance $33,166 over
Total expense variance $525,087 under
Total capital variance $383,238 under
Urban Futures Brisbane City Policy and Strategy $145,000 F E T Lower than anticipated expenditure on labour and consultancy costs due to later than anticipated staff employment.
City Signature Program City Policy and Strategy $294,000 F E T Later than anticipated progress in construction on the Caxton Street Suburban Centre Improvement Program (SCIP) and planning for the Clayfield SCIP.
City Signature Program City Policy and Strategy $348,000 F C T Later than anticipated progress in construction on the Caxton Street Suburban Centre Improvement Program (SCIP) and planning for the Clayfield SCIP.
APPROVING QUALITY DEVELOPMENT
Total revenue variance $131,776 over
Total expense variance $123,613 over
Total capital variance $270,529 under
Quality Development Customer & Community Services
$132,000 F R T Higher than anticipated Development Assessment and Licensing and Compliance revenue. This is partly offset by lower than anticipated Plumbing Service revenue.
Quality Development Customer & Community Services
$112,000 U E T/P Higher than anticipated Development Assessment labour costs to date. This is partly offset by lower than expected depreciation and other expenses due to later than anticipated progress of the Development and Regulatory Tracking (DART) system. The remainder of the variance is due to higher than anticipated Licensing and Compliance labour costs which will be addressed in the next Budget Review.
Quality Development Customer & Community Services
$271,000 F C T Later than anticipated progress of the final phase of the Development and Regulatory Tracking (DART) system.
LEGEND: F/U - favourable/unfavourable; R/E/C - revenue/expense/capital; T/P - timing/permanent 48

THIS PAGE IS DELIBERATELY BLANK
49
Section 2.7
For the Period Ended
Actual
to Date
Approved
YTD Budget
Variance
Over(Under)
to Date
Variance
Over(Under)
to Date
Approved
Budget
2006/07September 2006 $ $ $ % $
OUTCOMES
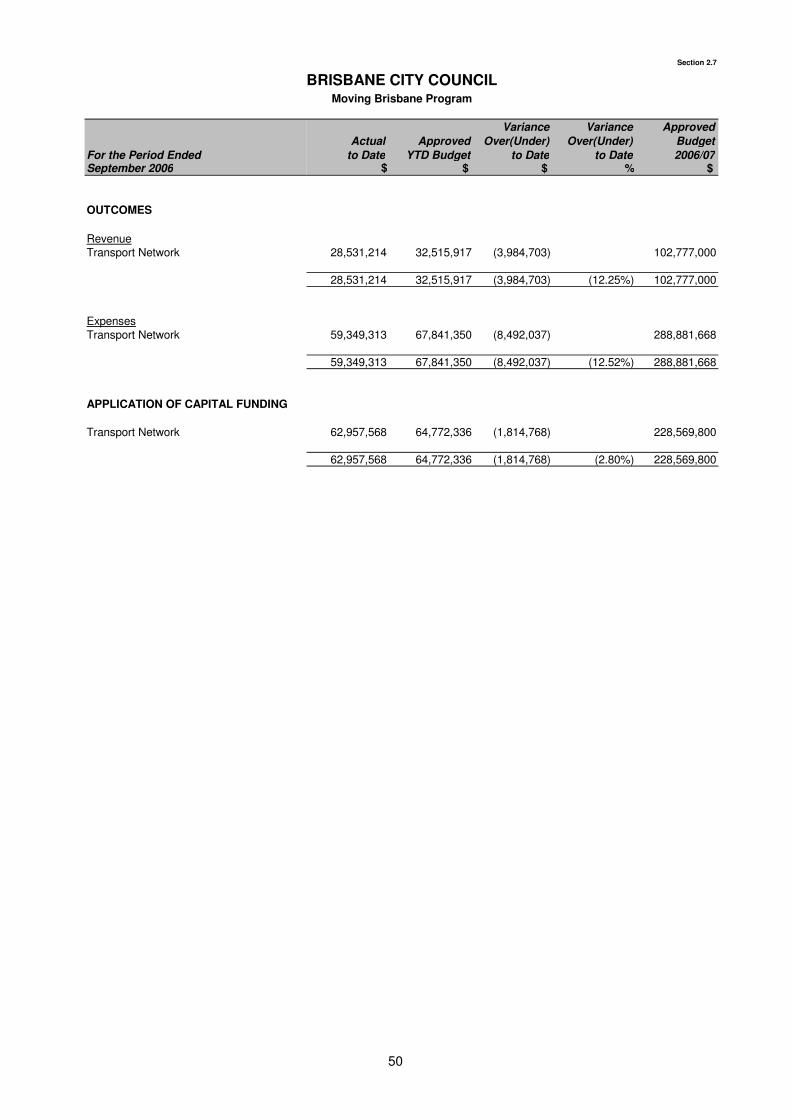
RevenueTransport Network 28,531,214 32,515,917 (3,984,703) 102,777,000
28,531,214 32,515,917 (3,984,703) (12.25%) 102,777,000
ExpensesTransport Network 59,349,313 67,841,350 (8,492,037) 288,881,668
59,349,313 67,841,350 (8,492,037) (12.52%) 288,881,668
APPLICATION OF CAPITAL FUNDING
Transport Network 62,957,568 64,772,336 (1,814,768) 228,569,800
62,957,568 64,772,336 (1,814,768) (2.80%) 228,569,800
BRISBANE CITY COUNCILMoving Brisbane Program
50
Section 2.7
BRISBANE CITY COUNCILReview of Moving Brisbane Program
Revenue
Expenses
Capital
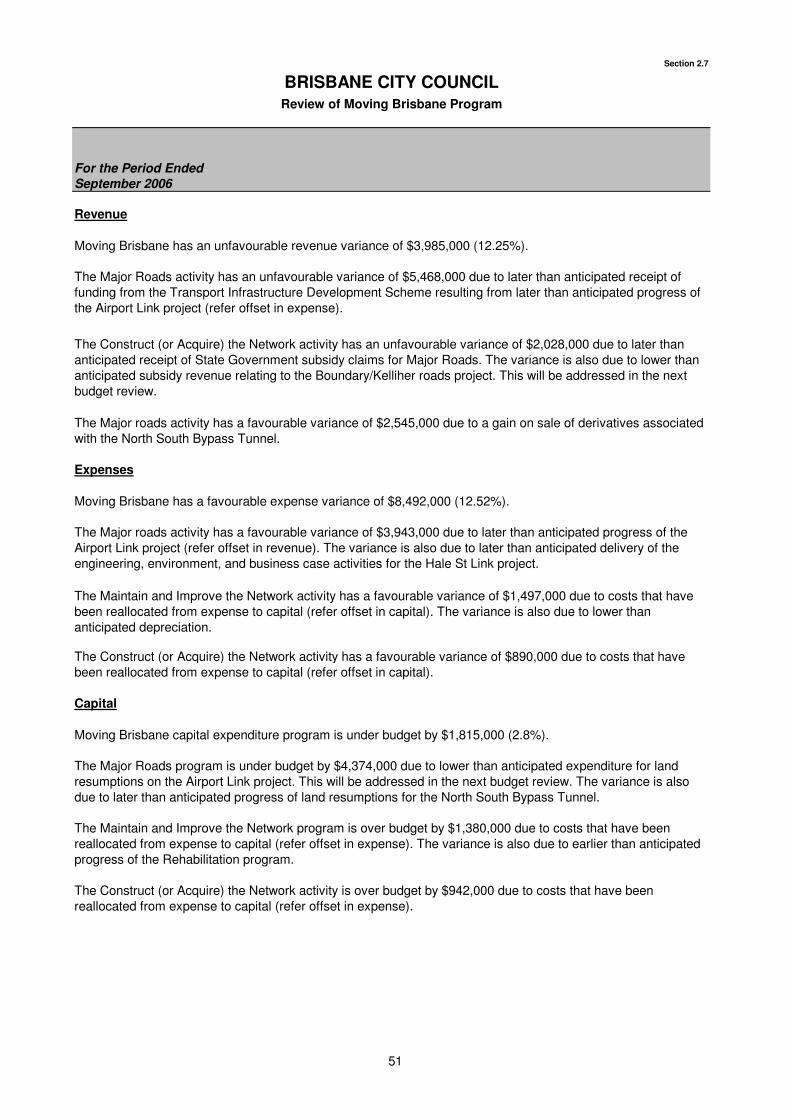
The Maintain and Improve the Network program is over budget by $1,380,000 due to costs that have been reallocated from expense to capital (refer offset in expense). The variance is also due to earlier than anticipated progress of the Rehabilitation program.
The Construct (or Acquire) the Network activity is over budget by $942,000 due to costs that have been reallocated from expense to capital (refer offset in expense).
The Maintain and Improve the Network activity has a favourable variance of $1,497,000 due to costs that have been reallocated from expense to capital (refer offset in capital). The variance is also due to lower than anticipated depreciation.
The Construct (or Acquire) the Network activity has a favourable variance of $890,000 due to costs that have been reallocated from expense to capital (refer offset in capital).
Moving Brisbane capital expenditure program is under budget by $1,815,000 (2.8%).
The Major Roads program is under budget by $4,374,000 due to lower than anticipated expenditure for land resumptions on the Airport Link project. This will be addressed in the next budget review. The variance is also due to later than anticipated progress of land resumptions for the North South Bypass Tunnel.
For the Period Ended September 2006
Moving Brisbane has an unfavourable revenue variance of $3,985,000 (12.25%).
The Major Roads activity has an unfavourable variance of $5,468,000 due to later than anticipated receipt of funding from the Transport Infrastructure Development Scheme resulting from later than anticipated progress of the Airport Link project (refer offset in expense).
The Construct (or Acquire) the Network activity has an unfavourable variance of $2,028,000 due to later than anticipated receipt of State Government subsidy claims for Major Roads. The variance is also due to lower than anticipated subsidy revenue relating to the Boundary/Kelliher roads project. This will be addressed in the next budget review.
The Major roads activity has a favourable variance of $2,545,000 due to a gain on sale of derivatives associated with the North South Bypass Tunnel.
Moving Brisbane has a favourable expense variance of $8,492,000 (12.52%).
The Major roads activity has a favourable variance of $3,943,000 due to later than anticipated progress of the Airport Link project (refer offset in revenue). The variance is also due to later than anticipated delivery of the engineering, environment, and business case activities for the Hale St Link project.
51
SECTION 2.7
MOVING BRISBANE PROGRAM Explanation of Variances
OUTCOME
ACTIVITY DIVISION VARIANCE F/U R/E/C T/P THE FOLLOWING VARIANCES ARE MAINLY DUE TO:
TRANSPORT NETWORK
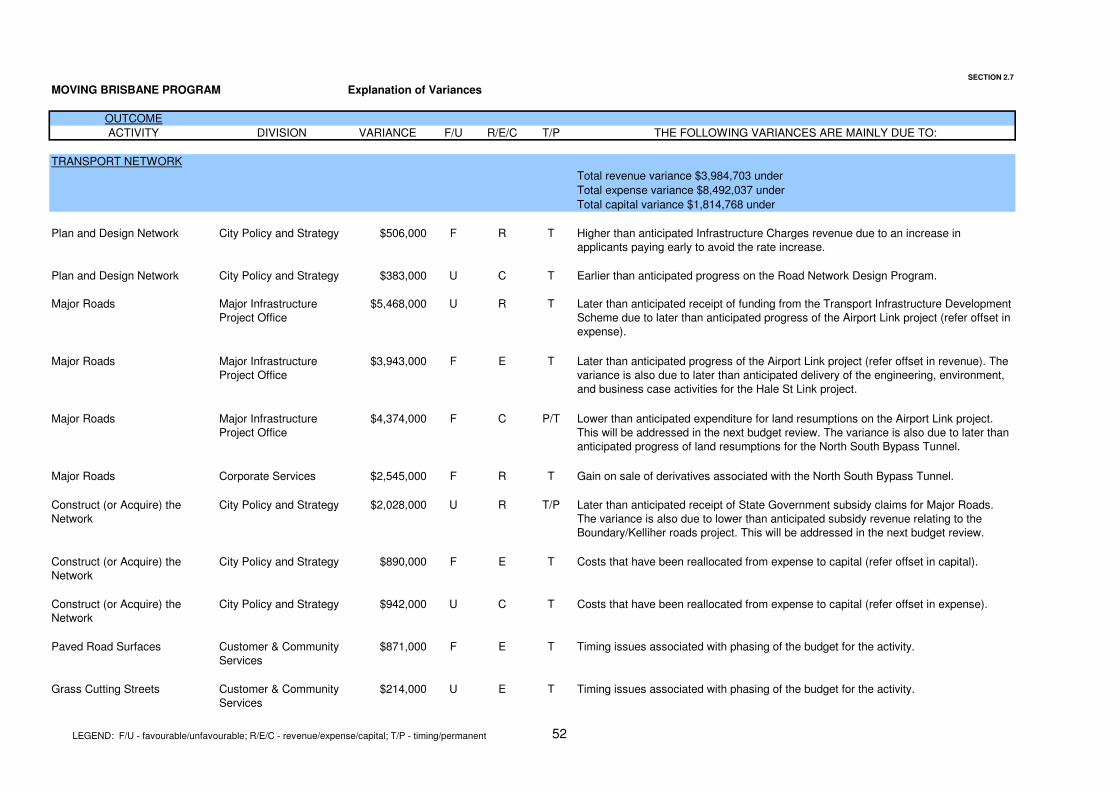
Total revenue variance $3,984,703 under
Total expense variance $8,492,037 under
Total capital variance $1,814,768 under
Plan and Design Network City Policy and Strategy $506,000 F R T Higher than anticipated Infrastructure Charges revenue due to an increase in applicants paying early to avoid the rate increase.
Plan and Design Network City Policy and Strategy $383,000 U C T Earlier than anticipated progress on the Road Network Design Program.
Major Roads Major Infrastructure Project Office
$5,468,000 U R T Later than anticipated receipt of funding from the Transport Infrastructure Development Scheme due to later than anticipated progress of the Airport Link project (refer offset in expense).
Major Roads Major Infrastructure Project Office
$3,943,000 F E T Later than anticipated progress of the Airport Link project (refer offset in revenue). The variance is also due to later than anticipated delivery of the engineering, environment, and business case activities for the Hale St Link project.
Major Roads Major Infrastructure Project Office
$4,374,000 F C P/T Lower than anticipated expenditure for land resumptions on the Airport Link project. This will be addressed in the next budget review. The variance is also due to later than anticipated progress of land resumptions for the North South Bypass Tunnel.
Major Roads Corporate Services $2,545,000 F R T Gain on sale of derivatives associated with the North South Bypass Tunnel.
Construct (or Acquire) the Network
City Policy and Strategy $2,028,000 U R T/P Later than anticipated receipt of State Government subsidy claims for Major Roads. The variance is also due to lower than anticipated subsidy revenue relating to the Boundary/Kelliher roads project. This will be addressed in the next budget review.
Construct (or Acquire) the Network
City Policy and Strategy $890,000 F E T Costs that have been reallocated from expense to capital (refer offset in capital).
Construct (or Acquire) the Network
City Policy and Strategy $942,000 U C T Costs that have been reallocated from expense to capital (refer offset in expense).
Paved Road Surfaces Customer & Community Services
$871,000 F E T Timing issues associated with phasing of the budget for the activity.
Grass Cutting Streets Customer & Community Services
$214,000 U E T Timing issues associated with phasing of the budget for the activity.
LEGEND: F/U - favourable/unfavourable; R/E/C - revenue/expense/capital; T/P - timing/permanent 52
SECTION 2.7
MOVING BRISBANE PROGRAM Explanation of Variances
OUTCOME
ACTIVITY DIVISION VARIANCE F/U R/E/C T/P THE FOLLOWING VARIANCES ARE MAINLY DUE TO:
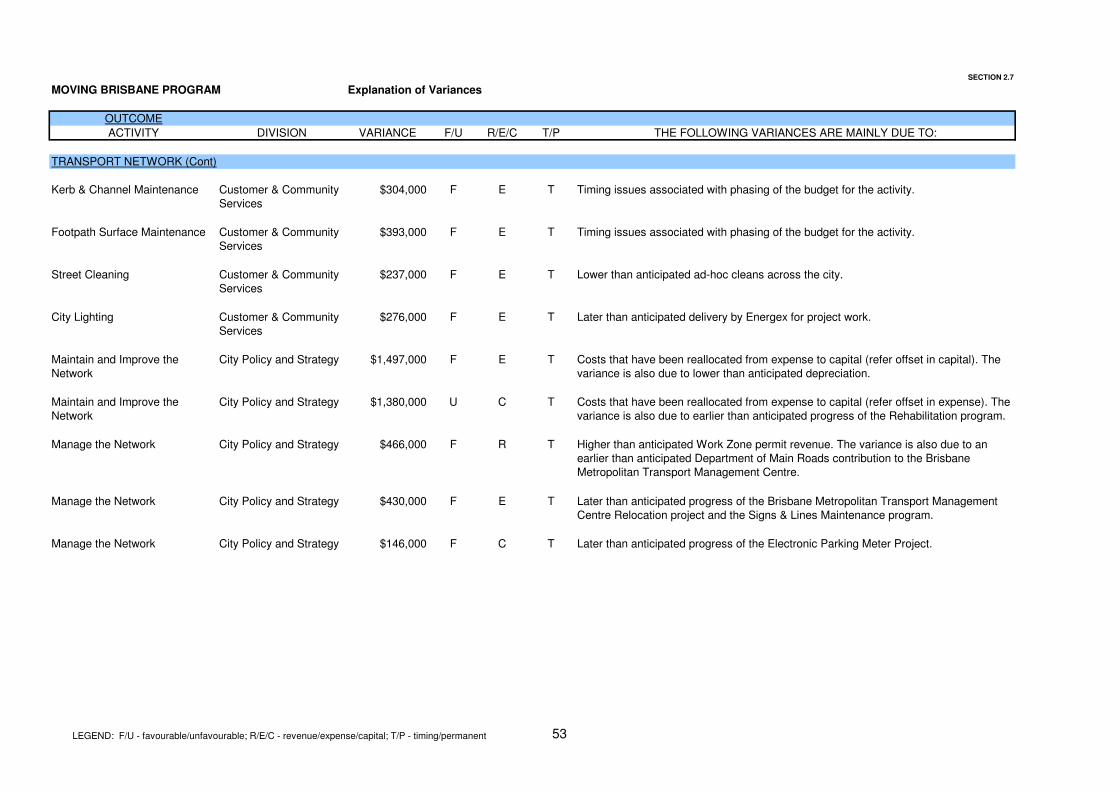
TRANSPORT NETWORK (Cont)
Kerb & Channel Maintenance Customer & Community Services
$304,000 F E T Timing issues associated with phasing of the budget for the activity.
Footpath Surface Maintenance Customer & Community Services
$393,000 F E T Timing issues associated with phasing of the budget for the activity.
Street Cleaning Customer & Community Services
$237,000 F E T Lower than anticipated ad-hoc cleans across the city.
City Lighting Customer & Community Services
$276,000 F E T Later than anticipated delivery by Energex for project work.
Maintain and Improve the Network
City Policy and Strategy $1,497,000 F E T Costs that have been reallocated from expense to capital (refer offset in capital). The variance is also due to lower than anticipated depreciation.
Maintain and Improve the Network
City Policy and Strategy $1,380,000 U C T Costs that have been reallocated from expense to capital (refer offset in expense). The variance is also due to earlier than anticipated progress of the Rehabilitation program.
Manage the Network City Policy and Strategy $466,000 F R T Higher than anticipated Work Zone permit revenue. The variance is also due to an earlier than anticipated Department of Main Roads contribution to the Brisbane Metropolitan Transport Management Centre.
Manage the Network City Policy and Strategy $430,000 F E T Later than anticipated progress of the Brisbane Metropolitan Transport Management Centre Relocation project and the Signs & Lines Maintenance program.
Manage the Network City Policy and Strategy $146,000 F C T Later than anticipated progress of the Electronic Parking Meter Project.
LEGEND: F/U - favourable/unfavourable; R/E/C - revenue/expense/capital; T/P - timing/permanent 53
Section 2.8
For the Period Ended
Actual
to Date
Approved
YTD Budget
Variance
Over(Under)
to Date
Variance
Over(Under)
to Date
Approved
Budget
2006/07September 2006 $ $ $ % $
OUTCOMES
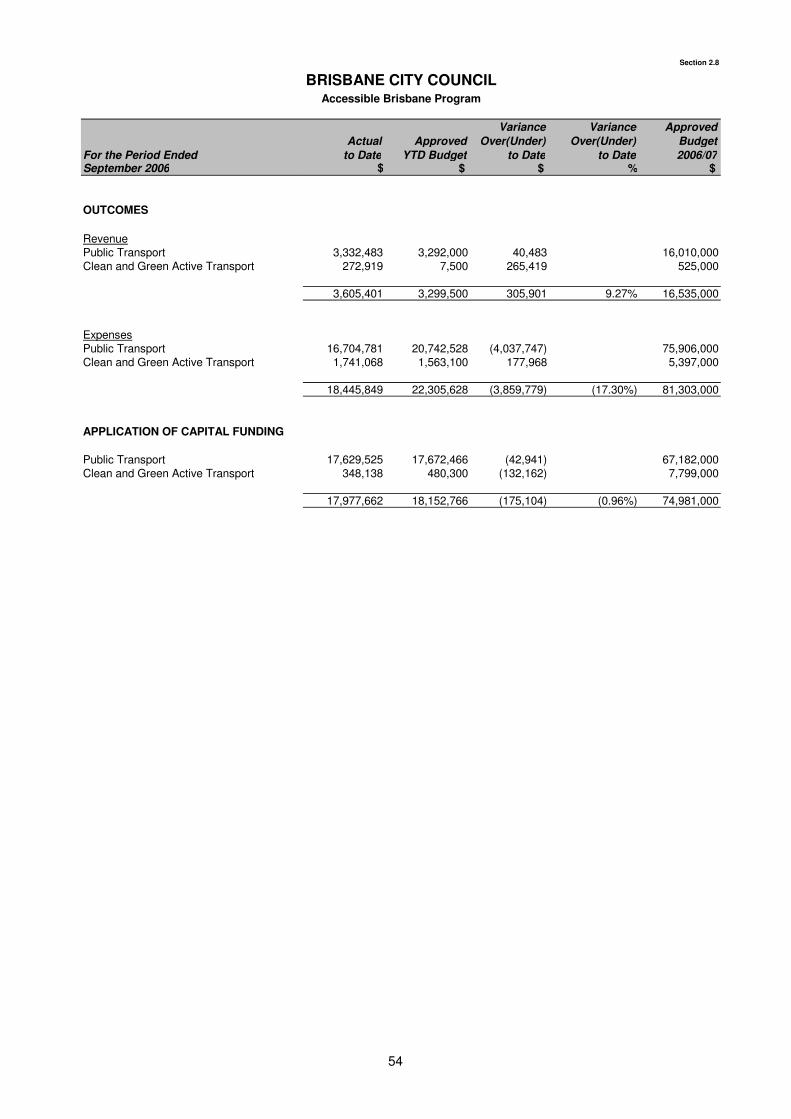
RevenuePublic Transport 3,332,483 3,292,000 40,483 16,010,000Clean and Green Active Transport 272,919 7,500 265,419 525,000
3,605,401 3,299,500 305,901 9.27% 16,535,000
ExpensesPublic Transport 16,704,781 20,742,528 (4,037,747) 75,906,000Clean and Green Active Transport 1,741,068 1,563,100 177,968 5,397,000
18,445,849 22,305,628 (3,859,779) (17.30%) 81,303,000
APPLICATION OF CAPITAL FUNDING
Public Transport 17,629,525 17,672,466 (42,941) 67,182,000Clean and Green Active Transport 348,138 480,300 (132,162) 7,799,000
17,977,662 18,152,766 (175,104) (0.96%) 74,981,000
BRISBANE CITY COUNCILAccessible Brisbane Program
54
Section 2.8
BRISBANE CITY COUNCILReview of Accessible Brisbane Program
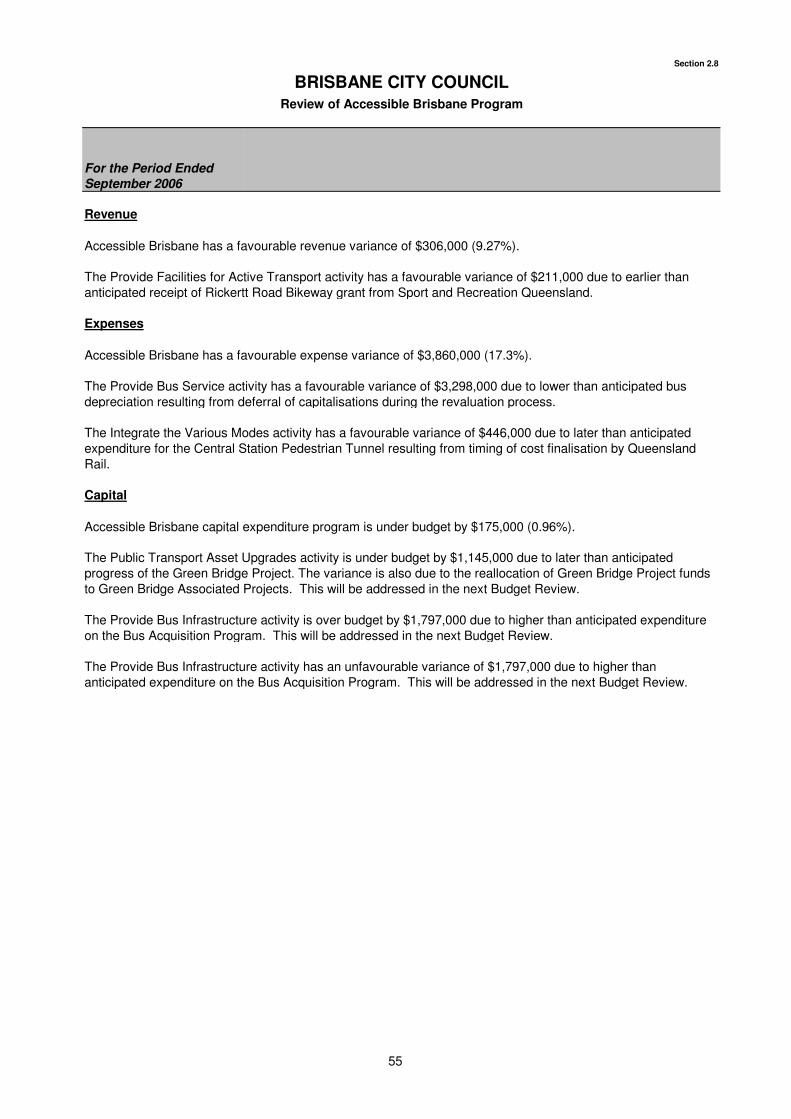
Revenue
Accessible Brisbane has a favourable revenue variance of $306,000 (9.27%).
Expenses
Accessible Brisbane has a favourable expense variance of $3,860,000 (17.3%).
Capital
Accessible Brisbane capital expenditure program is under budget by $175,000 (0.96%).
For the Period Ended September 2006
The Provide Facilities for Active Transport activity has a favourable variance of $211,000 due to earlier than anticipated receipt of Rickertt Road Bikeway grant from Sport and Recreation Queensland.
The Provide Bus Service activity has a favourable variance of $3,298,000 due to lower than anticipated bus depreciation resulting from deferral of capitalisations during the revaluation process.
The Integrate the Various Modes activity has a favourable variance of $446,000 due to later than anticipated expenditure for the Central Station Pedestrian Tunnel resulting from timing of cost finalisation by Queensland Rail.
The Provide Bus Infrastructure activity is over budget by $1,797,000 due to higher than anticipated expenditure on the Bus Acquisition Program. This will be addressed in the next Budget Review.
The Provide Bus Infrastructure activity has an unfavourable variance of $1,797,000 due to higher than anticipated expenditure on the Bus Acquisition Program. This will be addressed in the next Budget Review.
The Public Transport Asset Upgrades activity is under budget by $1,145,000 due to later than anticipated progress of the Green Bridge Project. The variance is also due to the reallocation of Green Bridge Project funds to Green Bridge Associated Projects. This will be addressed in the next Budget Review.
55
SECTION 2.8
ACCESSIBLE BRISBANE PROGRAM Explanation of Variances
OUTCOME
ACTIVITY DIVISION VARIANCE F/U R/E/C T/P THE FOLLOWING VARIANCES ARE MAINLY DUE TO:
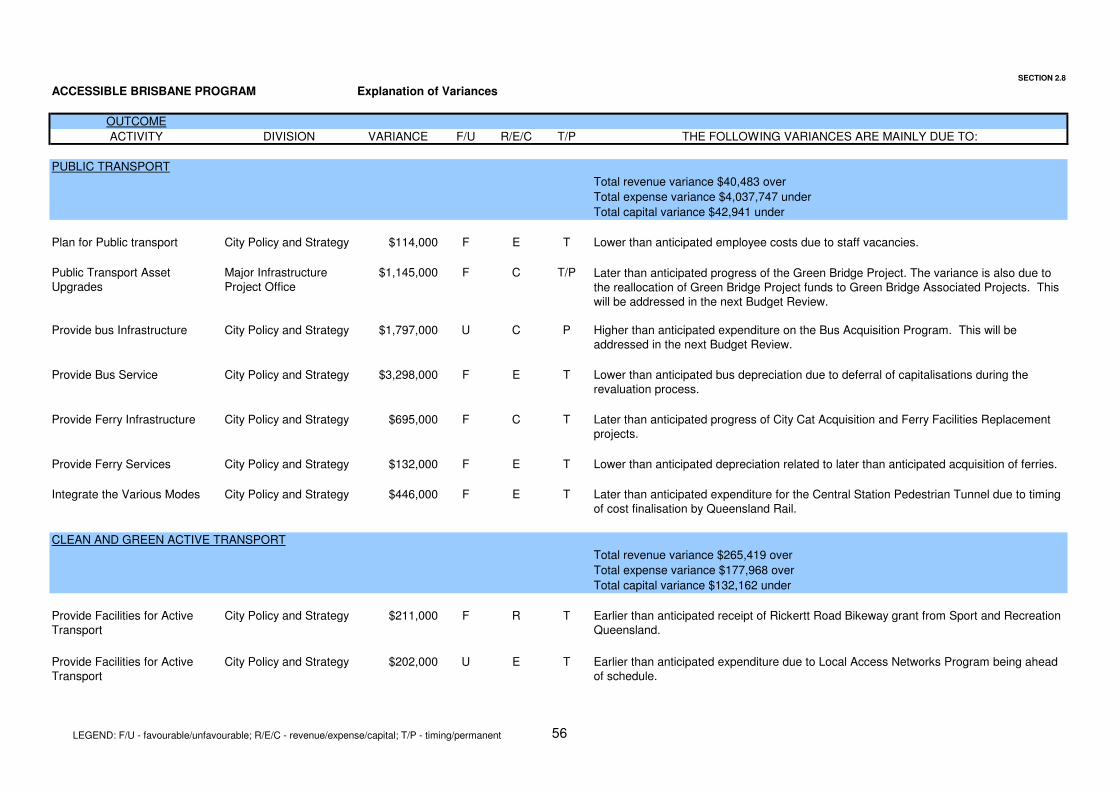
PUBLIC TRANSPORT
Total revenue variance $40,483 over
Total expense variance $4,037,747 under
Total capital variance $42,941 under
Plan for Public transport City Policy and Strategy $114,000 F E T Lower than anticipated employee costs due to staff vacancies.
Public Transport Asset Upgrades
Major Infrastructure Project Office
$1,145,000 F C T/P Later than anticipated progress of the Green Bridge Project. The variance is also due to the reallocation of Green Bridge Project funds to Green Bridge Associated Projects. This will be addressed in the next Budget Review.
Provide bus Infrastructure City Policy and Strategy $1,797,000 U C P Higher than anticipated expenditure on the Bus Acquisition Program. This will be addressed in the next Budget Review.
Provide Bus Service City Policy and Strategy $3,298,000 F E T Lower than anticipated bus depreciation due to deferral of capitalisations during the revaluation process.
Provide Ferry Infrastructure City Policy and Strategy $695,000 F C T Later than anticipated progress of City Cat Acquisition and Ferry Facilities Replacement projects.
Provide Ferry Services City Policy and Strategy $132,000 F E T Lower than anticipated depreciation related to later than anticipated acquisition of ferries.
Integrate the Various Modes City Policy and Strategy $446,000 F E T Later than anticipated expenditure for the Central Station Pedestrian Tunnel due to timing of cost finalisation by Queensland Rail.
CLEAN AND GREEN ACTIVE TRANSPORT
Total revenue variance $265,419 over
Total expense variance $177,968 over
Total capital variance $132,162 under
Provide Facilities for Active Transport
City Policy and Strategy $211,000 F R T Earlier than anticipated receipt of Rickertt Road Bikeway grant from Sport and Recreation Queensland.
Provide Facilities for Active Transport
City Policy and Strategy $202,000 U E T Earlier than anticipated expenditure due to Local Access Networks Program being ahead of schedule.
LEGEND: F/U - favourable/unfavourable; R/E/C - revenue/expense/capital; T/P - timing/permanent 56
SECTION 2.8
ACCESSIBLE BRISBANE PROGRAM Explanation of Variances
OUTCOME
ACTIVITY DIVISION VARIANCE F/U R/E/C T/P THE FOLLOWING VARIANCES ARE MAINLY DUE TO:
CLEAN AND GREEN ACTIVE TRANSPORT (Cont)
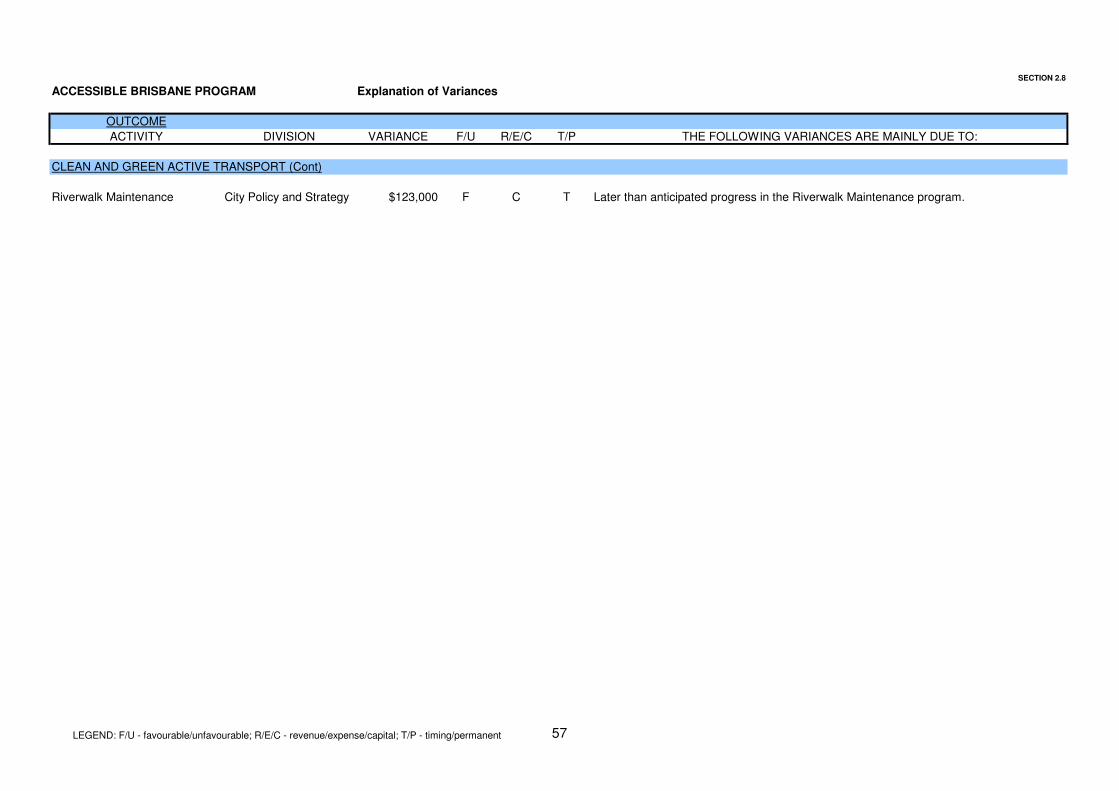
Riverwalk Maintenance City Policy and Strategy $123,000 F C T Later than anticipated progress in the Riverwalk Maintenance program.
LEGEND: F/U - favourable/unfavourable; R/E/C - revenue/expense/capital; T/P - timing/permanent 57
Section 2.9
For the Period Ended
Actual
to Date
Approved
YTD Budget
Variance
Over(Under)
to Date
Variance
Over(Under)
to Date
Approved
Budget
2006/07September 2006 $ $ $ % $
OUTCOMES
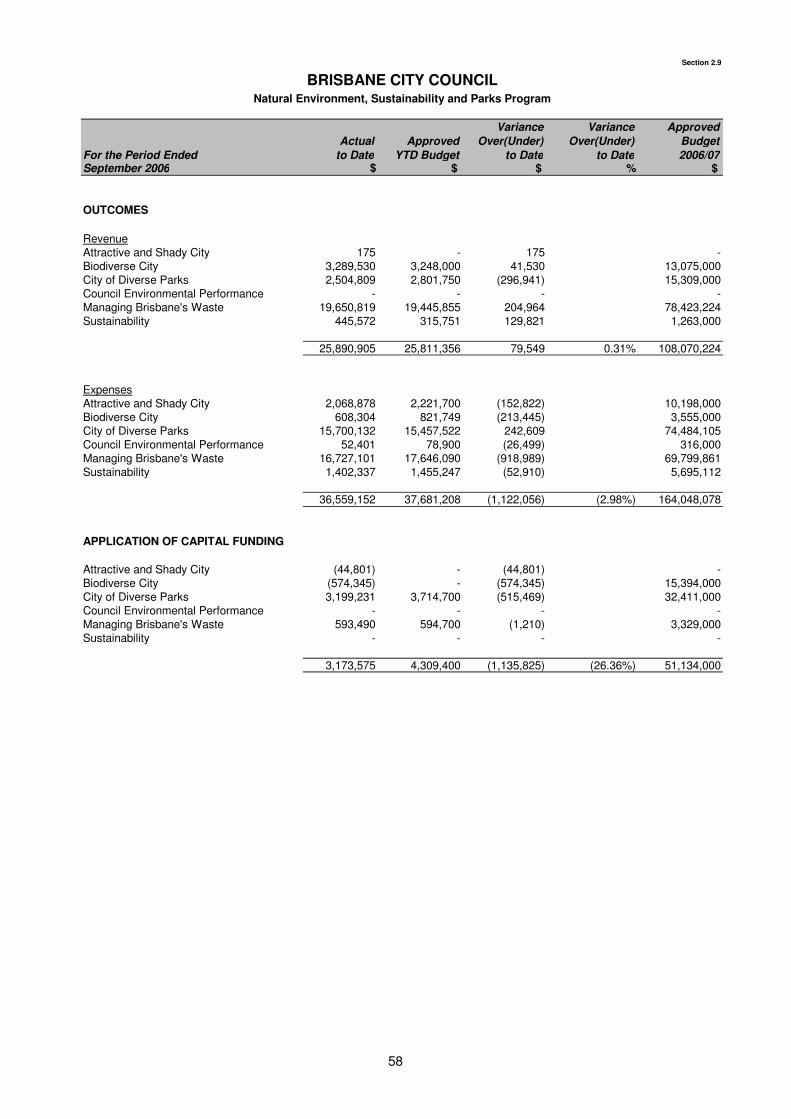
RevenueAttractive and Shady City 175 - 175 -Biodiverse City 3,289,530 3,248,000 41,530 13,075,000City of Diverse Parks 2,504,809 2,801,750 (296,941) 15,309,000Council Environmental Performance - - - -Managing Brisbane's Waste 19,650,819 19,445,855 204,964 78,423,224Sustainability 445,572 315,751 129,821 1,263,000
25,890,905 25,811,356 79,549 0.31% 108,070,224
ExpensesAttractive and Shady City 2,068,878 2,221,700 (152,822) 10,198,000Biodiverse City 608,304 821,749 (213,445) 3,555,000City of Diverse Parks 15,700,132 15,457,522 242,609 74,484,105Council Environmental Performance 52,401 78,900 (26,499) 316,000Managing Brisbane's Waste 16,727,101 17,646,090 (918,989) 69,799,861Sustainability 1,402,337 1,455,247 (52,910) 5,695,112
36,559,152 37,681,208 (1,122,056) (2.98%) 164,048,078
APPLICATION OF CAPITAL FUNDING
Attractive and Shady City (44,801) - (44,801) -Biodiverse City (574,345) - (574,345) 15,394,000City of Diverse Parks 3,199,231 3,714,700 (515,469) 32,411,000Council Environmental Performance - - - -Managing Brisbane's Waste 593,490 594,700 (1,210) 3,329,000Sustainability - - - -
3,173,575 4,309,400 (1,135,825) (26.36%) 51,134,000
BRISBANE CITY COUNCILNatural Environment, Sustainability and Parks Program
58
Section 2.9
BRISBANE CITY COUNCILReview of Natural Environment Sustainability and Parks Program
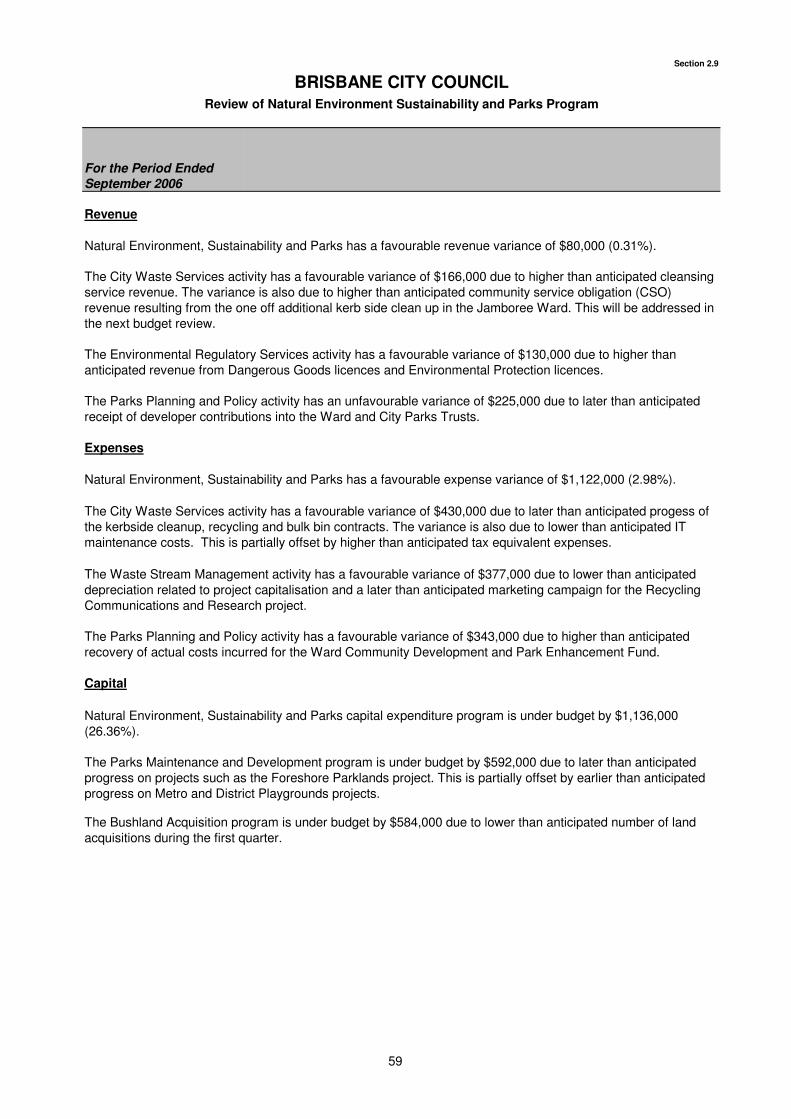
Revenue
Expenses
Capital
Natural Environment, Sustainability and Parks capital expenditure program is under budget by $1,136,000 (26.36%).
The Parks Maintenance and Development program is under budget by $592,000 due to later than anticipated progress on projects such as the Foreshore Parklands project. This is partially offset by earlier than anticipated progress on Metro and District Playgrounds projects.
The Bushland Acquisition program is under budget by $584,000 due to lower than anticipated number of land acquisitions during the first quarter.
The Parks Planning and Policy activity has an unfavourable variance of $225,000 due to later than anticipated receipt of developer contributions into the Ward and City Parks Trusts.
The Waste Stream Management activity has a favourable variance of $377,000 due to lower than anticipated depreciation related to project capitalisation and a later than anticipated marketing campaign for the Recycling Communications and Research project.
Natural Environment, Sustainability and Parks has a favourable expense variance of $1,122,000 (2.98%).
The City Waste Services activity has a favourable variance of $430,000 due to later than anticipated progess of the kerbside cleanup, recycling and bulk bin contracts. The variance is also due to lower than anticipated IT maintenance costs. This is partially offset by higher than anticipated tax equivalent expenses.
The Parks Planning and Policy activity has a favourable variance of $343,000 due to higher than anticipated recovery of actual costs incurred for the Ward Community Development and Park Enhancement Fund.
Natural Environment, Sustainability and Parks has a favourable revenue variance of $80,000 (0.31%).
The City Waste Services activity has a favourable variance of $166,000 due to higher than anticipated cleansing service revenue. The variance is also due to higher than anticipated community service obligation (CSO) revenue resulting from the one off additional kerb side clean up in the Jamboree Ward. This will be addressed in the next budget review.
The Environmental Regulatory Services activity has a favourable variance of $130,000 due to higher than anticipated revenue from Dangerous Goods licences and Environmental Protection licences.
For the Period Ended September 2006
59
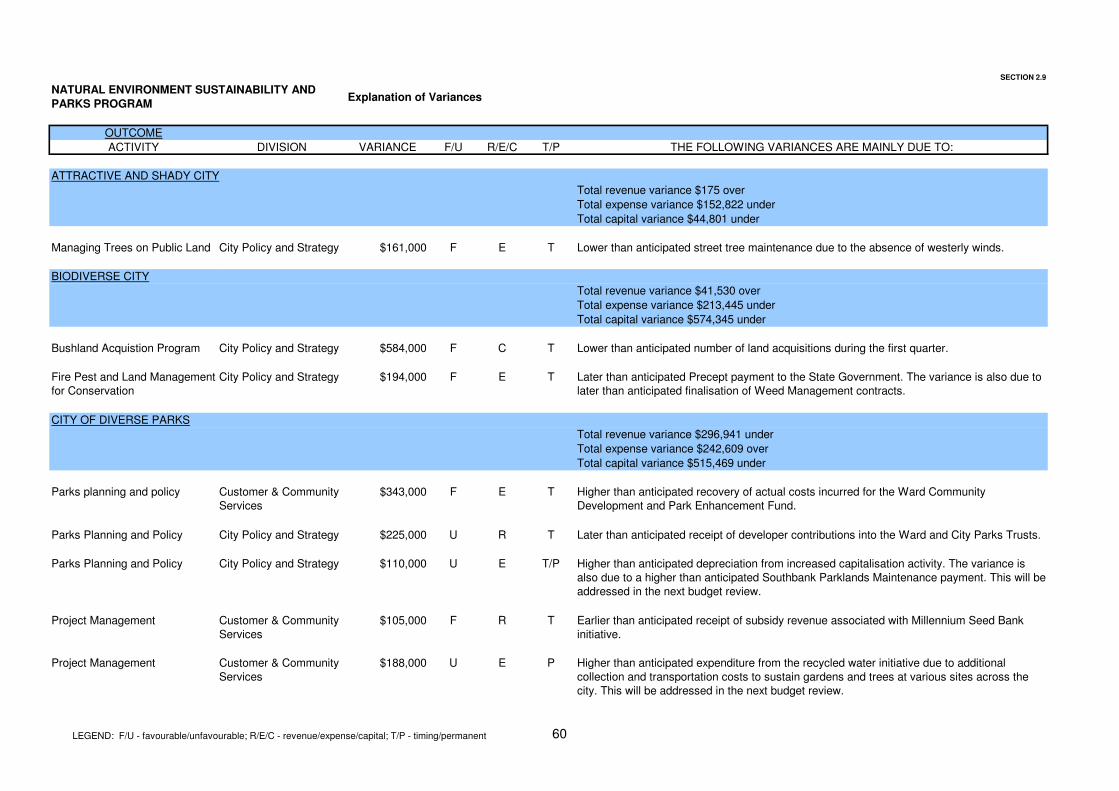
SECTION 2.9
Explanation of Variances
OUTCOME
ACTIVITY DIVISION VARIANCE F/U R/E/C T/P THE FOLLOWING VARIANCES ARE MAINLY DUE TO:
ATTRACTIVE AND SHADY CITY
Total revenue variance $175 over
Total expense variance $152,822 under
Total capital variance $44,801 under
Managing Trees on Public Land City Policy and Strategy $161,000 F E T Lower than anticipated street tree maintenance due to the absence of westerly winds.
BIODIVERSE CITY
Total revenue variance $41,530 over
Total expense variance $213,445 under
Total capital variance $574,345 under
Bushland Acquistion Program City Policy and Strategy $584,000 F C T Lower than anticipated number of land acquisitions during the first quarter.
Fire Pest and Land Management for Conservation
City Policy and Strategy $194,000 F E T Later than anticipated Precept payment to the State Government. The variance is also due to later than anticipated finalisation of Weed Management contracts.
CITY OF DIVERSE PARKS
Total revenue variance $296,941 under
Total expense variance $242,609 over
Total capital variance $515,469 under
Parks planning and policy Customer & Community Services
$343,000 F E T Higher than anticipated recovery of actual costs incurred for the Ward Community Development and Park Enhancement Fund.
Parks Planning and Policy City Policy and Strategy $225,000 U R T Later than anticipated receipt of developer contributions into the Ward and City Parks Trusts.
Parks Planning and Policy City Policy and Strategy $110,000 U E T/P Higher than anticipated depreciation from increased capitalisation activity. The variance is also due to a higher than anticipated Southbank Parklands Maintenance payment. This will be addressed in the next budget review.
Project Management Customer & Community Services
$105,000 F R T Earlier than anticipated receipt of subsidy revenue associated with Millennium Seed Bank initiative.
Project Management Customer & Community Services
$188,000 U E P Higher than anticipated expenditure from the recycled water initiative due to additional collection and transportation costs to sustain gardens and trees at various sites across the city. This will be addressed in the next budget review.
NATURAL ENVIRONMENT SUSTAINABILITY AND
PARKS PROGRAM
LEGEND: F/U - favourable/unfavourable; R/E/C - revenue/expense/capital; T/P - timing/permanent 60
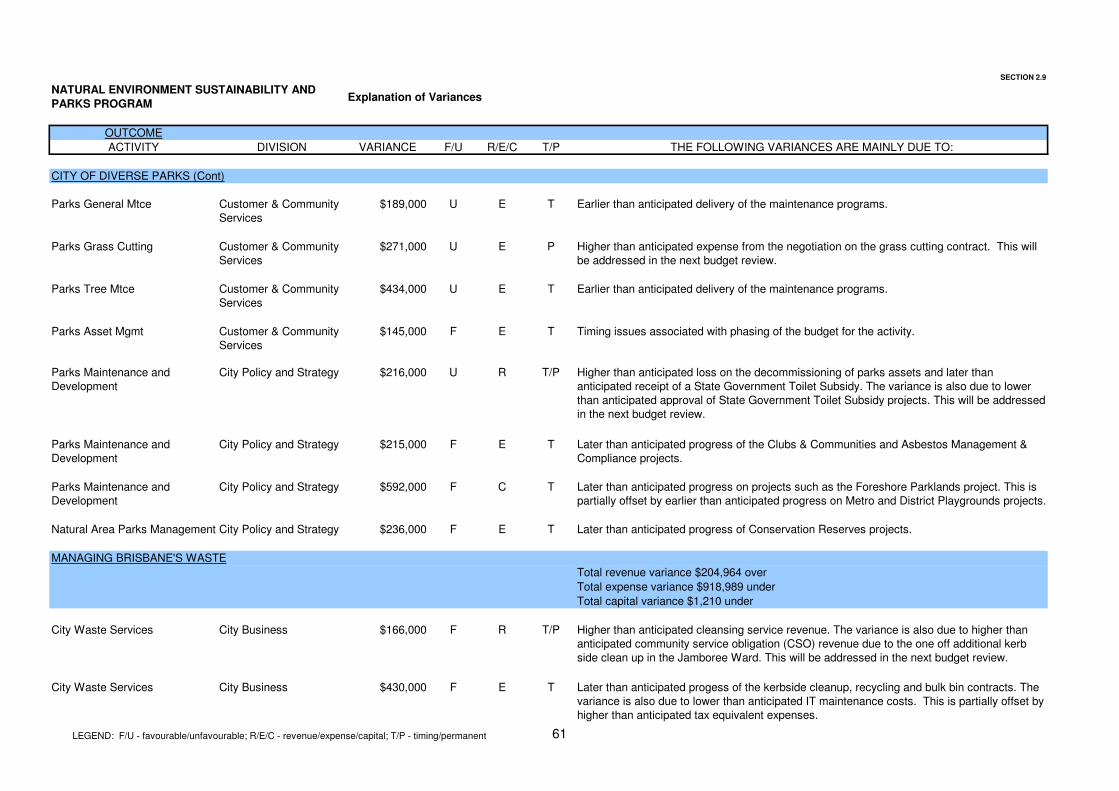
SECTION 2.9
Explanation of Variances
OUTCOME
ACTIVITY DIVISION VARIANCE F/U R/E/C T/P THE FOLLOWING VARIANCES ARE MAINLY DUE TO:
NATURAL ENVIRONMENT SUSTAINABILITY AND
PARKS PROGRAM
CITY OF DIVERSE PARKS (Cont)
Parks General Mtce Customer & Community Services
$189,000 U E T Earlier than anticipated delivery of the maintenance programs.
Parks Grass Cutting Customer & Community Services
$271,000 U E P Higher than anticipated expense from the negotiation on the grass cutting contract. This will be addressed in the next budget review.
Parks Tree Mtce Customer & Community Services
$434,000 U E T Earlier than anticipated delivery of the maintenance programs.
Parks Asset Mgmt Customer & Community Services
$145,000 F E T Timing issues associated with phasing of the budget for the activity.
Parks Maintenance and Development
City Policy and Strategy $216,000 U R T/P Higher than anticipated loss on the decommissioning of parks assets and later than anticipated receipt of a State Government Toilet Subsidy. The variance is also due to lower than anticipated approval of State Government Toilet Subsidy projects. This will be addressed in the next budget review.
Parks Maintenance and Development
City Policy and Strategy $215,000 F E T Later than anticipated progress of the Clubs & Communities and Asbestos Management & Compliance projects.
Parks Maintenance and Development
City Policy and Strategy $592,000 F C T Later than anticipated progress on projects such as the Foreshore Parklands project. This is partially offset by earlier than anticipated progress on Metro and District Playgrounds projects.
Natural Area Parks Management City Policy and Strategy $236,000 F E T Later than anticipated progress of Conservation Reserves projects.
MANAGING BRISBANE'S WASTE
Total revenue variance $204,964 over
Total expense variance $918,989 under
Total capital variance $1,210 under
City Waste Services City Business $166,000 F R T/P Higher than anticipated cleansing service revenue. The variance is also due to higher than anticipated community service obligation (CSO) revenue due to the one off additional kerb side clean up in the Jamboree Ward. This will be addressed in the next budget review.
City Waste Services City Business $430,000 F E T Later than anticipated progess of the kerbside cleanup, recycling and bulk bin contracts. The variance is also due to lower than anticipated IT maintenance costs. This is partially offset by higher than anticipated tax equivalent expenses.
LEGEND: F/U - favourable/unfavourable; R/E/C - revenue/expense/capital; T/P - timing/permanent 61
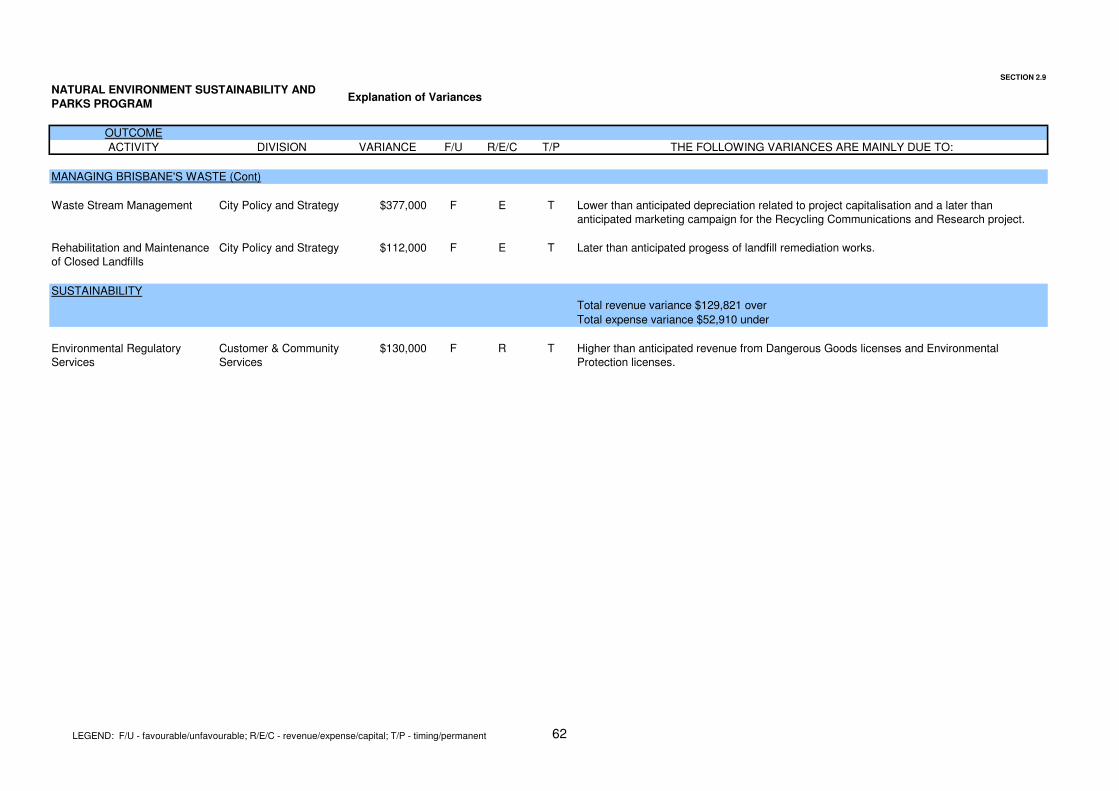
SECTION 2.9
Explanation of Variances
OUTCOME
ACTIVITY DIVISION VARIANCE F/U R/E/C T/P THE FOLLOWING VARIANCES ARE MAINLY DUE TO:
NATURAL ENVIRONMENT SUSTAINABILITY AND
PARKS PROGRAM
MANAGING BRISBANE'S WASTE (Cont)
Waste Stream Management City Policy and Strategy $377,000 F E T Lower than anticipated depreciation related to project capitalisation and a later than anticipated marketing campaign for the Recycling Communications and Research project.
Rehabilitation and Maintenance of Closed Landfills
City Policy and Strategy $112,000 F E T Later than anticipated progess of landfill remediation works.
SUSTAINABILITY
Total revenue variance $129,821 over
Total expense variance $52,910 under
Environmental Regulatory Services
Customer & Community Services
$130,000 F R T Higher than anticipated revenue from Dangerous Goods licenses and Environmental Protection licenses.
LEGEND: F/U - favourable/unfavourable; R/E/C - revenue/expense/capital; T/P - timing/permanent 62

THIS PAGE IS DELIBERATELY BLANK
63
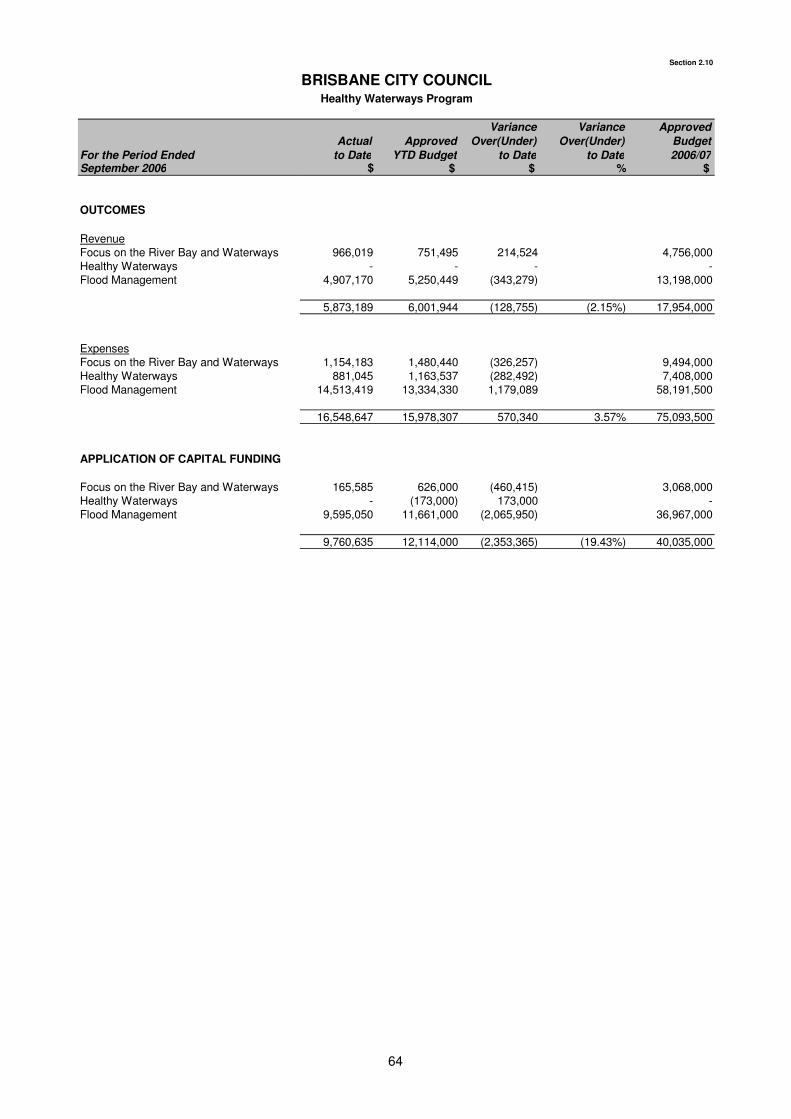
Section 2.10
For the Period Ended
Actual
to Date
Approved
YTD Budget
Variance
Over(Under)
to Date
Variance
Over(Under)
to Date
Approved
Budget
2006/07September 2006 $ $ $ % $
OUTCOMES
RevenueFocus on the River Bay and Waterways 966,019 751,495 214,524 4,756,000Healthy Waterways - - - -Flood Management 4,907,170 5,250,449 (343,279) 13,198,000
5,873,189 6,001,944 (128,755) (2.15%) 17,954,000
ExpensesFocus on the River Bay and Waterways 1,154,183 1,480,440 (326,257) 9,494,000Healthy Waterways 881,045 1,163,537 (282,492) 7,408,000Flood Management 14,513,419 13,334,330 1,179,089 58,191,500
16,548,647 15,978,307 570,340 3.57% 75,093,500
APPLICATION OF CAPITAL FUNDING
Focus on the River Bay and Waterways 165,585 626,000 (460,415) 3,068,000Healthy Waterways - (173,000) 173,000 -Flood Management 9,595,050 11,661,000 (2,065,950) 36,967,000
9,760,635 12,114,000 (2,353,365) (19.43%) 40,035,000
BRISBANE CITY COUNCILHealthy Waterways Program
64
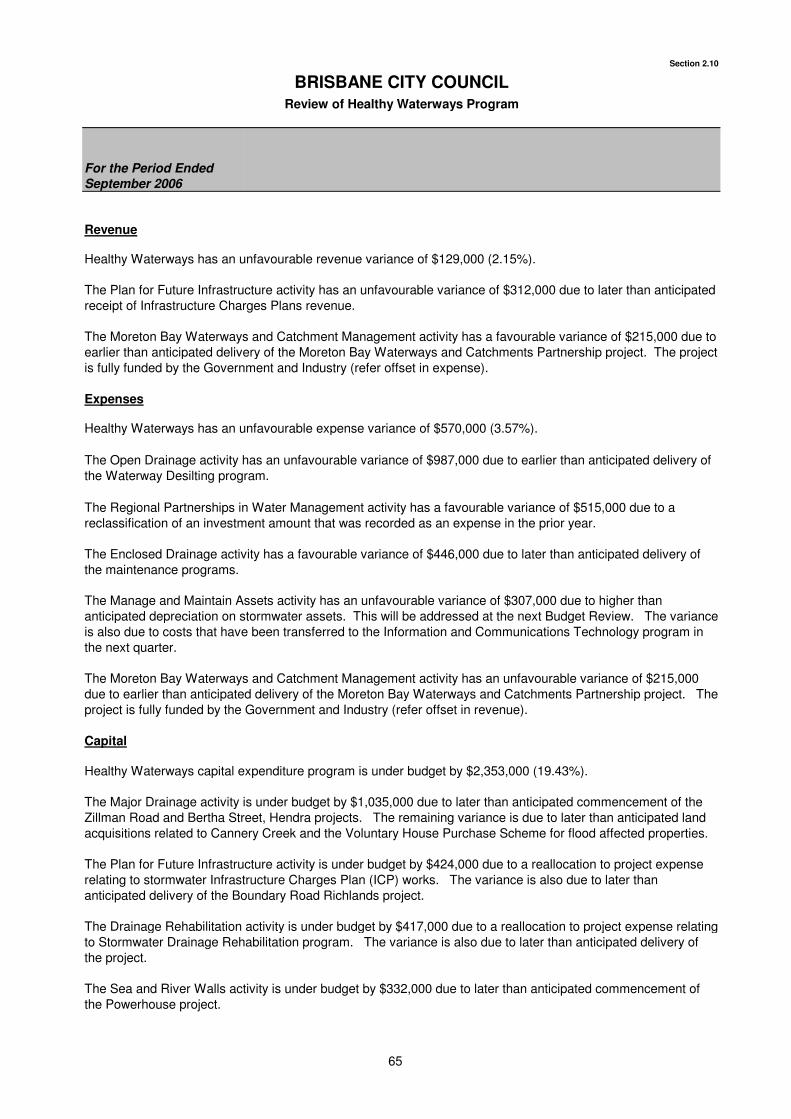
Section 2.10
BRISBANE CITY COUNCILReview of Healthy Waterways Program
Revenue
Expenses
Capital
The Open Drainage activity has an unfavourable variance of $987,000 due to earlier than anticipated delivery of the Waterway Desilting program.
The Regional Partnerships in Water Management activity has a favourable variance of $515,000 due to a reclassification of an investment amount that was recorded as an expense in the prior year.
The Manage and Maintain Assets activity has an unfavourable variance of $307,000 due to higher than anticipated depreciation on stormwater assets. This will be addressed at the next Budget Review. The variance is also due to costs that have been transferred to the Information and Communications Technology program in the next quarter.
For the Period Ended September 2006
Healthy Waterways has an unfavourable revenue variance of $129,000 (2.15%).
The Plan for Future Infrastructure activity has an unfavourable variance of $312,000 due to later than anticipated receipt of Infrastructure Charges Plans revenue.
The Moreton Bay Waterways and Catchment Management activity has a favourable variance of $215,000 due to earlier than anticipated delivery of the Moreton Bay Waterways and Catchments Partnership project. The project is fully funded by the Government and Industry (refer offset in expense).
Healthy Waterways has an unfavourable expense variance of $570,000 (3.57%).
The Drainage Rehabilitation activity is under budget by $417,000 due to a reallocation to project expense relating to Stormwater Drainage Rehabilitation program. The variance is also due to later than anticipated delivery of the project.
The Sea and River Walls activity is under budget by $332,000 due to later than anticipated commencement of the Powerhouse project.
The Enclosed Drainage activity has a favourable variance of $446,000 due to later than anticipated delivery of the maintenance programs.
The Moreton Bay Waterways and Catchment Management activity has an unfavourable variance of $215,000 due to earlier than anticipated delivery of the Moreton Bay Waterways and Catchments Partnership project. The project is fully funded by the Government and Industry (refer offset in revenue).
Healthy Waterways capital expenditure program is under budget by $2,353,000 (19.43%).
The Major Drainage activity is under budget by $1,035,000 due to later than anticipated commencement of the Zillman Road and Bertha Street, Hendra projects. The remaining variance is due to later than anticipated land acquisitions related to Cannery Creek and the Voluntary House Purchase Scheme for flood affected properties.
The Plan for Future Infrastructure activity is under budget by $424,000 due to a reallocation to project expense relating to stormwater Infrastructure Charges Plan (ICP) works. The variance is also due to later than anticipated delivery of the Boundary Road Richlands project.
65
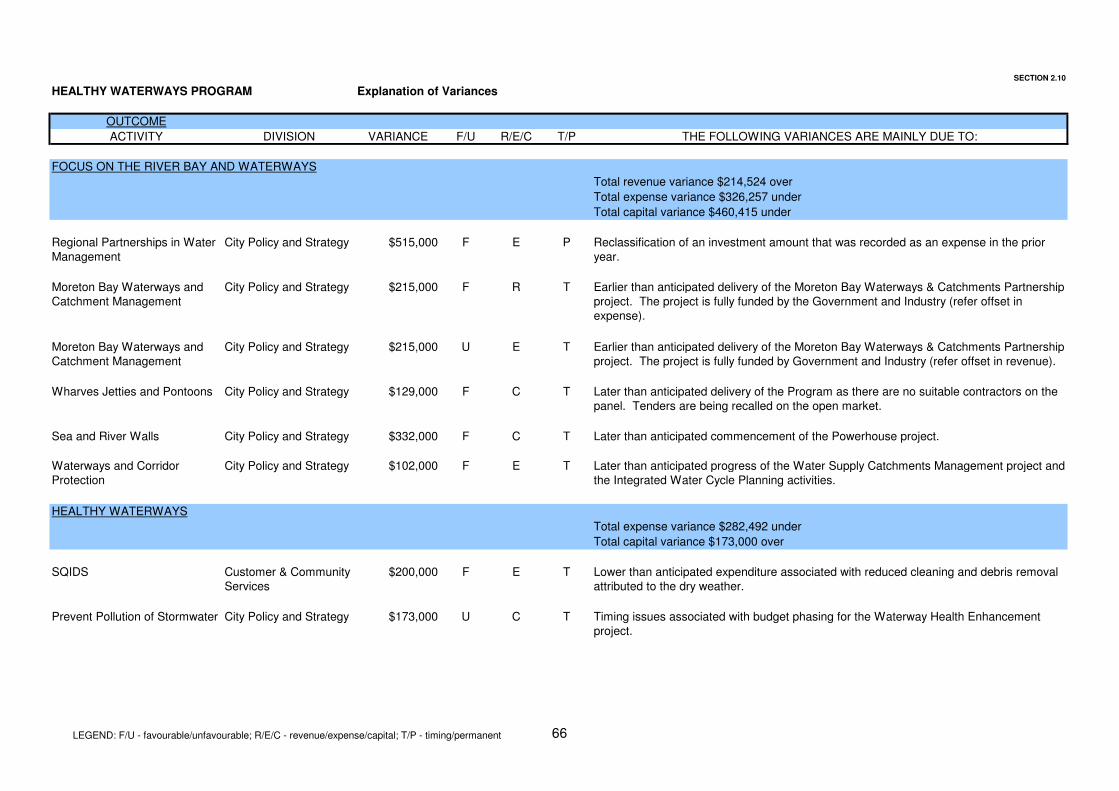
SECTION 2.10
HEALTHY WATERWAYS PROGRAM Explanation of Variances
OUTCOME
ACTIVITY DIVISION VARIANCE F/U R/E/C T/P THE FOLLOWING VARIANCES ARE MAINLY DUE TO:
FOCUS ON THE RIVER BAY AND WATERWAYS
Total revenue variance $214,524 over
Total expense variance $326,257 under
Total capital variance $460,415 under
Regional Partnerships in Water Management
City Policy and Strategy $515,000 F E P Reclassification of an investment amount that was recorded as an expense in the prior year.
Moreton Bay Waterways and Catchment Management
City Policy and Strategy $215,000 F R T Earlier than anticipated delivery of the Moreton Bay Waterways & Catchments Partnership project. The project is fully funded by the Government and Industry (refer offset in expense).
Moreton Bay Waterways and Catchment Management
City Policy and Strategy $215,000 U E T Earlier than anticipated delivery of the Moreton Bay Waterways & Catchments Partnership project. The project is fully funded by Government and Industry (refer offset in revenue).
Wharves Jetties and Pontoons City Policy and Strategy $129,000 F C T Later than anticipated delivery of the Program as there are no suitable contractors on the panel. Tenders are being recalled on the open market.
Sea and River Walls City Policy and Strategy $332,000 F C T Later than anticipated commencement of the Powerhouse project.
Waterways and Corridor Protection
City Policy and Strategy $102,000 F E T Later than anticipated progress of the Water Supply Catchments Management project and the Integrated Water Cycle Planning activities.
HEALTHY WATERWAYS
Total expense variance $282,492 under
Total capital variance $173,000 over
SQIDS Customer & Community Services
$200,000 F E T Lower than anticipated expenditure associated with reduced cleaning and debris removal attributed to the dry weather.
Prevent Pollution of Stormwater City Policy and Strategy $173,000 U C T Timing issues associated with budget phasing for the Waterway Health Enhancement project.
LEGEND: F/U - favourable/unfavourable; R/E/C - revenue/expense/capital; T/P - timing/permanent 66
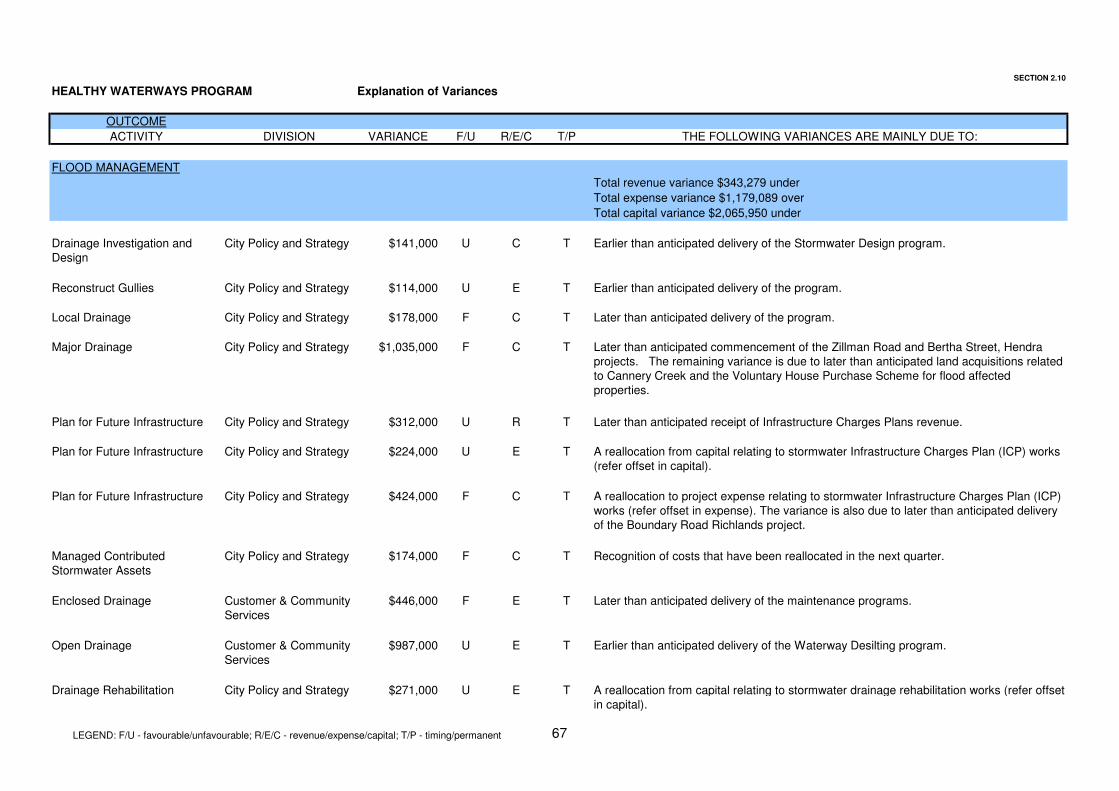
SECTION 2.10
HEALTHY WATERWAYS PROGRAM Explanation of Variances
OUTCOME
ACTIVITY DIVISION VARIANCE F/U R/E/C T/P THE FOLLOWING VARIANCES ARE MAINLY DUE TO:
FLOOD MANAGEMENT
Total revenue variance $343,279 under
Total expense variance $1,179,089 over
Total capital variance $2,065,950 under
Drainage Investigation and Design
City Policy and Strategy $141,000 U C T Earlier than anticipated delivery of the Stormwater Design program.
Reconstruct Gullies City Policy and Strategy $114,000 U E T Earlier than anticipated delivery of the program.
Local Drainage City Policy and Strategy $178,000 F C T Later than anticipated delivery of the program.
Major Drainage City Policy and Strategy $1,035,000 F C T Later than anticipated commencement of the Zillman Road and Bertha Street, Hendra projects. The remaining variance is due to later than anticipated land acquisitions related to Cannery Creek and the Voluntary House Purchase Scheme for flood affected properties.
Plan for Future Infrastructure City Policy and Strategy $312,000 U R T Later than anticipated receipt of Infrastructure Charges Plans revenue.
Plan for Future Infrastructure City Policy and Strategy $224,000 U E T A reallocation from capital relating to stormwater Infrastructure Charges Plan (ICP) works (refer offset in capital).
Plan for Future Infrastructure City Policy and Strategy $424,000 F C T A reallocation to project expense relating to stormwater Infrastructure Charges Plan (ICP) works (refer offset in expense). The variance is also due to later than anticipated delivery of the Boundary Road Richlands project.
Managed Contributed Stormwater Assets
City Policy and Strategy $174,000 F C T Recognition of costs that have been reallocated in the next quarter.
Enclosed Drainage Customer & Community Services
$446,000 F E T Later than anticipated delivery of the maintenance programs.
Open Drainage Customer & Community Services
$987,000 U E T Earlier than anticipated delivery of the Waterway Desilting program.
Drainage Rehabilitation City Policy and Strategy $271,000 U E T A reallocation from capital relating to stormwater drainage rehabilitation works (refer offset in capital).
LEGEND: F/U - favourable/unfavourable; R/E/C - revenue/expense/capital; T/P - timing/permanent 67
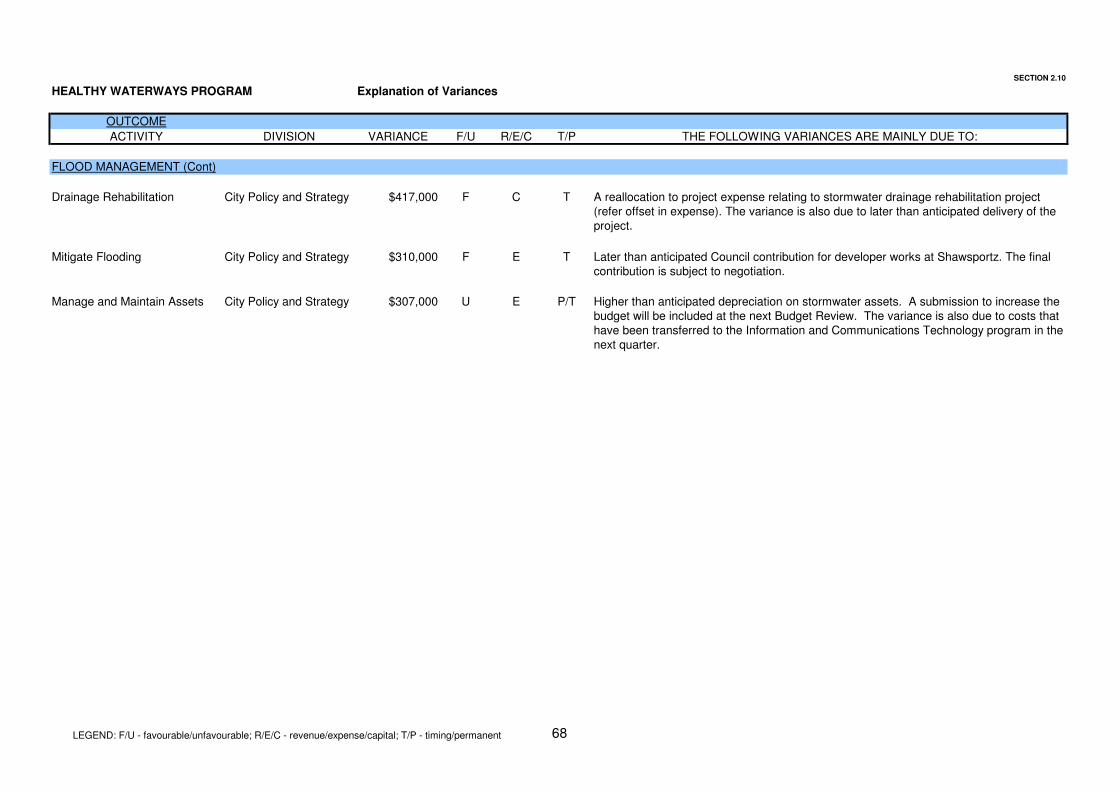
SECTION 2.10
HEALTHY WATERWAYS PROGRAM Explanation of Variances
OUTCOME
ACTIVITY DIVISION VARIANCE F/U R/E/C T/P THE FOLLOWING VARIANCES ARE MAINLY DUE TO:
FLOOD MANAGEMENT (Cont)
Drainage Rehabilitation City Policy and Strategy $417,000 F C T A reallocation to project expense relating to stormwater drainage rehabilitation project (refer offset in expense). The variance is also due to later than anticipated delivery of the project.
Mitigate Flooding City Policy and Strategy $310,000 F E T Later than anticipated Council contribution for developer works at Shawsportz. The final contribution is subject to negotiation.
Manage and Maintain Assets City Policy and Strategy $307,000 U E P/T Higher than anticipated depreciation on stormwater assets. A submission to increase the budget will be included at the next Budget Review. The variance is also due to costs that have been transferred to the Information and Communications Technology program in the next quarter.
LEGEND: F/U - favourable/unfavourable; R/E/C - revenue/expense/capital; T/P - timing/permanent 68

THIS PAGE IS DELIBERATELY BLANK
69
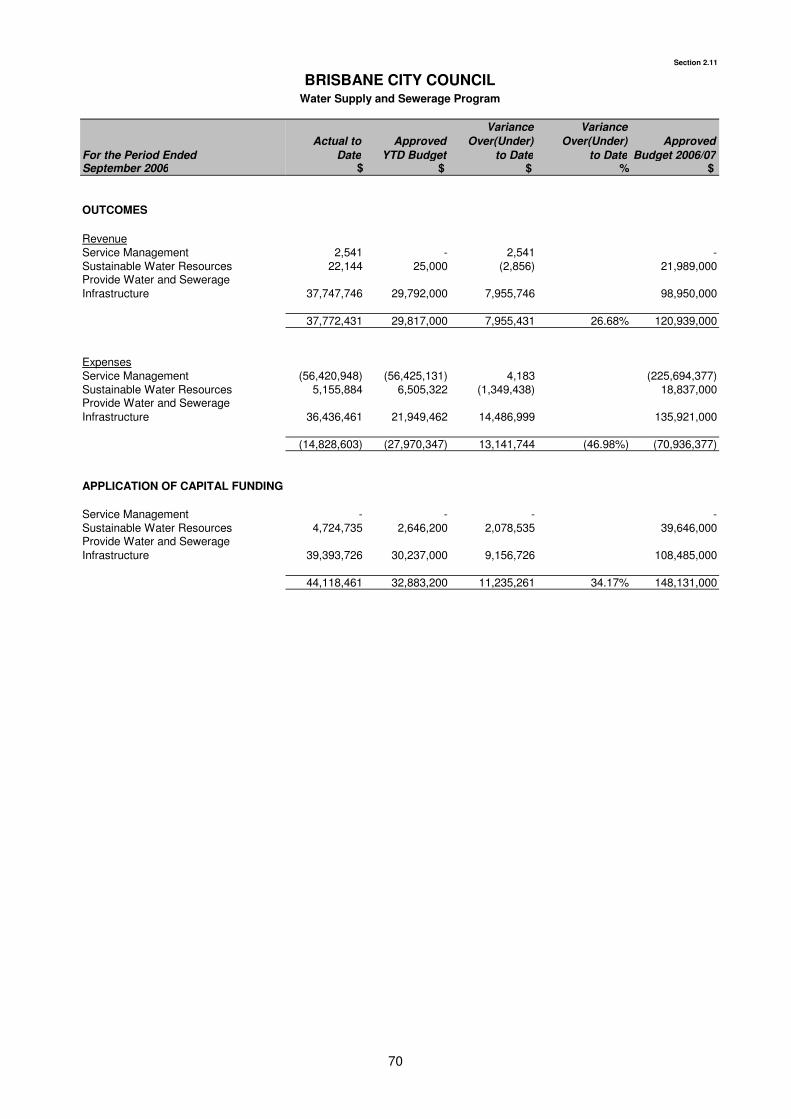
Section 2.11
For the Period Ended
Actual to
Date
Approved
YTD Budget
Variance
Over(Under)
to Date
Variance
Over(Under)
to Date
Approved
Budget 2006/07September 2006 $ $ $ % $
OUTCOMES
RevenueService Management 2,541 - 2,541 -Sustainable Water Resources 22,144 25,000 (2,856) 21,989,000Provide Water and Sewerage Infrastructure 37,747,746 29,792,000 7,955,746 98,950,000
37,772,431 29,817,000 7,955,431 26.68% 120,939,000
ExpensesService Management (56,420,948) (56,425,131) 4,183 (225,694,377)Sustainable Water Resources 5,155,884 6,505,322 (1,349,438) 18,837,000Provide Water and Sewerage Infrastructure 36,436,461 21,949,462 14,486,999 135,921,000
(14,828,603) (27,970,347) 13,141,744 (46.98%) (70,936,377)
APPLICATION OF CAPITAL FUNDING
Service Management - - - -Sustainable Water Resources 4,724,735 2,646,200 2,078,535 39,646,000Provide Water and Sewerage Infrastructure 39,393,726 30,237,000 9,156,726 108,485,000
44,118,461 32,883,200 11,235,261 34.17% 148,131,000
BRISBANE CITY COUNCILWater Supply and Sewerage Program
70
Section 2.11
BRISBANE CITY COUNCILReview of Water Supply and Sewerage Program
Revenue
Expenses
Capital
The City Development acitivity has a favourable variance of $505,000 due to higher than anticipated developer contributions due to early payment to avoid the rate increase.
Water Supply and Sewerage has an unfavourable expense variance of $13,142,000 (46.98%).
For the Period Ended September 2006
Water Supply and Sewerage has a favourable revenue variance of $7,955,000 (26.68%).
The Manage Water and Sewerage Contributed Assets activity has a favourable variance of $6,984,000 due to higher than anticipated receipt of water and sewerage contributed assets (refer offset in capital). This will be addressed at the next Budget Review.
The Total Asset Management Water and Sewerage activity is over budget by $475,000 due to recognition of previously unrecognised assets (refer offset in revenue).
The Total Asset Management Water and Sewerage activity has a favourable variance of $467,000 due to recognition of previously unrecognised assets (refer offset in capital).
The Maintain Customer Service Standards activity has an unfavourable variance of $693,000 due to earlier than anticipated delivery of the Maintain Customer Services Minor Works program.
The Reduce Environmental Impacts activity has an unfavourable variance of $179,000 due to a reallocation between capital and project expense for the capitalisation of prior year works (refer offset in capital).
Water Supply and Sewerage capital expenditure program is over budget by $11,235,000 (34.17%).
The Manage Water and Sewerage Contributed Assets activity is over budget by $7,128,000 due to higher than anticipated receipt of water and sewerage contributed assets (refer offset in revenue). This will be addressed at the next Budget Review.
The Manage Total Water Cycle activity is over budget by $2,079,000 due to earlier than anticipated delivery of the Drought Contingency projects.
The Reduce Environmental Impacts activity is over budget by $1,863,000 due to earlier than anticipated progress related to the upgrade works at Wynnum Waste Water Treatment Plant (WWTP). This is partly offset by a reallocation between capital and project expense (refer offset in expense).
The Total Asset Management Water and Sewerage activity has an unfavourable variance of $13,439,000 due to higher than anticipated depreciation due to the July revaluation of Water and Sewerage Assets and increased capital works. This will be addressed at a future Budget Review.
The Manage Total Water Cycle activity has a favourable variance of $1,315,000 due to later than anticipated payment of Council's contribution to the State Government's Home WaterWise service.
71
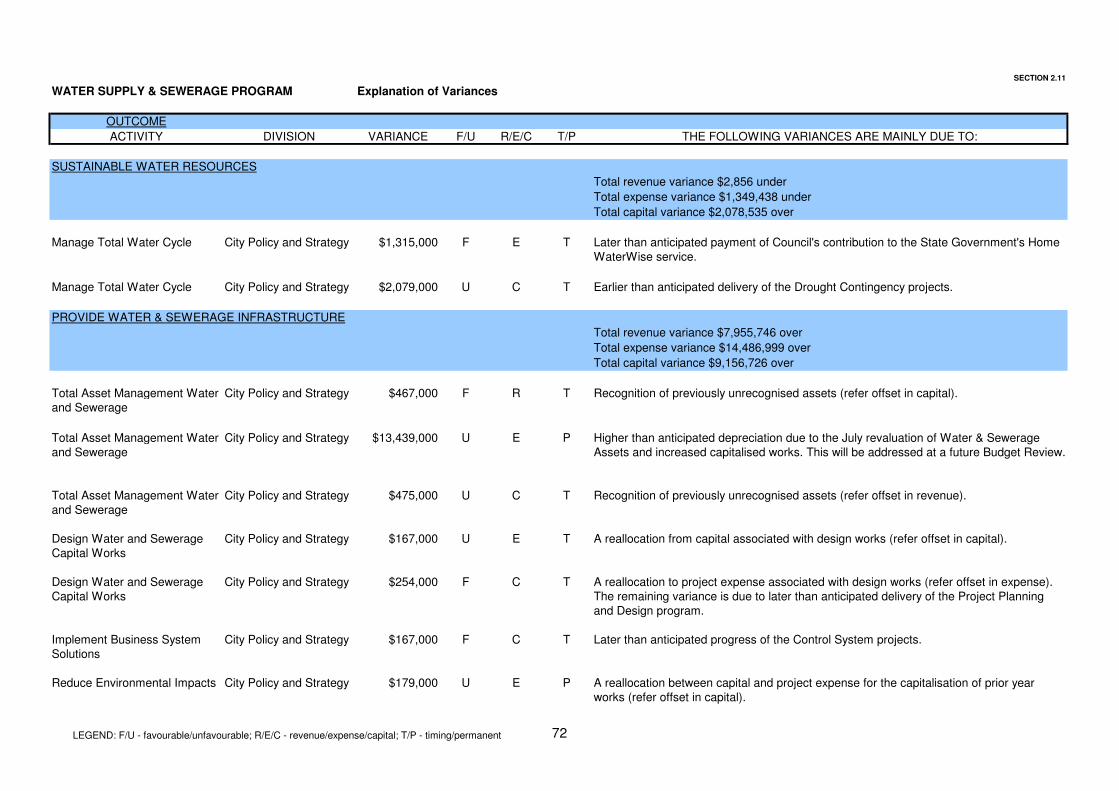
SECTION 2.11
WATER SUPPLY & SEWERAGE PROGRAM Explanation of Variances
OUTCOME
ACTIVITY DIVISION VARIANCE F/U R/E/C T/P THE FOLLOWING VARIANCES ARE MAINLY DUE TO:
SUSTAINABLE WATER RESOURCES
Total revenue variance $2,856 under
Total expense variance $1,349,438 under
Total capital variance $2,078,535 over
Manage Total Water Cycle City Policy and Strategy $1,315,000 F E T Later than anticipated payment of Council's contribution to the State Government's Home WaterWise service.
Manage Total Water Cycle City Policy and Strategy $2,079,000 U C T Earlier than anticipated delivery of the Drought Contingency projects.
PROVIDE WATER & SEWERAGE INFRASTRUCTURE
Total revenue variance $7,955,746 over
Total expense variance $14,486,999 over
Total capital variance $9,156,726 over
Total Asset Management Water and Sewerage
City Policy and Strategy $467,000 F R T Recognition of previously unrecognised assets (refer offset in capital).
Total Asset Management Water and Sewerage
City Policy and Strategy $13,439,000 U E P Higher than anticipated depreciation due to the July revaluation of Water & Sewerage Assets and increased capitalised works. This will be addressed at a future Budget Review.
Total Asset Management Water and Sewerage
City Policy and Strategy $475,000 U C T Recognition of previously unrecognised assets (refer offset in revenue).
Design Water and Sewerage Capital Works
City Policy and Strategy $167,000 U E T A reallocation from capital associated with design works (refer offset in capital).
Design Water and Sewerage Capital Works
City Policy and Strategy $254,000 F C T A reallocation to project expense associated with design works (refer offset in expense). The remaining variance is due to later than anticipated delivery of the Project Planning and Design program.
Implement Business System Solutions
City Policy and Strategy $167,000 F C T Later than anticipated progress of the Control System projects.
Reduce Environmental Impacts City Policy and Strategy $179,000 U E P A reallocation between capital and project expense for the capitalisation of prior year works (refer offset in capital).
LEGEND: F/U - favourable/unfavourable; R/E/C - revenue/expense/capital; T/P - timing/permanent 72
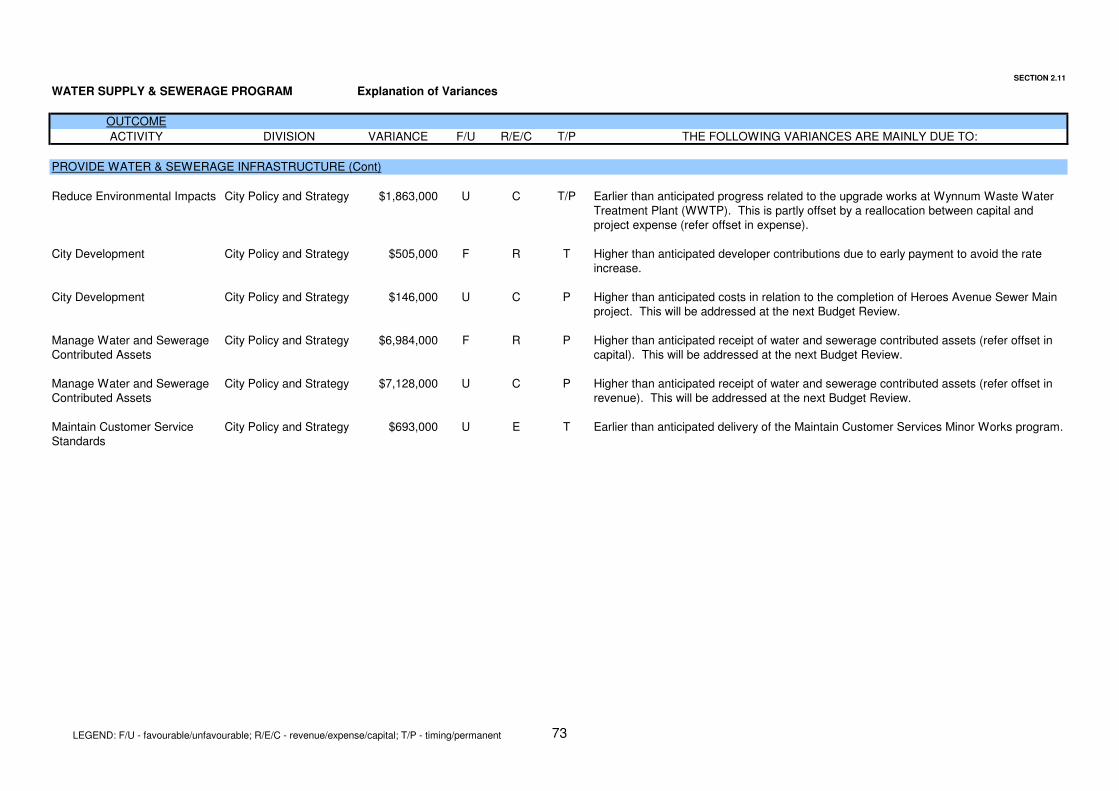
SECTION 2.11
WATER SUPPLY & SEWERAGE PROGRAM Explanation of Variances
OUTCOME
ACTIVITY DIVISION VARIANCE F/U R/E/C T/P THE FOLLOWING VARIANCES ARE MAINLY DUE TO:
PROVIDE WATER & SEWERAGE INFRASTRUCTURE (Cont)
Reduce Environmental Impacts City Policy and Strategy $1,863,000 U C T/P Earlier than anticipated progress related to the upgrade works at Wynnum Waste Water Treatment Plant (WWTP). This is partly offset by a reallocation between capital and project expense (refer offset in expense).
City Development City Policy and Strategy $505,000 F R T Higher than anticipated developer contributions due to early payment to avoid the rate increase.
City Development City Policy and Strategy $146,000 U C P Higher than anticipated costs in relation to the completion of Heroes Avenue Sewer Main project. This will be addressed at the next Budget Review.
Manage Water and Sewerage Contributed Assets
City Policy and Strategy $6,984,000 F R P Higher than anticipated receipt of water and sewerage contributed assets (refer offset in capital). This will be addressed at the next Budget Review.
Manage Water and Sewerage Contributed Assets
City Policy and Strategy $7,128,000 U C P Higher than anticipated receipt of water and sewerage contributed assets (refer offset in revenue). This will be addressed at the next Budget Review.
Maintain Customer Service Standards
City Policy and Strategy $693,000 U E T Earlier than anticipated delivery of the Maintain Customer Services Minor Works program.
LEGEND: F/U - favourable/unfavourable; R/E/C - revenue/expense/capital; T/P - timing/permanent 73
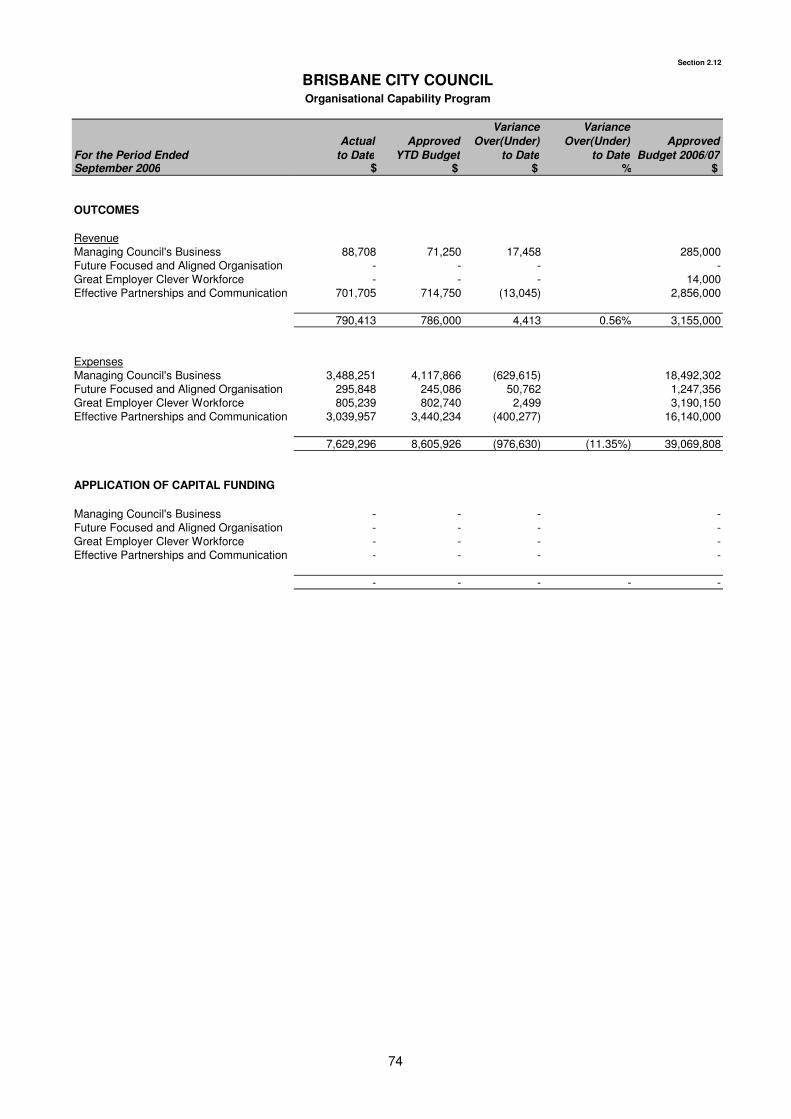
Section 2.12
For the Period Ended
Actual
to Date
Approved
YTD Budget
Variance
Over(Under)
to Date
Variance
Over(Under)
to Date
Approved
Budget 2006/07September 2006 $ $ $ % $
OUTCOMES
RevenueManaging Council's Business 88,708 71,250 17,458 285,000Future Focused and Aligned Organisation - - - -Great Employer Clever Workforce - - - 14,000Effective Partnerships and Communication 701,705 714,750 (13,045) 2,856,000
790,413 786,000 4,413 0.56% 3,155,000
ExpensesManaging Council's Business 3,488,251 4,117,866 (629,615) 18,492,302Future Focused and Aligned Organisation 295,848 245,086 50,762 1,247,356Great Employer Clever Workforce 805,239 802,740 2,499 3,190,150Effective Partnerships and Communication 3,039,957 3,440,234 (400,277) 16,140,000
7,629,296 8,605,926 (976,630) (11.35%) 39,069,808
APPLICATION OF CAPITAL FUNDING
Managing Council's Business - - - -Future Focused and Aligned Organisation - - - -Great Employer Clever Workforce - - - -Effective Partnerships and Communication - - - -
- - - - -
BRISBANE CITY COUNCILOrganisational Capability Program
74
Section 2.12
Revenue
Expenses
Capital
Organisational Capability has a favourable expense variance of $977,000 (11.35%).
The Recruitment /Employment Program activity has a favourable variance of $228,000 due to later than anticipated progress in recruitment for the Corporate Cadetship program. The variance is also due to lower than anticipated reimbursements to Divisions for trainees and apprentices.
The Divisional Management activity has a favourable variance of $127,000 due to lower than anticipated labour and marketing costs to date.
The HR Information Systems activity has a favourable variance of $121,000 due to later than anticipated recognition of labour overheads and later than expected payment of INfoHRM membership fees.
Organisational Capability capital expenditure program has no significant components.
BRISBANE CITY COUNCILReview of Organisational Capability Program
For the Period Ended September 2006
The Business Support Services activity has a favourable variance of $254,00 due to later than anticipated scheduling of individual programs within the corporate Learning and Development program.
The Organisation Alignment activity has a favourable variance of $136,000 due to later than anticipated commissioning of consultants and services for Gateway Reviews within the Partnerships Unit.
Organisational Capability has a favourable revenue variance of $4,000 (0.56%). There are no significant components.
75
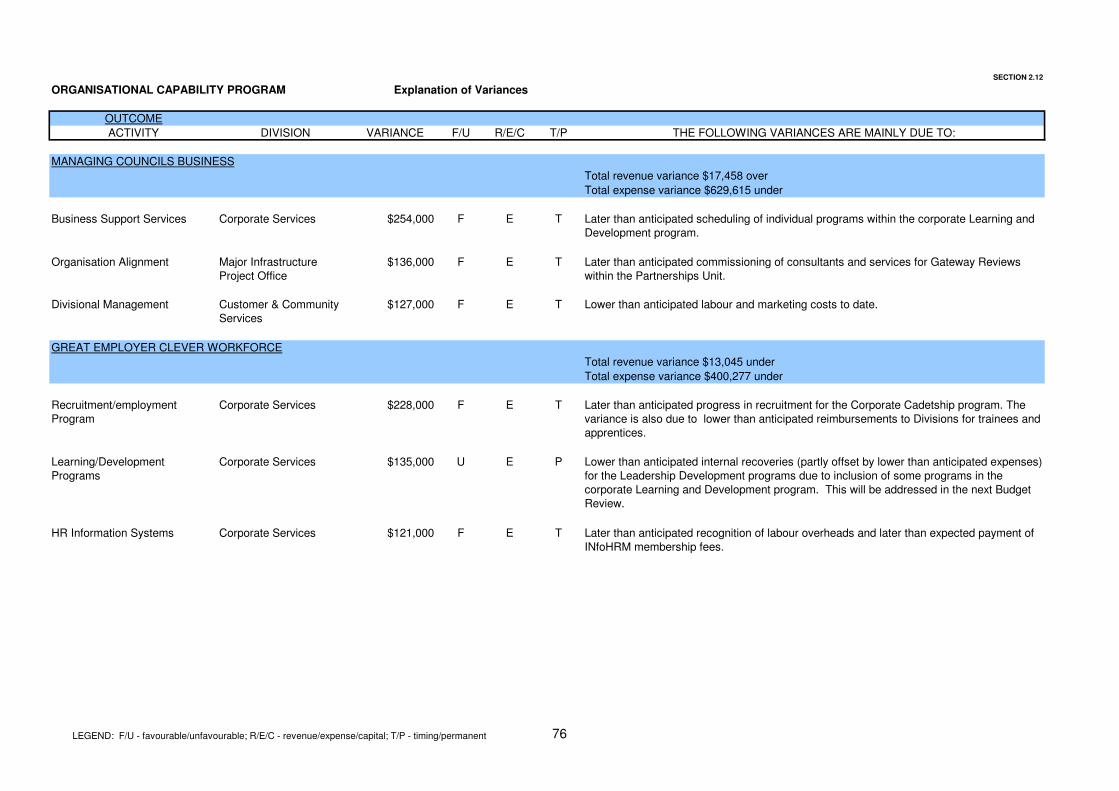
SECTION 2.12
ORGANISATIONAL CAPABILITY PROGRAM Explanation of Variances
OUTCOME
ACTIVITY DIVISION VARIANCE F/U R/E/C T/P THE FOLLOWING VARIANCES ARE MAINLY DUE TO:
MANAGING COUNCILS BUSINESS
Total revenue variance $17,458 over
Total expense variance $629,615 under
Business Support Services Corporate Services $254,000 F E T Later than anticipated scheduling of individual programs within the corporate Learning and Development program.
Organisation Alignment Major Infrastructure Project Office
$136,000 F E T Later than anticipated commissioning of consultants and services for Gateway Reviews within the Partnerships Unit.
Divisional Management Customer & Community Services
$127,000 F E T Lower than anticipated labour and marketing costs to date.
GREAT EMPLOYER CLEVER WORKFORCE
Total revenue variance $13,045 under
Total expense variance $400,277 under
Recruitment/employment Program
Corporate Services $228,000 F E T Later than anticipated progress in recruitment for the Corporate Cadetship program. The variance is also due to lower than anticipated reimbursements to Divisions for trainees and apprentices.
Learning/Development Programs
Corporate Services $135,000 U E P Lower than anticipated internal recoveries (partly offset by lower than anticipated expenses) for the Leadership Development programs due to inclusion of some programs in the corporate Learning and Development program. This will be addressed in the next Budget Review.
HR Information Systems Corporate Services $121,000 F E T Later than anticipated recognition of labour overheads and later than expected payment of INfoHRM membership fees.
LEGEND: F/U - favourable/unfavourable; R/E/C - revenue/expense/capital; T/P - timing/permanent 76
THIS PAGE IS DELIBERATELY BLANK
77
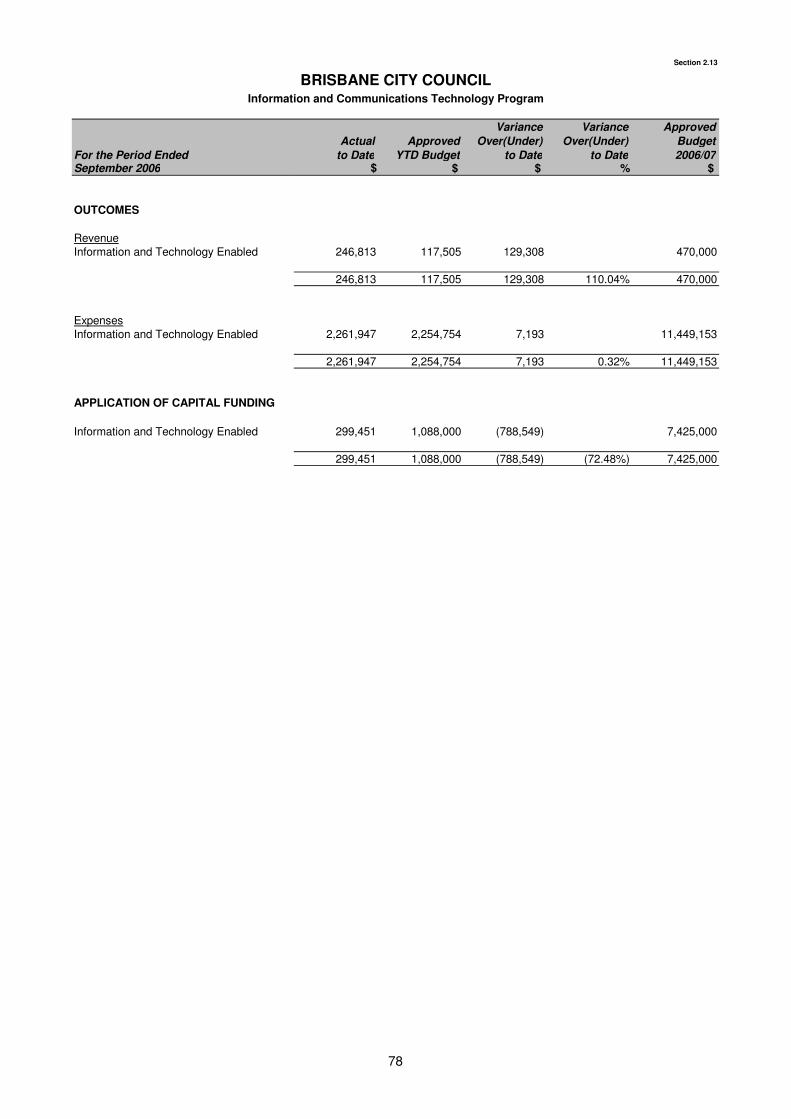
Section 2.13
For the Period Ended
Actual
to Date
Approved
YTD Budget
Variance
Over(Under)
to Date
Variance
Over(Under)
to Date
Approved
Budget
2006/07September 2006 $ $ $ % $
OUTCOMES
RevenueInformation and Technology Enabled 246,813 117,505 129,308 470,000
246,813 117,505 129,308 110.04% 470,000
ExpensesInformation and Technology Enabled 2,261,947 2,254,754 7,193 11,449,153
2,261,947 2,254,754 7,193 0.32% 11,449,153
APPLICATION OF CAPITAL FUNDING
Information and Technology Enabled 299,451 1,088,000 (788,549) 7,425,000
299,451 1,088,000 (788,549) (72.48%) 7,425,000
BRISBANE CITY COUNCILInformation and Communications Technology Program
78
Section 2.13
BRISBANE CITY COUNCILReview of Information and Communications Technology Program
Revenue
Expenses
Capital
Information and Communications Technology has an unfavourable expense variance of $7,000 (0.32%). There are no significant components.
Information and Communications Technology capital expenditure program is under budget by $789,000 (72.48%).
The Optimise Organisational IT Effectiveness program is under budget by $789,000 due to later than anticipated costs on service development projects such as Server Management and Council's Managing Electronic Records Strategy.
For the Period Ended September 2006
Information and Communications Technology has a favourable revenue variance of $129,000 (110.04%).
The Optimise Organisational IT Effectiveness program has a favourable variance of $129,000 due to higher than anticipated rent received for space at the Holland Park Data Centre. The variance is also due to higher than anticipated Spatial Information Services revenue. This will be addressed in the next Budget Review.
79
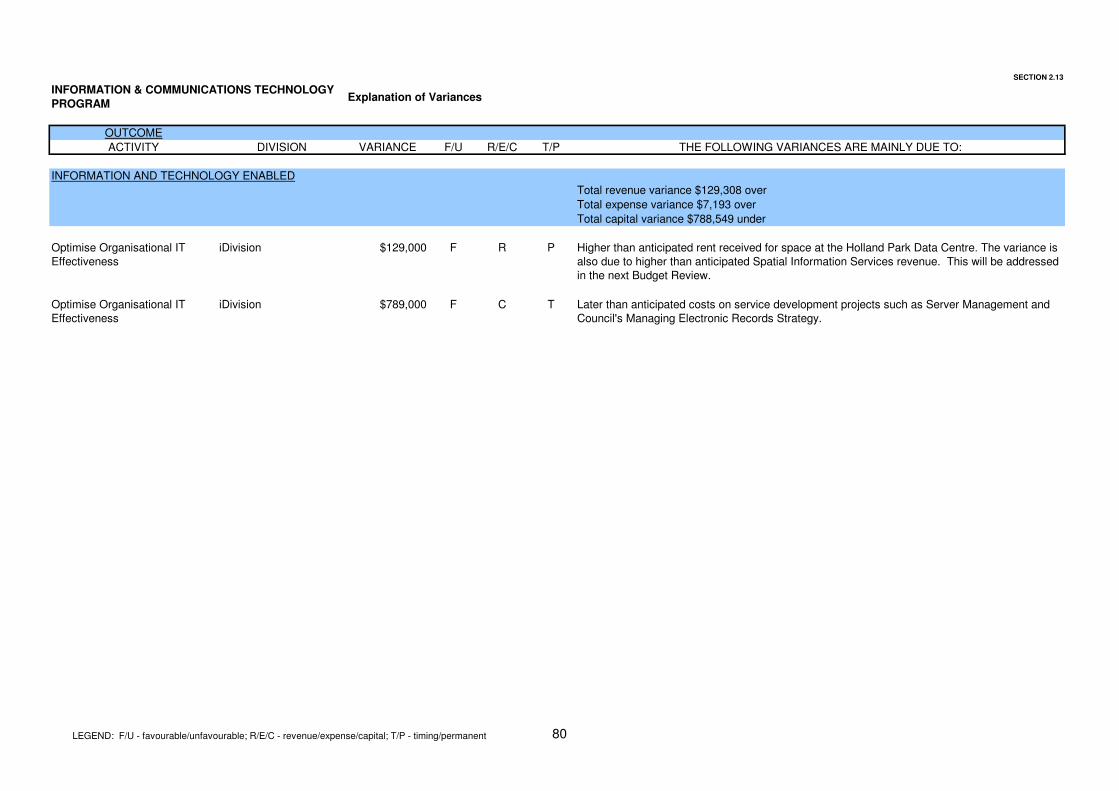
SECTION 2.13
Explanation of Variances
OUTCOME
ACTIVITY DIVISION VARIANCE F/U R/E/C T/P THE FOLLOWING VARIANCES ARE MAINLY DUE TO:
INFORMATION AND TECHNOLOGY ENABLED
Total revenue variance $129,308 over
Total expense variance $7,193 over
Total capital variance $788,549 under
Optimise Organisational IT Effectiveness
iDivision $129,000 F R P Higher than anticipated rent received for space at the Holland Park Data Centre. The variance is also due to higher than anticipated Spatial Information Services revenue. This will be addressed in the next Budget Review.
Optimise Organisational IT Effectiveness
iDivision $789,000 F C T Later than anticipated costs on service development projects such as Server Management and Council's Managing Electronic Records Strategy.
INFORMATION & COMMUNICATIONS TECHNOLOGY
PROGRAM
LEGEND: F/U - favourable/unfavourable; R/E/C - revenue/expense/capital; T/P - timing/permanent 80

Section 3
Business Unit Results
81

THIS PAGE IS DELIBERATELY BLANK
82
Brisbane Water
83
THIS PAGE IS DELIBERATELY BLANK
84
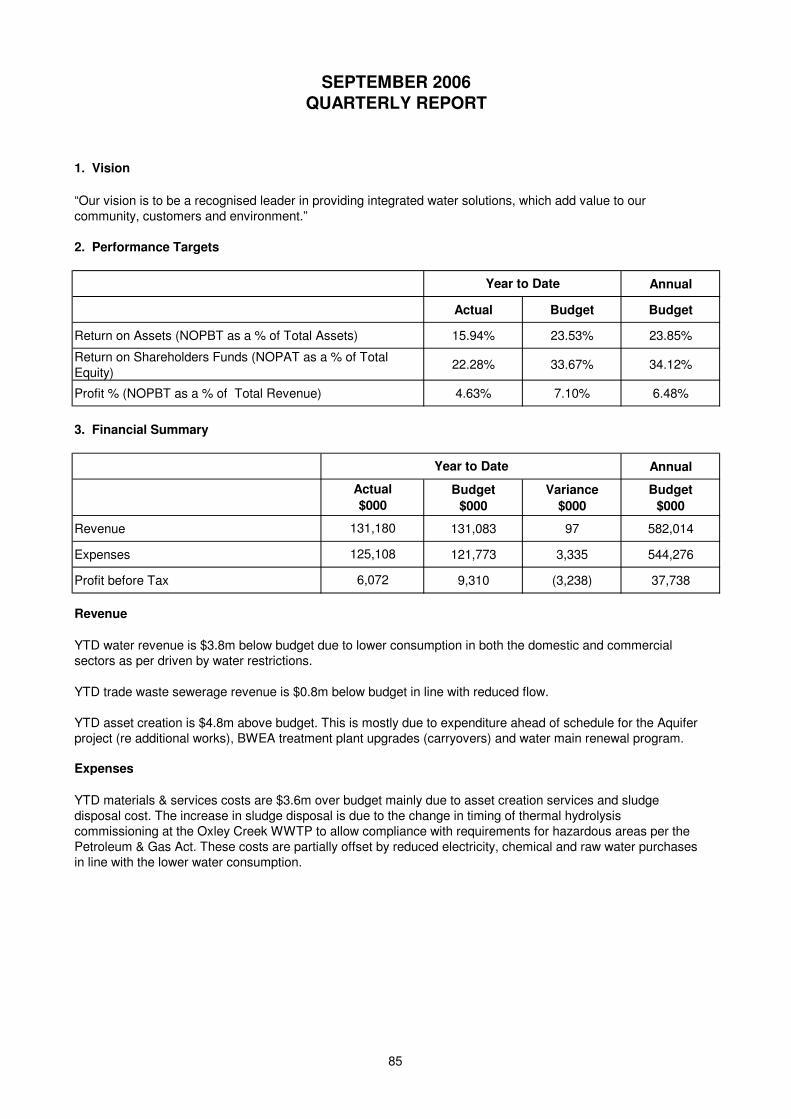
SEPTEMBER 2006QUARTERLY REPORT
1. Vision
“Our vision is to be a recognised leader in providing integrated water solutions, which add value to our community, customers and environment.”
2. Performance Targets
Annual
Actual Budget Budget
Return on Assets (NOPBT as a % of Total Assets) 15.94% 23.53% 23.85%
22.28% 33.67% 34.12%
Profit % (NOPBT as a % of Total Revenue) 4.63% 7.10% 6.48%
3. Financial Summary
Annual
Budget
$000
Variance
$000
Budget
$000
Revenue 131,083 97 582,014
Expenses 121,773 3,335 544,276
Profit before Tax 9,310 (3,238) 37,738
Revenue
YTD trade waste sewerage revenue is $0.8m below budget in line with reduced flow.
YTD asset creation is $4.8m above budget. This is mostly due to expenditure ahead of schedule for the Aquiferproject (re additional works), BWEA treatment plant upgrades (carryovers) and water main renewal program.
Expenses
YTD materials & services costs are $3.6m over budget mainly due to asset creation services and sludge disposal cost. The increase in sludge disposal is due to the change in timing of thermal hydrolysiscommissioning at the Oxley Creek WWTP to allow compliance with requirements for hazardous areas per thePetroleum & Gas Act. These costs are partially offset by reduced electricity, chemical and raw water purchasesin line with the lower water consumption.
131,180
Return on Shareholders Funds (NOPAT as a % of Total Equity)
Year to Date
Year to Date
Actual
$000
YTD water revenue is $3.8m below budget due to lower consumption in both the domestic and commercialsectors as per driven by water restrictions.
125,108
6,072
85
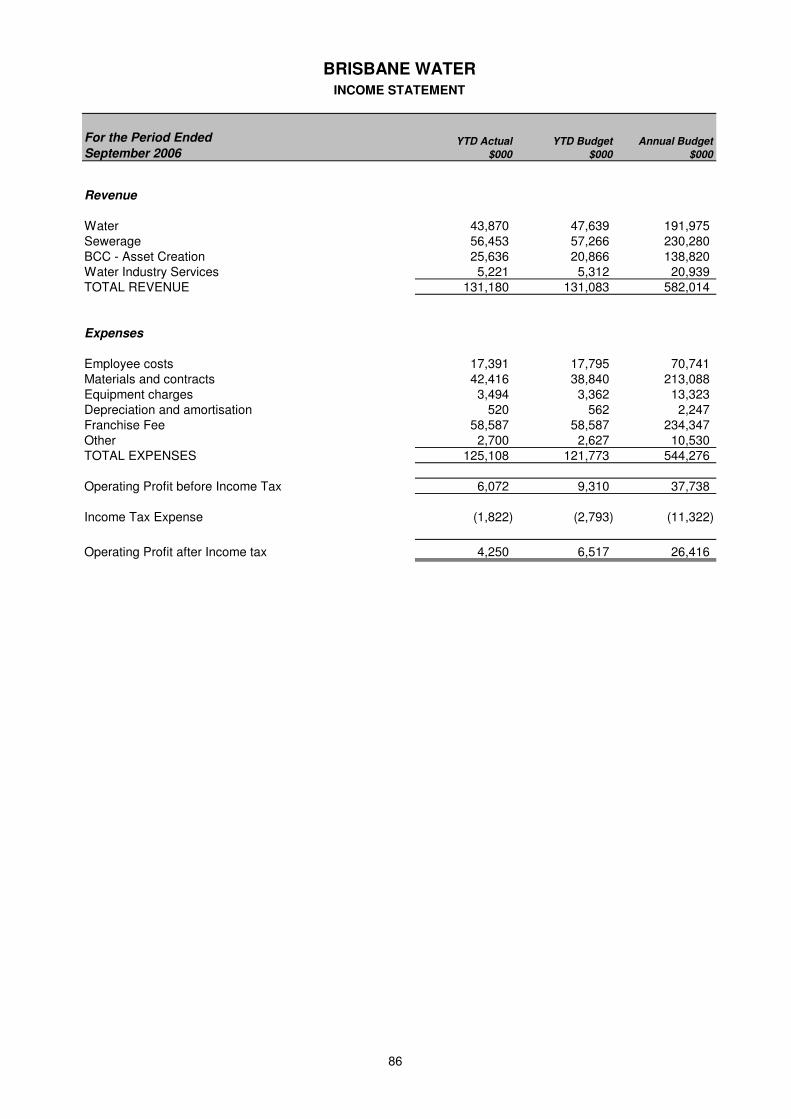
BRISBANE WATERINCOME STATEMENT
Revenue
Water 43,870 47,639 191,975 Sewerage 56,453 57,266 230,280 BCC - Asset Creation 25,636 20,866 138,820 Water Industry Services 5,221 5,312 20,939 TOTAL REVENUE 131,180 131,083 582,014
Expenses
Employee costs 17,391 17,795 70,741 Materials and contracts 42,416 38,840 213,088 Equipment charges 3,494 3,362 13,323 Depreciation and amortisation 520 562 2,247 Franchise Fee 58,587 58,587 234,347 Other 2,700 2,627 10,530 TOTAL EXPENSES 125,108 121,773 544,276
Operating Profit before Income Tax 6,072 9,310 37,738
Income Tax Expense (1,822) (2,793) (11,322)
Operating Profit after Income tax 4,250 6,517 26,416
For the Period Ended
September 2006YTD Actual
$000
YTD Budget
$000
Annual Budget
$000
86
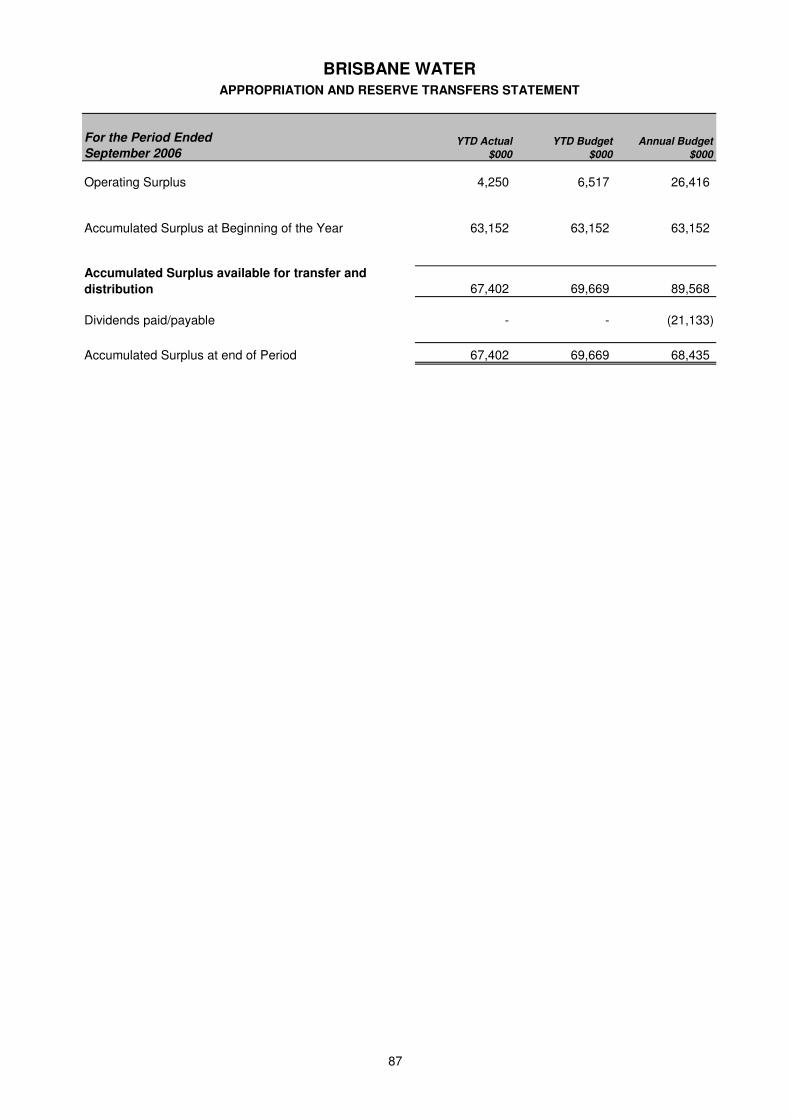
BRISBANE WATERAPPROPRIATION AND RESERVE TRANSFERS STATEMENT
Operating Surplus 4,250 6,517 26,416
Accumulated Surplus at Beginning of the Year 63,152 63,152 63,152
67,402 69,669 89,568
Dividends paid/payable - - (21,133)
Accumulated Surplus at end of Period 67,402 69,669 68,435
For the Period Ended
September 2006YTD Actual
$000
YTD Budget
$000
Annual Budget
$000
Accumulated Surplus available for transfer and
distribution
87
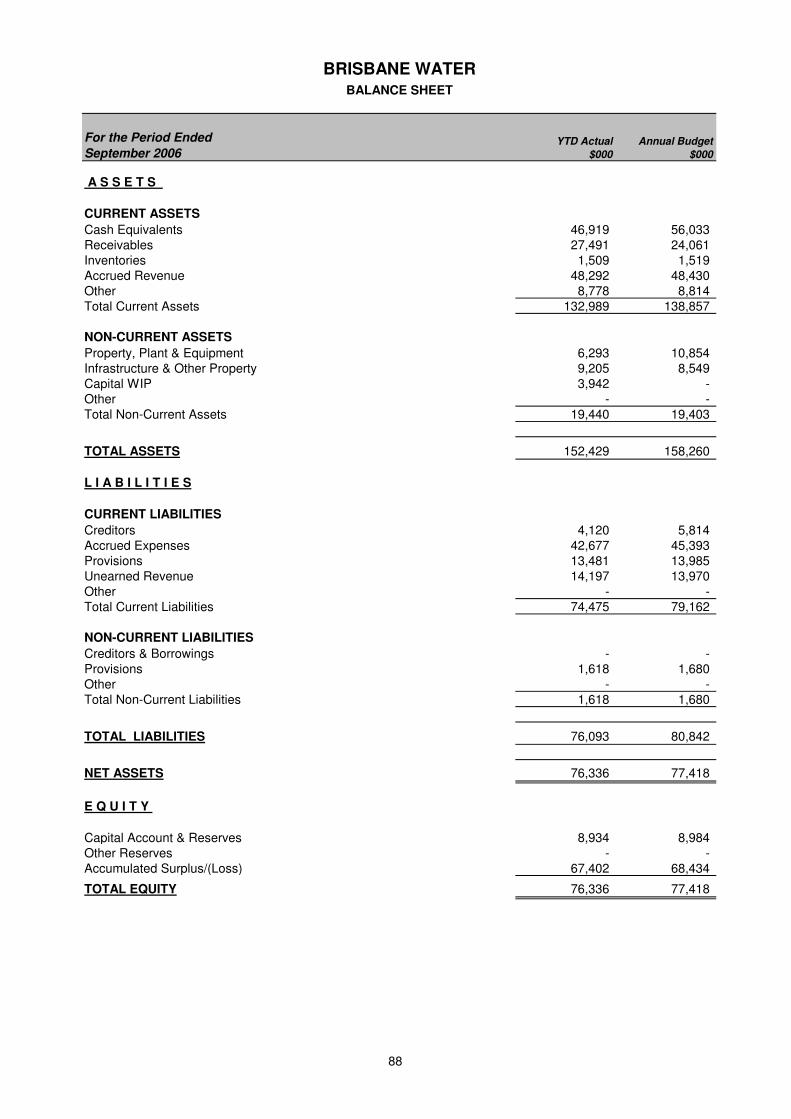
BRISBANE WATERBALANCE SHEET
A S S E T S
CURRENT ASSETS
Cash Equivalents 46,919 56,033 Receivables 27,491 24,061 Inventories 1,509 1,519 Accrued Revenue 48,292 48,430 Other 8,778 8,814 Total Current Assets 132,989 138,857
NON-CURRENT ASSETS
Property, Plant & Equipment 6,293 10,854 Infrastructure & Other Property 9,205 8,549 Capital WIP 3,942 - Other - - Total Non-Current Assets 19,440 19,403
TOTAL ASSETS 152,429 158,260
L I A B I L I T I E S
CURRENT LIABILITIES
Creditors 4,120 5,814 Accrued Expenses 42,677 45,393 Provisions 13,481 13,985 Unearned Revenue 14,197 13,970 Other - - Total Current Liabilities 74,475 79,162
NON-CURRENT LIABILITIES
Creditors & Borrowings - - Provisions 1,618 1,680 Other - - Total Non-Current Liabilities 1,618 1,680
TOTAL LIABILITIES 76,093 80,842
NET ASSETS 76,336 77,418
E Q U I T Y
Capital Account & Reserves 8,934 8,984 Other Reserves - - Accumulated Surplus/(Loss) 67,402 68,434
TOTAL EQUITY 76,336 77,418
For the Period Ended
September 2006YTD Actual
$000
Annual Budget
$000
88
Brisbane Transport
89

THIS PAGE IS DELIBERATELY BLANK
90
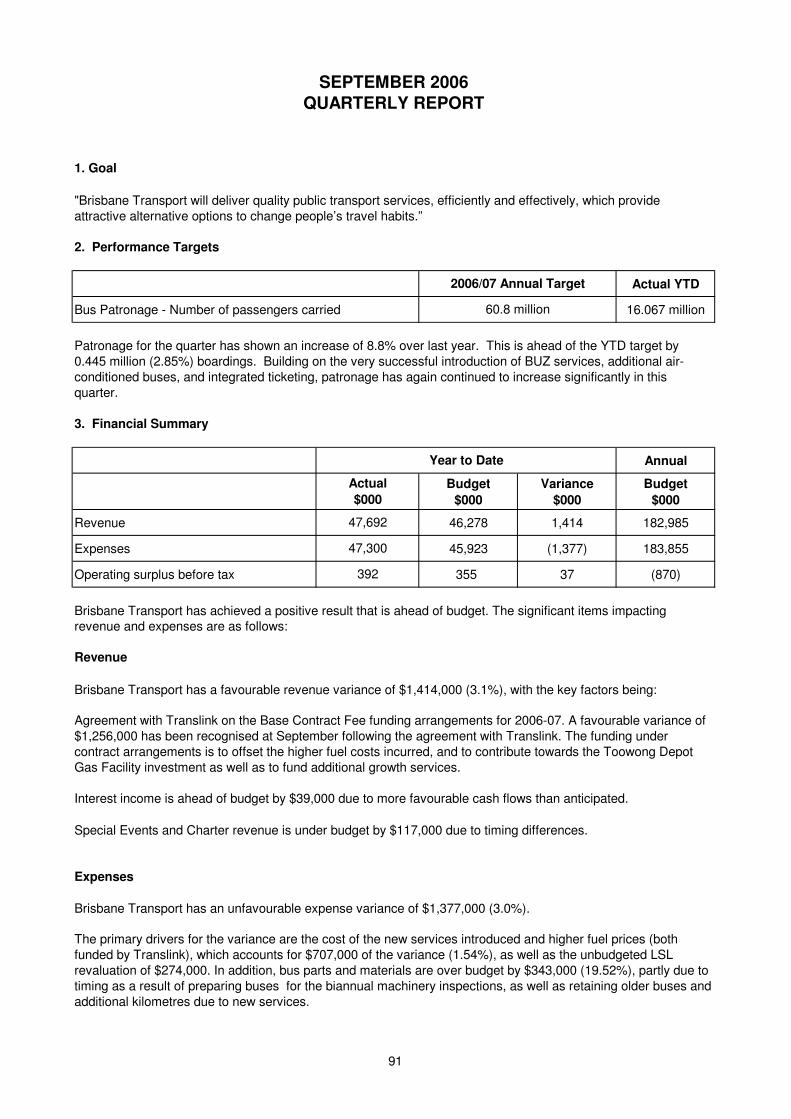
SEPTEMBER 2006QUARTERLY REPORT
1. Goal
attractive alternative options to change people’s travel habits.”
2. Performance Targets
Actual YTD
Bus Patronage - Number of passengers carried 16.067 million
3. Financial Summary
Annual
Budget
$000
Variance
$000
Budget
$000
Revenue 46,278 1,414 182,985
Expenses 45,923 (1,377) 183,855
Operating surplus before tax 355 37 (870)
Brisbane Transport has achieved a positive result that is ahead of budget. The significant items impacting revenue and expenses are as follows:
Revenue
Brisbane Transport has a favourable revenue variance of $1,414,000 (3.1%), with the key factors being:
Interest income is ahead of budget by $39,000 due to more favourable cash flows than anticipated.
Special Events and Charter revenue is under budget by $117,000 due to timing differences.
Expenses
Brisbane Transport has an unfavourable expense variance of $1,377,000 (3.0%).
"Brisbane Transport will deliver quality public transport services, efficiently and effectively, which provide
60.8 million
Actual
$000
2006/07 Annual Target
Year to Date
Patronage for the quarter has shown an increase of 8.8% over last year. This is ahead of the YTD target by 0.445 million (2.85%) boardings. Building on the very successful introduction of BUZ services, additional air-conditioned buses, and integrated ticketing, patronage has again continued to increase significantly in this quarter.
The primary drivers for the variance are the cost of the new services introduced and higher fuel prices (both funded by Translink), which accounts for $707,000 of the variance (1.54%), as well as the unbudgeted LSL revaluation of $274,000. In addition, bus parts and materials are over budget by $343,000 (19.52%), partly due to timing as a result of preparing buses for the biannual machinery inspections, as well as retaining older buses and additional kilometres due to new services.
47,692
47,300
392
Agreement with Translink on the Base Contract Fee funding arrangements for 2006-07. A favourable variance of $1,256,000 has been recognised at September following the agreement with Translink. The funding under contract arrangements is to offset the higher fuel costs incurred, and to contribute towards the Toowong Depot Gas Facility investment as well as to fund additional growth services.
91
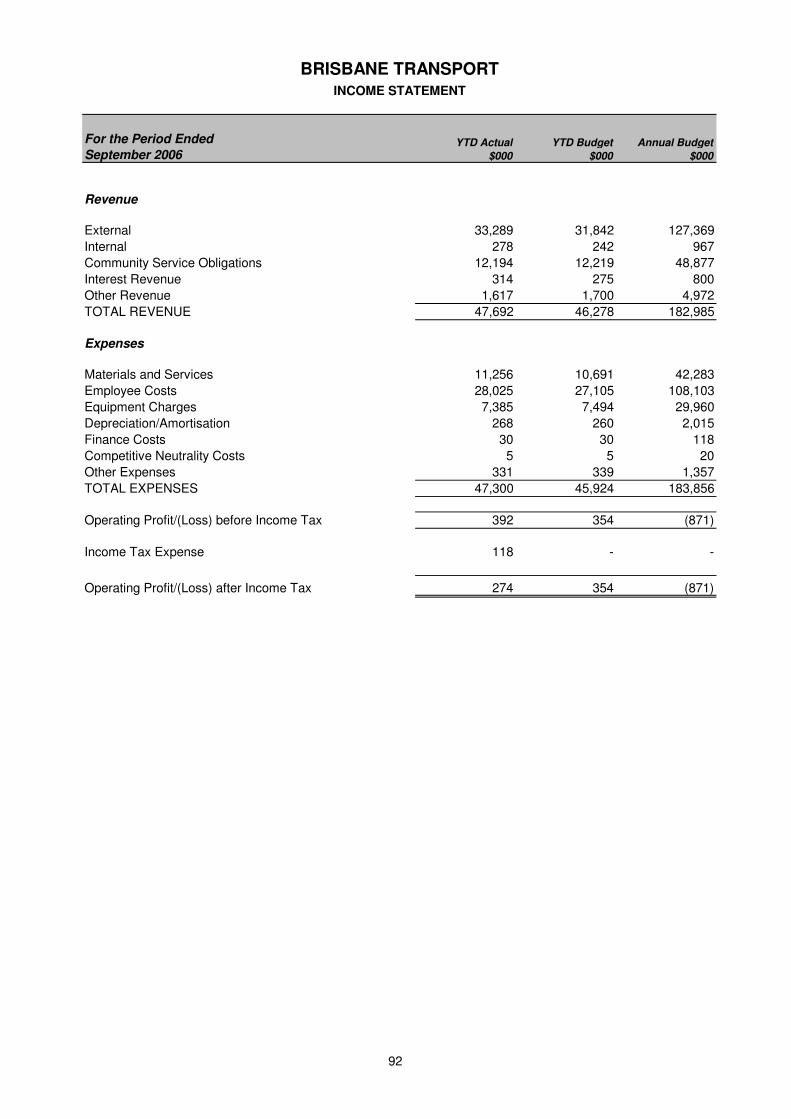
BRISBANE TRANSPORTINCOME STATEMENT
Revenue
External 33,289 31,842 127,369
Internal 278 242 967
Community Service Obligations 12,194 12,219 48,877
Interest Revenue 314 275 800
Other Revenue 1,617 1,700 4,972
TOTAL REVENUE 47,692 46,278 182,985
Expenses
Materials and Services 11,256 10,691 42,283
Employee Costs 28,025 27,105 108,103
Equipment Charges 7,385 7,494 29,960
Depreciation/Amortisation 268 260 2,015
Finance Costs 30 30 118
Competitive Neutrality Costs 5 5 20
Other Expenses 331 339 1,357
TOTAL EXPENSES 47,300 45,924 183,856
Operating Profit/(Loss) before Income Tax 392 354 (871)
Income Tax Expense 118 - -
Operating Profit/(Loss) after Income Tax 274 354 (871)
For the Period Ended
September 2006YTD Actual
$000
YTD Budget
$000
Annual Budget
$000
92
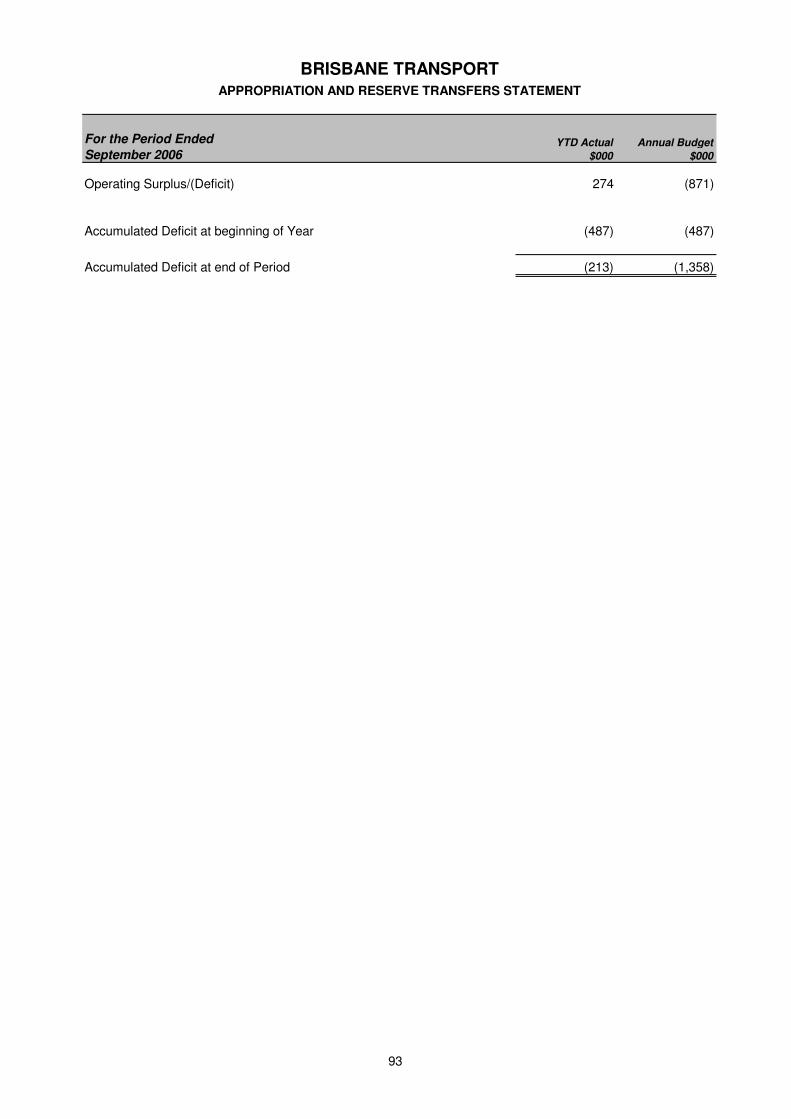
BRISBANE TRANSPORTAPPROPRIATION AND RESERVE TRANSFERS STATEMENT
Operating Surplus/(Deficit) 274 (871)
Accumulated Deficit at beginning of Year (487) (487)
Accumulated Deficit at end of Period (213) (1,358)
For the Period Ended
September 2006YTD Actual
$000
Annual Budget
$000
93
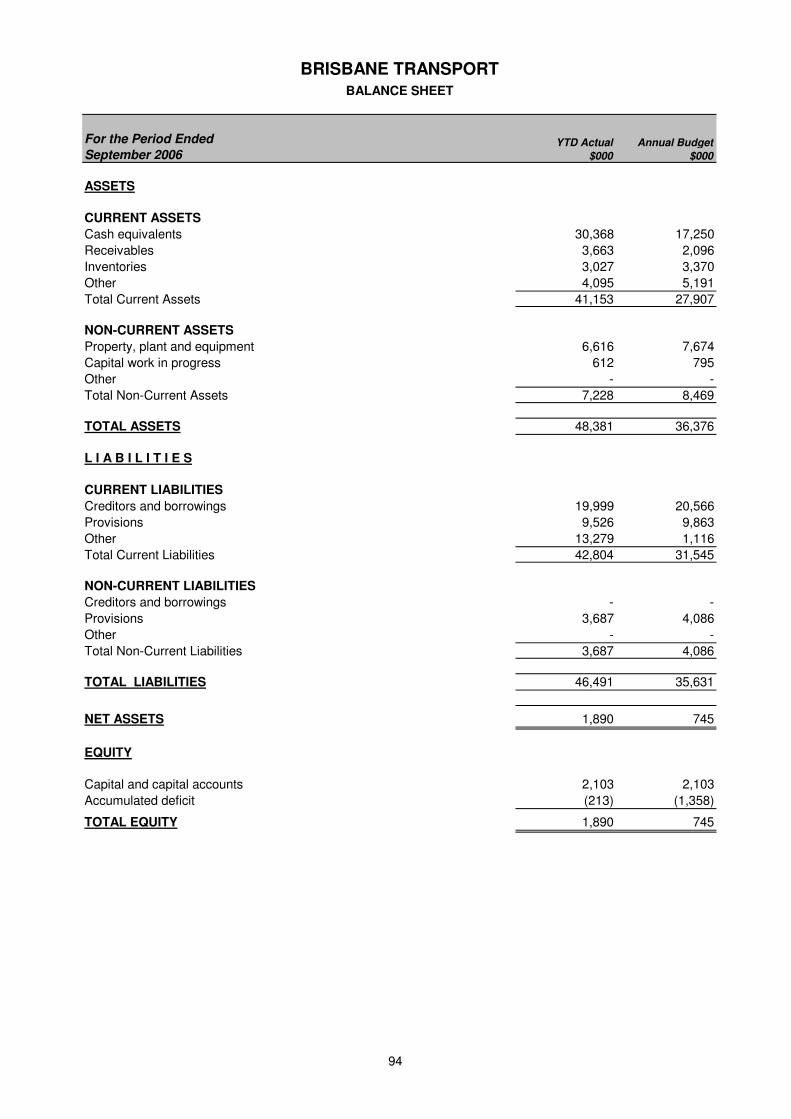
BRISBANE TRANSPORTBALANCE SHEET
ASSETS
CURRENT ASSETS
Cash equivalents 30,368 17,250
Receivables 3,663 2,096
Inventories 3,027 3,370
Other 4,095 5,191
Total Current Assets 41,153 27,907
NON-CURRENT ASSETS
Property, plant and equipment 6,616 7,674
Capital work in progress 612 795
Other - -
Total Non-Current Assets 7,228 8,469
TOTAL ASSETS 48,381 36,376
L I A B I L I T I E S
CURRENT LIABILITIES
Creditors and borrowings 19,999 20,566
Provisions 9,526 9,863
Other 13,279 1,116
Total Current Liabilities 42,804 31,545
NON-CURRENT LIABILITIES
Creditors and borrowings - -
Provisions 3,687 4,086
Other - -
Total Non-Current Liabilities 3,687 4,086
TOTAL LIABILITIES 46,491 35,631
NET ASSETS 1,890 745
EQUITY
Capital and capital accounts 2,103 2,103
Accumulated deficit (213) (1,358)
TOTAL EQUITY 1,890 745
Annual Budget
$000
For the Period Ended
September 2006YTD Actual
$000
94
Brisbane City Works
95
THIS PAGE IS DELIBERATELY BLANK
96
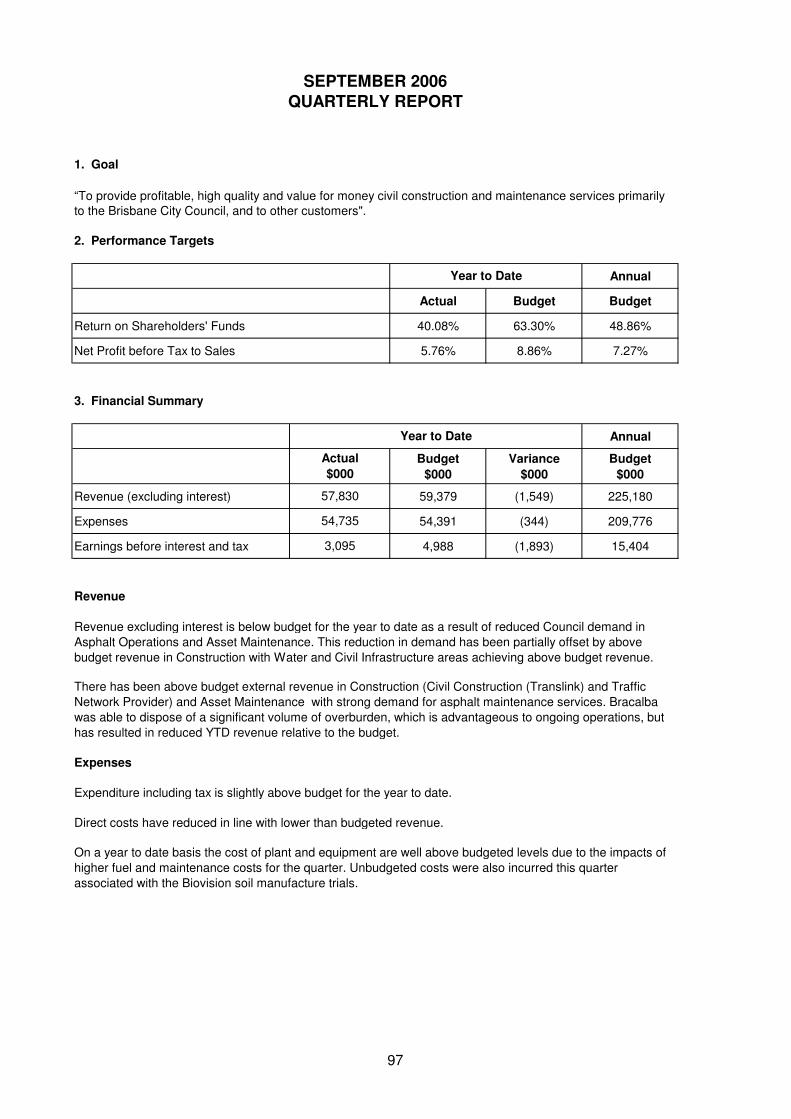
SEPTEMBER 2006
QUARTERLY REPORT
1. Goal
“To provide profitable, high quality and value for money civil construction and maintenance services primarily to the Brisbane City Council, and to other customers".
2. Performance Targets
Annual
Actual Budget Budget
Return on Shareholders' Funds 40.08% 63.30% 48.86%
Net Profit before Tax to Sales 5.76% 8.86% 7.27%
3. Financial Summary
Annual
Budget
$000
Variance
$000
Budget
$000
Revenue (excluding interest) 59,379 (1,549) 225,180
Expenses 54,391 (344) 209,776
Earnings before interest and tax 4,988 (1,893) 15,404
Revenue
Expenses
On a year to date basis the cost of plant and equipment are well above budgeted levels due to the impacts of
higher fuel and maintenance costs for the quarter. Unbudgeted costs were also incurred this quarter
associated with the Biovision soil manufacture trials.
Revenue excluding interest is below budget for the year to date as a result of reduced Council demand in
Asphalt Operations and Asset Maintenance. This reduction in demand has been partially offset by above
budget revenue in Construction with Water and Civil Infrastructure areas achieving above budget revenue.
There has been above budget external revenue in Construction (Civil Construction (Translink) and Traffic
Network Provider) and Asset Maintenance with strong demand for asphalt maintenance services. Bracalba
was able to dispose of a significant volume of overburden, which is advantageous to ongoing operations, but
has resulted in reduced YTD revenue relative to the budget.
Expenditure including tax is slightly above budget for the year to date.
Direct costs have reduced in line with lower than budgeted revenue.
57,830
54,735
3,095
Year to Date
Year to Date
Actual
$000
97
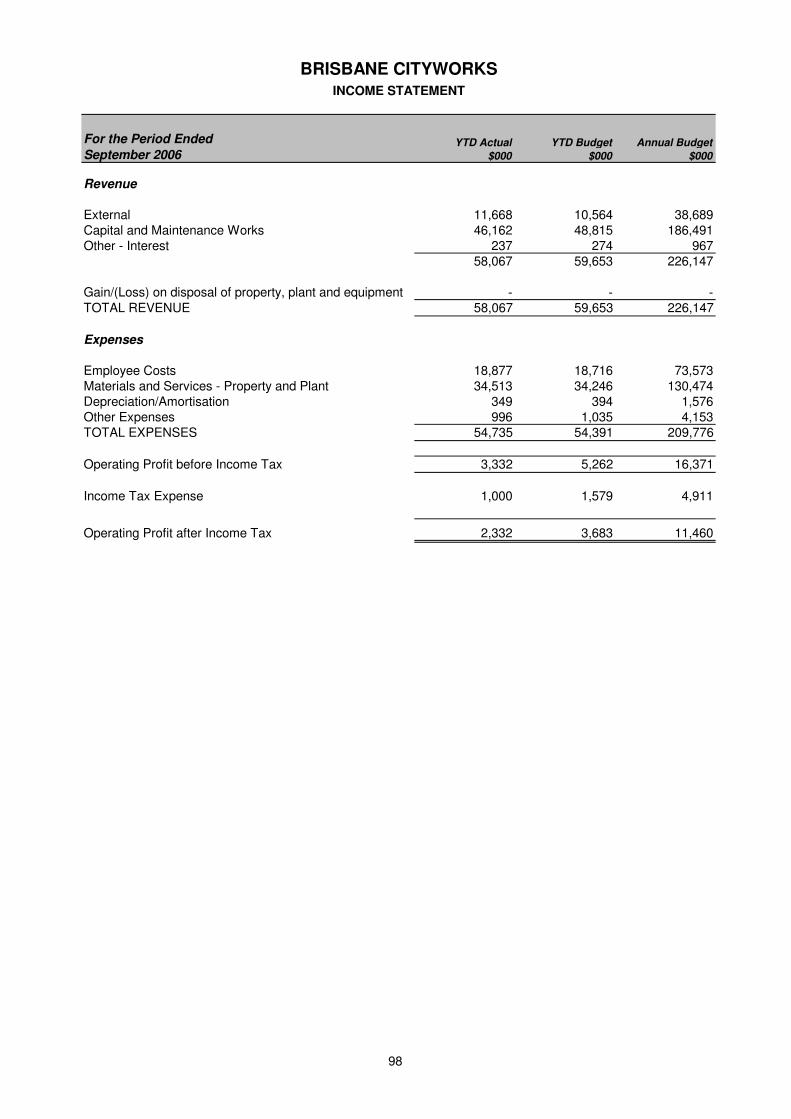
BRISBANE CITYWORKSINCOME STATEMENT
Revenue
External 11,668 10,564 38,689Capital and Maintenance Works 46,162 48,815 186,491Other - Interest 237 274 967
58,067 59,653 226,147
- - -TOTAL REVENUE 58,067 59,653 226,147
Expenses
Employee Costs 18,877 18,716 73,573Materials and Services - Property and Plant 34,513 34,246 130,474Depreciation/Amortisation 349 394 1,576Other Expenses 996 1,035 4,153TOTAL EXPENSES 54,735 54,391 209,776
Operating Profit before Income Tax 3,332 5,262 16,371
Income Tax Expense 1,000 1,579 4,911
Operating Profit after Income Tax 2,332 3,683 11,460
For the Period Ended
September 2006YTD Actual
$000
Annual Budget
$000
Gain/(Loss) on disposal of property, plant and equipment
YTD Budget
$000
98
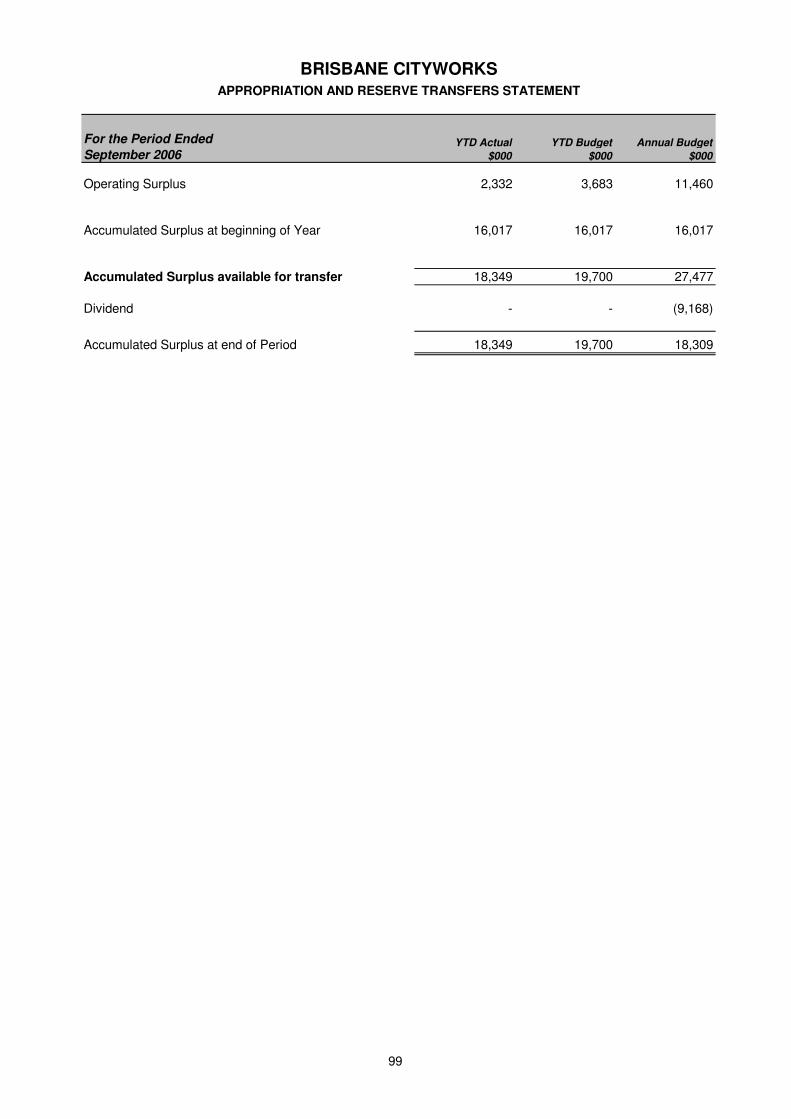
BRISBANE CITYWORKSAPPROPRIATION AND RESERVE TRANSFERS STATEMENT
Operating Surplus 2,332 3,683 11,460
Accumulated Surplus at beginning of Year 16,017 16,017 16,017
Accumulated Surplus available for transfer 18,349 19,700 27,477
Dividend - - (9,168)
Accumulated Surplus at end of Period 18,349 19,700 18,309
Annual Budget
$000
For the Period Ended
September 2006YTD Actual
$000
YTD Budget
$000
99
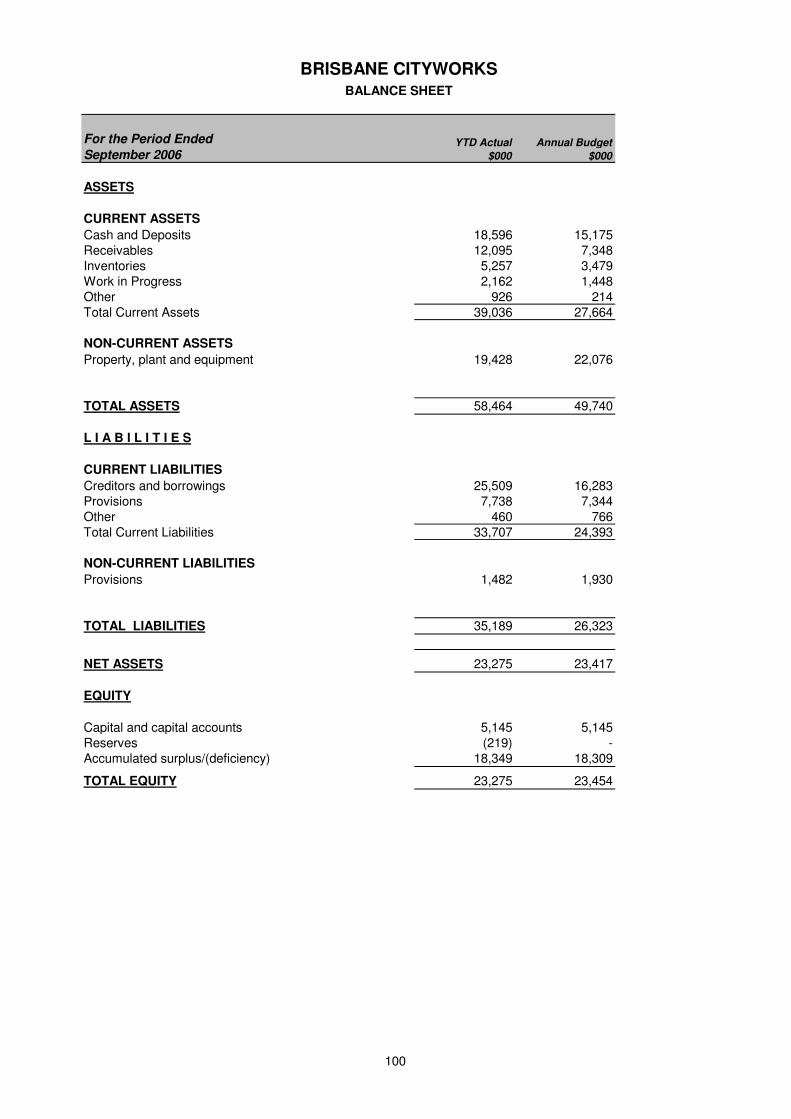
BRISBANE CITYWORKSBALANCE SHEET
ASSETS
CURRENT ASSETS
Cash and Deposits 18,596 15,175Receivables 12,095 7,348Inventories 5,257 3,479Work in Progress 2,162 1,448Other 926 214Total Current Assets 39,036 27,664
NON-CURRENT ASSETS
Property, plant and equipment 19,428 22,076
TOTAL ASSETS 58,464 49,740
L I A B I L I T I E S
CURRENT LIABILITIES
Creditors and borrowings 25,509 16,283Provisions 7,738 7,344Other 460 766Total Current Liabilities 33,707 24,393
NON-CURRENT LIABILITIES
Provisions 1,482 1,930
TOTAL LIABILITIES 35,189 26,323
NET ASSETS 23,275 23,417
EQUITY
Capital and capital accounts 5,145 5,145Reserves (219) -Accumulated surplus/(deficiency) 18,349 18,309
TOTAL EQUITY 23,275 23,454
For the Period Ended
September 2006YTD Actual
$000
Annual Budget
$000
100
City Business
101

THIS PAGE IS DELIBERATELY BLANK
102
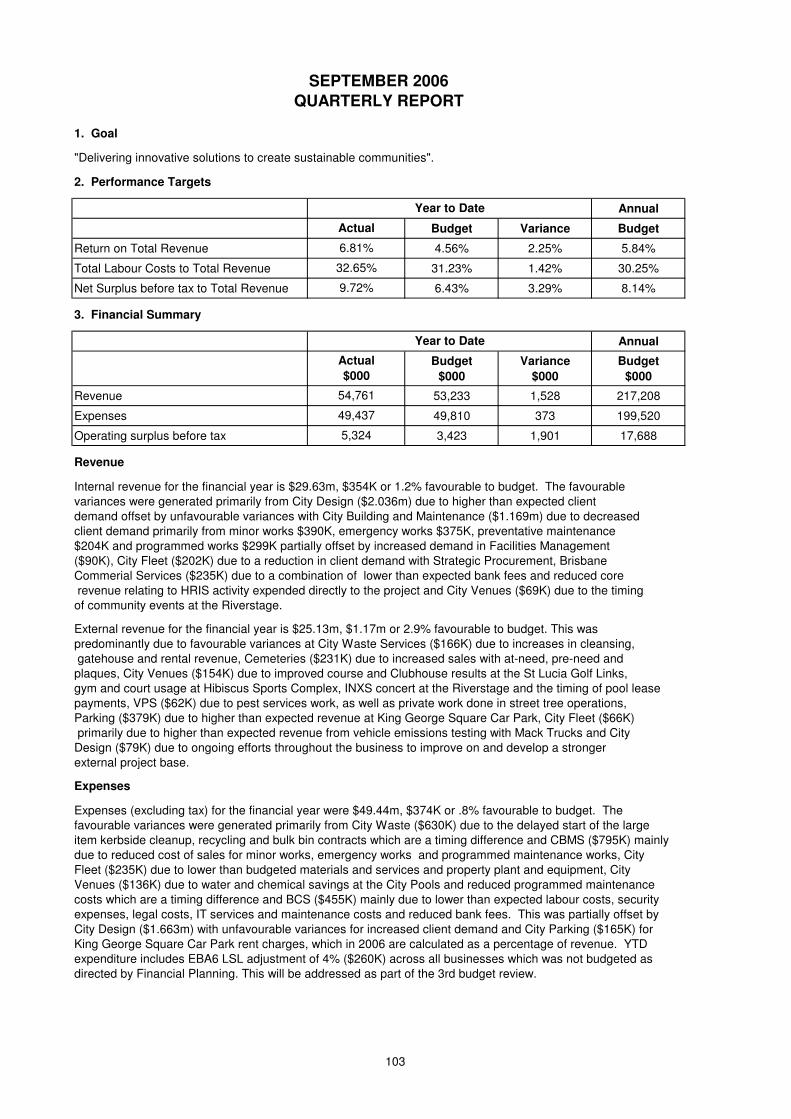
SEPTEMBER 2006
QUARTERLY REPORT
1. Goal
"Delivering innovative solutions to create sustainable communities".
2. Performance Targets
Annual
Budget Variance Budget
Return on Total Revenue 4.56% 2.25% 5.84%
Total Labour Costs to Total Revenue 31.23% 1.42% 30.25%
Net Surplus before tax to Total Revenue 6.43% 3.29% 8.14%
3. Financial Summary
Annual
Budget
$000
Variance
$000
Budget
$000
Revenue 53,233 1,528 217,208
Expenses 49,810 373 199,520
Operating surplus before tax 3,423 1,901 17,688
Revenue
Internal revenue for the financial year is $29.63m, $354K or 1.2% favourable to budget. The favourable
variances were generated primarily from City Design ($2.036m) due to higher than expected client
demand offset by unfavourable variances with City Building and Maintenance ($1.169m) due to decreased
client demand primarily from minor works $390K, emergency works $375K, preventative maintenance
$204K and programmed works $299K partially offset by increased demand in Facilities Management
($90K), City Fleet ($202K) due to a reduction in client demand with Strategic Procurement, Brisbane
Commerial Services ($235K) due to a combination of lower than expected bank fees and reduced core
revenue relating to HRIS activity expended directly to the project and City Venues ($69K) due to the timing
of community events at the Riverstage.
External revenue for the financial year is $25.13m, $1.17m or 2.9% favourable to budget. This was
predominantly due to favourable variances at City Waste Services ($166K) due to increases in cleansing,
gatehouse and rental revenue, Cemeteries ($231K) due to increased sales with at-need, pre-need and
plaques, City Venues ($154K) due to improved course and Clubhouse results at the St Lucia Golf Links,
gym and court usage at Hibiscus Sports Complex, INXS concert at the Riverstage and the timing of pool lease
payments, VPS ($62K) due to pest services work, as well as private work done in street tree operations,
Parking ($379K) due to higher than expected revenue at King George Square Car Park, City Fleet ($66K)
primarily due to higher than expected revenue from vehicle emissions testing with Mack Trucks and City
Design ($79K) due to ongoing efforts throughout the business to improve on and develop a stronger
external project base.
Expenses
Expenses (excluding tax) for the financial year were $49.44m, $374K or .8% favourable to budget. The
favourable variances were generated primarily from City Waste ($630K) due to the delayed start of the large
item kerbside cleanup, recycling and bulk bin contracts which are a timing difference and CBMS ($795K) mainly
due to reduced cost of sales for minor works, emergency works and programmed maintenance works, City
Fleet ($235K) due to lower than budgeted materials and services and property plant and equipment, City
Venues ($136K) due to water and chemical savings at the City Pools and reduced programmed maintenance
costs which are a timing difference and BCS ($455K) mainly due to lower than expected labour costs, security
expenses, legal costs, IT services and maintenance costs and reduced bank fees. This was partially offset by
City Design ($1.663m) with unfavourable variances for increased client demand and City Parking ($165K) for
King George Square Car Park rent charges, which in 2006 are calculated as a percentage of revenue. YTD
expenditure includes EBA6 LSL adjustment of 4% ($260K) across all businesses which was not budgeted as
directed by Financial Planning. This will be addressed as part of the 3rd budget review.
5,324
Year to Date
Actual
6.81%
32.65%
9.72%
54,761
49,437
Year to Date
Actual
$000
103
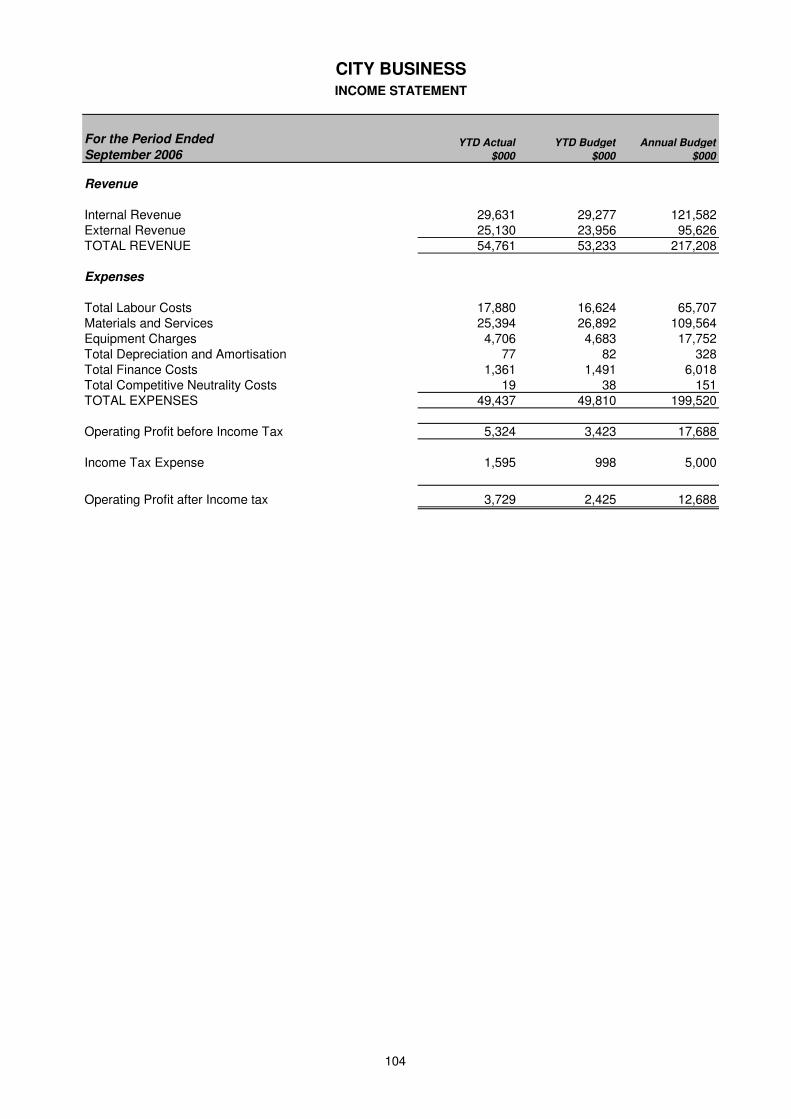
CITY BUSINESSINCOME STATEMENT
Revenue
Internal Revenue 29,631 29,277 121,582External Revenue 25,130 23,956 95,626TOTAL REVENUE 54,761 53,233 217,208
Expenses
Total Labour Costs 17,880 16,624 65,707Materials and Services 25,394 26,892 109,564Equipment Charges 4,706 4,683 17,752Total Depreciation and Amortisation 77 82 328Total Finance Costs 1,361 1,491 6,018Total Competitive Neutrality Costs 19 38 151TOTAL EXPENSES 49,437 49,810 199,520
Operating Profit before Income Tax 5,324 3,423 17,688
Income Tax Expense 1,595 998 5,000
Operating Profit after Income tax 3,729 2,425 12,688
For the Period Ended
September 2006YTD Actual
$000
YTD Budget
$000
Annual Budget
$000
104