bridge deck cracking and composite action analyses -...
TRANSCRIPT
FHWA-NJ-2008-010
i
Bridge Deck Cracking and Composite Action Analyses
FINAL REPORT March 2010
Submitted by
Hani Nassif1 Associate Professor
Nakin Suksawang2 Assistant Professor
Rod Lewis3 Senior Engineer
Husam Najm1 Associate Professor
NJDOT Research Project Manager W. Lad Szalaj
In cooperation with
New Jersey Department of Transportation
Bureau of Research And
U. S. Department of Transportation Federal Highway Administration
1Dept. of Civil & Environmental Engineering
Rutgers, The State University Piscataway, NJ 08854-8014
2Dept. of Civil & Environmental Engineering
Florida International University 10555 W. Flagler St.,
Miami, FL 33174
3HNTB Corporation
Wayne Plaza I, Suite 400 145 Route 46 West, Wayne, NJ
07470-6830

2.
ii
DISCLAIMER STATEMENT
―The contents of this report reflect the views of the author(s) who is (are) responsible for the facts and the accuracy of the data presented herein. The contents do not necessarily reflect the official views or policies of the New Jersey Department of Transportation or the Federal Highway Administration. This report does not constitute a standard, specification, or regulation.‖

i
TECHNICAL REPORT STANDARD TITLE PAGE
1. Report No. 2.Government Accession No. 3. Recipient‘s Catalog No.
FHWA NJ-2008-010
4. Title and Subtitle 5. Report Date
Bridge Deck Cracking and Composite Action Analyses March 2010
6. Performing Organization Code
CAIT/Rutgers University
7. Author(s) 8. Performing Organization Report No.
Hani Nassif, Nakin Suksawang, Rod Lewis, and Husam Najm.
9. Performing Organization Name and Address 10. Work Unit No.
Dept. of Civil & Environmental Engineering Center for Advanced Infrastructure & Transportation (CAIT) Rutgers, The State University Piscataway, NJ 08854-8014
11. Contract or Grant No.
12. Sponsoring Agency Name and Address 13. Type of Report and Period Covered
New Jersey Department of Transportation PO 600 Trenton, NJ 08625
Federal Highway Administration U.S. Department of Transportation Washington, D.C.
Final Report 01/31/06 – 08/30/2008
14. Sponsoring Agency Code
15. Supplementary Notes
16. Abstract According to the American Society of Civil Engineers Report Card (ASCE, 2005), United States infrastructure received a grade point average of ―D‖ (i.e., poor rating) in 2005. Moreover, the National Bridge Inventory (Federal Highway Administration, 2004)
revealed that of more than 594,470 bridges
in the US, about 150,981 (25.4%) are considered structurally deficient or functionally obsolete. Hence, major decisions must be made to allocate the limited funds available for repair, rehabilitation, and replacement. The vast majority of deficient bridges will require at least partial or full concrete deck replacement. Accordingly, many state departments of transportation expend significant effort and resources on the construction of durable reinforced concrete bridge decks. Previous research indicates that the development of transverse cracking in newly constructed concrete bridge decks continues to be a nationwide problem. In this study, three potential causes of cracking are investigated: 1) excessive restraint of the placed concrete, 2) design for deflection, and 3) high-strength gain of the concrete. Various bridge types were considered and modeled using the finite element (FE) computer program, ABAQUS. The FE model included the effect of shear studs, concrete strength, live load on the placement of concrete in existing bridges, and deflection limits. Existing data and results from this research indicate that the shear studs, concrete strength, and rebar locations have very little effect on bridge deck cracking. Depending on concrete pouring sequence, construction scenarios, and truck weight spectra, loading from adjacent truck traffic may lead to bridge deck cracking. To control bridge deck flexibility that causes an increase in concrete tensile stresses, new bridges with high-strength steel in excess of 70 ksi need to be designed with NJDOT deflection limits.
17. Key Words 18. Distribution Statement
Bridge Deck Cracking, Shrinkage, Finite Element Analysis,
19. Security Classif (of this report) 20. Security Classif. (of this page) 21. No of Pages
19. Security Classif (of this report)
Unclassified Unclassified
54 Unclassified
Form DOT F 1700.7 (8-69) Form DOT F
1700.7 (8-69)

ii 2.
ii
ACKNOWLEDGEMENTS
The authors thank the New Jersey Department of Transportation (NJDOT) and staff for their help and support on this project: Camille Crichton-Sumners, Research Bureau Manager; W. Lad Szalaj, Project Manager; Jose Lopez (retired); Richard Dunne; and Xiaohua ―Hannah‖ Cheng from the NJDOT Bureau of Structural Design; Thanks to Frank Corso, Joe Sheedy, and W. Scott Johnsen of the New Jersey Turnpike Authority (NJTA) for their help and assistance throughout the project. Also, the assistance of Richard Schaefer and Carlos Meneses of HNTB, engineers and staff of various project contractors at Conti (NJDOT‘s Route 18 over Albany Bridge project), Slattery-Skanska (NJDOT‘s Doremus Avenue Bridge Project), and students Kagan Aktas, Joseph Davis, John Montemarano, Chris Ericson, Michael Boxer, and Eric Rundstrom is appreciated.

iii 2.
iii
TABLE OF CONTENTS
EXECUTIVE SUMMARY ................................................................................................. 1
INTRODUCTION ............................................................................................................. 2 Objectives ....................................................................................................................... 2 Literature Review ............................................................................................................ 3
RESEARCH APPROACH ............................................................................................... 4 Composite Action Analysis .............................................................................................. 4
3-D FE Model Considering LRFD Composite Action Requirements ............................... 5 Model Element Types ...................................................................................................... 5 Beam Element ................................................................................................................. 6 Shell Element .................................................................................................................. 6
Steel Reinforcement ........................................................................................................ 7 Shear Studs .................................................................................................................... 8
Boundary Conditions ....................................................................................................... 9 Constraint and Release ................................................................................................... 9
Material Properties ........................................................................................................ 10 Steel Properties ............................................................................................................. 10 Concrete Properties ...................................................................................................... 11
Shrinkage Properties ..................................................................................................... 12 Temperature Gradient ................................................................................................... 14
Vehicular Live Loads ..................................................................................................... 15 Single-Truck .................................................................................................................. 16 Two-Trucks ................................................................................................................... 16
Test Bridges .................................................................................................................. 16
Concrete Deck Instrumentation ..................................................................................... 18
Steel Girder ................................................................................................................... 21 Laboratory Testing of Concrete Mixes........................................................................... 22 Compressive Strength Test ........................................................................................... 22 Splitting Tensile Strength Test ...................................................................................... 22
Model Validation ............................................................................................................ 24
FE Model Analysis Considering LRFD Composite Action Requirements ...................... 29 Steel Reinforcement ...................................................................................................... 29 Shear Stud Design Investigation ................................................................................... 29 Methodology .................................................................................................................. 32
Boundary Condition ....................................................................................................... 34
FE Analysis with NJDOT Deflection Requirements ....................................................... 37
FE Analysis Considering NJDOT ―Class A‖ Concrete ................................................... 37
CONCLUSIONS AND RECOMMENDATIONS ............................................................. 41
REFERENCES .............................................................................................................. 42
APPENDIX A: SAMPLE CALCULATION ...................................................................... 45

iv 2.
iv
LIST OF FIGURES Figure 1. Integration points of (a) two-node linear beam (B31), and (b) three-node
quadratic beam (B32) elements along the length of the beam (ABAQUS, 2005) .............................................................................................. 6
Figure 2. Integration points of a four-node shell element (ABAQUS, 2005) .................... 7 Figure 3. Reinforcement alignment: (a) parallel, (b) staggered, (c) longitudinal bar
on top of transverse and parallel alignment, (d) longitudinal bar on top of transverse and staggered alignment ............................................................ 8
Figure 4. Percentage of shear studs considered in the FE Model ................................... 9 Figure 5. Typical Stress-Strain Curves of structural steel (Salmon and Johnson,
1997) .............................................................................................................. 11 Figure 6. Ring Test set-up: a) schematic diagram, b) schematic cross-section,
and (c) picture of the restrained shrinkage test setup with six VWSG arrangement. .................................................................................................. 14
Figure 7. FEA model subjected to AASHTO LRFD positive vertical temperature gradient (°C) ................................................................................................... 15
Figure 8. Route 18 over Albany Street Bridge ............................................................... 17 Figure 9. Vibrating wire strain gage installation ............................................................. 19 Figure 10. Concrete deck strains on Route 18 Bridge over Albany Street .................... 19
Figure 11. Concrete deck temperature on Route 18 Bridge over Albany Street ............ 20 Figure 12. Importing field data in the FE model ............................................................. 20
Figure 13. Structural testing system by Bridge Diagnostics Inc. .................................... 21 Figure 14. Strain transducer clamped to a stringer at the Pearl Harbor Memorial
Bridge ............................................................................................................. 21
Figure 15. Forney 1 million pound compression machine ............................................. 22
Figure 16. Splitting tensile strength test setup ............................................................... 23
Figure 17. Sampling of concrete specimens at Route 18 Bridge over Albany Street .............................................................................................................. 24
Figure 18. Restrained shrinkage results for Route 18 Bridge over Albany Street: (a) Test Ring 1, and (b) Test Ring 2 ............................................................... 25
Figure 19. Incorporating the material properties into the FE Model ............................... 26
Figure 20. Comparison of results between FE model and field test results of (a) Doremus Avenue, and (b) Route 18 over Albany Street ................................ 27
Figure 21. Comparison of the FE Model and field test of Route 18 over Albany Street concrete deck strains ........................................................................... 28
Figure 22. Effect of truck loading on concrete deck with standard rebars arrangement ................................................................................................... 30
Figure 23. Effect of truck loading on concrete deck with modified rebar arrangement ................................................................................................... 30
Figure 24. Effect of time dependent on concrete deck with different rebar arrangement at midspan………………………………………………………………………...… 31
Figure 25. Effect of time dependent on concrete deck with different rebar arrangement at fixed end ............................................................................... 31
Figure 26. Comparison of the number of shear studs using LFD and LRFD provisions ....................................................................................................... 35

v 2.
v
Figure 27. Effect of shear stud percentages on concrete deck strain using load simulation ....................................................................................................... 36
Figure 28. Effect of shear stud percentages on concrete deck strain using time dependant simulation ..................................................................................... 36
Figure 29. Effect of boundary condition on the concrete deck strain at the end of the span ......................................................................................................... 38
Figure 30. Concrete deck strain at various positions on a 2-span continuous bridge ............................................................................................................. 38
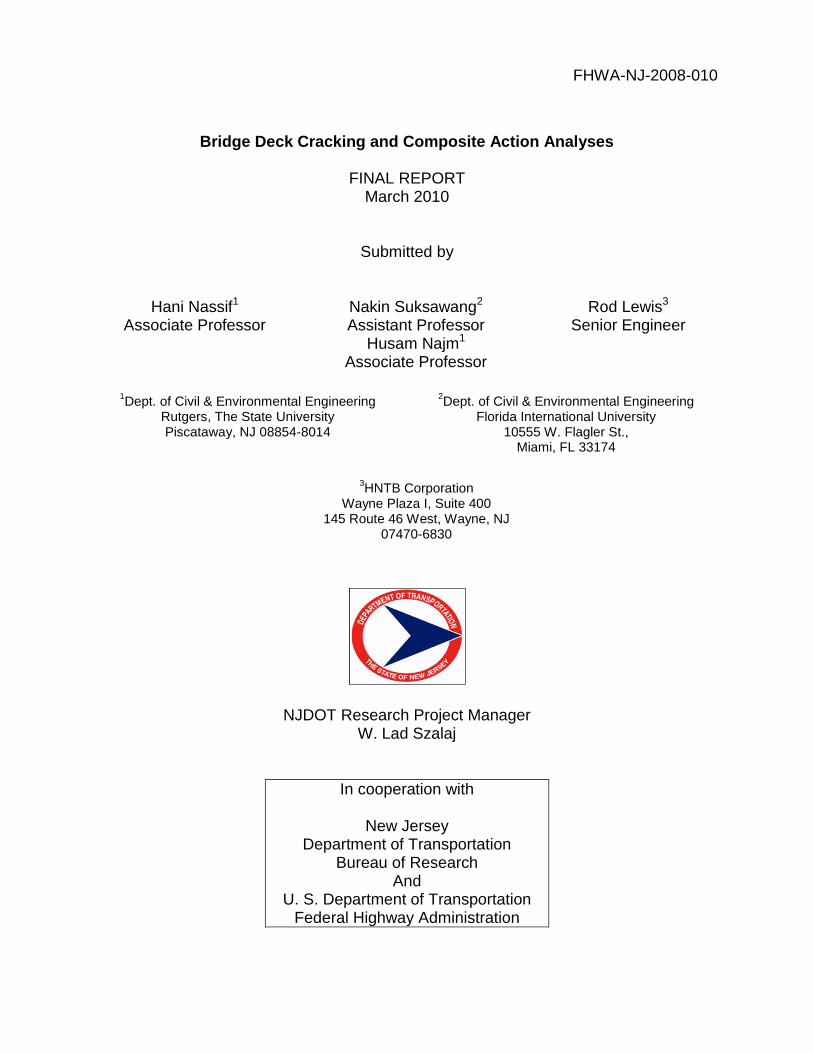
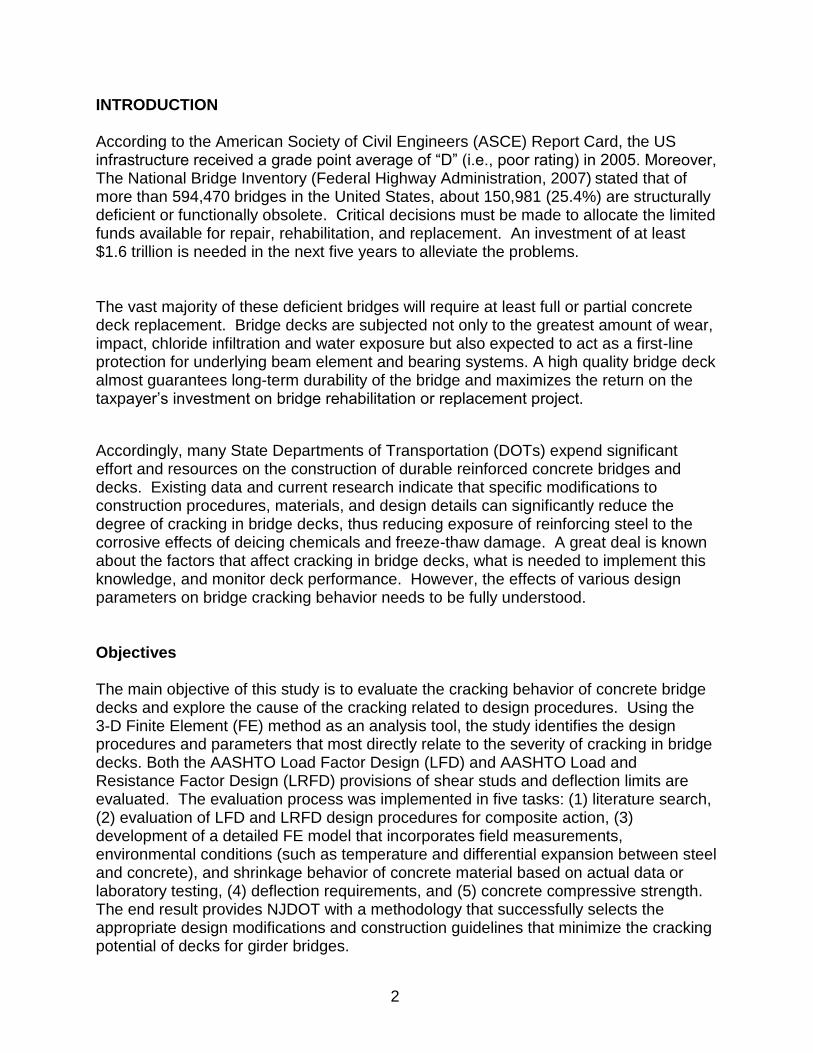
Figure 31. Effect of homogenous sectional properties on concrete deck strains ........... 39 Figure 32. Effect of hybrid sectional properties on concrete deck strains ...................... 39 Figure 33. Effect of concrete compressive strength on the concrete deck strain
for simply supported bridge (i.e., one end is pinned and one end is on a roller) .............................................................................................................. 40
Figure 34. Effect of concrete compressive strength on the cracking concrete strain under restrained condition (i.e., one end is fixed and one end is on a roller) ...................................................................................................... 40

vi 2.
vi
LIST OF TABLES
Table 1 - Number of shear studs required for a 100-ft span bridge……………................ 5
Table 2 - Design outcome for reinforcement using various deck design methods……….8 Table 3 - Material properties…………………………………………………………………. 15 Table 4 - Legend for shear stud comparison chart summary…………………………….. 34

1 1
EXECUTIVE SUMMARY Many State Departments of Transportation (DOTs) expend significant effort and resources on the construction of durable reinforced concrete bridges and decks. However, development of transverse cracking in newly constructed concrete bridge decks continues to be a nationwide problem. In this study, three potential causes of deck cracking are identified: (1) excessive restraint of the placed concrete, (2) designing for deflection, and (3) high-strength gain of the concrete. Although a great deal is known about the factors that affect cracking of concrete, there is a need to monitor deck performance to fully understand the effects of various design parameters on bridge cracking behavior. The main objective of this study is to evaluate the cracking behavior of concrete bridge decks and explore the cause of cracking related to design procedures. Using the 3-D Finite Element (FE) method as an analysis tool, the study identifies the design procedures and parameters that most directly relate to the severity of cracking in bridge decks. Both the AASHTO Load Factor Design (LFD) and AASHTO Load and Resistance Factor Design (LRFD) provisions of shear studs and deflection limits are evaluated. The evaluation process was implemented in five tasks: (1) literature search, (2) evaluation of LFD and LRFD design procedures for composite action, (3) development of a detailed FE model that incorporates field measurements, environmental conditions (such as temperature and differential expansion between steel and concrete), and shrinkage behavior of concrete material based on actual data or laboratory testing, (4) deflection requirements, and (5) concrete compressive strength. The results from current research indicate that specific modifications to construction procedures, materials, and design details can significantly reduce the degree of cracking in bridge decks. The following conclusions and recommendations are made from this study: 1. The LRFD Specifications do not require a higher number of shear studs in
comparison to the LFD Specifications. 2. Shear studs, concrete design strength, and rebar locations do not contribute to
nor play a significant role in bridge deck cracking. 3. There is a higher potential for cracking at the end restraints, specifically at the
fixed end and bridge pier for simple and continuous spans, respectively. For existing bridges that are in need of deck replacement, there is a high potential for cracking in the fresh concrete deck area due to truck loads traveling in adjacent lanes.
4. The NJDOT deflection requirements should be retained at a minimum of
L
800 to
control the bridge deck flexibility (and thus any increase in concrete strains) when higher strength steel is used (i.e., Grade 70 and 100).
2
INTRODUCTION According to the American Society of Civil Engineers (ASCE) Report Card, the US infrastructure received a grade point average of ―D‖ (i.e., poor rating) in 2005. Moreover, The National Bridge Inventory (Federal Highway Administration, 2007) stated that of more than 594,470 bridges in the United States, about 150,981 (25.4%) are structurally deficient or functionally obsolete. Critical decisions must be made to allocate the limited funds available for repair, rehabilitation, and replacement. An investment of at least $1.6 trillion is needed in the next five years to alleviate the problems. The vast majority of these deficient bridges will require at least full or partial concrete deck replacement. Bridge decks are subjected not only to the greatest amount of wear, impact, chloride infiltration and water exposure but also expected to act as a first-line protection for underlying beam element and bearing systems. A high quality bridge deck almost guarantees long-term durability of the bridge and maximizes the return on the taxpayer‘s investment on bridge rehabilitation or replacement project.
Accordingly, many State Departments of Transportation (DOTs) expend significant effort and resources on the construction of durable reinforced concrete bridges and decks. Existing data and current research indicate that specific modifications to construction procedures, materials, and design details can significantly reduce the degree of cracking in bridge decks, thus reducing exposure of reinforcing steel to the corrosive effects of deicing chemicals and freeze-thaw damage. A great deal is known about the factors that affect cracking in bridge decks, what is needed to implement this knowledge, and monitor deck performance. However, the effects of various design parameters on bridge cracking behavior needs to be fully understood. Objectives The main objective of this study is to evaluate the cracking behavior of concrete bridge decks and explore the cause of the cracking related to design procedures. Using the 3-D Finite Element (FE) method as an analysis tool, the study identifies the design procedures and parameters that most directly relate to the severity of cracking in bridge decks. Both the AASHTO Load Factor Design (LFD) and AASHTO Load and Resistance Factor Design (LRFD) provisions of shear studs and deflection limits are evaluated. The evaluation process was implemented in five tasks: (1) literature search, (2) evaluation of LFD and LRFD design procedures for composite action, (3) development of a detailed FE model that incorporates field measurements, environmental conditions (such as temperature and differential expansion between steel and concrete), and shrinkage behavior of concrete material based on actual data or laboratory testing, (4) deflection requirements, and (5) concrete compressive strength. The end result provides NJDOT with a methodology that successfully selects the appropriate design modifications and construction guidelines that minimize the cracking potential of decks for girder bridges.

3
Literature Review Research of available literature reveals that there are several published papers and reports on bridge deck cracking. One of the major research projects was the NCHRP Project 12-37 on ―Transverse Cracking in Newly Constructed Bridge Decks.‖ (Krauss and Rogalla, 1996) The project summarizes various factors affecting bridge deck cracking and their remediation. The study identified three categories of factors affecting bridge deck cracking: (1) material properties, (2) mix/structural design, and (3) construction methodology. The material properties category was further divided into 21 subcategories, where the modulus of elasticity, creep, heat of hydration, aggregate type, cement content and type, and coefficient of thermal expansion were classified as major contributing factors in deck cracking. Only one subcategory, the end restraints, in the mix/structural design category was considered to be major contributing factor to deck cracking. For the construction methodology category, the weather and time of casting were both classified as major factors. The report also extensively proposed guidelines for the selection of concrete bridge deck materials, construction methodology, and a standard method for testing the cracking tendency of concrete, or the AASHTO PP34 restrained ring test (AASHTO, 2005). The report did not look at the possible contribution of composite steel shear studs in detail, but mentioned that on the basis of the FE analysis, they did increase local stresses by approximately 20 percent. In addition to the NCHRP 12-37 project, State Departments of Transportation including those from New Jersey, Colorado, and Michigan had also initiated several independent research projects on deck cracking. NJ project FHWA-NJ-2002-19, conducted by Saadeghvaziri and Hadidi (2002), investigated deck cracking using FE analysis. A parametric study was administered to examine the effect of bridge support fixity conditions (i.e., pin-pin, pin-roller, 3-span, 2-span, fixed-roller, fixed-pin, and fixed-fixed), span length, deck thickness, girder spacing, the relative flexibility of girder to deck, composite action, and longitudinal reinforcement on the stress development in the bridge deck concrete. Based on the results of this study, most of these parameters did not significantly affect deck cracking. Only girder spacing and deck thickness produced more pronounced stress variations on the order of 20 and 10 percent, respectively. The support fixity conditions were determined to be major contributing factors affecting the stress development in the deck. The caveat to the conclusions of the research was based on finite element modeling, thus making the results difficult to verify without real-world experimental field data. Furthermore, given the theoretical nature of the research, assumptions, rather than actual field investigations, on certain properties of concrete shrinkage strain were also made. The projects conducted by Michigan (RC-1437 conducted by Aktan et al. [2003] ) and Colorado (CDOT-DTD-R-2003-3 conducted by Xi et al. [2003] ) also demonstrate similar results as the NCHRP research. Both projects also address the material and construction factors affecting deck cracking. In fact, several research projects address materials and construction factors and offer methods for improvement. However, few

4
have addressed the impact on design aspect especially when considering the newer LRFD provisions. RESEARCH APPROACH This study focuses primarily on investigating the possible contributions of practical structural design of bridge decks and superstructure bearing fixity to concrete deck cracking. In particular, an evaluation of the AASHTO criteria for composite design with respect to the requirements for shear connectors, including whether the number and the location of these connectors have an effect on deck stresses, was critical. The study also evaluates the effects of designing for deflection control on deck stiffness and stresses. Any, or all of the above noted effects, may offer some measure of restraint to the concrete deck, and contribute to the generation and propagation of cracking. The effect of using higher-strength concrete (than what is commonly used in practical bridge deck design) on the cracking behavior of bridge decks was also investigated. The following tasks were performed: Composite Action Analysis Accepted engineering practice in designing composite behavior in bridges requires enforced shear interaction between the deck element and the primary beam. With a steel beam, for example, steel shear studs are typically end-welded to the top flange of the beam. The studs are spaced according to design codification set forth in AASHTO design texts for Allowable Stress Design (ASD), LFD, and LRFD methodologies. They are designed to resist: 1) the ultimate strength for rare heavy vehicular loading, and 2) fatigue for repetitive loading of common design vehicles over the full service life of the bridge. The effect of this enforced composite action might be related to the observed cracking tendency of the concrete bridge decks on LFD designed bridges. While knowledge regarding the cracking on LRFD designed bridges in New Jersey has not yet been substantial, future bridges will undoubtedly be designed according to the current LRFD design methodologies. Hence, there is an urgent need to investigate any correlation between both codes regarding composite action and the cause of cracking. The design of shear studs has not significantly changed from LFD (Article 10.38.2) to LRFD (Article 6.10.10). However, one of the noted changes is the shear fatigue resistance (Zr). The equation has been modified from using a constant value for the
term () to a logarithmic expression. Significant changes between the two codes that may affect the overall design are load factors, distribution factors, and fatigue load truck. The LFD and LRFD requirements for shear connectors are based on two criteria: fatigue strength and ultimate strength. The fatigue shear strength of the connectors is an important parameter that significantly influences the number of shear connectors required. The value of Zr is low for a large number of cycles, and LRFD even sets a lower bound on Zr. An extensive study was conducted on the design of several LFD

5
and LRFD bridges using commercially available software packages, shown later in the report. Sample calculations using LFD and LRFD design provisions of two bridges of the same span length (100-ft), but varying web depths of 30-in. and 60-in. are provided in Appendix A. Table 1 summaries the required number of shear studs for the two bridges. For the 30-in. web depth, LFD required 376 shear studs and LRFD required 368 shear studs. Similarly for the 60-in web depth, LFD and LRFD required 256 and 248 shear studs, respectively. Overall, while there were small differences between the LFD and LRFD shear stud requirement, LRFD required slightly lower number of shear studs.
Table 1 - Number of shear studs required for a 100-ft span bridge
Web Depth (inches) LFD LRFD % Difference
30 376 368 -2.1
60 256 248 -3.1
3-D FE Model Considering LRFD Composite Action Requirements To study the cracking behavior of bridge decks, a detailed 3-D FE model was developed. A general-purpose finite element program, ABAQUS, was utilized to generate the model. ABAQUS includes a variety of routines that allow defining specific material behaviors and properties such as concrete cracking and tension stiffening, reinforcing steel rebar, boundary conditions, bond behavior, (e.g., shear studs) and interaction between the steel deck reinforcement and concrete. The development of the 3-D FE model was instrumental to this research project. While the FE model was a critical tool for accessing the conditions of bridge structures, it was important to understand some of its techniques and limitations in analyzing a bridge. For steel girder bridges there are various elements, materials, and loading libraries that need to be carefully addressed. It is important for the user to have a general understanding of what these libraries do and how to utilize them to model the truss bridge correctly. This section highlights key element selection, material properties, loading routine, as well as model verification, used for determining the composite action analyzes. Model Element Types Various types of elements can and have been used for modeling bridge structures. However, beam and shell elements have proven to offer the most reliable results. Solid element models can also provide a reasonable correlation with the field test results, but often require more computer resources, while not necessarily increasing the accuracy of the model. For the purposes of this research study, the elements described below have been utilized to model the behavior of composite bridges:

6
Beam Element The beam element is the best for modeling stringers and plated girders of the truss bridge. The beam element is a one-dimensional line element that typically cannot deform out of its own plane; under bending, the plane sections remain plane. However, some FE programs such as ABAQUS include wrapping theory—non-uniform, out-of-plane deformation of the cross section—to certain beam elements, particularly open, thin-walled beam elements, such as fabricated welded plate I-beams (ABAQUS, 2004). Figure 1 illustrates the beam element with different integration points. In general, the higher the order of discretizations of the bridge, the more accurate the results will be. However, the higher the order of discretizations of the bridge, the slower the program runs. Thus, for the purpose of this research project, a coarse mesh is used to model the bridge in general, while a fine mesh is utilized at the locations of maximum positive and negative moment and shear.
(a) (b)
Figure 1. Integration points of (a) two-node linear beam (B31), and (b) three-node
quadratic beam (B32) elements along the length of the beam (ABAQUS, 2005) Shell Element The shell element was used to model the concrete slab. The reason for this selection was because the concrete slab has one dimension that is significantly smaller than the others (i.e., thickness of the slabs are smaller than its width and length). The FE software contains a vast library of shell elements, but the most common type is the four-node shell element. This element is a fully integrated, general purpose, finite-membrane-strain shell element that allows in-plane bending. It also permits transverse shear deformation and uses a thick-shell theory. As shell thickness increases, the thin- shell behavior predicted by the Kirchhoff-Love hypothesis decreases. Since this hypothesis was developed primarily for homogenous isotropic materials, its use may not be appropriate for thick-shelled, laminated anisotropic materials, such as the steel reinforced concrete bridge deck. The four-node shell element has six degrees of freedom at each node and four integration points for each element. Figure 2 illustrates the integration point and nodes used by the four-node shell elements.

7
Figure 2. Integration points of a four-node shell element (ABAQUS, 2005) Steel Reinforcement The steel reinforcement was included in the model by using the rebar element. ABAQUS has a template of a defined rebar sub-element that can be embedded into both the beam and shell elements. The rebar element is embedded into a shell element by layers, and can be defined in both the longitudinal and transverse directions. In the beam element, the rebar element is defined as an individual rebar that can only be defined along the length of the beam. Grade 60 steel was used in the analysis to satisfy the AASHTO LRFD Article 6.10.1.7 on minimum negative flexure concrete deck reinforcement. For two-span and three-span continuous bridges, emphasis on the reinforcement of the negative moment region was evaluated for deck cracking, as well as its effect on the number of shear studs. Additionally, the AASHTO LRFD (1998) and AASHTO LRFD (2004) design methodologies were evaluated. The AASHTO LRFD (2004) provision states that a minimum requirement of 1-percent negative reinforcement needs to be placed not only in the region of negative moment, at a point of dead load contraflexure, but also beyond this region to address ―the tensile stresses in the deck due to either the factored construction loads (including load during the various phases of deck placing sequence) or due to Load Combination Service II in Table 3.4.1-1‖ (AASHTO LRFD, 2004, Article C6.10.1.7). Hence, a number of existing bridges may experience cracking in this region. The volume of reinforcement was investigated because of the two disparate methods of analysis permitted by AASHTO LRFD: traditional and empirical design (AASHTO LRFD, 2004, Article 9.6.1). The empirical design yields a lower requirement of reinforcement, nearly a 30-percent reduction, as shown in Table 2. This can propagate deck cracking further because there is a lower amount of steel to resist the tensile stresses. Furthermore, reinforcement alignment was also investigated because various reports suggest that a deck with staggered top and bottom reinforcement layers (Figure 3(b)) may have a higher cracking resistance than the traditional parallel alignment (Figure 3(a)). Although this is done at the cost of some loss of transverse bending capacity, various state DOTs believe that placing the longitudinal bar on the top of the transverse bar could mitigate deck cracking (Figure 3(c)) and Figure 3(d)) by intercepting the

8
crack earlier in the process of crack propagation. Using temperature and shrinkage load as well as post-cracking load, these conditions were modeled to verify the effects of rebar alignment and placement. Table 2 summarizes various reinforcement parameters that have been used in this study.
Figure 3. Reinforcement alignment: (a) parallel, (b) staggered, (c) longitudinal bar on top of transverse and parallel alignment, (d) longitudinal bar on top of transverse and staggered alignment
Table 2 - Design outcome for reinforcement using various deck design methods.
Design Method
Transverse Longitudinal Total
Top Bottom Top Bottom (lb/ft)
Traditional No. 5 @ 6" No. 5 @ 9" No. 5 @ 18" No. 5 @ 12"
Mass (lb/ft) 72.8 48.5 24.3 36.4 181.9
Empirical No. 5 @
18" No. 5 @ 14" No. 5 @ 18" No. 5 @ 14"
Mass (lb/ft) 24.3 31.2 24.3 31.2 110.9
Shear Studs There are two main methods for modeling shear studs: unbreakable bond and breakable bond. The unbreakable bond (i.e., multiple-point constraint, spring element, and welded surface interaction) method assumes that the bond between the steel girder and concrete deck will not fail. On the other hand, breakable bond allows the shear stud to fail, which may occur when reducing the number of studs. Both methods were used to model the shear studs. Figure 4 illustrates the method of reducing the number of shear studs in the FE model.
Longitudinal bar

9
Figure 4. Percentage of shear studs considered in the FE Model Boundary Conditions Bridge piers and abutments are idealized using boundary conditions (bridge superstructure bearing types) to represent the actual bearing used in the field. It is assumed that the piers and abutment are not affected by the live load (i.e., no settlement or side-sway) in the FE model. Pinned supports are modeled by restricting the translation in the x- and y-planes of the girder cross section. For roller supports, however, only the translation in the y-plane of the girder cross section is restricted. Even so, the boundary conditions may need to be changed from the design plans because of corrosions. The corrosion on the bearing can be excessive which can prevent bearing rotation. As a result, the bearing freezes making it necessary to restrict the rotation at the support of the bridge using a spring element. The spring constant can be determined based on the calibration of the bridge model. Constraint and Release The FE modeling of the bridges consists of multiple assemblies or parts known as structural components. By using constraint elements, specifically a multi-point

10
constraint (MPC), these parts are joined together to construct the entire bridge structure. The BEAM MPC provides a rigid beam between two nodes to constrain the displacement and rotation at the first node, to the displacement and rotation at the second node, thus simulating the presence of a rigid beam between the two nodes. This is primarily used in constraining the slab nodes to the stringer nodes for composite action. For non-composite or zero-moment connection, such as the connection between the stringers and floor beams, the ―PIN MPC‖ command is used. The ―PIN MPC‖ command provides a pin connection between two nodes. In addition to the constraint, there may be some members that share the same nodes, e.g., the diaphragms and the stringers. Thus, to model the diaphragm connections the rotation of the starting and ending nodes of the diaphragms (that are connected to the stringer) need to be released.
Material Properties Steel and concrete are two main materials that are used in bridge construction. Hence, their material properties need to be properly built into the model to obtain an acceptable level of accuracy. However, when the material properties are not available, several references and prediction models can also be used.
Steel Properties For an elastic bridge response, the modulus of elasticity and the Poisson‘s ratio are needed. For structural steel, the modulus of elasticity and Poisson‘s ratio is well-defined and given as 29,000 kip/in2 and 0.30, respectively. However, for plastic analysis, yield and ultimate strength are also needed. Moreover, to increase the accuracy of the model, a full stress-strain curve is vital in creating the element stiffness matrix at various strain levels. Three different types of steel properties are commonly used when designing bridges: (1) structural steel, (2) reinforcing steel, and (3) prestressing steel. The structural steel (I-girder and diaphragms) is subdivided into two grades: 1) A36 carbon steel, and 2) A572 high-strength, low-alloy carbon steel. The A36 carbon steel has a minimum yield strength of 36,000 lb/in2, where the ultimate strength varies between 58,000 lb/in2 to 80,000 lb/in2. The A572 high-strength, low-alloy carbon steel has a minimum yield strength of 50,000 psi, where the ultimate strength varies between 70,000 lb/in2 to 100,000 lb/in2. Figure 5 illustrates typical stress-strain curves of the two grades of steel used in the FE model.

11
Figure 5. Typical Stress-Strain Curves of structural steel (Salmon and Johnson, 1997) Concrete Properties Concrete is an engineering material with a wide range of compressive strengths between 100 lb/in2 to 35,000 lb/in2. However, the range of compressive strengths for bridge structures is smaller. Depending on the age of concrete, the deck slab typically has a design compressive strength ranging from 4,000 lb/in2 to 6,000 lb/in.2 For older concrete, the compressive strength is higher than the specified ―Class A‖ concrete compressive strength of 4,000 lb/in2. Moreover, high-performance concrete (HPC), normally used for new construction, typically has a slightly higher compressive strength and a lower water-to-cementitious ratio (0.40). Thus, the compressive strength of the deck slab is taken to be 5,000 lb/in2 for existing and new slabs. However, if cores can be extracted or nondestructive testing can be done, then the actual compressive strength and modulus of elasticity of concrete should be used.
As mentioned earlier, the modulus of elasticity and Poison‘s ratio need to be specified in the model for elastic analysis. Unlike steel, the modulus of elasticity of concrete varies significantly with compressive strength, types of aggregates, paste content, and admixture. For simplicity, the industry-accepted relationship between the modulus of elasticity and compressive strength has been utilized. The American Concrete Institute

12
building code (ACI 318 Article 8.5.1, 2005) gives the modulus of elasticity, cE , as
follows:
,for 1 5 59 0 cw 3/ ftlb (Eq. 1)
or for normal strength concrete:
cc fE 000,57 (Eq. 2)
where cw and cf are the unit weights ( 3/ ftlb ) and compressive strength (2/ inlb ) of
concrete, respectively. These equations are also published in both the AASHTO Standard Specification and the LRFD bridge design codes. In this study, Equation 2 was used to calculate the modulus of elasticity of concrete. The tensile strength of concrete should also be considered in the FE model. A good approximation of the tensile strength of concrete is 10% to 20% of the compressive strength. However, if subjected to bending, the modulus of rupture rather than the tensile strength should be used. ACI 318 Article 9.5.2.3 and AASHTO LRFD Article 5.4.2.6 both specify the modulus of rupture of concrete, fr, for normal-weight concrete as follows:
cr ff 5.7 Eq. (3)
Shrinkage Properties Shrinkage is one of the hardest properties to model in FE analysis for two reasons: it is a time- dependant property, but also influenced by the environment. In addition, concrete structures are also restrained by steel rebar and composite action between the steel and concrete sections exist. Thus, to accurately model the shrinkage properties, the best solution was to measure the actual strain from an instrumented deck slab. However, this procedure is not always applicable on existing structures. Alternatively, experimental measurements from free shrinkage prism and restrained ring specimens in a controlled test lab environment were used to determine the free and partially restrained conditions, respectively. Figure 6 illustrates the partially restrained conditions using the restrained ring test (AASHTO PP34) that is currently being conducted by the NJDOT research team. The creep of concrete was simulated in the FE model using viscoelastic material properties, which produced a reasonably accurate model. This was done to describe the concrete under constant stress over time. However for a bridge deck, shrinkage,
ccc fwE 5.133

13
rather than the concrete creep is considered to be the main contributor in secondary concrete strain. Thus, modifications were needed in order to use the viscoelasticity property to simulate the drying shrinkage in the FE model. ABAQUS uses the time-dependent shear and volumetric behavior of a viscoelastic material to simulate the decay function of the material under constant stress or strain. The time-dependant variables can be represented in terms of a Prony Estimation series given below: Shear Behavior:
Eq. (4)
where N, , and , are material constants. Volumetric Behavior:
Eq. (5)
where K0 is material constant and,
Eq. (6)
Both of these equations are simply a summation of a series of exponential decays that can be used to approximate the creep properties of viscoelastic materials. Although concrete is not exactly a viscoelastic material, the Prony series provide a good approximation of creep behavior for concrete without having to develop a constitutive model. For shrinkage properties, the creep behavior is dominated by the volumetric creep. Hence, only the volumetric behavior was considered in the model. As mentioned earlier, the viscoelasticity property can only be used to describe the creep behavior of concrete; the shrinkage data needs to be calibrated by back calculating the constant instantaneous stress acting on the concrete, which will cause the concrete to shrink.
This is done through the use of Eq. (5), by substituting vol to the strain at 1-day of drying from the free shrinkage result. The 1-day modulus of elasticity was used for the computation of the bulk modulus of elasticity, K0. Furthermore, ABAQUS also allows

14
the user to enter in ―CREEP TEST DATA,‖ in which case the other shrinkage values were inputted into the model by computing the volumetric creep compliance as follows:
p
ttJ
vol
K
)()(
Eq. (7)
Figure 6. Ring Test set-up: a) schematic diagram, b) schematic cross-section, and (c) picture of the restrained shrinkage test setup with six VWSG arrangement.
Temperature Gradient The temperature gradient was another key component in this research. Deck cracking can be divided into two main stages, early-age and later-age. The early-age cracking is a result of autogenous shrinkage that is enhanced with a high heat of hydration. For later-age cracking, seasonal temperature variation may also play a role in deck cracking. Thus, these temperature variations need to be modeled and studied extensively. In ABAQUS, in addition to the coefficient of thermal expansion, density, specific heat, Poisson‘s ratio, modulus of elasticity, and thermal conductivity, the temperature gradient is also modeled by defining various temperatures in the shell and beam elements. Table 3 lists the material properties used in ABAQUS for performing heat transfer calculations. Figure 7 illustrates the 8-ft composite I-girder subjected to
A
Steel Ri ng
18 in
12 i n
6 i n
A
11 in
V W SG
FSG
T hermosistor
(a) (b)
(c)

15
AASHTO LRFD temperature gradient (Article 3.12.3). The AASHTO LRFD temperature gradient has been used to analyze all thermal effects. In addition, the actual field-measured temperature data in concrete was also incorporated in the FE model for validation purposes.
Table 3 - Material properties
Properties STEEL CONCRETE
Density (kg/m3) 7,860 2,320
Modulus of Elasticity (GPa)
200 25
Poisson's Ratio 0.3 0.17
Coeff. Of Expansion (1/0C) 1.17 X10⁻⁵ 9.90 X 10⁻⁶
Thermal Conductivity (W/m0C)
46.73 1.8
Specific Heat (J/kg0C) 450 1000
Figure 7. FEA model subjected to AASHTO LRFD positive vertical temperature gradient (°C) Vehicular Live Loads Vehicular live loads were modeled using concentrated loads that represented the test truck. In the case where the truck could not be directly placed over the nodes, equivalent nodal load was computed and used in the FE program. Different load combinations were applied for calibrating the bridge model. The load combinations are as follows:
AASHTO LRFD Positive Temperature Gradient

16
Single-Truck Although the single-truck load combination does not often cause the maximum negative moment on the bridge, it is a more frequently occurring event on the bridge. The single-truck load is also used for simulating the early-age cracking when only one lane is open to traffic during a staged concrete deck pour. There are two main types of trucks that need to be considered, the 5-axle truck, and the 3-axle short dump truck. If there are no weigh-in-motion (WIM) data available, the gross vehicle weight of these trucks should be approximated to 80 kips. Dynamic impact factor should also be included. It is obtained by either multiplying the truck weight by 1.33 as per the AASHTO LRFD provision, or by directly measuring the actual dynamic impact. Two-Trucks The case of two trucks traveling in series (i.e., two trucks following each other in one lane) has been included because it will usually cause the highest negative moment on the bridge. The trucks are typically in combinations of two 5-axle trucks, two 3-axle trucks, or one 5-axle truck and one 3-axle truck. Similar to the single-truck combination, the dynamic impact factor should also be included. Test Bridges Two bridges were analyzed for this project: (1) the Doremus Avenue Bridge, located near Newark, NJ, and (2) Route 18 Bridge over Albany Street, located in New Brunswick, NJ. All bridge spans considered were typical steel girder bridges. The Doremus Avenue Bridge used ordinary ―Class A‖ concrete for the deck, whereas the Route 18 Bridges used HPC ―Class A‖ mixes. The Doremus Avenue Bridge is part of an integrated roadway infrastructure system that carries heavy weight truck traffic. It is the first NJDOT bridge to be designed and constructed in accordance with the AASHTO LRFD Bridge Design Specification in NJ. The bridge is 1315 ft long and the superstructure consists of three units of 3-span continuous welded plate girders for a total of 9 spans. The curb-to-curb width of the roadway on the bridge is 65 ft, which consists of two 12-ft lanes and an 8-ft shoulder in each direction. The bridge cross-section includes a 7-ft extension beyond the bridge‘s west parapet to carry a 2-ft diameter water main and a 10-in. diameter sanitary sewer force main across the bridge. In order to avoid disruption to traffic, the bridge was constructed in two stages as a deck replacement. Both stages consisted of 5 girders, but differed in girder spacing. Stage I had a girder spacing of 8.04 ft from center-to-center, whereas Stage II had a girder spacing of 7.71 ft center-to-center. The Route 18 Bridge over Albany Street (Figure 8) is a newly constructed simple-span concrete deck slab on steel girder bridge. The bridge is part of the Route 18 widening

17
project implemented to alleviate truck traffic in and around the city of New Brunswick. The truck traffic travels on Route 18 from the New Jersey Turnpike to Interstate 287. Only the northbound structure was analyzed.
Figure 8. Route 18 over Albany Street Bridge
For the purpose of validating the FE results, in addition to the FE model, a monitoring program for both bridges was implemented by embedding various sensors in the concrete deck and steel girder. The sensors and monitoring program details are outlined below:
Route 18 Northbound Bridge Span

18
Concrete Deck Instrumentation Sensors were placed within the concrete deck prior to concrete placement to observe the strain and temperature variations using a vibrating wire strain gauge (VWSG). The sensors were connected to a data logger to record observations at 5-minute intervals. Manufactured by Geokon Incorporated, VWSGs were embedded into the concrete in a variety of structures including bridges. Their primary use is to measure the static stresses in concrete. VWSGs consist of a 6-in. metal tube with a fine metal wire contained within. A transducer, called a plucking coil, magnetically excites the wire causing it to vibrate. The amplitude of vibration, proportional to the elongation of the gage length, is converted to strain. A unique advantage of the VWSG technology is the ability to have long cables run without a loss of signal. Since the gauge operates on a frequency rather than resistance, the signal does not become sensitive to cable lengths up to 500 feet. Figure 9 illustrates the installation of the VWSG. The VWSGs were mounted onto epoxy-coated steel bars directly attached to the top layer of the deck reinforcement. The VWSG and an environmental sensor were connected to a CR10X model data-logger manufactured by Campbell Scientific. The logger is a portable, 12VDC battery operated unit that can collect data unattended for up to 4 weeks. For this study, the data was typically downloaded on a weekly basis and sampled at an interval of 5 minutes for the first 3 days, then recalibrated to record at one-hour intervals to reduce data backlog. The system is limited in that it cannot be used to measure dynamic strains. Figure 10 and Figure 11 illustrate the concrete deck strain and temperature obtained from the VWSG and temperature sensors, respectively. Figure 10 reveals that the middle portion of the bridge has cracked, as the strain obtained from the VWSG exceeded the cracking strain. The cracking strain was determined through the splitting tensile tests in the laboratory. This data is then programmed into the FE model to improve the transverse cracking and composite analyzes (Figure 12).

19
Figure 9. Vibrating wire strain gage installation
Figure 10. Concrete deck strains on Route 18 Bridge over Albany Street
(refer to Figure 8 for sensor location)
-300.0
-200.0
-100.0
0.0
100.0
200.0
300.0
400.0
0 6 12 18 24 30
Albany Street Bridge - Deck Strains
Sensor 1Sensor 2
Sensor 3Sensor 4
Str
ain
()
Time (Days)
Cracking Strain

20
Figure 11. Concrete deck temperature on Route 18 Bridge over Albany Street (refer to Figure 8 for sensor location)
Figure 12. Importing field data in the FE model
50.0
60.0
70.0
80.0
90.0
100.0
110.0
120.0
0 2 4 6 8 10
Albany Street Bridge Deck Temperatures
Sensor 1Sensor 2Sensor 3Sensor 4
Tem
per
atu
re (
0F
)
Time (Days)
Peak temperature at 12 hours
50.0
60.0
70.0
80.0
90.0
100.0
110.0
120.0
0 6 12 18 24 30
Albany Street Bridge Deck Temperatures
Sensor 1Sensor 2Sensor 3Sensor 4
Temperature (
0F)
Time (Days)
Peak temperature at 12 hours
Tem
per
atu
re (
oF
)
-100
-50
0
50
100
150
0 5 10 15 20 25
Standard Rebar LayoutModified Rebar Layout
Concrete Deck Strain (
)
Time (Days)

21
Steel Girder The Structural Testing System (STS), shown in Figure 13, is a modular data acquisition system manufactured by Bridge Diagnostics, Inc., of Boulder, Colorado. The system consists of strain transducers and a main processing unit that samples data. The strain transducers (Figure 14) are mounted to structural elements with clamps or bolted to tabs that have been epoxied. Each sensor has a unique identification number and a microchip that allows it to be recognized and located within the system. The main advantage of the STS system is its random wiring capability. Sensors can be moved and then instantly identified within the system independent of the channel number. The STS system is programmed and controlled with a notebook computer.
The strain transducers read strain with a full Wheatstone bridge configuration. They are ruggedized within an aluminum case. Connection to the STS junction boxes is made with an Amphenol military grade connector with an embedded ID chip.
Figure 13. Structural testing system by Bridge Diagnostics Inc.
Figure 14. Strain transducer clamped to a stringer at the Pearl Harbor Memorial Bridge

22
Laboratory Testing of Concrete Mixes
The material properties, specifically pertaining to the concrete deck, are needed for calibrating the 3-D FE model. Several tests were performed in the laboratory at different ages in accordance with the ASTM Standards. Planned testing times were 1, 3, 7, 14, 28 and 56 days. However, to understand the properties of the mix in the first 24 hours, early-age testing was conducted at 8 and 12 hours. At 6 hours it was recognized that the concrete had not fully set, making it unable to sustain any load. The tests are described below:
Compressive Strength Test The compression test was performed in accordance with ASTM C39 using the Forney-1 million pound compression machine (Figure 15). The machine is equipped with three dial indicators used for different loading ranges.
Figure 15. Forney 1 million pound compression machine
Splitting Tensile Strength Test Splitting tensile strength is determined by splitting a 4 X 8-in. cylinder in accordance with ASTM C496 using the 400-kip Tinius Olsen Compression machine (Figure 16). The Tinius Olsen Compression machine is used because of its longer head extension capability than the Forney 1-million pound compression machine.

23
Figure 16. Splitting tensile strength test setup In addition to these standard tests, the restrained shrinkage test was also conducted on the Route 18 Bridge. The restrained shrinkage test setup is based on the modified AASHTO PP34 test methodology. Figure 6 shows a schematic diagram and picture of the AASHTO PP34 test setup, wherein the concrete ring is cast around the steel ring. The steel ring has an inner diameter of 11-in., an outer diameter of 12-in, and a height of 6 inches. The concrete wall thickness is 3 inches. The concrete is cast around the steel ring, such that when the concrete shrinks, a compressive stress is developed in the steel ring and balanced by a tensile stress in the concrete ring. If this tensile stress is greater than the ultimate tensile stress of the concrete, it cracks. The cracks in the ring are monitored daily using a crack microscope. In addition, four foil strain gauges (FSG) are instrumented at mid-height of the inner surface of the steel ring (Figure 6a) so that abrupt changes in the steel strain can signal the time of cracking. The strain readings are recorded using a data acquisition system. Moreover, an arrangement of vibrating wire strain gages (VWSGs) is installed at the top surface of the concrete ring using bolts. Figure 17 illustrates the specimens taken at the field during the casting of the concrete deck of the Route 18 Bridge. As mentioned earlier, detailed mechanical properties of the Route 18 Bridge was obtained from tests performed on specimens collected from the field. For the Doremus Avenue Bridge, the compressive strength, early-age compressive strength, tensile splitting, modulus elasticity, and shrinkage properties were obtained to determine the causality of transverse deck cracking and calibrating the FE model. The restrained shrinkage test results for the Route 18 Bridge are shown in Figure 18. The cracking capacity denotes the strain obtained from the splitting tensile test. Because concrete is a heterogeneous material, the VWSG curves in the figures do not have the same strain level. Therefore, the concrete will not have uniform shrinkage throughout the restrained ring. The concrete cracking date can be observed in these figures by the VWSG curve. If the VWSG curve crosses the cracking capacity, the concrete cracks. Thus, it is observed that the Route 18 Bridge has a higher potential to cracking. These properties

24
are then incorporated into the FE model to improve the accuracy of the model (Figure 19).
Figure 17. Sampling of concrete specimens at Route 18 Bridge over Albany Street Model Validation To perform the parametric study, the FE model was calibrated and validated using the field testing results. Both static and dynamic load tests were performed on the bridge using a 3-axle dump truck with gross vehicle weight (GVW) of 67,600 lbs moving at various speeds. The truck was positioned at various locations to maximize the moment on the interior girder. Figure 20 illustrates the comparison of the static load test of the 3-axles dump truck with FE model for the Route 18 Bridge over Albany Street. In Figure 20, the actual test data is denoted by ―EXP‖ and represented with a red solid line, whereas the FE model is denoted as ―FEM‖ and blue dashed line. All strain gauges were installed at the bottom flange of the girder at the position of maximum moment. Overall, the FE model correlated well with variations within 10% of the field test values. The reason for the variation is assumed to be due to the uneven load distribution of the truck‘s wheels. In addition to the static and dynamic tests, the concrete deck strains were also compared to the FE model. Figure 21 illustrates the comparison of the concrete deck strain obtained from the field test results with the FE model. On average, the FE model accurately predicted the shrinkage strain of the concrete deck.

25
(a)
(b)
Figure 18. Restrained shrinkage results for Route 18 Bridge over Albany Street: (a) Test
Ring 1, and (b) Test Ring 2
-400
-200
0
200
400
600
0 24 48 72 96 120
VWSG 1VWSG 2VWSG 3VWSG 4VWSG 5VWSG 6Cracking Strain
Str
ain
in
Con
cret
e ()
Time (Days)
Cracked at day 10
-600
-400
-200
0
200
400
0 24 48 72 96 120
VWSG 1VWSG 2VWSG 3VWSG 4VWSG 5VWSG 6Cracking Strain
Str
ain
in
Con
cret
e ()
Time (Days)
Cracked at day 9

26
Figure 19. Incorporating the material properties into the FE Model
-1000
-800
-600
-400
-200
0
200
0 8 16 24 32 40 48 56
Mod
ulu
s o
f E
lasticity (
ksi)
Time (Days)
Dry
ing
Sh
rinka
ge
(m
icro
str
ain
)
0
1000
2000
3000
4000
5000
6000
0 8 16 24 32 40 48 56
Com
pre
ssiv
e S
tren
gth
(p
si)
Time (Days)
0
1000
2000
3000
4000
5000
6000
0 8 16 24 32 40 48 56
Mod
ulu
s o
f E
lasticity (
ksi)
Time (Days)

27
(a)
(b)
Figure 20. Comparison of results between FE model and field test results of (a)
Doremus Avenue, and (b) Route 18 over Albany Street

28
Figure 21. Comparison of the FE Model and field test of Route 18 over Albany Street concrete deck strains
-200
-150
-100
-50
0
50
0 5 10 15 20 25
Field DataFE Model
Concrete Deck Strain (
)
Time (Days)
-250
-200
-150
-100
-50
0
50
0 5 10 15 20 25
Field DataFE Model
Concrete Deck Strain (
)
Time (Days)
Con
cre
te D
eck S
train
()
Con
cre
te D
eck S
train
()

29
FE Model Analysis Considering LRFD Composite Action Requirements After the 3-D FE models were developed and validated for various bridges, various parametric studies of vehicular load simulation, rebar arrangement, the number of shear studs, and boundary conditions were conducted. Steel Reinforcement As stated earlier, the steel reinforcement was modeled using the embedded or rebar elements provided by ABAQUS. The rebar arrangement simulation was performed using both the truck load and time dependant simulation (creep and shrinkage). Figure 22 and Figure 23 show the deck cracking using the truck load simulation of a standard and modified rebar arrangement, respectively. The truck loads used in the simulation were two trucks traveling side-by-side. ―One truck‖ represents a 3-axle dump truck with a gross vehicle weight of 50 kips and the other a 5-axle truck with a gross vehicle weight of 80 kips. There are no significant changes between the two arrangements. It should be noted that in these two figures, the cracking strain is based on the early-age concrete. This also confirmed in the time dependent simulation, as shown in Figure 24 and Figure 25, where less than a 7.5 percent difference in the concrete strain was seen. The strain is more pronounced at the fixed end of the bridge span, as shown in Figure 25, where the FE model indicated a higher likelihood of deck cracking. It should be noted that while analyzing the modified reinforcing arrangement, it was determined that the moment capacity of the concrete deck may not meet the design requirement for transverse flexure. Hence, the rebar arrangement is not recommended due to the fact that the rebar has to first meet the strength requirements as a possible method of controlling bridge deck cracking. As for staggering of the rebar arrangement, there is no appreciable change in concrete strain based on the results of the FE model. Shear Stud Design Investigation It has been inferred that the concrete decks of modern composite bridges tend to crack more readily than with past-accepted practice. At an early stage of this project, the hypothesis was put forth that AASHTO LRFD specifies a significantly different number of shear connectors than had been used in past LFD designs. This possible difference in shear connectors was identified as a contributing factor to the concrete deck cracking phenomena noted in modern bridges. The study compares and contrasts the composite steel girder/concrete deck connectivity requirements set forth in both the current AASHTO LRFD Bridge Design Specifications, (with interim update revisions through 2006), and the AASHTO Standard Specifications for Highway Bridges in its final 17th edition published in 2002. This comparison was made to determine if code requirements, that determine the number of shear studs required for composite bridge action, had changed significantly between the former and current codes. The methodologies and results of this study are outlined below.

30
Figure 22. Effect of truck loading on concrete deck with standard rebars arrangement
Figure 23. Effect of truck loading on concrete deck with modified rebar arrangement

31
Figure 24. Effect of time dependent on concrete deck with different rebar arrangement
at midspan
Figure 25. Effect of time dependent on concrete deck with different rebar arrangement
at fixed end
-150
-100
-50
0
50
0 5 10 15 20 25
Standard Rebar LayoutModified Rebar Layout
Co
ncre
te D
eck S
train
()
Time (Days)
~7.5%
-100
-50
0
50
100
150
200
0 5 10 15 20 25
Standard Rebar LayoutModified Rebar Layout
Co
ncre
te D
eck S
train
()
Time (Days)
Cracking Strain

32
Methodology The study investigated multiple variables from current steel girder design practice in an attempt to identify possible discrepancies between past (ASD/LFD) and current (LRFD) design standards. For simplicity, only single-span bridges were investigated; as negative moment region connectivity within continuous spans rarely controls a bridge design. Typical design parameters, modified within the maximum practical envelopes, are listed: 1. Span Length – 30 ft to 200 ft 2. Girder Spacing – 6 ft to 16 ft 3. Girder Steel Type – 50 ksi to 100 ksi (homogenous and hybrid sections)
Deck thickness was considered not to be a driving variable. For the purposes of this study, deck design thickness was dictated by the NJDOT Bridges and Structures Design Manual in Subsection 20. These designs, based on girder spacing, were adhered to throughout the study exercises. For each design example comparison, the known variables were entered into a commercially available bridge girder design program. LFD designs were performed using the Pennsylvania DOT‘s bridge analysis and rating program (BAR7), while the LRFD designs were conducted using Pennsylvania DOT‘s LRFD steel girder, design, and rating program (STLRFD). The programs were used to find the most efficient steel girder section for each set of variables, under each design method. The girder sections did not precisely correlate between identical variable sets for the two design methodologies. This was done intentionally to achieve results that would more accurately simulate actual designs encountered in the production bridges. It was assumed that an engineer would design for the most efficient structure given the methodology and materials to be used. In short, the goal was to achieve the most realistic representation of shear stud design on current and past-practice bridges. Each shear stud design output was verified against hand calculations and Excel spreadsheets, following the procedures and formulae set forth in both the AASHTO published codes. LFD based designs adhered to section 10.38.2 of the Standard Specifications for Highway Bridges and LRFD based designs adhered to section 6.10.10 of the LRFD Bridge Design Specifications. Both design methodologies are derived from basic shear flow relationships, which equate vertical shear on the beam element with the static moment of the short-term concrete about the neutral axis of the overall composite section. The horizontal shear determined from this relationship is used to determine the number of shear studs required to resist the incurred forces. Both LFD and LRFD methods determine a stress range limit for each shear stud based on fatigue criteria linked to the overall number of expected live load cycles over the life of the bridge. The LFD code states that 2,000,000 (2M) cycles is considered ‗infinite‘ in terms of fatigue life. The LRFD code is based on expected bridge life spans of 75 years. The total number of fatigue cycles to be experienced by the bridge over its lifetime is

33
determined from the highway classification of the road, as described in section 3.6.1.4 of the LRFD code. While the total number of cycles in this method can exceed 16M, the final equations used to determine the stress range of a single shear stud often produced results similar to the LFD code. Of the 24 designs covered under the scope of this study, shear stud requirements were noted to be similar between LRFD and LFD designs. The minimum difference between the two concurrent designs was 0 percent, while the maximum difference was 21.1 percent. The average difference was 13.3 percent. While these variations assert that the LRFD designs almost invariably require less shear studs than comparable LFD designs, the actual reduction percentage is relatively small. It should be noted that the discrepancies between LFD and LRFD shear stud requirements can at least be partially attributed to the different methods by which each code computes the effective flange width of the composite section. The LFD code in section 10.38.3 stipulates that the effective flange width shall not exceed the following: one forth the span length of the girder, the center-to-center spacing of the girders, or twelve times the least thickness of the concrete slab. However, the LRFD code in section 4.6.2.6 stipulates that the effective flange width is defined as the center-to-center spacing of the girders alone. While this may seem to be a minor difference, it will result in a larger concrete flange moment of inertia, which will effectively reduce the overall number of required shear studs in the final design of the composite girder. Figure 26 illustrates the variation between LFD and LRFD methodologies when computing the number of shear studs required for composite interaction between a steel beam element and a concrete deck element. Table 4 summarizes the legend used in the chart to denote different bridges used in the analysis. Figure 26 demonstrates that the LRFD designed beams typically had less shear studs than the parallel LFD design. The effect of shear stud restraint within the deck was simulated in the model by analyzing the concrete deck strain with varying amounts of shear studs along the top of the beam element. As a baseline example case, the maximum number of shear studs determined to be used in a typical bridge structure was entered into the model. Then, the overall number of shear studs was reduced on a percentage basis to ascertain if a reduced internal restraint condition would alter or otherwise reduce the strains experienced by the deck concrete. Several cases were studied; i.e., 50%, 75%, and 100% of the total possible shear stud arrangement. As shown earlier, Figure 4 illustrates the shear stud arrangement in the FE model. Similarly, the FE model was subjected to both loading (Figure 27) and time dependent (Figure 28) simulations. In both cases, there was no effect of the shear studs on the concrete strain. From these results, it is concluded that reducing or increasing the quantity of shear studs present in

34
a composite girder design have little, if any, impact in eliminating early cracking of deck concrete.
Table 4 - Legend for shear stud comparison chart summary
Combination Type: Strength (ksi) - Girder Spacing (ft) - Span Length (ft)
Hybrid Sections: Top Fig. - Web - Bottom Fig. (ksi)
HYB1 70 -50-70
(70 ksi top flange – 50 ksi web – 70 ksi bottom flange)
HYB2 100-50-100
(100 ksi top flange – 50 ksi web – 100 ksi bottom flange)
HYB3 100-70-100
(100 ksi top flange – 70 ksi web – 100 ksi bottom flange)
LEGEND EXAMPLE1: HYB1-8-60 70 ksi top flange, 50 ksi web, 70 ksi bottom flange, 8‘-0‖ center-to-center girder spacing, span length of 60‘-0‖ LEGEND EXAMPLE2: 50-10-90 homogeneous 50 ksi plate girder, 10‘-0‖ center-to-center girder spacing, span length of 90‘-0‖ Boundary Condition The boundary condition of the FE model was changed to simulate various bridge bearing and span continuity conditions using: (1) pin-roller, (2) pin-pin, (3) fixed-roller, (4) fixed-pin, and (5) fixed-fixed. This was done to determine if the end restrains have the most influence over any possible restraint introduced by either the rebar or shear studs. Figure 29 illustrates the effect of the above noted boundary condition at the end of the span. The fixed-end seems to provide the most restraint, and can be a possible source of transverse deck cracking. This would imply that integral abutment bridges are more likely to have transverse cracking problems than simple-span bridges. This boundary condition was expanded to include the inherent fixity of a continuous span superstructure as it passes over a pier. Figure 30 illustrates the concrete deck strain at various positions on a 2-span continuous span bridge. It shows that the concrete deck above the pier is more susceptible to transverse cracking. Thus, there is a need to mitigate cracking over the pier location. For example, this can be addressed by eliminating the composite behavior of the deck in this area. Ideally, this would be done by reducing or eliminating the shear studs, and possibly even using a bond-breaker to prevent interaction between the deck and the girder. It may be possible to back-calculate a sufficient length of debondment to obtain a length of concrete deck that can handle the bending stresses without cracking. However, this issue has a widespread implication on the AASHTO specifications and would impact other aspects of composite design including deflection analysis.

35
Figure 26. Comparison of the number of shear studs using LFD and LRFD provisions

36
Figure 27. Effect of shear stud percentages on concrete deck strain using load
simulation
Figure 28. Effect of shear stud percentages on concrete deck strain using time
dependant simulation
-200
-150
-100
-50
0
50
100
0 5 10 15 20 25
100% Shear Stud75% Shear Stud50% Shear Stud
Co
ncre
te D
eck S
train
()
Time (Days)
0
5
10
15
20
25
30
0 100 200 300 400
100 % Shear Studs75 %50 %
Ten
sile
Str
ain
()
Distance (ft)
% Diff.Max Tensile
StrainShear Studs
--12.96100 %
0.613.0475 %
7.013.8750 %

37
FE Analysis with NJDOT Deflection Requirements The NJDOT deflection requirements were investigated using the Doremus Avenue Bridge FE model by altering the girder geometry and material properties, while maintaining the bridge capacity. In other words, if the yield strength of the I-girder was increased from 50 ksi to 70 ksi, the moment of inertia should be reduced by approximately 70 percent. Thus, the bridge becomes more flexible, not meeting the NJDOT deflection requirements. Both homogenous and hybrid I-girder section properties were investigated. The steel properties of the I-girder used for the homogenous bridge designs were Grades 50, 70, and 100. For the hybrid bridge designs, the section properties of the web were maintained constant using Grade 50 steel, while the section properties of the top and bottom flanges were altered to Grades 70 and 100.
Figure 31 and Figure 32 illustrate the concrete deck strains for the homogenous and hybrid bridge designs, respectively. The bridge was loaded with two trucks side-by-side, where one truck is a 50 kips, 3-axle dump truck and the other is a 80 kips, 5-axle truck. It is observed that the tensile strains of concrete increase as the steel I-girders become more flexible. For homogenous and hybrid bridges, the maximum increases in tensile strain are approximately 123 percent and 145 percent, respectively. Although the strains did not exceed the cracking strength of the concrete deck, it is recommended that NJDOT retain and maintain its deflection requirements of L/1000 (or at a minimum L/800) when using high-strength steel to control bridge deck flexibility. FE Analysis Considering NJDOT “Class A” Concrete The concrete strength, or more specifically the difference in concrete properties between ―Class A‖ and high-performance concrete, was evaluated. Various concrete properties, such as shrinkage at different ages, can occur either at early or later ages. The following section highlights the concrete properties and parameters that were investigated and modeled in the 3-D FE model. Figure 33 and Figure 34 illustrate the comparison of bridge deck with various compressive strengths. There were small changes in the concrete deck strain in comparison to the compressive strength. Thus, the average 28-day compressive strength does not exacerbate deck cracking. However, it should be noted that the compressive strength at early age does play an important role, especially when the bridge is open to traffic in the adjacent lanes. For this case, the higher-early compressive strength is desired because it will give the deck higher tensile strength.

38
Figure 29. Effect of boundary condition on the concrete deck strain at the end of the span
Figure 30. Concrete deck strain at various positions on a 2-span continuous bridge
-200
-150
-100
-50
0
50
100
150
200
0 5 10 15 20 25
Pin-RollerPin-PinFix-Roller
Fix-PinFix-Fix
Co
ncre
te D
eck S
train
()
Time (Days)
Cracking Strain
-400
-300
-200
-100
0
100
200
300
0 5 10 15 20 25
Pin EndMid Span 1Pier 1
Mid Span 2Roller End
Co
ncre
te D
eck S
train
()
Time (Days)
Cracking Strain
39
Figure 31. Effect of homogenous sectional properties on concrete deck strains
Figure 32. Effect of hybrid sectional properties on concrete deck strains
0
5
10
15
20
25
30
0 100 200 300 400 500
50 ksi
70 ksi
100 ksi
Ten
sile
Str
ain
()
Distance (ft)
-5
0
5
10
15
20
25
30
35
0 100 200 300 400 500
50-50-50 ksi
70-50-70 ksi
100-50-100 ksi
Ten
sile
Str
ain
()
Distance (ft)

40
Figure 33. Effect of concrete compressive strength on the concrete deck strain for simply supported bridge (i.e., one end is pinned and one end is on a roller)
Figure 34. Effect of concrete compressive strength on the cracking concrete strain
under restrained condition (i.e., one end is fixed and one end is on a roller)
-150
-100
-50
0
50
0 5 10 15 20 25
4 ksi5 ksi6 ksi7 ksiC
oncre
te D
eck S
train
()
Time (Days)
~28%
-50
0
50
100
150
200
0 5 10 15 20 25
4 ksi7 ksi
Co
ncre
te D
eck S
train
()
Time (Days)
Cracking Strain

41
CONCLUSIONS AND RECOMMENDATIONS The following conclusions and recommendation are made from this study: 1. The LRFD Specifications do not require higher number of shear studs in
comparison to LFD Specifications.
2. Shear studs, design strength, and rebar locations do not contribute to bridge deck cracking.
3. There is a higher potential for cracking at the end restraints, specifically at the fixed end and bridge piers for simple and continuous spans, respectively.
4. For existing bridges that are in need of deck replacement, there is a high potential for cracking in the fresh concrete deck due to truck loads traveling in adjacent lanes. In some cases, depending on the concrete pouring sequence and live load effects from adjacent lanes, the concrete deck will undergo tensile stresses that can be larger than the early-age (5-8 hours) tensile strength. Removing any chemicals used in the concrete mix that has any retarding effects on the concrete chemical reaction and bond development especially at early ages can alleviate bridge deck cracking.
5. In staged replacement (no adjacent truck) or new deck construction, the concrete cracking can be attributed to three important factors: (1) concrete shrinkage, (2) thermal loads, and (3) preliminary construction loads. Bridge designers should take all three effects into account to ensure that the concrete deck will not crack.
6. The NJDOT deflection requirements should be retained at a minimum of
L
800 to
control the bridge deck flexibility (and thus any increase in concrete strains) when higher strength steel, i.e., Grade 70 and 100, is used.

42
REFERENCES 1. AASHTO (1998), AASHTO LRFD Bridge Design Specification for Highway
Bridges, 2nd Edition, Washington D.C. 2. AASHTO (2005), ―Standard Specifications for Transportation Materials and
Methods of Sampling and Testing,‖ 25th Edition, Washington, D.C. 3. ABAQUS Version 6.6 Documentation (2005) 4. ABAQUS, Inc. (2004), ABAQUS Version 6.5 Documentation 5. ACI Committee 209 (1998), Prediction of creep, shrinkage and temperature
effects in concrete structures. Report No. ACI 209 R-92, American Concrete Institute, Farmington Hills, Michigan, 47 pp.
6. Aktan, H., Fu, G., Dekelbab, W., and Attanayaka, U. (2003) ―Investigate Causes & Develop Methods to Minimize Early-Age Deck Cracking on Michigan Bridge Decks‖ MDOT Report RC-1437, p. 238.
7. American Association of State Highway and Transportation Officials (AASHTO, 1996), AASHTO Standard Specification for Highway Bridges, 16th Edition, Washington D.C.
8. American Association of State Highway and Transportation Officials (AASHTO, 2004), AASHTO LRFD Bridge Design Specification for Highway Bridges, 3rd Edition, Washington D.C.
9. ASCE, 2005 Report Card for American Infrastructure, Website Source: http://www.asce.org/reportcard/2005/index.cfm.
10. Babaei, K. and Purvis, R.L. (1995) ―Report on Observations of Bridge Deck Construction and Concrete Shrinkage Measurements in the Field,‖ research project No. 89-01, PennDOT, August.
11. Comité Européen de Normalisation (CEN, 2005), Eurocode 2: Design of Concrete Structures, EN-1992-2:2005 (E), Brussel, Belgium.
12. FHWA,. ―The State of the Nation's Highway and Bridges: Condition and Performance and Highway Bridge Replacement and Rehabilitation Program,‖ Federal highway Administration, U.S. Department of Transportation, Washington D.C., 2004.
13. Gindy and Nassif (in print). ―Application of Extreme Value Theory for the Prediction of Maximum Bridge Live Load Effects,‖ 9th International Conference on Structural Safety and Reliability.
14. Hadidi, R. and Saadeghvaziri, M. A. (2005) ―Transverse Deck Cracking of Concrete Bridge Decks: State-of-the-Art‖ ASCE Journal of Bridge Engineering, Vol. 10, No. 5, Sept., pp. 503-510.
15. Hadidi, R. and Saadeghvaziri, M. A., and Hsu, C. T. (2003) ―Practical Tool to Accurately Estimate Tensile Stresses in Concrete Bridge Decks to Control Transverse Cracking‖ ASCE Journal of Bridge Engineering, Vol. 8, No. 2, May, pp. 74-82.
16. Issa, Mohsen A. "Investigation of Cracking in Concrete Bridge Decks at Early Ages,‖ ASCE Journal of Bridge Engineering, Vol. 4, No. 2, May, pp. 116-124
17. Krauss, P.D., and Rogalla, E.A., ―Transverse Cracking in Newly Constructed Bridge Decks,‖ NCHRP Report 380, Transportation Research Board, National Research Council, Washington, D.C., 1996, p. 126.

43
18. Lane, D.S. (1994) ―Investigation of Bridge Deck Cracking on I-95 North-bound over Powell Creek,‖ Rep., Virginia Transportation and Research Council, Charlottesville, VA, 11.
19. Nassif, H. Abu-Amra, T., and El-Tawil, S. (2005) ―Development of Effective Flange Width Criteria for Steel Girder bridges,‖ Proceedings of the Transportation Research Board, Washington, D.C. (on CD)
20. Nassif, H. H. and Liu, M. (2004). "Analytical Modeling of Bridge-Road-Vehicle Dynamic Interaction System," Journal of Vibration and Control, Vol. 10, pp. 215-241.
21. Nassif, H. H., and Suksawang, N., ―Development of High-Performance Concrete for Transportation Structures in New Jersey,‖ FHWA NJ 2003-06, Final Report Submitted to NJDOT Research Bureau, August 2003, p. 123.
22. Nassif, H. H., Liu, M. and Ertekin, O. (2003). "Model Validation for Bridge-Road-Vehicle Dynamic Interaction System," Journal of Bridge Engineering, Vol. 8, No. 2, pp.112-120.
23. Nassif, H. H., Suksawang, N., Mohammed, M., ―Effect of Curing Methods on Early-Age and Drying Shrinkage of High-Performance Concrete,‖ Transportation Research Record: Journal of the Transportation Research Board, No. 1834, TRB, National Research Council, Washington, D.C., 2003, pp. 48-58.
24. Nassif, H., Gindy, M. and Davis, J. (2005) ―Comparison of Laser Doppler Vibrometer with Contact Sensors for Monitoring Bridge Deflection and Vibration,‖ Non-Destructive Testing and Evaluation International Journal, Vol. 38/3, pp. 213-218.
25. Nassif, H.H., Suksawang, N., Gindy, M., Abu-Amra, T., Davis, J. (2003) ―Instrumentation and Field Testing of the Doremus Avenue Bridge,‖ Transportation Research Board, Proceedings of the 82nd Annual Meetings, Washington, D.C., January 12-17 (on CD).
26. Nowak, A. S. and Collins, K. R. (2000). "Reliability of Structures". McGraw Hill Companies, Inc.
27. Nowak, A. S. and Hong, Y. K. (1991). ―Bridge Live-Load Models," Journal of Structural Engineering, Vol. 117, No. 9, pp. 2757-2767.
28. Petrou, M. (1999) ―Review of Class E Concrete Mix used in Bridge Decks in South Carolina,‖ South Carolina DOT, Report Number FHWA-SC-99-06, December.
29. Prenger, H.B. 91992), ―Bridge Deck Cracking, Research Report,‖ rep. No. MD-93-04, Maryland Dept. of Transportation, State Highway Administration, Baltimore, Md., 19.
30. Roeder, C. W., Barth, K. and Bergman, A. (2002). "Improved Live Load Deflection Criteria for Steel Bridges," NCHRP Project 20-7[133], Final Report, November 2002.
31. Saadeghvaziri, M. A. and Hadidi, R. (2002) ―Cause and Control of Transverse Cracking in Concrete Bridge Decks‖ NJDOT Report FHWA-NJ-2002-19, p. 203.
32. Saadeghvaziri, M. A. and Hadidi, R. (2005) ―Transverse Deck Cracking of Concrete Bridge Decks: Effect of Design Factor‖ ASCE Journal of Bridge Engineering, Vol. 10, No. 5, Sept., pp. 511-519

44
33. Salmon, C. G., Johnson, J. E. (1997) ―Steel Structures, Design and Behavior,‖ Fourth 4 Edition, Prentice Hall, Upper Saddle River, NJ, p. 1024.
34. Schmitt, T.R., and Darwin, D. (1995), ―Cracking in Concrete Bridge Decks, Report K-TRAN,‖ Rep. No. Ku-94-1, Cooperative Transportation Research Program Between Kansas Dept. of Transp., Kansas State University, and University of Kansas, Lawrence, Kan., 151.
35. Suksawang, N., and Nassif, H.H., Effect of Modulus of Elasticity on Creep Prediction of High Strength Concrete Containing Pozzolans, Shrinkage and Creep of Concrete, ACI, SP-227, Farmington Hills, M.I., 2005, pp. 261-284.
36. Suksawang, N., Nassif, H.H. (2005) ―Evaluation Live-Load Distribution Factor for a Three-Span Continuous Girder Bridge,‖ 2005 New York City Bridge Conference, New York, NY, September 12-13 (on CD).
37. Suksawang, N., Nassif, H.H., and Sanders, M. (2006) ―Analysis of Ferrocement-Laminated Concrete Beams,‖ Ferrocement and Thin Reinforced Cement Composites (Ferro-8), Bangkok, Thailand, February 6-8.
38. Xi Y., Shing, B., Abu-Hejleh, N., Asiz, A., Suwito, A., Xie, Z., and Ababneh, A. (2003) ―Assessment of the Cracking Problem in Newly Constructed Bridge Decks in Colorado‖ CDOT Report CDOT-DTD-R-2003-3, p. 136.

45
APPENDIX A: SAMPLE CALCULATION
Made by RjS Date 1.7.8 Job Number
43794
Checked by Date T h e H N T B C o m p a n i e s Sheet Number
For Shear Stud Requirements Backchecked by Date 1
100' Span with 30" web
C:\Documents and Settings\suksawan\My Documents\Rutgers\[Shear Stud Reqs.xls]100' span 30" web
Load Factor Shear Stud Requirements (AASHTO 10.38.5)
Sr = VrQ/I (AASHTO Eq. 10-58) I1n 41797 in^4
From BAR7 Program Output (LFD-100-30.out)
Span Loc. V DL2 V LL+I Q Sr studs/row Zr Comp spa. Max Spa. Tot. Studs
0.0 Ft. 0.0 K 70.5 K 1084.8 in^3 1.8 K/in 4 5500 lbs 12.0 in 12.0 in 44
10.0 Ft. -2.8 K 51.5 K 1084.8 in^3 1.4 K/in 4 5500 lbs 15.6 in 15.6 in 36
20.0 Ft. -7.5 K 45.6 K 1084.8 in^3 1.4 K/in 4 5500 lbs 16.0 in 16.0 in 36
30.0 Ft. -13.5 K 39.5 K 1084.8 in^3 1.4 K/in 4 5500 lbs 16.0 in 16.0 in 36
40.0 Ft. -20.2 K 33.4 K 1084.8 in^3 1.4 K/in 4 5500 lbs 15.8 in 15.8 in 36
50.0 Ft. -27.1 K 27.1 K 1084.8 in^3 1.4 K/in 4 5500 lbs 15.6 in 15.6 in ---
Total 376
LRFD Shear Stud Requirements (AASHTO 6.10.10)
P < nZr/Vsr (AASHTO Eq. 10.10.1.2-1) I1n 42452 in^4
Vfat = VfQ/I (AASHTO Eq. 10.10.1.2-3)
Zr = 5.5d2/2 (AASHTO Eq, 6.10.10.2-1)
From STLRFD Program Output (LRFD-100-30.out)
Span Loc. -V LL+I +V LL+I Q Vfat n Zr Comp spa. Max Spa. Tot. Studs
0.0 Ft. 0.0 K 40.6 K 1108.8 in^3 0.8 K/in 4 2.75 K 13.8 in 13.8 in 40
10.0 Ft. -2.2 K 35.7 K 1108.8 in^3 0.7 K/in 4 2.75 K 14.8 in 14.8 in 40
20.0 Ft. -4.8 K 30.7 K 1108.8 in^3 0.7 K/in 4 2.75 K 15.8 in 15.8 in 36
30.0 Ft. -7.5 K 25.7 K 1108.8 in^3 0.7 K/in 4 2.75 K 16.9 in 16.9 in 36
40.0 Ft. -11.0 K 20.8 K 1108.8 in^3 0.6 K/in 4 2.75 K 17.7 in 17.7 in 32
50.0 Ft. -15.8 K 15.8 K 1108.8 in^3 0.6 K/in 4 2.75 K 17.8 in 17.8 in ---
Total 368
Difference between LFD and LRFD = -2.1%

46
Made by RjS Date 1.7.8 Job Number
43794
Checked by Date T h e H N T B C o m p a n i e s Sheet Number
For Shear Stud Requirements Backchecked by Date 1
100' Span with 60" web
C:\Documents and Settings\suksawan\My Documents\Rutgers\[Shear Stud Reqs.xls]100' span 30" web
Load Factor Shear Stud Requirements (AASHTO 10.38.5)
Sr = VrQ/I (AASHTO Eq. 10-58) I1n 91247 in^4
From BAR7 Program Output (LFD-100-60.out)
Span Loc. -V LL+I +V LL+I Q Sr studs/row Zr Comp spa. Max Spa. Tot. Studs
0.0 Ft. 0.0 K 70.5 K 1429.5 in^3 1.1 K/in 4 5500 lbs 19.9 in 19.9 in 32
10.0 Ft. -2.8 K 51.5 K 1429.5 in^3 0.9 K/in 4 5500 lbs 25.9 in 24 24
20.0 Ft. -7.5 K 45.6 K 1429.5 in^3 0.8 K/in 4 5500 lbs 26.4 in 24 24
30.0 Ft. -13.5 K 39.5 K 1429.5 in^3 0.8 K/in 4 5500 lbs 26.5 in 24 24
40.0 Ft. -20.2 K 33.4 K 1429.5 in^3 0.8 K/in 4 5500 lbs 26.2 in 24 24
50.0 Ft. -27.1 K 27.1 K 1429.5 in^3 0.8 K/in 4 5500 lbs 25.9 in 24 ---
Total 256
LRFD Shear Stud Requirements (AASHTO 6.10.10)
P < nZr/Vsr (AASHTO Eq. 10.10.1.2-1) I1n 92355 in^4
Vfat = VfQ/I (AASHTO Eq. 10.10.1.2-3)
Zr = 5.5d2/2 (AASHTO Eq, 6.10.10.2-1)
From STLRFD Program Output (LRFD-100-60.out)
Span Loc. -V LL+I +V LL+I Q Vfat n Zr Comp spa. Max Spa. Tot. Studs
0.0 Ft. 0.0 K 40.6 K 1459.2 in^3 0.48 K/in 4 2.75 K 22.8 in 22.8 in 28
10.0 Ft. -2.2 K 35.7 K 1459.2 in^3 0.45 K/in 4 2.75 K 24.5 in 24 24
20.0 Ft. -4.8 K 30.7 K 1459.2 in^3 0.42 K/in 4 2.75 K 26.2 in 24 24
30.0 Ft. -7.5 K 25.7 K 1459.2 in^3 0.39 K/in 4 2.75 K 27.9 in 24 24
40.0 Ft. -11.0 K 20.8 K 1459.2 in^3 0.38 K/in 4 2.75 K 29.2 in 24 24
50.0 Ft. -15.8 K 15.8 K 1459.2 in^3 0.37 K/in 4 2.75 K 29.4 in 24 ---
Total 248
Difference between LFD and LRFD = -3.1%