bricktech: assessment for the use of waste in the …hera.ugr.es/tesisugr/26442176.pdf ·...
TRANSCRIPT
Dipartimento di Geoscienze dell’Università di Padova
Departamento de Mineralogía y Petrología de la Universidad de Granada
Scienze della Terra
Via Gradengino 6,
35131, Padova, Italia
Ciencias de la Tierra
Avenida Fuentenueva
s/n 18002 Granada, España
BRICKTECH: Assessment for the use of waste in the brick production.
Petrophysical characterization of new mix designs and optimization of the firing conditions
Directores: Ch.mo Prof. Claudio Mazzoli
Ch.mo Prof. Giuseppe Cultrone
Doctoranda: Chiara Coletti

Editor: Universidad de Granada. Tesis DoctoralesAutora: Chiara ColettiISBN: 9788491632009URI: http://hdl.handle.net/10481/46426
La doctoranda Chiara Coletti y los directores de la tesis Giuseppe Cultrone y Claudio
Mazzoli garantizamos, al firmar esta tesis doctoral, que el trabajo ha sido realizado por el
doctorando bajo la dirección de los directores de la tesis y hasta donde nuestro
conocimiento alcanza, en la realización del trabajo, se han respetado los derechos de
otros autores a ser citados, cuando se han utilizado sus resultados o publicaciones.
Granada, 16/02/2016
Director/es de la Tesis Doctorando
Fdo.: Giuseppe Cultrone Fdo.: Chiara Coletti
Fdo.: Claudio Mazzoli


INDEX

INDEX
RIASSUNTO iii
RESUMEN ix
ABSTRACT xv
CHAPTER I
Introduction
1. Introduction and objectives 3
References 7
CHAPTER II
Methods
1. Aesthetic qualities 13
1.1 Spectrophotometry 13
2. Chemical-mineralogical characterization 13
2.1 X-Ray Powder Diffraction (XRPD) 13
2.2 X-Ray Fluorescence (XRF) 13
2.3 Optical microscopy 14
2.4 Scanning Electron Microscopy (FESEM and SEM) 14
3. Porosity 14
3.1 Hydric test 14
3.2 Mercury Intrusion Porosimetry (MIP) 16
INDEX
3.3 Nitrogen adsorption 16
3.4 2D digital image analysis using SEM/BSE 17
3.5 3D digital image analysis using micro-computed tomography 18
4. Physical-Mechanical properties 19
4.1 Ultrasound test 19
4.2 Uniaxial compression test 20
4.3 Thermal behavior 20
5 Accelerated ageing tests 21
5.1 Freeze-thaw test 21
5.2 Salt crystallization test 21
5.3 Ultrasound monitoring during ageing test 22
5.4 Mercury Intrusion Porosimetry after ageing tests 22
References 22
CHAPTER III
Results
How to face the new industrial challenge of compatible,
sustainable brick production: study of various types
of commercially available bricks
Abstract 27
1. Introduction 27
2. Materials and methods 29
2.1 Raw materials and fired products 29
2.2 Analytical techniques 30
INDEX
3. Results 34
3.1 Raw clay materials and dye 34
3.2 Fired products 36
3.2.1 Mineralogy and texture 37
3.2.2 Water behavior and pore system 43
3.2.3 Compactness and durability 46
4. Conclusions 49
ACKNOWLEDGMENTS 50
References 50
CHAPTER IV
Results
Combined multi-analytical approach
for the study of the pore system of bricks:
how much porosity is there?
Abstract 57
1. Introduction 57
2. Sample material 59
3. Analytical techniques 60
3.1 Mercury Intrusion Porosimetry (MIP) 60
3.2 Hydric tests (HT) 61
3.3 Nitrogen Adsorption (NA) 62
3.4 2 D Digital Image Analysis of SEM backscattered electrons images 64
3.5 3D Digital Image Analysis Computerised X-ray micro-tomography 65
4. Results and discussion 66
4.1 MIP measurements vs. hydric properties 66
INDEX
4.2 Nitrogen adsorption behavior 69
4.3 2D imaging processing 70
4.4 3D imaging processing 73
4.5 Comparing techniques and the “overlap” method 80
5. Conclusions 84
Reference 86
CHAPTER V
Results
Recycling trachyte waste from quarry to brick industry:
petrophysical characterization
and durability of new ceramic products
Abstract 93
1. Introduction 93
2. Experimental procedure 95
2.1 Preparation of the samples 95
2.2 Analytical techniques 96
3. Results 98
3.1 Characterization of raw materials 98
3.2 Fired bricks 100
3.2.1 Mineralogical composition and microstructure 100
3.2.2 Porosity of fired bricks 107
3.2.3 Mechanical properties and durability of fired bricks 109
3.2.4 Thermal properties 113
INDEX
3.2.5 Colour 115
4. Conclusions 116
ACKNOWLEDGMENTS 117
References 119
CHAPTER VI
Results
Use of industrial ceramic sludge in the brick production:
effect on aesthetic quality and physical properties
Abstract 127
1. Introduction 127
2. Materials and methods 129
3. Results and discussion 131
3.1 Clay and recycled materials 131
3.2 Fired bricks 136
3.2.1 Colorimetry 136
3.2.2 Mineralogical composition 136
3.2.3 Texture 137
3.2.4 Hydric behavior and porosity 140
3.2.5 Physical-mechanical properties and durability 142
INDEX
4. Conclusions 145
ACKNOWLEDGMENTS 146
Reference 146
CHAPTER VII
Conclusions
1. Concluding remarks 151
2. Future lines of research 154
BRICKTECH:
Valutazione dell’utilizzo dei materiali di scarto nella produzione di laterizi.
Caratterizzazione petrofisica di nuovi mix design
e ottimizzazione delle condizioni di cottura.
RIASSUNTO

RIASSUNTO
iii
Il laterizio è un materiale della tradizione costruttiva dalle antiche origini, ma che può
rispondere alle importanti sfide verso cui la ricerca in ambito industriale è attualmente rivolta,
ossia il risparmio energetico, l’abbassamento di costi nella produzione e il miglioramento
delle qualità del prodotto finito. Inoltre, la crescente domanda di una produzione sostenibile
ha indirizzato la ricerca verso nuovi materiali che tengano conto della salvaguardia
dell’ambiente e del benessere della società.
Una delle strade percorribili per il raggiungimento di tali traguardi e che congiunge questi
diversi aspetti è l’ottimizzazione di nuovi mix design, utilizzando materiali di scarto, risultato
di attività industriali, urbane e di escavazione.
In questo modo il consolidamento di produzioni di tipo sostenibile ha un duplice valore in
quanto non solo determina la diminuzione dell’utilizzo di nuove geo-risorse, ma risolve anche
il problema dell’accumulo e della gestione dei rifiuti, rivalutandoli come fonte secondaria di
interesse per la realizzazione di nuovi materiali nel rispetto della tutela dell’ambiente.
Nonostante negli ultimi decenni siano stati numerosi gli studi effettuati per la realizzazione di
mattoni con materiali di riuso come risorse alternative e questi abbiano dimostrato una vasta
applicabilità nel settore del laterizio, l’implementazione in ambito industriale è ancora oggi
molto limitata, a causa della mancanza della compartecipazione tra ricerca accademica e le
reali necessità industriali, della scarsità di standard specifici di valutazione dei processi di
lavorazione e dei prodotti finiti e della limitata educazione pubblica rispetto alle possibili
frontiere sostenibili.
Un altro aspetto importante che deve essere considerato nella produzione di nuovi materiali è
quello del mantenimento delle caratteristiche estetiche del materiale tradizionale. Il mattone,
infatti, essendo un materiale da costruzione, deve rispondere a parametri di “compatibilità
culturale”, intesa come riconoscimento della identità territoriale di una comunità. Questo
aspetto ovviamente ha un valore ancor maggiore nel caso di materiali impiegati con funzione
di integrazione o sostituzione per il ripristino e/o restauro di edifici storici danneggiati.
Questo lavoro è, pertanto, rivolto a colmare la lacuna di uno scarso dialogo tra ricerca
accademica e sviluppo industriale, attraverso la stretta collaborazione tra università e industria
e il raggiungimento di obiettivi condivisi. Questo è stato possibile grazie all’affiancamento di
una ditta leader nel settore della produzione di laterizi tradizionali, la SanMarco-Terreal srl
(Noale, Italia), che ha apportato il suo contributo mettendo a servizio strumentazioni, materie
prime e la gran esperienza maturata in quest’ambito lavorativo. I prodotti sono stati sviluppati
RIASSUNTO
iv
in linea con gli obiettivi di Horizon 2020 (https://ec.europa.eu/programmes/horizon2020/),
soprattutto in termini di sfruttamento sostenibile delle risorse naturali, di miglioramento dei
processi di trasformazione delle materie prime, di riciclaggio e dell’ottimizzazione delle
condizioni di cottura, al fine di soddisfare i punti relativi all’eccellenza scientifica, alle sfide
per la società e alla leadership industriale.
Pertanto, lo studio è stato rivolto a:
1) mettere in relazione le caratteristiche mineralogiche e chimiche con le proprietà
meccaniche e la durabilità in diverse condizioni di stress di materiali già in commercio,
ottenuti da differenti argille e cotti a diverse temperature (600, 950, 980, 1050°C);
2) analizzare il sistema poroso di materiali industriali al fine di ottenerne una conoscenza
affidabile e completa come punto di partenza per definire un protocollo per la quantificazione
e la parametrizzazione delle caratteristiche morfologiche dei pori attraverso l'uso combinato
di metodi tradizionali e tecniche di elaborazione di immagine a seconda del tipo di materia
prima utilizzata e delle temperature di cottura raggiunte (600, 950, 1050°C);
3) sperimentare nuovi mix design ottenuti dall'aggiunta di rifiuti provenienti da attività di
estrazione di materiale lapideo e industriali per la produzione di nuovi mattoni basata sui
concetti di riciclo e di uso sostenibile delle risorse. Il tipo di materiali di ri-uso adottati nello
specifico sono stati: i) lo scarto di escavazione di trachite della cava di Rovolon, Colli
Euganei, Vicenza (Italia); ii) un fango refluo derivante dall’industria ceramica.
Lo studio dei mattoni commerciali ha confermato come le proprietà chimico-mineralogiche,
fisico-petrografiche, di porosità e di durabilità dei prodotti finiti siano strettamente dipendenti
dalla composizione delle materie prime e dalle temperature di cottura raggiunte durante il
processo di produzione. I risultati conseguiti dalle analisi dei mix design sperimentali hanno
dimostrato la possibilità di ottenere nuovi laterizi utilizzando materiale di scarto e di
implementare strategie industriali con soluzioni sostenibili e compatibili.
Più in dettaglio, i mattoni commerciali cotti a temperature superiori a 1050°C hanno mostrato
una maggiore evoluzione mineralogica, con la crescita di nuove fasi, e fusione della matrice,
con un conseguente miglioramento delle proprietà meccaniche. Al contrario il mattone cotto a
600°C si è distinto per un buon comportamento idrico, rilevandosi però il più debole durante i
cicli di invecchiamento accelerato, a causa della bassa compattezza, dovuta all’assenza di
vetrificazione nella matrice e alla bassa evoluzione di nuove fasi a tale temperatura. Inoltre, è
RIASSUNTO
v
stato osservato come l’hausmannite (Mn3O4) utilizzata come colorante, comporti cambiamenti
non solo sull’aspetto estetico del prodotto finito (determinando un colore grigio scuro), ma
agisca anche nelle sue proprietà meccaniche e nel sistema poroso promuovendo il processo di
fusione.
Lo studio dettagliato della porosità conseguito attraverso l’uso di differenti metodologie di
studio ha permesso da un lato di comprendere in maniera più approfondita i limiti di ogni
tecnica, dall’altro di conoscere il sistema poroso di ogni campione nella sua complessità. I
mattoni prodotti con argilla carbonatica sono caratterizzati da una maggiore porosità e
interconnessione dei pori, che derivano dalla decomposizione del carbonato durante il
processo di cottura. Nei mattoni cotti a temperature più alte (1050°C) è stato riscontrato lo
sviluppo della morfologia dei pori, che diventano più grandi e rotondi. Al contrario nel
mattone ottenuto con l’uso di una argilla meno carbonatica e cotto a 600°C, la porosità è
molto diversa, i pori sono meno omogenei e più piccoli.
Nella valutazione dell’influenza dell’utilizzo di materiale di scarto per la produzione di nuovi
laterizi, in entrambi i casi di studio i) l’aggiunta di trachite di escavazione (5, 10, 15% in
peso) e ii) l’aggiunta del fango ceramico (10% in peso) come inerte, i risultati sono stati
soddisfacenti al fine di identificare possibili “alternative sostenibili” ai mattoni attualmente in
commercio.
Si è visto come la presenza di feldspati alcalini nella trachite agiscono come agenti fondenti e
diminuiscono il punto di fusione. Questo effetto è stato osservato sotto differenti punti di
vista, dall’aumento della connessione tra i minerali, dalla crescente compattezza, dalla
maggiore evoluzione della tessitura e del sistema dei pori, tutte caratteristiche che si
sviluppano, non solo in corrispondenza dell’aumento della temperatura, ma anche
dell’aumento del contenuto di trachite. Inoltre, lo studio delle proprietà termiche, condotto
attraverso l’analisi di immagini infrarosse, ha evidenziato come il crescente contenuto di
trachite riduca la capacità di trasmissione di calore. Solo nel caso del mattone con 15% di
trachite e cotto alla temperatura di 1050°C è stata osservata una più rapida trasmissione di
calore, per l’alto livello di sinterizzazione raggiunto. In generale la buona risposta alle
condizioni di stress (gelo-disgelo e cristallizzazione di sali) e l’assenza di una forte differenza
tra i campioni hanno dimostrato che la trachite può essere considerata un inerte alternativo a
quello normalmente utilizzato che inoltre può recare vantaggi nella produzione, con risparmio
RIASSUNTO
vi
di energia e di costi, dal momento che agisce come fondente. Il suo impiego permette, infatti,
di ottenere mattoni cotti a 900°C (temperatura inferiore a quella attualmente utilizzata dalla
ditta) e che contengano più del 10% di inerte, limitando lo sfruttamento e l’uso di nuove geo-
risorse.
Anche la miscela con l’aggiunta del fango di scarto dell’industria ceramica ha ottenuto
risultati soddisfacenti. Le prove di colorimetria han dimostrato che il prodotto finito mantiene
un aspetto molto simile ad un mattone di colore giallo già in commercio (ottenuto con la
stessa argilla, ma con l’inerte standard) suggerendone la possibile sostituzione dal punto di
vista estetico. Le prove di compressione uniassiale e l’analisi ad ultrasuoni hanno, inoltre,
rilevato anche un comportamento meccanico molto simile a quello del mattone commerciale
giallo, indice della sua compatibilità anche nella riposta al carico. Solo dal punto di vista della
durabilità il mattone ottenuto con l’aggiunta del fango ha mostrato una risposta più debole.
Mentre durante la cristallizzazione dei sali il suo aspetto originario è rimasto quasi intatto, a
condizioni forzate di gelo e disgelo si è riscontrato il progressivo deterioramento dei campioni
fino alla loro totale disgregazione alla fine della prova. Alla luce di quanto evidenziato questo
nuovo mix design può essere a tutti gli effetti considerato un’alternativa sostenibile del
mattone commerciale, in particolare per il mantenimento delle proprietà fisico-meccaniche e
delle qualità estetiche, ma non può essere messo in opera in edifici situati in situazioni
ambientali dove sono possibili cicli di gelo e disgelo.
Questa tesi di Dottorato rappresenta un punto di partenza fondamentale per affrontare la
riqualificazione di mattoni tradizionali in chiave sostenibile e permettere la valutazione in
termini di qualità e durabilità dei mix sperimentali ottenuti con materiali di riciclo, nel caso
specifico consistenti in trachite di cava e in un fango ceramico. Entrambi i casi di studio
hanno dimostrato di rappresentare una valida alternativa al fine di ottenere nuovi mattoni di
interesse per il miglioramento del settore industriale del laterizio, in termini di risparmio di
sfruttamento di geo-risorse, energia e costi.
Comprendere le relazioni intrinseche tra composizione mineralogica, caratteristiche
tessiturali, la microstruttura e le proprietà fisiche del laterizio è la base di una consapevole
conoscenza del materiale per lo sviluppo di nuovi mix design.
BRICKTECH:
Evaluación para la utilización de materiales de desecho en la produción de
ladrillos. Caracterización petrofísica de nuevos productos
y optimización de las condiciones de cocción.
RESUMEN

RESUMEN
ix
El ladrillo es uno de los materiales de construcción tradicionales con orígenes más antiguos.
Sin embargo, puede responder a los desafíos que hoy en día la investigación industrial
plantea, es decir, el ahorro de energía, la reducción en los gastos de producción y la mejora en
la calidad del producto final. Por otra parte, la creciente demanda de una producción
sostenible ha focalizado la investigación hacía la elaboración de nuevos materiales que tengan
en cuenta la salvaguardia del medio ambiente y del bienestar social.
Un camino viable para lograr estos objetivos es la optimización en el uso de las materias
primas, diseñando nuevos productos, tras la adición de materiales de desecho, procedentes de
distintas actividades industriales e urbanas.
La consolidación de una producción sostenible tiene un doble resultado ya que no sólo limita
la explotación de nuevos geo-recursos, sino también resuelve, al menos en parte, el problema
de la acumulación y gestión de los residuos, reevaluandolos como fuente secundaria de interés
para la producción de materiales que favorezcan la protección del medio ambiente.
Aunque en las últimas décadas numerosos estudios se han centrado en el uso de materiales de
desecho como recursos alternativos para la producción de nuevos ladrillos, dando lugar en
algunos casos a resultados alentadores, desafortunadamente la puesta en práctica de estos
nuevos procedimientos en la industria ladrillera es todavía muy limitada, debido a la falta de
entendimiento entre la investigación académica y las necesidades reales de la industria, a la
carencia de normas específicas que evalúen las distintas fases del proceso productivo así
como los productos cocidos y a una todavía limitada concienciación pública sobre los
posibles recursos sostenibles.
Otro aspecto a tener en cuenta en la producción de nuevos materiales es el mantenimiento de
las características estéticas del material tradicional. El ladrillo, de hecho, al ser un material de
construcción, debe respetar los parámetros de "compatibilidad cultural", entendida como el
reconocimiento de la identidad territorial de una comunidad. Este aspecto tiene un valor aún
mayor en el caso de materiales utilizados con función de integración o reemplazamiento para
la recuperación y/o la restauración de edificios históricos dañados.
Esta Tesis Doctoral pretende llenar el vacío por el escaso diálogo existente entre el mundo
académico y la industria ladrillera, a través de una estrecha colaboración entre ambos sectores
y el logro de objetivos comunes. Esto ha sido posible gracias al apoyo de una empresa líder en
la producción de ladrillos tradicionales, la SanMarco-Terreal srl (Noale, Italia), que ha
RESUMEN
x
contribuido ofreciendo instrumentaciones, materias primas y la gran experiencia maturada en
el sector.
Las nuevas mezclas de materias primas y productos de desecho se han desarrollado de
acuerdo con los objetivos del proyecto Horizon 2020
(https://ec.europa.eu/programmes/horizon2020/), teniendo en cuenta sobre todo el uso
sostenible de los recursos naturales, la optimización de las condiciones de cocción, el reciclaje
y control de emisiones con el fin de cumplir con la excelencia científica, los desafíos de la
socieda y el liderazgo industrial.
Por tanto, los objetivos principales de esta Tesis Doctoral han sido los siguientes:
1) relacionar las características mineralógicas y químicas con las propiedades físicas,
mecánicas y de durabilidad de ladrillos que ya están en el mercado elaborados con diferentes
materias primas arcillosas y cocidos a diferentes temperaturas;
2) estudiar el sistema poroso de los ladrillos industriales con el fin de obtener un
conocimiento completo y fiable de los mismos y establecer un protocolo para la
cuantificación y parametrización de las características morfológicas de los poros a través del
uso combinado de métodos tradicionales y técnicas basadas sobre el análisis de imágenes
según el tipo de materia prima utilizada y la temperatura de cocción alcanzada;
3) elaborar nuevos ladrillos tras la adición de residuos procedentes de la extracción en cantera
de materiales pétreos y de la actividad industrial para la obtención de ladrillos nuevos que
respecten el concepto de reciclaje y el uso sostenible de los recursos. El tipo de materiales de
desechos utilizados en esta tesis han sido: i) traquita extraída en el área de los “Colli Euganei”
(Vicenza, Italia); ii) lodo resultante de la industria cerámica.
Los resultandos obtenitdo por el estudio de los ladrillos comerciales han confermado que las
propiedades químico- mineralógicas, físico-mecánicas, la porosidad y la durabilidad, son
altamente dependientes de la composición de la materia prima y de las temperaturas de
cocción alcanzadas durante el proceso de producción, mientras aquellos sobre las nuevas
mezclas han demostrado la posibilidad de obtener nuevos tipos de ladrillos, con material de
desecho, haciendo frente a los nuevos objectivos para una industria sostenible y compatible.
Más en detalle, los ladrillos comerciales cocidos a temperaturas superiores a 1050° C
mostraron una mayor evolución mineralógica, con el crecimiento de nuevas fases silicaticas y
una mayor fusión de la matriz, que ha comportado la mejoría del comportamiento mecánico.
RESUMEN
xi
Por el contrario el ladrillo cocido 600°C mostra un buen comportamiento en las pruebas
hídricas, pero tiene lo peor durante las pruebas de envejamento acelerado debido a su baja
compacidad por la ausencia de la vitrificación ne la matriz y la baja evolución de nuevas
fases. Se ha visto como el hausmannite utilizado cómo colorante (Mn3O4), causó cambios no
sólo a su aspecto visual (color gris oscuro), sino también a sus propiedades mecánicas y en el
sistema poroso, promovuendo el proceso de fusión.
El estudio de la porosidad obtenida mediante el uso de diferentes técnicas permití de entender
mejor las limitaciones de cada método de análisis y de conocer el sistema de poros de cada
muestra en su complejidad. Los ladrillos fabricados con arcilla carbonática tienen la mayor
cantidad de porosidad abierta debido a la decomposición de carbonato durante el proceso de
cocción que aumentan la porosidad y la interconexión de los poros. Por otra parte, el aumento
de las temperaturas de cocción los poros causò el cambio de la morfología con el desarrollo
de los poros más grandes y redondos, debido a fuga de gas a esta temperatura. Por el contrario
el ladrillo obetido por la arcilla menos carbonática y cocido a 600°C, la porosidad es muy
diferente, los poros son menos homogéneo y más pequeño.
La evaluación de la influencia de la utilización de material de desecho para la producción de
ladrillos en los dos casos experimentales de estudio i) la adición de trachyte excavación (5,
10, 15% en peso.) y 2) la adición del lodo cerámico (10% en peso) los resultados fueron
positivos con el fin de identificar posibles "alternativas sostenibles" a los ladrillos actualmente
en comercio.
Un alto contenido de trachyte disminuye el punto de fusión debido a la presencia de
feldespatos alcalinos, que actúan como agentes fundentes. Eso efecto es probado en diferentes
puntos de vista, con el aumento de la conexión entre los granos y un desarrollo de una matriz
más compacto en correspondencia de la traquita, la creciente de la densidad, y por la
evolución de la textura y el sistema de poros ya que no solo al aumentar la temperatura pero
tambien por el contenido de traquita, con los poros se hacen más grandes y redondos. La
correlación entre la resistencia y ambas temperaturas de cocción y el contenido trachyte es
evidente especialmente para resistencia a la compresión uniaxial, que es dipendente a el
aumento de la compacidad debido a la acción de fusión promovida por los feldespatos de la
trachyte. Más contenido traquita reduce la transmisión de calor como evidenciado de la
evaluación del comportamiento térmico realizada por imágenes infrarrojas, sólo cuando se
alcanza el alto nivel de sinterización (con el ladrillo con 15% traquita cocido a 1100 ° C), la
RESUMEN
xii
transmisión de calor es más rápida. La buena respuesta a las condiciones de estrés
(congelación-descongelación y la cristalización de la sal) y la falta de una fuerte diferencia
entre las muestras de prueba que trachyte bien puede ser considerado como un material
alternativo para sustituir materiales con tambien beneficios gracias por agir como agente
fundente y por el recurso de nuevos materiales: por exemplo con ladrillos cocidos a 900°C
(temperatura inferior a la actuamente utilizata por la fabrica) y que contengan más del 10% de
arena como degrasante.
También el uso de lodo de la industria cerámica demostró resultados satisfactorios. Las
pruebas de colorimetría mostraron que el ladrillo con el lodo mantiene una apariencia estética
similar al ladrillo amarillo en el comercio, lo que sugiere que por su color es compatible para
una sustitution. Los de compresión uniaxial y de ultrasonidos mostraron comporamiento
mecánico muy similar a lo de ladrillo comercial amarillo que indica también mantenimiento
de las propiedades mecánicas. Desde el punto di vista de la durabilidad el ladrillo obtenido
con la adición mostró la respuesta más débil bajo condiciones de congelación-descongelación,
con un decaimiento progresivo hasta la desintegración total al final de la prueba, mientras que
durante la cristalización de sales probar el ladrillo con lodos mantuvo su apariencia casi no
dañado. Esto sugiere que esa nueva mezcla puede ser sustituto válido del ladrillo comercial
por sus propiedades mecánicas y fisicasy por sus cualidades estéticas, pero no puede
utilization en edificios situados en la situación medioambientales donde por el tipo de clima
son posibles ciclos de congelación-descongelación.
Esta Tesis Doctoral representa un antecedente fundamental para abordar la mejora de los
ladrillos tradicionales de una manera sostenible y permitir su evaluación, en términos de
calidad y durabilidad, de las mezclas experimentales obtenidas tras la adición de materiales
reciclados. Ambos residuos han demostrado ser una alternativa viable en la obtención de
nuevos ladrillos de interés para la mejora del sector industrial, en términos de ahorro de
explotación de los geo-recursos, energía y gastos. Es, además un ejemplo de cómo el mundo
universitario e la industria pueden colaborar siguendo objetivos comunes.
BRICKTECH:
Assessment for the use of waste in the brick production.
Petrophysical characterization of new mix designs
and optimization of the firing conditions.
ABSTRACT

ABSTRACT
xv
Bricks are traditional building materials with ancient origin, but that can respond to the
important challenges the industrial research is currently called to face, i.e. in reducing energy
consumption, in lowering production costs and in improving physical properties and
durability of the finished products. The growing demand for a sustainable production
addressed research to obtain new materials designed to meet environmental issues and society
welfare.
A possible way to achieve these goals and satisfy these different aspects is the optimisation of
new mix design, re-using waste materials produced from industrial, urban and excavation
activities.
The fulfilment of a sustainable production is twofold, determining a reduction in the
exploitation of new geo-resources, and mitigating the problem of waste accumulation and
management, reassessing residual materials as secondary sources for a new environmental-
friendly material production.
Although numerous studies have been carried out in the last decades addressing waste reuse
as a successful alternative resource in the production of bricks, their implementation in the
industrial sector is still very limited. The main reasons are: i) sporadic partnership between
academic research and industry in this technological area; ii) lack of specific standards for the
evaluation of processes and finished products; and iii) limited public education on the
possible sustainable frontiers.
Another important issue should be considered in the production of new materials: the
maintenance of the aesthetic quality when substituting traditional materials. Bricks are
building materials, and innovation should respect parameters such as the "cultural
compatibility", understood as the recognition of the territorial identity of a community. This
aspect has even of greater relevance when bricks are used as integration or replacement
materials in the restoration of damaged historical buildings.
This work aims at filling the gap between academic research and industrial development,
through a close collaboration between university and industry and the achievement of
common objectives. This was possible with the support of a leader company in the production
of traditional bricks, SanMarco-Terreal srl (Noale, Italy), which contributed offering technical
support, raw materials and consolidate experience in the production of traditional bricks.
New mix designs have been developed according to the objectives of Horizon 2020,
(https://ec.europa.eu/programmes/horizon2020/), particularly in the field of sustainable use of
ABSTRACT
xvi
natural resources, optimization of firing conditions, recycling and gas emission control, in
order to satisfy the goals related to the scientific excellence, the societal challenges and the
industry leadership.
Therefore, the study focused on:
1) the relationship between chemical-mineralogical characteristics and mechanical properties
and durability under different stress conditions of bricks already on the market, obtained by
different clays and fired at different temperatures (600, 950, 980, 1050°C);
2) the characterisation of the pore system in commercial bricks using a multi-analytical
approach, in order to fully understand and describe porosity through a parameterization of the
morphological characteristics of pores. This study was also addressed to the optimization of
the pore system in fired bricks obtained from different raw materials and fired at different
temperatures (600, 950, 1050°C), providing hints for the optimisation of production strategies
that can affect the pore system and the brick quality;
3) the study of new mix designs obtained by adding waste material from quarrying activities
and industrial sludge for the production of new bricks based on the concepts of reuse and
sustainable use of natural resources. The type of waste specifically adopted were: i) trachyte
fragments from quarrying activity (Euganean Hills, Italy); ii) sludge resulting from the
ceramic industry.
The study of the commercial bricks showed that the chemical-mineralogical and physical-
mechanical properties, the porosity and the durability of the finished products are highly
dependent on the raw material composition and the firing temperatures reached during the
production process. The results obtained for the new experimental products demonstrated the
real possibility to achieve new bricks reusing waste, maintaining the physical, mechanical and
aesthetic features of the traditional materials and improving the quality of the finished
product.
More in detail, commercial bricks fired at temperature of 1050°C showed considerable
mineralogical transformations, with the growth of new phases and a higher vitrification
process in the matrix, which determined improvement of the mechanical properties. On the
contrary, brick fired at 600°C had good water behaviour, but resulted weaker during
accelerated ageing tests. This behaviour is due to the low compactness determined by the
absence of vitrification in the matrix and the low rate of new phase crystallisation. Moreover,
ABSTRACT
xvii
it was observed how hausmannite (Mn3O4) used as a dye, caused changes not only in the
aesthetic aspect of the finished product determining a dark grey colour, but also in its
mechanical properties and in the porous system, since it promotes the melting process.
The detailed study of the porosity allowed knowing the pore system in each of the samples
and assessing the influence of the raw materials and firing temperature on the development of
the pore system. Bricks produced with carbonate clay showed higher porosity and pore
interconnection due to the decomposition of the carbonate during the firing process.
Moreover, in the bricks fired at higher temperatures (1050°C) changes in the morphology of
pores occurred, which became larger and rounder due to the release of volatiles. On the
contrary, in bricks obtained from the least carbonate clay and fired at 600°C, porosity
displayed very different features, with less homogeneous and smaller pores.
In the study on the influence of the waste materials used in the production of new bricks, two
different cases were considered: i) addition of stone waste from trachyte quarrying activity; ii)
addition of ceramic sludge. These materials were added as temper; influence on the physical-
mechanical properties and durability were investigated. Results were satisfactory, recognising
their potentiality as possible sustainable additives in the brick industry.
It was observed that the alkali feldspars in trachyte act as fluxing agents and decrease the
melting point. This effect was emphasized with different observations: textural and
mineralogical analyses showed a considerable increase of the number of bridges among
minerals and a wider recrystallization of the matrix, sonic data an overall increase in
compactness, porometry a different evolution of the pores system upon firing. These changes
developed not only at increasing temperature, but also at increasing trachyte content.
Furthermore, the analysis of the thermal properties, carried out on infrared images showed
that the increasing content of trachyte reduces heat transmittance. Only in one case (a brick
with 15% of trachyte and fired at 1050°C) an increase in heat transmittance was observed,
caused by the high degree of sintering achieved. In general, the good response to stress
conditions (under freeze-thaw and salt crystallization cycles) and the relatively homogeneous
features among the samples showed that trachyte can be considered as a valid alternative
material to the currently used temper which also brings technical advantages. One important
result is that the addition of a trachytic temper confers to bricks the same technical features of
ABSTRACT
xviii
traditional ones already at a temperature as low as 900°C, opening the possibility to the
reduction of production costs, in addition to that of exploitation and use of new geo-resources.
The use of sludge from ceramic industry also showed satisfactory results. Colorimetry proved
that these bricks have aesthetic characteristics very similar to those of bricks already on the
market, as well as mechanical properties determined by uniaxial compressive and ultrasonic
tests. Nonetheless, differences arose when durability was evaluated. While during the salt
crystallisation tests the experimental bricks preserve almost intact their original appearance
and mechanical properties, they resulted to be particularly vulnerable to freeze-thaw cycles.
This suggests that they may represent a valid substitute of commercial bricks, but caution
should be taken when using in cold climates.
This PhD thesis is an important starting point to address the improvement of the traditional
bricks in a sustainable way, and the assessment of the characteristics for new materials
derived from industrial wastes, evaluating quality and durability. Both case studies
demonstrated that the reuse of industrial waste could indeed sustain the industrial sector of
brick production, providing a reduction in the exploitation of geo-resources, energy
consumption and costs.
The comprehension of the intrinsic relationships between mineralogical composition, textural
features and physical properties resulted to be fundamental for the development of new
products.

CHAPTER I
Introduction

CHAPTER I Introduction
3
1. Introduction and objectives
Bricks have been used for millennia as building materials. In recent times, market
requirements and innovative policies in the industrial sector, boosted numerous researches
and allowed converting this ancient traditional material into a new material which requires
technological innovation in order to face the increasingly relevant challenge of a sustainable
production. The growth of the environmental issues has led to review the approach of
developing processes in various sectors of economy and production. Moreover, the
recognition of a social role of the private enterprise implies important responsibilities to create
well-being conditions and to improve the quality of life in terms of economy/costs, as well as
health and safety. One of the main aspects of this change is the acquisition of a global vision,
based on finding a balance between environmental and human needs, in terms of final
products quality and actions giving rise to common wealth, energy savings and preservation
of resources. The principle of sustainable development is indeed focused on the well-being of
the future generations and the community promoting the concept of “Reuse, Recycle and
Replace” and improving the environmental damage control (Ortiz et al., 2009; Haldar, 2013).
The sustainability of a product is evaluated by the interactions with the environment that
occur during the entire cycle of its life (life cycle assessment LCA), including energy and
environmental safety (Koroneos & Dompros, 2007; Peris Mora, 2007; Ortiz et al., 2009). Any
brick company aiming to compete in the increasingly competitive global market has to invest
in the ability of producing new materials, optimizing the quality and costs of the final
products. The reuse of waste, the adoption of a renewable energy system and the control of
the firing conditions can be a possible way to achieve sustainable production and development
(Asiedu & Gu, 1998).
Bricks are artificial materials obtained by a firing process, which induces permanent changes
the starting raw material. This is generally made of a mixture of clay minerals and sand
(coarser naturally occurring inclusions) or temper (deliberately added to modify plasticity and
mechanical properties). In comparison to natural stones, bricks have the advantage to modify
their technical and aesthetic properties by changing the composition of the starting materials
and/or the firing conditions, in order to fit specific requirements. The mineralogical and
textural changes that occur during the firing process are similar to those developed during
pyrometamorphism, with the crystallisation of new mineral phases, the development of a new
pore system and vitrification (Riccardi et al., 1999; Aras, 2004; Cultrone et al., 2004; López-
CHAPTER I Introduction
4
Arce & García-Guinea, 2005). The understanding of the close connection among mineralogy,
porosity and physical properties can lead to considerable quality improvement of the fired
bricks. The improvement of our knowledge on the mineralogical and textural changes taking
place during firing can provide technical solutions, energy efficiency and human safety, and
introduce environmental-friendly materials in the market. Moreover, redeveloping
commercial traditional bricks, the historical memory of a territory needs to be taken into
account. Therefore, the new material must respect the aesthetic parameters, which represent a
part of the cultural identity.
The introduction of wastes in the brick production chain can be the response to the problem of
the disposal of large amounts of substances produced from various industrial activities that
constitute a global environmental hazard. The storage of these materials and, connected with
it, the increased demand to develop sustainable alternatives to the traditional building
materials addressed industrial and academic attentions to the production of new
environmentally friendly bricks. In the last decades several researches have been conducted
on bricks, promoting a sustainable development (Dondi et al., 1997a; Dondi et al., 1997b;
Demir, 2008; Raut et al., 2011; Zhang, 2013; Muñoz Velasco et al., 2014a,b; Neves Monteiro
& Fontes Vieira, 2014; Bories et al., 2014;). The influence of various types of additives have
been studied. Organic waste materials were principally used to increase the porosity, as for
example recycling paper (Demir et al., 2005; Sutcu & Akkurt, 2009; Rajput et al. 2012; Sutcu
et al., 2014), cotton (Rajput et al., 2012), tea (Demir, 2006), rise (Chiang et al., 2009), tobacco
(Demir, 2008) and sawdust (Eliche-Quesada et al., 2012) waste. Other studies have been
conducted to evaluate the effect of inorganic waste addition, both from natural stones
excavation materials, such as perlite (Topçu & Işidağ, 2007), marble (Elique-Quedada et al.,
2012; Bilgin et al., 2012; Sutcu et al., 2015), pozzolana (Ercikdi et al., 2009), fly ash
(Cultrone & Sebastián, 2009; Zhang et al., 2011), and from secondary industrial materials,
like sewage sludge (Yagüe et al., 2002; Weng et al. 2003; Cusidó & Cremades, 2012),
ceramic sludge (Coletti et al, submitted) and leach residues (Chen et al., 2011). Nevertheless,
the production of commercial bricks recycling waste materials is still very limited principally
because of the absence of standards to validate the large production and for the lack of
acceptance by the industry and public opinion.
CHAPTER I Introduction
5
This research developed from a university-industry joint project, supported by a PhD grant
sponsored by “INPS - Gestione Ex Inpdap (Direzione Regionale Veneto)”. Materials and
technical support were peovided by SanMarco-Terreal srl, an Italian company producing
traditional bricks at Noale (Venezia, northeast Italy), very sensitive to the development of
high quality sustainable productions. The collaboration between the Department of
Geoscience (University of Padua, Italy) and the Department of Mineralogy and Petrology
(University of Granada, Spain) permitted to carry out a complete study under mineralogical,
petrographic, physical and mechanical points of view of traditional bricks and products with
new mix designs.
This work relied on an accurately designed multi-analytical approach and investigated the
properties of bricks already on the market, in order to have a solid basis on which to tackle the
actual industrial challenge for identifying methods and criteria to introduce green solutions
and to ensure a leader industry, promoting excellence and innovation. Moreover, part of the
research focused on the study of the pore structure since it represent one of the principal
features affecting the building material quality, that therefore needs to be evaluated when
predicting bricks durability. With this in mind, new mix designs were produced reusing
wastes. The choice fell on two kinds of waste that do not generate undesirable pollutant
emissions or release contaminants, therefore ideal in terms of environmental and human
acceptance: i) trachyte fragments from quarrying activity; ii) ceramic sludge resulting from
the ceramic industry.
The experimental results were organised, in this PhD Thesis, into 4 chapters.
i) How to face the new industrial challenge of compatible, sustainable brick production:
study of various types of commercially available bricks (Chapter III):
Five industrial bricks, produced with three types of clayey materials and fired at four temperatures (600, 950,
980, 1050°C), were analysed with a combined multianalytical approach to determine relationships between
mineralogical-textural and physical-mechanical characteristics and decay behavior. Samples fired at 1050°C
showed more developed mineralogical evolution and had the best mechanical resistance, but tended to absorb
more water and have a higher rise in capillarity compared with the other samples. On the contrary, samples fired
at the lowest temperature (600°C) had the best pore interconnections and the lowest coefficient of capillarity.
However, the absence of new silicates and melting between grains and clay matrix made them the weakest under
load and decay tests. Finally, bricks produced at firing temperatures of 950ºC and 980°C generally showed
intermediate behavior, but also underwent the most significant changes in pore distribution after the salt
crystallization test. The results of this study improve our background knowledge of bricks, responding to the
CHAPTER I Introduction
6
current requirement of the construction industry to produce new mix designs for modern constructions and for
restoration of historical buildings.
ii) A combined multi-analytical approach for the study of the pore system of bricks: how
much porosity is there? (Chapter IV):
During the firing process of bricks mineralogical and textural transformations occur which produces an artificial
aggregate characterized by a significant porosity. Porosity, in particular concerning the pore-size distribution and
the interconnection model, is an important parameter to evaluate and predict durability of bricks. The system of
pores, indeed, is the principal factor that correlates building materials and environment (especially in the
weathering aggressive phenomena, e.g., salt crystallization and freeze-thaw cycles) and determines its durability.
Four industrial bricks (with different compositions and firing temperatures) were analysed combining “direct”
and “indirect” techniques, traditional methods (mercury intrusion porosimetry, hydric test, nitrogen adsorption)
and new analytical approaches based on the digital image reconstruction of 2D and 3D models (using
backscattered electrons and computerised X-ray micro-tomography). The combination of different analytical
methods over “overlapping ranges” of the porosity, as bridges of interconnection between them, permitted to
overcome their limits and draft a complete knowledge of the pore system of bricks.
iii) Recycling trachyte waste from quarry to brick industry: petrophysical
characterization and durability of new ceramic products (Chapter V):
This work aims to investigate the possibility of recycling trachyte waste produced from quarrying activity and
ornamental stone cutting processes, as temper for the preparation of new types of bricks, which satisfy the
requirement of energy saving, production cost reduction and preservation of increasingly meagre raw material
sources. Three different mixtures were prepared adding 5, 10 and 15 wt% of trachyte to a clayey material. Each
mixture was fired at the temperatures of 900, 1000 and 1100 °C, according to standard industrial procedure. The
influence of the waste addition was investigated determining petrographic and physical characteristics in order to
assess aesthetic and mechanical features of the fired bricks. The good response to stress conditions of all the
samples prove that the use of trachyte could bring benefits already for bricks fired at 900 °C.
iv) Use of industrial ceramic sludge in the brick production: effect on aesthetic quality
and physical properties (Chapter VI):
Nowadays most of the brick companies have addressed their research to the recycling of waste, in order to obtain
new types of bricks to put on the market. With this work, we intended to explore the possibility of using a
ceramic sludge in the brick production, in order to find an alternative eco-friendly additive to produce “eco-
bricks” characterised by appropriate mechanical and aesthetic properties, and durability. For this purpose, two
types of bricks produced by an Italian factory (SanMarco-Terreal) were compared with a newly design brick
obtained from the same starting clay material with the addition of a ceramic sludge in place of the traditionally
used siliceous sand.
CHAPTER I Introduction
7
Results demonstrate that the bricks produced with the addition of a ceramic sludge can well substitute traditional
bricks fulfilling aesthetic requirements and maintaining adequate mechanical properties, although these new
materials resulted problematic in their durability response to freeze-thaw cycles, pointing out potential
vulnerability in cold climates.
References
Aras A., 2004. The change of phase composition in kaolinite- and illite-rich clay-based
ceramic bodies, Applied Clay Science, 24, 257-269.
Asiedu Y., Gu P., 1998. Product life cycle cost analysis: state of the art review, International
Journal of Production Research 36, 4, 883-908
Bilgin N., Yeprem H.A., Arslan S., Bilgin A., Gunay E. , Mars Oglu M., 2012. Use of waste
marble powder in brick industry, Construction and Building Materials 29, 449–457
Bories C., Borredon M.-E, Vedrenne E., Vilarem G., 2014. Development of eco-friendly
porous fired clay bricks using pore-forming agents: A review, Journal of Environmental
Management 143, 186-196
Chen Y., Zhang Y., Chen T., Zhao Y., Bao S., 2011. Preparation of eco-friendly construction
bricks from hematite tailings, Construction and Building Materials 25, 2107-2111
Chiang K.-Y., Chou P.-H., Hua C.-R., Chien K.-L., Cheeseman C., 2009. Lightweight bricks
manufactured from water treatment sludge and rice husks, Journal of Hazardous
Materials 171, 76-82
Coletti C., Cultrone G., Mazzoli C., Maritan L., Evaluation of effects of adding industrial
residual materials on final aesthetic qualities and physical properties of Ca-rich fired
brick, submitted
Cultrone G., Sebastián E., Elert K., de la Torre M.J., Cazalla O., Rodriguez-Navarro C., 2004.
Influence of mineralogy and firing temperature in the porosity of bricks, Journal of the
European Ceramic Society 34, 547-564
Cultrone G., Sebastián E., 2009. Fly ash addition in clayey materials to improve the quality of
solid bricks, Construction and Building Materials 23, 1178–1184
Cusidó J. A., Cremades L.V., 2012. Environmental effects of using clay bricks produces with
sewage sludge: Leachability and toxicity studies, Waste Management 31, 1372-1380
Demir I., Baspinara M. S., Orhan M., 2005. Utilization of kraft pulp production residues in
clay brick production, Building and Environment 40, 1533-1537
CHAPTER I Introduction
8
Demir I., 2006. An investigation on the production of construction brick with processed waste
tea, Building and Environment 41, 1274-1278
Demir I., 2008. Effect of organic residues addition on the technological properties of clay
bricks, Waste Management 28, 622-627
Dondi M., Marsigli M., Fabbri B., 1997a. Recycling of Industrial and Urban Wastes in Brick
Production – A review, Tile Brick Int. 13, 218-225
Dondi M., Marsigli M., Fabbri B., 1997b. Recycling of Industrial and Urban Wastes in Brick
Production – A review (Part 2), Tile Brick Int. 13, 302-309
Eliche-Quesada D., Corpas-Iglesias F.A., Pérez-Villarejo L., Iglesias-Godino F.J., 2012.
Recycling of sawdust, spent earth from oil filtration, compost and marble residues for
brick manufacturing, Construction and Building Materials 34, 275–284
Ercikdi B., Cihangir F., Kesimal A., Deveci H., Alp I., 2009. Utilization of industrial waste
products as pozzolanic material in cemented paste backfill of high sulphide mill tailings,
Journal of Hazardous Materials 168, 848–856
Haldar S. K., 2013. Mineral Exploration: Principles and Applications, Elsevier Science
Publishing Co Inc, United States
Koroneos C., Dompros A., Environmental assessment of brick production in Greece, Building
and Environment 42, 2007, 2114–2123
López-Arce P., García-Guinea J., 2005. Weathering traces in ancients bricks from historic
buildings, Building and Environment 40, 929-941.
Muñoz Velasco P., Morales Ortíz M.P., Mendívil Giró M.A., Muñoz Velasco L., 2014a. Fired
clay bricks manufactured by adding wastes as sustainable construction material – A
review, Construction and Building Materials 63, 97–107
Muñoz Velasco P., Morales M.P., Mendívil M.A., Juárez M.C., Muñoz L., 2014b. Using of
waste pomace from winery industry to improve thermal insulation of fired clay bricks.
Eco-friendly way of building construction, Construction and Building Materials 7, 181-
187
Neves Monteiro S., Fontes Vieira C. M., 2014. On the production of fired clay bricks from
waste materials: A critical update, Construction and Building Materials 68, 599–610
Ortiz O., Castells F., Sonnemann G., 2009. Sustainability in the construction industry: A
review of recent developments based on LCA, Construction and Building Materials 23,
28–39
CHAPTER I Introduction
9
Peris Mora E., 2007. Life cycle, sustainability and the transcendent quality of building
materials, Building and Environment 42, 1329-1334
Rajput D., Bhagade S.S., Raut S.P., Ralegaonkar R.V., Mandavgane S. A., 2012. Reuse of
cotton and recycle paper mill waste as building material, Construction and Building
Materials 34, 470-475
Raut S.P., Ralegaonkar R.V, Mandavgane S.A., 2011. Development of sustainable
construction material using industrial and agricultural solid waste: A review of waste-
create bricks, Construction and Building Materials 25, 4037-4042
Riccardi M.P., Messiga B., Duminuco P., 1999. An approach to the dynamics of clay firing,
Applied Clay Science 15, 393-409
Sutcu M., Akkurt S., 2009. The use of recycled paper processing residues in making porous
brick with reduced thermal conductivity, Ceramics International 35, 2625-2631
Sutcu M., del Coz Diaz J. J., Alvarez Rabanal F.P., Gencel O., Akkurt S., 2014. Thermal
performance optimization of hollow clay bricks made up of paper waste, Energy and
Buildings 75, 96–108
Sutcu M., Alptekin H., Erdogmus E., Er Y., Gencel O., 2015. Characteristics of fired clay
bricks with waste marble powder addition as building materials Construction and
Building Materials 82, 1-8
Topçu İ. B., Işidağ B., 2007. Manufacture of high heat conductivity resistant clay bricks
containing perlite, Building and Environment 42, 3540-3546
Yagüe A., Valls S., Vázquez E., Kuchinow V., 2002. Utilización de Iodo seco de depuradora
de aguas residuales como adición en adoquines de hormigón prefabricado, Materiales de
construcción 52, 267, 31-41
Weng C.-H., Lin D.-F., Chiang P.-C., 2003. Utilization of sludge as brick materials, Advances
in Environmental Research 7, 679–685
Zhang L., Ahmari S., Zhang J., 2011. Synthesis and characterization of fly ash modified mine
tailings-based geopolymers, Construction and Building Materials 25, 3773-3781
Zhang L., 2013. Production of bricks from waste materials – A review, Construction and
Building Materials 47, 643-655

CHAPTER I Introduction
10
CHAPTER II
Methods

CHAPTER II Methods
13
1. Aesthetic qualities
1.1 Spectrophotometry
The colour of clay materials and fired bricks were determined using a portable Minolta
CM700d spectrophotometer following UNE EN 15886 norms (2011) and CIELab system,
where the colour is the result of the sum of lightness (L*, -100=black and +100=white) and
two chromatic coordinates a* and b*, that measure the amount of red-green and yellow-blue
colours (a*, -60=green and +60=red; and b*, -60=blue and +60=yellow), respectively.
Measurement conditions were as follows: 8 mm measurement area, D65 standard illuminant,
10° observer angle with SCI/SCE modes and wavelength range from 400 to 700 nm, with 10
nm wavelength interval.
Colorimetry was carried out on dry and wet bricks to determine which of them were visually
modified by the weather conditions. Colour difference ΔE was calculated according to the
following equation:
where subscript 1 refers to measurements of dry samples, and subscrpit 2 to those of wet
samples.
2. Chemical-mineralogical characterization
2.1 X-Ray Powder Diffraction (XRPD)
The mineralogical composition of raw materials and bricks was determined by means of X-
ray Powder Diffraction (XRPD), using a Philips PW 1710 diffractometer equipped with
automatic slit window, CuKα (=1.5405 Å) 2θ radiation in the range 3-60°, and goniometer
speed of 0.01º 2θ/s. Mineral phases were identified with X’High Score Plus software®.
Samples were milled in a agate mortar to < 40 m particle size and, then, analysed.
2.2 X-Ray Fluorescence (XRF)
The bulk chemical analysis of clays and fired products was performed with the X-ray
fluorescence (XRF) technique, using a S4 Pioneer (Brucker AXS) spectrometer. Samples
CHAPTER II Methods
14
were prepared as pellets and 5 g of each were finely ground in an agate mortar before being
pressed in an Al holder for disk preparation. The estimated detection limit for major elements
was 0.01 wt%. ZAF correction was performed systematically (Scott & Love, 1983). Standard
NCSDC 74301 (GSMS-1) (Chen & Wang, 1988) was applied.
2.3 Optical microscopy
Polarized light microscope (Olympus DX–50) equipped with a Nikon D7000 digital
microphotography system was used to observe the texture of brick samples, as well as shape
and size of pores and mineral phases. One thin section per sample was prepared and was
studied using plane- and cross-polarized light.
2.4 Scanning Electron Microscopy (FESEM and SEM)
The study of the microtexture of fired bricks, the development of new fases and of secondary
porosity was studied by means of i) Scanning Electron Microscopy Scanning Electron
Microscopy (SEM) with a CamScan MX 2500 microscope, coupled with EDAX “Sapphire”
detector (LEAP+Si(Li) crystal, equipped with a LaB6 cathode and operating at 20 kV and 160
nA and of ii) Field Emission Scanning Electron Microscopy (FESEM, LEO GEMINI 1530),
coupled with INCA-200 Oxford microanalyser.
3. Porosity
3.1 Hydric test
Hydric tests consist in a series of measures carried out to measure the movement of water
(absorbed by immersion or capillarity and dried) inside the bricks. Free and forced water
absorption (UNI EN 13755) and drying (NORMAL 29/88) were determined on three samples
(cube-shaped with sides of 50 mm) for each brick type. Free water absorption consists in
determining the percentage of water absorbed by the mass of a sample, firstly dried at 100°C
in an electric oven and then completely immersed in water at controlled room temperature
(20°C) and relative humidity (30%). During this test samples were periodically weighed until
they reach constant mass. At this stage, samples were saturated with water under vacuum for
24h (forced water absorption), thus, weighed again also under water (hydrostatic weight).
Finally, all samples were dried at the room temperature until the initial mass (drying test).
CHAPTER II Methods
15
Parameters associated with water flux (free water absorption (Al), forced water absorption
(Af), degree of pore interconnection (Ax), drying Index (Di), saturation coefficient (S), open
porosity (na), apparent density (ρA) and real density (ρR) were calculated as follows (Rilem,
1980; Cultrone et al., 2003):
Al=
Al=
Ax=
Di =
S =
na =
ρA =
ρR =
where M0 = mass of dried sample, Ml = mass of sample saturated with water at atmospheric
pressure, Ms = mass of sample saturated with water under vacuum, MH = hydrostatic weight
of sample saturated with water under vacuum, Mt = decreasing water weight content as a
function of time, t0 and tf = drying test start and end times,
Capillarity coefficient (Ks) and Capillarity rise (B) were determined on three prism-shaped
samples measuring 25×25×120 mm of each brick type according to UNI EN 1925 normative
as follows:
CHAPTER II Methods
16
Ks =
B =
where MC = amount of water absorbed at time t, A = surface of sample (in cm2) in contact
with water, and h = rise in capillarity (in cm).
3.2 Mercury Intrusion Porosimetry (MIP)
Mercury Intrusion Porosimetry is a powerful technique used to evaluate the open porosity
(interconnected pores) and pore size-distribution in the 0.003–350 μm range.
The instrument used in this study was a Micromeritics Autopore apparatus, model 9410,
which can generate a pressure of 414 MPa. Samples of approximately 2 cm3 were freshly cut
and oven-dried for 24 h at 110°C before being analysed.
From the pressure intrusion data, the instrument generates volume and size distributions using
the Washburn equation (Pirard et al., 2002):
where PL = pressure of liquid (mercury in this case), PG = pressure of gas in the pores (it is
approximated to 0 atm because before the introduction of the liquid, the sample is subjected to
vacuum conditions), σ = surface tension of liquid, θ = contact angle of intrusion of liquid
(generally between 135° and 142° for mercury), Dp = diameter of pores.
3.3 Nitrogen adsorption
Nitrogen Adsorption was used to determine the porosity in the range (in diameter) comprised
between 2 and 3000 Å. The sorption isotherms were obtained at 77 K, using a Micromeritics
Tristar 3000 apparatus under continuous adsorption conditions. Prior to measurement,
samples were heated at 130°C for 24h and outgassed to 10-3 Torr using a Micromeritics
Flowprep. The total pore volume of the samples was calculated using t-plot analysis. The
Barret-Joyner-Halenda (BJH) method was used to obtain pore size distribution curves.
CHAPTER II Methods
17
The quantity of gas adsorbed per mass expressed the volume as a function of relative
equilibrium pressure (P/P0), while the shape of the isotherm and its hysteresis pattern provide
information to qualitatively predict the types of pores present in the materials. Isotherms are
classified by IUPAC into six different types (Type I to VI) (Sing et al. 1985). The hysteresis
patterns are four (H1 to H4) and permit to characterize different meso-pores shapes (Anovitz
& Cole, 2015).
Quantitative description of porosity is obtained calculating the total pore volume as follows
shapes (Anovitz & Cole, 2015):
Vliq =
where Vliq is the N2-liquid adsorbed, Pa is the ambient pressure, Vads is the amount of vapor
adsorbed, Vm is the volume of a monolayer, R is the gas constant, T is the temperature
expressed in K.
Average pore radii (rp) were estimated from the pore volume assuming cylindrical pore
geometry. It can be expressed as:
rp =
where Vliq is the N2 liquid adsorbed, S is the specific surface area.
3.4 2D digital image analysis using SEM/BSE
Digital Image Analysis (DIA) of SEM back-scattered electron images (BSE) is a simple
method for the quantification of total porosity, shape and size of pores and a suitable
alternative of the traditional analytical methods. SEM-BSE images were acquired with a
CamScan MX 2500, equipped with a LaB6 cathode, operating at 20 kV and Working Distance
(WD) of 20 mm at magnification of 50 and of 18 mm at magnification of 500. These two
different magnifications were adopted to investigate the pore system at different levels in
terms of representativeness and size. SEM grey-scale images were processed using ImageJ (a
public domain Java image processing program, http://imagej.nih.gov/ij/), decreasing the noise
and converting them into binary image (black and white) by a thresholding process.
CHAPTER II Methods
18
Therefore, information was grouped in two different “classes” (black=pores; white=ground-
matrix and minerals of the temper) (Sun et al., 2007; Crawford, 2009; Grove & Jerram, 2011).
For each of the two classes, training pixels were selected, defining specific regions of interest
(ROI). Image segmentation (classification of each pixel) was performed on the basis of ROI
selection. In order to automate the threshold selection and limit the operator subjectivity a
supervised classification was performed using MultiSpec3.3© software. Total porosity is
measured counting the black pixels of the binary images. In order to increase the
representativeness, DIA was performed on composite images obtained stitching together 30
overlapping-images at magnification of 50x (~2 cm2) and 240 overlapping-images at 500x (~2
mm2).
Porosity is calculated from binary images as a ratio of number of pixel pore representing class
to the total number of pixels of the area of interest (AOI):
PT =
where Npp is the number of pore-pixels (black pixels); Nsp is the number of solid-pixels
(white pixels).
Pore distribution was carried out dividing pores in different range basing on the minimum
Feret diameters (minFeret) calculated through ImageJ software.
3.5 3D digital image analysis using micro-computed tomography
Micro-computed tomography (m-CT) 3D image analysis is a modern used technique that
allows the investigation of different aspect of internal materials structures, including porosity.
For the measurements a “Skyscan 1172” X-ray computed micro-tomograph was used. This
device scans a rotating (360°) small sample (cylindric-shaped of 520 mm), using a fixed Cu
X-ray source with a focal spot size of 6 μm and a CCD detector. The spatial resolution of the
reconstructed slices in the X, Y and Z directions create a minimum 3D space (voxel) of 216
μm3. Samples were scanned at 74 kV and 133 nA, with an Al-filter of 0.5 mm thickness
interposed between the source and the detector in order to reduce the beam hardening. Cone-
beam reconstruction software from Skyscan converted the series of X-ray radiographs into
grey-scale slides (Cnudde & Boone, 2013). These radiographs are, then, stacked together to
CHAPTER II Methods
19
reconstruct a 3D image in voxel elements (Agbogun, 2013) and the pore-body inside the core-
sample is isolated.
The percentage of porosity (PT) is calculated as number of voxels concerning pore-body in the
volume of interest (VOI) (Noiriel, 2015) as follows:
PT =
where Npv = number of pore-voxels (white voxels); Nsv = number of solid-voxels (black
voxels).
Pore structure is considered as a pore-body (Noiriel, 2015), the proportion of the VOI
occupied by binarised solid objects, and pores entity is calculated trough the “structural
thickness” parameter obtained through the “3D analysis” measurements with the CTAn®
software.
From the “3D object analysis” tool was also possible to correlate the Object Volume vs. the
Sauter diameter (Sd) defined as the diameter of a sphere that has the same Volume/Area ratio
as the particle of interest:
Sd = 6
4. Physical-mechanical properties
4.1 Ultrasound test
The elastic and mechanical properties of brick samples were measured by ultrasound and
uniaxial compression tests. The former measured the degree of compactness and structural
anisotropy of fired undamaged bricks and their evolution after aging tests. The ultrasound
propagation velocity of compressional (Vp) and shear (Vs) pulses was measured in the three
perpendicular directions on cube samples (50 mm-edge) on a Panametrics HV
Pulser/Receiver 5058PR apparatus coupled with a Tektronix TDS 3012B oscilloscope.
Measurements were performed with 1 MHz Panametrics transducers with contact surface of 3
cm diameter. To ensure good contact between transducers and brick samples, two visco-
elastic gels were used to emphasize the P and S waves.
CHAPTER II Methods
20
Once the compressional and shear wave velocities were determined, the Poisson coefficient
() and the Young (E), Shear (G) and Bulk (K) moduli were calculated according to the
following formulas:
ν =
E = 2ρVs2 (1+ ν)
G =
ν
K =
ν
where ρ is the apparent density, previously determined by MIP.
Vp values were also useful in calculating the total (ΔM) and relative (m) anisotropies, as
follows (Guydader & Denis, 1986):
ΔM = (1-
) x100
m =
x 100
4.2 Uniaxial compression test
Uniaxial compressive strength of bricks was measured according to UNI EN 1926 (2007).
Three cubic samples with 40 mm edges for each brick type were tested at a loading rate of 20
kg/s. Compressive strength σ (in kg/cm2) was calculated as follows:
σ =
where F is the break load (in Kg) and A is the sample area (in cm2).
CHAPTER II Methods
21
4.3 Thermal behavior
Infrared Thermography (IRT) was performed on cubic samples of 50 mm-edge, using a FLIR
T440 series camera. This test consisted in heating the samples on their base during 20 min at
50°C and recording infrared images at regular intervals of 30 s. The instrument used is a
thermal camera capable of converting the infrared light into electronic signals, returning an
image in false color, each of which corresponding to a different temperature. In order to
evaluate bricks thermal insulation, each image taken by the Infrared thermocamera was
modified through Corel Draw® software to isolate the same area for each sample. The overall
image was segmented in a binary mode and analysed to obtain a value of percentage of
saturation (versus time of heat exposition) using MultiSpec3.3© software.
5. Accelerated ageing tests
5.1 Freeze-thaw test
The effect of ice crystallization inside the porous system of bricks was studied. Freeze-thaw
test was carried on three cubic samples (50 mm-edge) per brick type according to UNI EN
12371 norm. The test consists of 30 cycles each lasting 24 h. Each cycle includes 8 h of
freezing at -12°C and 16 h at +20°C of thawing in water. The samples were weighed at each
cycle and carefully observed by visual inspection to check their progressive decay. At the end
of the test, samples were dried to measure the weight loss (final weight on respect initial
weight).
5.2 Salt crystallization test
Salt crystallization test was carried on three cubic samples (50 mm-edge) per brick type
according to UNI EN 12370 norm. The test consists of 10 cycles of 24 h each, during which
samples were immersed for 4 h in a 14 wt% solution of NaSO4 ∙10 H2O at 20°C, then dried
for 16 h in an electric oven at 100°C, and finally cooled for 4 h at 20°C. The samples were
weighed at each cycle and carefully observed by visual inspection to check their progressive
decay. At the end of the test, samples were washed in water in order to remove possible salts
trapped in the pores and dried to measure the weight loss. This test provided information on
the damaging effects of soluble salts that are usually contained in water and can crystallize in
the pores and fissures.
CHAPTER II Methods
22
5.3 Ultrasound monitoring during ageing test
At regular intervals of 5 cycles during the freeze-thaw test and 3 cycles of salt crystallization,
sample compactness was monitored by ultrasound waves transmission (only Vp pulses were
measured).
5.4 Mercury Intrusion Porosimetry after ageing tests
MIP was again performed on deteriorated samples after salt crystallization test, to evaluate
any change in porosity and pore size distribution. Samples were washed several times to
ensure salt removal before MIP analysis.
References
Agbogun H.M.D., Al T.A., Hussein E.M.A., 2013. Three dimensional imaging of porosity
and tracer concentration distributions in a dolostone sample during diffusion
experiments using X-ray micro-CT, Journal of Contaminant Hydrology 145, 44–53
Anovitz L.M., Cole D. R., 2015Characterization and Analysis of porosity and pore structure,
Reviews in Mineralogy and Geochemistry, Vol. 80, 61-164,
Chen, G., Wang, J., 1998. The preparation of marine geological certified reference materials -
polymetallic nodule GSPN-1 and marine sediment GSMS-1 from the Central Pacific
Ocean, Geostandards and Geoanalytical Research 22, 119-125.
Crawford E.C., Mortensen J.K., 2009. An ImageJ1 plugin for the rapid morphological
characterization of separated particles and an initial application to placer gold analysis,
Computers &Geosciences 35, 347-359
Cnudde V., Boone M.N., 2013. High-resolution X-ray computed tomography in geosciences:
A review of the current technology and applications, Earth-Science Reviews 123, 1–17
Cultrone G., de la Torre M.J., Sebastian E. and Cazalla O., 2003. Evaluación de la durabilidad
de ladrillos mediante tecnicas destructivas (TD) y no-destructivas (TND), Materiales de
Construcción 53, 41-59.
Grove C., Jerram D.J., 2011. jPOR: An ImageJ macro to quantify total optical porosity from
blue-stained thin sections, Computers & Geosciences 37, 1850–1859
CHAPTER II Methods
23
Guydader J., Denis A., 1986. Propagation des ondes dans les roches anisotropes sous
contrainte évaluation de la qualité des schistes ardoisiers, Bull. Engineering Geololgy
33, 49-55.
Noiriel C., 2015. Resolving Time-dependent Evolution of Pore-Scale Structure, Permeability
and Reactivity using X-ray Microtomography, Reviews in Mineralogy & Geochemistry,
Vol 80, 247-285,
NORMAL 29/88, 1988. Misura dell’indice di asciugamento (drying index), CNR-ICR, Rome
UNE EN 15886, 2011. Conservación del patrimonio cultural. Métodos de ensayo. Medición
del color de superficies, A.E.N.O.R., Madrid
UNI EN 11084, 2003. La norma indica le principali caratteristiche mineralogiche, fisiche e
chimiche dei materiali ceramici determinabili in laboratorio, CNR-ICR, Rome.
UNI EN 13755, 2008. Metodi di prova per pietre naturali - Determinazione dell'assorbimento
d'acqua a pressione atmosferica, CNR-ICR, Rome.
UNI EN 1925, 2000. Metodi di prova per pietre naturali - determinazione del coefficiente di
assorbimento d'acqua per capillarità, CNR-ICR, Rome.
UNI EN 1926, 2007. Metodo di prova per pietre naturali - determinazione della resistenza alla
compressione uniassiale, ICNR-ICR, Rome.
UNI EN 12371, 2010. Metodo di prova per pietre naturali - determinazione della resistenza al
gelo, CNR-ICR, Rome.
UNI EN 12370, 2001. Metodi di prova per pietre naturali - determinazione della resistenza
alla cristallizzazione dei Sali, CNR-ICR, Rome.
Pirard R., Alié C., Pirard J.-P., 2002. Characterization of porous texture of hyperporous
materials by mercury porosimetry using densification equation, Powder Technology
128, 242-247
RILEM 1980. Recommended test to measure the deterioration of stone and to assess the
differences of treatment methods, Mater. Struct. 13, 175-253.
Scott V.D., Love G., 1983. Quantitative Electron Probe Microanalysis, John Wiley and Sons,
New York.
Sun W., Chen T., Chen C., Li J., 2007. A study on membrane morphology by digital image
processing, Journal of Membrane Science 305, 93-102

CHAPTER II Methods
24

CHAPTER III
Results
How to face the new industrial challenge of compatible,
sustainable brick production: study of various types
of commercially available bricks

CHAPTER II Results
27
How to face the new industrial challenge of compatible, sustainable brick
production: study of various types of commercially available bricks
Abstract
In the view of a sustainable production responding to the important challenges to which industrial research is
currently facing, this research is addressed to define the more appropriate brick types, among those here studied,
in terms of mechanical resistance and durability, as well as the aesthetic qualities. More in detail, five industrial
bricks, produced with three types of clay and fired at four temperatures (600, 950, 980, 1050°C), were analysed
with a combined multianalytical approach to determine relationships between mineralogical-textural and
physical-mechanical properties and decay behavior. Samples fired at 1050°C show more complete mineralogical
evolution and have the best mechanical resistance, but are the most sensitive to the water absorption. Instead,
samples fired at the lowest temperature (600°C) have the best pore interconnections and the lowest coefficient of
capillarity, however, the absence of new silicates and melting make them the weakest under load and decay tests.
Lastly, bricks produced at firing temperatures of 950ºC and 980°C generally showed intermediate behavior.
These results indicate, how bricks produced form the same or similar mix design and fired at different
temperature show different reactions to decay and mechanical resistance, allowing the industry to indentify the
limit of applicability of these materials in various contexts.
Key-words: Raw materials; Bricks; Physical–mechanical properties; Mineralogy; Pore system;
Durability
1. Introduction
Brick, a ceramic product used as a building material since ancient times, is still valued for its
easy availability of georesources, resistance to loading and environmental stress, and its
esthetic quality.
During firing, the raw materials, generally a mixture of a body of clay minerals and
predetermined fractions of silt and sand (temper), is transformed into a new artificial material
in which mineralogical changes occur, similar to those which developed during
pyrometamorphism; as regards microstructure, new porosity develops and melts form
(Riccardi et al., 1999; Aras, 2004; Cultrone et al., 2004; López-Arce and García-Guinea,
2005).
CHAPTER II Results
28
Many works have been published on case studies of historic interest, with specific focus on
the mineralogy and texture of fired samples (Cardiano et al., 2004; Cultrone et al., 2005a;
Özlaya and Böke, 2009), the provenance of raw materials (López-Arce et al., 2003; Maritan et
al., 2005; Miriello and Crisci, 2007) and firing conditions (Setti et al., 2012). Many other
researches have described the phase transformations taking place during firing of artificial
samples (Dondi et al., 1998; Duminuco et al., 1998; Riccardi et al., 1999; Elert K., 2003;
Aras, 2004; Cultrone et al., 2004; Monteiro and Fontes Vieria, 2004; Cultrone et al., 2005b;
Maritan et al., 2006; Nodari et al., 2007; Fabbri et al., 2014) and have greatly contributed to
our knowledge of the physical and mechanical changes according to raw material composition
and firing temperature (Cultrone et al., 2001b; Carretero et al., 2002; Jordan et al., 2008; De
Bonis et al., 2014). Porosity and decay have also been investigated, to evaluate the parameters
controlling durability, since bricks, like any other construction material, are affected by
various and sometimes combined deterioration phenomena when they are set in a building or
other type of structure (Valluzzi et al., 2002; Valluzzi et al., 2005; Anzani et al., 2010).
Examples are interactions with other materials nearby (Larbi, 2004; Cultrone et al., 2007),
environmental conditions, and the presence of soluble salts (Cultrone et al., 2000; Rodriguez-
Navarro et al., 2000; Benavente et al, 2003; Tsui et al., 2003; Van Hess and Brocken, 2004;
Benavente et al., 2006; Steiger and Asmussen, 2008) or ice (Grossi et al., 2007; Ducman et
al., 2011). Nevertheless, although extensive studies on ceramic materials have been carried
out, little research has focused on the real needs of brick industries. This work aims to close
this gap, in collaboration with the personnel of a brick factory and focusing on actual
requirements in industrial research, i.e., the creation of new mixes for specific situations (e.g.,
restoration of historical buildings) and the promotion of sustainable solutions in terms of
saving resources and energy. Replacing some particular types of bricks in a damaged historic
structure requires caution in operating in a way which is mechanically and chemically
compatible with the undamaged materials and in preserving the overall original appearance
(Cardiano et al., 2004). The brick industry is also encouraged to ensure quality, to improve
eco-friendly brick production, and to optimize firing conditions, while maintaining the
characteristics which make brick a traditional material, in which our cultural identity can be
recognised (Cultrone & Sebastian, 2009; Eliche-Quesada et al., 2012; Zhang, 2013; Monteiro
& Fontes Vieria, 2014).
Compared with natural stone, brick has the advantage that its technical and esthetic qualities
can be modified by changing the composition of raw materials and/or firing conditions to
obtain certain properties, depending on the position or function the brick is required to carry
CHAPTER II Results
29
out in a given place and environment. Identifying new mix designs for use in historic and
modern constructions is a challenge of prime interest for restorers and builders. This work
develops a valid multianalytical approach to study of the properties of bricks, starting from
five different types, four already on the market, in order to have a solid basis on which to
tackle the actual industrial challenge of identifying methods and criteria to introduce green
solutions to the market and ensure a leadership industry promoting excellence and innovation.
Improvements in quality and production are directly related to community needs, in terms not
only of type of final products, but also of actions giving rise to common wealth, energy
savings, preservation of resources in short supply and reduced emission of gases and
pollutants. Awareness of the close connections among mineralogy, porosity and physical
properties can lead to improved quality in the brick industry as a whole, allowing us to take
the next steps toward sustainable, compatible production and introducing new materials
adapted to particular cultural and environmental contexts.
2. Materials and methods
2.1 Raw materials and fired products
Three types of clay materials provided by the brick factory SanMarco-Terreal (Noale, Veneto,
Italy) were studied: LG (Laminato Giallo, i.e. “Yellow Laminated”), LRSS (Laminato Rosso,
“Red Laminated”) and LRS (Laminato Rosa, “Pink Laminated”). They mainly differ in the
amount of carbonates, LG being the richest in carbonates (45 wt% carbonates, 23 wt%
quartz), whereas LRSS and LRS are more siliceous (respectively 12 and 20 wt% carbonates,
and 35 wt% quartz). The manufacturers add 10 wt% of siliceous sand as temper to each of the
three clay materials. Sample were fired in a tunnel kiln, with the following temperature curve:
heated to maximum temperature in 1h and left at maximum temperature for 1 h (soaking
time).
From these clays, five types of bricks (GP, N, RSS, RS and R6) are currently produced by
SanMarco-Terreal according to the “soft mud” method: GP (Giallo Paglierino, i.e., “Straw
Yellow”) is a brick obtained with LG clay fired at 1050°C; N (Nero, “Black”) is a brick
produced with LG clay with the addition of 15 wt% of hausmannite powder (Mn3O4), to
obtain a dark gray product, and fired at 1050ºC; RSS (Rosso, “Red”) and R6 (Rosso600,
“Red600”) are prepared with LRSS clay and fired respectively at 950 and 600°C; RS
(Rosato, “Pink”) has LRS clay and is fired at 980°C (Table 1).
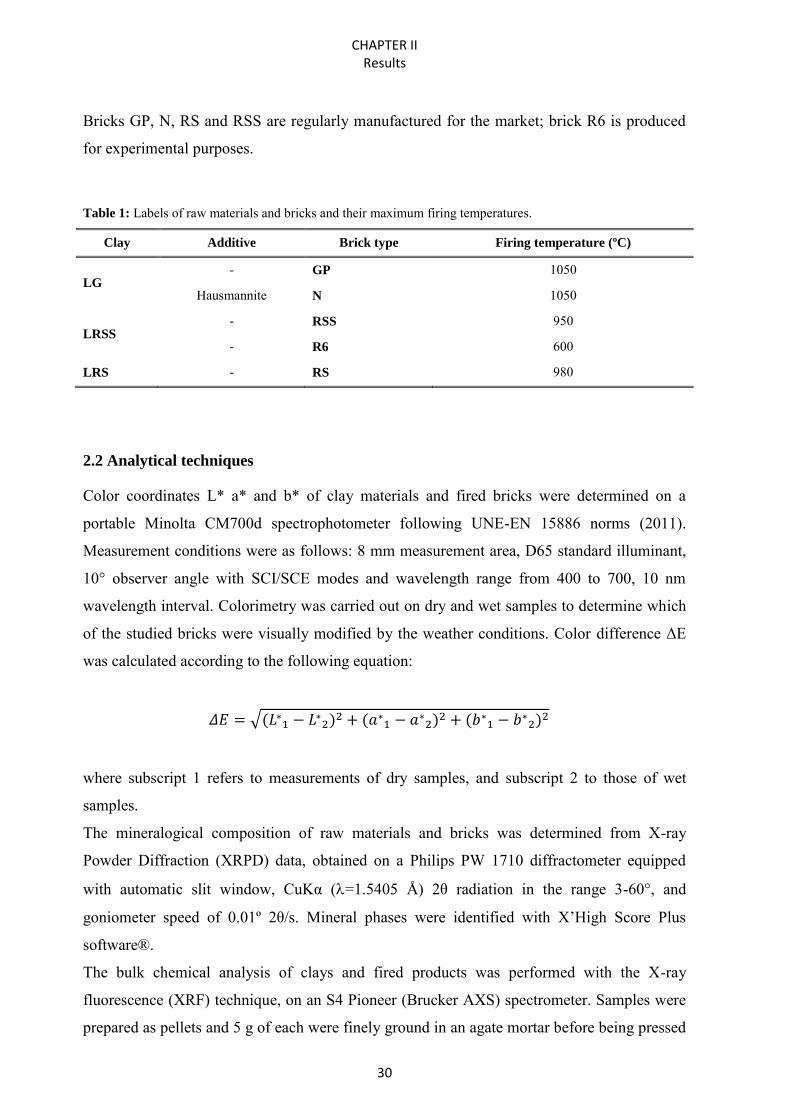
CHAPTER II Results
30
Bricks GP, N, RS and RSS are regularly manufactured for the market; brick R6 is produced
for experimental purposes.
Table 1: Labels of raw materials and bricks and their maximum firing temperatures.
Clay Additive Brick type Firing temperature (ºC)
LG - GP 1050
Hausmannite N 1050
LRSS - RSS 950
- R6 600
LRS - RS 980
2.2 Analytical techniques
Color coordinates L* a* and b* of clay materials and fired bricks were determined on a
portable Minolta CM700d spectrophotometer following UNE-EN 15886 norms (2011).
Measurement conditions were as follows: 8 mm measurement area, D65 standard illuminant,
10° observer angle with SCI/SCE modes and wavelength range from 400 to 700, 10 nm
wavelength interval. Colorimetry was carried out on dry and wet samples to determine which
of the studied bricks were visually modified by the weather conditions. Color difference ΔE
was calculated according to the following equation:
where subscript 1 refers to measurements of dry samples, and subscript 2 to those of wet
samples.
The mineralogical composition of raw materials and bricks was determined from X-ray
Powder Diffraction (XRPD) data, obtained on a Philips PW 1710 diffractometer equipped
with automatic slit window, CuKα (=1.5405 Å) 2θ radiation in the range 3-60°, and
goniometer speed of 0.01º 2θ/s. Mineral phases were identified with X’High Score Plus
software®.
The bulk chemical analysis of clays and fired products was performed with the X-ray
fluorescence (XRF) technique, on an S4 Pioneer (Brucker AXS) spectrometer. Samples were
prepared as pellets and 5 g of each were finely ground in an agate mortar before being pressed
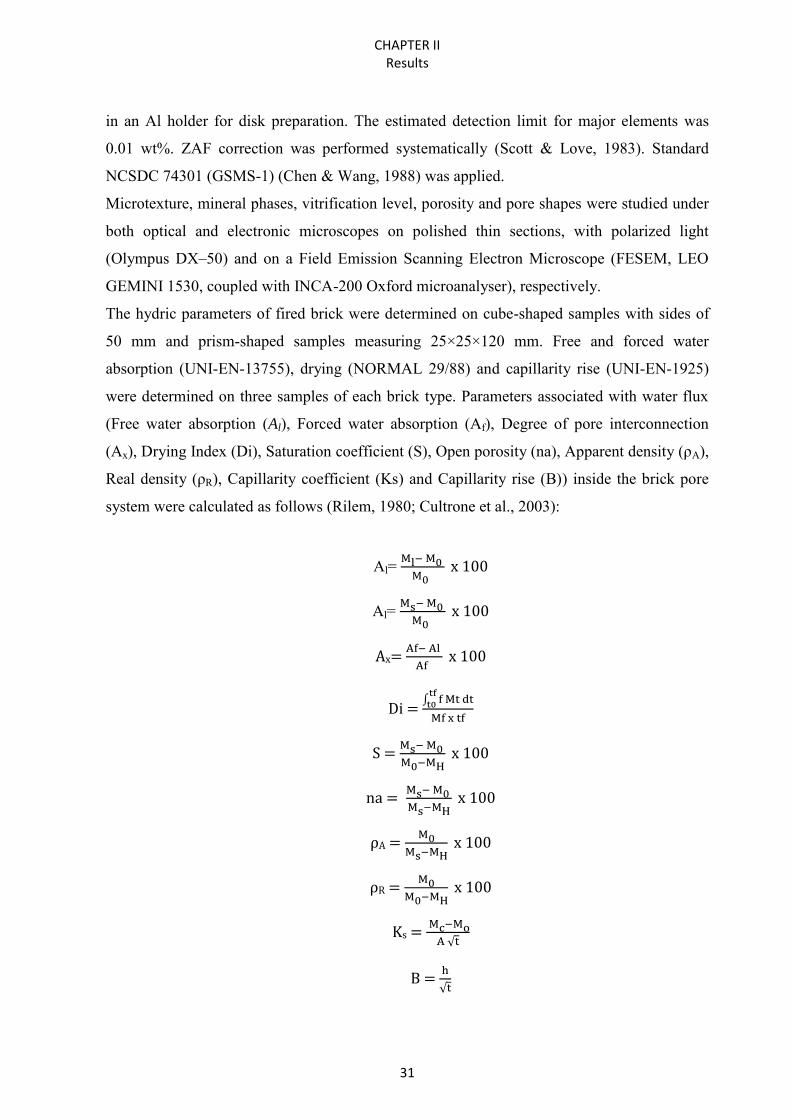
CHAPTER II Results
31
in an Al holder for disk preparation. The estimated detection limit for major elements was
0.01 wt%. ZAF correction was performed systematically (Scott & Love, 1983). Standard
NCSDC 74301 (GSMS-1) (Chen & Wang, 1988) was applied.
Microtexture, mineral phases, vitrification level, porosity and pore shapes were studied under
both optical and electronic microscopes on polished thin sections, with polarized light
(Olympus DX–50) and on a Field Emission Scanning Electron Microscope (FESEM, LEO
GEMINI 1530, coupled with INCA-200 Oxford microanalyser), respectively.
The hydric parameters of fired brick were determined on cube-shaped samples with sides of
50 mm and prism-shaped samples measuring 25×25×120 mm. Free and forced water
absorption (UNI-EN-13755), drying (NORMAL 29/88) and capillarity rise (UNI-EN-1925)
were determined on three samples of each brick type. Parameters associated with water flux
(Free water absorption (Al), Forced water absorption (Af), Degree of pore interconnection
(Ax), Drying Index (Di), Saturation coefficient (S), Open porosity (na), Apparent density (ρA),
Real density (ρR), Capillarity coefficient (Ks) and Capillarity rise (B)) inside the brick pore
system were calculated as follows (Rilem, 1980; Cultrone et al., 2003):
Al=
Al=
Ax=
Di =
S =
na =
ρA =
ρR =
Ks =
B =
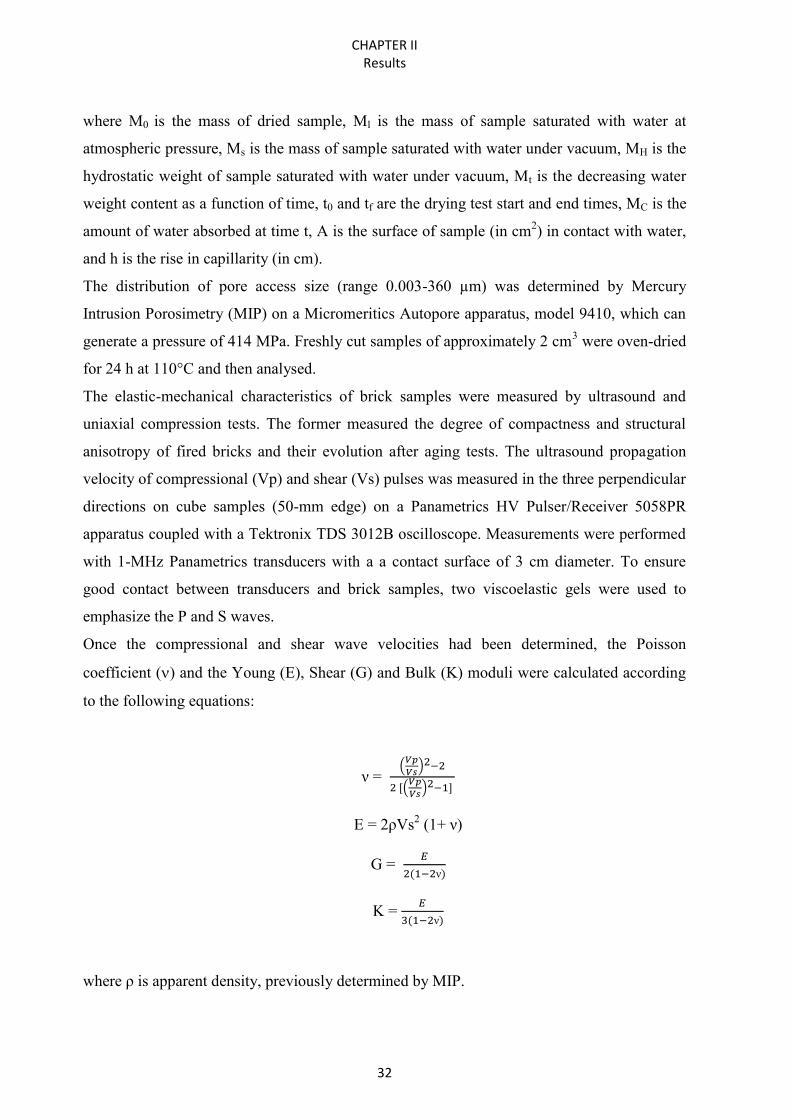
CHAPTER II Results
32
where M0 is the mass of dried sample, Ml is the mass of sample saturated with water at
atmospheric pressure, Ms is the mass of sample saturated with water under vacuum, MH is the
hydrostatic weight of sample saturated with water under vacuum, Mt is the decreasing water
weight content as a function of time, t0 and tf are the drying test start and end times, MC is the
amount of water absorbed at time t, A is the surface of sample (in cm2) in contact with water,
and h is the rise in capillarity (in cm).
The distribution of pore access size (range 0.003-360 µm) was determined by Mercury
Intrusion Porosimetry (MIP) on a Micromeritics Autopore apparatus, model 9410, which can
generate a pressure of 414 MPa. Freshly cut samples of approximately 2 cm3 were oven-dried
for 24 h at 110°C and then analysed.
The elastic-mechanical characteristics of brick samples were measured by ultrasound and
uniaxial compression tests. The former measured the degree of compactness and structural
anisotropy of fired bricks and their evolution after aging tests. The ultrasound propagation
velocity of compressional (Vp) and shear (Vs) pulses was measured in the three perpendicular
directions on cube samples (50-mm edge) on a Panametrics HV Pulser/Receiver 5058PR
apparatus coupled with a Tektronix TDS 3012B oscilloscope. Measurements were performed
with 1-MHz Panametrics transducers with a a contact surface of 3 cm diameter. To ensure
good contact between transducers and brick samples, two viscoelastic gels were used to
emphasize the P and S waves.
Once the compressional and shear wave velocities had been determined, the Poisson
coefficient () and the Young (E), Shear (G) and Bulk (K) moduli were calculated according
to the following equations:
ν =
E = 2ρVs2 (1+ ν)
G =
ν
K =
ν
where ρ is apparent density, previously determined by MIP.
CHAPTER II Results
33
Vp values were also useful in calculating the total (ΔM) and relative (m) anisotropies, as
follows (Guydader & Denis, 1986):
ΔM = (1-
) x100
m =
x 100
Uniaxial compressive strength and other mechanical characteristics of bricks were measured
according to UNI-EN 1926 (2007). Three cubic samples with 40-mm edges of each brick type
were tested at a loading rate of 20 Kg/s. Compressive strength σ (in Kg/cm2) was calculated
according to the following formula:
σ =
where F is the break load (in Kg) and A is the sample area (in cm2).
Accelerated aging tests were carried on three cubic samples (50-mm edge) per brick type, to
evaluate their resistance to frost and salt crystallization. Freeze-thaw and salt crystallization
tests were carried out according to UNI EN 12371 and UNI EN 12370 norms, respectively.
The former consists of 30 cycles each lasting 24 h. Each cycle includes 8 h of freezing at -
12°C and 16 h at +20°C of thawing in water. The salt crystallization test consists of 10 24-h
cycles, during which samples were immersed for 4 hours in a 14 wt.% solution of NaSO4 ∙10
H2O at 20°C, dried for 16 h in an electric oven at 100 °C, and cooled for 4 h at 20°C.
In both tests, the samples were weighed at each cycle and carefully observed by visual
inspection to check their progressive decay. At regular intervals of 5 cycles during the freeze-
thaw test and 3 cycles of salt crystallization, sample compactness was also monitored by
ultrasound.
MIP was again performed on deteriorated samples after the salt crystallization test, to evaluate
any changes in pore distribution or size. Samples were washed several times to ensure salt
removal before MIP analysis
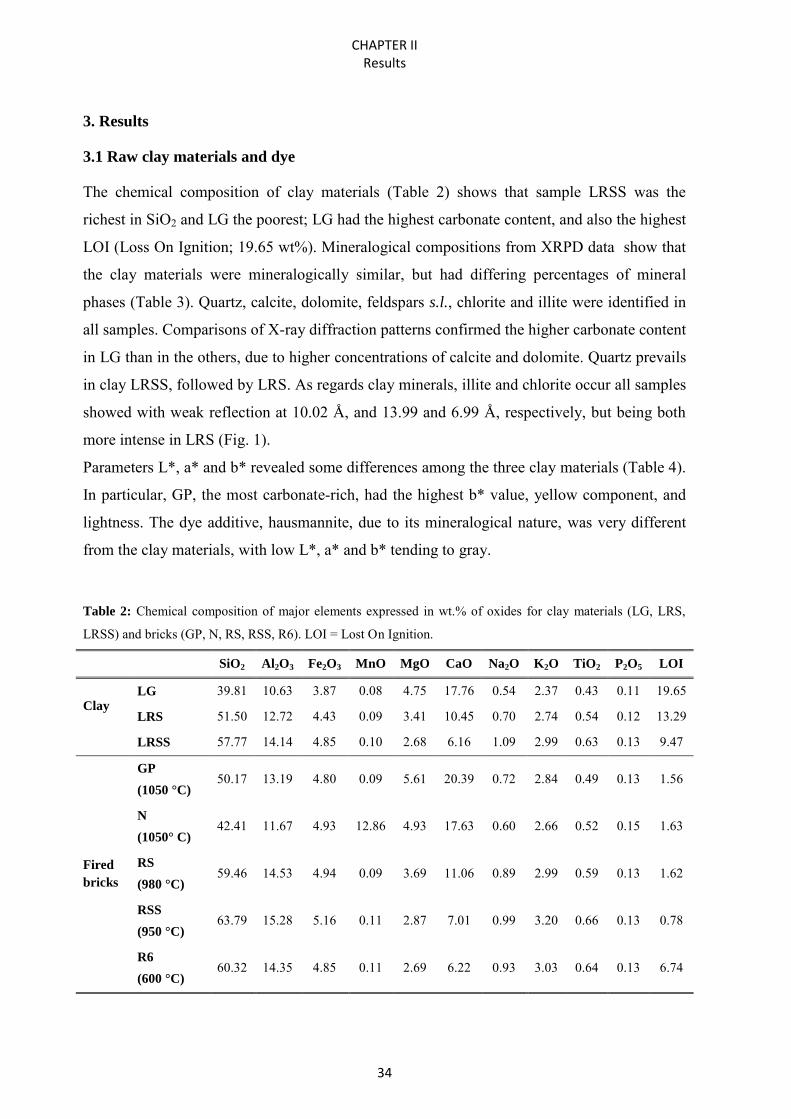
CHAPTER II Results
34
3. Results
3.1 Raw clay materials and dye
The chemical composition of clay materials (Table 2) shows that sample LRSS was the
richest in SiO2 and LG the poorest; LG had the highest carbonate content, and also the highest
LOI (Loss On Ignition; 19.65 wt%). Mineralogical compositions from XRPD data show that
the clay materials were mineralogically similar, but had differing percentages of mineral
phases (Table 3). Quartz, calcite, dolomite, feldspars s.l., chlorite and illite were identified in
all samples. Comparisons of X-ray diffraction patterns confirmed the higher carbonate content
in LG than in the others, due to higher concentrations of calcite and dolomite. Quartz prevails
in clay LRSS, followed by LRS. As regards clay minerals, illite and chlorite occur all samples
showed with weak reflection at 10.02 Å, and 13.99 and 6.99 Å, respectively, but being both
more intense in LRS (Fig. 1).
Parameters L*, a* and b* revealed some differences among the three clay materials (Table 4).
In particular, GP, the most carbonate-rich, had the highest b* value, yellow component, and
lightness. The dye additive, hausmannite, due to its mineralogical nature, was very different
from the clay materials, with low L*, a* and b* tending to gray.
Table 2: Chemical composition of major elements expressed in wt.% of oxides for clay materials (LG, LRS,
LRSS) and bricks (GP, N, RS, RSS, R6). LOI = Lost On Ignition.
SiO2 Al2O3 Fe2O3 MnO MgO CaO Na2O K2O TiO2 P2O5 LOI
Clay
LG 39.81 10.63 3.87 0.08 4.75 17.76 0.54 2.37 0.43 0.11 19.65
LRS 51.50 12.72 4.43 0.09 3.41 10.45 0.70 2.74 0.54 0.12 13.29
LRSS 57.77 14.14 4.85 0.10 2.68 6.16 1.09 2.99 0.63 0.13 9.47
Fired
bricks
GP
(1050 °C) 50.17 13.19 4.80 0.09 5.61 20.39 0.72 2.84 0.49 0.13 1.56
N
(1050° C) 42.41 11.67 4.93 12.86 4.93 17.63 0.60 2.66 0.52 0.15 1.63
RS
(980 °C) 59.46 14.53 4.94 0.09 3.69 11.06 0.89 2.99 0.59 0.13 1.62
RSS
(950 °C) 63.79 15.28 5.16 0.11 2.87 7.01 0.99 3.20 0.66 0.13 0.78
R6
(600 °C) 60.32 14.35 4.85 0.11 2.69 6.22 0.93 3.03 0.64 0.13 6.74
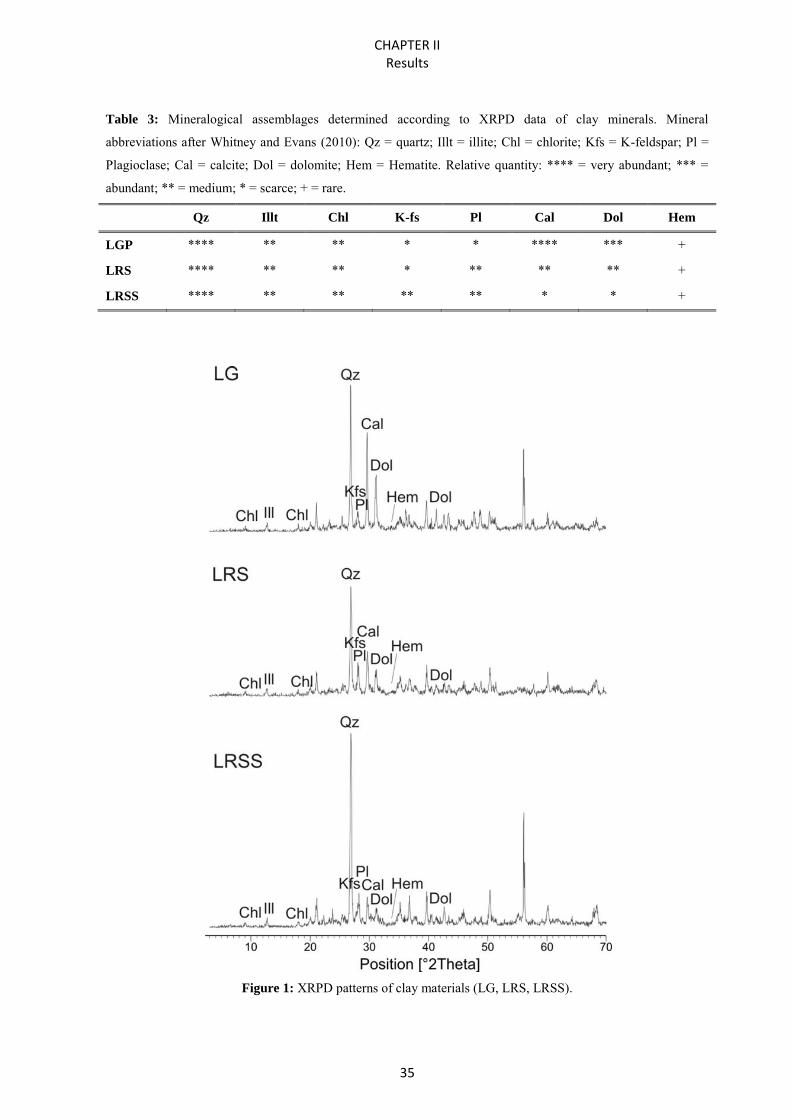
CHAPTER II Results
35
Table 3: Mineralogical assemblages determined according to XRPD data of clay minerals. Mineral
abbreviations after Whitney and Evans (2010): Qz = quartz; Illt = illite; Chl = chlorite; Kfs = K-feldspar; Pl =
Plagioclase; Cal = calcite; Dol = dolomite; Hem = Hematite. Relative quantity: **** = very abundant; *** =
abundant; ** = medium; * = scarce; + = rare.
Qz Illt Chl K-fs Pl Cal Dol Hem
LGP **** ** ** * * **** *** +
LRS **** ** ** * ** ** ** +
LRSS **** ** ** ** ** * * +
Figure 1: XRPD patterns of clay materials (LG, LRS, LRSS).
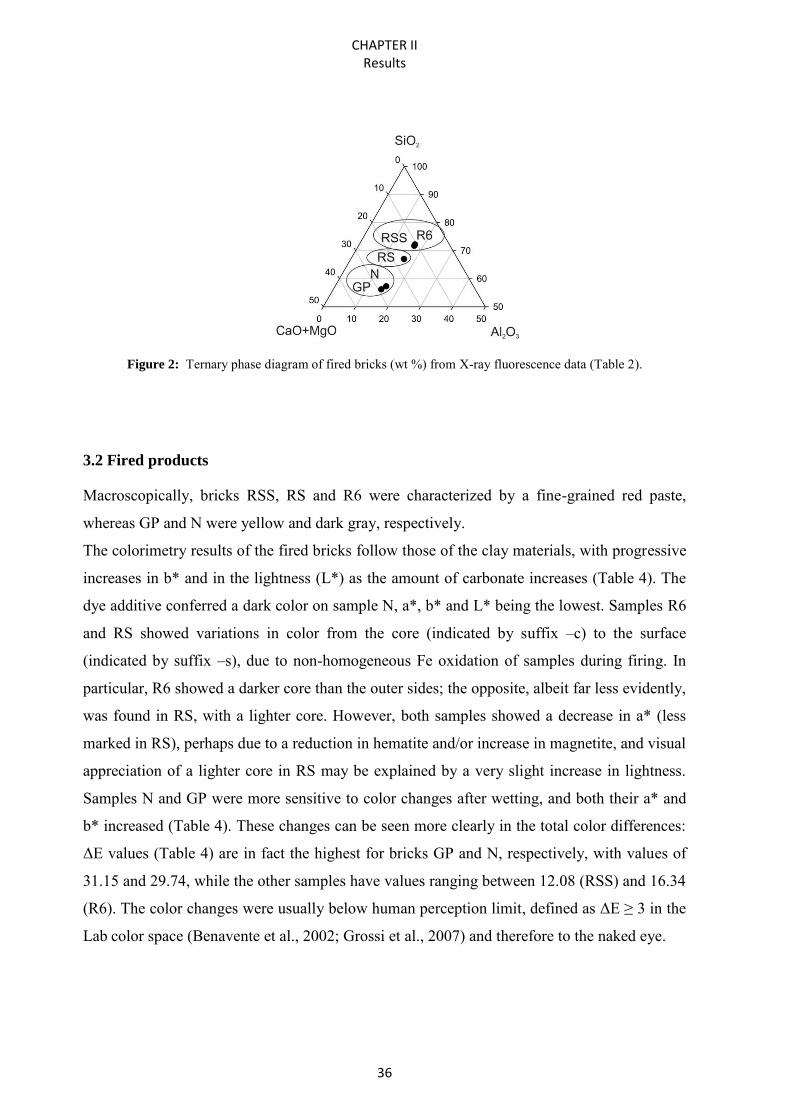
CHAPTER II Results
36
Figure 2: Ternary phase diagram of fired bricks (wt %) from X-ray fluorescence data (Table 2).
3.2 Fired products
Macroscopically, bricks RSS, RS and R6 were characterized by a fine-grained red paste,
whereas GP and N were yellow and dark gray, respectively.
The colorimetry results of the fired bricks follow those of the clay materials, with progressive
increases in b* and in the lightness (L*) as the amount of carbonate increases (Table 4). The
dye additive conferred a dark color on sample N, a*, b* and L* being the lowest. Samples R6
and RS showed variations in color from the core (indicated by suffix –c) to the surface
(indicated by suffix –s), due to non-homogeneous Fe oxidation of samples during firing. In
particular, R6 showed a darker core than the outer sides; the opposite, albeit far less evidently,
was found in RS, with a lighter core. However, both samples showed a decrease in a* (less
marked in RS), perhaps due to a reduction in hematite and/or increase in magnetite, and visual
appreciation of a lighter core in RS may be explained by a very slight increase in lightness.
Samples N and GP were more sensitive to color changes after wetting, and both their a* and
b* increased (Table 4). These changes can be seen more clearly in the total color differences:
ΔE values (Table 4) are in fact the highest for bricks GP and N, respectively, with values of
31.15 and 29.74, while the other samples have values ranging between 12.08 (RSS) and 16.34
(R6). The color changes were usually below human perception limit, defined as ΔE ≥ 3 in the
Lab color space (Benavente et al., 2002; Grossi et al., 2007) and therefore to the naked eye.
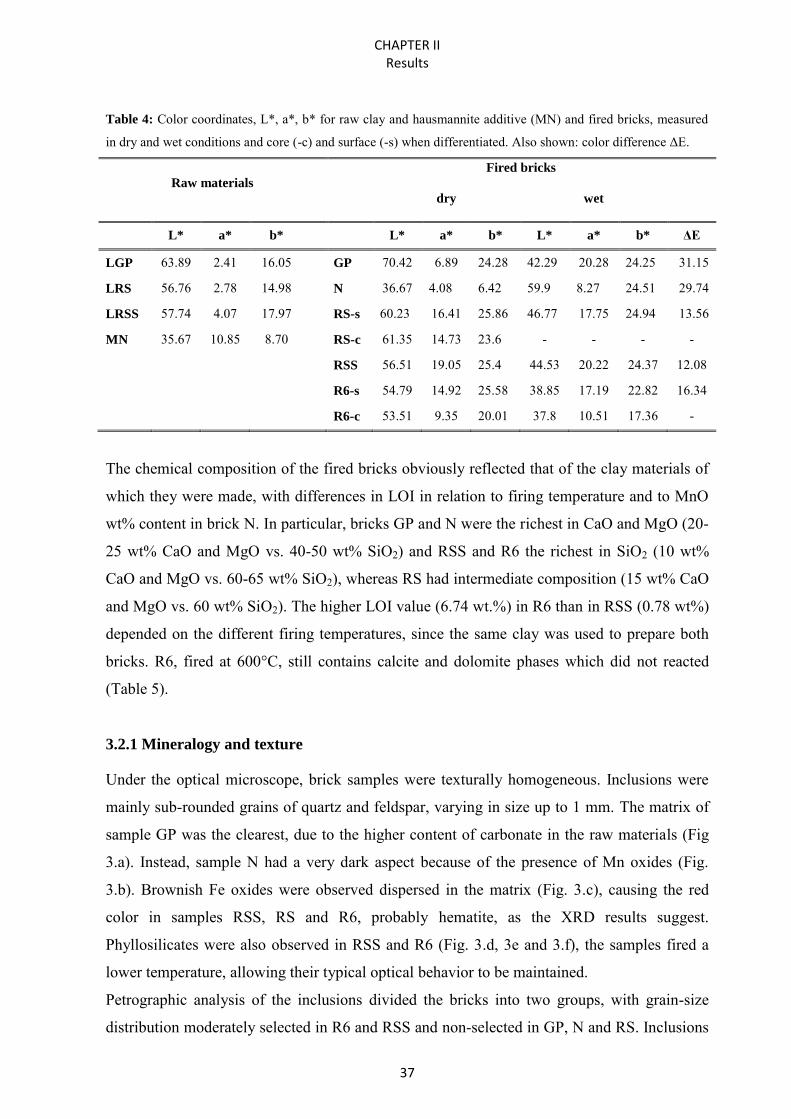
CHAPTER II Results
37
Table 4: Color coordinates, L*, a*, b* for raw clay and hausmannite additive (MN) and fired bricks, measured
in dry and wet conditions and core (-c) and surface (-s) when differentiated. Also shown: color difference ΔE.
Raw materials
Fired bricks
dry wet
L* a* b* L* a* b* L* a* b* ΔE
LGP 63.89 2.41 16.05 GP 70.42 6.89 24.28 42.29 20.28 24.25 31.15
LRS 56.76 2.78 14.98 N 36.67 4.08 6.42 59.9 8.27 24.51 29.74
LRSS 57.74 4.07 17.97 RS-s 60.23 16.41 25.86 46.77 17.75 24.94 13.56
MN 35.67 10.85 8.70 RS-c 61.35 14.73 23.6 - - - -
RSS 56.51 19.05 25.4 44.53 20.22 24.37 12.08
R6-s 54.79 14.92 25.58 38.85 17.19 22.82 16.34
R6-c 53.51 9.35 20.01 37.8 10.51 17.36 -
The chemical composition of the fired bricks obviously reflected that of the clay materials of
which they were made, with differences in LOI in relation to firing temperature and to MnO
wt% content in brick N. In particular, bricks GP and N were the richest in CaO and MgO (20-
25 wt% CaO and MgO vs. 40-50 wt% SiO2) and RSS and R6 the richest in SiO2 (10 wt%
CaO and MgO vs. 60-65 wt% SiO2), whereas RS had intermediate composition (15 wt% CaO
and MgO vs. 60 wt% SiO2). The higher LOI value (6.74 wt.%) in R6 than in RSS (0.78 wt%)
depended on the different firing temperatures, since the same clay was used to prepare both
bricks. R6, fired at 600°C, still contains calcite and dolomite phases which did not reacted
(Table 5).
3.2.1 Mineralogy and texture
Under the optical microscope, brick samples were texturally homogeneous. Inclusions were
mainly sub-rounded grains of quartz and feldspar, varying in size up to 1 mm. The matrix of
sample GP was the clearest, due to the higher content of carbonate in the raw materials (Fig
3.a). Instead, sample N had a very dark aspect because of the presence of Mn oxides (Fig.
3.b). Brownish Fe oxides were observed dispersed in the matrix (Fig. 3.c), causing the red
color in samples RSS, RS and R6, probably hematite, as the XRD results suggest.
Phyllosilicates were also observed in RSS and R6 (Fig. 3.d, 3e and 3.f), the samples fired a
lower temperature, allowing their typical optical behavior to be maintained.
Petrographic analysis of the inclusions divided the bricks into two groups, with grain-size
distribution moderately selected in R6 and RSS and non-selected in GP, N and RS. Inclusions
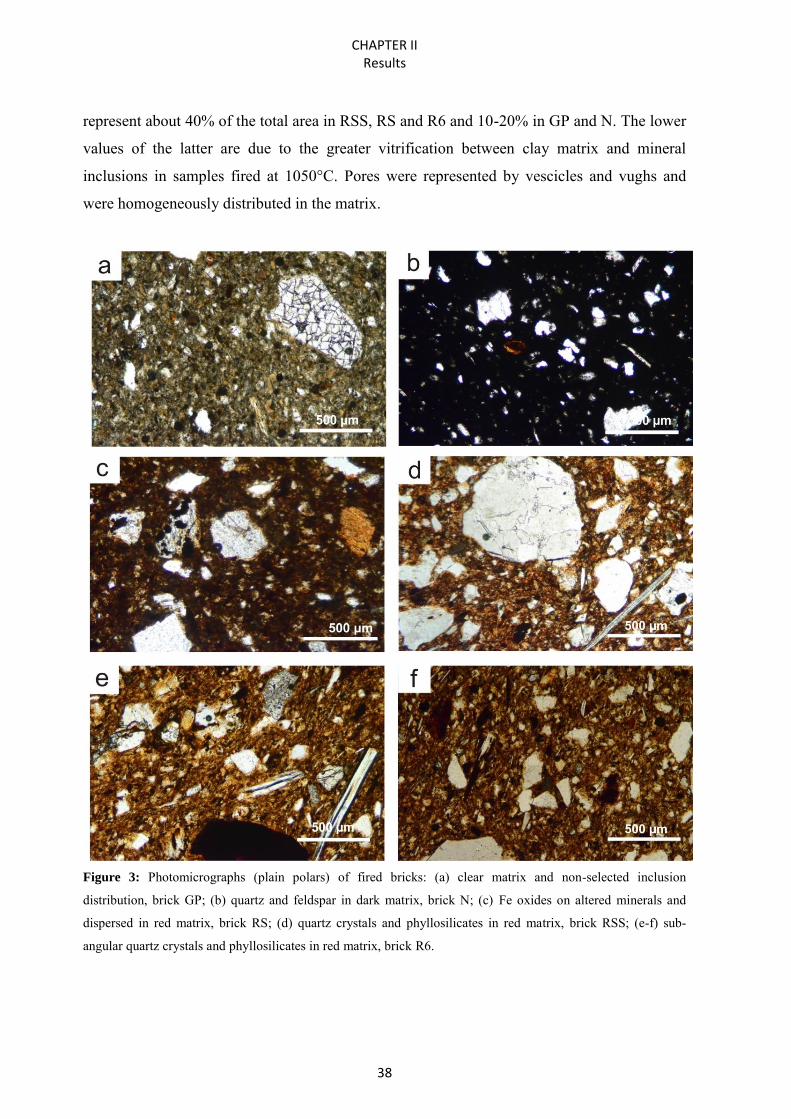
CHAPTER II Results
38
represent about 40% of the total area in RSS, RS and R6 and 10-20% in GP and N. The lower
values of the latter are due to the greater vitrification between clay matrix and mineral
inclusions in samples fired at 1050°C. Pores were represented by vescicles and vughs and
were homogeneously distributed in the matrix.
Figure 3: Photomicrographs (plain polars) of fired bricks: (a) clear matrix and non-selected inclusion
distribution, brick GP; (b) quartz and feldspar in dark matrix, brick N; (c) Fe oxides on altered minerals and
dispersed in red matrix, brick RS; (d) quartz crystals and phyllosilicates in red matrix, brick RSS; (e-f) sub-
angular quartz crystals and phyllosilicates in red matrix, brick R6.
CHAPTER II Results
39
The mineral composition of samples determined by XRPD analysis (Table 5) showed that
RSS, RS, GP and N were composed of quartz, gehlenite, anorthite, sanidine and diopside,
matching the high temperatures these samples reached during firing. The new phases were
less abundant in RSS than in the other samples. Peaks of illite and chlorite were still present
in R6 because of its low firing temperature (600°C), due to weak reaction processes which
were either very slight or did not take place at all. These phases disappear when the firing
temperature exceeds 900°C (Cultrone et al., 2005b; Maritan et al., 2006), and this was
confirmed by their absence in RSS, RS, GP and N.
As regards mineral transformations, calcite starts to react with illite to form gehlenite at 800-
850ºC and with quartz to form Ca-rich silicates such as wollastonite at higher temperatures
(900-1000ºC) (Duminuco et al., 1998; Riccardi et al., 1999), according to the following
equations:
(1) 1.2 CaCO3 (Calcite) + 0.4 KAl4Si7O20(OH)4 → 0.6 Ca2Al2SiO7 (Gehlenite) + 0.4
KAlSi3O8 (K-feldspar) + 1.6 H20 + 1.2 CO2
(2) CaCO3 (Calcite) + SiO2 (Quartz) → CaSiO3 (Wollastonite) + CO2
Feldpars were present in all samples but, although R6 contained orthoclase from the raw
material, in the other bricks this feldspar changed into sanidine, a more stable high-
temperature polymorph (Cultrone et al., 2001a). Na-Ca plagioclases assumed anorthitic
composition as follows:
(3) Ca2Al2SiO7 (Gehlenite) + 2SiO2 (Quartz) → CaSiO3 (Wollastonite) + CaAl2Si2O8
(Anorthite)
In the temperature range 900-1050°C, diopside is arranged from dolomite and quartz as
follows (Cultrone et al. 2001a):
(4) CaMg(CO3)2 (Dolomite) + SiO2 (Quartz) → CaMgSi2O6 (Diopside)
Sample N was rich in bustamite, CaMn(Si2O6), which developed from the reaction of
hausmannite with calcite and quartz. Mn2+ cations from hausmannite partially substituted
Ca2+ cations during the formation of new silicate phase, as follows:
CHAPTER II Results
40
(5) CaCO3 (Calcite) + Mn3O4 (Hausmannite) + 2SiO2 (Quartz) → CaMn(Si2O6) (Bustamite) +
Mn2O3 + CO2
The diffractograms of GP and N showed higher background noise than the others because of
the high firing temperature, reaching the amorphous phase (Am; Table 5). The higher
amorphous phase in N, produced with the same clay material and at the firing temperature of
GP (1050°C), depended on the addition of hausmannite, which acts as a flux agent, promoting
the melting process.
High resolution FESEM analysis allowed detailed study of brick textures and of the reaction
rims between carbonates and silicates to form new phases. In brick R6, fired at 600°C, only
incipient dehydroxylation and decarbonation were observed. Phyllosilicates maintained their
sheet-like fabric, although the loss of OH- groups revealed exfoliation along basal plans.
Carbonates were still recognizable, but secondary porosity appeared, due to release of CO2
from the crystals. This phenomenon has already been observed in Ca-rich ceramics fired at
low temperatures (Cultrone et al., 2014). Firing-induced transformation of feldspar grains was
evident along preferential lines (Fig. 4.a) and to the boundaries. No evidence of melting could
be seen in the groundmass.
In RS, fired at 980°C, dehydroxylation was more extensive than in R6 and showed
pseudomorphs of phyllosilicates (Fig. 4.b). Dolomite and calcite were totally decomposed,
losing CO2, and Mg and Ca oxides reacted with silicates to develop rims along the borders of
pre-existing carbonates. EDX analysis revealed the presence of wollastonite, growing close to
quartz and calcite grains, with fibrous habit and with nearly the same Ca:Si ratio (Fig. 4.c).
As regards brick RSS, fired at 950°C, both textural features and mineralogical patterns were
very similar to those of RS. Carbonates were totally decomposed and new phases had formed.
Feldspar showed reaction rims with calcite, with progressive Ca enrichment (Fig. 4.d). As
point analysis of the edges showed reactions, EDX spectra revealed several phases with no
stoichiometric composition, due to sub-solidus reactions, with a passage to gehlenite (spectra
of Fig. 4.d), as also attested by XRPD analyses.
Bricks GP and N (fired at 1050°C) showed a melted groundmass and well-developed reaction
bridges, especially along quartz and feldspar borders. At 1050°C, phyllosilicates were totally
dehydroxylated. Firing had transformed the structure, giving rise to abundant secondary
bubbles and Fe-bearing oxides. Grains of quartz and K-feldspar showed evident
transformation processes at the rims. Diopside was seen growing around quartz boundaries
(Fig. 4.e) and gehlenite along K-feldspar crystals (Fig. 4.f).
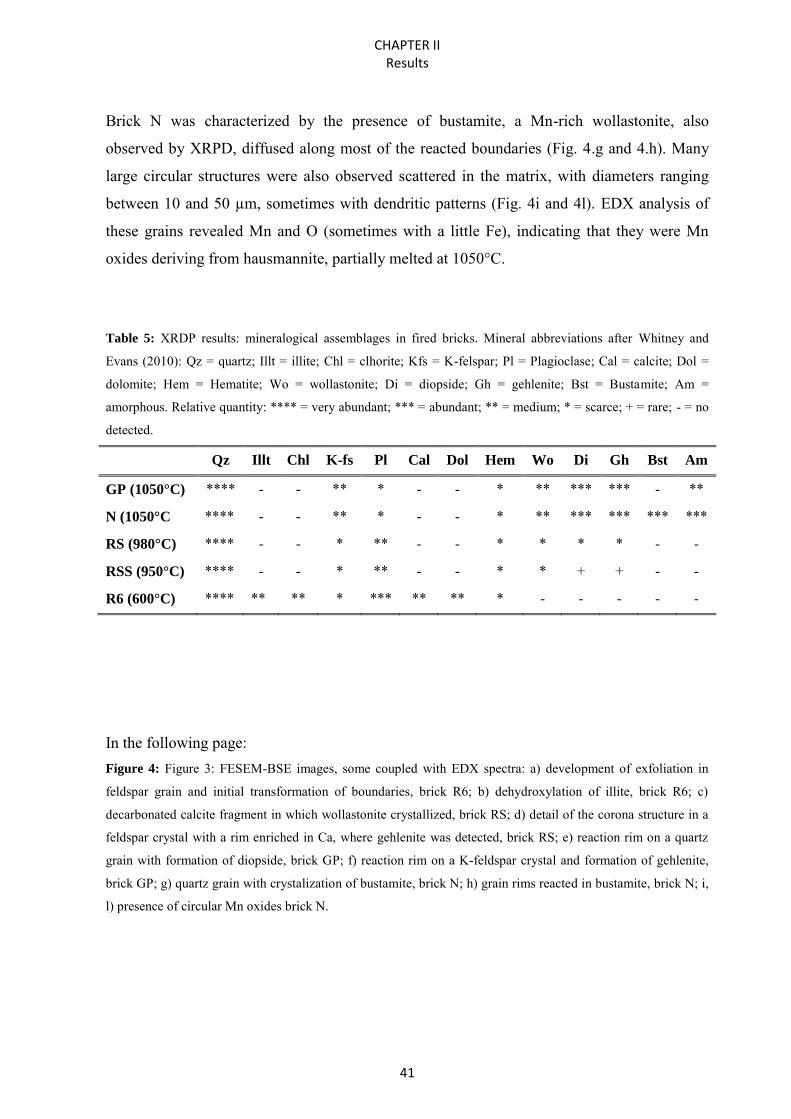
CHAPTER II Results
41
Brick N was characterized by the presence of bustamite, a Mn-rich wollastonite, also
observed by XRPD, diffused along most of the reacted boundaries (Fig. 4.g and 4.h). Many
large circular structures were also observed scattered in the matrix, with diameters ranging
between 10 and 50 µm, sometimes with dendritic patterns (Fig. 4i and 4l). EDX analysis of
these grains revealed Mn and O (sometimes with a little Fe), indicating that they were Mn
oxides deriving from hausmannite, partially melted at 1050°C.
Table 5: XRDP results: mineralogical assemblages in fired bricks. Mineral abbreviations after Whitney and
Evans (2010): Qz = quartz; Illt = illite; Chl = clhorite; Kfs = K-felspar; Pl = Plagioclase; Cal = calcite; Dol =
dolomite; Hem = Hematite; Wo = wollastonite; Di = diopside; Gh = gehlenite; Bst = Bustamite; Am =
amorphous. Relative quantity: **** = very abundant; *** = abundant; ** = medium; * = scarce; + = rare; - = no
detected.
Qz Illt Chl K-fs Pl Cal Dol Hem Wo Di Gh Bst Am
GP (1050°C) **** - - ** * - - * ** *** *** - **
N (1050°C **** - - ** * - - * ** *** *** *** ***
RS (980°C) **** - - * ** - - * * * * - -
RSS (950°C) **** - - * ** - - * * + + - -
R6 (600°C) **** ** ** * *** ** ** * - - - - -
In the following page: Figure 4: Figure 3: FESEM-BSE images, some coupled with EDX spectra: a) development of exfoliation in
feldspar grain and initial transformation of boundaries, brick R6; b) dehydroxylation of illite, brick R6; c)
decarbonated calcite fragment in which wollastonite crystallized, brick RS; d) detail of the corona structure in a
feldspar crystal with a rim enriched in Ca, where gehlenite was detected, brick RS; e) reaction rim on a quartz
grain with formation of diopside, brick GP; f) reaction rim on a K-feldspar crystal and formation of gehlenite,
brick GP; g) quartz grain with crystalization of bustamite, brick N; h) grain rims reacted in bustamite, brick N; i,
l) presence of circular Mn oxides brick N.
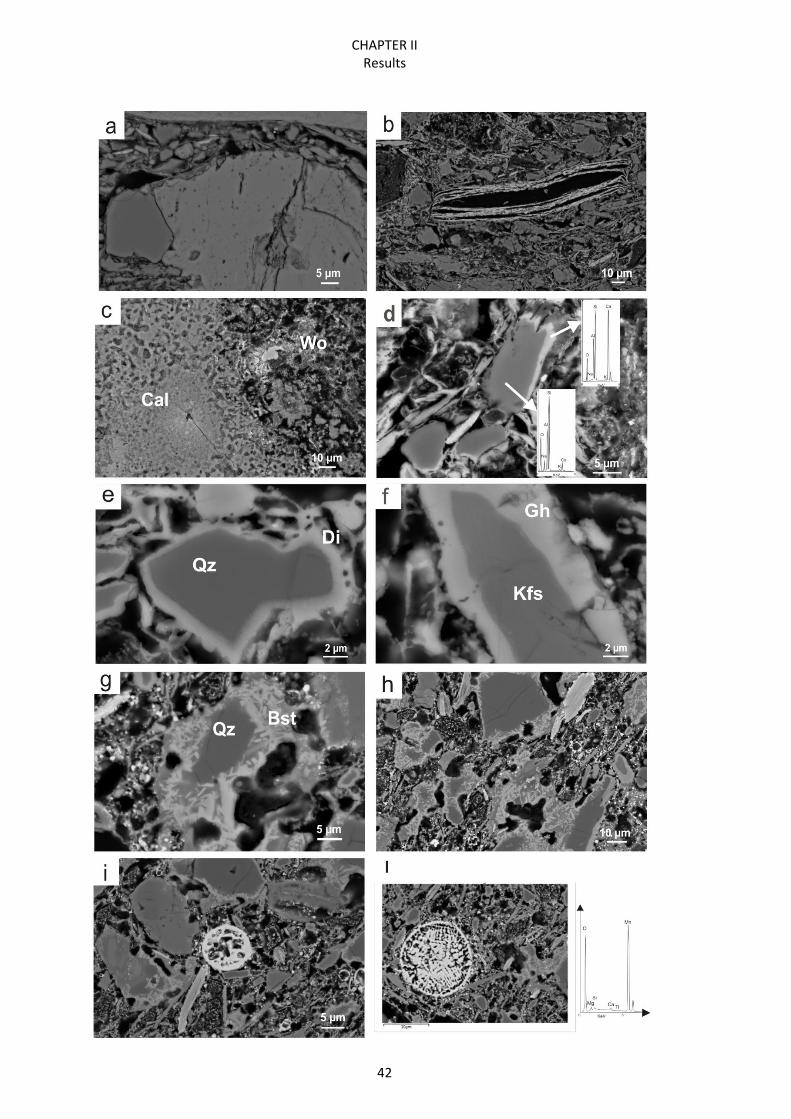
CHAPTER II Results
42
CHAPTER II Results
43
3.2.2 Water behavior and pore system
The hydric parameters of fired samples are listed in Table 6 and shown in Figure 5. GP was
the brick with the highest free and forced absorption values (Ab = 27.63%, Af = 28.71%,
respectively). N, RS and RSS showed intermediate values, whereas R6 stood out for its low
capacity to absorb water (Ab = 17.36%, Af = 17.88%).
RS showed the best pore interconnections (Ax = 2.12%), followed by R6 and N. RSS had the
highest value (Ax = 7.35%), indicating the presence of pores with little access to water.
However, all samples dried within 200 hours, had similar drying curves (Fig. 5), and their
drying indexes were all very similar. GP had the lowest drying index (Di = 1.35); R6 had the
slowest water release (Di = 1.37) (see Table 6).
Saturation coefficient S was > 90% for all bricks, confirming good water absorption behavior.
The percentage of open porosity po follows the extent of carbonate content in samples. GP
and N, the most carbonatic bricks, had the highest values of open porosity (41.36% and
40.56%, respectively), RSS and RS were intermediate (37.52%, 36.75%) and R6 was the
lowest (31.14%). Microscopic observations also confirmed that N and GP appear texturally
similar, with uniform fine porosity, except for sporadic large pores; RS had similar porosity,
but was more homogeneous in size; RSS and R6 were characterized by matrices with diffuse
small pores. This was due to the fact that carbonates leave empty spaces during
decomposition and may develop fissures around their grains, increasing open porosity. This
phenomenon was not observed in R6, in which carbonate grains were still present.
The results of the capillarity test highlighted the trend followed by free water absorption
(Table 6). Sample GP had a capillarity rise of 0.43; R6 had the lowest value (Ks = 0.16); and
N, RS and RSS were intermediate. Capillarity is an important parameter as regards brick
durability, and this behavior suggests that GP is the brick most sensitive to deterioration.
Pore size distribution (PSD), evaluated by MIP, showed that GP was characterized by
unimodal distribution, with a peak around 1 µm of pore radius (Fig. 6). This confirmed its
higher capillarity attitude (fired at 1050°C) with respect to that of the other bricks, and it did
have a pore system characterized by the highest number of pores of critical size, favoring
capillarity (0.1-10 µm). Instead, brick R6 (fired at 600°C) had very many small pores (< 0.1
µm) and was the least affected by capillarity rise. N, RS and RSS had similar capillarity
values. The PSD of sample N (fired at 1100°C) was very similar to that of GP. Its lower
predisposition to capillarity rise was due to several characteristics, such as lower porosity
(46.87%), lower number of pores around 1 µm, and a better pore interconnections (Ax).
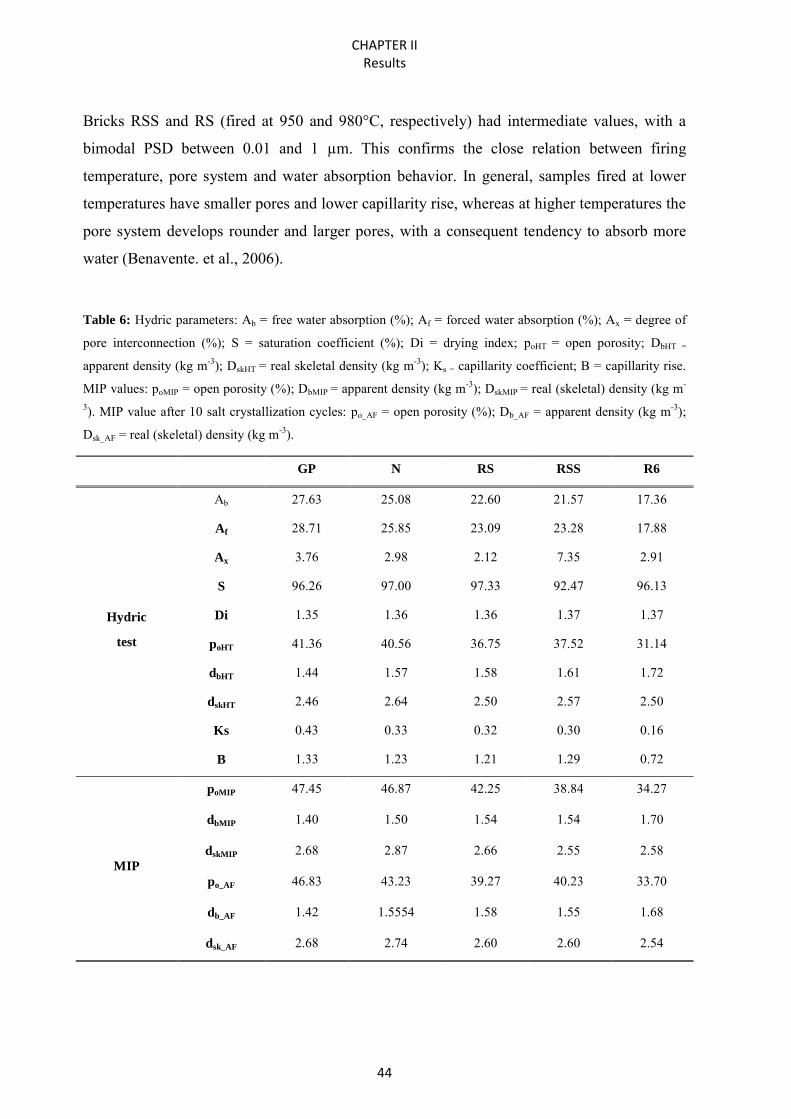
CHAPTER II Results
44
Bricks RSS and RS (fired at 950 and 980°C, respectively) had intermediate values, with a
bimodal PSD between 0.01 and 1 µm. This confirms the close relation between firing
temperature, pore system and water absorption behavior. In general, samples fired at lower
temperatures have smaller pores and lower capillarity rise, whereas at higher temperatures the
pore system develops rounder and larger pores, with a consequent tendency to absorb more
water (Benavente. et al., 2006).
Table 6: Hydric parameters: Ab = free water absorption (%); Af = forced water absorption (%); Ax = degree of
pore interconnection (%); S = saturation coefficient (%); Di = drying index; poHT = open porosity; DbHT =
apparent density (kg m-3); DskHT = real skeletal density (kg m-3); Ks = capillarity coefficient; B = capillarity rise.
MIP values: poMIP = open porosity (%); DbMIP = apparent density (kg m-3); DskMIP = real (skeletal) density (kg m-
3). MIP value after 10 salt crystallization cycles: po_AF = open porosity (%); Db_AF = apparent density (kg m-3);
Dsk_AF = real (skeletal) density (kg m-3).
GP N RS RSS R6
Hydric
test
Ab 27.63 25.08 22.60 21.57 17.36
Af 28.71 25.85 23.09 23.28 17.88
Ax 3.76 2.98 2.12 7.35 2.91
S 96.26 97.00 97.33 92.47 96.13
Di 1.35 1.36 1.36 1.37 1.37
poHT 41.36 40.56 36.75 37.52 31.14
dbHT 1.44 1.57 1.58 1.61 1.72
dskHT 2.46 2.64 2.50 2.57 2.50
Ks 0.43 0.33 0.32 0.30 0.16
B 1.33 1.23 1.21 1.29 0.72
MIP
poMIP 47.45 46.87 42.25 38.84 34.27
dbMIP 1.40 1.50 1.54 1.54 1.70
dskMIP 2.68 2.87 2.66 2.55 2.58
po_AF 46.83 43.23 39.27 40.23 33.70
db_AF 1.42 1.5554 1.58 1.55 1.68
dsk_AF 2.68 2.74 2.60 2.60 2.54
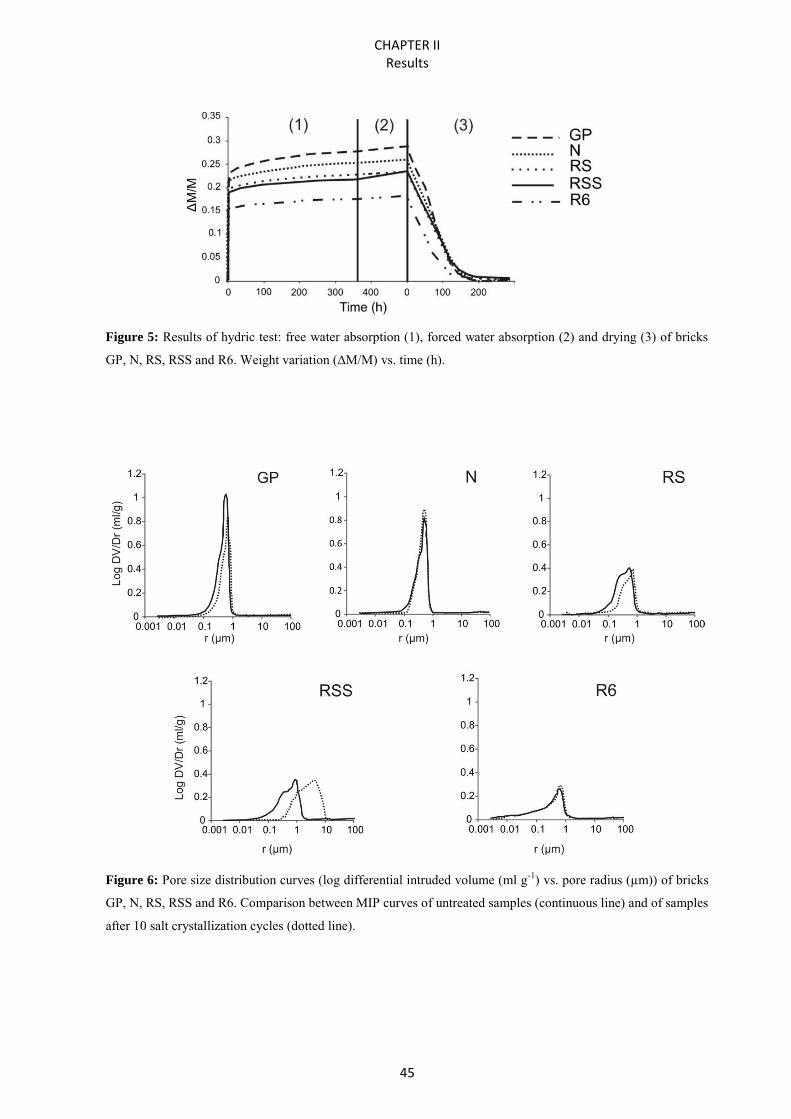
CHAPTER II Results
45
Figure 5: Results of hydric test: free water absorption (1), forced water absorption (2) and drying (3) of bricks
GP, N, RS, RSS and R6. Weight variation (ΔM/M) vs. time (h).
Figure 6: Pore size distribution curves (log differential intruded volume (ml g-1) vs. pore radius (µm)) of bricks
GP, N, RS, RSS and R6. Comparison between MIP curves of untreated samples (continuous line) and of samples
after 10 salt crystallization cycles (dotted line).
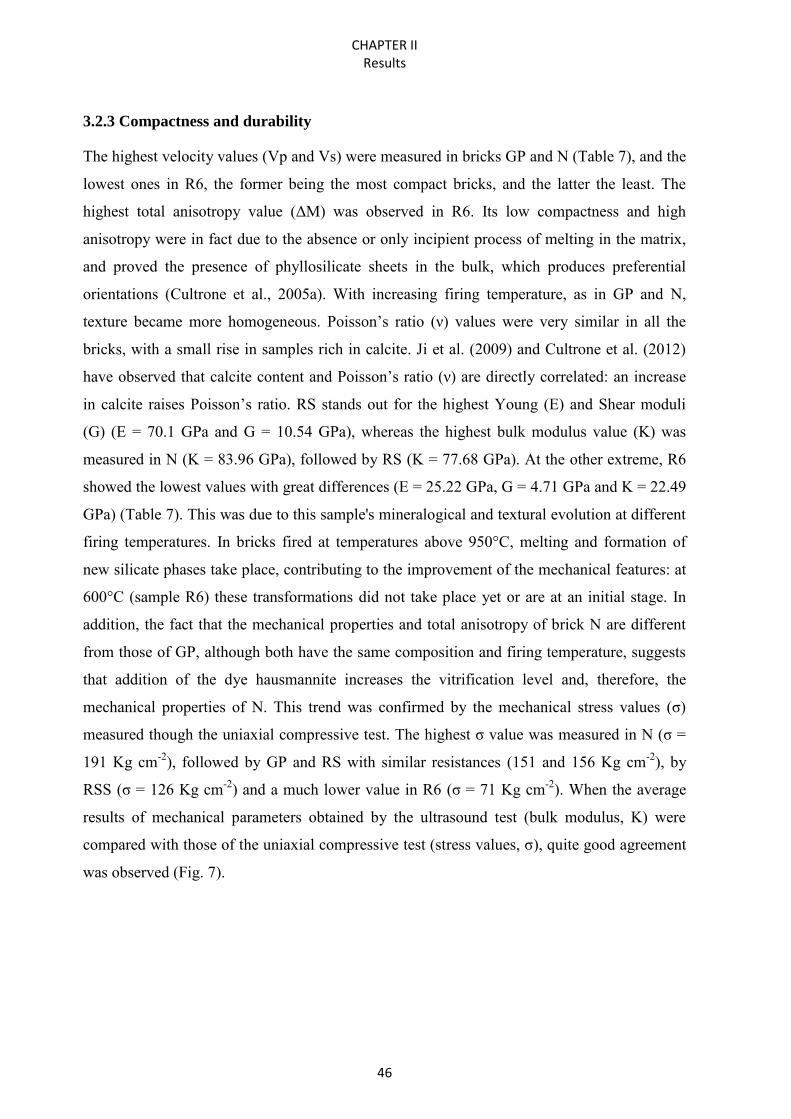
CHAPTER II Results
46
3.2.3 Compactness and durability
The highest velocity values (Vp and Vs) were measured in bricks GP and N (Table 7), and the
lowest ones in R6, the former being the most compact bricks, and the latter the least. The
highest total anisotropy value (ΔM) was observed in R6. Its low compactness and high
anisotropy were in fact due to the absence or only incipient process of melting in the matrix,
and proved the presence of phyllosilicate sheets in the bulk, which produces preferential
orientations (Cultrone et al., 2005a). With increasing firing temperature, as in GP and N,
texture became more homogeneous. Poisson’s ratio (ν) values were very similar in all the
bricks, with a small rise in samples rich in calcite. Ji et al. (2009) and Cultrone et al. (2012)
have observed that calcite content and Poisson’s ratio (ν) are directly correlated: an increase
in calcite raises Poisson’s ratio. RS stands out for the highest Young (E) and Shear moduli
(G) (E = 70.1 GPa and G = 10.54 GPa), whereas the highest bulk modulus value (K) was
measured in N (K = 83.96 GPa), followed by RS (K = 77.68 GPa). At the other extreme, R6
showed the lowest values with great differences (E = 25.22 GPa, G = 4.71 GPa and K = 22.49
GPa) (Table 7). This was due to this sample's mineralogical and textural evolution at different
firing temperatures. In bricks fired at temperatures above 950°C, melting and formation of
new silicate phases take place, contributing to the improvement of the mechanical features: at
600°C (sample R6) these transformations did not take place yet or are at an initial stage. In
addition, the fact that the mechanical properties and total anisotropy of brick N are different
from those of GP, although both have the same composition and firing temperature, suggests
that addition of the dye hausmannite increases the vitrification level and, therefore, the
mechanical properties of N. This trend was confirmed by the mechanical stress values (σ)
measured though the uniaxial compressive test. The highest σ value was measured in N (σ =
191 Kg cm-2), followed by GP and RS with similar resistances (151 and 156 Kg cm-2), by
RSS (σ = 126 Kg cm-2) and a much lower value in R6 (σ = 71 Kg cm-2). When the average
results of mechanical parameters obtained by the ultrasound test (bulk modulus, K) were
compared with those of the uniaxial compressive test (stress values, σ), quite good agreement
was observed (Fig. 7).
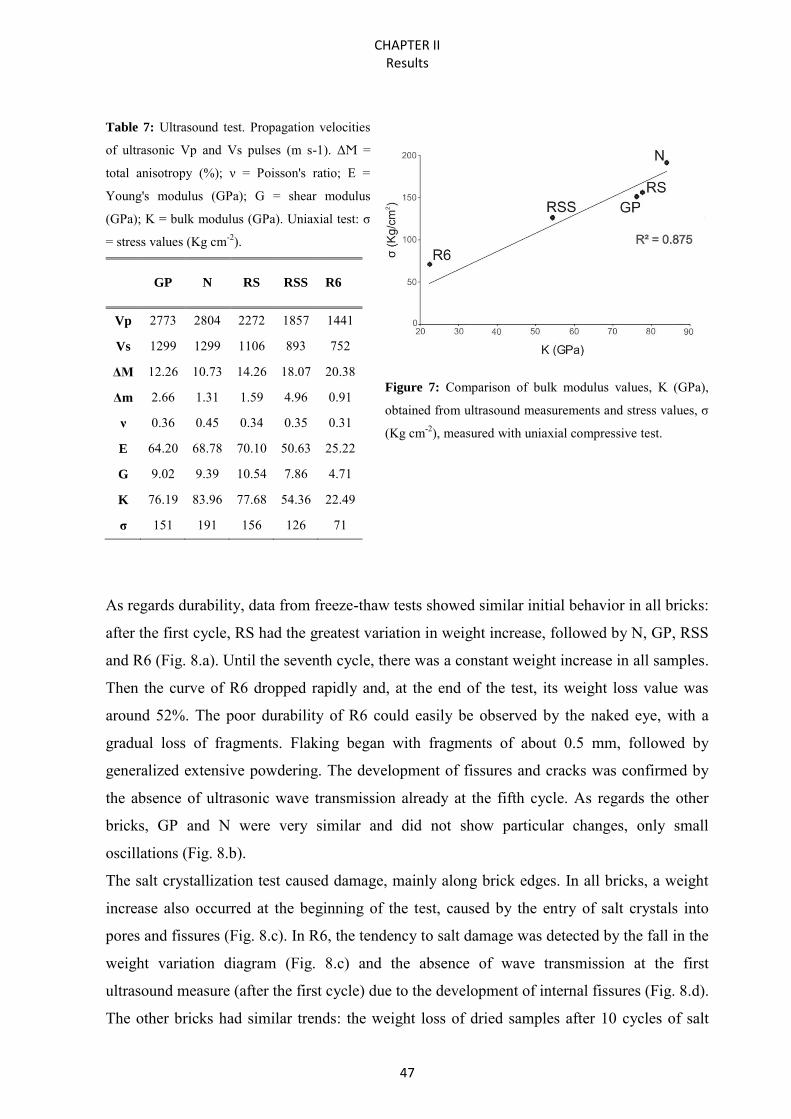
CHAPTER II Results
47
Table 7: Ultrasound test. Propagation velocities
of ultrasonic Vp and Vs pulses (m s-1). ΔϺ =
total anisotropy (%); ν = Poisson's ratio; E =
Young's modulus (GPa); G = shear modulus
(GPa); K = bulk modulus (GPa). Uniaxial test: σ
= stress values (Kg cm-2).
GP N RS RSS R6
Vp 2773 2804 2272 1857 1441
Vs 1299 1299 1106 893 752
ΔM 12.26 10.73 14.26 18.07 20.38
Δm 2.66 1.31 1.59 4.96 0.91
ν 0.36 0.45 0.34 0.35 0.31
E 64.20 68.78 70.10 50.63 25.22
G 9.02 9.39 10.54 7.86 4.71
K 76.19 83.96 77.68 54.36 22.49
σ 151 191 156 126 71
Figure 7: Comparison of bulk modulus values, K (GPa),
obtained from ultrasound measurements and stress values, σ
(Kg cm-2), measured with uniaxial compressive test.
As regards durability, data from freeze-thaw tests showed similar initial behavior in all bricks:
after the first cycle, RS had the greatest variation in weight increase, followed by N, GP, RSS
and R6 (Fig. 8.a). Until the seventh cycle, there was a constant weight increase in all samples.
Then the curve of R6 dropped rapidly and, at the end of the test, its weight loss value was
around 52%. The poor durability of R6 could easily be observed by the naked eye, with a
gradual loss of fragments. Flaking began with fragments of about 0.5 mm, followed by
generalized extensive powdering. The development of fissures and cracks was confirmed by
the absence of ultrasonic wave transmission already at the fifth cycle. As regards the other
bricks, GP and N were very similar and did not show particular changes, only small
oscillations (Fig. 8.b).
The salt crystallization test caused damage, mainly along brick edges. In all bricks, a weight
increase also occurred at the beginning of the test, caused by the entry of salt crystals into
pores and fissures (Fig. 8.c). In R6, the tendency to salt damage was detected by the fall in the
weight variation diagram (Fig. 8.c) and the absence of wave transmission at the first
ultrasound measure (after the first cycle) due to the development of internal fissures (Fig. 8.d).
The other bricks had similar trends: the weight loss of dried samples after 10 cycles of salt
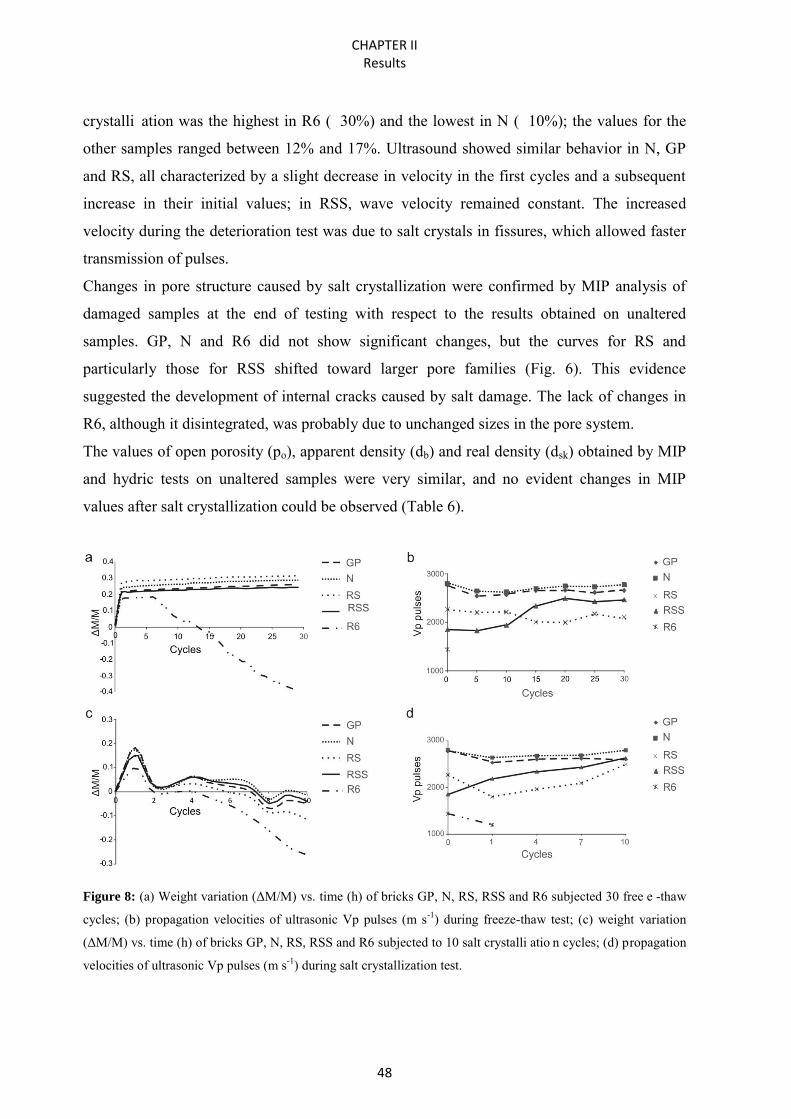
CHAPTER II Results
48
crystalli ation was the highest in R6 ( 30%) and the lowest in N ( 10%); the values for the
other samples ranged between 12% and 17%. Ultrasound showed similar behavior in N, GP
and RS, all characterized by a slight decrease in velocity in the first cycles and a subsequent
increase in their initial values; in RSS, wave velocity remained constant. The increased
velocity during the deterioration test was due to salt crystals in fissures, which allowed faster
transmission of pulses.
Changes in pore structure caused by salt crystallization were confirmed by MIP analysis of
damaged samples at the end of testing with respect to the results obtained on unaltered
samples. GP, N and R6 did not show significant changes, but the curves for RS and
particularly those for RSS shifted toward larger pore families (Fig. 6). This evidence
suggested the development of internal cracks caused by salt damage. The lack of changes in
R6, although it disintegrated, was probably due to unchanged sizes in the pore system.
The values of open porosity (po), apparent density (db) and real density (dsk) obtained by MIP
and hydric tests on unaltered samples were very similar, and no evident changes in MIP
values after salt crystallization could be observed (Table 6).
Figure 8: (a) Weight variation (ΔM/M) vs. time (h) of bricks GP, N, RS, RSS and R6 subjected 30 free e -thaw
cycles; (b) propagation velocities of ultrasonic Vp pulses (m s-1) during freeze-thaw test; (c) weight variation
(ΔM/M) vs. time (h) of bricks GP, N, RS, RSS and R6 subjected to 10 salt crystalli atio n cycles; (d) propagation
velocities of ultrasonic Vp pulses (m s-1) during salt crystallization test.
CHAPTER II Results
49
4. Conclusions
The multianalytical approach adopted to studying SanMarco-Terreal Italia bricks fired at 600,
950, 980 and 1050°C highlights close relationships among mineralogy, porosity and physical
properties and their behavior in varying stress environments. The following conclusions may
be drawn:
- although bricks GP and N, both fired at 1050°C, showed the greatest mineralogical
evolution, with the growth of new silicate phases and melting of the matrix, they were
also the samples which absorbed more water and had the highest capillarity rise;
- R6 (fired at 600°C) is the brick with the worst behavior during accelerated decay tests.
It showed good behavior in hydric tests, with the best pore interconnections and a low
capillarity coefficient. However, it was the weakest under loading and was affected by
ice and salt inside pores and fissures because of its low compactness and absence of
vitrification of the matrix;
- N (fired at 1050°C) showed good mechanical behavior, followed by RS (fired at
980°C). N and GP were both produced with the same clay material and fired at
1050°C, although comparison of the results for N indicates that adding the dye
hausmannite caused changes not only to its visual aspect (dark gray color) but also to
its mechanical properties. This was confirmed by analysis of XRPD patterns, in which
N had the highest background noise, indicating amorphous phases, as also confirmed
by FESEM;
- In general, RSS was characterized by intermediate hydric and mechanic behavior, but
showed the greatest changes in pore structure after salt crystallization.
The close correspondence between results from ultrasound testing and stress from the uniaxial
mechanical test may be important in evaluating the possibility of replacing the latter, which is
destructive, with validation of parameters from ultrasound, which is non-destructive. This is
especially important when valuable pieces must be analysed or the behavior of samples
followed over time. The important role of firing on the characteristics of the final products is
clear-cut. In the sample fired at the lowest temperature (R6), the absence of new silicates and
interconnections due to melting made it the weakest in load resistance and decay tests. This
implies that this sample, produced experimentally but not actually marketed, does not reach
standard requirements of durability and load resistance. Conversely, samples fired at the
highest temperature (GP and N) responded well to stress, but tended to absorb more water.
GP, in particular, showed the highest capillarity rise, because its main pore distribution has a
CHAPTER II Results
50
critical range (0.1-10 µm). RS showed the best compromise in physical-mechanical
properties, with good resistance to stress, deterioration and behavior with respect to water.
Therefore the latter sample represents a good-quality brick obtained at a lower firing
temperature, thus reducing energy consumption and production costs. These results confirm
the close relationships among mineralogy, porosity and physical properties of bricks and
make a valuable contribution to the development of brick production and the improved quality
of final products, to aim at new ad hoc mix designs and to face the new challenges in a
sustainable and compatible industry.
ACKNOWLEDGMENTS This study was funded by Research Group RNM179 of the Junta de Andalucía and by
Research Project MAT2012-34473. The research benefitted by funding from INPS - Gestione
Ex Inpdap (Direzione Regionale Veneto), which provided the PhD “Doctor J” Grant over the
period 2012-2015. The authors are grateful to Gabriel Walton, who revised the English text.
References
Anzani A., Binda L., Carpinteri A., Invernizzi S., 2010. A multilevel approach for the damage
assessment of historic masonry towers, Journal of Cultural Heritage 11, 459-470.
Aras A., 2004. The change of phase composition in kaolinite- and illite-rich clay-based
ceramic bodies, Applied Clay Science, 24, 257-269.
Benavente D., Martiñez-Verdú F., Bernabeu A., Viqueira V., Fort R., García del Cura M.A.,
Illueca C., Ordóñez S., 2003. Influence of surface roughness on color changes in
building stones, Color Research and Application 28, 343-351.
Benavente D., García del Cura M.A., Ordoñez S., 2003. Salt influence on evaporation from
porous building rocks, Construction and Buildings Materials 17, 113-122.
Benavente D., Linares-Fernández L., Cultrone G., Sebastián E., 2006. Influence of
microstructure on the resistance to salt crystallization damage in bricks, Materials and
Structures, 39, 105-113.
Cardiano P., Ioppolo S., De Stefano C., Pettiganno A., Sergi S., Piraino P., 2004. Study and
characteri ation of the ancient bricks of monastery of “San Filippo di Fragalà” in
Frazzanò (Sicily), Analytical Chimica Acta 519, 103-111.
Carretero M.I., Dondi M., Fabbri B., Raimondo M., 2002. The influence of shaping and firing
technology on ceramic properties of calcareous and non-calcareous illitic–chloritic
clays, Applied Clay Science 20, 301-306.
CHAPTER II Results
51
Chen, G., Wang, J., 1998. The preparation of marine geological certified reference materials -
polymetallic nodule GSPN-1 and marine sediment GSMS-1 from the Central Pacific
Ocean, Geostandards and Geoanalytical Research 22, 119-125.
Cultrone G., Rodriguez-Navarro C., Sebastián E.M., Cazalla O., de la Torre M.J., 2001a.
Carbonate and silicate phase reactions during ceramic firing, European Journal
Mineralogy 13, 621-634.
Cultrone G., Sebastián E., Cazalla O., Nechar M., Romero R., Bagur M.G., 2001b.
Ultrasound and mechanical tests combined with ANOVA to evaluate brick quality,
Ceramics International 27, 401-406.
Cultrone G., de la Torre M.J., Sebastian E. and Cazalla O., 2003. Evaluación de la durabilidad
de ladrillos mediante tecnicas destructivas (TD) y no-destructivas (TND), Materiales de
Construcción 53, 41-59.
Cultrone G., Sebastián E., Elert K., de la Torre M.J., Cazalla O., Rodriguez-Navarro C., 2004.
Influence of mineralogy and firing temperature in the porosity of bricks, Journal of the
European Ceramic Society 34, 547-564.
Cultrone G., Sidraba I., Sebastián E., 2005a. Mineralogical and physical characterization of
the bricks used in the construction of the “Triangul Bastion”, Riga (Latvia), Applied
Clay Science 28, 295-308.
Cultrone G., Sebastián E., de la Torre M.J., 2005b. Mineralogical and physical behaviours of
solid bricks with additives, Construction and Building Materials 19, 39-48.
Cultrone G., Sebastián E, Ortega Huertas M., 2007. Durability of masonry systems: a
laboratory study, Construction and Building Materials 21, 40-51.
Cultrone G., Sebastián E., 2009. Fly ash addition in clayey materials to improve the quality of
solid bricks, Construction and Buildings Materials 23, 1174-1184.
Cultrone G., Luque A., Sebastián E., 2012. Petrophysical and durability tests on sedimentary
stones to evaluate their quality as building materials, Quarterly Journal of Engineering
Geology and Hydrogeology 45, 415-422.
Cultrone G., Molina E., Arizzi A., 2014. The combined use of petrographic, chemical and
physical techniques to define the technological features of Iberian ceramics from the
Canto Tortoso area (Granada, Spain), Ceramics International 40, 10803-10816.
De Bonis A., Cultrone G., Grifa C., Langella A., Morra V., 2014. Clays from the Bay of
Naples (Italy): New insight on ancient and traditional ceramics, Journal of the European
Ceramic Society 34, 3229-3244.
CHAPTER II Results
52
Dondi M., Ercolani G., Fabbri B., Marsigli M., 1998. An approach to the chemistry of
pysrxenes formed during the firing of Ca-rich silicate ceramics, Clay Minerals 33, 443-
452.
Ducman V., Škapin S. A., Radeka M., Rnogajec J., 2011. Frost resistance of clay roofing
titles: case study, Ceramics International 37, 85-91.
Duminuco P., Messiga B., Riccardi M.P., 1998. Firinig process of natural clays. Some
microtextures and related phase compositions, Termodicnamica Acta 321, 185-190.
Elert K., Cultrone G., Rodriguez Navarro C., Sebastián Pardo E., 2003. Durability of bricks
used in the conservation of historic buildings -influence of composition and
microstructure, Journal of Cultural Heritage 4, 91-99.
Eliche-Quesada D., Martínez-Martínez S., Pérez-Villarejo L., Iglesias-Godino F.J., Martínez-
García C., 2012. Corpas-Iglesias F.A., Valorization of biodisel production residues in
making porous clay brick, Fuel Processing Technology 103, 166-173.
Fabbri B., Gualtieri S., Shoval S., 2014. The presence of calcite in archaeological ceramics,
Journal of the European Ceramic Society 34, 1899-1911.
Grossi C. M., Brimblecombe P., Esbert R.M., 2007. Francisco Javier Alonso, Color changes
in architectural limestones from pollution and cleaning, Color Research and Application
32, 320-331.
Guydader J., Denis A., 1986. Propagation des ondes dans les roches anisotropes sous
contrainte évaluation de la qualité des schistes ardoisiers, Bull. Engineering Geololgy
33, 49-55.
Ji, S., WAng Q., Salisbury M.H., 2009. Composition and tectonic evolution of the Chinese
continental crust constrained by Poisson’s ratio, Tectonophysics, 463, 15-30.
Jordan M.M., Montero M.A., Meseguer S., Sanfeliu T., 2008. Influence of firing temperature
and mineralogical composition on bending strength and porosity of ceramic tile bodies,
Applied Clay Science 42, 266-271.
Larbi J.A., 2004. Microscopy applied to the diagnosis of the deterioration of brick masonry,
Construction and Building Materials 18, 299-307.
López-Arce P., García-Guinea J., Gracía M., Obis J., 2003. Bricks in historical buildings of
Toledo City: characterisation and restoration, Materials Characterization 50, 59-68.
López-Arce P., García-Guinea J., 2005. Weathering traces in ancients bricks from historic
buildings, Building and Environment 40, 929-941.
CHAPTER II Results
53
Maritan L., Mazzoli C., Nodari L., Russo U., 2005. Second Iron Age grey pottery from Este
(northeastern Italy): study of provenance and technology, Applied Clay Science 29, 31-
44.
Maritan L., Nodari L., Mazzoli C., Milano A., Russo U., 2006. Influence of firing conditions
in ceramic products: Experimental study on clay rich in organic matter, Applied Clay
Science 31, 1-15.
Miriello D., Crisci G. M., 2007. Mixing and provenance of raw materials in the bricks from
the Svevian castle of Rocca Imperiale (North Calabria, Italy), European Journal
Mineralogy 19, 137-144.
Monteiro S. N., Fontes Vieria C.M., 2004. Influence of firing temperature on the ceramic
properties of clays from Campos dos Goytacazes, Brazil, Applied Clay Science 27, 229-
234.
Monteiro S. N., Fontes Vieria C.M., 2014. On the production of fired clay bricks from waste
materials: a critical update, Construction and Building Materials, 68, 599-310.
Nodari L., Marcuz E., Maritan L., Mazzoli C., Russo U., 2007. Hematite nucleation and
growth in the firing of carbonate-rich clay for pottery production, Journal of the
European Ceramic Society 27, 4665-4673.
Normal 29/88, 1988. Misura dell’indice di asciugamento (drying index), CNR-ICR, Rome.
Özlaya Ö. A., Böke H, 2009. Properties of Roman bricks and mortars used in Serapis temple
in the city of Pergamon, Materials Characterization 60, 995-1000.
Riccardi M.P., Messiga B., Duminuco P., 1999. An approach to the dynamics of clay firing,
Applied Clay Science 15, 393-409.
RILEM 1980, Recommended test to measure the deterioration of stone and to assess the
differences of treatment methods, Mater. Struct. 13, 175-253.
Rodriguez-Navarro C., Doehne E., Sebastián E., 2000. How does sodium sulfate crystallize?
Implications for the decay and testing of building materials, Cement and Concrete
Research 30, 1527-1534.
Scott V.D., Love G., 1983. Quantitative Electron Probe Microanalysis, John Wiley and Sons,
New York.
Setti M., Lanfranchi A., Cultrone G., Marinoni L., 2012. Archeometric investigation and
evaluation of the decay of ceramic materials from the Church of Santa Maria del
Carmine (Pavia, Italy), Material de Costrucción, Vol. 62, N° 305, 79-98.
CHAPTER II Results
54
Steiger M., Asmussen S., 2008. Crystallization of sodium sulphate phases in porous materials:
the phase diagram Na2SO4 - H2O and the generation of stress, Geochimica et
Cosmochimica Acta 72, 4291-4306.
Tsui N., Flatt R., Scherer G.W., 2003. Crystallization damage by sodium sulphate, Journal of
Cultural Heritage 4, 109-115.
UNE EN 15886, 2011. Conservación del patrimonio cultural. Métodos de ensayo. Medición
del color de superficies, A.E.N.O.R., Madrid
UNI EN 11084, 2003. La norma indica le principali caratteristiche mineralogiche, fisiche e
chimice dei materiali ceramici determinabili in laboratorio, CNR-ICR, Rome.
UNI EN 13755, 2008. Metodi di prova per pietre naturali - Determinazione dell'assorbimento
d'acqua a pressione atmosferica, CNR-ICR, Rome.
UNI EN 1925, 2000. Metodi di prova per pietre naturali - determinazione del coefficiente di
assorbimento d'acqua per capillarità, CNR-ICR, Rome.
UNI EN 1926, 2007. Metodo di prova per pietre naturali - determinazione della resistenza alla
compressione uniassiale, ICNR-ICR, Rome.
UNI EN 12371, 2010. Metodo di prova per pietre naturali - determinazione della resistenza al
gelo, CNR-ICR, Rome.
UNI EN 12370, 2001. Metodi di prova per pietre naturali - determinazione della resistenza
alla cristallizzazione dei Sali, CNR-ICR, Rome.
Valluzzi M.R., Bondì A., da Porto F., Franchetti P., Modena C., 2002. Structural
investigations and analyses for the conservation of the ‘Arsenale’ of Venice, Journal of
Cultural Heritage 3, 65-71.
Valluzzi M.R., Binda L., Modena C., 2005. Mechanical behaviour of historic masonry
structures strengthened by bed joints structural repointing, Construction and Building
Materials 19, 63-73. Van Hess R.P.J. , Brocken H.J.P., 2004. Damage development to treated brick masonry in a
long-term salt crystallization test, Construction and Building Materials18, 331-338.
Whitney D. L., Evans B. W., 2010. Abbreviations for names of rock-forming minerals,
American Mineralogist 95, 185-187.
Zangh L., 2013. Production of bricks from waste materials - a review, Construction and
Building Materials 47, 643-655.
CHAPTER IV
Results
Combined multi-analytical approach
for the study of the pore system in bricks:
how much porosity is there?

CHAPTER IV Results
57
Combined multi-analytical approach for the study of the pore system in
bricks: How much porosity is there?
Abstract
During the firing process of bricks mineralogical and textural transformations occur which produces an artificial
aggregate characterized by a significant porosity. Porosity, in particular concerning the pore-size distribution and
the interconnection model, is an important parameter to evaluate and predict durability of bricks. The system of
pores, indeed, is the principal factor that correlates building materials and environment (especially in the
weathering aggressive phenomena, e.g., salt crystallization and freeze-thaw cycles) and determines its durability.
Four industrial bricks (with different compositions and firing temperatures) were analysed combining “direct”
and “indirect” techniques, traditional methods (mercury intrusion porosimetry, hydric test, nitrogen adsorption)
and new analytical approaches based on the digital image reconstruction of 2D and 3D models (using
backscattered electrons and computerised X-ray micro-tomography). The combination of different analytical
methods over “overlapping ranges” of the porosity, as bridges of interconnection between them, permitted to
overcome their limits and draft a complete knowledge of the pore system of bricks.
Key-words: Pore system; Pore morphology; Pore quantification; Combined techniques; 2D and 3D
Digital Image reconstruction.
1. Introduction
Porosity and pore structure deeply affects physical and mechanical properties, and durability
of building materials. In bricks, the pore structure forms during the production process
(Cultrone et al., 2004; Benavente et al., 2006), and depends on the complex interaction of
different factors which include features of the starting paste and the mineralogical and textural
changes occurring during firing. Pore shape, pore-size distribution and interconnection all
affect the physical properties of bricks and represent the prominent parameters evaluated
when predicting durability of building materials (Di Benedetto et al., 2015). Indeed, open
pores connect the inside of the building materials with the external environment, determining
water storage and circulation potential, and effectiveness of soluble salts crystallisation and
freeze-thaw cycles, directly influencing on deterioration rate (Hall & Hoff, 2009; Aligizaki,
2006; Cnudde & Boone, 2013). Porosity of bricks mainly depends on the maximum firing
CHAPTER IV Results
58
temperature and the adequate soaking time, and evolves through three main steps during
firing: i) between 100 and 200°C the loss of moisture produces interstitial pores among the
grains; ii) from 400 to 800°C dehydroxylation of clay minerals (loss of OH and in some cases
F), oxidation of organic matter (release of CO and/or CO2) and decomposition of carbonates
(loss of CO2) further increase porosity; iii) above 800°C, when the melting process begins,
pores become larger and with smoother surfaces (Cultrone et al., 2004; Benavente et al.,
2006; Sobott et al., 2014).
The correct characterization of the pore structure of building materials, and in particular of
bricks, is a difficult issue because pores may present very different shape, size and connection
both among them and with the material surface (Aligizaki, 2006). Considering pore
connectivity, we may refer either to the total (or absolute) or to the effective porosity. Total
porosity is the total volume of pores with respect to the bulk volume (Cueto et al., 2009;
Siegesmund & Dürrast, 2014), and refers to closed and open pores, regardless the degree of
interconnection. The effective porosity only refers to open and interconnected pores,
accessible to the circulation of fluids or gases, and therefore constitute the main pathway for
environmental threats (Anovitz & Cole, 2015). Closed pores do not affect absorption and
permeability but influence the mechanical and physical properties of building materials.
A further criterion of pore classification consists in considering their size. Various categories
of pore sizes are described in the literature (Zdravkov et al., 2007); nevertheless, a unanimous
classification is difficult to achieve mainly due to the differences in ranges of macro-, meso-
and micro-pores, which are still a subject for lively discussions.
There is a large number of possible methods available to investigate and quantify the pore
system. Nevertheless, a better description of the pore system may derive from the comparison
of different techniques, each investigating only a restricted part of the overall pore system due
to specific limitations (e.g., in terms of pore-size interval, open or closed porosity) and
instrumental setups (Navarro & Sebastián, 1994; Galaup et al., 2102; Rozenbaum, 2011;
Abell, 1999; Barbera, et al., 2014; Cnudde, 2009; Labus, 2009; Bai et al., 2013; Rigby et al.,
2004).
A simple question such as “how much porosity is there in a sample?” really has a complex
answer.
The combined multi-analytical approach adopted in this research consists in the combination
of “direct” and “indirect” techniques, traditional methods and new analytical approaches
CHAPTER IV Results
59
based on digital image reconstruction of 2D and 3D models. “Indirect” techniques rely on the
behaviour of the fluids used to evaluate the distribution, size and abundance of interconnected
pores (effective or open porosity) inside the materials. In this study, we considered the
following “indirect” methods: i) Mercury Intrusion Porosimetry (MIP), ii) Hydric Tests (HT)
and iii) Nitrogen Adsorption (NA). “Direct” techniques permit a direct observation of the
shape, distribution and abundance of open and closed pores. In this study, the direct methods
used are: i) Scanning Electron Microscopy Backscattered Electrons (SEM-BSE), ii)
Computerised X-ray micro-Tomography (micro-CT), both coupled with Digital Image
Analysis (DIA).
Each direct and indirect technique analyses a different range of pore size. To establish a
connection among the different methods, “overlapping zones” were identified according to
the image resolution established for the digital imaging and the micro-CT analysis.
The present work investigates pore-size distribution and structure of the pore system in four
commercial bricks, with different composition of the raw materials and firing temperatures.
This information will be fundamental in the optimization of new mix designs for the
production of bricks with suitable porosity, to be used in the restoration and in the modern
buildings, and in the definition of a protocol for the quantification of voids.
2. Sample material
Four types of bricks (R6, RSS, GP and N) produced by the SanMarco-Terreal company (Italy)
were here studied. These bricks were obtained from two types of clays, which differ in terms
of carbonate amount; one can be classified as moderately carbonate clay, as the amount of
CaO plus MgO is 8.84 wt%; the other one can be defined as highly carbonate clay, because
the sum of CaO and MgO reaches 22.51 wt%. They were mixed with 10% of quartz sand
(temper) and fired at different temperatures.
From the moderately carbonate clay, two different bricks were obtained on the basis of the
firing temperature: sample R6 fired at 600°C and sample RSS fired at 950°C. From the highly
carbonate clay two further bricks were produced, GP and N, both fired at 1050 °C. About 15
wt% of hausmannite powder (Mn3O4) was also added to sample N as grey-dye, determining a
dark colour to the fired sample. Chemical-mineralogical and physical-mechanical features of
these bricks have been described in Coletti et al. (submitted).
CHAPTER IV Results
60
3. Analytical techniques
3.1 Mercury Intrusion Porosimetry (MIP)
Mercury Intrusion Porosimetry is a powerful technique used to evaluate the open porosity
(interconnected pores) and pore size-distribution in the range comprised between 0.003 and
350 μm.
Since mercury is a non-wetting liquid, it does not spontaneously penetrate pores by capillary
action, it must be forced to penetrate by the application of external pressure. The required
pressure is inversely proportional to the size of the pores. Mercury fills larger pores first and,
as pressure increases, smaller ones. Assuming the contact angle of 130° and a surface tension
of 485 dyne cm-1, a pressure of 414 MPa is required for mercury to access pores as small as
0.003 µm.
From the pressure intrusion data, the porosimeter determines volume and size distributions
using the Washburn equation (Pirard et al., 2002):
where PL is the pressure of the liquid (mercury in this case), PG is the pressure of the gas in
the pores (approximated to 0 atm under initial vacuum conditions), σ is the surface tension of
the liquid, θ is the contact angle of intrusion of the liquid (generally comprised between 135°
and 142° for mercury) and Dp is the diameter of the pores.
Despite mercury intrusion porosimetry is widely used, this technique has two important
limitations: the assumption that pores are perfectly cylindrical in shape, and that mercury
moves from larger pores to smaller ones, discarding the opposite, the so-called pores with
“ink-bottle” morphology (Moro & Böhni, 2002). Therefore, mercury enters in voids with a
pressure determined only by the entrance size and not the real size of the pore (Giesche,
2006). Moreover, at high intrusion pressures (above 414 MPa) pore structure can be damaged,
distorting the pore range distribution (Diamond, 2000) with an artificial increase of the small
pore fraction (Galaup et al., 2012).
The equipment used in this study is a Micromeritics Autopore III apparatus, model 9410,
which can generate a maximum pressure of 414 MPa. Samples of approximately 2 cm3 were
freshly cut and oven-dried for 24 h at 110°C before being analysed.
CHAPTER IV Results
61
3.2 Hydric Tests (HT)
Hydric tests consist in a series of measurements, such as water absorption and drying. In this
study, free and forced water absorption (UNI EN 13755) and drying (NORMAL 29/88) were
determined on three samples (cube-shaped with sides of 50 mm) for each brick type. Water
absorption test consists in determining the percentage of water absorbed by the mass of a
sample during time. Firstly, samples are dried at 100°C in electric oven in order to determine
the dry mass and then completely immersed in water at controlled room temperature (20°C)
and relative humidity (30%). Samples immersed in water are periodically weighted (several
times during the first hour and then one time each 24 h) until they reach constant mass. The
quantity of adsorbed water is the free water absorption. Samples are then saturated with water
under vacuum for 24 h, weighted and dried to determine their capacity and velocity to lose
water. Environmental conditions (temperature and relative humidity) are monitored and
samples weighted with the same frequency used for the determination of water absorption,
until constant mass is reached. The following hydric parameters useful for the purpose of this
work have been calculated: open porosity (na); degree of pore interconnection (Ax) (Cultrone
& Madkourb, 2013; Siegesmund & Dürrast, 2014).
Open porosity (na) is calculated as:
na =
while the degree of pore interconnection (Ax) is calculated as:
Ax= -
where M0 is the mass of the dried sample, Ms is the mass of the sample saturated with water
under vacuum, MH is the hydrostatic weight of sample saturated with water under vacuum, Al
is the free water absorption and Af is the forced water absorption.
Capillarity rise (UNI EN 1925) has been determined on three prism-shaped samples
(25×25×120 mm) for each brick type, and weighted following the same timing used for water
absorption and drying. Capillary rise coefficient (Ks) is calculated as:
CHAPTER IV Results
62
Ks = -
where M0 is the mass of dried sample, MC is the amount of water absorbed at time t, A is the
surface area of sample (in cm2) in contact with water.
Also this method, largely adopted to measure the porosity of building materials, exhibits
some limitations that need to be considered. Contrary to mercury, water is a wetting liquid
that spontaneously penetrates open pores without requiring an external driving force. In the
case of this research, brick is a material with a good aptitude to absorb water and has a high
degree of wettability. The hydrophilicity of this material can increase the amount of water
accumulated in pores and the long period of immersion (in the specific case about one month
of free absorption) may damage the material and alter its pore structure. Furthermore, this
method returns the total effective porosity and the degree of pores interconnection, but not a
description of the pore-size distribution.
3.3 Nitrogen Adsorption (NA)
Nitrogen Adsorption has been used to determine the porosity of bricks in the range (in
diameter) between 2 and 3000 Å. The sorption isotherms have been obtained at 77 K, using a
Micromeritics Tristar 3000 under continuous adsorption conditions. Prior to measurement,
samples were heated at 130°C for 24 h and outgassed to 10-3 Torr using a Micromeritics
Flowprep. The total pore volume and micropore volume of the samples have been calculated
using t-plot analysis. The Barret-Joyner-Halenda (BJH) method has been used to obtain pore
size distribution curves.
Nitrogen adsorption (at 77 K) is the most widely used method to investigate the smallest
pores in materials. The amount of adsorbed gas by the material surface is measured at discrete
pressure (P) steps over the equilibrium pressure (P/P0) at constant temperature and with P0
that corresponds to the condensation pressure. Nitrogen initially fills micro-pores for their
larger adsorption potential at low relative pressure; under increasing gas pressure, mono- and
multi-layer adsorption occurs in meso- and macro-pores. During the experiment, pressure
increases up to condensation (adsorption branch) followed by reduction of pressure (P0)
(desorption branch) and these data are reported as adsorption isotherm. The conventional
technique makes a discontinuous point-by-point measurement. The shape of the isotherm and
its hysteresis pattern provide information on the types of pores present in the materials.
CHAPTER IV Results
63
Isotherms are classified according to the IUPAC nomenclature into six different types (Type I
to VI) (Sing et al., 1985). Hysteresis patterns are four (H1 to H4) and permit to characterize
different meso-pores shapes (Anovitz & Cole, 2015).
Quantitative description of porosity is obtained calculating the total pore volume as follows
(Anovitz & Cole, 2015):
Vliq =
where Vliq is the volume of adsorbed liquid N2, Pa is the environmental pressure, Vads is the
volume of adsorbed vapour, Vm is the volume of N2 adsorbed as a monolayer, R is the gas
constant and T is the temperature expressed in K.
Average pore radii (rp) are estimated from the pore volume assuming cylindrical pore
geometry. It can be expressed as:
rp =
where Vliq is N2 liquid adsorbed and S is the specific surface area.
Despite nitrogen adsorption is largely employed to determine porosity of various materials,
especially those characterised by micro- and meso-pores, this method necessarily assumes
that: i) pores are rigid and cylindrical, and ii) the meniscus curvature of the fluid is dependent
on the dimensions of the pores (Washburn equation). Physical phenomena could significantly
affect the adsorption isotherm and lead to incorrect micro- and meso-pore size estimation
(Groen et al., 2003). Moreover, hysteresis loops are often observed, generally associated with
the occurrence of meso-pores, since desorption path may depend on percolation effects or
along channel variation of pore diameter. These assumptions prevent an accurate description
of both pore-size distribution and pore shapes. This method is fully reliable when the pore
structure is already known, but results are questionable when applied to materials with a
complex undetermined pore structure (Sing, 2001).
CHAPTER IV Results
64
3.4 2D Digital Image Analysis of SEM backscattered electrons images
The development of new analytical approaches strongly advanced our knowledge on pore
structure and distribution through digital image analysis (DIA). The use of high-resolution
SEM backscattered electron images (BSE) is a suitable alternative of the traditional optical
methods and it represents an efficient tool to quantify petrographic features and porosity of
geo-materials.
Porosity can be calculated from a binarised BSE image as the ratio of the number of pixels
corresponding to the pores (pore-pixels) to the entire area of interest (AOI):
PT =
where Npp is the number of pore-pixels (black pixels) and Nsp is the number of solid-pixels
(white pixels). Pore-size distribution has been carried out dividing pores in different classes of
the minimum Feret diameters (minFeret) calculated with the public domain Java image
processing program ImageJ (Rasband, 1997-2015).
DIA of SEM-BSE images is a rather simple method for the quantification of total porosity,
shape and size of pores, but the results may be influenced by instrumental conditions and
settings that are not completely controllable. For instance, possible variations in grey-scale
levels due to different contrast and brightness settings may affect the correct identification of
pore-matrix and pore-temper interfaces. Although DIA is a direct technique, which therefore
permits to describe pore shape, part of the geometrical information is lost, since the use of the
Feret diameter represents a simplification preventing a complete description of empty spaces.
In this study SEM-BSE images were acquired with a CamScan MX 2500 microscope,
equipped with a LaB6 cathode, operating at 20 kV, working distance (WD) of 20 mm at
magnification of 50x and 18 mm at magnification of 500x. The two different magnifications
were adopted to investigate the pore system at different scales in terms of representativeness
of the investigated area with respect to a given interval of pore-size. SEM grey-scale images
were processed by ImageJ, reducing the noise and converting them into binary images (black
and white) by thresholding process. Information was grouped in two different “classes”
(black=pores; white=ground-matrix and grains of the temper) (Sun et al., 2007; Crawford &
Mortensen, 2009; Grove & Jerram, 2011). For each class, training pixels were selected from
specific regions of interest (ROI). Image segmentation (classification of each pixel) was
CHAPTER IV Results
65
performed on the basis of the ROI. In order to automate the threshold selection and limit the
operator subjectivity, a supervised classification has been performed using MultiSpec3.3©
software. Total porosity derived from the counting of the black pixels in the binary images. In
order to increase representativeness, digital imaging study has been performed on merged
panoramic images obtained stitching together 30 overlapping images at magnification of 50x
(~2 cm2) and 240 overlapping images at 500x (~2 mm2).
3.5 3D Digital Image Analysis using computerised X-ray micro-tomography
Computerised X-ray micro-Tomography (micro-CT) 3D imaging, as SEM-BSE 2D digital
imaging, is a rather frequently used technique that permits the investigation of the internal
materials structure, including porosity.
Micro-CT analyses were performed on cores (diameter = 8 mm, length = 20 mm) using a
bench-top Skyscan 1172 micro-CT scanner (Bruker®) at the Department of Geosciences
(University of Padova). Scanner is equipped with a Hamamatsu 100/250 microfocus X-ray
source operating at acceleration voltage of 74 kV and beam current of 133 μA, and with a
Hamamatsu C9300 10 megapixel camera (Camera pixel size 8.5 μm) filtered by a 0.5 mm Al
foil. Projection images were acquired every 0.3° over a 360° rotation with exposure time of
2500 ms, camera binning of 2x2, averaging 8 frames in vertical random movement mode to
minimise noise, and connecting 3 scans to scan the entire vertical length of the cores. The run
time for each scan was about 21 hours. Cross-section slices were reconstructed from raw
projection images using NRecon software (Bruker®) applying thermal correction,
misalignment compensation, ring artefact reduction and beam hardening correction, obtaining
voxel edge of 6 μm, corresponding to a minimum volume unit (voxel) of 216 μm3. Since in
micro-CT images the greyscale values are proportional to the X-ray attenuation coefficients,
which is a function of the mean atomic number of the specific voxel, porosity was segmented
by adequately thresholding tomographic images using CT-Analyser, obtaining binary image
stacks.
After segmentation, porosity is calculated as the ratio of the number of voxels of the pores
(pore-voxels) to the total volume of interest (VOI) (Noiriel, 2015) as follows:
PT =
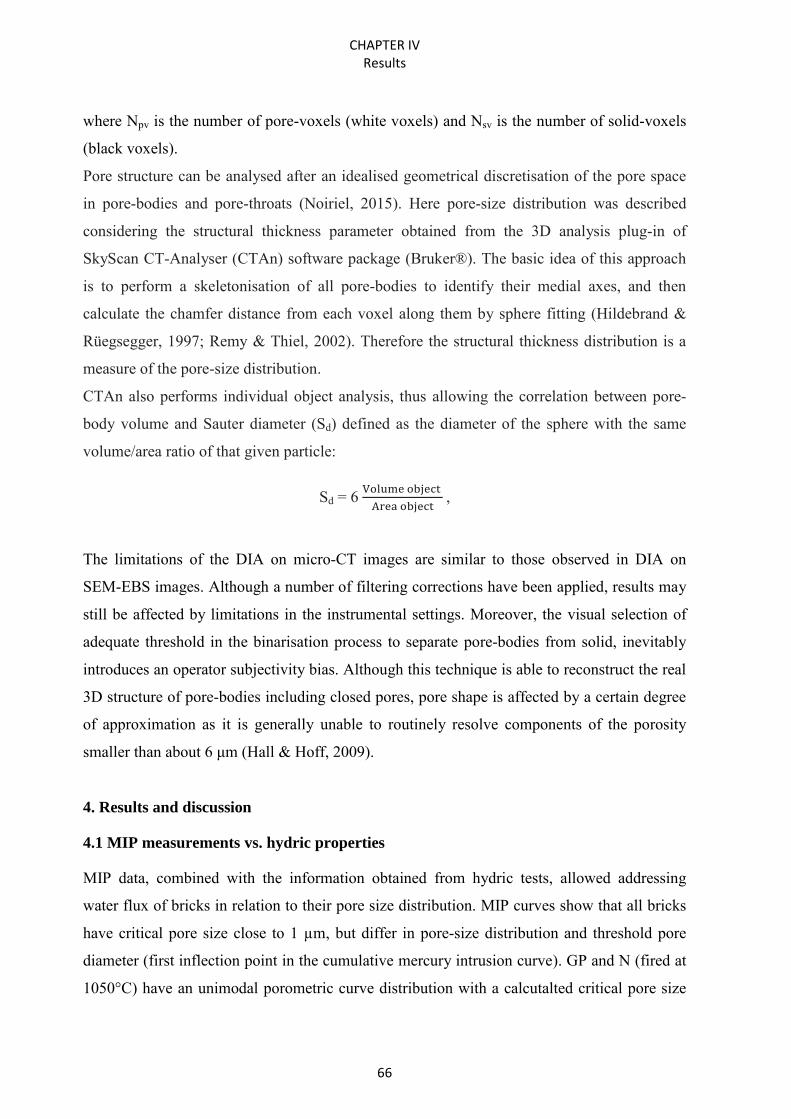
CHAPTER IV Results
66
where Npv is the number of pore-voxels (white voxels) and Nsv is the number of solid-voxels
(black voxels).
Pore structure can be analysed after an idealised geometrical discretisation of the pore space
in pore-bodies and pore-throats (Noiriel, 2015). Here pore-size distribution was described
considering the structural thickness parameter obtained from the 3D analysis plug-in of
SkyScan CT-Analyser (CTAn) software package (Bruker®). The basic idea of this approach
is to perform a skeletonisation of all pore-bodies to identify their medial axes, and then
calculate the chamfer distance from each voxel along them by sphere fitting (Hildebrand &
Rüegsegger, 1997; Remy & Thiel, 2002). Therefore the structural thickness distribution is a
measure of the pore-size distribution.
CTAn also performs individual object analysis, thus allowing the correlation between pore-
body volume and Sauter diameter (Sd) defined as the diameter of the sphere with the same
volume/area ratio of that given particle:
Sd = 6
,
The limitations of the DIA on micro-CT images are similar to those observed in DIA on
SEM-EBS images. Although a number of filtering corrections have been applied, results may
still be affected by limitations in the instrumental settings. Moreover, the visual selection of
adequate threshold in the binarisation process to separate pore-bodies from solid, inevitably
introduces an operator subjectivity bias. Although this technique is able to reconstruct the real
3D structure of pore-bodies including closed pores, pore shape is affected by a certain degree
of approximation as it is generally unable to routinely resolve components of the porosity
smaller than about 6 μm (Hall & Hoff, 2009).
4. Results and discussion
4.1 MIP measurements vs. hydric properties
MIP data, combined with the information obtained from hydric tests, allowed addressing
water flux of bricks in relation to their pore size distribution. MIP curves show that all bricks
have critical pore size close to 1 µm, but differ in pore-size distribution and threshold pore
diameter (first inflection point in the cumulative mercury intrusion curve). GP and N (fired at
1050°C) have an unimodal porometric curve distribution with a calcutalted critical pore size
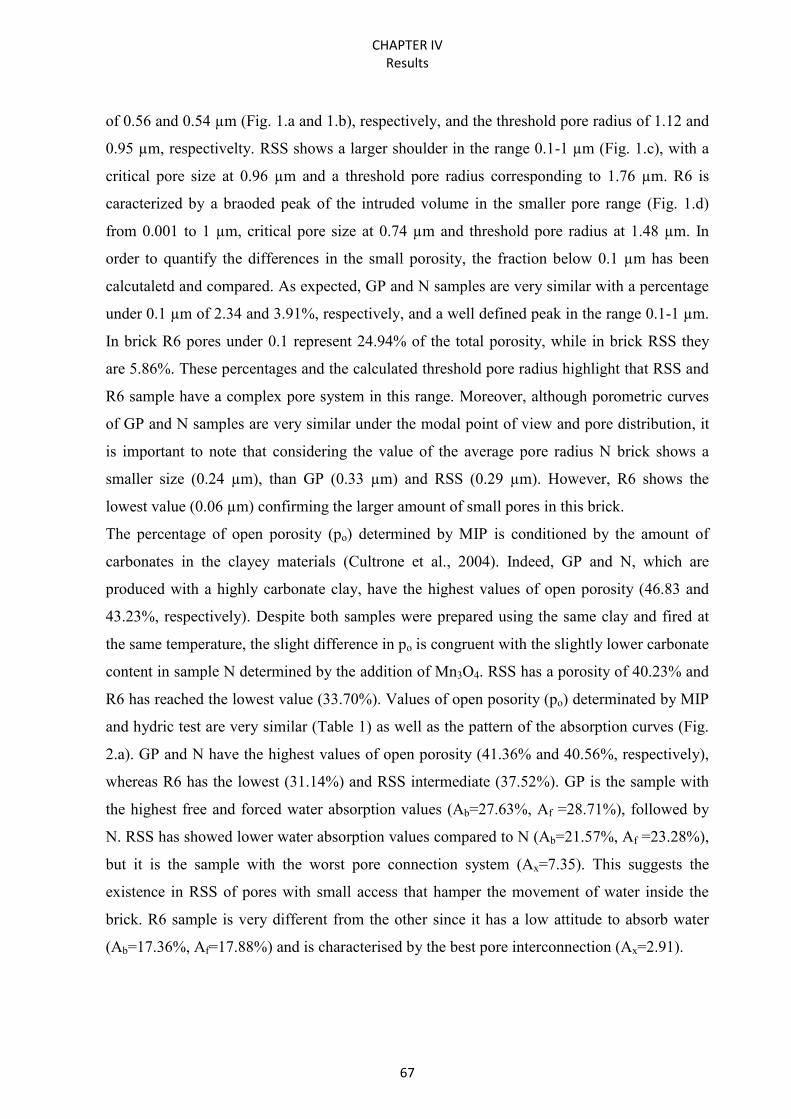
CHAPTER IV Results
67
of 0.56 and 0.54 µm (Fig. 1.a and 1.b), respectively, and the threshold pore radius of 1.12 and
0.95 µm, respectivelty. RSS shows a larger shoulder in the range 0.1-1 µm (Fig. 1.c), with a
critical pore size at 0.96 µm and a threshold pore radius corresponding to 1.76 µm. R6 is
caracterized by a braoded peak of the intruded volume in the smaller pore range (Fig. 1.d)
from 0.001 to 1 µm, critical pore size at 0.74 µm and threshold pore radius at 1.48 µm. In
order to quantify the differences in the small porosity, the fraction below 0.1 µm has been
calcutaletd and compared. As expected, GP and N samples are very similar with a percentage
under 0.1 µm of 2.34 and 3.91%, respectively, and a well defined peak in the range 0.1-1 µm.
In brick R6 pores under 0.1 represent 24.94% of the total porosity, while in brick RSS they
are 5.86%. These percentages and the calculated threshold pore radius highlight that RSS and
R6 sample have a complex pore system in this range. Moreover, although porometric curves
of GP and N samples are very similar under the modal point of view and pore distribution, it
is important to note that considering the value of the average pore radius N brick shows a
smaller size (0.24 µm), than GP (0.33 µm) and RSS (0.29 µm). However, R6 shows the
lowest value (0.06 µm) confirming the larger amount of small pores in this brick.
The percentage of open porosity (po) determined by MIP is conditioned by the amount of
carbonates in the clayey materials (Cultrone et al., 2004). Indeed, GP and N, which are
produced with a highly carbonate clay, have the highest values of open porosity (46.83 and
43.23%, respectively). Despite both samples were prepared using the same clay and fired at
the same temperature, the slight difference in po is congruent with the slightly lower carbonate
content in sample N determined by the addition of Mn3O4. RSS has a porosity of 40.23% and
R6 has reached the lowest value (33.70%). Values of open posority (po) determinated by MIP
and hydric test are very similar (Table 1) as well as the pattern of the absorption curves (Fig.
2.a). GP and N have the highest values of open porosity (41.36% and 40.56%, respectively),
whereas R6 has the lowest (31.14%) and RSS intermediate (37.52%). GP is the sample with
the highest free and forced water absorption values (Ab=27.63%, Af =28.71%), followed by
N. RSS has showed lower water absorption values compared to N (Ab=21.57%, Af =23.28%),
but it is the sample with the worst pore connection system (Ax=7.35). This suggests the
existence in RSS of pores with small access that hamper the movement of water inside the
brick. R6 sample is very different from the other since it has a low attitude to absorb water
(Ab=17.36%, Af=17.88%) and is characterised by the best pore interconnection (Ax=2.91).
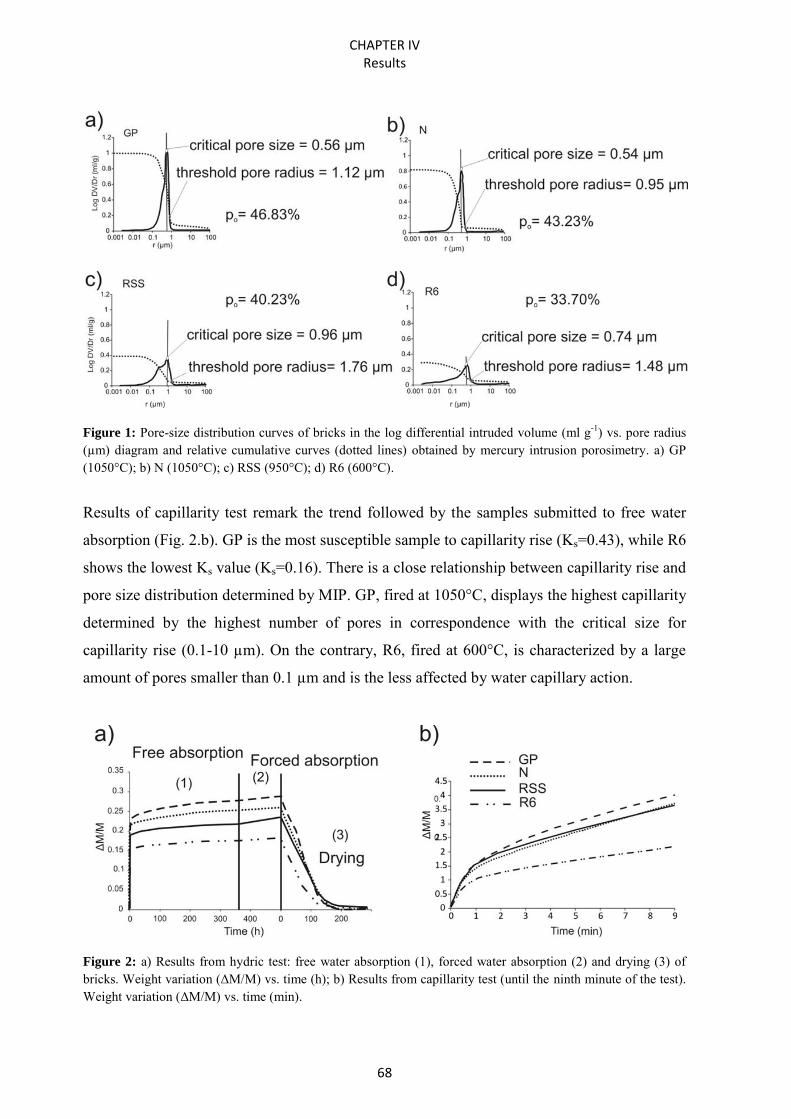
CHAPTER IV Results
68
Figure 1: Pore-size distribution curves of bricks in the log differential intruded volume (ml g-1) vs. pore radius (µm) diagram and relative cumulative curves (dotted lines) obtained by mercury intrusion porosimetry. a) GP (1050°C); b) N (1050°C); c) RSS (950°C); d) R6 (600°C).
Results of capillarity test remark the trend followed by the samples submitted to free water
absorption (Fig. 2.b). GP is the most susceptible sample to capillarity rise (Ks=0.43), while R6
shows the lowest Ks value (Ks=0.16). There is a close relationship between capillarity rise and
pore size distribution determined by MIP. GP, fired at 1050°C, displays the highest capillarity
determined by the highest number of pores in correspondence with the critical size for
capillarity rise (0.1-10 µm). On the contrary, R6, fired at 600°C, is characterized by a large
amount of pores smaller than 0.1 µm and is the less affected by water capillary action.
Figure 2: a) Results from hydric test: free water absorption (1), forced water absorption (2) and drying (3) of bricks. Weight variation (ΔM/M) vs. time (h); b) Results from capillarity test (until the ninth minute of the test). Weight variation (ΔM/M) vs. time (min).
CHAPTER IV Results
69
4.2 Nitrogen adsorption behaviour
N2 adsorption isotherms of the samples are type IV with H3 hysteresis loop according to the
IUPAC classification (Sing et al., 1985; Storck et al., 1998), that reflect the meso-porous
nature of the materials. Indeed, the hysteresis loop is usually associated with capillary
condensation in meso-pore structures and entails complications in the correct characterisation
of the porosity. Nevertheless, it can provide important information to understand the pore
structure and its morphology (Liu et al., 2015). H3 hysteresis type, in particular, can be
determined by the presence of pores between aggregates of plate-like particles or assemblages
of slit-shaped pores and can be expected to provide a reliable assessment of the pore-size
distribution. The different behaviour in the adsorption and desorption branch is evident in the
relative pressure interval (P/P0) between 0.4-0.5 where desorption branch drops (Groen et al.,
2003). This phenomenon is evident in particular in R6 and N bricks, which are also those with
the highest amount of gas volume intruded. R6 is the sample showing the isotherm with the
highest plateau at lower relative pressure values. Samples RSS and GP have the lowest
adsorption isotherms (Fig. 3.a), while sample N displays intermediate values. In detail,
layouts of bricks RSS and GP overlap in figure 3a, although RSS has a higher amount of
micro-pores and a higher trend at low relative pressure. This is confirmed by the t-plot micro-
pore volume (for pores <10Å) which is higher in sample RSS than in sample GP (0.000129
cm3/g vs. -0.000140 cm3/g) (Table 1). In general, the t-plot micro-pore volume is relatively
low, as also confirmed by the pore-size distribution calculated according to the BJH method
(in the range of 10-1500 Å) that shows samples porosity mainly concentrated in the meso-
and macro-pore ranges. Brick R6 shows the highest micro-porosity (BJH desorption volume:
0.24470 cm3/g), followed by N (0.009709 cm3/g) and by GP and RSS (0.004450 and
0.002686 cm3/g, respectively) (Table 1). The total open porosity (po) was derived for all
samples from the intruded volume obtained by both the t-plot and the BJH methods: the
highest po pertain to R6 and the lowest to RSS (Table 1). Plots of BJH pore-size distribution
of the N2 desorption curves (Fig. 3.b) show that most of the porosity is comprised between 30
and 50 Å. R6 is the brick showing the highest peak in this range, followed by N, whereas GP
and RSS have the smallest peaks. In GP, N and R6 samples, the BJH curves show a shoulder
between 100 and 150 Å, which is especially evident in R6. These data confirm what was
previously observed by MIP analysis and in particular: i) porosity characterised by smaller
pores in R6 (fired at 600°C) than in the other bricks; ii) the two samples fired at 1050°C are
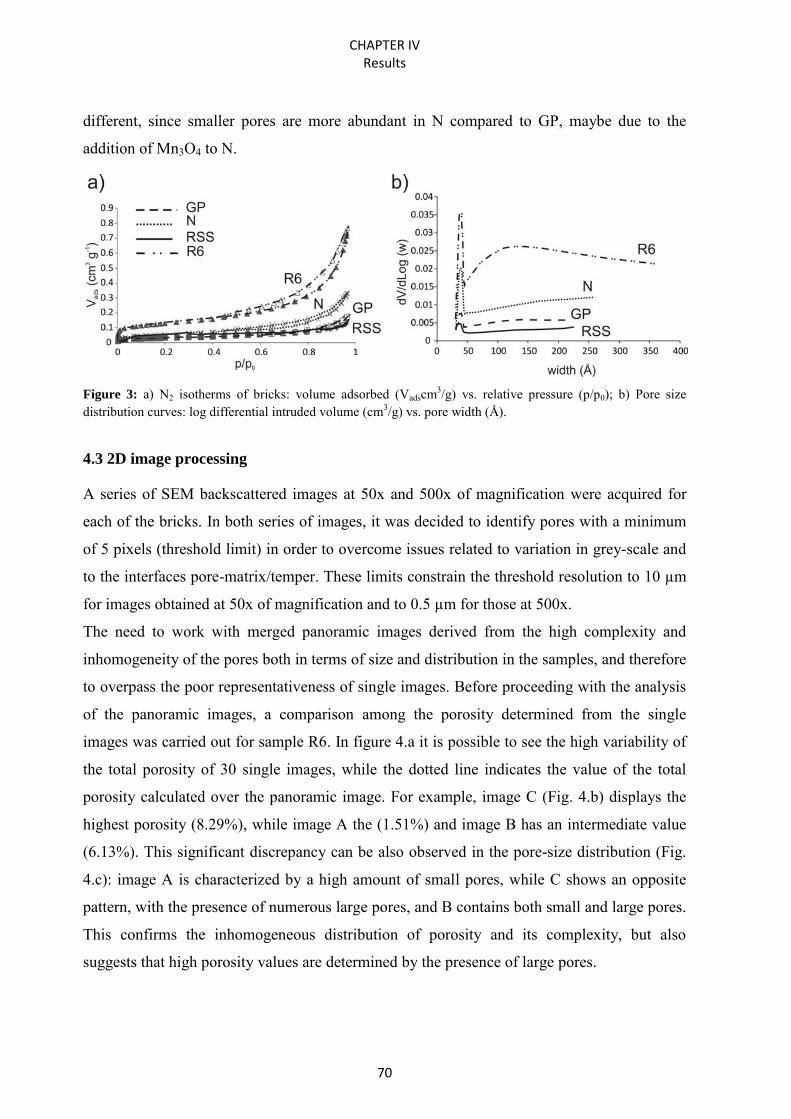
CHAPTER IV Results
70
different, since smaller pores are more abundant in N compared to GP, maybe due to the
addition of Mn3O4 to N.
Figure 3: a) N2 isotherms of bricks: volume adsorbed (Vadscm3/g) vs. relative pressure (p/p0); b) Pore size distribution curves: log differential intruded volume (cm3/g) vs. pore width (Å).
4.3 2D image processing
A series of SEM backscattered images at 50x and 500x of magnification were acquired for
each of the bricks. In both series of images, it was decided to identify pores with a minimum
of 5 pixels (threshold limit) in order to overcome issues related to variation in grey-scale and
to the interfaces pore-matrix/temper. These limits constrain the threshold resolution to 10 µm
for images obtained at 50x of magnification and to 0.5 µm for those at 500x.
The need to work with merged panoramic images derived from the high complexity and
inhomogeneity of the pores both in terms of size and distribution in the samples, and therefore
to overpass the poor representativeness of single images. Before proceeding with the analysis
of the panoramic images, a comparison among the porosity determined from the single
images was carried out for sample R6. In figure 4.a it is possible to see the high variability of
the total porosity of 30 single images, while the dotted line indicates the value of the total
porosity calculated over the panoramic image. For example, image C (Fig. 4.b) displays the
highest porosity (8.29%), while image A the (1.51%) and image B has an intermediate value
(6.13%). This significant discrepancy can be also observed in the pore-size distribution (Fig.
4.c): image A is characterized by a high amount of small pores, while C shows an opposite
pattern, with the presence of numerous large pores, and B contains both small and large pores.
This confirms the inhomogeneous distribution of porosity and its complexity, but also
suggests that high porosity values are determined by the presence of large pores.
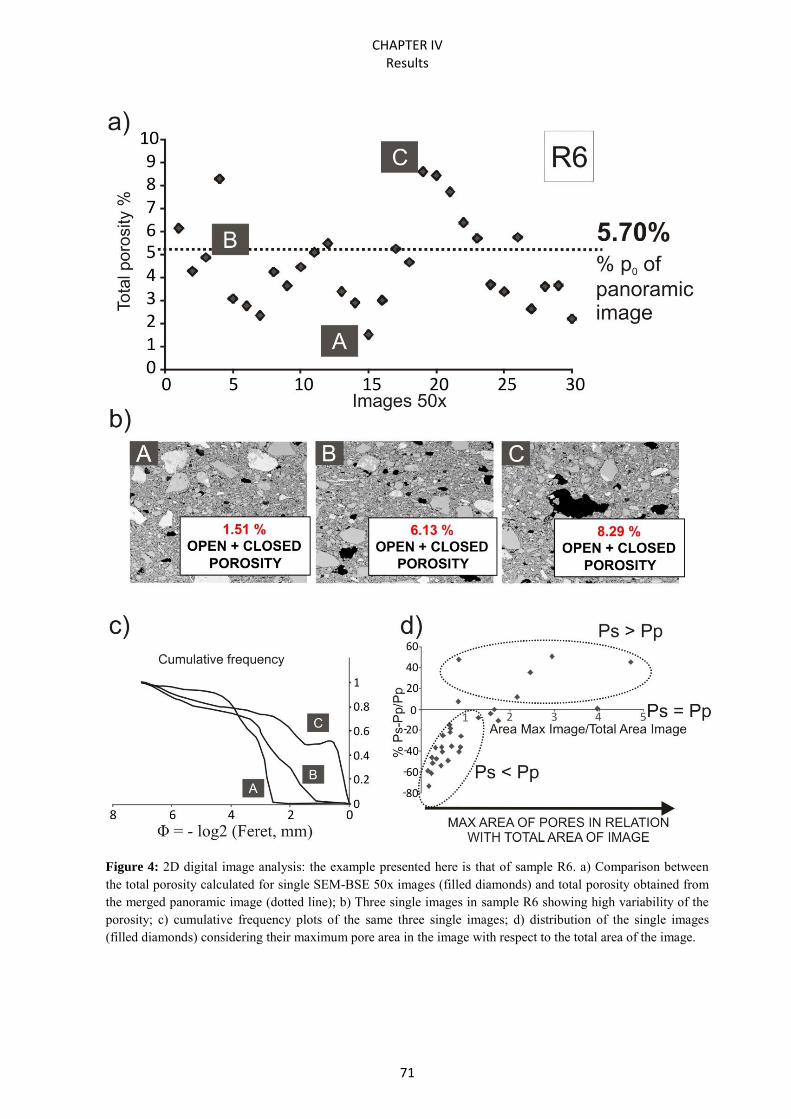
CHAPTER IV Results
71
Figure 4: 2D digital image analysis: the example presented here is that of sample R6. a) Comparison between the total porosity calculated for single SEM-BSE 50x images (filled diamonds) and total porosity obtained from the merged panoramic image (dotted line); b) Three single images in sample R6 showing high variability of the porosity; c) cumulative frequency plots of the same three single images; d) distribution of the single images (filled diamonds) considering their maximum pore area in the image with respect to the total area of the image.
CHAPTER IV Results
72
This relationship can be observed in figure 4.d where the percentage of the largest pore
(Largest Pore Area/Total Image Area, expressed in %) in each image is compared with the
total porosity of that image (Ps) normalised to the total porosity of the panoramic image (Pp)
using the following equation: (Ps-Pp)/Pp. Images are clearly divided into three groups. A first
group includes images with higher porosity than the panoramic image (Ps>Pp); these images
also contain the larger pores. A second group includes images with lower porosity than the
panoramic image (Ps<Pp); these images do not contain large pores. A third group includes
images with porosity close to the average value of the panoramic image (Pp≈Ps).
Table 1 lists the values of the total porosity for each of the bricks calculated on the panoramic
images taken at a magnification of 50x.
The sample with the highest value of total porosity is RSS (po=14.13%), followed by GP
(po=13.13%) and N (po=12.61%), while the lower value was measured for the sample R6
(po=7.87%). Images taken at a magnification of 50x have a larger variability in terms of pore-
size than those at 500x (Table 1), as inferred comparing standard deviation values. RSS brick
contains the largest isolated pores in the matrix, up to a minFeret diameter of 1450 µm. This
is easily deduced also from the box-and-whisker plots of the minFeret diameters (Fig. 5.a).
When compared to other techniques, 500x SEM-BSE images resulted particularly useful since
they cover a similar range of pore-size distribution with respect to that investigated by MIP.
Total porosity obtained from 500x images is always higher than that from 50x ones.
Moreover, porosity results to be less variable among the bricks, confirmed by overall lower
values of the standard deviation (Table 1). As in the case of 50x images, GP, N and RSS
samples have rather similar total porosity. GP displays the highest value (po=25.59%), N and
RSS follow with similar values (24.99% and 24.43%), while R6 presents relatively low total
porosity (15.68%) (Table 1). Box-and-whisker plots show a similar distribution of pores (Fig.
5.c) for GP, N and RSS sample (90% of pores below 120 µm), while in R6 the distribution is
shifted towards lower values (90% of pores below 100 µm). Samples fired at higher
temperature (GP, N and RSS) present larger pores (up to 205, 300 and 225 µm, respectively),
while sample fired at lower temperature (R6) displays smaller pores (up to 159 µm). This
confirms the influence of the firing process on the pores size. Indeed, pores tend to increase
their size when vitrification occurs (Benavente et al., 2006). Cumulative frequency
distribution of pores is concentrated under minFeret of 10 µm; in particular, in samples GP, N
and RSS about 47% of the pores fall in this range, while in sample R6 this pore fraction is as
CHAPTER IV Results
73
high as 55.65% (Table 1), confirming what observed also by MIP and N2 adsorption. Also the
average value of the pore diameter (minFeret) in sample R6 is lower (0.70 µm) than that of
samples N (0.85 µm), GP (0.90 µm) and RSS (1 µm).
Pore shape can condition water storage. Therefore, the influence of the firing temperature on
this parameter is an important issue. An important shape factor is the circularity that can be
used to describe the degree of asymmetry of a pore shape, calculated in 2D according to the
following equation:
c = 4 π
,
where A and P are the area and the perimeter of each pore, respectively. Circularity factor (c)
is comprised between 0 (perfectly elongated shape) and 1 (perfectly circular shape).
Circularity factors obtained from the segmented panoramic 50x images were plotted against
the correspondent minFeret values (Figure 5.b). Pores with approximately circular shape (c
approaching 1) are more abundant in samples fired at higher temperature (bricks GP and N).
In particular, sample N presents a greatest fraction of rounded pores. This observation is also
confirmed in 500x images (Fig. 5.d).
The degree of pore anisotropy was also evaluated considering the ratio of maximum Feret
diameter (maxFeret) to minFeret. When these parameters are very similar, particle is almost
isotropic, whereas when the ration is higher than 1, the particle is anisotropic (elongated
shape). Pores of samples N and GP in both 50x and 500x images have the lowest ratios (50x:
N = 10.98, GP = 13.64; 500x: N = 33.36, GP = 33.36), confirming that bricks fired at higher
temperature are characterized by more circular pores, in agreement with circularity
distribution.
4.4 3D image processing
After reconstruction, adequate filtering and 3D thresholding, the stack of binarised images
obtained for each of the sample cores underwent 3D analysis using CTAn. RSS sample
displayed higher porosity (26.85%) than GP (15.64%), N (9.89%) and R6 (9.08%) (Table 1).
Considering that voxel edge is 6 µm, the cumulative frequency curves of the structural
thickness show different pore-size distribution among the samples. The majority of the pores
lie in the range between 6 and 20 µm for most of the bricks (RSS=54.82%; GP=50.22%;
R6=40.42; N=37.93%). In the range between 20 and 30 µm, samples GP, N and R6 all have a
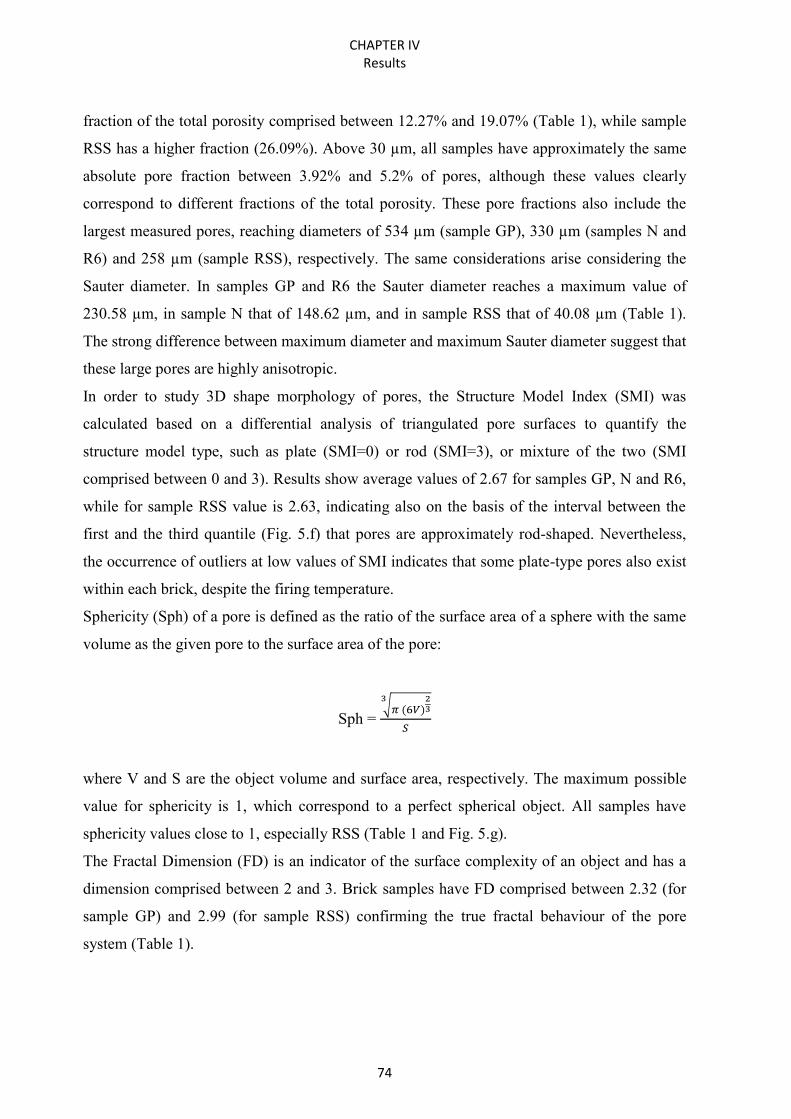
CHAPTER IV Results
74
fraction of the total porosity comprised between 12.27% and 19.07% (Table 1), while sample
RSS has a higher fraction (26.09%). Above 30 µm, all samples have approximately the same
absolute pore fraction between 3.92% and 5.2% of pores, although these values clearly
correspond to different fractions of the total porosity. These pore fractions also include the
largest measured pores, reaching diameters of 534 µm (sample GP), 330 µm (samples N and
R6) and 258 µm (sample RSS), respectively. The same considerations arise considering the
Sauter diameter. In samples GP and R6 the Sauter diameter reaches a maximum value of
230.58 µm, in sample N that of 148.62 µm, and in sample RSS that of 40.08 µm (Table 1).
The strong difference between maximum diameter and maximum Sauter diameter suggest that
these large pores are highly anisotropic.
In order to study 3D shape morphology of pores, the Structure Model Index (SMI) was
calculated based on a differential analysis of triangulated pore surfaces to quantify the
structure model type, such as plate (SMI=0) or rod (SMI=3), or mixture of the two (SMI
comprised between 0 and 3). Results show average values of 2.67 for samples GP, N and R6,
while for sample RSS value is 2.63, indicating also on the basis of the interval between the
first and the third quantile (Fig. 5.f) that pores are approximately rod-shaped. Nevertheless,
the occurrence of outliers at low values of SMI indicates that some plate-type pores also exist
within each brick, despite the firing temperature.
Sphericity (Sph) of a pore is defined as the ratio of the surface area of a sphere with the same
volume as the given pore to the surface area of the pore:
Sph =
where V and S are the object volume and surface area, respectively. The maximum possible
value for sphericity is 1, which correspond to a perfect spherical object. All samples have
sphericity values close to 1, especially RSS (Table 1 and Fig. 5.g).
The Fractal Dimension (FD) is an indicator of the surface complexity of an object and has a
dimension comprised between 2 and 3. Brick samples have FD comprised between 2.32 (for
sample GP) and 2.99 (for sample RSS) confirming the true fractal behaviour of the pore
system (Table 1).
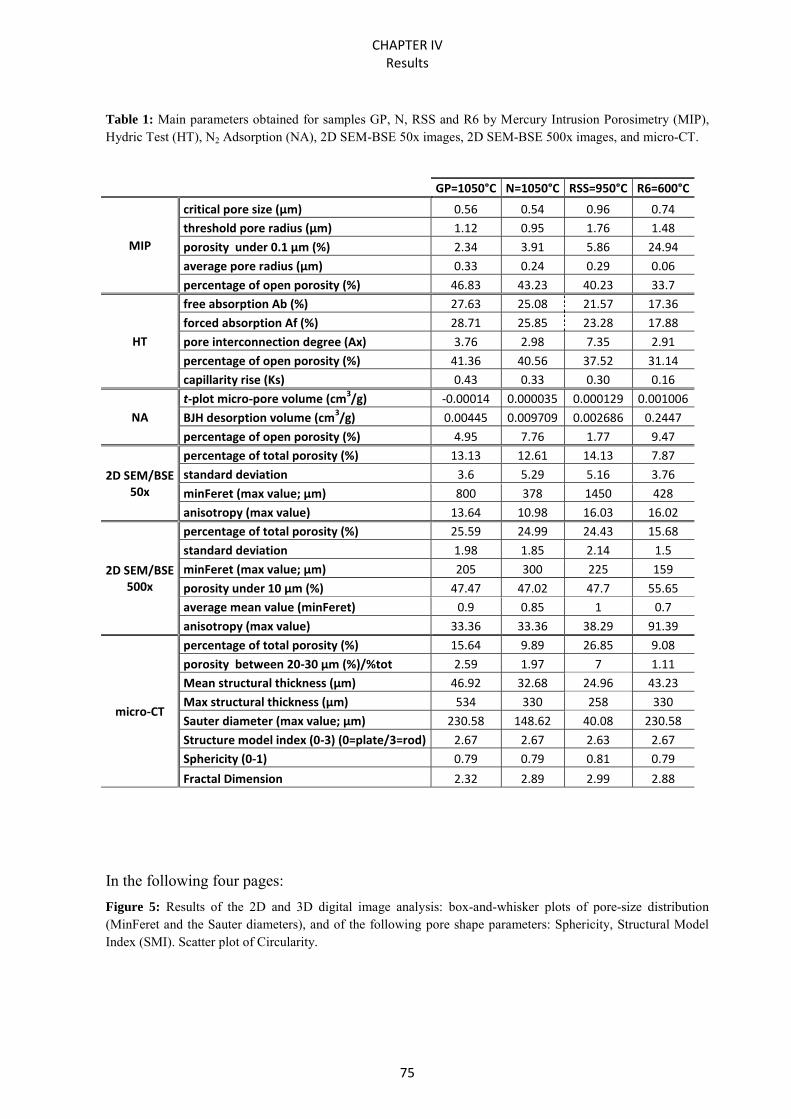
CHAPTER IV Results
75
Table 1: Main parameters obtained for samples GP, N, RSS and R6 by Mercury Intrusion Porosimetry (MIP), Hydric Test (HT), N2 Adsorption (NA), 2D SEM-BSE 50x images, 2D SEM-BSE 500x images, and micro-CT.
In the following four pages: Figure 5: Results of the 2D and 3D digital image analysis: box-and-whisker plots of pore-size distribution (MinFeret and the Sauter diameters), and of the following pore shape parameters: Sphericity, Structural Model Index (SMI). Scatter plot of Circularity.
GP=1050°C N=1050°C RSS=950°C R6=600°C
MIP
critical pore size (µm) 0.56 0.54 0.96 0.74
threshold pore radius (µm) 1.12 0.95 1.76 1.48
porosity under 0.1 µm (%) 2.34 3.91 5.86 24.94
average pore radius (µm) 0.33 0.24 0.29 0.06
percentage of open porosity (%) 46.83 43.23 40.23 33.7
HT
free absorption Ab (%) 27.63 25.08 21.57 17.36
forced absorption Af (%) 28.71 25.85 23.28 17.88
pore interconnection degree (Ax) 3.76 2.98 7.35 2.91
percentage of open porosity (%) 41.36 40.56 37.52 31.14
capillarity rise (Ks) 0.43 0.33 0.30 0.16
NA
t-plot micro-pore volume (cm3/g) -0.00014 0.000035 0.000129 0.001006
BJH desorption volume (cm3/g) 0.00445 0.009709 0.002686 0.2447
percentage of open porosity (%) 4.95 7.76 1.77 9.47
2D SEM/BSE 50x
percentage of total porosity (%) 13.13 12.61 14.13 7.87
standard deviation 3.6 5.29 5.16 3.76
minFeret (max value; µm) 800 378 1450 428
anisotropy (max value) 13.64 10.98 16.03 16.02
2D SEM/BSE 500x
percentage of total porosity (%) 25.59 24.99 24.43 15.68
standard deviation 1.98 1.85 2.14 1.5
minFeret (max value; µm) 205 300 225 159
porosity under 10 µm (%) 47.47 47.02 47.7 55.65
average mean value (minFeret) 0.9 0.85 1 0.7
anisotropy (max value) 33.36 33.36 38.29 91.39
micro-CT
percentage of total porosity (%) 15.64 9.89 26.85 9.08
porosity between 20-30 µm (%)/%tot 2.59 1.97 7 1.11
Mean structural thickness (µm) 46.92 32.68 24.96 43.23
Max structural thickness (µm) 534 330 258 330
Sauter diameter (max value; µm) 230.58 148.62 40.08 230.58
Structure model index (0-3) (0=plate/3=rod) 2.67 2.67 2.63 2.67
Sphericity (0-1) 0.79 0.79 0.81 0.79
Fractal Dimension 2.32 2.89 2.99 2.88
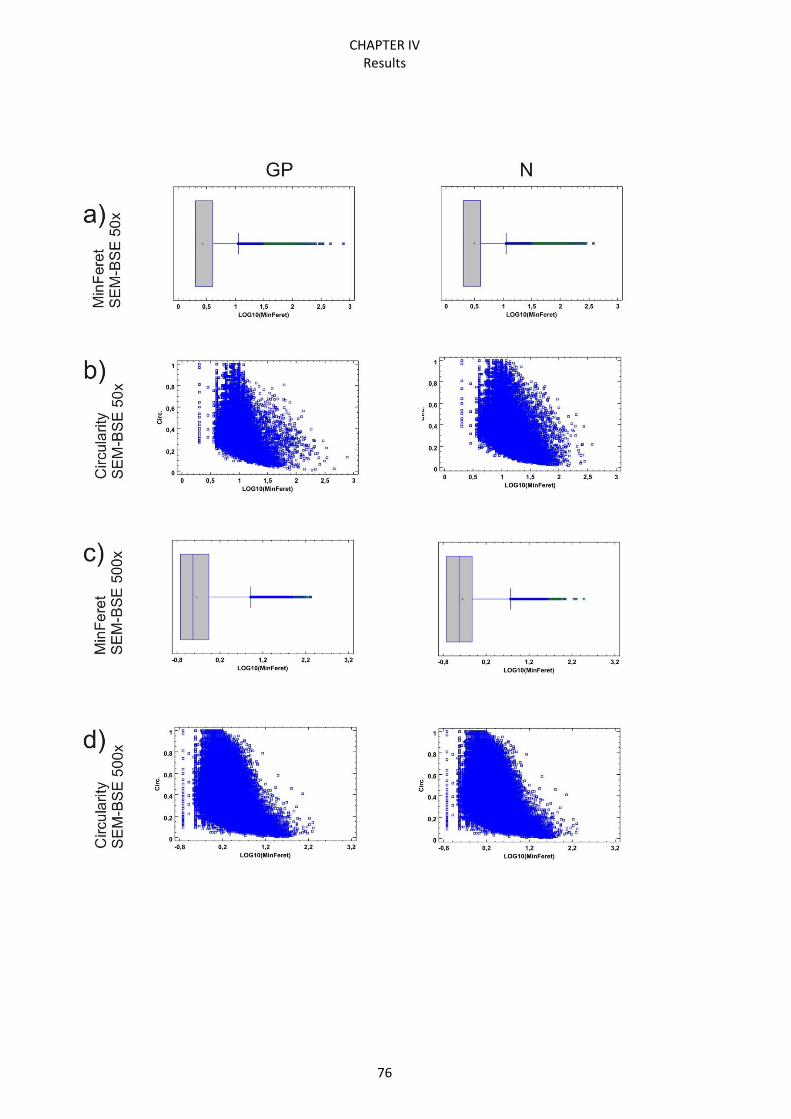
CHAPTER IV Results
76
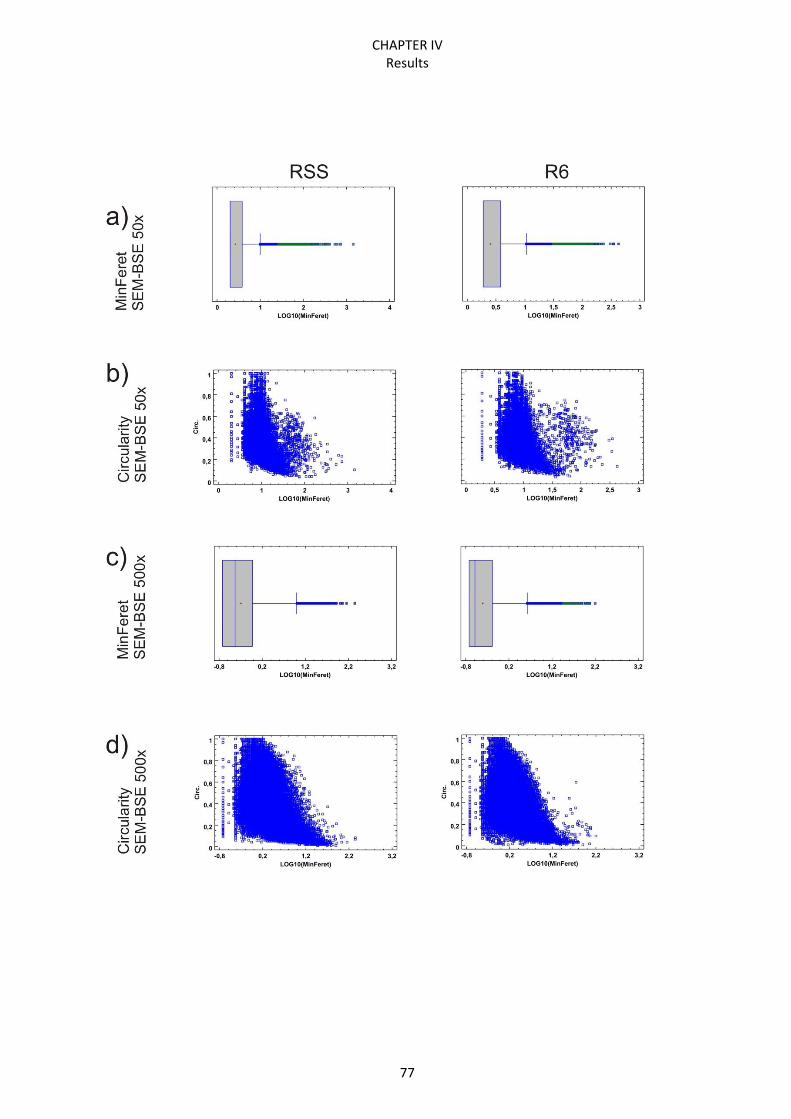
CHAPTER IV Results
77
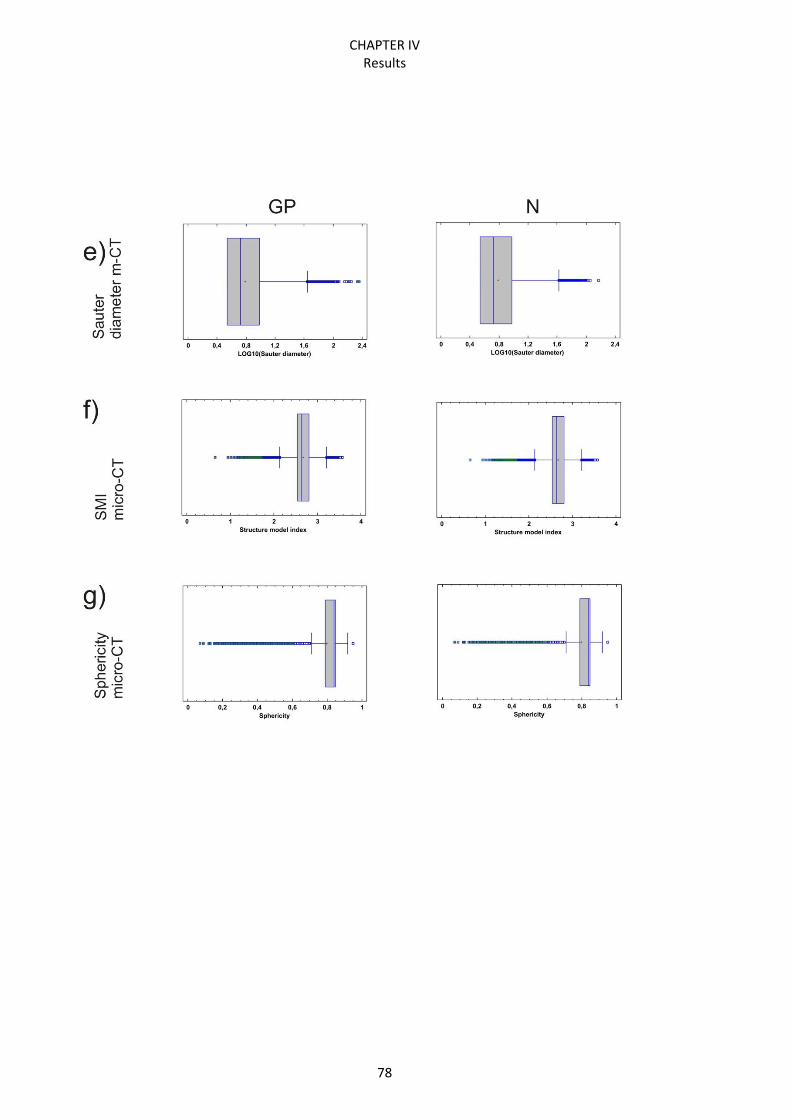
CHAPTER IV Results
78
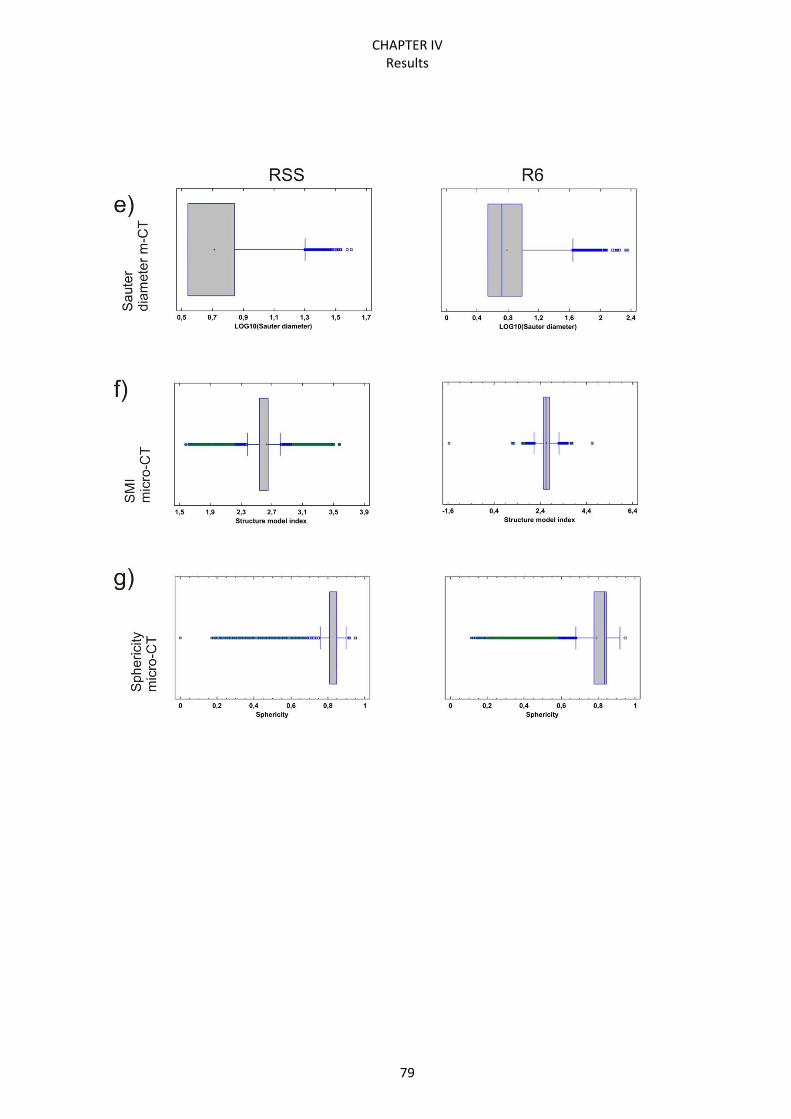
CHAPTER IV Results
79
CHAPTER IV Results
80
4.5 Comparing techniques and the “overlap” method
The comparison between the different cumulative curves and the total porosity obtained by
each technique in the total range of pores can supply a realistic image of the pore system of
the studied bricks. Between 2 Å and 3000 Å (0.3 µm), the pore-radius distribution and pore
volume was determined from the nitrogen adsorption method, the micro-pores volumes
obtained by the t-plot method and desorption cumulative curves by the BHJ method. Between
0.001 and 100 µm the pore-radius distribution was determined with MIP. Pores with a
diameter above 0.5 µm were measured by 2D DIA of SEM/BSE images and by 3D analysis
based on micro-CT 3D reconstructions. All cumulative curves obtained from different
techniques for the specific pore range and the percentages of total porosity for all samples are
reported in figure 6, the overall analysis of which allows depicting a reliable outline of the
overall pore system for each of the samples, and estimating a more general and reliable pore
distribution.
The comparison between GP and N samples, both fired at 1050°C and elaborated with the
same base-clay, evidence some difference. N sample, for instance, has more micro-pores than
GP, which were detected by N2 adsorption. Porosity, obtained by MIP and 2D and 3D digital
image analysis has a similar trend in GP and N, but always it is lower in N than in GP. 2D and
3D digital image analyses obtained from 50x images attest the occurrence of larger pores in
GP sample than in N, with higher minFeret and Sauter diameter.
The comparison between samples RSS and R6, produced with the same base-clay, but fired at
950°C and 600°C, respectively, indicates that sample R6 is characterised by a higher micro-
porosity, as confirmed by both MIP (considering the smaller pore range) and NA. MIP. On
the other hand, sample RSS always has rather higher total porosity values according to MIP,
2D and 3D DIA data, and shows the overall most complex pore system, with the presence of
large pores, as shown by SEM-BSE images. Moreover, this sample has the highest value of
the total porosity determined by micro-tomography, probably due to the presence of the
elevated number of pores below 30 µm.
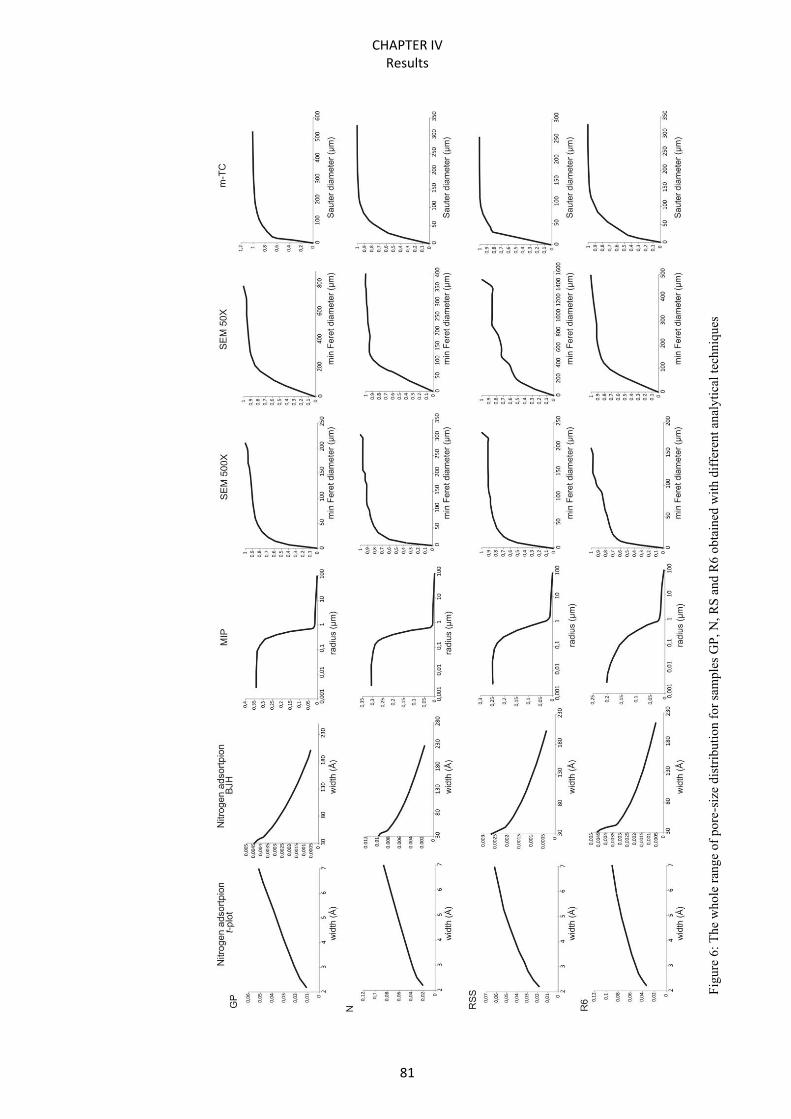
CHAPTER IV Results
81
Figu
re 6
: The
who
le ra
nge
of p
ore-
size
dis
tribu
tion
for s
ampl
es G
P, N
, RS
and
R6
obta
ined
with
diff
eren
t ana
lytic
al te
chni
ques
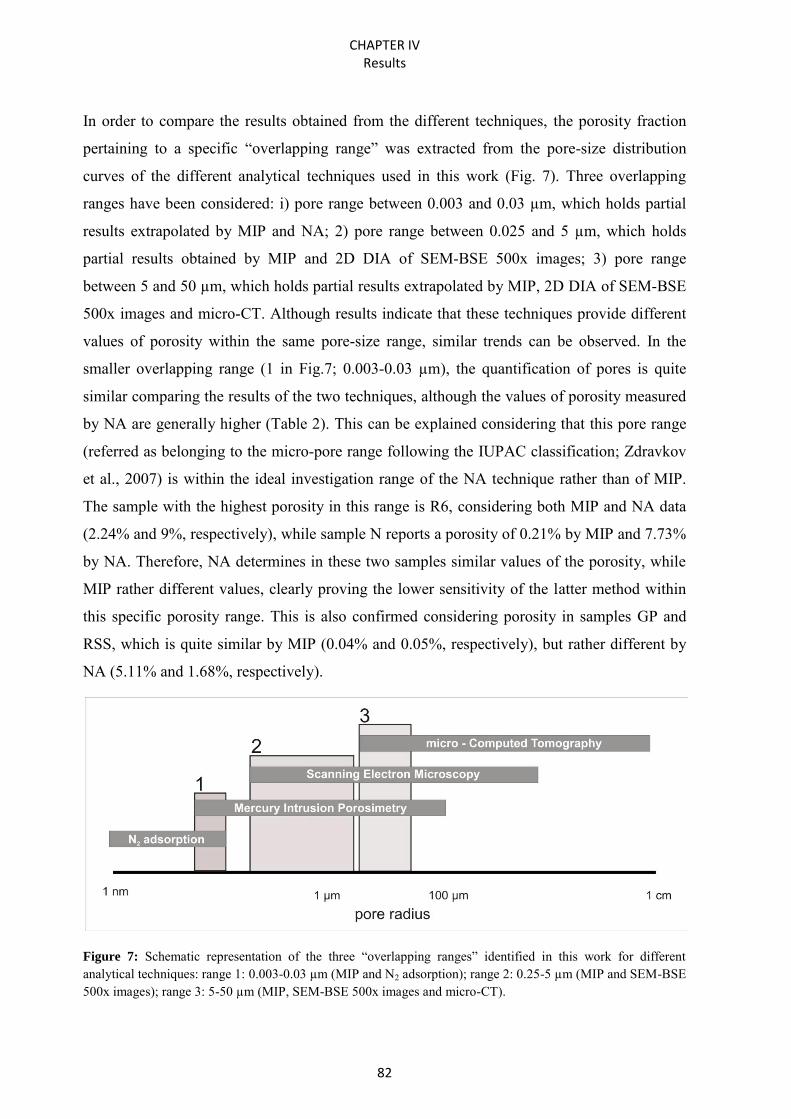
CHAPTER IV Results
82
In order to compare the results obtained from the different techniques, the porosity fraction
pertaining to a specific “overlapping range” was extracted from the pore-size distribution
curves of the different analytical techniques used in this work (Fig. 7). Three overlapping
ranges have been considered: i) pore range between 0.003 and 0.03 µm, which holds partial
results extrapolated by MIP and NA; 2) pore range between 0.025 and 5 µm, which holds
partial results obtained by MIP and 2D DIA of SEM-BSE 500x images; 3) pore range
between 5 and 50 µm, which holds partial results extrapolated by MIP, 2D DIA of SEM-BSE
500x images and micro-CT. Although results indicate that these techniques provide different
values of porosity within the same pore-size range, similar trends can be observed. In the
smaller overlapping range (1 in Fig.7; 0.003-0.03 µm), the quantification of pores is quite
similar comparing the results of the two techniques, although the values of porosity measured
by NA are generally higher (Table 2). This can be explained considering that this pore range
(referred as belonging to the micro-pore range following the IUPAC classification; Zdravkov
et al., 2007) is within the ideal investigation range of the NA technique rather than of MIP.
The sample with the highest porosity in this range is R6, considering both MIP and NA data
(2.24% and 9%, respectively), while sample N reports a porosity of 0.21% by MIP and 7.73%
by NA. Therefore, NA determines in these two samples similar values of the porosity, while
MIP rather different values, clearly proving the lower sensitivity of the latter method within
this specific porosity range. This is also confirmed considering porosity in samples GP and
RSS, which is quite similar by MIP (0.04% and 0.05%, respectively), but rather different by
NA (5.11% and 1.68%, respectively).
Figure 7: Schematic representation of the three “overlapping ranges” identified in this work for different analytical techniques: range 1: 0.003-0.03 µm (MIP and N2 adsorption); range 2: 0.25-5 µm (MIP and SEM-BSE 500x images); range 3: 5-50 µm (MIP, SEM-BSE 500x images and micro-CT).
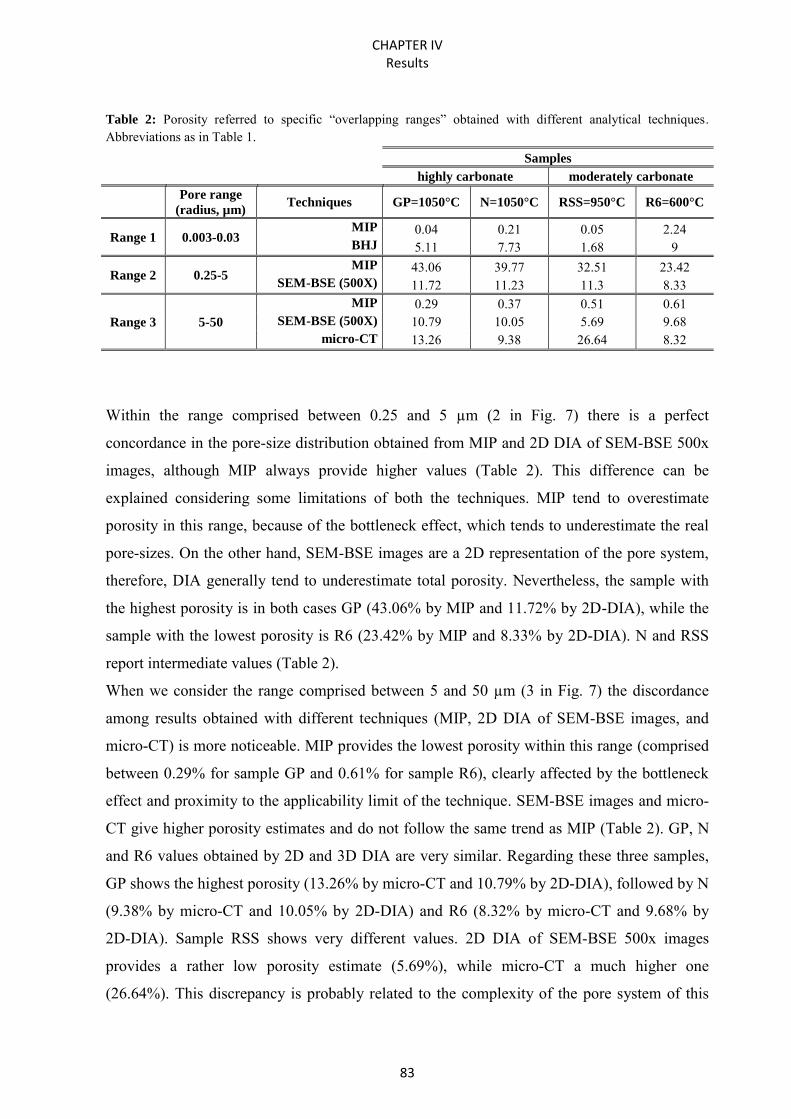
CHAPTER IV Results
83
Table 2: Porosity referred to specific “overlapping ranges” obtained with different analytical techniques. Abbreviations as in Table 1.
Samples
highly carbonate moderately carbonate
Pore range
(radius, µm) Techniques GP=1050°C N=1050°C RSS=950°C R6=600°C
Range 1 0.003-0.03 MIP 0.04 0.21 0.05 2.24 BHJ 5.11 7.73 1.68 9
Range 2 0.25-5 MIP 43.06 39.77 32.51 23.42
SEM-BSE (500X) 11.72 11.23 11.3 8.33
Range 3 5-50
MIP 0.29 0.37 0.51 0.61 SEM-BSE (500X) 10.79 10.05 5.69 9.68
micro-CT 13.26 9.38 26.64 8.32
Within the range comprised between 0.25 and 5 µm (2 in Fig. 7) there is a perfect
concordance in the pore-size distribution obtained from MIP and 2D DIA of SEM-BSE 500x
images, although MIP always provide higher values (Table 2). This difference can be
explained considering some limitations of both the techniques. MIP tend to overestimate
porosity in this range, because of the bottleneck effect, which tends to underestimate the real
pore-sizes. On the other hand, SEM-BSE images are a 2D representation of the pore system,
therefore, DIA generally tend to underestimate total porosity. Nevertheless, the sample with
the highest porosity is in both cases GP (43.06% by MIP and 11.72% by 2D-DIA), while the
sample with the lowest porosity is R6 (23.42% by MIP and 8.33% by 2D-DIA). N and RSS
report intermediate values (Table 2).
When we consider the range comprised between 5 and 50 µm (3 in Fig. 7) the discordance
among results obtained with different techniques (MIP, 2D DIA of SEM-BSE images, and
micro-CT) is more noticeable. MIP provides the lowest porosity within this range (comprised
between 0.29% for sample GP and 0.61% for sample R6), clearly affected by the bottleneck
effect and proximity to the applicability limit of the technique. SEM-BSE images and micro-
CT give higher porosity estimates and do not follow the same trend as MIP (Table 2). GP, N
and R6 values obtained by 2D and 3D DIA are very similar. Regarding these three samples,
GP shows the highest porosity (13.26% by micro-CT and 10.79% by 2D-DIA), followed by N
(9.38% by micro-CT and 10.05% by 2D-DIA) and R6 (8.32% by micro-CT and 9.68% by
2D-DIA). Sample RSS shows very different values. 2D DIA of SEM-BSE 500x images
provides a rather low porosity estimate (5.69%), while micro-CT a much higher one
(26.64%). This discrepancy is probably related to the complexity of the pore system of this
CHAPTER IV Results
84
brick, characterised by the presence of very large but spaced pores, as also revealed in the
SEM-BSE 50x images. If this is the case, the huge difference in the porosity obtained for this
sample by 2D DIA and micro-CT is at the end determined, in the specific case of sample
RSS, by a problem of representativeness of the total surface of the SEM-BSE 500x images
considered.
5. Conclusions
The combination of different methodology successfully provided a reliable characterisation of
the pore system in bricks, and a better understanding of the specific limitations of the different
techniques. The following remarks arise from the experimental work carried out:
- Porometric curves of samples fired at 1050°C (GP and N) have a well defined unimodal
pore-size distribution with the main frequency peak comprised in the range 0.5-0.1 µm. RSS
sample shows a wider peak in the range 0.1-1 µm and a threshold pore radius at 1.76 µm,
suggesting the presence of both smaller and larger pores than samples GP and N. R6 is
caracterized by a braoded peak in a smaller pore-size range compared to other samples;
- Results of capillarity test remark the trend followed by free water absorption test and the
close relationship between capillarity rise and pore-size distribution obtained by mercury
intrusion porosimetry. Samples fired at 1050°C (GP and N), which have the highest
capillarity attitude, have a pore system characterized by the highest number of pores in
correspondence with the critical size for capillarity rise (0.1-10 µm). Instead, sample R6 (fired
at 600°C) has pores smaller than 0.1 µm and is the least affected by water capillary rise;
- R6 is the sample with the N2 adsorption isotherm with the highest plateau at lower relative
pressure values, indicating the highest amount of micro-pores. Samples RSS and GP samples
have the lowest adsorption isotherms, while sample N displays intermediate features. All
samples shows hysteresis with H3 pattern, typical of meso-porous materials;
- Larger and rounder pores were identified in bricks fired at the highest temperature (1050°C).
In particular, these pores are more evident in sample N than in sample GP even if both bricks
were prepared using the same raw clayey material. Probably, the addition of Mn3O4 to sample
N promoted vitrification;
- The analysis of pore anisotropy confirmed that high firing temperature favour the
development of pores with rounded morphology;
CHAPTER IV Results
85
- The high variability of the total porosity value obtained by the segmentations of 30 single
SEM-BSE images stressed the importance of total processed area representativeness through
DIA in order to identify the real total porosity and pore-size distribution.
We have shown that none of the analytical methods here adopted are individually sufficiently
representative of the whole pore system. The different results obtained by using different
techniques, and the critical analysis of “overlapping ranges”, permit a better understanding of
the specific limitations of each analytical method, and more realistically assess the
characteristics of the whole pore system and its complexity. Through the multi-analytical
approach used, it was possible to describe in detail the relation among raw materials, firing
temperatures and porosity. Bricks made with highly carbonate clay and fired at high
temperature (1050ºC), such as GP and N, display the largest volume of open pores derived
from the decomposition of carbonate during firing. Moreover, high firing temperature
favoured the development of large and rounded pores. On the contrary, porosity in sample R6,
prepared with a moderately carbonate clay and fired at 600°C, shows rather different features.
In this sample, pore shapes is more inhomogeneous and the volume of small pores is certainly
higher. Sample RSS, with the same composition as R6, but fired at 950°C shows intermediate
features and presents the highest complexity of the pore system.
These results show that the combination of different analytical methods to the study of
porosity and the analysis of “overlapping ranges” over the pore-size distribution range
provide a more realistic reconstruction of the pore system in materials characterized by a
complex pore structure, such as bricks.
CHAPTER IV Results
86
References
Abell A.B., Willis K.L., Lange D.A., 1999. Mercury Intrusion Porosimetry and Image
Analysis of Cement-Based Materials, Journal of Colloid and Interface Science 211, 39–
44
Aligizaki K.K., 2006. Pore structure on cement-based materials, Testing, interpretation and
requirements, Taylor and Francis Group
Anovitz L.M., Cole D.R., 2015. Characterization and Analysis of porosity and pore structure,
Reviews in Mineralogy and Geochemistry 80, 61-164
Bai B., Zhu R., Wu S., Yang W.,Gelb J., Gu A., Zhang X., Su L., 2013. Multi-scale method
of Nano(Micro)-CT study on microscopic pore structure of tight sandstone of Yanchang
Formation, Ordos Basin, Petroleum Explotation and Development, Volume 40, Issue 3
Barbera G., Barone G., Crupi V., Longo F., Maisano G., Majolino D., Mazzoleni P, Raneri S.,
Teixeira J., Venuti V., 2014. A multi-technique approach for the determination of the
porous structure of building stone, European Journal of Mineralogy 26, 189–198
Benavente D., Linares-Fernández L., Cultrone G., Sebastián E., 2006. Influence of
microstructure on the resistance to salt crystallisation damage in brick, Materials and
Structures 39, 105–113
Crawford E.C., Mortensen J.K., 2009. An ImageJ plugin for the rapid morphological
characterization of separated particles and an initial application to placer gold analysis,
Computers & Geosciences 35, 347–359
Cnudde V., Cwirzen A., Masschaele B., Jacobs P.J.S., 2009. Porosity and microstructure
characterization of building stones and concretes, Engineering Geology 103, 76–83
Cnudde V., Boone M.N., 2013. High-resolution X-ray computed tomography in geosciences:
A review of the current technology and applications, Earth-Science Reviews 123, 1–17
Coletti C., Cultrone G., Maritan L., Mazzoli C., How to face the new industrial challenge of
compatible, sustainable brick production: study of various types of commercially
available bricks, (submitted)
Cueto N., Benavente D., Martínez-Martínez J., García-del-Cura M.A., 2009. Rock fabric,
pore geometry and mineralogy effects on water transport in fractured dolostones,
Engineering Geology 107, 1–15
CHAPTER IV Results
87
Cultrone G., Sebastián E., Elerta K., de la Torre M. J., Cazalla O., 2004. Rodriguez-Navarro
C., Influence of mineralogy and firing temperature on the porosity of bricks, Journal of
the European Ceramic Society 24, 547–564
Cultrone G., Madkourb F., 2013. Evaluation of the effectiveness of treatment products in
improving the quality of ceramics used in new and historical buildings, Journal of
Cultural Heritage 14, 304–310
Diamond S., 2000. Mercury porosimetry. An inappropriate method for the measurement of
pore size distributions in cement-based materials, Cement and Concrete Research 30,
1517-1525
Di Benedetto C., Cappelletti P., Favaro M., Graziano S.F., Langella A., Calcaterra D., Colella
A., 2015. Porosity as key factor in the durability of two historical building stones:
Neapolitan Yellow Tuff and Vicenza Stone, Engineering Geology 193, 310–319
Galaup S., Liu Y, Cerepi A., 2012. New integrated 2D–3D physical method to evaluate the
porosity and microstructure of carbonate and dolomite porous system, Microporous and
Mesoporous Materials 154, 175–186
Giesche H., 2006. Mercury Porosimetry: A General (Practical) Overview, Particle & Particle
Systems Characterization 23, 9–19
Groen J.C., Peffer L.A.A., Pérez-Ramírez, 2003. Pore size determination in modified micro-
and mesoporous materials. Pitfalls and limitations in gas adsorption data analysis,
Microporous and Mesoporous Materials 60, 1–17
Grove C., Jerram D.J., 2011. jPOR: An ImageJ macro to quantify total optical porosity from
blue-stained thin sections, Computers & Geosciences 37, 1850–1859
Hall C., Hoff W.D., 2009. Water Transport in Brick, Stone and Concrete, CRC Press, Taylor
and Francis Group
Hildebrand T., Rüegsegger P., 1997. A new method for the model independent assessment of
thickness in three dimensional images. Journal of Microscopy 185, 67–75
Labus M., 2009. Rock porosity in the historical monuments preservation, Civil and
Environmental Engineering Reports, N.3
Liu F.L.X., Xiong J., Liang L., 2015. Investigation of pore structure and fractal characteristics
of organic rich Yanchang formation shale in central China by nitrogen
adsorption/desorption analysis, Journal of Natural Gas Science and Engineering 22, 62–
72
CHAPTER IV Results
88
Moro F. and Böhni H., 2002. Ink-Bottle Effect in Mercury Intrusion Porosimetry of Cement-
Based Materials, Journal of Colloid and Interface Science 246, 135–149
Noiriel C., 2015. Resolving Time-dependent Evolution of Pore-Scale Structure, Permeability
and Reactivity using X-ray Microtomography, Reviews in Mineralogy & Geochemistry
80, 247 –285
NORMAL 29/88 1988, Misura dell’indice di asciugamento (drying index), CNR-ICR, Rome
Pirard R., Alié C., Pirard J.-P., Characterization of porous texture of hyperporous materials by
mercury porosimetry using densification equation, Powder Technology 128 (2002)
242–247
Rasband W.S., 1997-2015. ImageJ, U.S. National Institutes of Health, Bethesda, Maryland,
USA, http://imagej.nih.gov/ij/
Remy E., Thiel E., 2002. Medial axis for chamfer distances: computing look-up tables and
neighbourhoods in 2D or 3D, Pattern Recognition Letters 23, 649–661
Rigby S.P., Fletcher R. S., Riley S. N.., 2004. Characterisation of porous solids using
integrated nitrogen sorption and mercury porosimetry, Chemical Engineering Science
59, 41–51
Rozenbaum O., 2011. 3-D characterization of weathered building limestones by high
resolution synchrotron X-ray microtomography, Science of the Total Environment 409,
1959–1966
Siegesmund S., Dürrast H., 2014, Physical and Mechanical Properties of Rocks, in: Stone in
Architecture, Properties, Durability, Siegesmund S. & Snethlage R. (eds), Springer,
London, 97–225
Sing K.S.W., Everett D.H., Haul R.A.W., Moscou L., Pierotti R.A., Rouquérol J.,
Siemienievska T., 1985. Reporting physisorption data for gas/solid systems with special
reference to the determination of surface area and porosity, Pure & Applied Chemistry
57, 603–619
Sing K.S.W., 2001. The use of nitrogen adsorption for the characterisation of porous
materials, Colloids and Surfaces, A: Physicochemical and Engineering Aspects 187–
188, 3–9
Sobott R., Bente K., Kittel M., 2014. Comparative porosity measurements on ceramic
materials, The Old Potter’s Almanack 19, 18–25
CHAPTER IV Results
89
Storck S., Bretinger H., Maier W.F., 1998. Characterization of micro- and mesoporous solids
by physisorption methods and pore-size analysis, Applied Catalysis A: General 174,
137-146
Sun W., Chen T., Chen C., Li J., 2007. A study on membrane morphology by digital image
processing, Journal of Membrane Science 305, 93–102
UNI EN 13755, 2008. Metodi di prova per pietre naturali - Determinazione dell'assorbimento
d'acqua a pressione atmosferica, CNR-ICR, Rome.
UNI EN 1925, 2000. Metodi di prova per pietre naturali - determinazione del coefficiente di
assorbimento d'acqua per capillarità, CNR-ICR, Rome.
Zdravkov B.D., Čermák J.J., Šefara M., Janků J., 2007. Pore classification in the
characterization of porous materials: A perspective, Central European Journal of
Chemistry 5 385–395

CHAPTER IV Results
90
CHAPTER V
Results
Recycling trachyte waste from quarry to brick industry:
petrophysical characterization and durability
of new ceramic products

CHAPTER V Results
93
Recycling trachyte waste from quarry to brick industry: petrophysical
characterization and durability of new ceramic products
Abstract
This work aims to investigate the possibility of recycling trachyte waste produced from quarrying activity and
ornamental stone cutting processes, as temper for the preparation of new types of bricks, which satisfy the
requirement of energy saving, production cost reduction and preservation of increasingly meagre raw material
sources. Three different mixtures were prepared adding 5, 10 and 15 wt% of trachyte to a clayey material. Each
mixture was fired at the temperatures of 900, 1000 and 1100 °C, according to standard industrial procedure. The
influence of the waste addition was investigated determining petrographic and physical characteristics in order to
assess aesthetic and mechanical features of the fired bricks. The good response to stress conditions of all the
samples prove that the use of trachyte could bring benefits already for bricks fired at 900 °C.
Key-words: Bricks; Waste recycling; Physical–mechanical properties; Petrography; Pore system; Durability
1. Introduction
For millennia clay bricks have been used as building materials for their excellent properties.
From both environmental and economic perspectives, bricks are still a valuable, healthy and
efficient construction material. In the last years, extensive research has been conducted on the
industrial brick production promoting environmental protection and supporting sustainable
development (Dondi et al., 1997a; Dondi et al., 1997b; Raut et al., 2011; Zhang, 2013; Muñoz
Velasco et al., 2014; Neves Monteiro & Fontes Vieira, 2014; Bories et al., 2014; Demir,
2008).
The great amount of waste generated by industrial processes and the increasing attention to
environmental issues stimulated a progressive interest in the reuse of waste. Moreover, the
increasing demand of sustainable materials addressed research to environmental friendly
development of construction materials using waste and at the same time introducing better
quality bricks in the industrial production.
Several studies have been conducted on the influence of various types of additives used in the
brick production, such as those tested to increase porosity by recycling paper (Demir et al.,
CHAPTER V Results
94
2005; Sutcu & Akkurt, 2009; Rajput et al., 2012; Sutcu et al., 2014), cotton (Rajput et al.,
2012), tea (Demir, 2006), rise (Chiang et al., 2009), tobacco (Demir, 2008), sudwaste (Elique-
Quesada et al., 2012b) or reusing biomass (Fernández-Pereira et al., 2011; Pérez-Villarejo,
2012; Barbieri et al., 2013) and biodiesel (Elique-Quesada et al., 2012a). The addition of
inorganic wastes of various origin have been also tested, such as that of material derived from
natural stone processing like perlite (Topçu & Işidağ, 2007), marble (Ercikdi et al., 2011;
Bilgin et al., 2012; Elique-Quedada et al., 2012b; Sutcu et al., 2015), pozzolana (Ercikdi et al.,
2009), fly ash (Cultrone & Sebastián, 2009; Zhang et al., 2011) and of secondary industrial
materials like sewage sludge (Yagüe et al., 2002; Weng et al., 2003; Cusidó & Cremades,
2012; Manca et al., 2015), ceramic sludge (Coletti et al., submitted) and leach residues (Chen
et al., 2011). Nevertheless, the production of commercial bricks with recycled waste materials
is still very limited. The absence of standard procedures fulfilling requirements of industrial
production and widespread general public scepticism are the main weaknesses for scaling-up.
Despite these difficulties, scientific research should continue investigating the possible reuse
of waste, maintaining required quality and health standards of the final products, finding valid
criteria of standardization of the technical properties, and quantifying the impact on economic
and environmental issues, thus allowing aware eco-labelling and adequate public education
(Burnett, 2007; Zhang, 2013).
The principles of a sustainable development arise from the increasing shortage of non-
renewable resources exposing well-being of the future generations to risk, and encompass the
concepts of “Reuse, Recycle and Replace” improving environmental damage control (Ortiz et
al., 2009; Haldar, 2013). The sustainability of a product is evaluated considering the
interactions with the environment, taking place during the entire cycle of its life (Life Cycle
Assessment, LCA), from raw material extraction to disposal, recycling or reuse. The
environmental impact of a product is therefore determined through the evaluation of the LCA,
including energy and material consumption, environmental risk factors, specifically related to
gas emissions during firing and to the release of chemicals exposing humans and environment
to risk (Koroneos & Dompros, 2007; Peris Mora, 2007; Ortiz et al., 2009). Moreover, brick
companies compete on the global market relying on their skills in optimizing quality and
reducing production costs. This can be achieved reusing resources, adopting renewable energy
systems and decreasing firing temperatures (Asiedu & Gu, 1998).
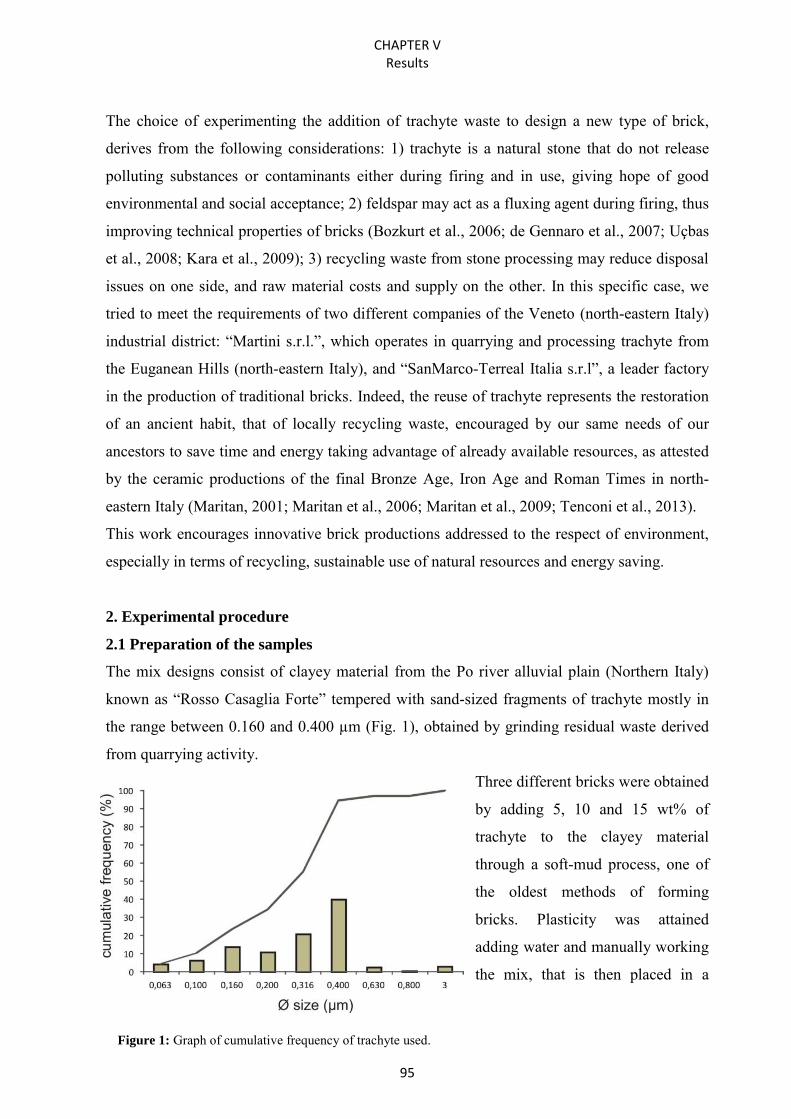
CHAPTER V Results
95
Figure 1: Graph of cumulative frequency of trachyte used.
The choice of experimenting the addition of trachyte waste to design a new type of brick,
derives from the following considerations: 1) trachyte is a natural stone that do not release
polluting substances or contaminants either during firing and in use, giving hope of good
environmental and social acceptance; 2) feldspar may act as a fluxing agent during firing, thus
improving technical properties of bricks (Bozkurt et al., 2006; de Gennaro et al., 2007; Uçbas
et al., 2008; Kara et al., 2009); 3) recycling waste from stone processing may reduce disposal
issues on one side, and raw material costs and supply on the other. In this specific case, we
tried to meet the requirements of two different companies of the Veneto (north-eastern Italy)
industrial district: “Martini s.r.l.”, which operates in quarrying and processing trachyte from
the Euganean Hills (north-eastern Italy), and “SanMarco-Terreal Italia s.r.l”, a leader factory
in the production of traditional bricks. Indeed, the reuse of trachyte represents the restoration
of an ancient habit, that of locally recycling waste, encouraged by our same needs of our
ancestors to save time and energy taking advantage of already available resources, as attested
by the ceramic productions of the final Bronze Age, Iron Age and Roman Times in north-
eastern Italy (Maritan, 2001; Maritan et al., 2006; Maritan et al., 2009; Tenconi et al., 2013).
This work encourages innovative brick productions addressed to the respect of environment,
especially in terms of recycling, sustainable use of natural resources and energy saving.
2. Experimental procedure
2.1 Preparation of the samples
The mix designs consist of clayey material from the Po river alluvial plain (Northern Italy)
known as “Rosso Casaglia Forte” tempered with sand-sized fragments of trachyte mostly in
the range between 0.160 and 0.400 µm (Fig. 1), obtained by grinding residual waste derived
from quarrying activity.
Three different bricks were obtained
by adding 5, 10 and 15 wt% of
trachyte to the clayey material
through a soft-mud process, one of
the oldest methods of forming
bricks. Plasticity was attained
adding water and manually working
the mix, that is then placed in a
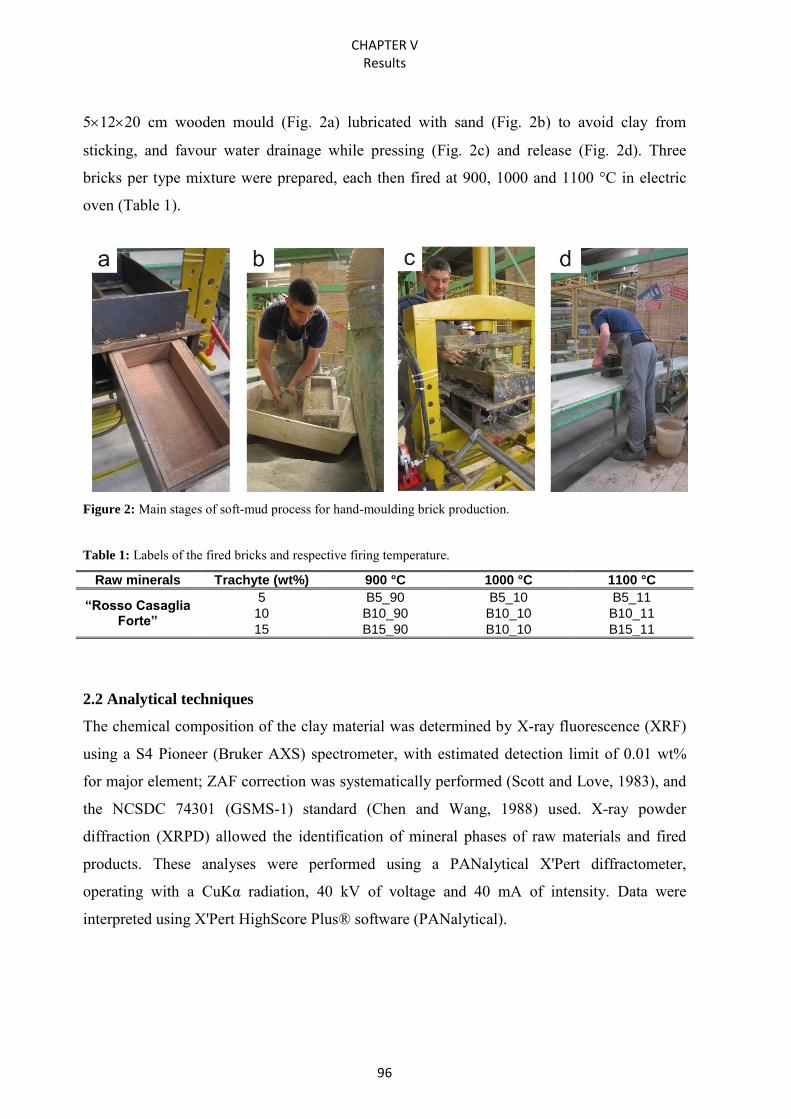
CHAPTER V Results
96
51220 cm wooden mould (Fig. 2a) lubricated with sand (Fig. 2b) to avoid clay from
sticking, and favour water drainage while pressing (Fig. 2c) and release (Fig. 2d). Three
bricks per type mixture were prepared, each then fired at 900, 1000 and 1100 °C in electric
oven (Table 1).
Figure 2: Main stages of soft-mud process for hand-moulding brick production.
Table 1: Labels of the fired bricks and respective firing temperature.
Raw minerals Trachyte (wt%) 900 °C 1000 °C 1100 °C
“Rosso Casaglia Forte”
5 B5_90 B5_10 B5_11
10 B10_90 B10_10 B10_11
15 B15_90 B10_10 B15_11
2.2 Analytical techniques
The chemical composition of the clay material was determined by X-ray fluorescence (XRF)
using a S4 Pioneer (Bruker AXS) spectrometer, with estimated detection limit of 0.01 wt%
for major element; ZAF correction was systematically performed (Scott and Love, 1983), and
the NCSDC 74301 (GSMS-1) standard (Chen and Wang, 1988) used. X-ray powder
diffraction (XRPD) allowed the identification of mineral phases of raw materials and fired
products. These analyses were performed using a PANalytical X'Pert diffractometer,
operating with a CuKα radiation, 40 kV of voltage and 40 mA of intensity. Data were
interpreted using X'Pert HighScore Plus® software (PANalytical).
CHAPTER V Results
97
Minero-petrogaphic and textural features were described under polarized light optical
microscope on polished thin sections, (Olympus DX–50, equipped with a Nikon D7000
digital microphotography system).
Texture and reaction microstructures were investigated by scanning electron microscopy
(SEM) with a CamScan MX 2500 microscope, coupled with EDAX “Sapphire” detector
(LEAP+Si(Li) crystal), equipped with a LaB6 cathode and operating at 20 kV and 160 nA.
Backscattered electron images (SEM-BSE) were acquired with a resolution of 1280×1024
pixels. Elemental maps (512×400 pixels) of selected areas were acquired for a number of
chemical elements of interest (Al, Ca, Fe, K, Mg, Na, P, Si, Ti) in order to recognise reaction
margins between trachyte grains and surrounding matrix.
Water absorption (UNI EN 1925, 2000; UNI EN 13755, 2008) and drying tests (NORMAL
29/88) were performed using cubic samples (50 mm edge) (three samples per type of brick).
Free and forced absorption (Al and Af), drying index (Di), apparent and real density (Da and
Dr), open porosity (P) and degree of pore interconnection (Ax) were then calculated (RILEM,
1980; Cultrone et al., 2003).
Nitrogen Adsorption (NA) determined porosity in the range 0.0002-0.15 µm (radius). The
sorption isotherms were obtained at 77 K using a Micromeritics Tristar 3000 apparatus. Prior
to measurement samples were heated at 130 °C for 24 h and outgassed to 10-3 Torr using a
Micromeritics Flowprep.
The propagation velocities Vp (compression pulse) and Vs (shear pulse) were measured to
check the elastic parameters and structural anisotropy of fired bricks and to detect variation in
the degree of compactness during and after the ageing tests. Ultrasonic waves were
transmitted in the three perpendicular directions of the cubic samples (edge: 50 mm) by
means of a Panametrics HV Pulser/Receiver 5058PR coupled with a Tektronix TDS 3012B
oscilloscope. The measurements were performed using transducers of 1 MHz over a circular
contact surface of 3 cm in diameter. Poisson coefficient (ν), Young (E), shear (S) and bulk
(K) modules were then calculated from the measured wave velocities (Vp and Vs), using the
apparent density values previously determined by hydric test. Uniaxial mechanical test was
carried out on three cubic samples (edge: 40 mm) for each of the brick types using a IPEMSA
Model S-110 press with a loading rate of 20 kg/s.
The effect of salts on the durability of bricks was verified by means of salt crystallization test
on three cubic samples (edge: 50 mm) for each brick type subjected to 10 cycles of 24 h (UNI
CHAPTER V Results
98
EN 12370, 2001). The evaluation of the frost resistance was carried out by freeze-thaw test on
three cubic samples (edge: 50 mm) for each brick type through 30 cycles of 24 h (UNI EN
12371, 2010).
Infrared Thermography (IRT) was also performed on cubic samples (edge: 50 mm), using a
FLIR T440 series camera. This non-destructive test consisted in heating the samples on their
base during 20 min at 50 °C and recording infrared images at regular intervals of 30 s. The
camera converts infrared light to electronic signals, returning images in false colours, each
corresponding to a different temperature. In order to evaluate brick thermal insulation, the
same area was cropped from each set of IRT images and segmented for a given fraction of
colour saturation corresponding to a temperature of 50 °C using MultiSpec3.3© software.
The colour of dried and wet fired bricks was measured using a Konica Minolta CM-700d
spectrophotometer following the CIELab system, where the colour is described in terms of
lightness (L*: -100 = black, +100 = white) and two chromatic coordinates a* and b*, that
reflect the amount of red-green and yellow-blue colours (a*: -60 = green, +60 = red; b*: -60 =
blue, +60 = yellow), respectively. The degree of colour difference (∆E*) was calculated with
the following equation:
Measurements were carried out using a CIE D65 standard illuminant (simulating daylight
with a colour temperature of 6504 K) with SCI/SCE modes and a wave-length between 400
and 700 nm.
3. Results
3.1 Characterization of raw materials
The clayey material is chemically rich in SiO2 (63.57 wt%) and Al2O3 (13.62 wt%), rather
poor in calcium and magnesium (CaO + MgO = 3.85 + 2.29 = 6.14 wt%), and moderately rich
in iron (Fe2O3 = 5.06 wt%) and potassium (K2O = 2.61 wt%), with a Loss on Ignition (LOI)
of 6.94 wt% (Table 2). Based on XRPD analysis, quartz is the most abundant phase, followed
by feldspars and lesser amounts of calcite, dolomite, chlorite and illite (Table 2).
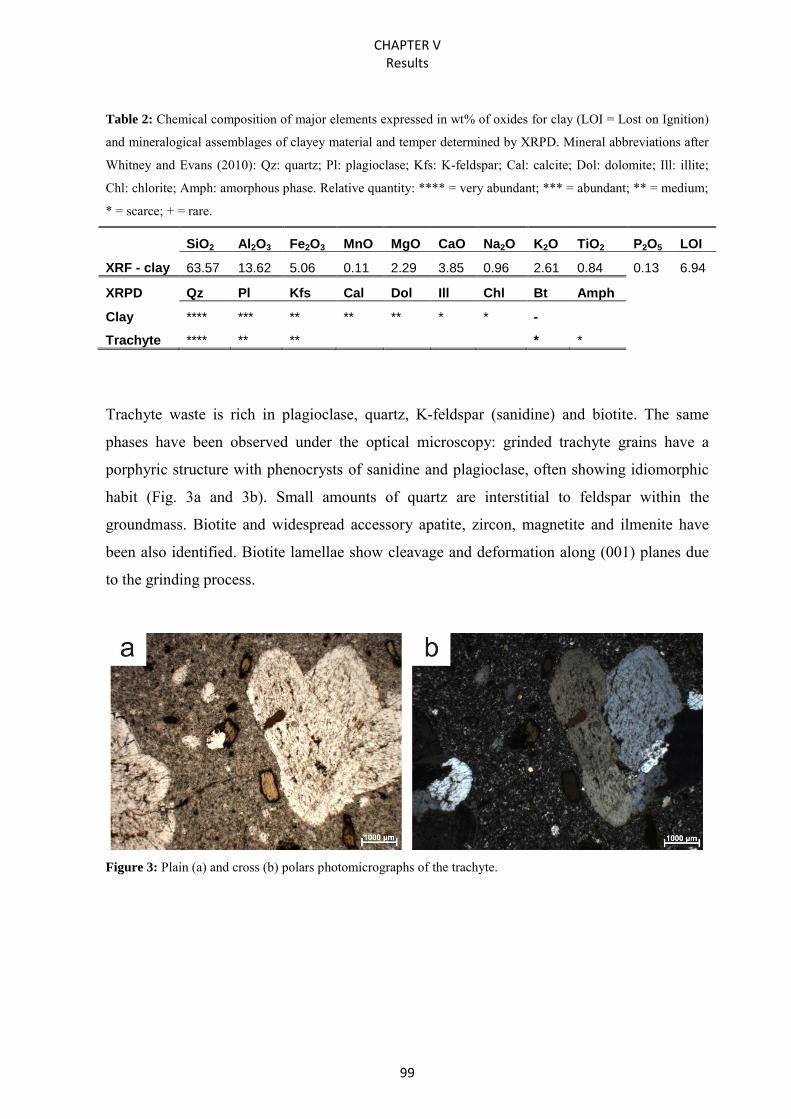
CHAPTER V Results
99
Table 2: Chemical composition of major elements expressed in wt% of oxides for clay (LOI = Lost on Ignition)
and mineralogical assemblages of clayey material and temper determined by XRPD. Mineral abbreviations after
Whitney and Evans (2010): Qz: quartz; Pl: plagioclase; Kfs: K-feldspar; Cal: calcite; Dol: dolomite; Ill: illite;
Chl: chlorite; Amph: amorphous phase. Relative quantity: **** = very abundant; *** = abundant; ** = medium;
* = scarce; + = rare.
SiO2 Al2O3 Fe2O3 MnO MgO CaO Na2O K2O TiO2 P2O5 LOI
XRF - clay 63.57 13.62 5.06 0.11 2.29 3.85 0.96 2.61 0.84 0.13 6.94
XRPD Qz Pl Kfs Cal Dol Ill Chl Bt Amph
Clay **** *** ** ** ** * * -
Trachyte **** ** **
* *
Trachyte waste is rich in plagioclase, quartz, K-feldspar (sanidine) and biotite. The same
phases have been observed under the optical microscopy: grinded trachyte grains have a
porphyric structure with phenocrysts of sanidine and plagioclase, often showing idiomorphic
habit (Fig. 3a and 3b). Small amounts of quartz are interstitial to feldspar within the
groundmass. Biotite and widespread accessory apatite, zircon, magnetite and ilmenite have
been also identified. Biotite lamellae show cleavage and deformation along (001) planes due
to the grinding process.
Figure 3: Plain (a) and cross (b) polars photomicrographs of the trachyte.
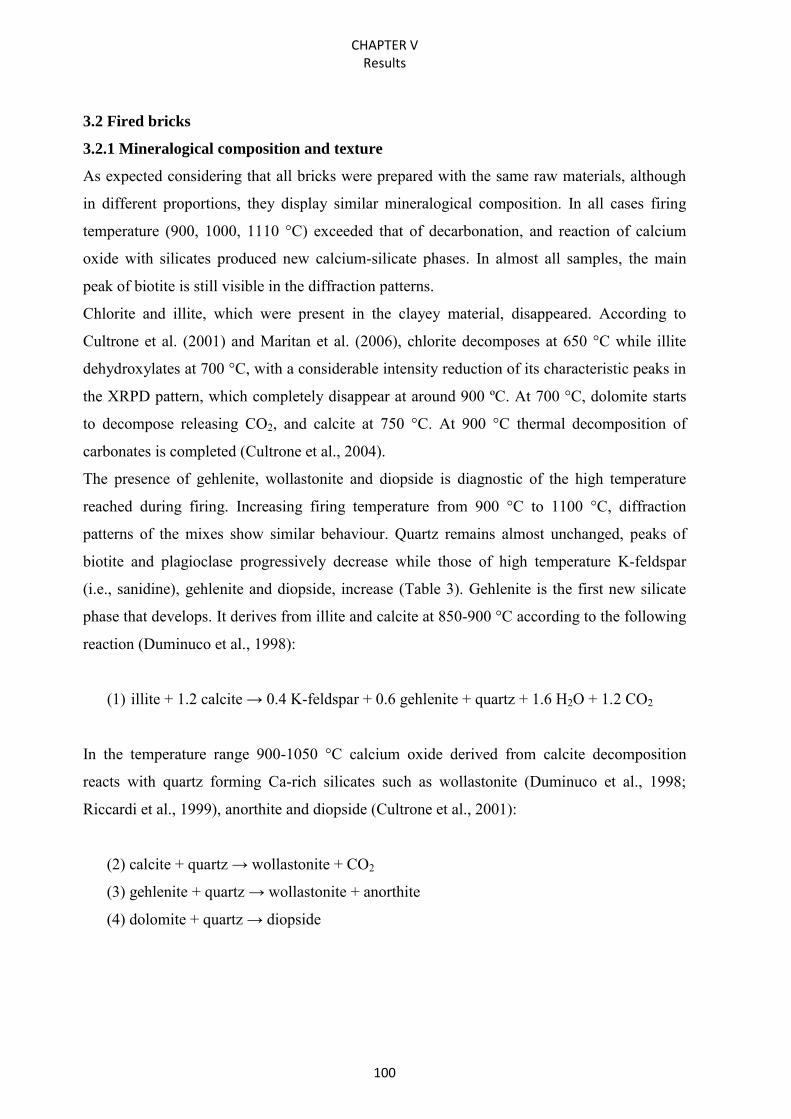
CHAPTER V Results
100
3.2 Fired bricks
3.2.1 Mineralogical composition and texture
As expected considering that all bricks were prepared with the same raw materials, although
in different proportions, they display similar mineralogical composition. In all cases firing
temperature (900, 1000, 1110 °C) exceeded that of decarbonation, and reaction of calcium
oxide with silicates produced new calcium-silicate phases. In almost all samples, the main
peak of biotite is still visible in the diffraction patterns.
Chlorite and illite, which were present in the clayey material, disappeared. According to
Cultrone et al. (2001) and Maritan et al. (2006), chlorite decomposes at 650 °C while illite
dehydroxylates at 700 °C, with a considerable intensity reduction of its characteristic peaks in
the XRPD pattern, which completely disappear at around 900 ºC. At 700 °C, dolomite starts
to decompose releasing CO2, and calcite at 750 °C. At 900 °C thermal decomposition of
carbonates is completed (Cultrone et al., 2004).
The presence of gehlenite, wollastonite and diopside is diagnostic of the high temperature
reached during firing. Increasing firing temperature from 900 °C to 1100 °C, diffraction
patterns of the mixes show similar behaviour. Quartz remains almost unchanged, peaks of
biotite and plagioclase progressively decrease while those of high temperature K-feldspar
(i.e., sanidine), gehlenite and diopside, increase (Table 3). Gehlenite is the first new silicate
phase that develops. It derives from illite and calcite at 850-900 °C according to the following
reaction (Duminuco et al., 1998):
(1) illite + 1.2 calcite → 0.4 K-feldspar + 0.6 gehlenite + quartz + 1.6 H2O + 1.2 CO2
In the temperature range 900-1050 °C calcium oxide derived from calcite decomposition
reacts with quartz forming Ca-rich silicates such as wollastonite (Duminuco et al., 1998;
Riccardi et al., 1999), anorthite and diopside (Cultrone et al., 2001):
(2) calcite + quartz → wollastonite + CO2
(3) gehlenite + quartz → wollastonite + anorthite
(4) dolomite + quartz → diopside
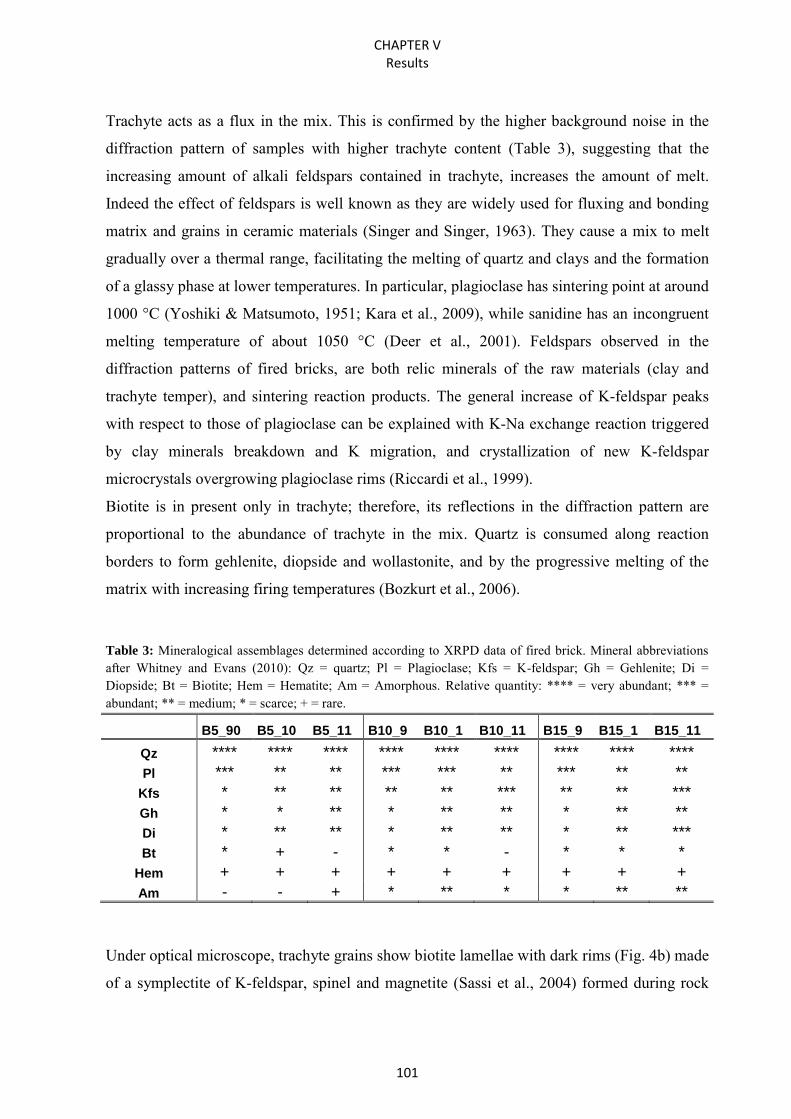
CHAPTER V Results
101
Trachyte acts as a flux in the mix. This is confirmed by the higher background noise in the
diffraction pattern of samples with higher trachyte content (Table 3), suggesting that the
increasing amount of alkali feldspars contained in trachyte, increases the amount of melt.
Indeed the effect of feldspars is well known as they are widely used for fluxing and bonding
matrix and grains in ceramic materials (Singer and Singer, 1963). They cause a mix to melt
gradually over a thermal range, facilitating the melting of quartz and clays and the formation
of a glassy phase at lower temperatures. In particular, plagioclase has sintering point at around
1000 °C (Yoshiki & Matsumoto, 1951; Kara et al., 2009), while sanidine has an incongruent
melting temperature of about 1050 °C (Deer et al., 2001). Feldspars observed in the
diffraction patterns of fired bricks, are both relic minerals of the raw materials (clay and
trachyte temper), and sintering reaction products. The general increase of K-feldspar peaks
with respect to those of plagioclase can be explained with K-Na exchange reaction triggered
by clay minerals breakdown and K migration, and crystallization of new K-feldspar
microcrystals overgrowing plagioclase rims (Riccardi et al., 1999).
Biotite is in present only in trachyte; therefore, its reflections in the diffraction pattern are
proportional to the abundance of trachyte in the mix. Quartz is consumed along reaction
borders to form gehlenite, diopside and wollastonite, and by the progressive melting of the
matrix with increasing firing temperatures (Bozkurt et al., 2006).
Table 3: Mineralogical assemblages determined according to XRPD data of fired brick. Mineral abbreviations after Whitney and Evans (2010): Qz = quartz; Pl = Plagioclase; Kfs = K-feldspar; Gh = Gehlenite; Di = Diopside; Bt = Biotite; Hem = Hematite; Am = Amorphous. Relative quantity: **** = very abundant; *** = abundant; ** = medium; * = scarce; + = rare.
B5_90 B5_10 B5_11 B10_9 B10_1 B10_11 B15_9 B15_1 B15_11
Qz **** **** **** **** **** **** **** **** ****
Pl *** ** ** *** *** ** *** ** **
Kfs * ** ** ** ** *** ** ** ***
Gh * * ** * ** ** * ** **
Di * ** ** * ** ** * ** ***
Bt * + - * * - * * *
Hem + + + + + + + + +
Am - - + * ** * * ** **
Under optical microscope, trachyte grains show biotite lamellae with dark rims (Fig. 4b) made
of a symplectite of K-feldspar, spinel and magnetite (Sassi et al., 2004) formed during rock
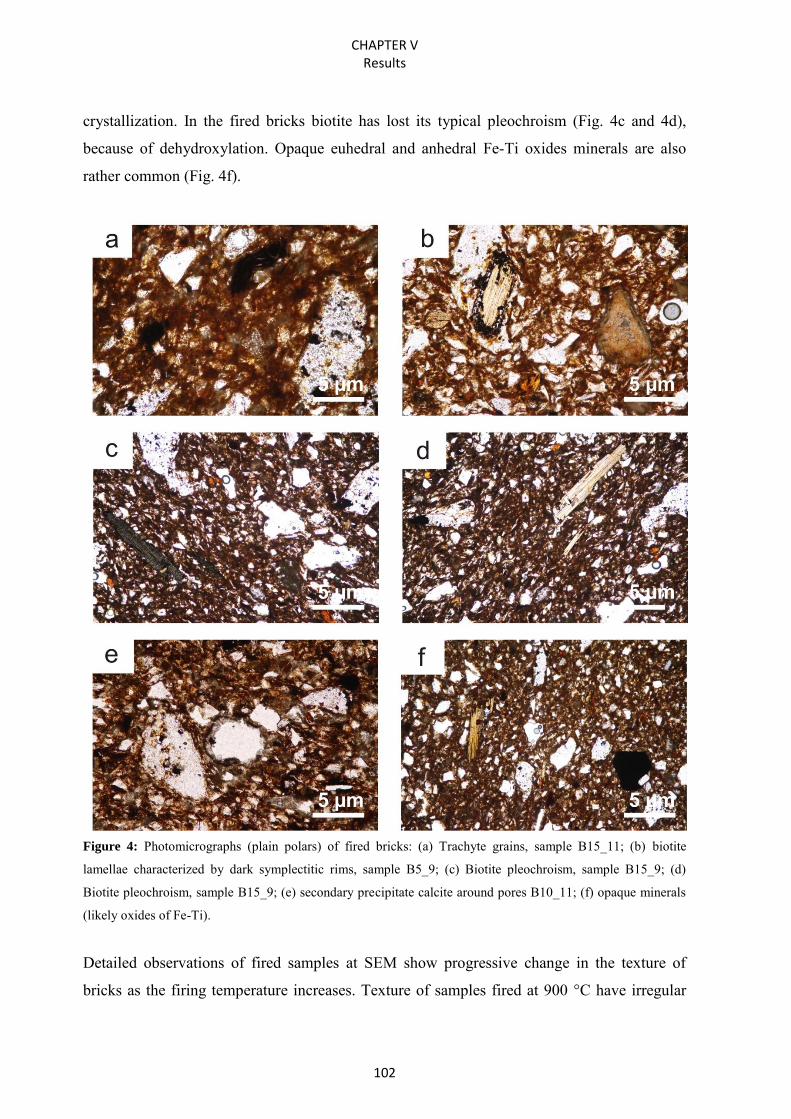
CHAPTER V Results
102
crystallization. In the fired bricks biotite has lost its typical pleochroism (Fig. 4c and 4d),
because of dehydroxylation. Opaque euhedral and anhedral Fe-Ti oxides minerals are also
rather common (Fig. 4f).
Figure 4: Photomicrographs (plain polars) of fired bricks: (a) Trachyte grains, sample B15_11; (b) biotite
lamellae characterized by dark symplectitic rims, sample B5_9; (c) Biotite pleochroism, sample B15_9; (d)
Biotite pleochroism, sample B15_9; (e) secondary precipitate calcite around pores B10_11; (f) opaque minerals
(likely oxides of Fe-Ti).
Detailed observations of fired samples at SEM show progressive change in the texture of
bricks as the firing temperature increases. Texture of samples fired at 900 °C have irregular
CHAPTER V Results
103
pores and grains poorly connected with the surrounding matrix (Fig. 5a), whereas in those
fired at 1000 and 1100 °C the level of vitrification is more pronounced and pores are more
homogeneously shaped and rounded, not only as an effect of the firing temperature, but also
proportionally to trachyte content. Changes in compactness and porosity structure is less
evident in bricks fired at 1100 °C and containing 5% of trachyte (Fig. 5b), than in those fired
at 1000 °C but containing 15% of trachyte (Fig. 5c). In samples with the highest trachyte
concentration (15%) and fired at 1100 °C, groundmass results to be extremely compact, with
numerous bonds among grains determined by the melt (Fig. 5d) and secondary porosity
developed. Connecting bridges among grains are even better visible at higher magnification
(Fig 5e) as well as the rounded shape of the pores (Fig 5f). The effect of trachyte on melting
can be also observed from textural analysis of trachyte grains. Vitrification is more diffused
along grain boundaries, the amorphous phase acting as a bridge among trachyte grains and the
surrounding matrix (Fig. 5g, Fig. 5h). Element distribution in chemical maps (Figs. 5i, Fig. 5j)
shows that K content in the amorphous phase decreases from the trachyte grain towards the
surrounding matrix, indicating a diffusion of this elements from the feldspar contained in the
trachyte outwards.
As for the other type of inclusions naturally occurring in the clay material, it can be observed
that at 1000 °C calcite and dolomite completely reacted and only residual decomposed grains
are still present (Fig. 5k, Fig. 5l). The diffusion of Ca and Mg ions in the groundmass,
released by calcite and dolomite decomposition, determines the formation of calcium silicates
in the matrix and that of ring structures around quartz and feldspar boundaries, where
wollastonite (Fig. 5m), diopside and gehlenite crystallized (Fig. 5m). At 900 °C biotite is
completely dehydroxylated (Fig. 5o) and at 1000 °C presents the typical alteration along (001)
cleavage planes with the development of secondary porosity (Fig. 5p). At 1100 °C illite is
deeply altered with diffused Fe-bearing oxides and glass patches including bubbles (Fig. 5q).
Rounded pores at 1100 °C are also rather frequent in the matrix (Fig. 5r).
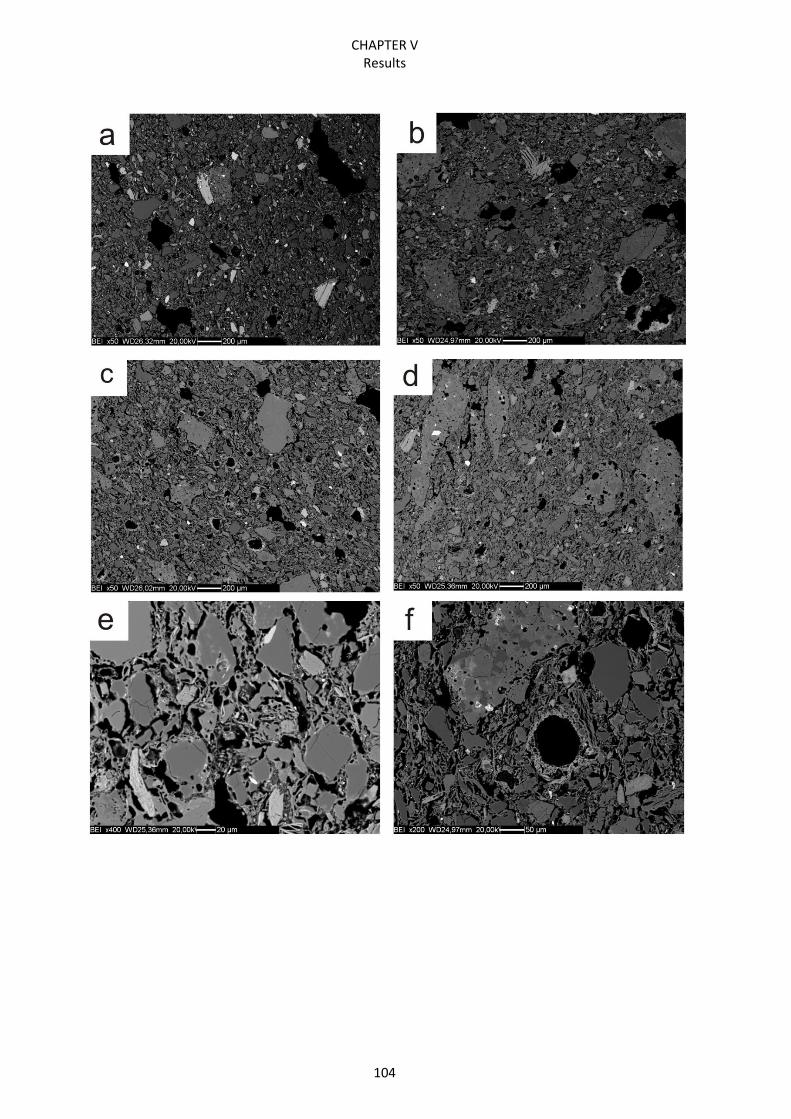
CHAPTER V Results
104
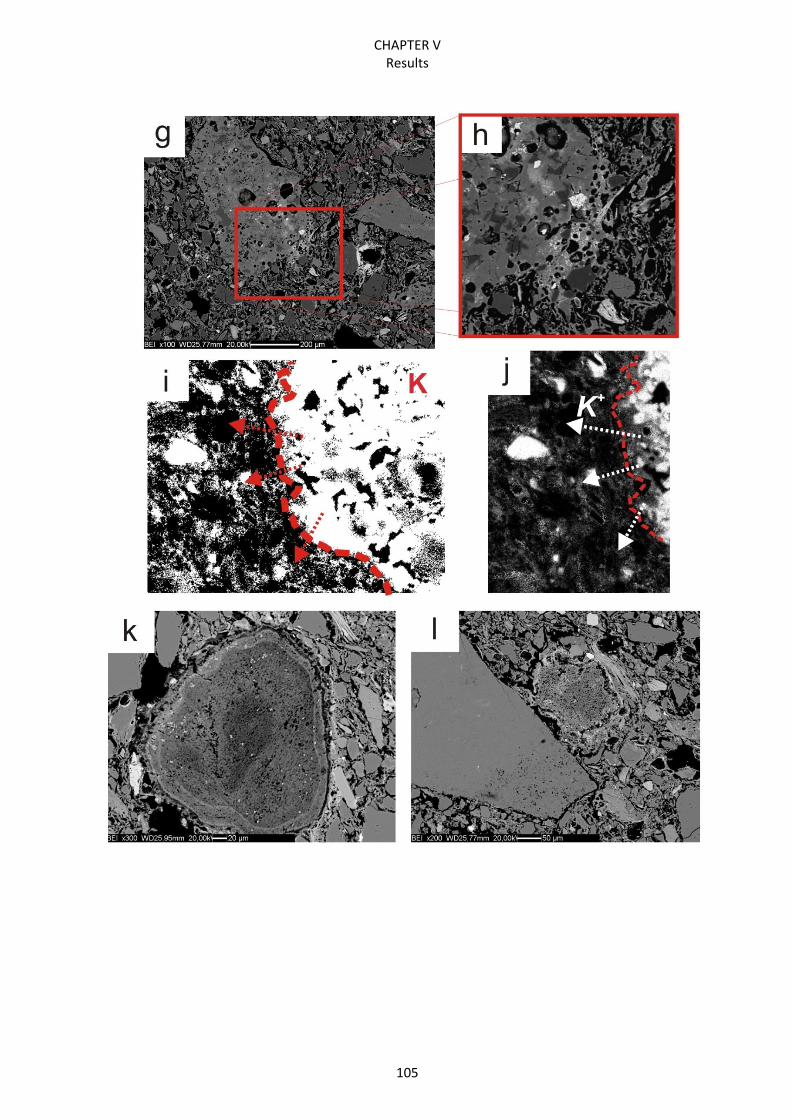
CHAPTER V Results
105
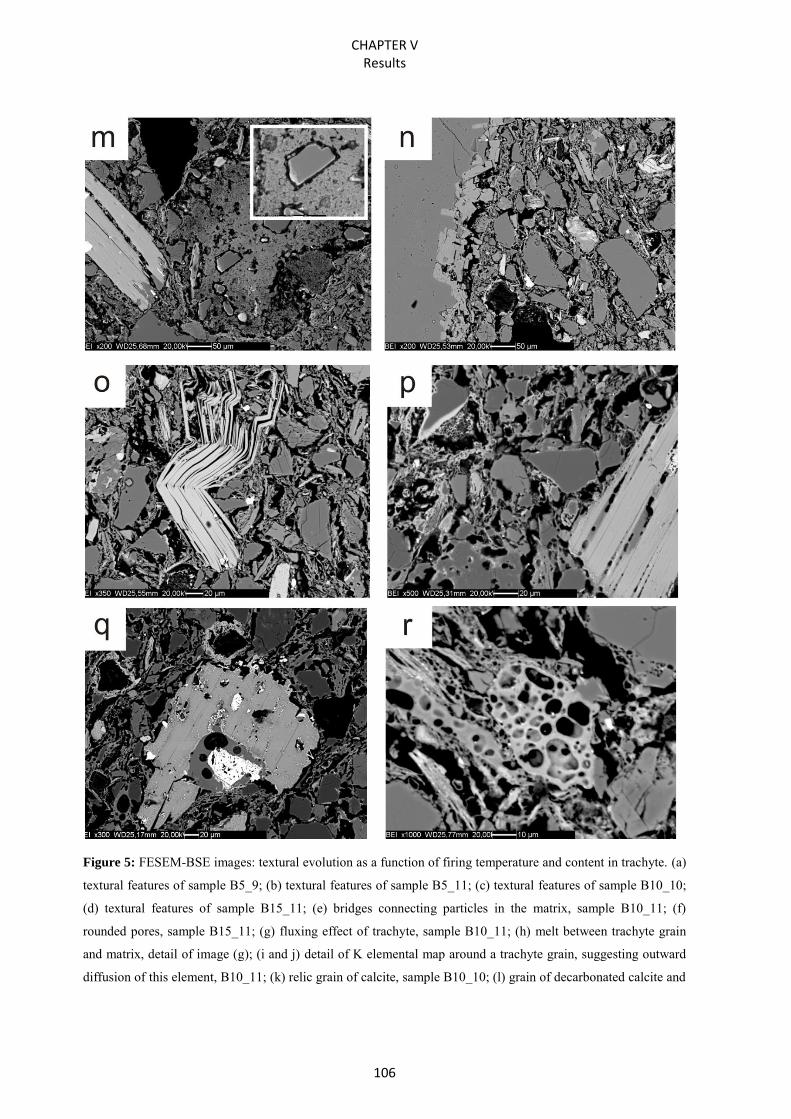
CHAPTER V Results
106
Figure 5: FESEM-BSE images: textural evolution as a function of firing temperature and content in trachyte. (a)
textural features of sample B5_9; (b) textural features of sample B5_11; (c) textural features of sample B10_10;
(d) textural features of sample B15_11; (e) bridges connecting particles in the matrix, sample B10_11; (f)
rounded pores, sample B15_11; (g) fluxing effect of trachyte, sample B10_11; (h) melt between trachyte grain
and matrix, detail of image (g); (i and j) detail of K elemental map around a trachyte grain, suggesting outward
diffusion of this element, B10_11; (k) relic grain of calcite, sample B10_10; (l) grain of decarbonated calcite and
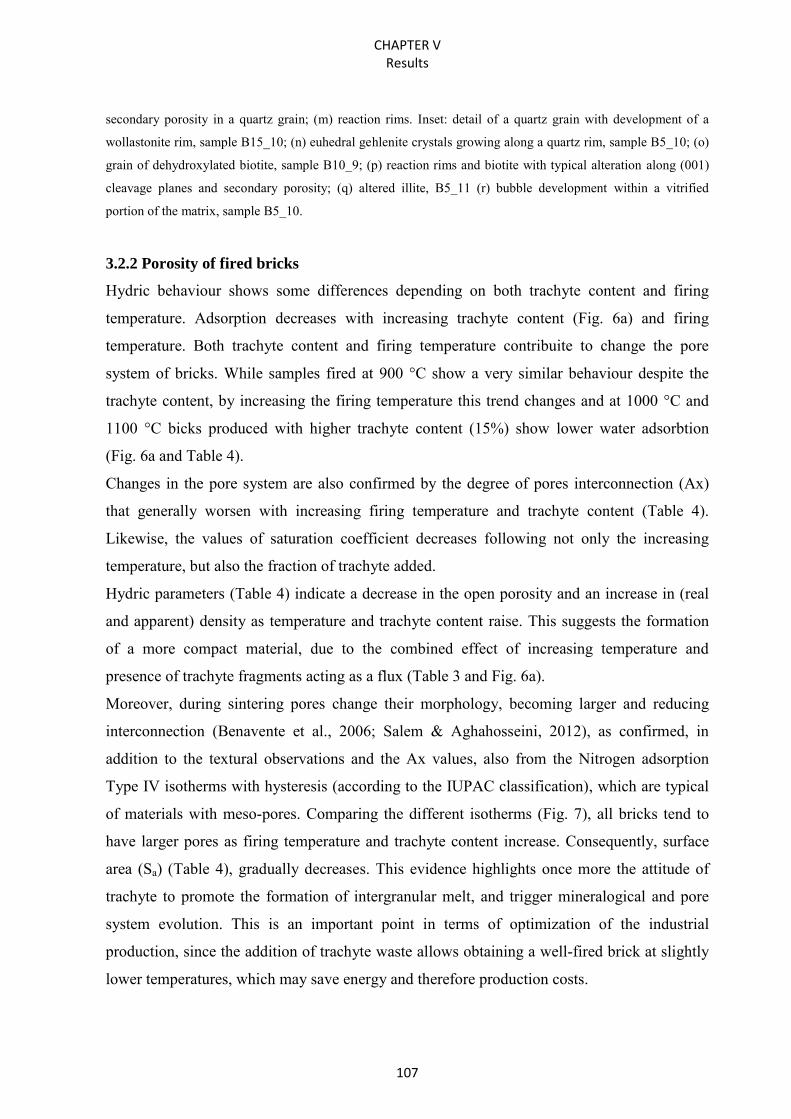
CHAPTER V Results
107
secondary porosity in a quartz grain; (m) reaction rims. Inset: detail of a quartz grain with development of a
wollastonite rim, sample B15_10; (n) euhedral gehlenite crystals growing along a quartz rim, sample B5_10; (o)
grain of dehydroxylated biotite, sample B10_9; (p) reaction rims and biotite with typical alteration along (001)
cleavage planes and secondary porosity; (q) altered illite, B5_11 (r) bubble development within a vitrified
portion of the matrix, sample B5_10.
3.2.2 Porosity of fired bricks
Hydric behaviour shows some differences depending on both trachyte content and firing
temperature. Adsorption decreases with increasing trachyte content (Fig. 6a) and firing
temperature. Both trachyte content and firing temperature contribuite to change the pore
system of bricks. While samples fired at 900 °C show a very similar behaviour despite the
trachyte content, by increasing the firing temperature this trend changes and at 1000 °C and
1100 °C bicks produced with higher trachyte content (15%) show lower water adsorbtion
(Fig. 6a and Table 4).
Changes in the pore system are also confirmed by the degree of pores interconnection (Ax)
that generally worsen with increasing firing temperature and trachyte content (Table 4).
Likewise, the values of saturation coefficient decreases following not only the increasing
temperature, but also the fraction of trachyte added.
Hydric parameters (Table 4) indicate a decrease in the open porosity and an increase in (real
and apparent) density as temperature and trachyte content raise. This suggests the formation
of a more compact material, due to the combined effect of increasing temperature and
presence of trachyte fragments acting as a flux (Table 3 and Fig. 6a).
Moreover, during sintering pores change their morphology, becoming larger and reducing
interconnection (Benavente et al., 2006; Salem & Aghahosseini, 2012), as confirmed, in
addition to the textural observations and the Ax values, also from the Nitrogen adsorption
Type IV isotherms with hysteresis (according to the IUPAC classification), which are typical
of materials with meso-pores. Comparing the different isotherms (Fig. 7), all bricks tend to
have larger pores as firing temperature and trachyte content increase. Consequently, surface
area (Sa) (Table 4), gradually decreases. This evidence highlights once more the attitude of
trachyte to promote the formation of intergranular melt, and trigger mineralogical and pore
system evolution. This is an important point in terms of optimization of the industrial
production, since the addition of trachyte waste allows obtaining a well-fired brick at slightly
lower temperatures, which may save energy and therefore production costs.
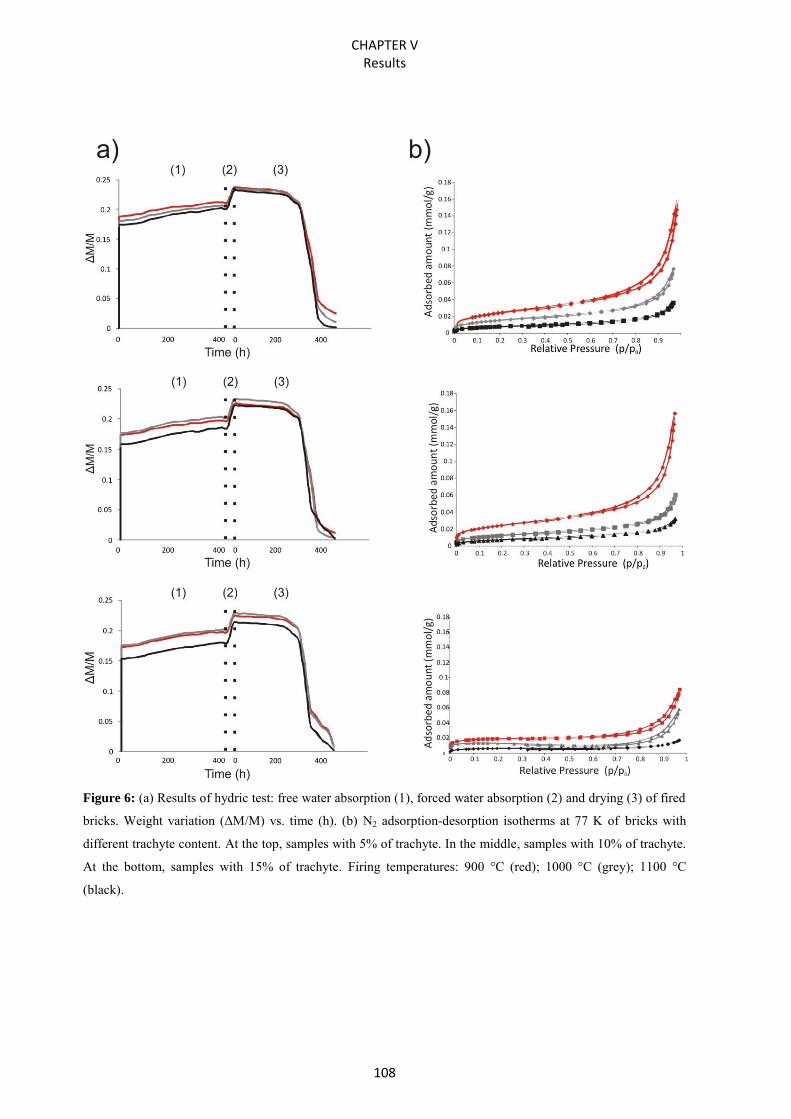
CHAPTER V Results
108
Figure 6: (a) Results of hydric test: free water absorption (1), forced water absorption (2) and drying (3) of fired
bricks. Weight variation (ΔM/M) vs. time (h). (b) N2 adsorption-desorption isotherms at 77 K of bricks with
different trachyte content. At the top, samples with 5% of trachyte. In the middle, samples with 10% of trachyte.
At the bottom, samples with 15% of trachyte. Firing temperatures: 900 °C (red); 1000 °C (grey); 1100 °C
(black).
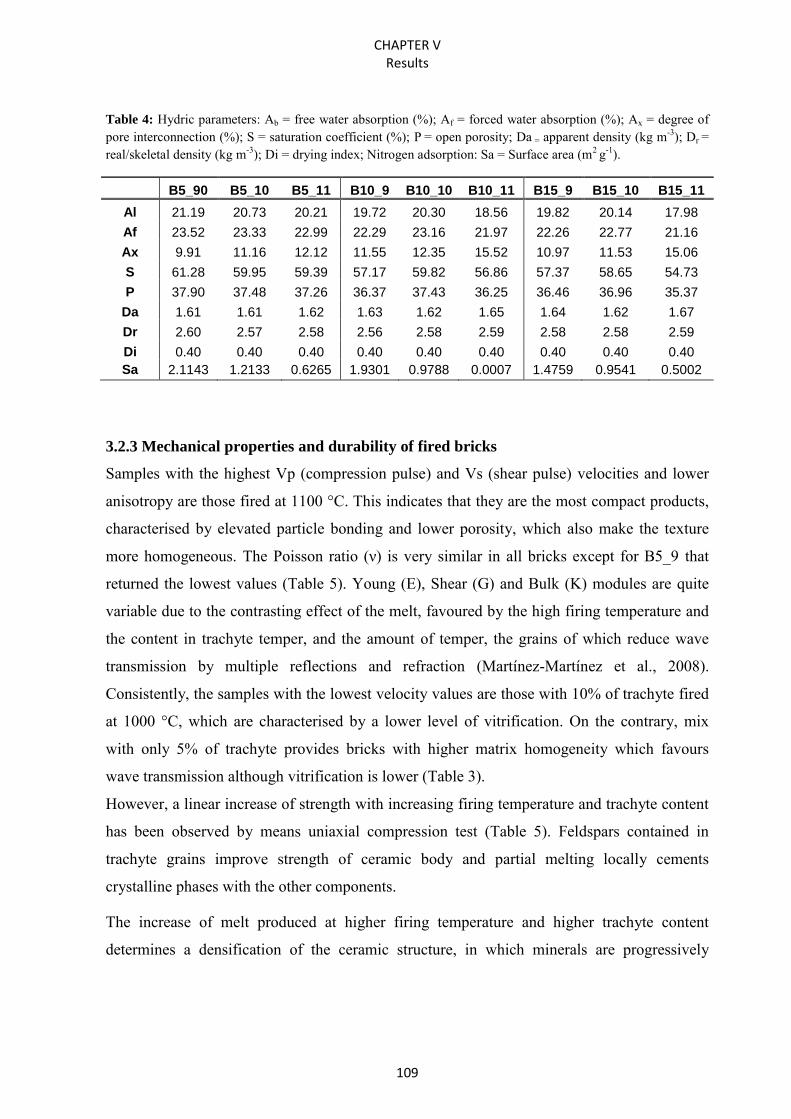
CHAPTER V Results
109
Table 4: Hydric parameters: Ab = free water absorption (%); Af = forced water absorption (%); Ax = degree of pore interconnection (%); S = saturation coefficient (%); P = open porosity; Da = apparent density (kg m-3); Dr = real/skeletal density (kg m-3); Di = drying index; Nitrogen adsorption: Sa = Surface area (m2 g-1).
3.2.3 Mechanical properties and durability of fired bricks
Samples with the highest Vp (compression pulse) and Vs (shear pulse) velocities and lower
anisotropy are those fired at 1100 °C. This indicates that they are the most compact products,
characterised by elevated particle bonding and lower porosity, which also make the texture
more homogeneous. The Poisson ratio (ν) is very similar in all bricks except for B5_9 that
returned the lowest values (Table 5). Young (E), Shear (G) and Bulk (K) modules are quite
variable due to the contrasting effect of the melt, favoured by the high firing temperature and
the content in trachyte temper, and the amount of temper, the grains of which reduce wave
transmission by multiple reflections and refraction (Martínez-Martínez et al., 2008).
Consistently, the samples with the lowest velocity values are those with 10% of trachyte fired
at 1000 °C, which are characterised by a lower level of vitrification. On the contrary, mix
with only 5% of trachyte provides bricks with higher matrix homogeneity which favours
wave transmission although vitrification is lower (Table 3).
However, a linear increase of strength with increasing firing temperature and trachyte content
has been observed by means uniaxial compression test (Table 5). Feldspars contained in
trachyte grains improve strength of ceramic body and partial melting locally cements
crystalline phases with the other components.
The increase of melt produced at higher firing temperature and higher trachyte content
determines a densification of the ceramic structure, in which minerals are progressively
B5_90 B5_10 B5_11 B10_9 B10_10 B10_11 B15_9 B15_10 B15_11
Al 21.19 20.73 20.21 19.72 20.30 18.56 19.82 20.14 17.98
Af 23.52 23.33 22.99 22.29 23.16 21.97 22.26 22.77 21.16
Ax 9.91 11.16 12.12 11.55 12.35 15.52 10.97 11.53 15.06
S 61.28 59.95 59.39 57.17 59.82 56.86 57.37 58.65 54.73
P 37.90 37.48 37.26 36.37 37.43 36.25 36.46 36.96 35.37
Da 1.61 1.61 1.62 1.63 1.62 1.65 1.64 1.62 1.67
Dr 2.60 2.57 2.58 2.56 2.58 2.59 2.58 2.58 2.59
Di 0.40 0.40 0.40 0.40 0.40 0.40 0.40 0.40 0.40
Sa 2.1143 1.2133 0.6265 1.9301 0.9788 0.0007 1.4759 0.9541 0.5002
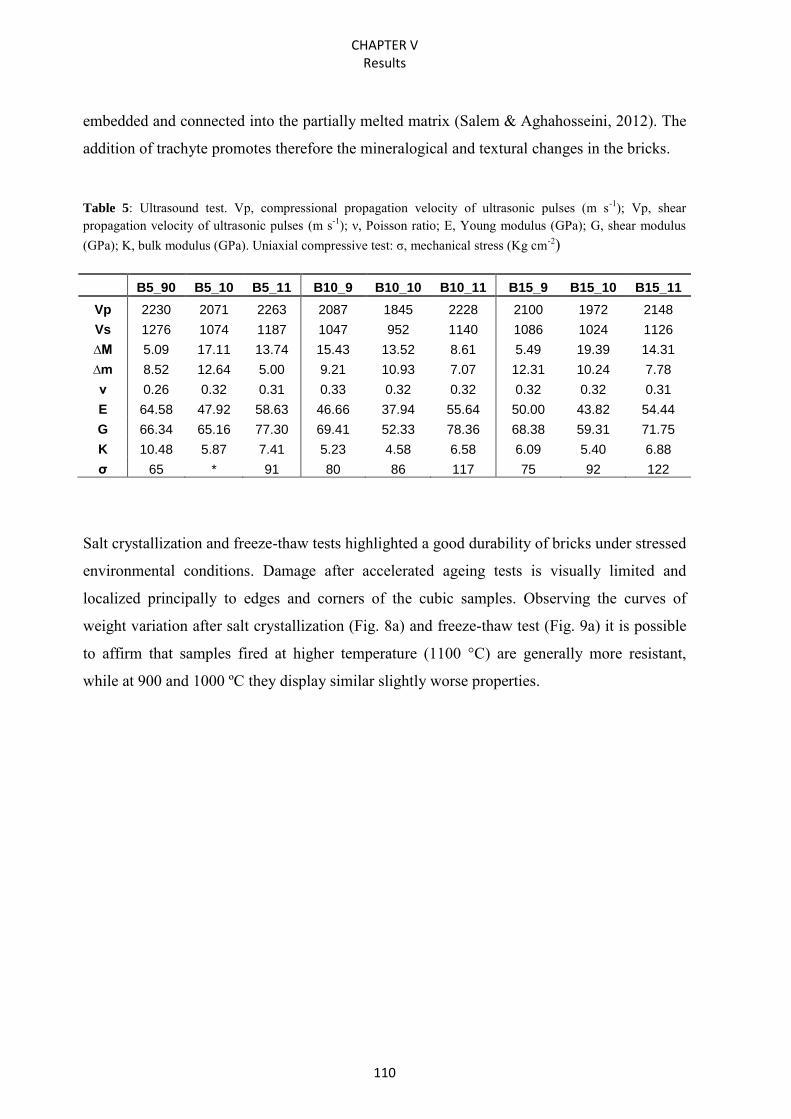
CHAPTER V Results
110
embedded and connected into the partially melted matrix (Salem & Aghahosseini, 2012). The
addition of trachyte promotes therefore the mineralogical and textural changes in the bricks.
Table 5: Ultrasound test. Vp, compressional propagation velocity of ultrasonic pulses (m s-1); Vp, shear propagation velocity of ultrasonic pulses (m s-1); ν, Poisson ratio; E, Young modulus (GPa); G, shear modulus (GPa); K, bulk modulus (GPa). Uniaxial compressive test: σ, mechanical stress (Kg cm-2)
Salt crystallization and freeze-thaw tests highlighted a good durability of bricks under stressed
environmental conditions. Damage after accelerated ageing tests is visually limited and
localized principally to edges and corners of the cubic samples. Observing the curves of
weight variation after salt crystallization (Fig. 8a) and freeze-thaw test (Fig. 9a) it is possible
to affirm that samples fired at higher temperature (1100 °C) are generally more resistant,
while at 900 and 1000 ºC they display similar slightly worse properties.
B5_90 B5_10 B5_11 B10_9 B10_10 B10_11 B15_9 B15_10 B15_11
Vp 2230 2071 2263 2087 1845 2228 2100 1972 2148
Vs 1276 1074 1187 1047 952 1140 1086 1024 1126
∆M 5.09 17.11 13.74 15.43 13.52 8.61 5.49 19.39 14.31
∆m 8.52 12.64 5.00 9.21 10.93 7.07 12.31 10.24 7.78
ν 0.26 0.32 0.31 0.33 0.32 0.32 0.32 0.32 0.31
E 64.58 47.92 58.63 46.66 37.94 55.64 50.00 43.82 54.44
G 66.34 65.16 77.30 69.41 52.33 78.36 68.38 59.31 71.75
K 10.48 5.87 7.41 5.23 4.58 6.58 6.09 5.40 6.88
σ 65 * 91 80 86 117 75 92 122
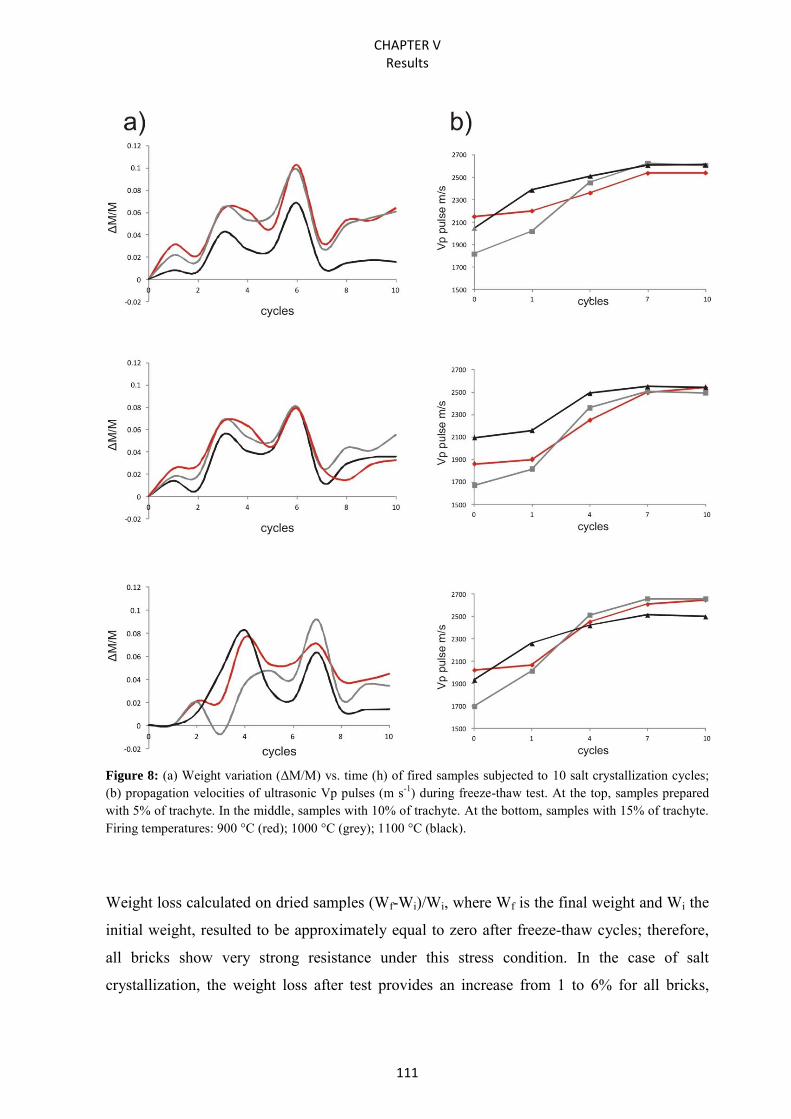
CHAPTER V Results
111
Figure 8: (a) Weight variation (ΔM/M) vs. time (h) of fired samples subjected to 10 salt crystallization cycles; (b) propagation velocities of ultrasonic Vp pulses (m s-1) during freeze-thaw test. At the top, samples prepared with 5% of trachyte. In the middle, samples with 10% of trachyte. At the bottom, samples with 15% of trachyte. Firing temperatures: 900 °C (red); 1000 °C (grey); 1100 °C (black).
Weight loss calculated on dried samples (Wf-Wi)/Wi, where Wf is the final weight and Wi the
initial weight, resulted to be approximately equal to zero after freeze-thaw cycles; therefore,
all bricks show very strong resistance under this stress condition. In the case of salt
crystallization, the weight loss after test provides an increase from 1 to 6% for all bricks,
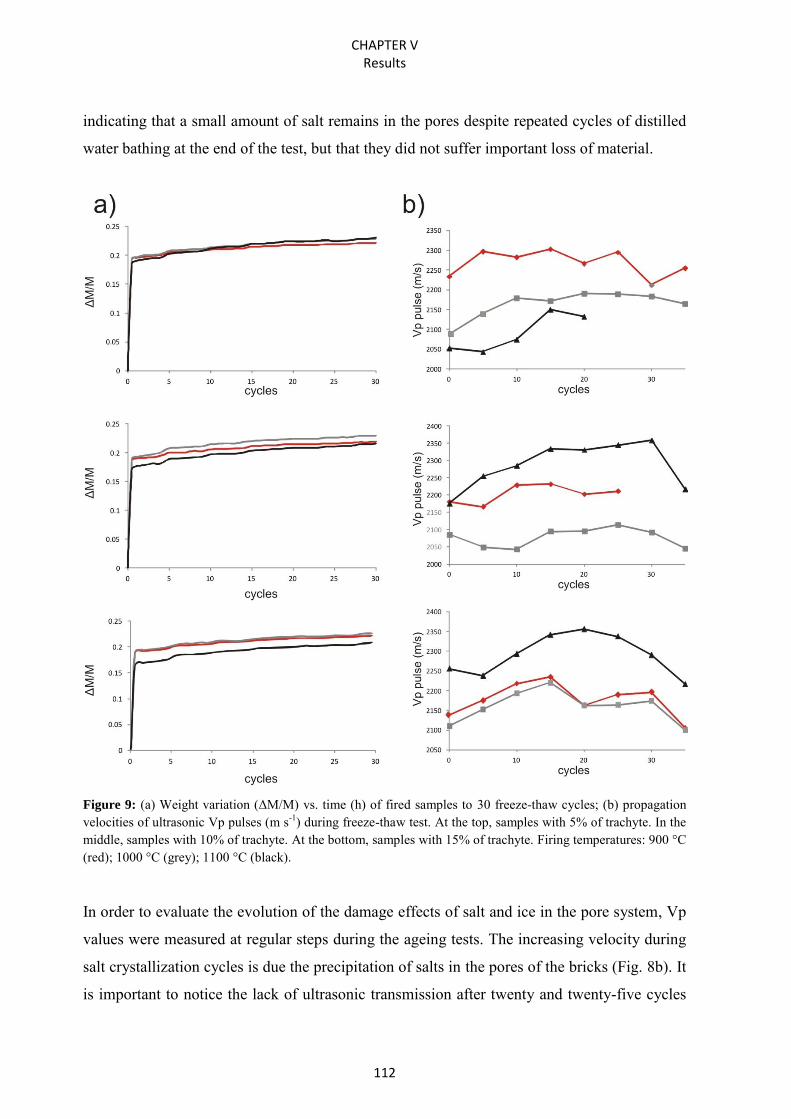
CHAPTER V Results
112
indicating that a small amount of salt remains in the pores despite repeated cycles of distilled
water bathing at the end of the test, but that they did not suffer important loss of material.
Figure 9: (a) Weight variation (ΔM/M) vs. time (h) of fired samples to 30 freeze-thaw cycles; (b) propagation velocities of ultrasonic Vp pulses (m s-1) during freeze-thaw test. At the top, samples with 5% of trachyte. In the middle, samples with 10% of trachyte. At the bottom, samples with 15% of trachyte. Firing temperatures: 900 °C (red); 1000 °C (grey); 1100 °C (black). In order to evaluate the evolution of the damage effects of salt and ice in the pore system, Vp
values were measured at regular steps during the ageing tests. The increasing velocity during
salt crystallization cycles is due the precipitation of salts in the pores of the bricks (Fig. 8b). It
is important to notice the lack of ultrasonic transmission after twenty and twenty-five cycles
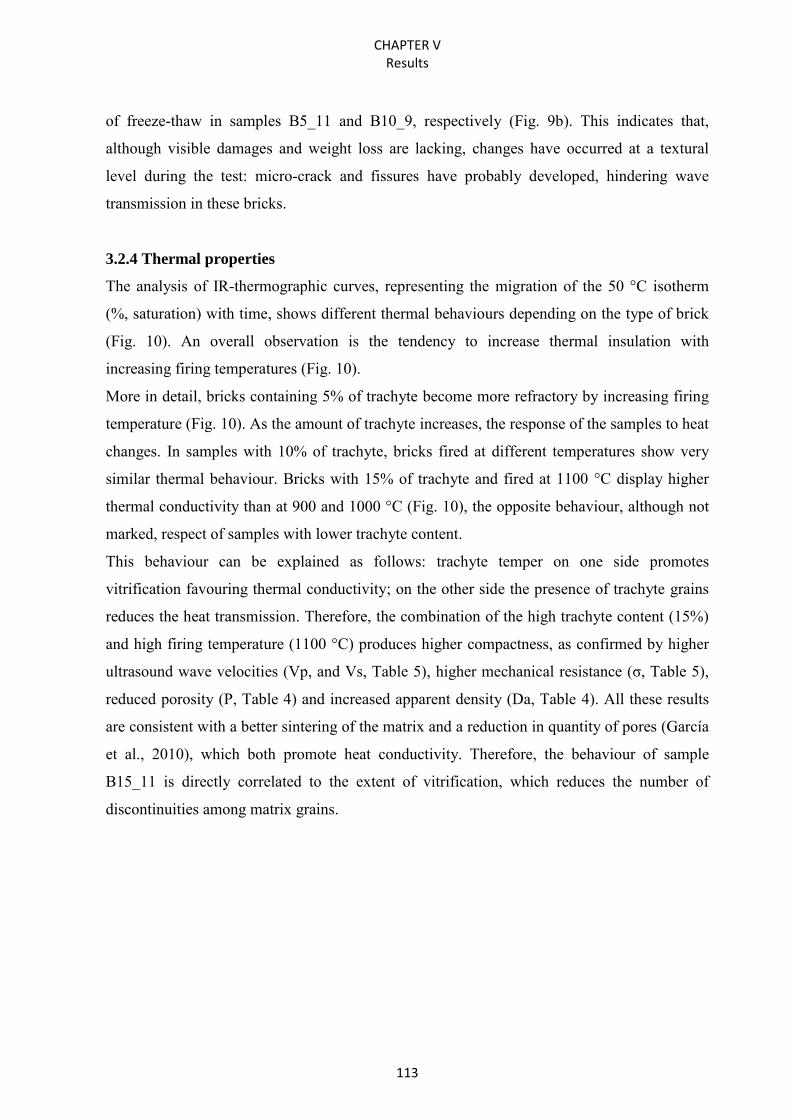
CHAPTER V Results
113
of freeze-thaw in samples B5_11 and B10_9, respectively (Fig. 9b). This indicates that,
although visible damages and weight loss are lacking, changes have occurred at a textural
level during the test: micro-crack and fissures have probably developed, hindering wave
transmission in these bricks.
3.2.4 Thermal properties
The analysis of IR-thermographic curves, representing the migration of the 50 °C isotherm
(%, saturation) with time, shows different thermal behaviours depending on the type of brick
(Fig. 10). An overall observation is the tendency to increase thermal insulation with
increasing firing temperatures (Fig. 10).
More in detail, bricks containing 5% of trachyte become more refractory by increasing firing
temperature (Fig. 10). As the amount of trachyte increases, the response of the samples to heat
changes. In samples with 10% of trachyte, bricks fired at different temperatures show very
similar thermal behaviour. Bricks with 15% of trachyte and fired at 1100 °C display higher
thermal conductivity than at 900 and 1000 °C (Fig. 10), the opposite behaviour, although not
marked, respect of samples with lower trachyte content.
This behaviour can be explained as follows: trachyte temper on one side promotes
vitrification favouring thermal conductivity; on the other side the presence of trachyte grains
reduces the heat transmission. Therefore, the combination of the high trachyte content (15%)
and high firing temperature (1100 °C) produces higher compactness, as confirmed by higher
ultrasound wave velocities (Vp, and Vs, Table 5), higher mechanical resistance (σ, Table 5),
reduced porosity (P, Table 4) and increased apparent density (Da, Table 4). All these results
are consistent with a better sintering of the matrix and a reduction in quantity of pores (García
et al., 2010), which both promote heat conductivity. Therefore, the behaviour of sample
B15_11 is directly correlated to the extent of vitrification, which reduces the number of
discontinuities among matrix grains.
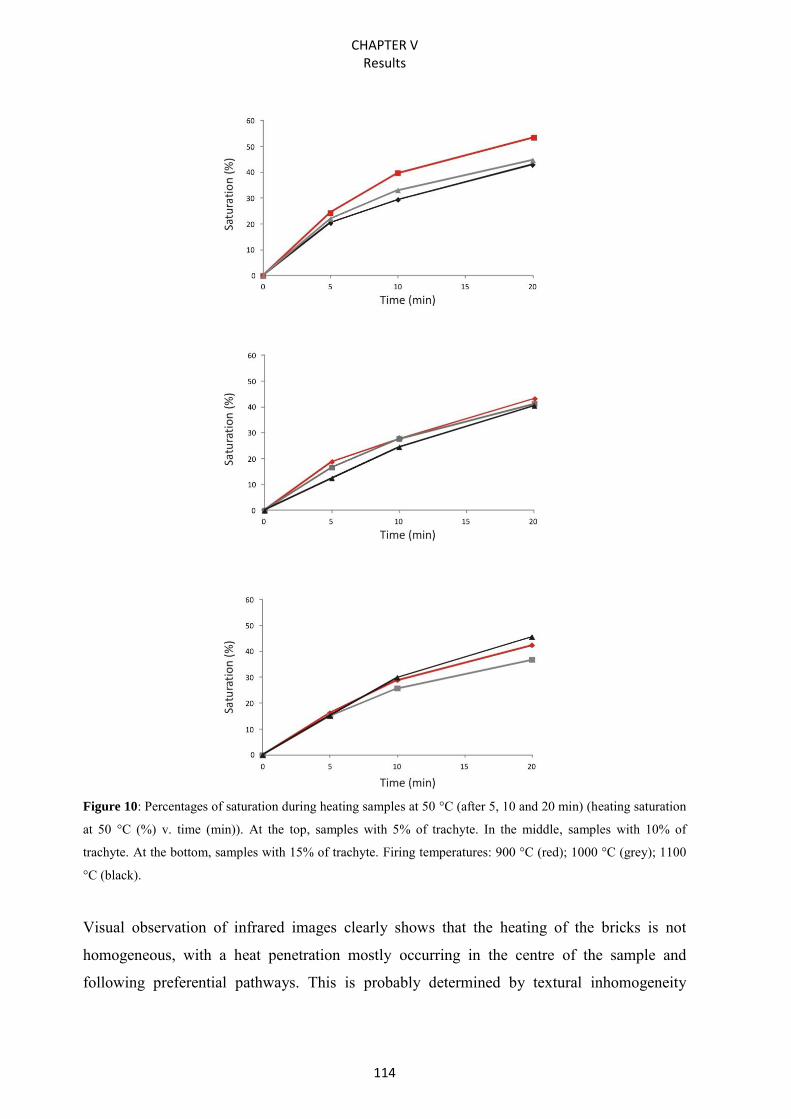
CHAPTER V Results
114
Figure 10: Percentages of saturation during heating samples at 50 °C (after 5, 10 and 20 min) (heating saturation
at 50 °C (%) v. time (min)). At the top, samples with 5% of trachyte. In the middle, samples with 10% of
trachyte. At the bottom, samples with 15% of trachyte. Firing temperatures: 900 °C (red); 1000 °C (grey); 1100
°C (black).
Visual observation of infrared images clearly shows that the heating of the bricks is not
homogeneous, with a heat penetration mostly occurring in the centre of the sample and
following preferential pathways. This is probably determined by textural inhomogeneity
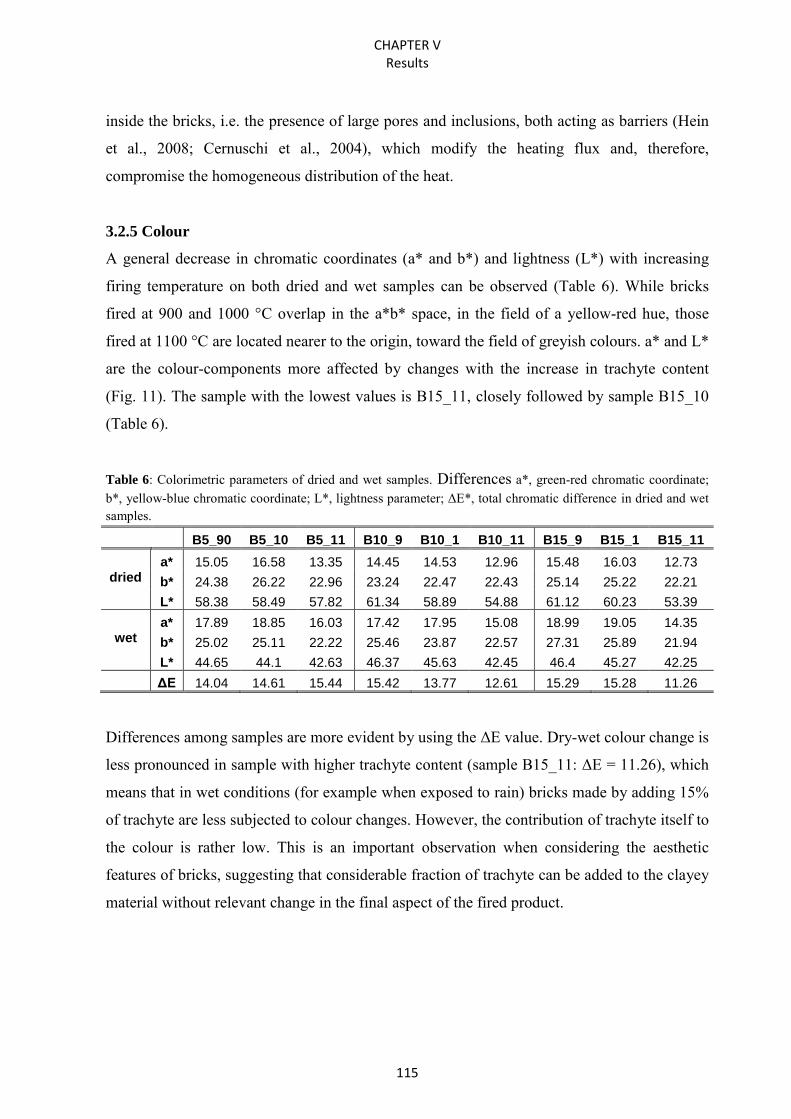
CHAPTER V Results
115
inside the bricks, i.e. the presence of large pores and inclusions, both acting as barriers (Hein
et al., 2008; Cernuschi et al., 2004), which modify the heating flux and, therefore,
compromise the homogeneous distribution of the heat.
3.2.5 Colour
A general decrease in chromatic coordinates (a* and b*) and lightness (L*) with increasing
firing temperature on both dried and wet samples can be observed (Table 6). While bricks
fired at 900 and 1000 °C overlap in the a*b* space, in the field of a yellow-red hue, those
fired at 1100 °C are located nearer to the origin, toward the field of greyish colours. a* and L*
are the colour-components more affected by changes with the increase in trachyte content
(Fig. 11). The sample with the lowest values is B15_11, closely followed by sample B15_10
(Table 6).
Table 6: Colorimetric parameters of dried and wet samples. Differences a*, green-red chromatic coordinate; b*, yellow-blue chromatic coordinate; L*, lightness parameter; ΔE*, total chromatic difference in dried and wet samples.
B5_90 B5_10 B5_11 B10_9 B10_1 B10_11 B15_9 B15_1 B15_11
a* 15.05 16.58 13.35 14.45 14.53 12.96 15.48 16.03 12.73 dried b* 24.38 26.22 22.96 23.24 22.47 22.43 25.14 25.22 22.21
L* 58.38 58.49 57.82 61.34 58.89 54.88 61.12 60.23 53.39
a* 17.89 18.85 16.03 17.42 17.95 15.08 18.99 19.05 14.35 wet b* 25.02 25.11 22.22 25.46 23.87 22.57 27.31 25.89 21.94
L* 44.65 44.1 42.63 46.37 45.63 42.45 46.4 45.27 42.25
ΔE 14.04 14.61 15.44 15.42 13.77 12.61 15.29 15.28 11.26
Differences among samples are more evident by using the ΔE value. Dry-wet colour change is
less pronounced in sample with higher trachyte content (sample B15_11: ΔE = 11.26), which
means that in wet conditions (for example when exposed to rain) bricks made by adding 15%
of trachyte are less subjected to colour changes. However, the contribution of trachyte itself to
the colour is rather low. This is an important observation when considering the aesthetic
features of bricks, suggesting that considerable fraction of trachyte can be added to the clayey
material without relevant change in the final aspect of the fired product.
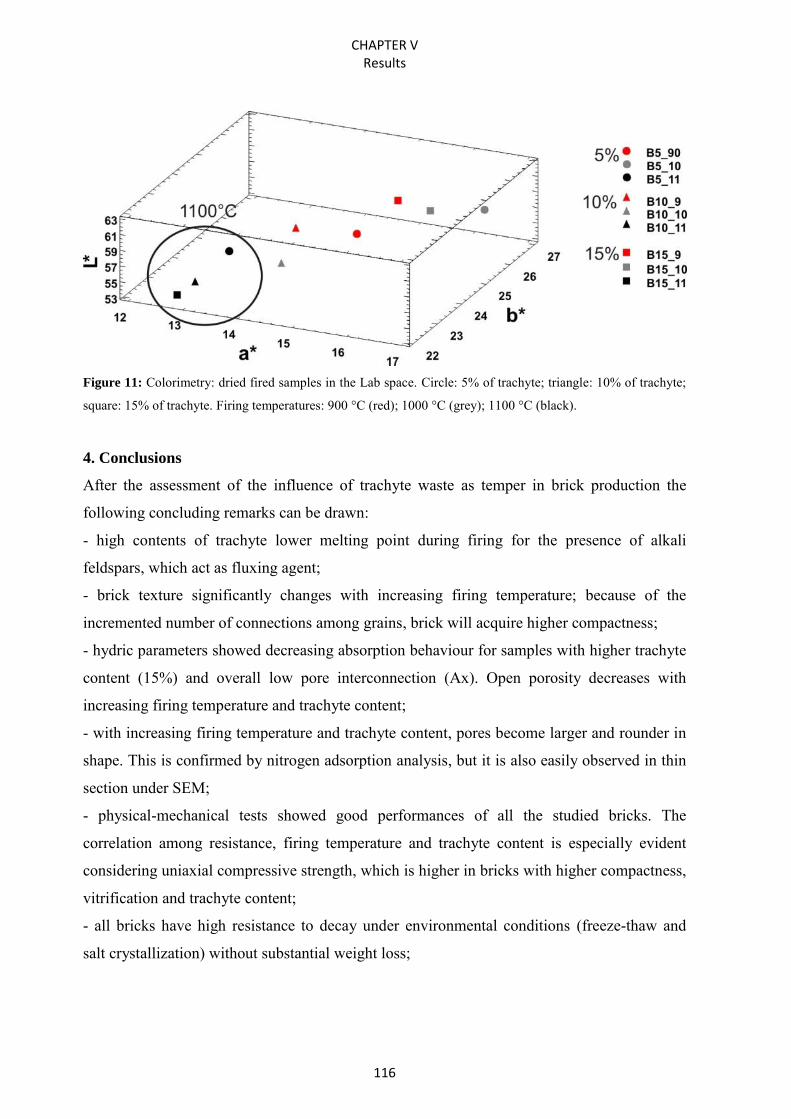
CHAPTER V Results
116
Figure 11: Colorimetry: dried fired samples in the Lab space. Circle: 5% of trachyte; triangle: 10% of trachyte;
square: 15% of trachyte. Firing temperatures: 900 °C (red); 1000 °C (grey); 1100 °C (black).
4. Conclusions
After the assessment of the influence of trachyte waste as temper in brick production the
following concluding remarks can be drawn:
- high contents of trachyte lower melting point during firing for the presence of alkali
feldspars, which act as fluxing agent;
- brick texture significantly changes with increasing firing temperature; because of the
incremented number of connections among grains, brick will acquire higher compactness;
- hydric parameters showed decreasing absorption behaviour for samples with higher trachyte
content (15%) and overall low pore interconnection (Ax). Open porosity decreases with
increasing firing temperature and trachyte content;
- with increasing firing temperature and trachyte content, pores become larger and rounder in
shape. This is confirmed by nitrogen adsorption analysis, but it is also easily observed in thin
section under SEM;
- physical-mechanical tests showed good performances of all the studied bricks. The
correlation among resistance, firing temperature and trachyte content is especially evident
considering uniaxial compressive strength, which is higher in bricks with higher compactness,
vitrification and trachyte content;
- all bricks have high resistance to decay under environmental conditions (freeze-thaw and
salt crystallization) without substantial weight loss;
CHAPTER V Results
117
- infrared images evidenced that as trachyte is added to the mix, heat transmission is reduced;
only when high sintering levels are reached (brick with 15% trachyte fired at 1100 °C), heat
transmission increases;
- colorimetric analysis showed changes in the aesthetic appearance at different firing
temperatures, with darker hues in bricks fired at higher temperature. Trachyte content seems
not to affect brick colour significantly, and has little influence on their appearance when dry
and wet. Therefore, trachyte addition in the range of 5 and 15% can be used without problems
in terms of aesthetic quality.
The good response to stress conditions and the lack of significant differences among the
studied samples prove that trachyte can well be considered as an alternative material to
replace expensive fluxing agent materials. The use of trachyte could provide valuable bricks
already at a firing temperature of 900 °C with a concentration of 10%. This is an important
issue to improve brick production, reusing accumulated waste, avoiding the recovery of raw
materials and reducing the firing temperature, therefore reducing production costs and
consumption of natural resources.
The results of the present study may have important consequence as industrial application,
contribute to understand the possibilities of recycling trachyte waste obtaining new products
satisfying the necessity of saving energy, reducing production costs and reducing the
exploitation of natural resources.
ACKOWLEDGMENTS
This study was financially supported by Research Group RNM179 of the Junta de Andalucía
and by the Research Project MAT2012-34473 and by the overseas mobility grant
“Fondazione Ing. Aldo Gini”. The research benefitted by funding from INPS - Gestione Ex
Inpdap (Direzione Regionale Veneto), which provided the PhD “Doctor J” Grant over the
period 2012-2015.
CHAPTER V Results
118
References
Asiedu Y., Gu P., 1998. Product life cycle cost analysis: state of the art review, International
Journal of Production Research, 36, 883–908.
Barbieri L., Andreola F., Lancellotti I., Taurino R., 2013. Management of agricultural
biomass wastes: Preliminary study on characterization and valorisation in clay matrix
bricks, Waste Management, 33, 2307–2315.
Benavente D., Linares-Fernández L., Cultrone G., Sebastián E., 2006. Influence of
microstructure on the resistance to salt crystallization damage in bricks, Materials and
Structures, 39, 105–113.
Bilgin N., Yeprem H.A., Arslan S., Bilgin A., Gunay E. , Marsoglu M., 2012. Use of waste
marble powder in brick industry, Construction and Building Materials, 29, 449–457.
Bories C., Borredon M.-E, Vedrenne E., Vilarem G., 2014. Development of eco-friendly
porous fired clay bricks using pore-forming agents: A review, Journal of Environmental
Management, 143, 186–196.
Bozkurt V., Kara A., Uçbas Y., Kayaci K. and Çiftçi M., 2006. Possible Use of Trachyte as a
Flux in Floor Tile Production, Industrial Ceramics, 26, 87–94.
Burnett J., 2007. City buildings - Eco-labels and shades of green!, Landscape and Urban
Planning, 83, 29–38.
Cernuschi F., Ahmaniemi S., Vuoristo P., Mäntylä T., 2004. Modelling of thermal
conductivity of porous materials: application to thick thermal barrier coatings, Journal
of the European Ceramic Society, 24, 2657–2667.
Chen, G., Wang, J., 1998. The preparation of marine geological certified reference materials -
polymetallic nodule GSPN-1 and marine sediment GSMS-1 from the Central Pacific
Ocean, Geostandards and Geoanalytical Research, 22, 119-125.
Chen Y., Zhang Y., Chen T., Zhao Y., Bao S., 2011. Preparation of eco-friendly construction
bricks from hematite tailings, Construction and Building Materials, 25, 2107–2111.
Chiang K.Y., Chou P.H., Hua C.R., Chien K.L., Cheeseman C., 2009. Lightweight bricks
manufactured from water treatment sludge and rice husks, Journal of Hazardous
Materials, 171, 76–82.
Cultrone G., de la Torre M.J., Sebastian E. and Cazalla O., 2003. Evaluación de la durabilidad
de ladrillos mediante técnicas destructivas (TD) y no-destructivas (TND), Materiales de
Construcción, 53, 41–59.
CHAPTER V Results
119
Cultrone G., Rodríguez Navarro C., Sebastián E. Cazalla O., de la Torre, M.J. Carbonate and
silicate phase reactions during ceramic firing, European Journal of Mineralogy, 13,
2001, 621–634.
Cultrone G., Sebastián E., Elert K., de la Torre M.J., Cazalla O., Rodriguez-Navarro C., 2004.
Influence of mineralogy and firing temperature in the porosity of bricks, Journal of the
European Ceramic Society, 34, 547–564.
Cultrone G., Sebastián E., 2009. Fly ash addition in clayey materials to improve the quality of
solid bricks, Construction and Building Materials, 23, 1178–1184.
Cultrone G., Rodriguez-Navarro C., Sebastián E.M., Cazalla O., de la Torre M.J., 2001.
Carbonate and silicate phase reactions during ceramic firing, European Journal
Mineralogy, 13, 621–634.
Cusidó J. A., Cremades L.V., 2012. Environmental effects of using caly bricks produces with
sewage sludge: Leachability and toxicity studies, Waste Management, 31, 1372–1380.
Deer W.A., Howie R.A., Zussman J., 2001. Rock-Forming Minerals, Volume 4A: Framework
Silicates – Feldspars, Hardcover.
Demir I., Baspınara M. S., Orhan M., 2005. Utilization of kraft pulp production residues in
clay brick production, Building and Environment, 40, 1533–1537.
Demir I., 2006. An investigation on the production of construction brick with processed waste
tea, Building and Environment, 41, 1274–1278.
Demir I., 2008. Effect of organic residues addition on the technological properties of clay
bricks, Waste Management, 28, 622–627.
Dondi M., Marsigli M., Fabbri B., 1997a. Recycling of Industrial and Urban Wastes in Brick
Production – A review, Tile and Brick International, 13, 218–225.
Dondi M., Marsigli M., Fabbri B., 1997b. Recycling of Industrial and Urban Wastes in Brick
Production – A review (Part 2), Tile and Brick International, 13, 302–309.
Duminuco P., Messiga B., Riccardi M.P., 1998. Firing process of natural clays. Some
microtextures and related phase compositions, Thermochimica Acta, 321, 185–190.
Eliche-Quesada D., Martínez-Martínez S., Pérez-Villarejo L., Iglesias-Godino F.J., Martínez-
García C., Corpas-Iglesias F.A., 2012a. Valorization of biodiesel production residues in
making porous clay brick, Fuel Processing Technology, 103, 166–173.
CHAPTER V Results
120
Eliche-Quesada D., Corpas-Iglesias F.A., Pérez-Villarejo L., Iglesias-Godino F.J., 2012b.
Recycling of sawdust, spent earth from oil filtration, compost and marble residues for
brick manufacturing. Construction and Building Materials, 34, 275–284.
Ercikdi B., Cihangir F., Kesimal A., Deveci H., Alp I., 2009. Utilization of industrial waste
products as pozzolanic material in cemented paste backfill of high sulphide mill tailings.
Journal of Hazardous Materials, 168, 848–856.
Haldar S. K., 2013. Mineral Exploration: Principles and Applications. Elsevier Science
Publishing Co Inc, United States.
Hein A., Müller N.S., Day. P.M., Kilikoglou V., 2008. Thermal conductivity of
archaeological ceramics: The effect of inclusions, porosity and firing temperature.
Thermochimica Acta, 480, 35–42.
Fernández-Pereira C., de la Casa J.A., Gómez-Barea A., Arroyo F., Leiva C., Luna Y., 2011.
Application of biomass gasification fly ash for brick manufacturing. Fuel, 90, 220–232.
García Ten J., Orts M.J., Sabutit A., Silva G., 2010. Thermal conductivity of traditional
ceramics. Part I: Influence of bulk density and firing temperature. Ceramics
International, 36, 1951–1959.
Kara A., Kayaci K., KüçüKer A.S., Bozkurt V., Uçbas Y., Özdamar S., 2009. Use of rhyolite
as flux in porcelain tile production. Industrial Ceramics, 29, 71–81.
Koroneos C., Dompros A., 2007. Environmental assessment of brick production in Greece.
Building and Environment, 42, 2114–2123.
Manca P.P., Orrù G., Desogus P., 2015. Recycling of sludge from ornamental stone
processing as resource in civil constructions. International Journal of Mining,
Reclamation and Environment, 29, 141–155.
Maritan L., 2001. Corse Iron age pottery from Este (Padova), Italy. Proceedings del 3rd
International Congress on Science and Technology for the Safeguard of Cultural
Heritage in the Mediterranean Basin, Alcalà de Henares, Spagna 9-14 luglio 2001, Eds.
J. Alpuente, I. de Bustamante, P. López, J. Sanz, Servicio de Publicaciones de la
Universidad de Alcalá, 1–6.
Maritan L., Mazzoli C., Rigaldo P., Pesavento Mattioli S., Mazzocchin S., 2006. Le olle
romane dello scavo di via Neroniana (Montegrotto Terme – Padova): indagini
preliminari. Proceedings del Convegno Nazionale AIAr, 16-18 febbraio 2005, Ed.
Patron, 253–260.
CHAPTER V Results
121
Maritan L., Mazzoli C., Tenconi M., Leonardi G., Boaro S., 2009. Provenance and production
technology of Early Bronze Age pottery from a lake dwelling settlement at Arquà
Petrarca (Padova, NE Italy). In: Interpreting Silent Artefacts: Petrographic Approaches
to Archaeological Ceramics (Ed. P.S. Quinn), Archaeopress, Oxford, 81–99.
Maritan L., Nodari L., Mazzoli C., Milano A., Russo U., 2006. Influence of firing conditions
in ceramic products: Experimental study on clay rich in organic matter. Applied Clay
Science, 31, 1–15.
Martínez-Martínez J., Benavente D., Ordóñez S., García-del-Cura M.A., 2008. Multivariate
statistical techniques for evaluating the effects of brecciated rock fabric on ultrasonic
wave propagation. International Journal of Rock Mechanics and Mining Sciences, 45,
609–620.
Muñoz Velasco P., Morales Ortíz M.P., Mendívil Giró M.A., Muñoz Velasco L., 2014a. Fired
clay bricks manufactured by adding wastes as sustainable construction material – A
review. Construction and Building Materials, 63, 97–107.
Muñoz Velasco P., Morales M.P., Mendívil M.A., Juárez M.C., Muñoz L., 2014b. Using of
waste pomace from winery industry to improve thermal insulation of fired clay bricks.
Eco-friendly way of building construction. Construction and Building Materials, 7,
181–187.
Neves Monteiro S., Fontes Vieira C. M., 2014. On the production of fired clay bricks from
waste materials: A critical update. Construction and Building Materials, 68, 599–610.
NORMAL 29/88, 1988. Misura dell’indice di asciugamento (drying index), CNR-ICR, Rome.
Ortiz O., Castells F., Sonnemann G., 2009. Sustainability in the construction industry: A
review of recent developments based on LCA. Construction and Building Materials, 23,
28–39.
Pérez-Villarejo L., Eliche-Quesada D., Iglesias-Godino Fco. J., Martínez-García C., Corpas-
Iglesias Fco. A., 2012. Recycling of ash from biomass incinerator in clay matrix to
produce ceramic bricks. Journal of Environmental Management, 95, 349–354.
Peris Mora E., 2007. Life cycle, sustainability and the transcendent quality of building
materials. Building and Environment, 42, 1329–1334.
Rajput D., Bhagade S.S., Raut S.P., Ralegaonkar R.V., Mandavgane S. A., 2012. Reuse of
cotton and recycle paper mill waste as building material. Construction and Building
Materials, 34, 470–475.
CHAPTER V Results
122
Raut S.P., Ralegaonkar R.V, Mandavgane S.A., 2011. Development of sustainable
construction material using industrial and agricultural solid waste: A review of waste-
create bricks. Construction and Building Materials, 25, 4037–4042.
Riccardi M.P., Messiga B., Duminuco P., 1999. An approach to the dynamics of clay firing.
Applied Clay Science, 15, 393–409.
RILEM 1980, Recommended test to measure the deterioration of stone and to assess the
differences of treatment methods. Matériaux et Constructions, 13, 175–253.
Salem A. and Aghahosseini S., 2012. Determination of fluxing agents mixing ratio for
enhancing thermal shock resistance of ceramic Raschig ring via systematic approach.
Thermodinamica Acta, 545, 57–66.
Sassi R., Mazzoli C., Spiess R., Cester T., 2004. Towards a better understanding of the
fibrolite problem: the effect of reaction overstepping and surface energy anisotropy.
Journal of Petrology, 45, 1467–1479.
Scott V.D., Love G., 1983. Quantitative Electron Probe Microanalysis. John Wiley and Sons,
New York.
Singer S.S., Singer F., 1963. Industrial ceramics. Chapman and Hall, London.
Sutcu M., Akkurt S., 2009. The use of recycled paper processing residues in making porous
brick with reduced thermal conductivity. Ceramics International, 35, 2625–2631.
Sutcu M., del Coz Diaz J. J., Alvarez Rabanal F.P., Gencel O., Akkurt S., 2014. Thermal
performance optimization of hollow clay bricks made up of paper waste. Energy and
Buildings, 75, 96–108.
Sutcu M., Alptekin H., Erdogmus E., Er Y., Gencel O., 2015. Characteristics of fired clay
bricks with waste marble powder addition as building materials. Construction and
Building Materials, 82, 1–8.
Tenconi M., Maritan L., Leonardi G., Prosdocimi B., Mazzoli C., 2013. Ceramic production
and distribution in North-East Italy: Study of a possible trade network between Friuli
Venezia Giulia and Veneto regions during the final Bronze Age and early Iron Age
through analysis of peculiar “flared rim and flat lip” pottery. Applied Clay Science, 82,
121–134.
Topçu İ. B., Işidağ B., 2007. Manufacture of high heat conductivity resistant clay bricks
containing perlite. Building and Environment, 42, 3540–3546.
CHAPTER V Results
123
Uçbas Y., Bozkurt V., Bilir K., 2008. Recovery of sanidine from trachyte. Proceedings of the
11th International Mineral Processing Symposium, Belek-Antalya, Turkey.
UNI EN 1925, 2000. Natural stone test methods - Determination of water absorption
coefficient by capillarity. CNR-ICR, Rome.
UNI EN 13755, 2008. Natural stone test methods - Determination of water absorption at
atmospheric pressure. CNR-ICR, Rome.
UNI EN 12370, 2001. Natural stone test methods - Determination of resistance to salt
crystallisation. CNR-ICR, Rome.
UNI EN 12371, 2010. Natural stone test methods - Determination of frost resistance. CNR-
ICR, Rome.
Yagüe A., Valls S., Vázquez E., Kuchinow V., 2002. Utilización de Iodo seco de depuradora
de aguas residuales como adición en adoquines de hormigón prefabricado. Materiales de
Construcción, 52, 267, 31–41.
Yoshiki B., Matsumoto K., 1951. High-Temperature Modification of Barium Feldspar.
Journal of the American Ceramic Society, 34, 283–286.
Weng C.-H., Lin D.-F., Chiang P.-C., 2003. Utilization of sludge as brick materials. Advances
in Environmental Research, 7, 679–685.
Whitney D. L., Evans B. W., 2010. Abbreviations for names of rock-forming minerals.
American Mineralogist, 95, 185–187.
Zhang L., Ahmari S., Zhang J., 2011. Synthesis and characterization of fly ash modified mine
tailings-based geopolymers. Construction and Building Materials, 25, 3773–3781.
Zhang L., 2013. Production of bricks from waste materials – A review. Construction and
Building Materials, 47, 643–655.
CHAPTER VI
Results
Use of industrial ceramic sludge in the brick production:
effect on aesthetic quality and physical properties

CHAPTER VI Results
127
Use of industrial ceramic sludge in the brick production:
effect on aesthetic quality and physical properties
Abstract
Nowadays most of the brick companies have addressed their research to the recycling of waste, in order to obtain
new types of bricks to put on the market. With this work, we intended to explore the possibility of using a
ceramic sludge in the brick production, in order to find an alternative eco-friendly additive to produce “eco-
bricks” characterised by appropriate mechanical and aesthetic properties, and durability. For this purpose, two
types of bricks produced by an Italian factory (SanMarco-Terreal) were compared with a newly design brick
obtained from the same starting clay material with the addition of a ceramic sludge in place of the traditionally
used siliceous sand.
Results demonstrate that the brick produced with the addition of a ceramic sludge can well substitute traditional
bricks fulfilling aesthetic requirements and maintaining adequate mechanical properties, although these new
material resulted problematic in their durability response to freeze-thaw cycles, pointing out potential
vulnerability in cold climates.
Keywords: Sludge; Aesthetic quality; Mineralogy; Durability; Waste; Pore system.
1. Introduction
The raw material used in brick production is mostly composed of clay. The growing demand
for high quality final products, the necessity to expand the production of companies, as well
as the increasing attention to environmental issues (as also established by numerous regional,
national and communitarian regulations) have led to the use of several different additives in
addition to the normal raw clayey materials. Additives, both natural and synthetically
produced, act as auxiliary “raw materials”, which influence many properties of the fired
products, such as colour, mechanical strength and durability (Dondi et al., 1998). Quartz-rich
sand is the additive mostly used as temper (from 10 to 20 wt%) in ordinary brick productions,
CHAPTER VI Results
128
since it is easily available, does not release pollutants at any stage of the ceramic production,
its addition reduces plasticity, prevents shrinkage and improves the mechanical resistance of
the finished products.
Several researches have been carried out in the last decades on the realisation of new bricks
using additives, often consisting of residual urban and industrial materials (Dondi et al.,
1997a; Dondi et al., 1997b; Demir, 2008; Raut et al., 2011; Zhang, 2013; Muñoz Velasco et
al., 2014; Neves Monteiro and Fontes Vieira, 2014; Bories et al., 2014). Frequently they
demonstrated the potentiality of these materials in reducing impact upon the environment and
determining technical advantages. Moreover, the introduction of industrial wastes in the brick
production can be a response to the problem of the disposal of large amounts of waste
materials produced from various industrial activities. The storage of these waste materials and
the global environmental hazard, connected with it, increased the demand and the
development of sustainable alternatives. For these reasons, industrial and academic attentions
have been addressed to the development of environmental friendly, low cost and lightweight
construction materials using waste. Bricks mainly consist of clayey materials, tolerate the
addition of waste even in significant percentages, and therefore are suitable for this type of
reuse (Dondi et al., 1998).
A type of waste is represented by sludge deriving from the ceramic production, and consisting
mostly on silico-aluminous based components (>50%), generally with a low content of heavy
metals (Dondi et al., 1998). This type of waste, compositionally similar to the raw clayey
materials of bricks and related to the ceramic production and often inadequately disposed,
may represent an important source of possible additives in the brick production through
adequate new mix designs. Nowadays, most of the ceramic producing companies have
addressed their research and organization of the productive implants to recycle “wastes”, save
energy and reuse resources (mainly water) originated from the production cycle, saving
natural resources and resolving the waste disposal problem. All these aspects deeply
contribute to the evaluation of the company performances. Although the reuse of ceramic
production waste (shards) is quite common, that of sludge is more difficult for the intrinsic
nature of this product. This material is very fine grained and can potentially contain, in
dependence of the type of ceramic production from which it derives, considerable amounts of
heavy metals and/or possible pollutants, although in small quantities, that may contrast with
CHAPTER VI Results
129
environmental and human safety requirements, suggesting that continuous quality control of
the used materials is always an important issue.
This work intends to explore the possibility of using a ceramic sludge in the brick production.
For this reason, two types of commercial bricks produced by the Italian factory SanMarco-
Terreal were analysed and results compared with a new designed brick obtained from the
same starting clayey material tempered with a ceramic sludge in place of the traditional
siliceous sand. Mineralogical composition, texture, physical properties, water behaviour and
durability of both traditionally produced and newly designed bricks were analysed using a
multi-analytical approach, and the possibility of recycling ceramic sludge in the brick
production was critically evaluated.
This research arose from a concrete interest of the company that provided full technical
support.
2. Materials and methods
All bricks were prepared using the same carbonate-rich clay and fired at 1050°C. Differences
consist in the additives used. Commercial bricks have a yellow (brick 1) and a black (brick 2)
colour, respectively, and are both obtained by tempering clay with 10 wt% of siliceous sand.
15 wt% of the colouring agent hausmannite (Mn2+Mn3+2O4) was also added to the latter.
Hausmannite is a secondary waste approved by valid criteria of environmental impact
evaluation (Sancho et al., 2009), and derived from industrial productions, such as those of
ferroalloys and MnO2-based batteries. The newly designed brick (brick 3) was prepared by
tempering the same clay with 10 wt% of dried ceramic sludge provided by the SanMarco-
Terreal factory.
Raw materials (clay and sludge) and fired products were chemically analysed by X-Ray
Fluorescence (XRF), using a S4 Pioneer (Brucker AXS) spectrometer, for which the
estimated detection limit for major elements is 0.01 wt%; ZAF correction was performed
systematically (Scott & Love, 1983), and the NCSDC 74301 (GSMS-1) standard (Chen &
Wang, 1988) was applied.
Mineralogical composition of raw materials and bricks was determined by X-Ray Powder
Diffraction (XRPD), using a PANalytical X'Pert diffractometer with Cu-Kα radiation,
operating at 40 kV and 40 mA of intensity; XRPD data were interpreted using X'Pert
HighScore Plus® software (PANalytical).
CHAPTER VI Results
130
Colour was determined using a Konica Minolta CM-700d spectrophotometer. According to
the CIE system, the colour can be described considering a parameter of luminescence (L*)
and of two chromatic coordinates, a* and b*, that reflect the amount of red-green (-60: green,
+60: red) and yellow-blue (-60: blue, +60: yellow), respectively. Colorimetry was performed
in dry and then in wet conditions on the fired bricks to determine all possible colour changes
related to the presence of water or humidity. Colour difference ΔE was calculated according
to the following equation:
where subscript 1 refers to measurements on the dry samples, and subscript 2 on the wet ones.
Petrographic features and texture as well as the degree of vitrification in the bricks were
studied on polished thin sections by Optical Microscopy (OM) under polarized light using an
Olympus DX–50 equipped with a Nikon D7000 digital microphotography system, and by
Field Emission Scanning Electron Microscopy (FESEM) using a LEO GEMINI 1530,
coupled with an INCA-200 Oxford microanalysis system.
Water absorption (UNI EN 13755) and drying (NORMAL 29/88) tests of fired bricks were
performed on cube-shaped samples (50 mm edge) (three samples for each brick type). Free
and forced absorption (Al and Af), drying index (Di), apparent and real density (Da and Dr),
open porosity (P) and degree of pore interconnection (Ax) were calculated.
Capillary rise (B) was studied on three prism-shaped samples (25x25x120 mm) for each brick
type according to the normative UNI EN 1925. Coefficient of capillarity (Ks) was calculated
after 9 minutes from the beginning of the test.
The distribution of pore access size (range 0.003-360 µm) was determined by Mercury
Intrusion Porosimetry (MIP) on a Micromeritics Autopore apparatus, model 9410, which can
generate a pressure of 414 MPa. Freshly cut samples of approximately 2 cm3 were oven-dried
for 24 h at 110°C and then analysed. Nitrogen Adsorption was used to determine porosity in
the range diameter comprised between 2 and 3000 Å. The sorption isotherms were determined
at 77 K using a Micromeritics Tristar 3000 under continuous adsorption conditions. Prior to
measurement, samples were heated at 130°C for 24h and out-gassed to 10-3 Torr using a
Micromeritics Flowprep. The Barrett-Joyner-Halenda (BJH) method was used to obtain pore-
size distribution curves.
CHAPTER VI Results
131
Vp (compression pulse) and Vs (shear pulse) propagation velocities were measured to check
the elastic-mechanical characteristics and the structural anisotropy of the fired bricks, and
detect compactness variations during and after the ageing treatments. The waves were
transmitted in the three perpendicular directions of the cube-shaped samples (50 mm edge)
using a Panametrics HV Pulser/Receiver 5058PR coupled with a Tektronix TDS 3012B
oscilloscope. Measurements were performed using Panametrics transducers of 1 MHz with a
contact surface of 3 cm in diameter. Once established wave velocities (Vp and Vs) and
apparent density (by MIP), Poisson Coefficient (ν), Young (E), shear (S) and bulk (K)
modules were calculated.
Uniaxial mechanical tests were carried out on three cubic samples (40x40x40 mm) for each
brick, using a press IPEMSA Model S-110 with a load force of 20 kg/s according to the
normative UNI EN 1926.
Accelerated ageing tests were carried out on three cubic samples (50 mm edge) for each brick
type, to evaluate their resistance to frost and salt crystallization. Freeze-thaw and salt
crystallization tests were carried out according to UNI EN 12371 and UNI EN 12370 norms,
respectively. The former consists of 30 cycles each lasting 24 h. Each cycle includes 8 h of
freezing at -12°C and 16 h of thawing at +20°C under water. Samples were weighed at each
cycle and carefully observed by visual inspection to check their progressive decay. At the end
of the test, samples were dried to measure their weight loss. Salt crystallization test consists of
10 cycles of 24 h, during which samples are immersed for 4 h in a 14 wt% solution of NaSO4
∙10H2O at 20°C, dried for 16 h in an electric oven at 100°C, and cooled for 4 h at 20°C.
Samples were weighed at each cycle and observed by visual inspection. At the end of the test,
samples were washed in water in order to remove possible salts trapped in pores and dried to
measure their weight loss. During both tests, at regular intervals (every 5 cycles during the
freeze-thaw test and every 3 cycles of salt crystallization) sample compactness was also
monitored by ultrasounds.
3. Results and discussion
3.1 Clay and recycled materials
On the basis of the mineralogical composition (Fig. 1, Table 1), the clay material is an illitic-
chloritic highly calcareous (carbonate-rich) clay. The abundance of carbonate is confirmed by
the high values of calcium and magnesium oxides, and loss of ignition (Table 2:
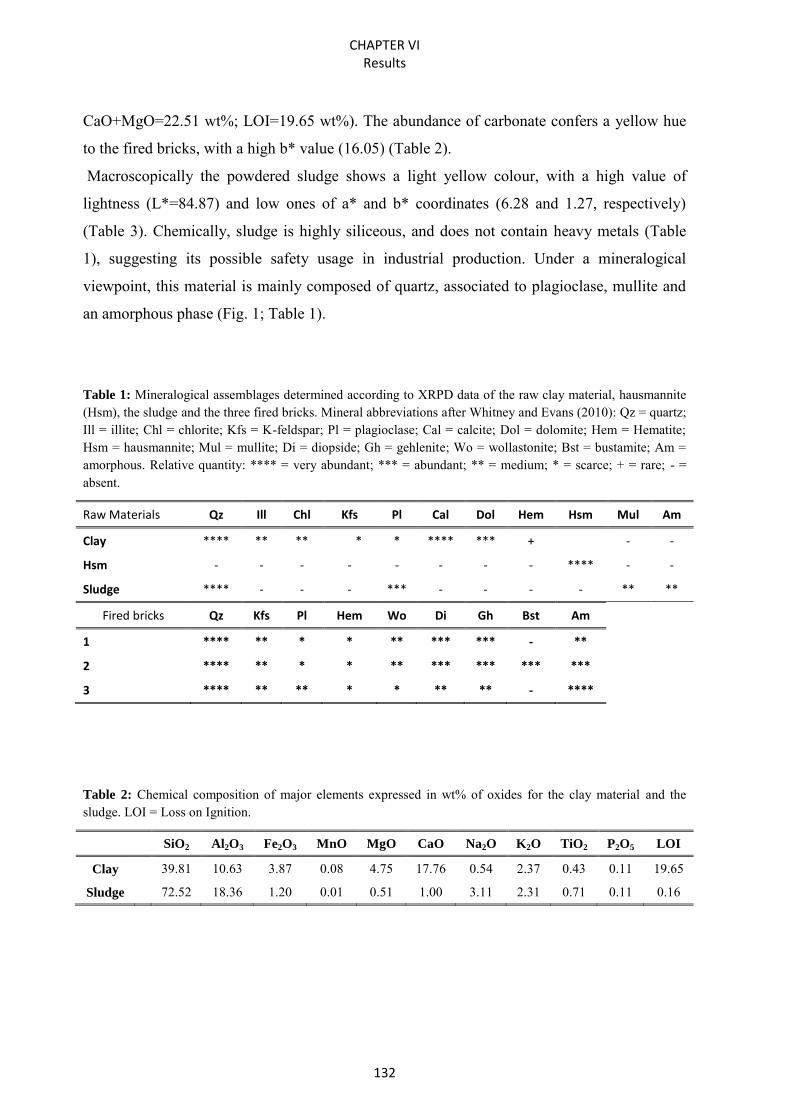
CHAPTER VI Results
132
CaO+MgO=22.51 wt%; LOI=19.65 wt%). The abundance of carbonate confers a yellow hue
to the fired bricks, with a high b* value (16.05) (Table 2).
Macroscopically the powdered sludge shows a light yellow colour, with a high value of
lightness (L*=84.87) and low ones of a* and b* coordinates (6.28 and 1.27, respectively)
(Table 3). Chemically, sludge is highly siliceous, and does not contain heavy metals (Table
1), suggesting its possible safety usage in industrial production. Under a mineralogical
viewpoint, this material is mainly composed of quartz, associated to plagioclase, mullite and
an amorphous phase (Fig. 1; Table 1).
Table 1: Mineralogical assemblages determined according to XRPD data of the raw clay material, hausmannite (Hsm), the sludge and the three fired bricks. Mineral abbreviations after Whitney and Evans (2010): Qz = quartz; Ill = illite; Chl = chlorite; Kfs = K-feldspar; Pl = plagioclase; Cal = calcite; Dol = dolomite; Hem = Hematite; Hsm = hausmannite; Mul = mullite; Di = diopside; Gh = gehlenite; Wo = wollastonite; Bst = bustamite; Am = amorphous. Relative quantity: **** = very abundant; *** = abundant; ** = medium; * = scarce; + = rare; - = absent.
Raw Materials Qz Ill Chl Kfs Pl Cal Dol Hem Hsm Mul Am
Clay **** ** ** * * **** *** + - -
Hsm - - - - - - - - **** - -
Sludge **** - - - *** - - - - ** **
Fired bricks Qz Kfs Pl Hem Wo Di Gh Bst Am
1 **** ** * * ** *** *** - **
2 **** ** * * ** *** *** *** ***
3 ****
** ** * * ** ** - ****
Table 2: Chemical composition of major elements expressed in wt% of oxides for the clay material and the sludge. LOI = Loss on Ignition.
SiO2 Al2O3 Fe2O3 MnO MgO CaO Na2O K2O TiO2 P2O5 LOI
Clay
39.81 10.63 3.87 0.08 4.75 17.76 0.54 2.37 0.43 0.11 19.65
Sludge
72.52 18.36 1.20 0.01 0.51 1.00 3.11 2.31 0.71 0.11 0.16
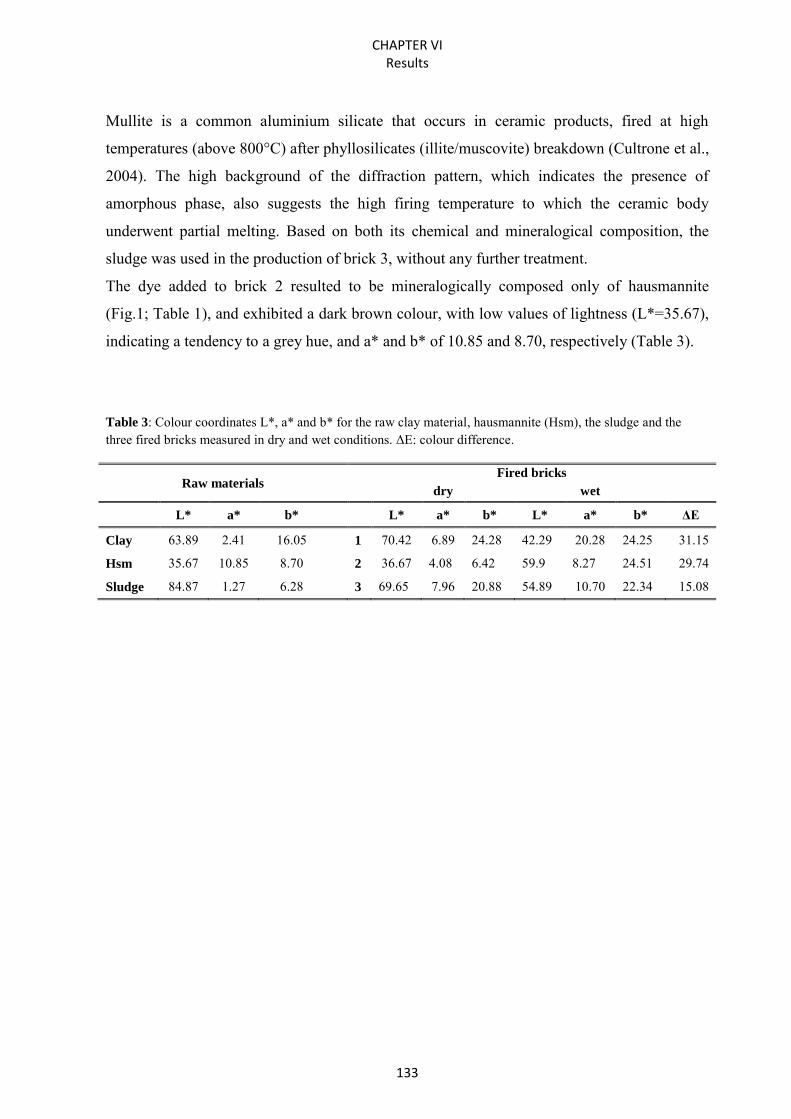
CHAPTER VI Results
133
Mullite is a common aluminium silicate that occurs in ceramic products, fired at high
temperatures (above 800°C) after phyllosilicates (illite/muscovite) breakdown (Cultrone et al.,
2004). The high background of the diffraction pattern, which indicates the presence of
amorphous phase, also suggests the high firing temperature to which the ceramic body
underwent partial melting. Based on both its chemical and mineralogical composition, the
sludge was used in the production of brick 3, without any further treatment.
The dye added to brick 2 resulted to be mineralogically composed only of hausmannite
(Fig.1; Table 1), and exhibited a dark brown colour, with low values of lightness (L*=35.67),
indicating a tendency to a grey hue, and a* and b* of 10.85 and 8.70, respectively (Table 3).
Table 3: Colour coordinates L*, a* and b* for the raw clay material, hausmannite (Hsm), the sludge and the three fired bricks measured in dry and wet conditions. ΔE: colour difference.
Raw materials Fired bricks
dry wet
L* a* b* L* a* b* L* a* b* ΔE
Clay 63.89 2.41 16.05 1 70.42 6.89 24.28 42.29 20.28 24.25 31.15
Hsm 35.67 10.85 8.70 2 36.67 4.08 6.42 59.9 8.27 24.51 29.74
Sludge 84.87 1.27 6.28 3 69.65 7.96 20.88 54.89 10.70 22.34 15.08
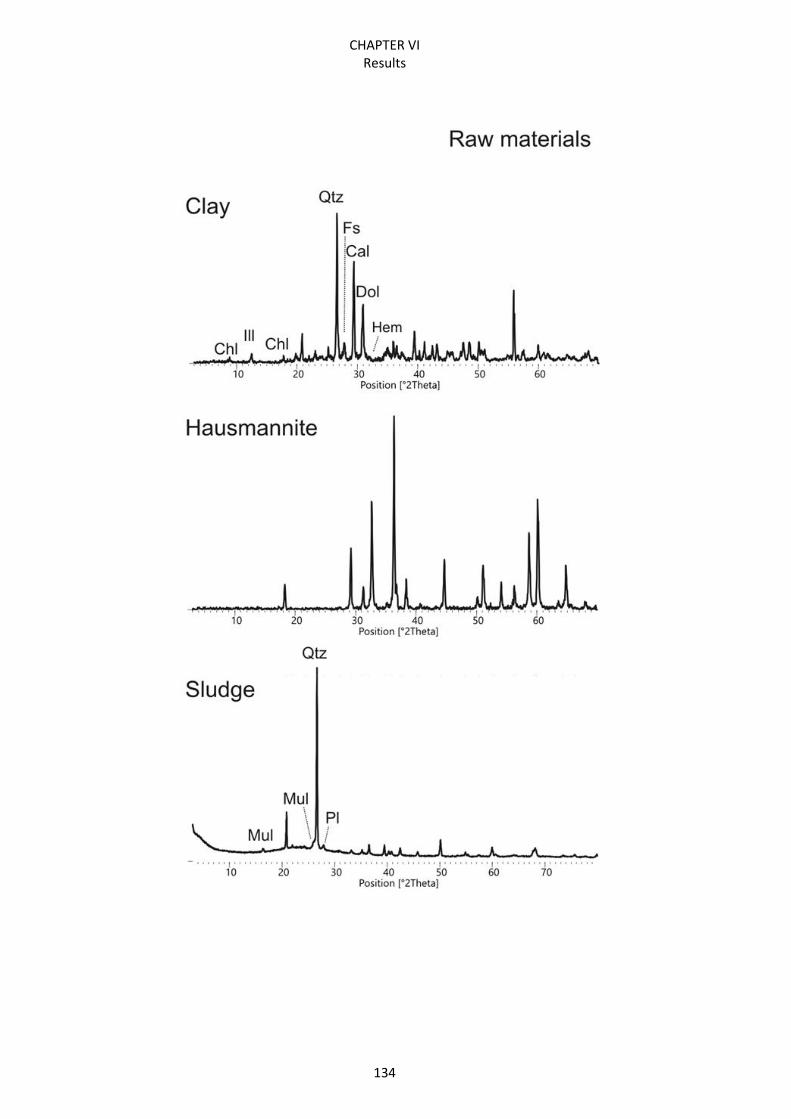
CHAPTER VI Results
134
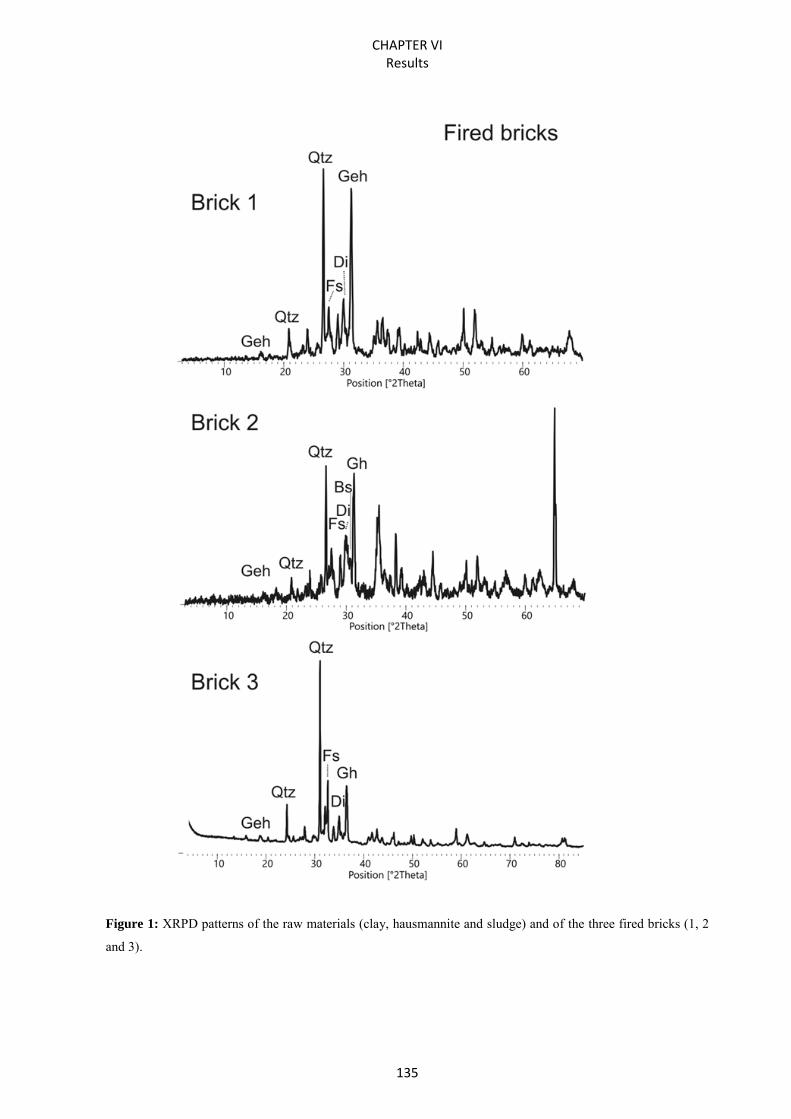
CHAPTER VI Results
135
Figure 1: XRPD patterns of the raw materials (clay, hausmannite and sludge) and of the three fired bricks (1, 2
and 3).
CHAPTER VI Results
136
3.2 Fired bricks
3.2.1 Colorimetry
Fired bricks are all characterized by a fine-grained paste, with a yellow hue for brick 1 and 3,
and a dark grey one for brick 2. Lightness (L*) is considerably high for bricks 1 and 3
compared to brick 2, as well as the chromatic coordinates a* and b*) which are rather similar
in brick 1 and 3 but higher with respect to brick 2 (Table 4). Colorimetric results indicate that
the use of a sludge produces a brick with aesthetic characteristics similar to those obtained
with a siliceous sand temper.
Changes in L*, a* and b* values can be observed when samples are wetted, although these
changes do not affect all the samples in the same way. Bricks 1 and 3 become darker, while
brick 2 registers an increase of the L* parameter. Brick 1 registers a considerable increase of
the a* value, while brick 2 shows a similar increment in the b* value. Brick 3 displays little
changes in both a* and b*, and generally registers minor colour changes between dry and wet
conditions (ΔE=31.15, 29.74 and 15.08 for brick 1, 2 and 3, respectively). Although colour
changes are in all cases outside the limit of perceptibility, defined as ΔE ≥ 3 in the Lab colour
space (Benavente et al., 2002; Grossi et al., 2007), brick 3, compared to the other bricks, has
the advantage to change less its aesthetic aspect in case of wet conditions (i.e., rainfall or
humidity).
3.2.2 Mineralogical composition
The mineral composition of the fired bricks follows what expected from a typical ceramic
material made of illitic-chloritic carbonate clay and fired at high temperature (1050°C).
Brick 1 is composed of predominant quartz, abundant gehlenite, diopside and wollastonite,
and associated anorthite, sanidine, hematite and amorphous phase. It is very similar to brick 2,
which also contains bustamite (CaMnSi2O6), a Mn-rich high temperature polymorph
belonging to the wollastonite group, developed from the following reaction among
hausmannite, carbonate and quartz:
CaCO3 + 2SiO2 + (Mn2+Mn3+2O4) → CaMn2+Si2O6 + Mn3+
2O3 + CO2
CHAPTER VI Results
137
Brick 3 has the same mineral composition of brick 1, but the newly formed silicates and the
amorphous phase are less developed (Fig. 1). The characteristic peaks of mullite, which were
detected in the sludge, are absent in the XRPD diffractogram of the fired product, probably
because the sludge represents only 10 wt% of the starting raw material, therefore its
concentration is too low to be detected.
At 1050°C most of the minerals composing the clay material and the natural sand have
already reacted. This is the reason why illite, chlorite and carbonates (calcite and dolomite)
have disappeared (Cultrone et al., 2005; Maritan et al., 2006) and contributed to the
development of new silicates, such as gehlenite, diopside and wollastonite (or bustamite).
Decarbonation of calcite takes place at 750-850°C and has an important role in the
development of new phases due to the release and migration of Ca2+ cations, promoting
reactions between minerals in the matrix. Gehlenite, for example, can derive from calcite and
illite (at 800-850ºC), while wollastonite can grow by reaction between calcite and quartz (at
900-1000ºC) (Duminuco et al., 1998; Riccardi et al., 1999). When dolomite decarbonates
between 500°C and 600°C, Mg2+ and Ca2+ cations are released, and their reaction with quartz
or with silica derived from the decomposition of the clay minerals, determines the formation
of diopside at 900-1050°C (Cultrone et al., 2001). Orthoclase, initially present in the raw clay,
is transformed into its high-temperature polymorph sanidine (Cultrone et al., 2001), while
plagioclase is enriched in anorthite when exceeding 950°C (Duminuco et al., 1998).
Concerning the amorphous phase, the comparison of the XRPD patterns (namely the
background in the 2θ interval between 30° and 40°) suggests high vitrification in brick 2 (Fig.
1). Therefore, the use of hausmannite not only promotes a marked colour variation, but also
increases the degree of melting, and consequently changes the mineralogy and the texture of
the final product.
3.2.3 Texture
Under optical microscope brick 1 (Fig. 2.a and 2.b) and 3 (Fig. 2.c and 2.d) show a bright
matrix (groundmass), while in brick 2 (Fig. 2.e and 2.f) the groundmass is dark due to the
presence of the hausmannite in the raw materials. All samples are very similar in terms of
pore structure and grain-size distribution. Grains (about 20%) have sub-angular shape with
non-selected distribution. Pores are mainly represented by “vescicles” and “vughs” (Kemp,
1985), and are homogeneously distributed in the matrix.
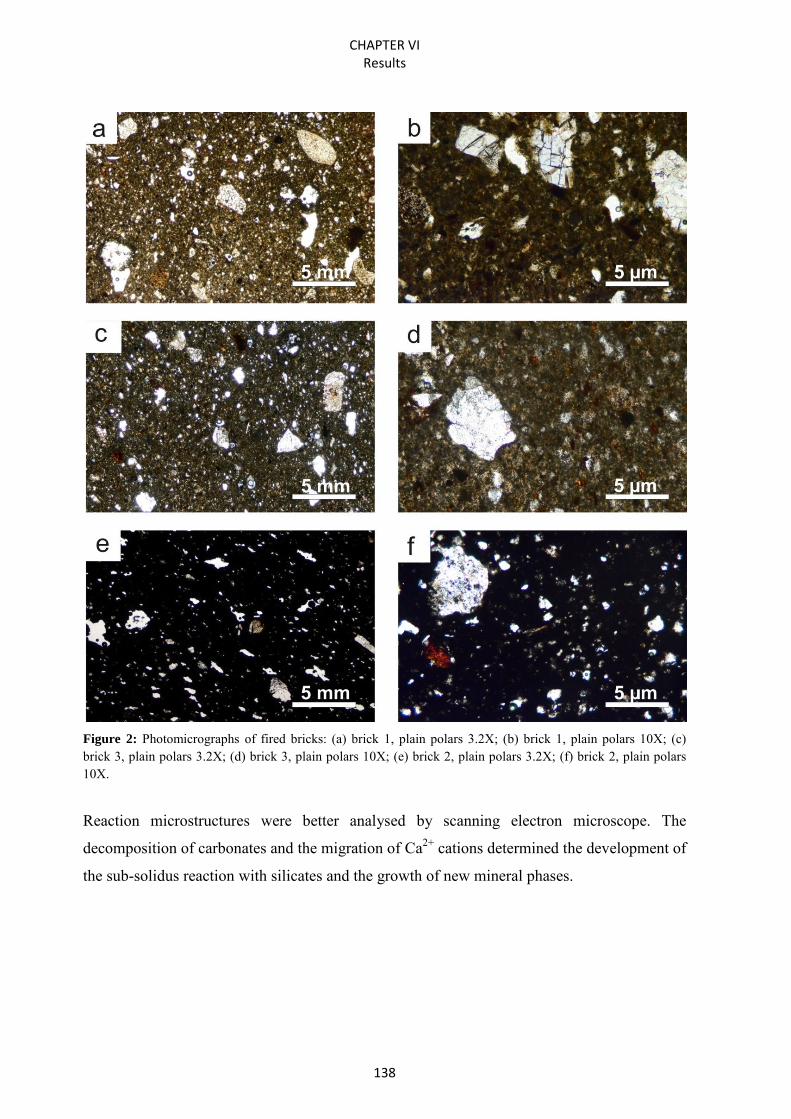
CHAPTER VI Results
138
Figure 2: Photomicrographs of fired bricks: (a) brick 1, plain polars 3.2X; (b) brick 1, plain polars 10X; (c) brick 3, plain polars 3.2X; (d) brick 3, plain polars 10X; (e) brick 2, plain polars 3.2X; (f) brick 2, plain polars 10X.
Reaction microstructures were better analysed by scanning electron microscope. The
decomposition of carbonates and the migration of Ca2+ cations determined the development of
the sub-solidus reaction with silicates and the growth of new mineral phases.
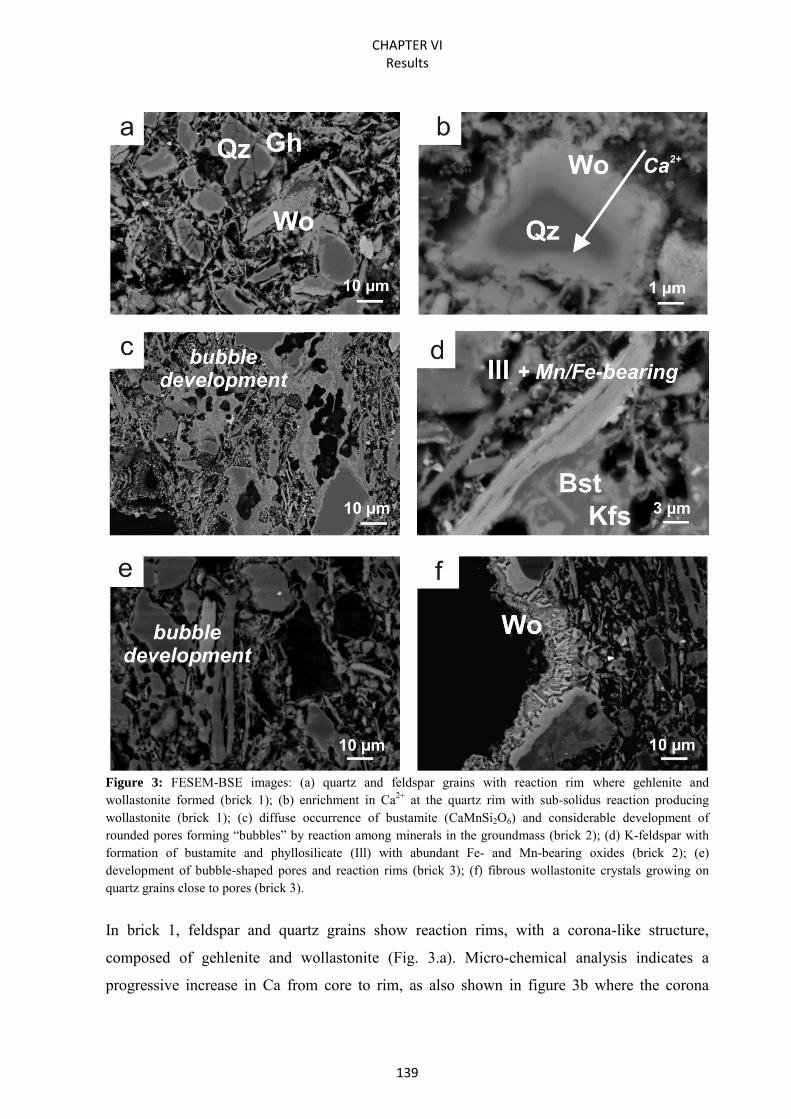
CHAPTER VI Results
139
Figure 3: FESEM-BSE images: (a) quartz and feldspar grains with reaction rim where gehlenite and wollastonite formed (brick 1); (b) enrichment in Ca2+ at the quartz rim with sub-solidus reaction producing wollastonite (brick 1); (c) diffuse occurrence of bustamite (CaMnSi2O6) and considerable development of rounded pores forming “bubbles” by reaction among minerals in the groundmass (brick 2); (d) K-feldspar with formation of bustamite and phyllosilicate (Ill) with abundant Fe- and Mn-bearing oxides (brick 2); (e) development of bubble-shaped pores and reaction rims (brick 3); (f) fibrous wollastonite crystals growing on quartz grains close to pores (brick 3).
In brick 1, feldspar and quartz grains show reaction rims, with a corona-like structure,
composed of gehlenite and wollastonite (Fig. 3.a). Micro-chemical analysis indicates a
progressive increase in Ca from core to rim, as also shown in figure 3b where the corona
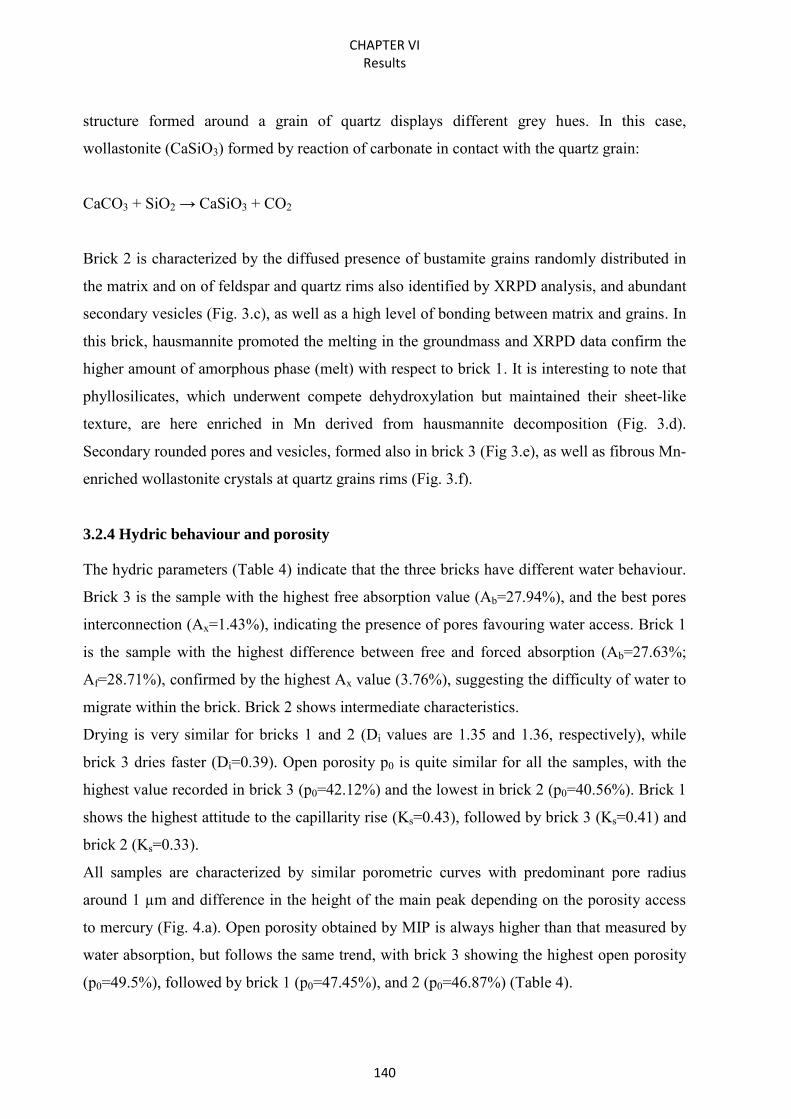
CHAPTER VI Results
140
structure formed around a grain of quartz displays different grey hues. In this case,
wollastonite (CaSiO3) formed by reaction of carbonate in contact with the quartz grain:
CaCO3 + SiO2 → CaSiO3 + CO2
Brick 2 is characterized by the diffused presence of bustamite grains randomly distributed in
the matrix and on of feldspar and quartz rims also identified by XRPD analysis, and abundant
secondary vesicles (Fig. 3.c), as well as a high level of bonding between matrix and grains. In
this brick, hausmannite promoted the melting in the groundmass and XRPD data confirm the
higher amount of amorphous phase (melt) with respect to brick 1. It is interesting to note that
phyllosilicates, which underwent compete dehydroxylation but maintained their sheet-like
texture, are here enriched in Mn derived from hausmannite decomposition (Fig. 3.d).
Secondary rounded pores and vesicles, formed also in brick 3 (Fig 3.e), as well as fibrous Mn-
enriched wollastonite crystals at quartz grains rims (Fig. 3.f).
3.2.4 Hydric behaviour and porosity
The hydric parameters (Table 4) indicate that the three bricks have different water behaviour.
Brick 3 is the sample with the highest free absorption value (Ab=27.94%), and the best pores
interconnection (Ax=1.43%), indicating the presence of pores favouring water access. Brick 1
is the sample with the highest difference between free and forced absorption (Ab=27.63%;
Af=28.71%), confirmed by the highest Ax value (3.76%), suggesting the difficulty of water to
migrate within the brick. Brick 2 shows intermediate characteristics.
Drying is very similar for bricks 1 and 2 (Di values are 1.35 and 1.36, respectively), while
brick 3 dries faster (Di=0.39). Open porosity p0 is quite similar for all the samples, with the
highest value recorded in brick 3 (p0=42.12%) and the lowest in brick 2 (p0=40.56%). Brick 1
shows the highest attitude to the capillarity rise (Ks=0.43), followed by brick 3 (Ks=0.41) and
brick 2 (Ks=0.33).
All samples are characterized by similar porometric curves with predominant pore radius
around 1 µm and difference in the height of the main peak depending on the porosity access
to mercury (Fig. 4.a). Open porosity obtained by MIP is always higher than that measured by
water absorption, but follows the same trend, with brick 3 showing the highest open porosity
(p0=49.5%), followed by brick 1 (p0=47.45%), and 2 (p0=46.87%) (Table 4).
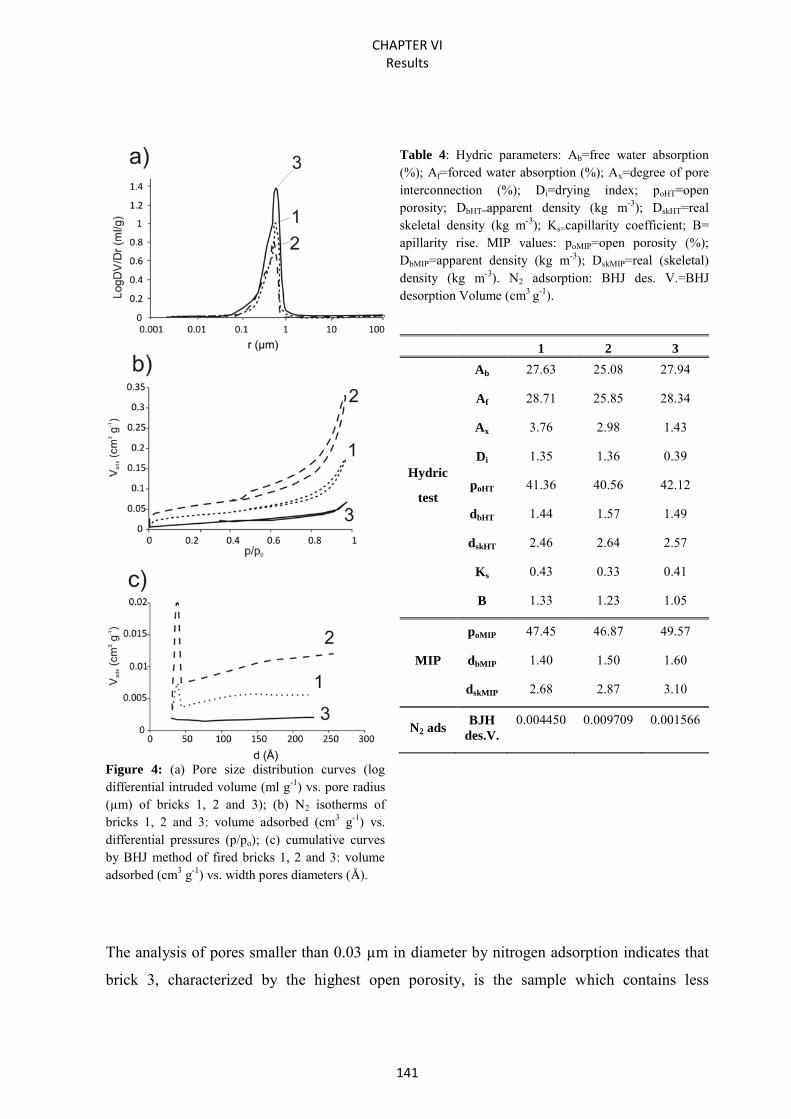
CHAPTER VI Results
141
Figure 4: (a) Pore size distribution curves (log differential intruded volume (ml g-1) vs. pore radius (µm) of bricks 1, 2 and 3); (b) N2 isotherms of bricks 1, 2 and 3: volume adsorbed (cm3 g-1) vs. differential pressures (p/po); (c) cumulative curves by BHJ method of fired bricks 1, 2 and 3: volume adsorbed (cm3 g-1) vs. width pores diameters (Å).
Table 4: Hydric parameters: Ab=free water absorption (%); Af=forced water absorption (%); Ax=degree of pore interconnection (%); Di=drying index; poHT=open porosity; DbHT=apparent density (kg m-3); DskHT=real skeletal density (kg m-3); Ks=capillarity coefficient; B= apillarity rise. MIP values: poMIP=open porosity (%); DbMIP=apparent density (kg m-3); DskMIP=real (skeletal) density (kg m-3). N2 adsorption: BHJ des. V.=BHJ desorption Volume (cm3 g-1).
1 2 3
Hydric
test
Ab 27.63 25.08 27.94
Af 28.71 25.85 28.34
Ax 3.76 2.98 1.43
Di 1.35 1.36 0.39
poHT 41.36 40.56 42.12
dbHT 1.44 1.57 1.49
dskHT 2.46 2.64 2.57
Ks 0.43 0.33 0.41
B 1.33 1.23 1.05
MIP
poMIP 47.45 46.87 49.57
dbMIP 1.40 1.50 1.60
dskMIP 2.68 2.87 3.10
N2 ads BJH
des.V.
0.004450 0.009709 0.001566
The analysis of pores smaller than 0.03 µm in diameter by nitrogen adsorption indicates that
brick 3, characterized by the highest open porosity, is the sample which contains less
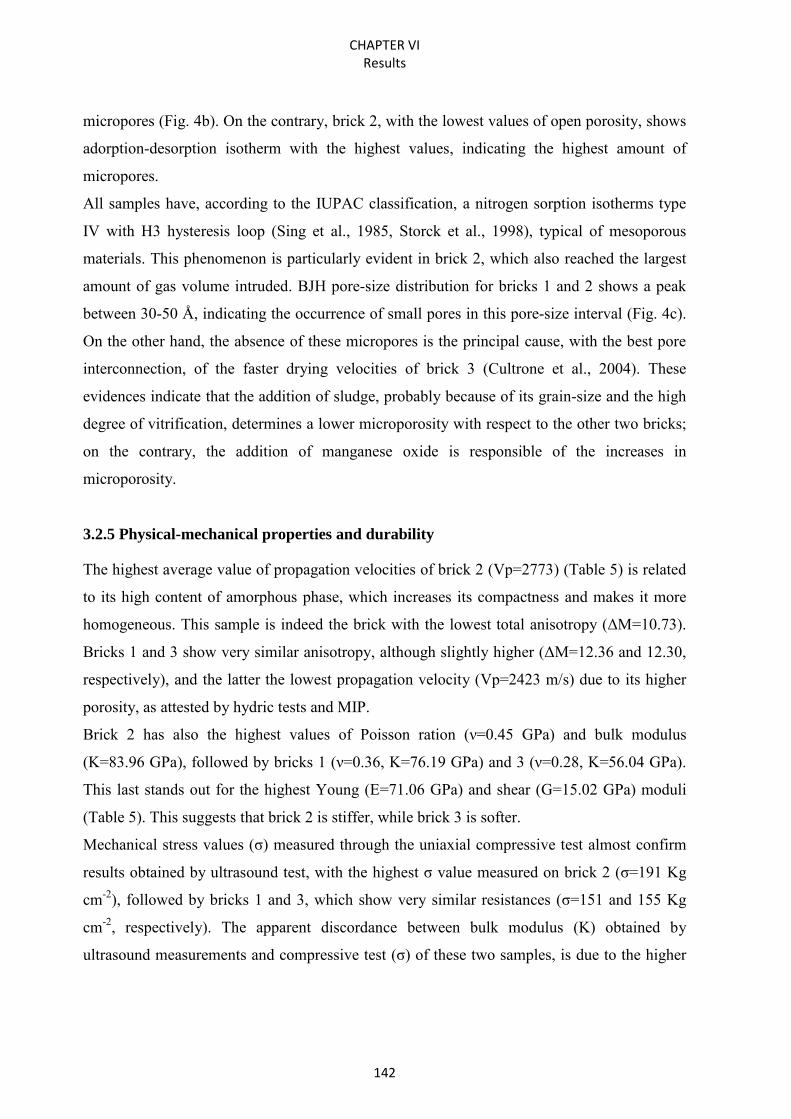
CHAPTER VI Results
142
micropores (Fig. 4b). On the contrary, brick 2, with the lowest values of open porosity, shows
adorption-desorption isotherm with the highest values, indicating the highest amount of
micropores.
All samples have, according to the IUPAC classification, a nitrogen sorption isotherms type
IV with H3 hysteresis loop (Sing et al., 1985, Storck et al., 1998), typical of mesoporous
materials. This phenomenon is particularly evident in brick 2, which also reached the largest
amount of gas volume intruded. BJH pore-size distribution for bricks 1 and 2 shows a peak
between 30-50 Å, indicating the occurrence of small pores in this pore-size interval (Fig. 4c).
On the other hand, the absence of these micropores is the principal cause, with the best pore
interconnection, of the faster drying velocities of brick 3 (Cultrone et al., 2004). These
evidences indicate that the addition of sludge, probably because of its grain-size and the high
degree of vitrification, determines a lower microporosity with respect to the other two bricks;
on the contrary, the addition of manganese oxide is responsible of the increases in
microporosity.
3.2.5 Physical-mechanical properties and durability
The highest average value of propagation velocities of brick 2 (Vp=2773) (Table 5) is related
to its high content of amorphous phase, which increases its compactness and makes it more
homogeneous. This sample is indeed the brick with the lowest total anisotropy (ΔM=10.73).
Bricks 1 and 3 show very similar anisotropy, although slightly higher (ΔM=12.36 and 12.30,
respectively), and the latter the lowest propagation velocity (Vp=2423 m/s) due to its higher
porosity, as attested by hydric tests and MIP.
Brick 2 has also the highest values of Poisson ration (ν=0.45 GPa) and bulk modulus
(K=83.96 GPa), followed by bricks 1 (ν=0.36, K=76.19 GPa) and 3 (ν=0.28, K=56.04 GPa).
This last stands out for the highest Young (E=71.06 GPa) and shear (G=15.02 GPa) moduli
(Table 5). This suggests that brick 2 is stiffer, while brick 3 is softer.
Mechanical stress values (σ) measured through the uniaxial compressive test almost confirm
results obtained by ultrasound test, with the highest σ value measured on brick 2 (σ=191 Kg
cm-2), followed by bricks 1 and 3, which show very similar resistances (σ=151 and 155 Kg
cm-2, respectively). The apparent discordance between bulk modulus (K) obtained by
ultrasound measurements and compressive test (σ) of these two samples, is due to the higher
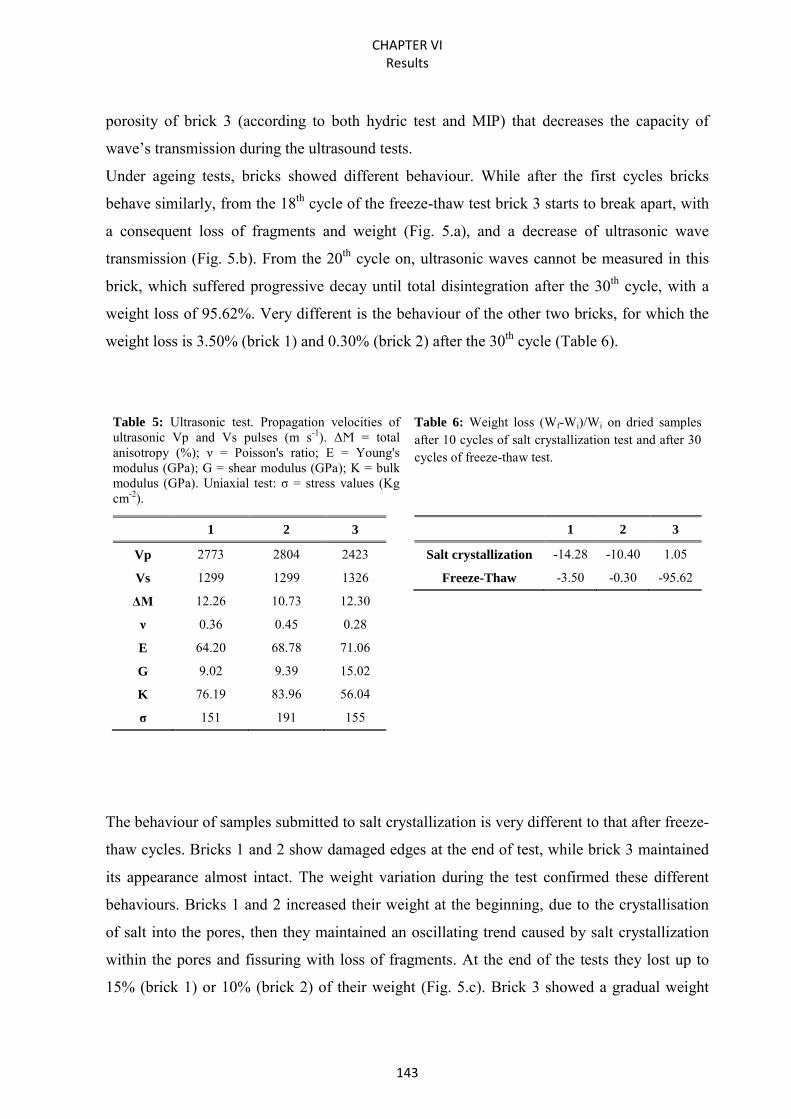
CHAPTER VI Results
143
porosity of brick 3 (according to both hydric test and MIP) that decreases the capacity of
wave’s transmission during the ultrasound tests.
Under ageing tests, bricks showed different behaviour. While after the first cycles bricks
behave similarly, from the 18th cycle of the freeze-thaw test brick 3 starts to break apart, with
a consequent loss of fragments and weight (Fig. 5.a), and a decrease of ultrasonic wave
transmission (Fig. 5.b). From the 20th cycle on, ultrasonic waves cannot be measured in this
brick, which suffered progressive decay until total disintegration after the 30th cycle, with a
weight loss of 95.62%. Very different is the behaviour of the other two bricks, for which the
weight loss is 3.50% (brick 1) and 0.30% (brick 2) after the 30th cycle (Table 6).
Table 5: Ultrasonic test. Propagation velocities of ultrasonic Vp and Vs pulses (m s-1). ΔϺ = total anisotropy (%); ν = Poisson's ratio; E = Young's modulus (GPa); G = shear modulus (GPa); K = bulk modulus (GPa). Uniaxial test: σ = stress values (Kg cm-2).
1 2 3
Vp 2773 2804 2423
Vs 1299 1299 1326
ΔM 12.26 10.73 12.30
ν 0.36 0.45 0.28
E 64.20 68.78 71.06
G 9.02 9.39 15.02
K 76.19 83.96 56.04
σ 151 191 155
Table 6: Weight loss (Wf-Wi)/Wi on dried samples after 10 cycles of salt crystallization test and after 30 cycles of freeze-thaw test.
1 2 3
Salt crystallization -14.28 -10.40 1.05
Freeze-Thaw -3.50 -0.30 -95.62
The behaviour of samples submitted to salt crystallization is very different to that after freeze-
thaw cycles. Bricks 1 and 2 show damaged edges at the end of test, while brick 3 maintained
its appearance almost intact. The weight variation during the test confirmed these different
behaviours. Bricks 1 and 2 increased their weight at the beginning, due to the crystallisation
of salt into the pores, then they maintained an oscillating trend caused by salt crystallization
within the pores and fissuring with loss of fragments. At the end of the tests they lost up to
15% (brick 1) or 10% (brick 2) of their weight (Fig. 5.c). Brick 3 showed a gradual weight
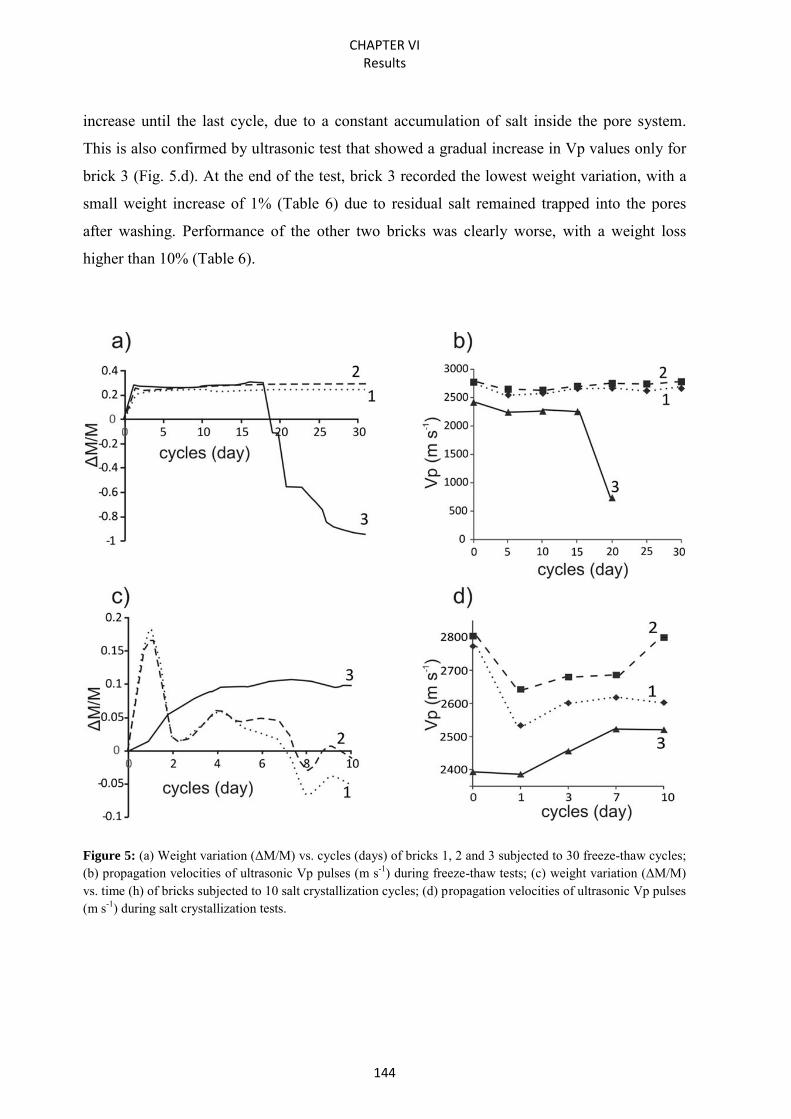
CHAPTER VI Results
144
increase until the last cycle, due to a constant accumulation of salt inside the pore system.
This is also confirmed by ultrasonic test that showed a gradual increase in Vp values only for
brick 3 (Fig. 5.d). At the end of the test, brick 3 recorded the lowest weight variation, with a
small weight increase of 1% (Table 6) due to residual salt remained trapped into the pores
after washing. Performance of the other two bricks was clearly worse, with a weight loss
higher than 10% (Table 6).
Figure 5: (a) Weight variation (ΔM/M) vs. cycles (days) of bricks 1, 2 and 3 subjected to 30 freeze-thaw cycles; (b) propagation velocities of ultrasonic Vp pulses (m s-1) during freeze-thaw tests; (c) weight variation (ΔM/M) vs. time (h) of bricks subjected to 10 salt crystallization cycles; (d) propagation velocities of ultrasonic Vp pulses (m s-1) during salt crystallization tests.
CHAPTER VI Results
145
4. Conclusions
This study demonstrated the possibility of using ceramic sludge in the brick mixture and
highlighted changes in brick properties determined by the addition of manganese oxide as a
dye.
Colorimetric tests showed that the brick with sludge have a similar aesthetic appearance with
the yellow commercial brick, suggesting that its colour is compatible for a feasible
substitution. Concerning water behaviour, the brick with sludge had the best pore
interconnection and a slightly higher open porosity, confirmed by mercury intrusion analysis
and nitrogen adsorption.
Uniaxial compression test showed very similar stress (σ) value with the yellow commercial
brick, indicating that despite the change of temper also the mechanical properties are
maintained. The addition of hausmannite (Mn2+Mn3+2O4) to the paste determines on contrary
an increase in the mechanical strength: hausmannite does not only acts as a dye, but also
changes bricks texture, increasing vitrification and improving mechanical strength. These
overall good mechanical properties are also confirmed from the ultrasonic tests.
A contrasting behaviour regards the durability of bricks. While the commercial bricks 1 and 2
are particularly susceptible to salt crystallization, the experimental brick with sludge is weaker
after freeze-thaw cycles. These differences are related to the different pore system of these
three bricks and the aptitude of salt and ice to crystallize within those pores. Ice and salt
growth mechanisms are similar and generate a similar type of damage (Scherer, 1999). While
the nucleation rate of salt is higher in pores with diameter between 1 and 10 μm (Arnold and
Zehnder, 1990), the more sensitive pore range to ice crystallisation is that between 0.1 and 10
µm (Benavente, 2011). In pores below 0.1 µm, salt requires a considerable degree of
saturation to precipitate, while in pores above 10 µm, salt hinders to generate sufficient
pressure to damage the pore structure (Martínez-Martínez et al., 2013). The weakest response
to frost of brick 3 may be related to the highest amount of pores in the range 0.1-10 µm, in
which crystals can efficiently grow, damaging the material.
These evidences suggest that the brick obtained with the addition of sludge can be a valid
substitute of the commercial brick 1 (yellow) under many viewpoints, but it cannot be used in
cold climates.
Our results confirm the possibility to undertake economic and ecologic ways to improve the
brick industry and develop new products using waste materials.
CHAPTER VI Results
146
ACKNOWLEDGMENTS This study was funded by Research Group RNM179 of the Junta de Andalucía and by
Research Project MAT2012-34473. The research benefitted by funding from INPS - Gestione
Ex Inpdap (Direzione Regionale Veneto), which provided the PhD “Doctor J” Grant over the
period 2012-2015.
Reference
Arnold A., Zehnder K., 1990. Salt weathering on monuments, in The Conservation of
Monuments in the Mediterranean Basin: The influence of coastal environment and salt
spray on limestone and marble. Proceedings of the 1st International Symposium, 31-58
Benavente D., 2011. Why pore size is important in the deterioration of porous stones used in
the built heritage? Macla 15, 41–42
Benavente D., Martiñez-Verdú F., Bernabeu A., Viqueira V., Fort R., García del Cura M.A.,
Illueca C., Ordóñez S., 2002. Influence of surface roughness on color changes in
building stones, Color Research and Application 28, 343–351.
Bories C., Borredon M.-E, Vedrenne E., Vilarem G., 2014. Development of eco-friendly
porous fired clay bricks using pore-forming agents: A review, Journal of Environmental
Management 143, 186–196
Chen G., Wang J., 1998. The preparation of marine geological certified reference materials -
polymetallic nodule GSPN-1 and marine sediment GSMS-1 from the Central Pacific
Ocean, Geostandards and Geoanalytical Research 22, 119–125.
Cultrone G., Rodriguez-Navarro C., Sebastián E.M., Cazalla O., de la Torre M.J., 2001.
Carbonate and silicate phase reactions during ceramic firing, European Journal
Mineralogy 13, 621–634
Cultrone G., Sebastián E., Elert K., de la Torre M.J., Cazalla O., Rodriguez-Navarro C., 2004.
Influence of mineralogy and firing temperature in the porosity of bricks, Journal of the
European Ceramic Society 34, 547–564
Cultrone G., Sebastián E., de la Torre M.J., 2005. Mineralogical and physical behaviours of
solid bricks with additives, Construction and Building Materials 19, 39–48
Demir I., 2008. Effect of organic residues addition on the technological properties of clay
bricks, Waste Management 28, 622–627
CHAPTER VI Results
147
Dondi M., Marsigli M., Fabbri B., 1997a. Recycling of Industrial and Urban Wastes in Brick
Production – A review, Tile Brick Int. 13, 218–225
Dondi M., Marsigli M., Fabbri B., 1997b. Recycling of Industrial and Urban Wastes in Brick
Production – A review (Part 2), Tile Brick Int. 13, 302–309
Dondi M., Fabbri B., Marsigli M., 1998. Rassegna delle esperienze di riciclaggio di scarti
industriali e urbani nella produzione di laterizi, L’industria dei laterizi 51, 160–178
Duminuco P., Messiga B., Riccardi M.P., 1998. Firinig process of natural clays. Some
microtextures and related phase compositions, Termodicnamica Acta 321, 185-190
Grossi C.M., Brimblecombe P., Esbert R.M., 2007. Francisco Javier Alonso, Color changes in
architectural limestones from pollution and cleaning, Color Research and Application
32, 320-331
Maritan L., Nodari L., Mazzoli C., Milano A., Russo U., 2006. Influence of firing conditions
in ceramic products: Experimental study on clay rich in organic matter, Applied Clay
Science 31, 1–15
Martínez-Martínez J., Benavente D., Gomez-Heras M., Marco-Castaño L., García-del-Cura
M. Á., 2013, Non-linear decay of building stones during freeze–thaw weathering
processes, Construction and Building Materials 38, 443–454
Muñoz Velasco P., Morales Ortíz M.P., Mendívil Giró M.A., Muñoz Velasco L., 2014. Fired
clay bricks manufactured by adding wastes as sustainable construction material – A
review, Construction and Building Materials 63, 97–107
Neves Monteiro S., Fontes Vieira C. M., 2014. On the production of fired clay bricks from
waste materials: A critical update, Construction and Building Materials 68, 599–610
UNE EN 15886, 2011. Conservación del patrimonio cultural. Métodos de ensayo. Medición
del color de superficies, A.E.N.O.R., Madrid
UNI EN 13755, 2008. Metodi di prova per pietre naturali - Determinazione dell'assorbimento
d'acqua a pressione atmosferica, CNR-ICR, Rome.
UNI EN 1925, 2000. Metodi di prova per pietre naturali - determinazione del coefficiente di
assorbimento d'acqua per capillarità, CNR-ICR, Rome.
UNI EN 1926, 2007. Metodo di prova per pietre naturali - determinazione della resistenza alla
compressione uniassiale, ICNR-ICR, Rome.
UNI EN 12371, 2010. Metodo di prova per pietre naturali - determinazione della resistenza al
gelo, CNR-ICR, Rome.
CHAPTER VI Results
148
UNI EN 12370, 2001. Metodi di prova per pietre naturali - determinazione della resistenza
alla cristallizzazione dei Sali, CNR-ICR, Rome.
Raut S.P., Ralegaonkar R.V, Mandavgane S.A., 2011. Development of sustainable
construction material using industrial and agricultural solid waste: A review of waste-
create bricks, Construction and Building Materials 25, 4037–4042
Riccardi M.P., Messiga B., Duminuco P., 1999. An approach to the dynamics of clay firing,
Applied Clay Science 15, 393-409.
Sancho J., Fernández B., Ayala J., García P., Recio J.C., Rodríguez C., Bernardo J.L., 2009.
Method of the obtaining electrolytic manganese from ferroalloy production waste, 1st
Spanish National Conference on Advances in Materials Recycling and Eco – Energy,
Madrid
Scott V.D., Love G., 1983. Quantitative Electron Probe Microanalysis, John Wiley and Sons,
New York.
Sing K.S.W., Everett D.H., Haul R.A.W., Moscou L., Pierotti R.A., Rouquerol J.,
Siemieniewska T., 1985. Reporting physorption data for gas/solid systems with special
reference to the determination of surface area and porosity, Pure & Applied Chemistry,
IUPAC, Vol. 57, No. 4, 603-619
Storck S., Bretinger H., Maier W.F., 1998. Characterization of micro- and mesoporous solids
by physisorption methods and pore-size analysis, Applied Catalysis A: General 174,
137-146
Whitney D.L., Evans B. W., 2010. Abbreviations for names of rock-forming minerals,
American Mineralogist 95, 185-187.
Zhang L., 2013. Production of bricks from waste materials – A review, Construction and
Building Materials 47, 643–655
CHAPTER VII
Conclusions

CHAPTER VII Conclusions
151
1. Concluding remarks
The overall study on the characterization of commercial bricks and the optimization of new
mix design obtained reusing waste materials highlights the close relationships between
mineralogy, porosity, mechanical properties and durability under different environmental
stresses. Moreover, this study demonstrates the possibility of recycling waste in the
production of bricks, maintaining traditional aesthetical characteristics and satisfying the
requirements of saving energy, reducing the production costs, and reducing the need of raw
materials so facing the new challenges for a sustainable and eco-compatible industry.
Commercial bricks fired at temperatures above 1050°C showed the greatest mineralogical
changes, with crystallisation of new silicate phases and widespread vitrification of the matrix.
This improved physical-mechanical properties of the bricks, and determined rather high water
absorption and capillarity rise, due to the presence of pores comprised mainly between 0.1
and 10 µm. On the contrary, bricks fired at 600°C showed good performance during hydric
tests, but rather poor resistance to accelerated decay tests in response to the low compactness
and lack of vitrification in the matrix, which determined poor bonding among grains.
The use of hausmannite (Mn3O4) as a dye caused changes not only to the visual aspect of the
bricks which turned dark grey in colour, but also to the mechanical properties and structure of
the pore system, since haumannite promoted vitrification during firing. This also determined
higher stress resistance, higher background noise in X-ray Diffraction patterns and increase of
pore roundness with respect to bricks obtained with the same raw materials and fired at the
same temperature, but lacking such an additive.
The analysis of the pore-system on a series of bricks by means of different analytical
techniques (Mercury Intrusion Porosimetry, Hydric Test, Nitrogen Adsorption, 2D Image
analysis of Scanning Electron Microscopy Backscattered images and Computerised X-Ray
micro-Tomography) revealed what information can be obtained and what pore-size interval
can be reliably investigated with each of the techniques. Moreover, the limitations of each
specific method were discussed. Bricks made with carbonate-rich (calcareous) clays have the
higher open porosity pore interconnection determined by carbonate decomposition. The
increase of the firing temperatures also favoured volatile release and caused significant
changes in pore morphology, developing large rounded pores. On the contrary, clays with
lower amounts of carbonate were fired at 600°C produced materials characterised by a very
different porosity, with less homogeneous and smaller pores.
CHAPTER VII Conclusions
152
The substitution of the standard quartz temper with industrial waste derived from trachyte
quarrying activity and ceramic sludge from industrial ceramic processes, successfully
confirmed the possibility of producing sustainable alternative materials without significantly
changing or even improving the mechanical, physical and aesthetical properties.
In particular, high trachyte contents favour vitrification at lower firing temperature for the
fluxing effect of alkali feldspars. This idea is supported by textural observations, revealing an
increased number of bridges connecting adjacent grains, the development of a more compact
matrix in correspondence of trachyte grains, the increase of the apparent density, and the
evolution of the texture. The pore system of such new bricks, as observed at SEM, showed
that increasing firing temperature and trachyte content, pores become larger and rounder. The
correlation between brick resistance and both firing temperature and trachyte content arose
also from the uniaxial compressive strength that was linked to the increase in compactness
due to vitrification related to the presence of feldspars contained in trachyte temper. The
assessment of thermal behaviour, carried out using infrared images, showed that with
increasing trachyte content heat transmission decreases; moreover, only when a high degree
of sintering was reached (with bricks containing 15% of trachyte and fired at 1100°C) heat
transmission increased again. All bricks displayed high resistance to decay under aggressive
environmental conditions (freeze-thaw and salt crystallization) without weight loss. The good
response to stresses and the lack of significant differences among the samples proved that
trachyte could be considered as a reliable alternative material to replace expensive fluxing
agent materials. The use of trachyte allowed preparing bricks with appreciable properties
already after firing at 900°C and containing more than 10% of trachyte.
Also in the case of reuse of ceramic sludge, the possibility of adding waste material in brick
mixture gave satisfying results. Colorimetry tests showed that bricks with sludge have similar
aesthetic appearances as some yellow bricks manufactured by the company, suggesting that
its colour closely resembles traditional bricks. Bricks with sludge registered ideal pore
interconnection and slightly higher open porosity, confirmed by the water behaviour, mercury
intrusion porosimetry and nitrogen adsorption. Uniaxial compression and ultrasonic tests
showed the mechanical resistance is very similar to that of commercial yellow bricks,
indicating that despite the change of temper also mechanical properties are preserved. The
most problematic aspect arose from the durability tests. While during salt crystallization test
bricks with sludge maintained their appearance without evident damages, after a number of
CHAPTER VII Conclusions
153
freeze-thaw cycles bricks faced progressive decay until total disintegration at the end of the
test. This suggests that this type of bricks can be considered as a valid substitute of
commercial ones for their mechanical properties, aesthetic qualities and water behaviour, but
may suffer in cold climates.
The study performed in this Doctoral Thesis regarding the petro-physical, mineralogical, and
textural properties of bricks, with particular attention to their porous system and durability,
revealed the close relationship between raw materials, firing process and features of the final
product. Indeed, mineralogy and pore system evolve during firing conferring different
properties to the fired bricks. This information represents an essential background of
knowledge in order to face the redevelopment of traditional bricks in a sustainable key. The
new mix designs experimentally produced by reusing waste (trachyte and ceramic sludge),
overall confirmed the possibility of following economical and ecological ways to improve
brick industry. This is an important starting point to improve brick production, reuse
accumulated waste, avoid the recovery of raw materials and reduce firing temperature,
economising in terms of both exploitation of new resources and production costs, and
ensuring sustainable processes and materials.
Beyond the successful results obtained and the feasibility of new bricks, this work is an
example of how universities from different countries and the industrial world can collaborate
pursuing common objectives. The interest in addressing research and scientific growth to the
support sustainability and environmental compatibility derived from the shared certainty that
margins exist to improve construction materials through the introduction on the market of
eco-conscious production lines, maintaining the characteristics of the traditional materials.
CHAPTER VII Conclusions
154
2. Future lines of research
Further future lines of research arising from this Doctoral Thesis are the following (some of
them are already in progress):
- study of the porous system, considering the representativeness of 2D digital processing on
backscattered images by scanning electron microscopy (SEM/BSE), on different types of
mineral aggregates and natural rocks (for example brick, marble, trachyte, travertine);
- study pyrometamorphic reactions and textural evolution occurring during the ceramic
production process staring from mixtures of pure standard phases (clays and temper), and
firing at different temperatures. This approach could permit the quantification of the new
silicate phases growing during firing and the identification of the mechanism of nucleation
and growth;
- parametrization of thermal infrared analysis in combination with thermal conductivity
analysers.