brazil and latin america networks regional overview may 2012 1
TRANSCRIPT

1
BRAZIL and LATIN AMERICANETWORKS REGIONAL OVERVIEW
MAY 2012

2
Population of 580M
Total TV HHs: 135MPay TV HHs: 50M
21 Countries and select Caribbean islands
Primary Countries• Mexico• Brazil• Colombia• Argentina• Chile
Latin and South America Region

3
Financials – Combined EBIT
Market revenues – Affiliate and Ad Sales
Combined Combined LA BR Combined LA BR CombinedFY2010 FY2011
Channels Total EBIT 51,330 63,897 38,478 16,403 54,881 52,400 19,600 72,000 FY2012 FY2013 Budget
Actuals Actuals Actuals Budget(US$ in thousands) FY2010 FY2011 FY2012 FY2013
Brazil Total Revenues 47,179 53,131 58,478 76,296 Mexico Total Revenues 33,306 34,913 37,974 45,192 Colombia Total Revenues 6,203 8,675 8,879 10,273 Other Market Revenues 52,863 55,193 68,498 85,406
Total Revenues 139,551 151,911 173,828 217,166

4
• Strong EBIT performance from channel operations with challenges. • Cost of programming up due to market competition from other cable channels• Increased selling expenses for ad agency incentives• Venezuela decentralization cost due to political instability
• Brazil is largest market representing 35% of total revenue. • Strongest growth in affiliate revenues due to subscriber penetration increase.• Growth mostly in middle class segment.• Established SPT Brazil Management team in FY12 to focus on market needs• Opportunity to launch mass appeal Pay TV service
• Mexico second largest market represent 21% of total revenue.• Growth impacted by restriction on ad sales minutes and Televisa pressure
against cable channels.• Fighting pressure as an industry• Exploring anti-trust action
Financial Performance

6
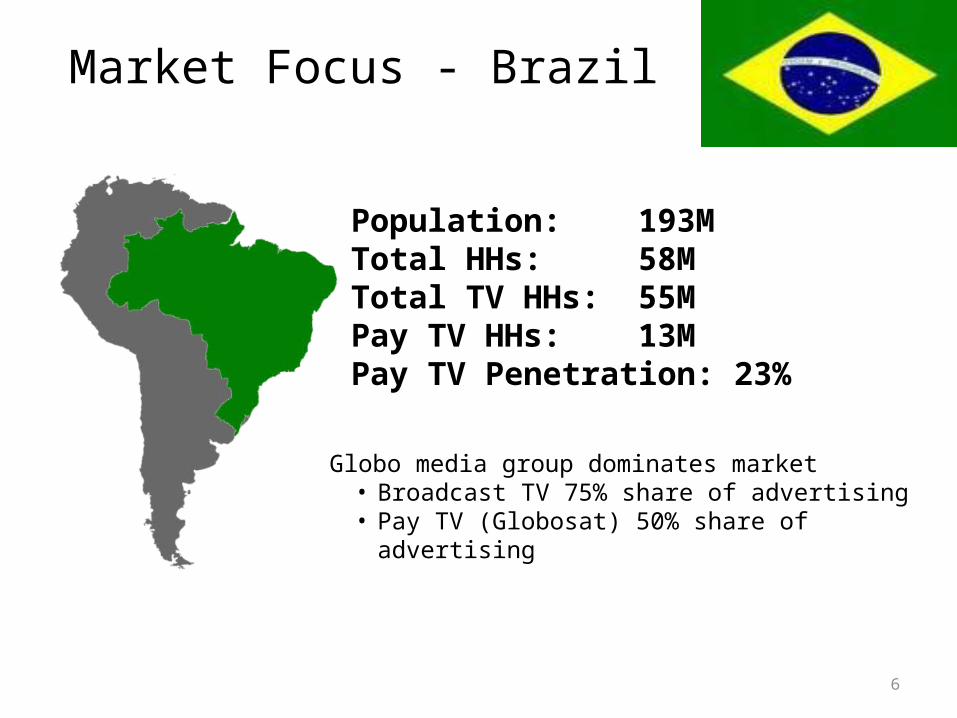
Market Focus - Brazil
Population: 193MTotal HHs: 58MTotal TV HHs: 55MPay TV HHs: 13MPay TV Penetration: 23%
Globo media group dominates market• Broadcast TV 75% share of advertising• Pay TV (Globosat) 50% share of advertising

7
21 20 18 17 16 16 16 16 14 12 12
2.2 2.5 5.54.8 4.3 3.7 2.8 2.7 3.0 2.9 3.0
4.7 4.6 4.44.3 4.2 4.2 4.0 4.2 4.4 4.2 4.0
10.6 9.7 9.18.3 8.8 8.6 8.5 8.5 7.7
7.5 7.2
57.3 58.7 57.359.2 59.6 59.4 59.2 58.8 60.9 62.9 63.3
1.5 1.9 1.72.2 2.3 3.0 3.4 3.7 3.7 3.9 4.2
1.41.6 1.7 2.1 2.8 3.5 4.3 4.6 5.1
2001 2002 2003 2004 2005 2006 2007 2008 2009 2010 2011
Others
Internet
Pay TV
Open TV
Magazine
Radio
Out of Home
Newspaper
Source: Projeto Inter-Meios
Advertising Market TrendMedia Share %
75%TV Globo
18%Ed.Globo
15%Infoglobo
25%S. Globo R.
15%Globo.com
51%Globosat
Globo group55% of the Ad Market
• Broadcast TV continues to build share of ad market• Pay TV share has remained relatively flat since 2007• Solid growth in internet spend

8
Cable45.1%
DTH52.7%
MMDS2.2%
Market Share by Groups(subscribers)
Subscribers by Technology
38.4%
29.1%
16.5%
5.9%2.9%
7.2%NET Services
Sky
Via Embratel
Telefonica/TVA
Oi
Others
Brazil Market Share – Affiliate Systems
Opportunity for growth from current 23% penetration level. Projection to double to 50% by 2016.
Growth in new affiliate systems – Oi and Telefonica investment in market

9
• Regulatory change allowed increased foreign ownership of affiliate systems in fall 2011. o Telmex owned Claro took majority control of NET system. o Telefonica took control of TVA system
• New Local Content approved in late 2011 and pending detailed implementation. o Minimum number of local content hours in primetime which will
escalate over three years from 1hour/week to 3 ½ hours/weeko Local productions must be with a Brazilian production company to
qualify.
• New Advertising Regs requiring local ad agency involvemento Will impact pan-regional business, since ads will be required to be
sourced locally.
New Legislation Impact to PayTV Channels

10
Brazil Ratings Highlights• Performance of key programs
– Once Upon a Time has launched as - #1 show for PayTV – Moved CSI Miami from AXN to SET and achieving top ratings– Criminal Minds and Unforgettable strong performers on AXN.
• Production of original content for SET (Time has Come) and Spin (Breakout) in pre-production
• SET and AXN rank in top fifteen for PayTV channels (for April 2012)

11
MEXICO

12
Population: 112.3MTotal HHs: 26.0MPay TV HHs: 10.8MPay TV Penetration:41.5%
Note: Based on LAMAC, AD Spend, IBOPE
Market Focus - Mexico
Televisa group is largest broadcaster and Pay TV operator
Televisa using muscle to control growth of international programmers advertising.

13
Mexico 2010 Advertising
Open TV59%
Radio9%
OOH8%
Newspapers7%
Cable TV6%
Internet6%
Magazines3%
Cinema2%
Source: CICOMFY 2010* Figures in million of Mexican Pesos
TOTAL ADVERTISING2010: $57,156 (+14.3%)2009: $50,023
OPEN TV ADVERTISING2010: $33,908 (+17.0%)2009: $28,882
CABLE TV ADVERTISING2010: $3,397 (+20%)2009: $2,831
• Share of broadcast TV: Televisa 70%; TV Azteca 27%• Pay TV represents 9% of total TV advertising

Affiliate Systems Market Share
Increase in PayTV penetration to over 40% in 2011 with growth of introductory cable packagesHighest growth in DTH with launch of Dish in Dec 2008 and rapidly grown to over 3M subscribers
• Televisa Systems (5.3M) Ownership:
• Sky Mexico 59%• Cablemas 100%• Cablevision 51%
• DISH (3.6M)• MVS 51%• DISH 49%
• Megacable (1.6)

15
Televisa is using their cable and DTH systems to limit advertising on international cable channels
• Televisa Systems began restricting international programmers to a cap of 6 minutes of advertising per hour, which reduce our SPT Channel prime time available inventory by 50%
• This had a severe impact on all international channels and specifically effected SPT channels FY12 Q3 revenue results
• Through our trade organization LAMAC, the international programmers received a rule clarification from the RTC, Mexican regulatory agency, authorizing Pay TV channels to average 6 minutes in 24 hour period with a cap of 12 minutes in any given hour.
• Televisa is still attempting to fight this ruling, but in the interim the international programmers are continuing to work with Mexico government agency RTC to respond to this market attack.
Televisa’s unfair business practice

16
Mexico Ratings Highlights• Performance of key programs
– Greys Anatomy - #1 show for PayTV– Continued strong performance of CSI series on AXN
• Production of MNTM for SET– Pre-production of season three now– Ad Sales sponsorship budget of MX$30M
• SET and AXN rank as top ten channel for PayTV channels (for April 2012)


18
Financials and Market Data• Relative to Brazil and Mexico is smaller market. Potential growth in market and
have opened one ad sales office operation in April 2012. Production of Los Caballeros with SPT Production group.
• Major Free TV Channels are RCN and Caracol
• Largest systems - Telmex (1.5M), DirecTV (0.4M), Une (1.0M)
• Market Revenues
2011
(Us$ millions) Revenues
Open TV $ 530
Radio $ 222
Magazines $ 55
Pay TV $ 38
Total $ 845

19
Colombia Affiliate Pay TV Market Share
46%
31%
13%
11%
Market Share
TelmexUNEDirectvOther

20
CRACKLE

21
Insert info from JOSE
Digital Entertainment-- Our Future Growth

22
Crackle Latin America• First mover opportunity
– Large underserved market, with a high revenue potential – 85% Internet audiences watching online videos; yet very limited long form premium
content available– 1 Billion Display Ad market, video ads poised to take off
• Latin American infrastructure gave us a one-two punch• Ad sales offices in all major markets• Strong channels to promote service
• Strong market response to Crackle launch• Advertisers ready to invest in digital media at scale • Pre-sold over $2Million USD media sponsorships prior to launch• Key clients: Visa, Banamex, Heineken, Sony Electronics, Sony Mobile, Kimberly Clark,
Nextel• Digital Video complements Paid TV ad sales packages for overall SPT offering

23
Crackle Latin America• Favorable content scenario:
– Agreement for SPE library provide high return on investment– Other studios/distributors have shown willingness to negotiate AVOD content:
Miramax, Polar Star, BBC, MGM, Disney
• Crackle launch: – WEB: 18 Countries/18 Sites (BR: Mar 13 and MX & Spanish LatAm April 17)– SONY BIV OTT: 18 Countries: May 1
• Initial outstanding results, meeting audience forecast. April results: • +1.29 Million Total Unique Users Brazil 0.91M• +1.7 Million Visits Total Brazil +1.2M• +1.0 Million Video Streams Brazil 0.75M• +8.3 Million Page Views Brazil 6M• +18 mins Average Time Spent Brazil 22mins
• +150 Thousand Crackle BR Facebook Fans• + 45 Thousand Crackle MX Facebook Fans

24
Sony United Examples• Mexico - Key relationship with Sony Companies.
– Sony Music: Revenue for FY ´12 represented 300k.
• Crackle: Key partnerships strategic in achieving success
– Sony Electronics $1 Million USD Media Investment in exchange for Crackle exclusivity on Sony BIV Devices OTT devices
– Sony Mobile - $300K sponsorship, development of Sony Android exclusive App– Fully integrated Sony Electronics/Crackle co-marketing plan: Packaging, In-Store POS,
Collateral, Public Relations, Events, Mass Communications
• Brazil - July 2011 Official draw for qualifiers for 2014 World Cup. Promoted on channel air. In discussions for 2014 World Cup event plans

APPENDICES


Competing Channel Packages
21 Channels15 Channels
9 Channels
Channels above do not include separate HD feeds
Purchased in 2010 Chilevision (Free TV)

Additional Channel Packages
3Channels
6 Channels
Launched Comedy Central in early 2012

01/0
4/11
09/0
4/11
17/0
4/11
25/0
4/11
03/0
5/11
11/0
5/11
19/0
5/11
27/0
5/11
04/0
6/11
12/0
6/11
20/0
6/11
28/0
6/11
06/0
7/11
14/0
7/11
22/0
7/11
30/0
7/11
07/0
8/11
15/0
8/11
23/0
8/11
31/0
8/11
08/0
9/11
16/0
9/11
24/0
9/11
02/1
0/11
10/1
0/11
18/1
0/11
26/1
0/11
03/1
1/11
11/1
1/11
19/1
1/11
27/1
1/11
05/1
2/11
13/1
2/11
21/1
2/11
29/1
2/11
06/0
1/12
14/0
1/12
22/0
1/12
30/0
1/12
07/0
2/12
15/0
2/12
23/0
2/12
02/0
3/12
10/0
3/12
18/0
3/12
26/0
3/12
03/0
4/12
11/0
4/12
19/0
4/12
27/0
4/12
05/0
5/12
1.50
1.55
1.60
1.65
1.70
1.75
1.80
1.85
1.90
1.95
2.00
1.53
1.90
1.96
FY12 and FY13 – Brazilian Rail Evolution Analysis
1,67
6 months below the final average of 1.67 BRA/USD
Max FY12=
Min FY12=
SPE FY13 Budget rate is 1.79

01/0
4/11
10/0
4/11
19/0
4/11
28/0
4/11
07/0
5/11
16/0
5/11
25/0
5/11
03/0
6/11
12/0
6/11
21/0
6/11
30/0
6/11
09/0
7/11
18/0
7/11
27/0
7/11
05/0
8/11
14/0
8/11
23/0
8/11
01/0
9/11
10/0
9/11
19/0
9/11
28/0
9/11
07/1
0/11
16/1
0/11
25/1
0/11
03/1
1/11
12/1
1/11
21/1
1/11
30/1
1/11
09/1
2/11
18/1
2/11
27/1
2/11
05/0
1/12
14/0
1/12
23/0
1/12
01/0
2/12
10/0
2/12
19/0
2/12
28/0
2/12
08/0
3/12
17/0
3/12
26/0
3/12
04/0
4/12
13/0
4/12
22/0
4/12
01/0
5/12
10/0
5/12
11.50
12.00
12.50
13.00
13.50
14.00
14.5014.24
13.34
FY12 and FY13 - Mexican Peso Evolution Analysis
12,66
6 months below the final average of 12.66 MXN/USD
Max FY12=
Min FY12= 11.50
SPE FY13 Budget rate is 13.64