brand valuation - delegate.com · brand valuation - the importance for owners ... product brands...
TRANSCRIPT
Brand Valuation The Importance for Owners
Brand Valuation - The Importance for Owners
• Aims for this session:
Brand valuation
what?
how?
why? and
what’s in it for us?
• Agenda:
background
brand valuation in general
why is it important?
is it art or science?
comparisons & benchmarks
methodologies
implications for us
questions / discussion
History of Brand Valuation
Who are the players in this field?
Background

Brand Valuation – a potted history
• History of Brand Valuation
1988 – 1st Notable Valuation
2000 – $1bn Securitisation
2001 – “100 Best Global Brands”
2004 – IFRS3
2010 – ISO 10668
2014 – League Tables
• Some Players in Valuation:
The Big 4 Accounting Firms
Business Consulting Firms
InterBrand
Brand Finance
Valuation Consulting
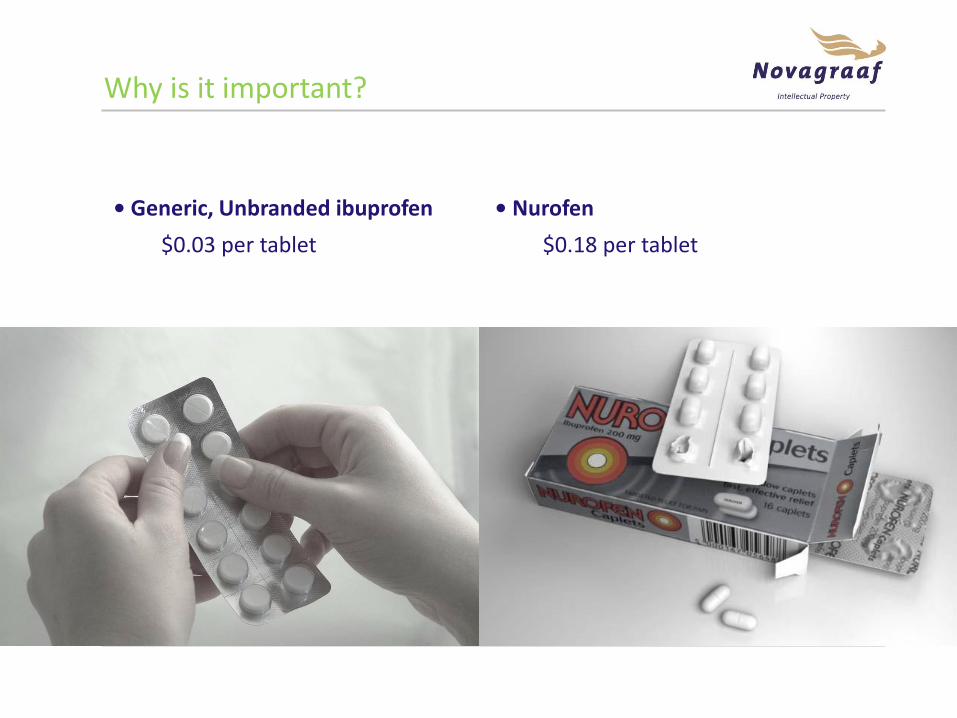
• Generic, Unbranded ibuprofen
$0.03 per tablet
• Nurofen
$0.18 per tablet
Why is it important?
Ability to charge premium
How much is it worth?
Has the business leveraged that ability?
What is the value to the business?
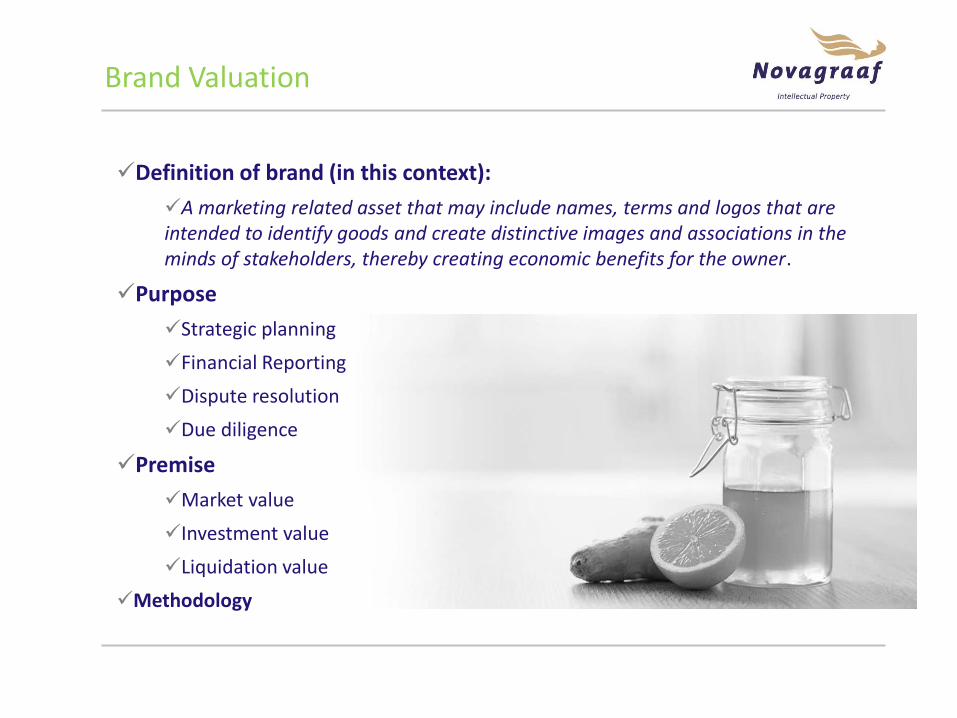
Definition of brand (in this context):
A marketing related asset that may include names, terms and logos that are intended to identify goods and create distinctive images and associations in the minds of stakeholders, thereby creating economic benefits for the owner.
Purpose
Strategic planning
Financial Reporting
Dispute resolution
Due diligence
Premise
Market value
Investment value
Liquidation value
Methodology
Brand Valuation
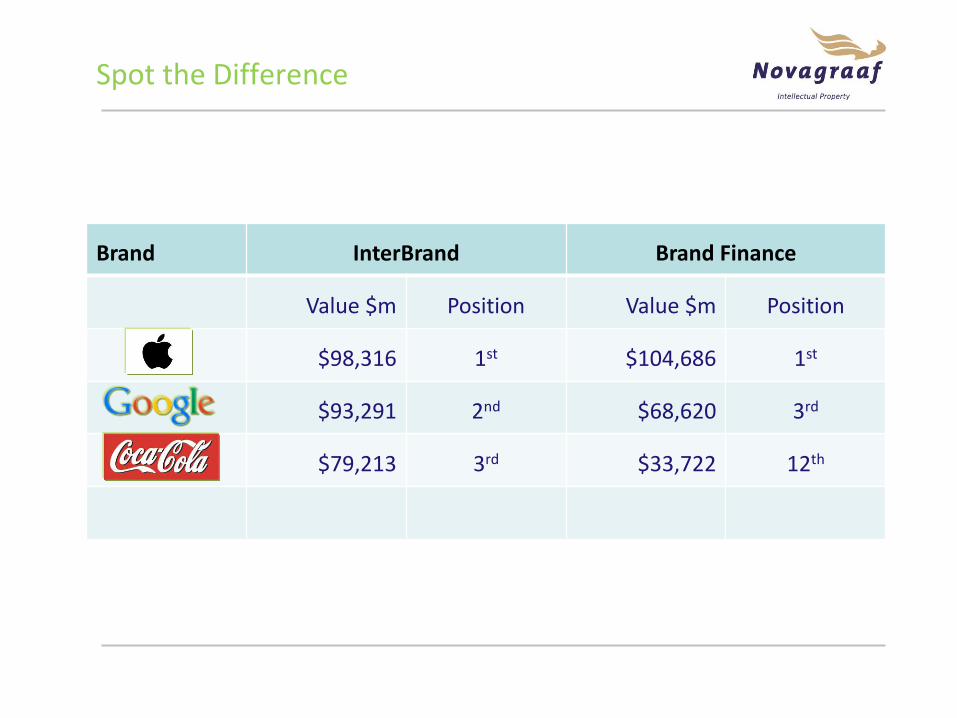
Spot the Difference
Brand InterBrand Brand Finance
Value $m Position Value $m Position
$98,316 1st $104,686 1st
$93,291 2nd $68,620 3rd
$79,213 3rd $33,722 12th
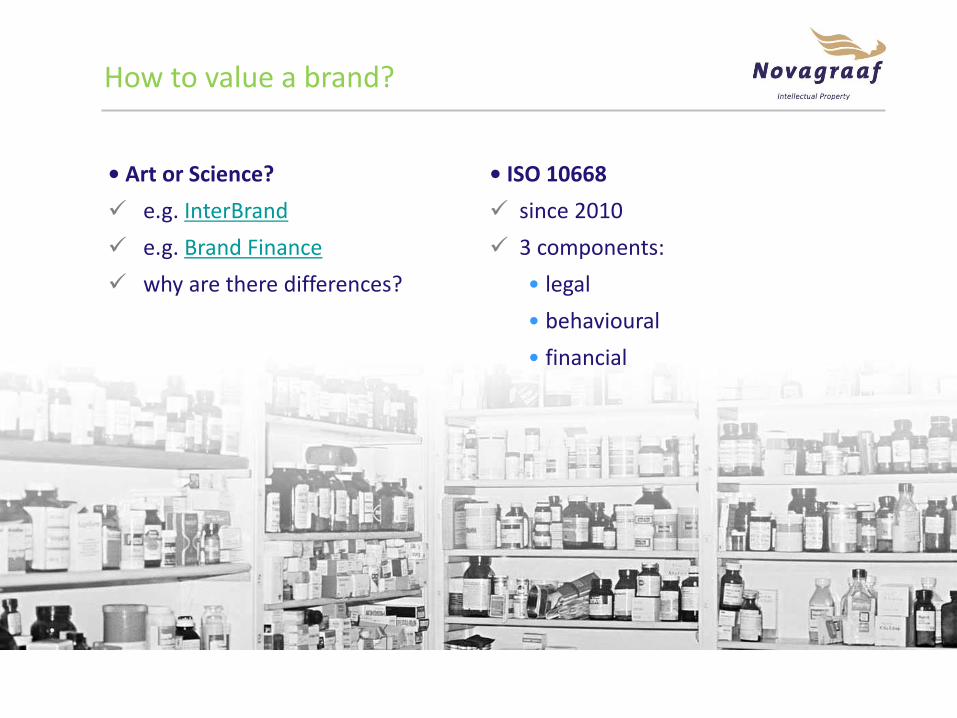
How to value a brand?
• Art or Science?
e.g. InterBrand
e.g. Brand Finance
why are there differences?
• ISO 10668
since 2010
3 components:
• legal
• behavioural
• financial
About ISO 10668
• The differing approaches
market
cost
income
• Income approaches
various
• Royalty Relief
why that one?
principle behind it

• Brand Value is a function of
brand strength; and
financial performance
Royalty Relief Method
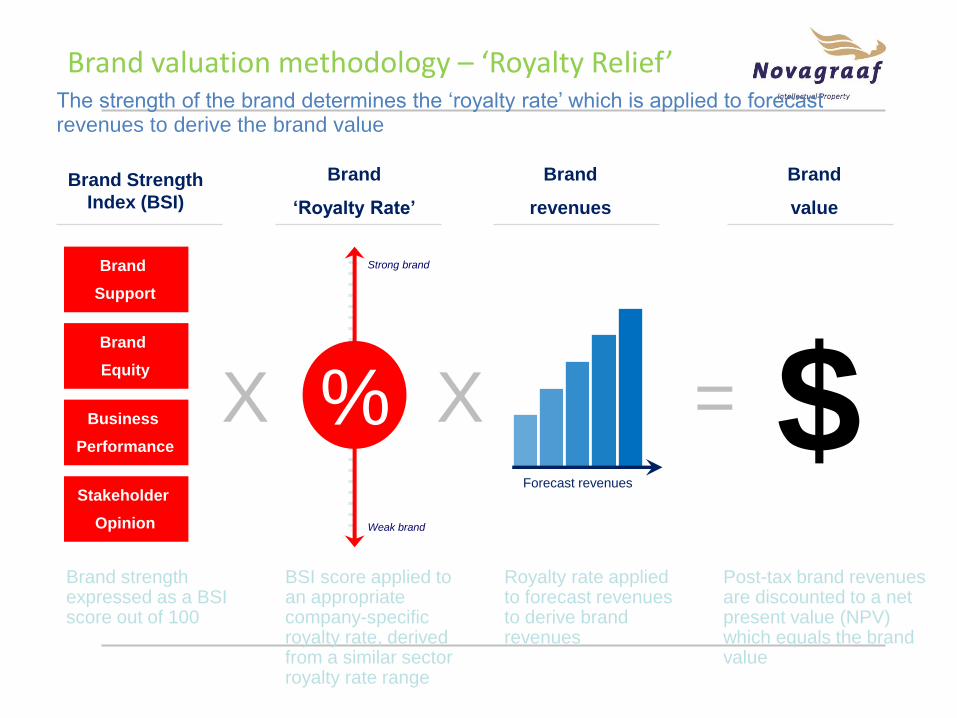
Brand valuation methodology – ‘Royalty Relief’ The strength of the brand determines the ‘royalty rate’ which is applied to forecast revenues to derive the brand value
Brand strength expressed as a BSI score out of 100
BSI score applied to an appropriate company-specific royalty rate, derived from a similar sector royalty rate range
Royalty rate applied to forecast revenues to derive brand revenues
Post-tax brand revenues are discounted to a net present value (NPV) which equals the brand value
Brand
Support
Brand
Equity
Business
Performance
Stakeholder
Opinion
X = $ Forecast revenues
Brand Strength
Index (BSI)
Brand
‘Royalty Rate’
Brand
revenues
Brand
value
%
Strong brand
Weak brand
X
Valuation – Why?
Disposal
Acquisition
Transfer pricing
Licensing
Securitisation
Choice of methodology influenced by purpose
May use several methods
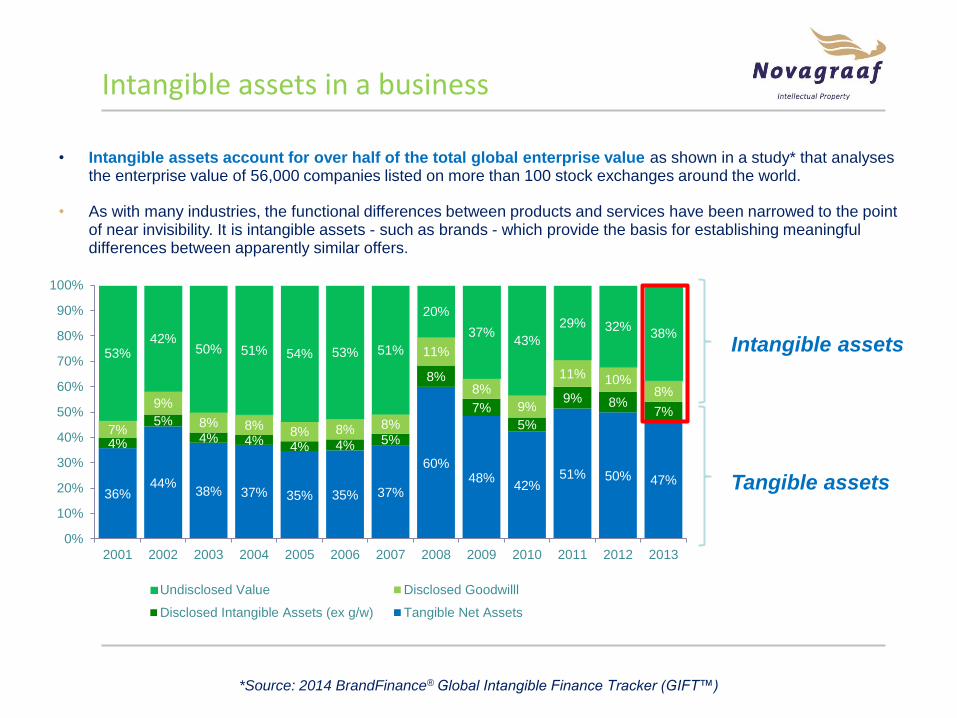
• Intangible assets account for over half of the total global enterprise value as shown in a study* that analyses the enterprise value of 56,000 companies listed on more than 100 stock exchanges around the world.
• As with many industries, the functional differences between products and services have been narrowed to the point of near invisibility. It is intangible assets - such as brands - which provide the basis for establishing meaningful differences between apparently similar offers.
36% 44%
38% 37% 35% 35% 37%
60% 48%
42% 51% 50% 47%
4%
5%
4% 4% 4% 4% 5%
8%
7%
5%
9% 8% 7%
7%
9%
8% 8% 8% 8% 8%
11%
8%
9%
11% 10% 8%
53% 42%
50% 51% 54% 53% 51%
20%
37% 43%
29% 32% 38%
0%
10%
20%
30%
40%
50%
60%
70%
80%
90%
100%
2001 2002 2003 2004 2005 2006 2007 2008 2009 2010 2011 2012 2013
Undisclosed Value Disclosed Goodwilll
Disclosed Intangible Assets (ex g/w) Tangible Net Assets
Intangible assets
Tangible assets
*Source: 2014 BrandFinance® Global Intangible Finance Tracker (GIFT™)
Intangible assets in a business
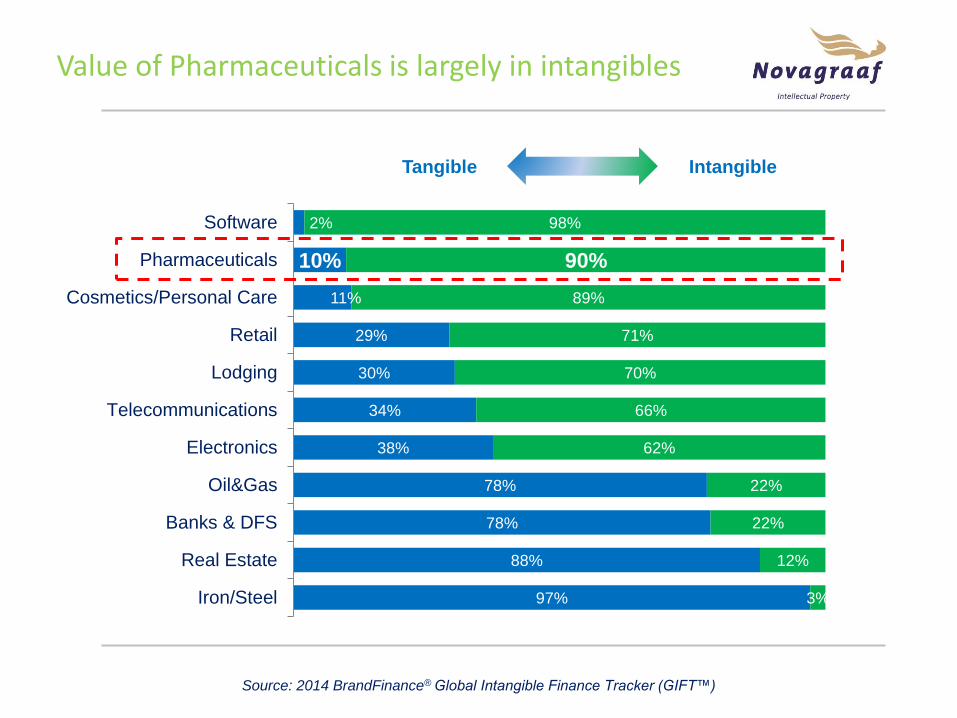
97%
88%
78%
78%
38%
34%
30%
29%
11%
10%
2%
3%
12%
22%
22%
62%
66%
70%
71%
89%
90%
98%
Iron/Steel
Real Estate
Banks & DFS
Oil&Gas
Electronics
Telecommunications
Lodging
Retail
Cosmetics/Personal Care
Pharmaceuticals
Software
Source: 2014 BrandFinance® Global Intangible Finance Tracker (GIFT™)
Intangible Tangible
Value of Pharmaceuticals is largely in intangibles

Intangibles in Pharma Business
Tangible Net Assets 10%
Marketing intangibles
5%
Customer intangibles
5%
Contract intangibles
10%
Technology intangibles
55%
General goodwill
15%
Pharmaceutical Breakdown of Intangible Value by Category
(e.g. brands)
(e.g. customer
relationships)
(e.g. Manufacturing
and distribution
agreements)
(e.g. Patents, R&D)
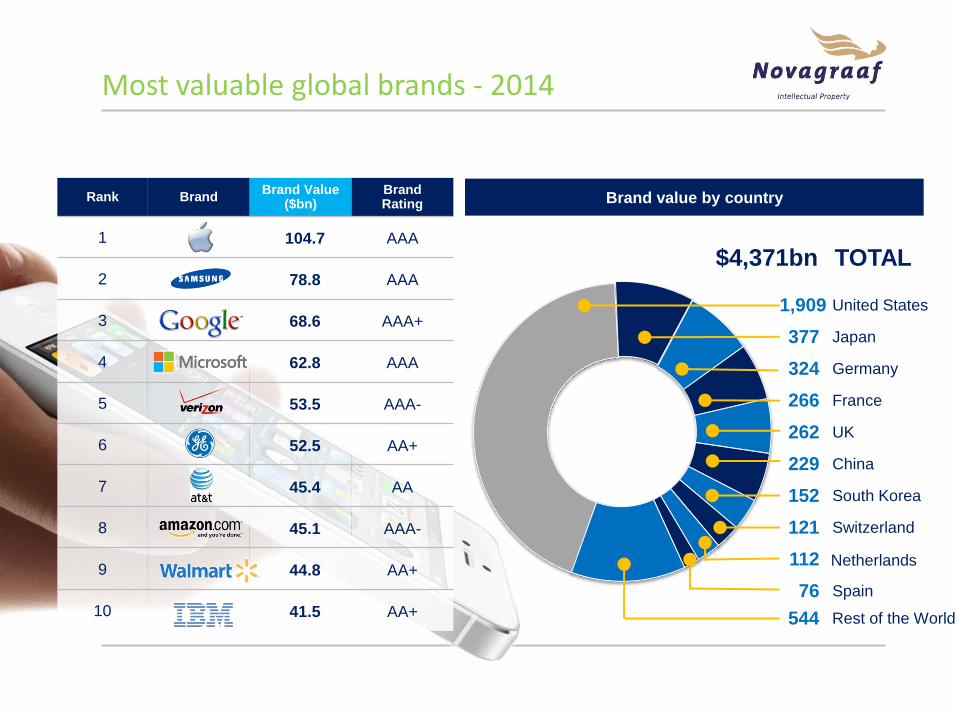
Most valuable global brands - 2014
Rank Brand Brand Value
($bn) Brand Rating
1 104.7 AAA
2 78.8 AAA
3 68.6 AAA+
4 62.8 AAA
5 53.5 AAA-
6 52.5 AA+
7 45.4 AA
8 45.1 AAA-
9 44.8 AA+
10 41.5 AA+
Brand value by country
United States 1,909
Japan 377
Germany 324
France 266
UK 262
China 229
South Korea 152
Switzerland 121
Netherlands 112
Spain 76
TOTAL $4,371bn
Rest of the World 544
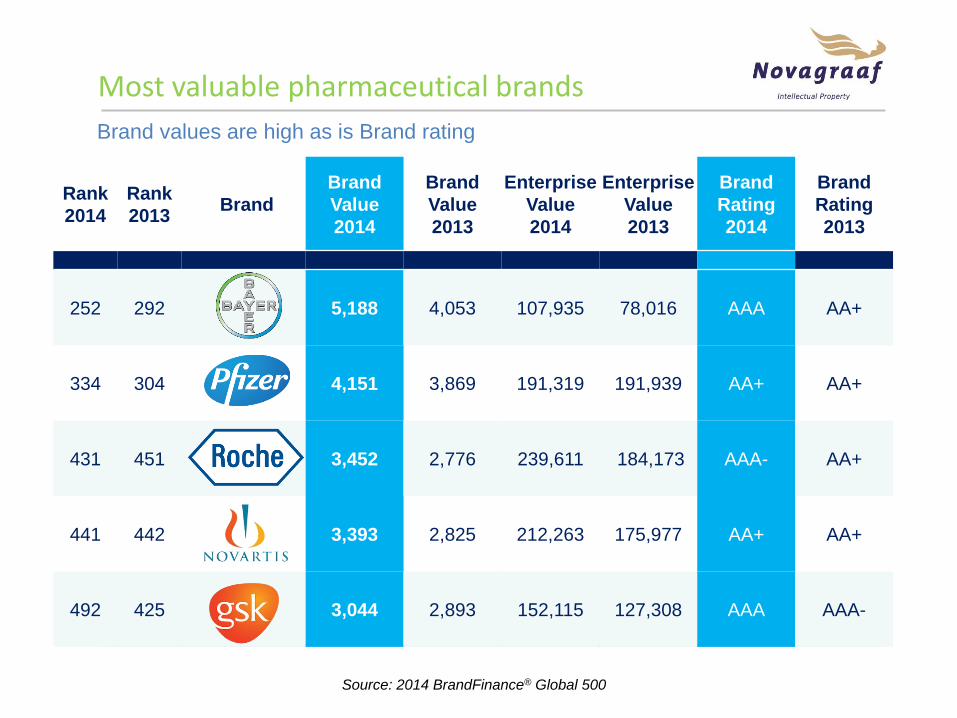
Rank
2014
Rank
2013 Brand
Brand
Value
2014
Brand
Value
2013
Enterprise
Value
2014
Enterprise
Value
2013
Brand
Rating
2014
Brand
Rating
2013
252 292 5,188 4,053 107,935 78,016 AAA AA+
334 304 4,151 3,869 191,319 191,939 AA+ AA+
431 451 3,452 2,776 239,611 184,173 AAA- AA+
441 442 3,393 2,825 212,263 175,977 AA+ AA+
492 425 3,044 2,893 152,115 127,308 AAA AAA-
Source: 2014 BrandFinance® Global 500
Most valuable pharmaceutical brands
Brand values are high as is Brand rating

Corporate Brands, Product Brands
Brand is the mental shortcut for consumers who cannot and will not study clinical data
Most consumers do not currently choose products based on their corporate brand
FMCG brands including big pharma are increasingly promoting themselves alongside their products
Corporate brand promotion tends to focus on emotional attributes and appeal – e.g. Pfizer’s “More than medication” campaign
Product brand promotion tends to focus on functional attributes
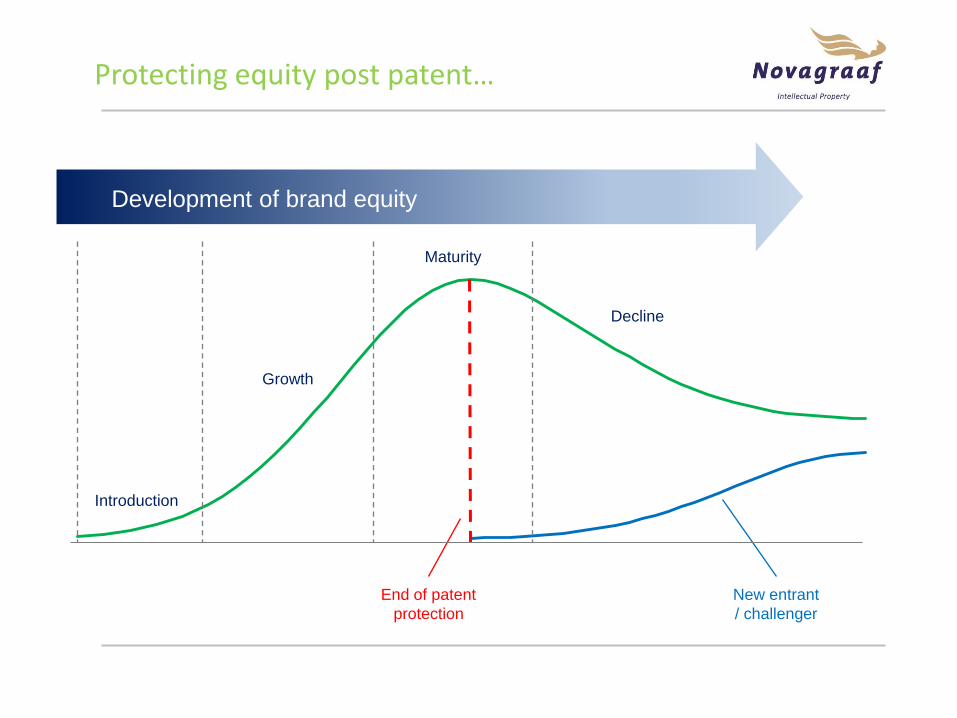
Protecting equity post patent…
Introduction
Growth
Maturity
Decline
End of patent
protection
New entrant
/ challenger
Development of brand equity

…and is critical in a crowded OTC market
How can brands
stand out from the crowd?
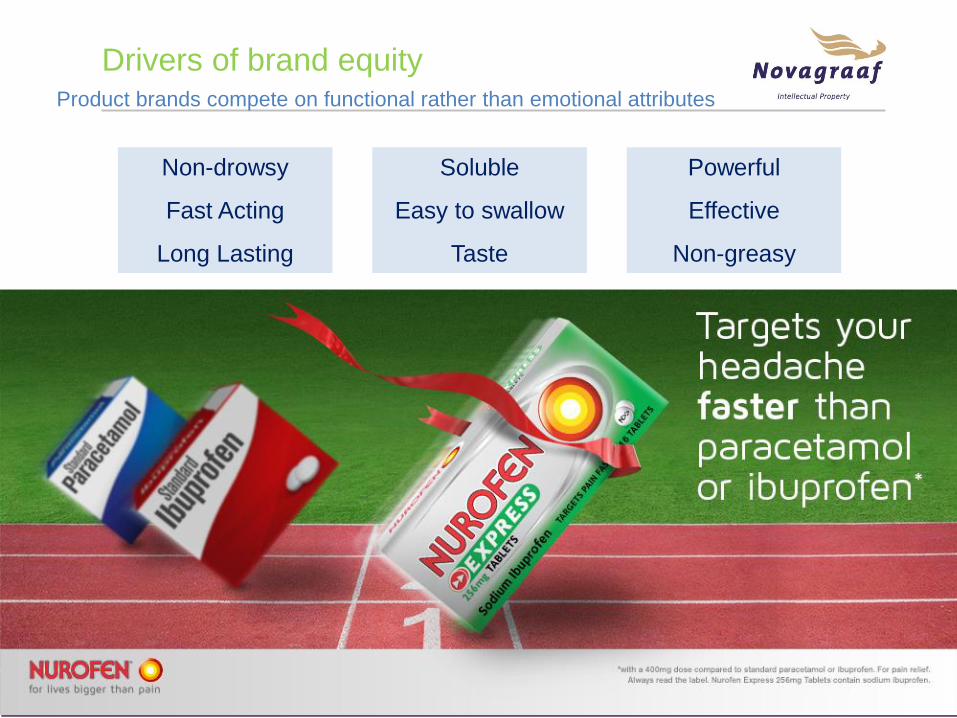
Drivers of brand equity Product brands compete on functional rather than emotional attributes
Non-drowsy
Fast Acting
Long Lasting
Soluble
Easy to swallow
Taste
Powerful
Effective
Non-greasy
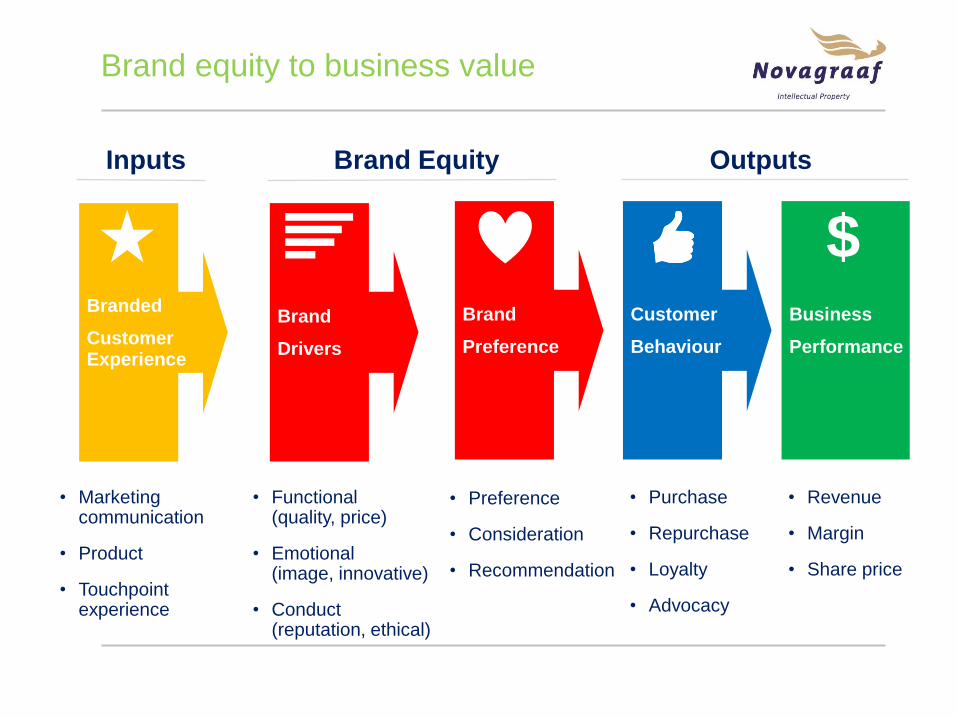
Brand equity to business value
Inputs Brand Equity Outputs
Business
Performance
Brand
Preference
Customer
Behaviour
• Marketing communication
• Product
• Touchpoint experience
Brand
Drivers
Branded
Customer Experience
$
• Functional (quality, price)
• Emotional (image, innovative)
• Conduct (reputation, ethical)
• Revenue
• Margin
• Share price
• Purchase
• Repurchase
• Loyalty
• Advocacy
• Preference
• Consideration
• Recommendation
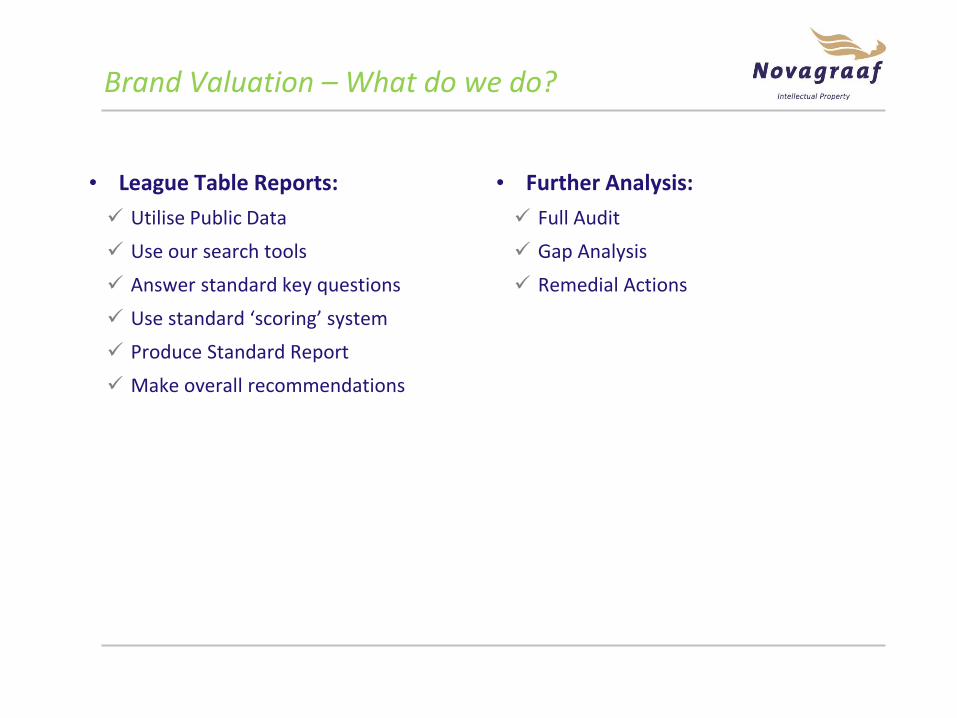
Brand Valuation – What do we do?
• League Table Reports:
Utilise Public Data
Use our search tools
Answer standard key questions
Use standard ‘scoring’ system
Produce Standard Report
Make overall recommendations
• Further Analysis:
Full Audit
Gap Analysis
Remedial Actions
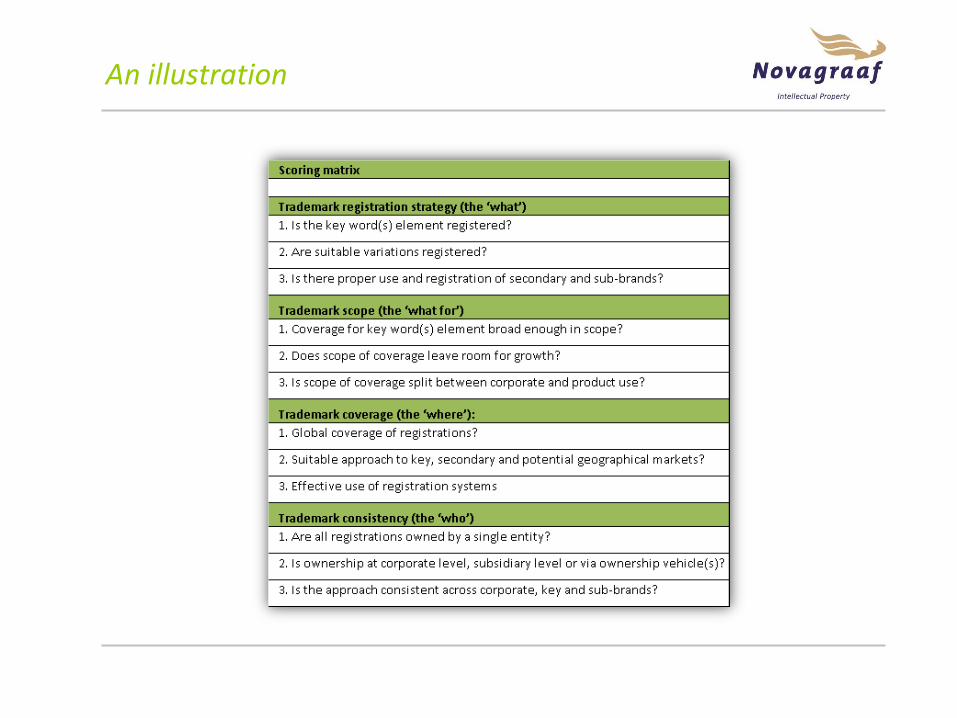
An illustration
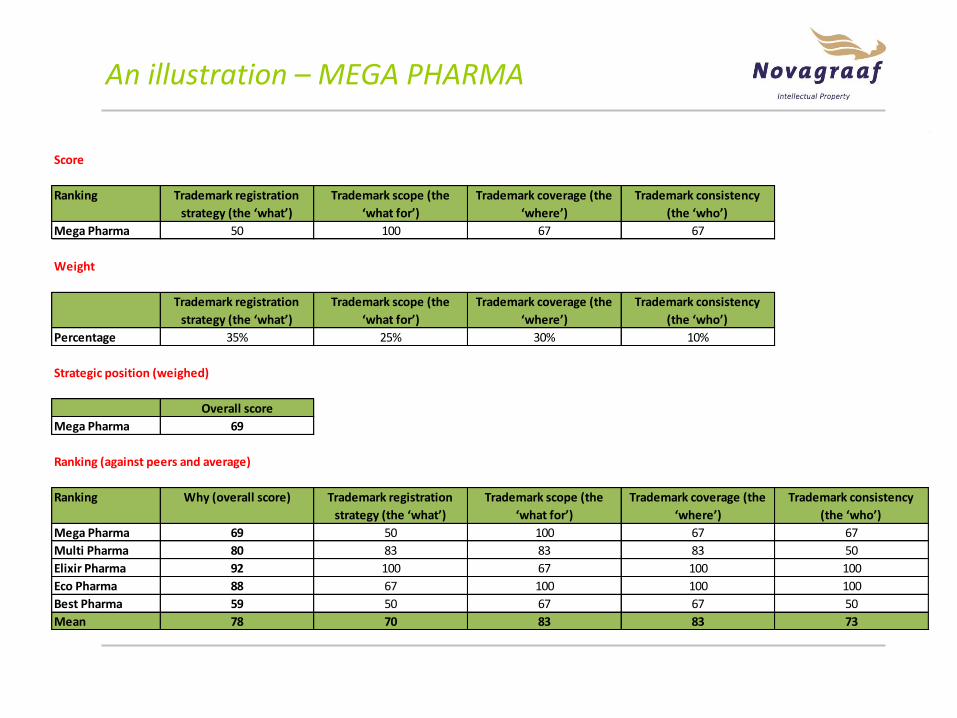
An illustration – MEGA PHARMA
Score
Ranking Trademark registration
strategy (the ‘what’)
Trademark scope (the
‘what for’)
Trademark coverage (the
‘where’)
Trademark consistency
(the ‘who’)
Mega Pharma 50 100 67 67
Weight
Trademark registration
strategy (the ‘what’)
Trademark scope (the
‘what for’)
Trademark coverage (the
‘where’)
Trademark consistency
(the ‘who’)
Percentage 35% 25% 30% 10%
Strategic position (weighed)
Overall score
Mega Pharma 69
Ranking (against peers and average)
Ranking Why (overall score) Trademark registration
strategy (the ‘what’)
Trademark scope (the
‘what for’)
Trademark coverage (the
‘where’)
Trademark consistency
(the ‘who’)
Mega Pharma 69 50 100 67 67
Multi Pharma 80 83 83 83 50
Elixir Pharma 92 100 67 100 100
Eco Pharma 88 67 100 100 100
Best Pharma 59 50 67 67 50
Mean 78 70 83 83 73

An illustration – MEGA PHARMA
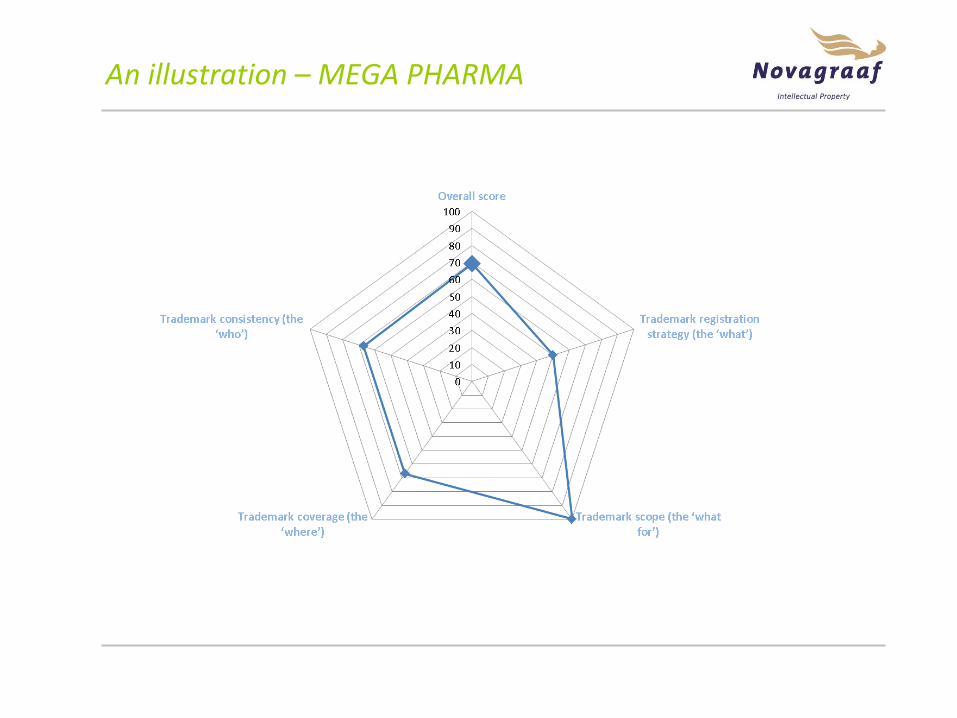
An illustration – MEGA PHARMA
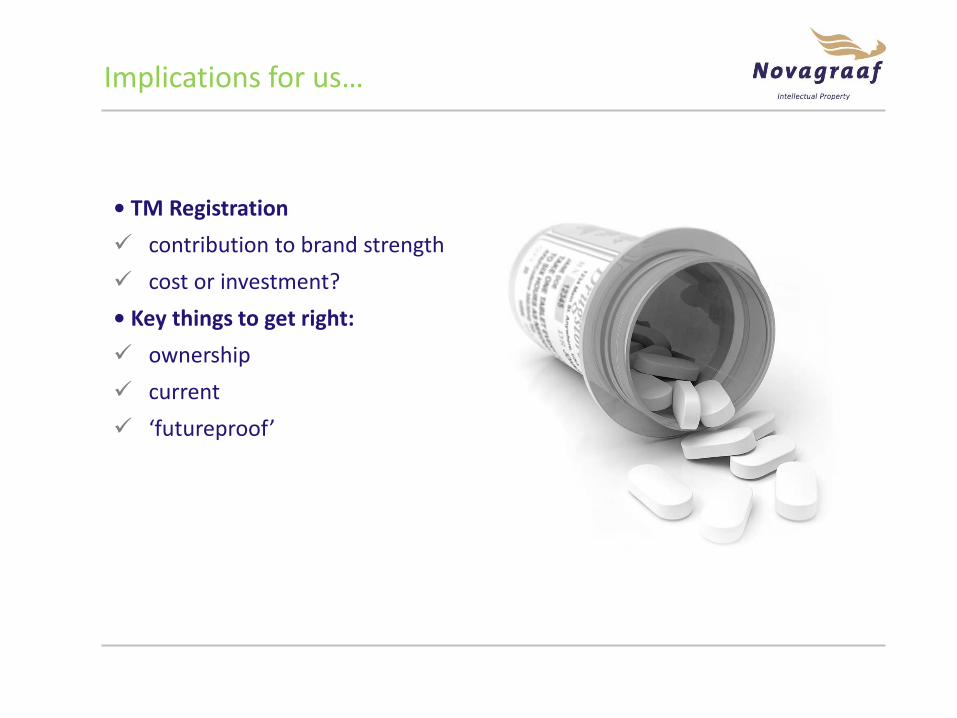
Implications for us…
• TM Registration
contribution to brand strength
cost or investment?
• Key things to get right:
ownership
current
‘futureproof’
Questions
Tom Farrand
Managing Director UK, Trademarks
T: +44 (0)20 74690950
W: www.novagraaf.com
• Registered TM Attorney
• Fellow of ITMA
• 30 years (gulp) in IP
• Specialist in IP protection strategy
Contact Details and Mini-Bio
Bibliography
ISO 10668 – link to obtain a copy:
http://www.iso.org/iso/catalogue_detail?csnumber=46032
ISO 10668 – link to overview from Brand Finance:
http://www.brandfinance.com/images/upload/iso_10668_overview.pdf
Brand Finance – website with league tables:
http://brandirectory.com/
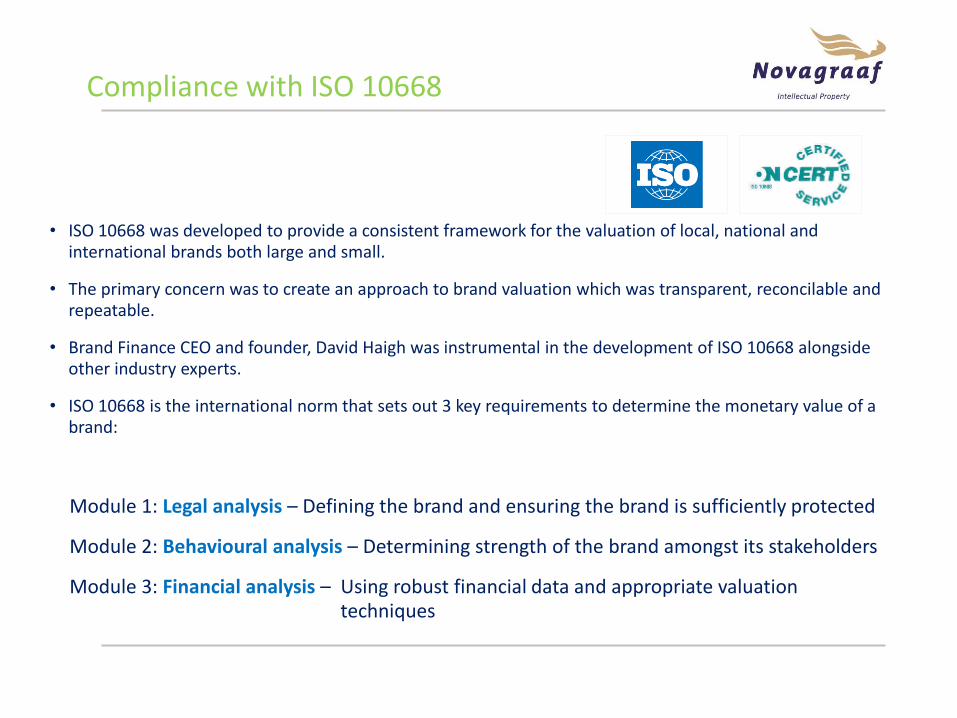
Compliance with ISO 10668
• ISO 10668 was developed to provide a consistent framework for the valuation of local, national and international brands both large and small.
• The primary concern was to create an approach to brand valuation which was transparent, reconcilable and repeatable.
• Brand Finance CEO and founder, David Haigh was instrumental in the development of ISO 10668 alongside other industry experts.
• ISO 10668 is the international norm that sets out 3 key requirements to determine the monetary value of a brand:
Module 1: Legal analysis – Defining the brand and ensuring the brand is sufficiently protected
Module 2: Behavioural analysis – Determining strength of the brand amongst its stakeholders
Module 3: Financial analysis – Using robust financial data and appropriate valuation techniques

• Price premium
• Volume premium
• Income split
• Multi-period excess earnings
• Incremental cash flow
• Royalty Relief
Cost Approach Income Approach
• Comparable market transactions
Market Approach
• Cost to create
• Cost to recreate
• Within the Income approach, ‘relief from royalty’ is considered to be the most robust and effective method and is regularly used for accounting, tax and legal matters.
• The royalty relief approach hypothesises two separate businesses, one involved in manufacturing and/or marketing and one in intangible asset ownership.
• The asset owner licenses its IP to the manufacturer/ marketing company and receives a royalty in return based on the value/ volume of sales arising from the asset in question. Thus, if a company actually owns rather than licenses an asset it is relieved from paying such royalties.
• Part of the appeal of the Royalty Relief method is that real world publically available licensing agreements and financial data can be used to conduct the valuation.
ISO 10668 Market, Cost or Income Approaches
For the public league tables the Royalty Relief method is employed.
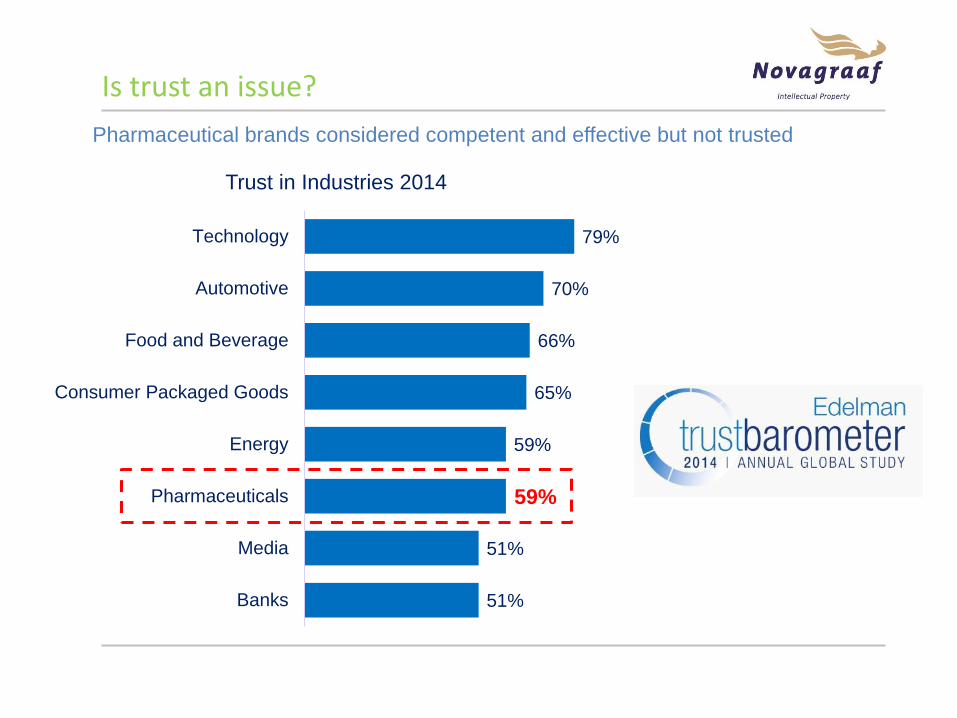
Is trust an issue?
Pharmaceutical brands considered competent and effective but not trusted
79%
70%
66%
65%
59%
59%
51%
51%
Technology
Automotive
Food and Beverage
Consumer Packaged Goods
Energy
Pharmaceuticals
Media
Banks
Trust in Industries 2014
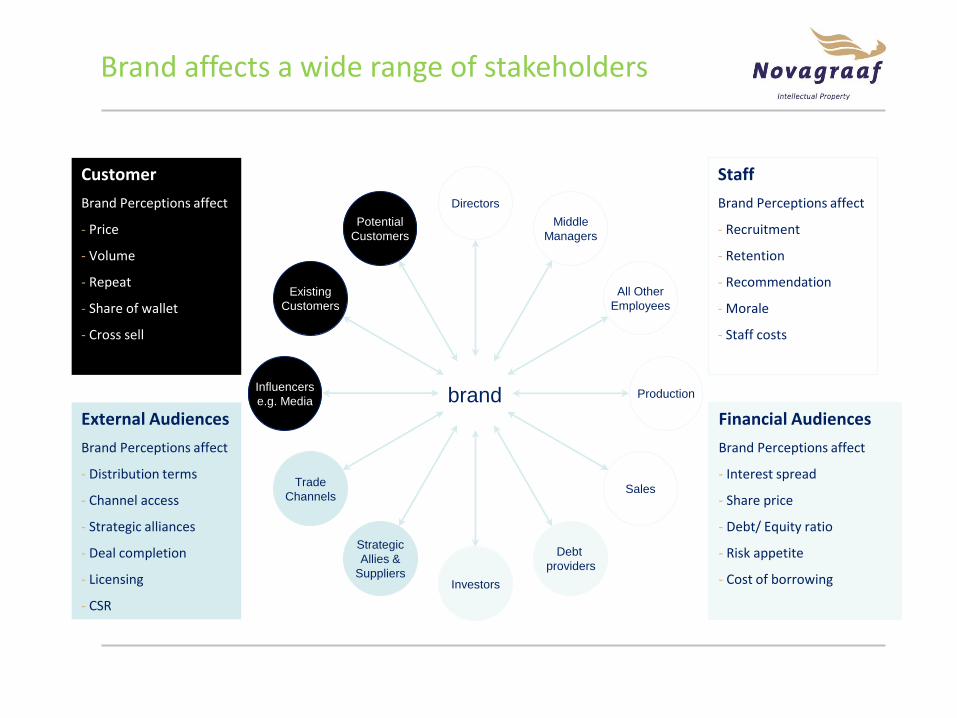
Customer
Brand Perceptions affect
- Price
- Volume
- Repeat
- Share of wallet
- Cross sell
External Audiences
Brand Perceptions affect
- Distribution terms
- Channel access
- Strategic alliances
- Deal completion
- Licensing
- CSR
Staff
Brand Perceptions affect
- Recruitment
- Retention
- Recommendation
- Morale
- Staff costs
Financial Audiences
Brand Perceptions affect
- Interest spread
- Share price
- Debt/ Equity ratio
- Risk appetite
- Cost of borrowing
Potential
Customers
Existing
Customers
Influencers
e.g. Media
Trade
Channels
Strategic
Allies &
Suppliers Investors
Debt
providers
Sales
Production
All Other
Employees
Middle
Managers
Directors
brand
Brand affects a wide range of stakeholders