boundary layer pro le behind gaseous detonation as...
TRANSCRIPT

Boundary Layer Profile Behind Gaseous Detonation as
it Affects Reflected Shock Wave Bifurcation
J. Damazo,∗ J. Odell,† and J. E. Shepherd‡
California Institute of Technology, Pasadena, CA, 91125, USA
The present study explores the flow field created by reflecting detonations using heattransfer and pressure measurements near the location of detonation reflection. Schlierenimaging techniques are used to examine the possibility of shock wave–boundary layer in-teraction. These measurements are compared to laminar boundary layer theory and a one-dimensional model of detonation reflection. Experiments were carried out in a 7.6 m longdetonation tube with a rectangular test section using mixtures of stoichiometric hydrogen–oxygen with argon dilution of 0, 50, 67, and 83% at an initial pressure of 10, 25, and40 kPa. Optical observations show that minimal interaction of the reflected shock waveresults when propagating into the boundary layer created by the incident wave. The heattransfer rate is qualitatively consistent with the time dependent laminar boundary layerpredictions, however the magnitude is consistently larger and substantial (factor of three)peak-to-peak fluctuations are observed. The pressure measurements show good agreementbetween predicted ideal incident and reflected wave speeds. The pressure amplitudes areunder-predicted for no argon dilution cases particularly at 40 kPa, but in reasonable agree-ment for lower pressures and higher dilutions.
Nomenclature
Subscripts1 Initial experimental conditions2 Post-detonation (Chapman–Jouguet) conditions3 Burned equilibrium conditions
Symbolsη Similarity variable used in the solution to the laminar boundary layer equationsγ Ratio of specific heatsν Kinematic viscosity
c Fluid sound speedcp Specific heat at constant pressuref Non-dimensionalized velocity used in the similarity solution to the laminar boundary layer equationsh Enthalpyk Fluid heat conductivityp PressurepR Pressure at the reflecting end-wallq Heat transfer per unit areau Fluid velocityRe Reynolds number∗PhD Candidate at the Graduate Aerospace Laboratories California Institute of Technology, 1200 E California Blvd, MC
105-50, Pasadena, CA, 91125. AIAA student member.†Senior Mechanical Engineer at the California Institute of Technology, 1200 E California Blvd, MC 105-50, Pasadena, CA,
91125. AIAA student member.‡C.L. “Kelly” Johnson Professor of Aeronautics and Professor of Mechanical Engineering at the Graduate Aerospace Labo-
ratories California Institute of Technology, 1200 E California Blvd, MC 105-50, Pasadena, CA, 91125. AIAA senior member.
1 of 14
American Institute of Aeronautics and Astronautics

Re1 Reynolds number evaluated 1 m behind the detonationSt Stanton numberT TemperatureUI Measured incident detonation speedUCJ Theoretical Chapman–Jouguet detonation speed
I. Introduction
Aparticularly important situation in laboratory testing or accidental explosions is the initiation of aflame followed by deflagration to detonation transition (DDT), resulting in a detonation propagating
in a piping system.1 Gaseous detonations2,3 inside piping or vessels create both structural and thermalloads and in extreme cases may lead to plastic deformation or rupture.4 When the detonation reaches aclosed end, the boundary condition of zero flow velocity leads to the creation of a reflected shock wavethat propagates back towards the point of ignition.5 The speed and strength of this reflected shock wavechanges with time as the shock propagates through the unsteady Taylor–Zel’dovich wave.6,7 The reflectedshock wave is also complicated by the possibility of interaction with the boundary layer created by the flowinduced by the incident gaseous detonation.8 Recent work in our laboratory by Karnesky et al.,4,8 hassuggested that the internal pressure and resulting plastic deformation of thin-walled cylindrical shells due tointernal detonation loading is influenced by these viscous effects. There is evidence that the boundary layercreated by the fluid motion induced by the detonation interacts with the reflected shock wave created whenthe detonation normally impinges upon a planar wall. The goal of this paper is to present analytical andexperimental findings on the behavior and nature of the boundary layer induced by the detonation and itseffects on the reflected shock wave created when a detonation normally impinges upon an end wall.
Reflected shock wave bifurcation occurs when a normally reflected shock wave splits into a lambda shockas shown in Figure 1 due to interaction with the boundary layer created by the incident shock. Previousresearchers have extensively examined bifurcation in shock tubes as it pertains to shock tube performance.9–12
Mark developed the foundational theory that explains and predicts under what conditions bifurcation willoccur.9 Mark shows that gases exhibiting a low ratio of specific heats, γ, bifurcate under the widest rangeof conditions; this suggests that reflected detonations, which have an especially low value for γ, will readilybifurcate and makes bifurcation a likely candidate for explaining the two-dimensional effects observed in ourlaboratory’s previous work. However, Mark’s analysis assumes the temperature is constant and equal to theinitial conditions. This assumption is invalid for the detonation case and is one of the motivations for thisstudy of the boundary layer behind a detonation and interaction with the reflected shock wave.
u(x,y,t) + UR(t)
Slip Line
UR(t)
UR(t)
Primary Reflected Shock
Obl
ique
Foo
t
Separated Bubble Boundary Layer
Flow Induced by Incident Wave
!"
#"
UR(t)
Point of Bifurcation
Figure 1. Archetypical reflected shock wave bifurcation sketched in the shock fixed frame.
Numerous researchers have studied boundary layer growth behind shock waves. Mirels13,14 developedmuch of the pioneering work on boundary layer growth behind shock waves. Sturtevant and Okamura15
2 of 14
American Institute of Aeronautics and Astronautics
solved the boundary layer equation in the shock-fixed frame and explored the effects of shock strength onthe boundary layer profile. Liu et al.16 applied boundary layer analyses to the case of hemi-spherical blastand detonation waves. Here we adapt these models of boundary layer development behind shock waves tothe case of boundary layer growth behind detonation. We compare the results to pressure and heat fluxmeasurements recorded during gaseous detonation experiments of stoichiometric hydrogen–oxygen at varyinginitial pressure and varying argon dilution, conditions which result in varying free-stream conditions as wellas detonation cell size. Alongside these measurements we present schlieren photographs of the incidentdetonation and reflected shock. These pictures reveal novel behavior of the shock wave where it is madeup of multiple shock waves. The photographs further reveal the presence of shock wave–boundary layerinteraction over a range of argon dilutions.
II. Analytical Formulation
One approach to modeling the detonation reflection process is numerical simulation of reacting viscouscompressible flows.17–20 Previous studies on reflecting shock waves9,21 however, suggest that much may begained in understanding the shock wave–boundary layer interaction by applying simple models in analyzingthe boundary layer growth and propagation of the reflected shock wave. As a first step, we apply previousmodels for boundary layer growth and detonation reflection to the experimental cases of stoichiometrichydrogen–oxygen detonations with argon dilution. At the present stage, we are still developing an analyticalmodel that includes the strong property variations within the boundary layer and the present experimentalresults serve to inform our efforts in that direction.
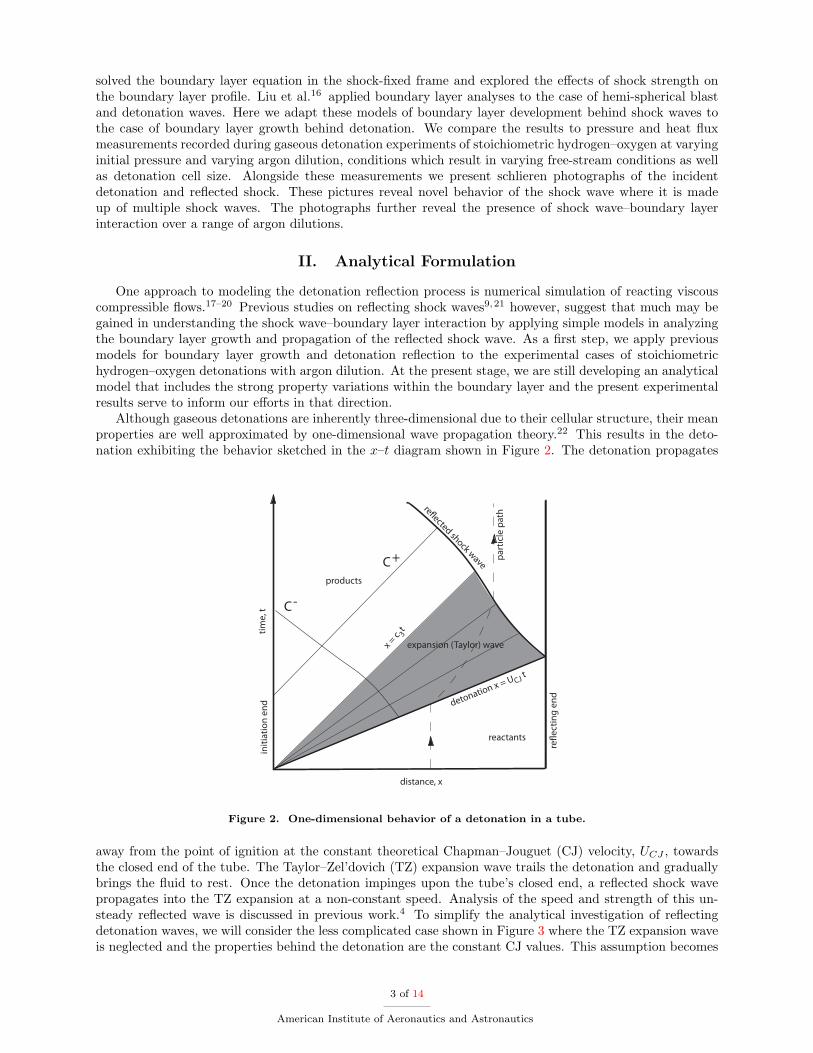
Although gaseous detonations are inherently three-dimensional due to their cellular structure, their meanproperties are well approximated by one-dimensional wave propagation theory.22 This results in the deto-nation exhibiting the behavior sketched in the x–t diagram shown in Figure 2. The detonation propagates
C-
detonation x = UCJ t
re�ected shock waveC+
expansion (Taylor) wave
reactants
products
distance, x
re�e
ctin
g en
d
time,
t
part
icle
pat
h
x = c 3
t
initi
atio
n en
d
Figure 2. One-dimensional behavior of a detonation in a tube.
away from the point of ignition at the constant theoretical Chapman–Jouguet (CJ) velocity, UCJ , towardsthe closed end of the tube. The Taylor–Zel’dovich (TZ) expansion wave trails the detonation and graduallybrings the fluid to rest. Once the detonation impinges upon the tube’s closed end, a reflected shock wavepropagates into the TZ expansion at a non-constant speed. Analysis of the speed and strength of this un-steady reflected wave is discussed in previous work.4 To simplify the analytical investigation of reflectingdetonation waves, we will consider the less complicated case shown in Figure 3 where the TZ expansion waveis neglected and the properties behind the detonation are the constant CJ values. This assumption becomes
3 of 14
American Institute of Aeronautics and Astronautics

!"#$
%&$
'&$(&$
!"#$%&'$"()*"(+,"(&-*"(#+
&'$"()*"(+
.'),$)($#+
/+
0+
1"2(&).0+3)0'.+
%)+4+5+
')$()+
!"#$%&
'(&
)(&
!"#"$%"&'()*$+'
,'
-'
''.'/'
)"#$%'
0*12&34-'53-"4'
(a) (b)
Figure 3. Relevant fluid dynamic and thermodynamic parameters involved in the detonation reflection processshown in the lab-fixed frame of reference used in all mathematical derivations presented herein sketched(a) before and (b) after detonation reflection occurs.
more accurate as the gradients in the TZ wave become smaller which occurs in long detonation tubes suchas the 7.6 m long GALCIT Detonation Tube (GDT) discussed in Section III.
A. Boundary Layer Analysis
For the configuration shown in Figure 3, we can develop an approximate analytical laminar boundary layersolution to predict the boundary layer profile and heat transfer to the wall up until the arrival of the reflectedshock wave. Let us suppose the detonation is initiated at x = 0, t = 0. In front of the detonation, t > x/UCJ ,the gas is stationary at initial pressure p1 and temperature T1. Behind the detonation, t < x/UCJ , thefree-stream properties are the computed Chapman–Jouguet post-detonation properties p2 and T2. The free-stream properties (written with a sub-script 2) are used to define laminar boundary layer solution parametersand are calculated with the shock and detonation toolbox.23 Through the Levy–Lees transformation,24 thetwo-dimensional compressible laminar boundary layer equations can be transformed with the similarityvariable η where
η(x, y, t) =1
δ(x, t)
∫ y
0
ρ(x, y′, t)ρ2
dy′ (1)
and δ is the boundary layer thickness written in the lab-fixed frame
δ(x, t) =
√ν2
(t− x
UCJ
). (2)
Assuming that the detonation products behave as a perfect gas, the analysis results in an ordinary differentialequation in η which may be solved to yield the fluid velocity:
0 = f ′′′ +12
(η − u2
UCJf
)f ′′ (3)
using
f(η) =∫ η
0
u(η′)u2
dη′ (4)
and u2 is the fluid velocity behind the detonation. Although Equation (3) does allow for varying densityand viscosity through the boundary layer, we make the simplifying assumption that
ρµ
ρ2µ2= C = 1 (5)
4 of 14
American Institute of Aeronautics and Astronautics

where C is the Chapman–Rubesin parameter. The boundary conditions are that of zero flow velocity at thewall and uniform velocity u2 as η →∞
f(0) = f ′(0) = 0 (6)limη→∞
f ′(η) = 1. (7)
Applying the boundary layer analysis to the conservation of energy equation results in
0 =1Pr
g′′ +u2
2
h2f ′′2 +
12
(η − u2
UCJf
)g′ (8)
where Pr is the Prandtl number and is assumed to equal 0.7, h is enthalpy, and, for a perfect gas,
g(η) =h(η)h2
=T (η)T2
. (9)
The boundary conditions are given by the wall temperature and free-stream enthalpy
h(0) = hw = cp,2Tw (10)limη→∞
h(η) = 1. (11)
Equations (9) and (10) use h = cp,2T and assume that the specific heat is constant behind the detonationfront and the effects of chemical reaction are negligible. In general, the flow within the boundary layer isreacting and non-equilibrium, which requires a numerical solution and the resulting flow field is not self-similar.
The solutions to Equations 3 and 8 were obtained using the Matlab function ode45 combined with ashooting technique to implement the boundary conditions. Once the temperature profile was known, theheat flux to the wall was computed using
q̇ = kdT
dy
∣∣∣∣y=0
(12)
where k is the thermal conductivity in the fluid. This predicted heat flux is compared with the measuredheat flux behind detonations in Section IV.
B. Detonation Reflection
A semi-empirical model has been developed4,25 in our laboratory that predicts the speed and strength of areflected detonation. The relevant portion of the model is that the speed of the reflected detonation is givenby
UR(t) = −u(x, t) + c(x, t)
√1 +
γ + 12γ
[pR(t)p(x, t)
− 1]
(13)
where theoretical values for post-detonation fluid velocity u, sound speed c, pressure p, and ratio of specificheats γ are calculated using Cantera 1.826 and the pressure behind the shock is given by
pR(t) = (pCJ,ref − p3) exp[− t− t0
τ
]+ p3 (14)
where t0 is the time of reflection, τ is a time constant corresponding to the pressure decay caused by the TZexpansion, the final equilibrium pressure p3 is calculated using Cantera and the theoretical peak reflecteddetonation pressure, pCJ,ref is calculated using the Shock and Detonation Toolbox.23 For a very longdetonation tube, such as considered here, τ � t− t0 implying that pR may be approximated as
pR(t) = pCJ,ref (15)
5 of 14
American Institute of Aeronautics and Astronautics

and
UR = UR,CJ (16)
which is also computed using the shock and detonation toolbox,23 values for the present experiments aregiven in Table 1.
III. Experimental Setup
Experiments were performed in the GALCIT Detonation Tube (GDT)27 shown in Figure 4. The GDT isa 7.6 m long, inner diameter 280 mm detonation tube equipped with a test section of 150 mm wide squarecross-section and two quartz windows to provide optical access. The tube was initially evacuated and thenfilled via the method of partial pressures to the desired composition. The experimental work presentedherein is a stoichiometric hydrogen–oxygen mixture diluted with varying amounts of argon at varying initialpressure as given in Table 1. These run conditions were chosen to give a range of cell sizes and post-detonation temperatures allowing us to examine these effects on the wave reflection process. Increasing theinitial pressure decreases the cell size from approximately 14 mm28 for an initial pressure of 10 kPa to 3 mmfor an initial pressure of 40 kPa.29 Argon dilution increases the cell size and decreases the post-detonationtemperature.
The experiment was initiated by injecting a mixture of acetylene–oxygen into the ignition end of the GDTfor a duration of 4.5 s. This injection was followed by a 1 s settling period before a 2 µF capacitor chargedto 9 kV discharged through an 80 µm diameter copper wire located in the ignition end of the GDT. Thisvaporized the copper wire and created a blast wave in the acetylene–oxygen, thereby initiating a detonation.This wave propagated into the H2–O2 mixture where it decayed in speed to the Chapman-Jouguet speed.
After ignition, a detonation enters the test section shown in Figure 5(a).30 A splitter plate was constructed(see Figure 5(b)) that raised the location of the boundary layer into the center of the windows. This splitterplate was instrumented with 12 PCB 113B26 pressure transducers and 12 surface junction thermocouplesidentical to those employed by Sanderson and Sturtevant31 for measuring heat flux inside the test section.The thermocouples are connected to a TrikTek Model 205B instrumentation amplifier with a response timeof 7.5 µs to a unit step input. In comparing this response time to the signal response, it seems that the gaugeresponse time is sufficiently small so that the amplifiers dominate the overall response time. The gaugesthemselves are hand made and may have considerable differences in response. Calibration efforts along thelines of Mohammed et al.32,33 would be necessary to better deduce the gauge response. The spectral methodemployed by Sanderson and Sturtevant31 for reducing the heat flux data is also employed here. The locationsof all gauges are given on the all relevant plots.
A Z-type schlieren system is used to visualize the incident detonation and shock wave reflection. Theschlieren system consists of a pulsed EverGreen 70 PIV laser with a pulse width duration less than or equalto 10 ns and a Cooke PCO.2000 digital 14 bit CCD camera system. This allows two images to be taken inquick succession and was used to visualize the incoming detonation and the reflected shock wave for eachtest.
7.6 m
Figure 4. Schematic of the GALCIT Detonation Tube in which detonation experiments were performed (formore information, see Akbar 199727).
6 of 14
American Institute of Aeronautics and Astronautics

12.7 mm
12.7 mm
76.2 mm
(a) (b)
Figure 5. Detail views of the test section for the GDT; dimensions in mm. (a) Location of viewing windowrelative to end-wall. (b) Pressure and thermocouple gauge locations relative to end-wall.
Table 1. Run conditions with measured incident shock speed UI , theoretical CJ detonation speed UCJ , fluidvelocity u2, temperature behind the incident wave T2, equilibrium ratio of specific heats γe,2 behind the incidentwave,34 unit Reynolds number, mean measured reflected shock speed over the first 127 mm Stof reflected wavepropagation, and computed reflected shock speed.
Initial Pressure Argon dilution UIa UCJ
b u2b T2
b γe,2b Re1
c UR,measa UR,comp
d
(kPa) (m/s) (m/s) (m/s) (K) (m/s) (m/s)
10.0 0% 2702 2719 1239 3272 1.12 0.49 · 106 1005 102650.0% 1838 1854 827 3055 1.15 0.64 · 106 699 71766.7% 1681 1664 737 2892 1.18 0.66 · 106 688 668
25.0 0% 2763 2760 1260 3425 1.12 1.20 · 106 1038 104950.0% 1865 1872 840 3179 1.15 1.56 · 106 709 73666.7% 1684 1691 745 2992 1.19 1.62 · 106 686 68683.3% 1435 1457 589 2474 1.35 1.43 · 106 720 661
40.0 0% 2792 2786 1270 3508 1.12 1.90 · 106 1033 106150.0% 1888 1889 846 3245 1.16 2.47 · 106 728 74666.7% 1699 1705 750 3045 1.20 2.57 · 106 701 69683.3% 1445 1462 588 2489 1.37 2.25 · 106 720 670
a Measured using time of arrival from PCB pressure transducers.b Computed using Cantera 1.826 and the Shock and Detonation Toolbox.23c Computed using Equation (17) at time t − ta = 1 m/UCJ corresponding to a location 1 m behind thedetonation.d Computed using the ideal reflection model described in the shock and detonation toolbox.23
7 of 14
American Institute of Aeronautics and Astronautics

0
0.02
0.04
0.06
0.08
0.1
0.12
0.14
Dist
ance
from
refle
ctin
g en
d [m
]
−0.1 0 0.1 0.2 0.3 0.4 0.5 0.6
0
50
Time [ms]
Heat Flux [MW
/m2]
0
50
ExperimentModel
0
0.01
0.02
0.03
0.04
0.05
0.06
0.07
0.08
0.09
Dist
ance
from
refle
ctin
g en
d [m
]
−0.1 −0.05 0 0.05 0.1 0.15 0.2
0
1
Time [ms]
Pressure [MPa]
0
1
ExperimentModel
(a) (b)
Figure 6. Results for a stoichiometric hydrogen–oxygen detonation of initial pressure 25 kPa with 0% argondilution. Experimental measurements (blue) are compared to (a) the laminar boundary layer heat flux modeldiscussed in Section II A and (b) the one-dimensional pressure model discussed in Section II B and
IV. Discussion
Figure 6 portrays results for 0% argon dilution; this case has the largest discrepancy between observedand computed reflected shock pressures of the cases examined in this paper. The heat flux plot in Fig-ure 6(a) shows the heat transfer measurements compared to the laminar boundary layer theory describedin Section II A. The incident detonation is clearly marked by a spike in both measured and predicted heattransfer. The reflected detonation is much less clear and plays only a lesser role in the heat flux measure-ments. The heat-flux model is only valid for times before the arrival of the reflected shock. Figure 7 plotsthe heat-flux data in a St–Re plot where the Stanton and Reynolds35 numbers are computed from
Re =ρ2u
22 (t− ta)µ2
(17)
St =q̇
(h2 − hw) ρ2u2(18)
where ta is the arrival time of the detonation. We observe that for times after the response time of thegauge and before the arrival of the reflected shock, the laminar theory does an adequate job of predictingthe measured heat transfer. This suggests that the boundary layer is in fact laminar for this duration. Usinga turbulent transition Reynolds number of35 ReT ≈ 6 · 105 it is perhaps no surprise that transition doesnot occur before the arrival of the reflected shock (which corresponds to Reref = 5.5 · 105 for the undilutedinitial pressure 25 kPa detonation). However a substantial difference between shock and detonation wavesis the presence of transverse waves behind detonations. This work indicates that the transverse waves donot significantly effect turbulent transition for the mixtures tested. This agrees with the work of Liu et al.16
who found reasonable qualitative agreement with the experimental work of Laderman et al.36 with a laminarboundary layer model applied to hydrogen–oxygen mixtures of initial pressure 1 atm. The best agreementwith the experimental measurements comes from a power law curve fit from Hartunian37 as denoted by the
8 of 14
American Institute of Aeronautics and Astronautics

subscript H:
StH,lam =0.8√Re
StH,turb =3.7 · 10−2
Re1/5.
This fit is also plotted on Figure 7.
105
106
10−4
10−3
10−2
Re
St
2−D BL theoryHartunian LaminarHartunian Turbulent
(a)
104
105
10−3
10−2
Re
St
2−D BL theoryHartunian LaminarHartunian Turbulent
105
106
10−4
10−3
10−2
Re
St
2−D BL theoryHartunian LaminarHartunian Turbulent
(b) (c)
Figure 7. Stanton–Reynolds plot comparing measured and computed heat flux for a stoichiometric hydrogen–oxygen detonation with 0% argon dilution at a distance of 127 mm from the reflecting end wall; initial pressure(a) 25 kPa, (b) 10 kPa, and (c) 40 kPa. The dashed black line indicates the arrival of the reflected wave.
The trend of agreement with the laminar boundary layer theory is seen for all initial pressures tested asobserved in Figures 7(b), 7(c), and 8 with the largest differences occurring in the 10 kPa initial pressure casewhere the Reynolds number is smaller and the cell size larger than the other considered cases. We also seeon each heat flux graph that the heat transfer is under-predicted near the location of detonation reflectionindicating the wave reflection process and resulting fluid dynamics are more complicated than incorporatedinto the simple two-dimensional laminar boundary layer theory.
Examining the corresponding pressure plot, Figure 6(b), we observe two sharp increases in pressure foreach measurement location. The first increase is due to the incident detonation; following this rise are high-frequency pressure oscillations corresponding to the transverse waves associated with gaseous detonations.The second increase occurs from the reflected shock wave propagating back towards the location of ignition.Plotted with the experimental data are the predictions of the model introduced in Section II B. We see thatthe arrival time and resulting pressure of the incident detonation is well-predicted by the one-dimensional
9 of 14
American Institute of Aeronautics and Astronautics

0
0.02
0.04
0.06
0.08
0.1
0.12Dist
ance
from
refle
ctin
g en
d [m
]
−0.2 0 0.2 0.4 0.6
020
Time [ms]
Heat Flux [MW
/m2]
020Experiment
Model
0
0.02
0.04
0.06
0.08
0.1
0.12
0.14
Dist
ance
from
refle
ctin
g en
d [m
]
−0.2 0 0.2 0.4 0.6
050
Time [ms]
Heat Flux [MW
/m2]
050Experiment
Model
(a) (b)
Figure 8. Heat flux measurements for detonations of stoichiometric hydrogen–oxygen with 0% argon dilutionat initial pressure (a) 10 kPa and (b) 40 kPa.
Chapman–Jouguet theory. The reflected shock wave, however, is not adequately described by the pressuremodel. The reflected shock speed is within 8% of the predicted value in the highest dilution case and 3% forthe undiluted case. However the reflected shock pressure is under predicted by up to 40% in the undilutedcases and up to 6% in the argon dilution cases. This trend of accurate arrival time, but inaccurate pressuresis the same as observed in earlier work4 and initially suggested the possibility of shock wave–boundarylayer interaction. Figure 9 shows the schlieren image corresponding to the graphs plotted in Figure 6 withFigure 9(a) showing the incident detonation propagating to the right and Figure 9(b) showing the reflectedshock wave propagating back to the left. As is observed in the schlieren photographs, there is no significantshock wave–boundary layer interaction.
(a) (b)
Figure 9. Schlieren images showing (a) incident detonation and (b) reflected shock wave for a stoichiometrichydrogen–oxygen detonation with no argon dilution at initial pressure 25 kPa.
Another feature of note in the pressure signals is that the rise time of the pressure signals throughthe reflected shock wave occurs over several microseconds–slower than would be expected from a shock.This corresponds to the reflected shock wave being apparently composed of multiple shocks as observed inFigures 9 and 10. The source of these shocks is not fully understood. The spacing does not seem to be a
10 of 14
American Institute of Aeronautics and Astronautics

strong function of cell size as observed by essentially no change in the wave thickness for initial pressuresof 10 kPa (approximately 14 mm cell width28) and 40 kPa (approximately 3 mm cell width29) as seen inFigure 10.
(a) (b)
Figure 10. Schlieren images for stoichiometric hydrogen–oxygen detonations with no argon dilution at initialpressure (a) 10 kPa and (b) 40 kPa.
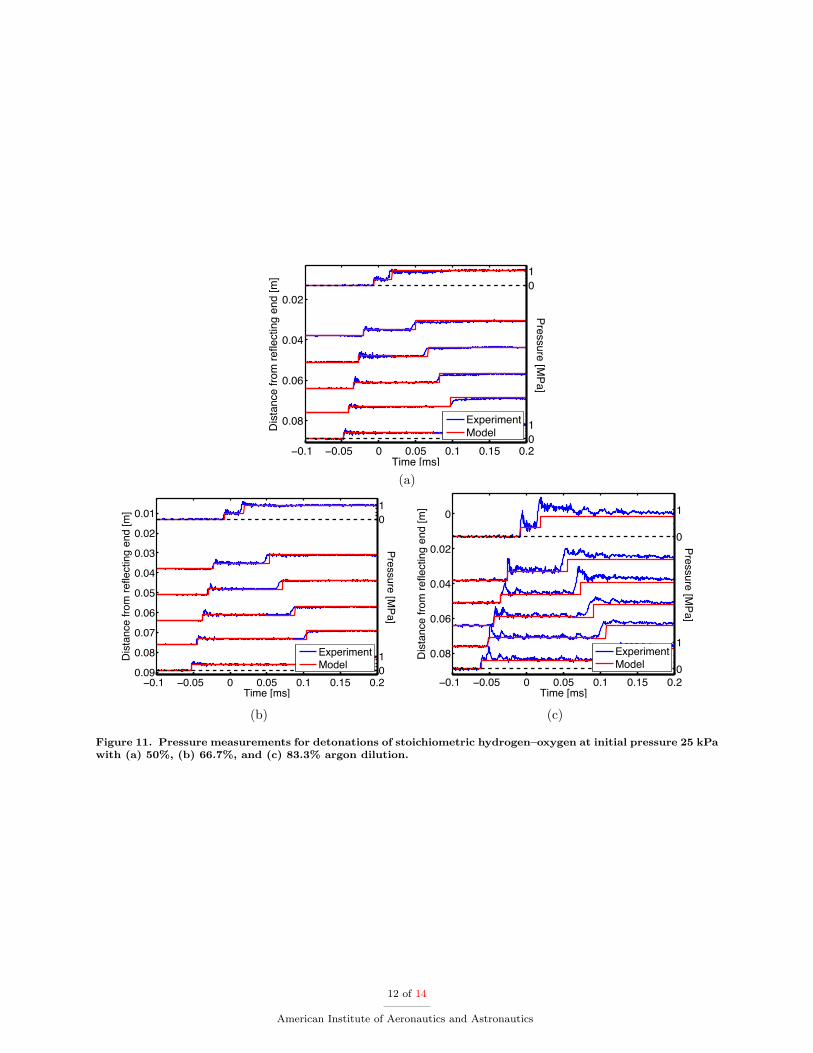
We next examine the effects of argon dilution. Pressure traces for detonations in hydrogen–oxygen–argonat 25 kPa and argon dilutions of 50, 66.7, and 83.3% is given in Figure 11. We observe that the pressuresignals are much better predicted by the analytical pressure model. This result is still under investigation;one significant point is that the effect of adding argon is to decrease the post-detonation temperature. Theeffect of the transverse waves on the wall pressure are clearly observed in the 83% argon dilution case shownin Figure 11(c) as additional pressure waves behind the incident detonation and in a decrease in the frequencyof the pressure signals after the arrival of the detonation.
The schlieren images corresponding to the pressure measurements of Figure 11 are shown in Figure 12.Here we observe the general trend of the reflected shock wave becoming gradually thicker from 1.9 mm at 0%argon dilution to 2.6 mm at 83.3% argon dilution. We also observe a small amount of shock wave–boundarylayer interaction for the 50 and 66.7% argon dilution cases as marked by the shock wave angling to theleft near the floor of the detonation tube. This effect was unexpected due to the fact that argon is known9
to inhibit boundary layer interaction in shock tubes due to the increase in γ; however there is no visibleboundary layer interaction in the 83.3% argon dilution case.
Although the measurements and schlieren images were not shown for the remaining test cases, similarqualitative trends were observed in both pressure measurements and schlieren images. The largest differencein the remaining data is that the heat flux measurements became less useful at higher dilutions and lowerpressures due to the decreased signal amplitude resulting in an unfavorable signal-to-noise ratio.
V. Conclusions
The heat flux to the tube wall and wall pressure are investigated behind stoichiometric hydrogen–oxygendetonations. Laminar boundary layer theory well-predicts the heat transfer observed behind gaseous deto-
11 of 14
American Institute of Aeronautics and Astronautics
0.02
0.04
0.06
0.08Dist
ance
from
refle
ctin
g en
d [m
]
−0.1 −0.05 0 0.05 0.1 0.15 0.2
01
Time [ms]
Pressure [MPa]
01Experiment
Model
(a)
0.01
0.02
0.03
0.04
0.05
0.06
0.07
0.08
0.09
Dist
ance
from
refle
ctin
g en
d [m
]
−0.1 −0.05 0 0.05 0.1 0.15 0.2
01
Time [ms]
Pressure [MPa]
01Experiment
Model
0
0.02
0.04
0.06
0.08Dist
ance
from
refle
ctin
g en
d [m
]
−0.1 −0.05 0 0.05 0.1 0.15 0.2
0
1
Time [ms]
Pressure [MPa]
0
1ExperimentModel
(b) (c)
Figure 11. Pressure measurements for detonations of stoichiometric hydrogen–oxygen at initial pressure 25 kPawith (a) 50%, (b) 66.7%, and (c) 83.3% argon dilution.
12 of 14
American Institute of Aeronautics and Astronautics

(a) (b) (c)
Figure 12. Schlieren images of stoichiometric hydrogen–oxygen detonations of initial pressure 25 kPa with(a) 50%, (b) 66.7%, and (c) 83.3% argon dilution.
nations for the 25 kPa and 40 kPa initial pressure cases. This suggests that the boundary layer for thesecases is laminar. The laminar theory is less accurate for the 10 kPa initial pressure case; the source of thisdiscrepancy is still under investigation.
The behavior of the reflected shock wave created when a detonation normally impinges upon an end wallis investigated. The ideal model of detonation reflection predicts the speed of the reflected wave within 3–8%.The pressure behind the reflected waves is substantially under predicted (up to 40%) for the undiluted cases,but the agreement is much better (within 6%) for the diluted cases. This trend was previously observedin the work of Karnesky et al.4 and was thought to be caused by shock wave–boundary layer interaction.The present work, however, discounts such interaction as the source of the discrepancy through schlierenphotographs taken of the reflected shock wave. Paradoxically, some degree of interaction is observed forargon dilutions of 50 and 67% although the ideal model more accurately predicts the pressure behind thereflected wave. These findings are puzzling and still under investigation.
Acknowledgments
This research is sponsored by the DHS through the University of Rhode Island, Center of Excellence forExplosives Detection. The authors would also like to thank Bahram Valiferdowsi for his help in designingthe splitter plate as well as the Caltech SURF program for sponsoring Jeff Odell.
References
1Shepherd, J. E., “Structural Response of Piping to Internal Gas Detonation,” Journal of Pressure Vessel Technology,Vol. 131, No. 3, June 2009, pp. 87–115.
2Lee, J. H. S., The Detonation Phenomenon, Cambridge University Press, 2008.3Fickett, W. and Davis, W. C., Detonation, University of California Press, Berkerely, CA, 1979.4Karnesky, J., Damazo, J., Shepherd, J. E., and Rusinek, A., “Plastic response of thin-walled tubes to detonation,” ASME
2010 Pressure Vessels and Piping Conference., ASME, 2010.
13 of 14
American Institute of Aeronautics and Astronautics

5Shepherd, J., Teodorcyzk, A., Knystautas, R., and Lee, J., “Shock Waves Produced by Reflected Detonations,” Progressin Astronautics and Aeronautics, Vol. 134, 1991, pp. 244–264.
6Taylor, G. I., “The Dynamics of the Combustion Products behind Plane and Spherical Detonation Fronts in Explosives,”Proc. Roy. Soc., Vol. A200, 1950, pp. 235–247.
7Zel’dovich, Y. B., “On the Theory of the Propagation of Detonations in Gaseous Systems,” JETP , Vol. 10, 1940, pp. 542–568, Available in translation as NACA TM 1261 (1950).
8Damazo, J., Ziegler, J., Karnesky, J., and Shepherd, J. E., “Investigating Shock Wave–Boundary Layer Interaction Causedby Reflecting Detonations,” Proceedings of the 8th ISPHMIE Conference, Yokohama, Japan, September 5-10 2010.
9Mark, H., “The Interaction of a Reflected Shock Wave with the Boundary Layer in a Shock Tube,” Tech. Rep. TM1418,National Advisory Committee for Aeronautics, March 1958.
10Strehlow, R. A. and Cohen, A., “Limitations of the Reflected Shock Technique for Studying Fast Chemical Reactionsand Its Application to the Observation of Relaxation in Nitrogen and Oxygen,” Journal of Chemical Physics, Vol. 30, No. 1,1959, pp. 257–265.
11Taylor, J. R. and Hornung, H. G., “Real Gas and Wall Roughness Effects on the Bifurcation of the Shock Reflected fromthe End Wall of a Tube,” Proceedings of the 13th International Symposium on Shock Tubes and Waves, Niagara Falls, USA,July 6-9 1981.
12Petersen, E. L. and Hanson, R. K., “Improved Turbulent Boundary-Layer Model for Shock Tubes,” AIAA Journal ,Vol. 41, No. 7, 2003, pp. 1314–1322.
13Mirels, H., “Boundary Layer Behind Shock or Thin Expansion Wave Moving Into Stationary Fluid,” NACA TN 3712,Lewis Flight Propulsion Laboratory, Cleveland, Ohio, 1956.
14Mirels, H., “Laminar Boundary Layer Behind a Strong Shock Moving Into Air,” NACA TN D-291, Lewis Flight PropulsionLaboratory, Cleveland, Ohio, 1961.
15Sturtevant, B. and Okamura, T. T., “Dependence of Shock-Tube Boundary Layers on Shock Strength,” The Physics ofFluids, Vol. 12, No. 8, 1969, pp. 1723–1725.
16Liu, W. S., Du, X. X., and Glass, I. I., “Laminar Boundary Layers Behind Detonation Waves,” Proceedings of the RoyalSociety of London Series A, Mathematical and Physical Sciences, Vol. 387, No. 1793, June 1983, pp. 331–349.
17Ziegler, J., Simulations of Compressible, Diffusive, Reactive Flows with Detailed Chemistry Using a High-Order HybridWENO-CD Scheme, Ph.D. thesis, California Institute of Technology, 2011.
18Gamezo, V. N., Khokhlov, A. M., and Oran, E. S., “The Influence of Shock Bifurcations on Shock-Flame Interactionsand DDT,” Combustion and Flame, Vol. 126, 2001, pp. 1810–1826.
19Weber, J., Oran, E., Boris, J., and Anderson, J., “The numerical simulation of shock bifurcation near the end wall of ashock tube,” Physics of Fluids, Vol. 7, No. 10, 2006, pp. 2475–2488.
20Kessler, D., Gamezo, V., and Oran, E., “Three-dimensional reactive shock bifurcations,” Proceedings of the CombustionInstitute, Vol. 30, 2005, pp. 1841–1847.
21Davies, L. and Wilson, J. L., “Influence of Reflected Shock and Boundary-Layer Interaction on Shock-Tube Flows,” ShockTube Symposium, 1969.
22Nettleton, M. A., Gaseous Detonations, Chapman and Hall, NY, 1987.23Browne, S., Zeigler, J., and Shepherd, J., “Numerical Solution Methods for Shock and Detonation Jump Conditions,”
Tech. Rep. FM2006-006, Graduate Aeronautical Laboratories California Institute of Technology, February 2008.24Schlichting, H. and Gersten, K., Boundary-layer Theory, Springer, Berlin, 1965.25Karnesky, J., Detonation Induced Strain in Tubes, PhD dissertation, California Institute of Technology, 2010.26Goodwin, D. G., “Cantera – An open-source, extensible software suite for CVD process simulations,” Electrochemical
Society, 2003, pp. 155–162.27Akbar, R., Mach Reflection of Gaseous Detonations, Ph.D. thesis, Rensselaer Polytechnic Institute, 1997.28Strehlow, R., “Transverse waves in detonations: II. structure and spacing in H2-O2, C2H2-O2, C2H4-O2 and CH4-O2
systems,” AIAA J , Vol. 7, 1969, pp. 492–496.29Desbordes, D., Aspects stationnaires et transitoires de la detonation dans les gaz: relation avec la structure cellulaire du
front , PhD dissertation, Universite de Poitiers, 1990.30Kaneshige, M. J., Gaseous Detonation Initiation and Stabilization by Hypervelocity Projectiles, PhD dissertation, Cali-
fornia Institute of Technology, 1999.31Sanderson, S. R. and Sturtevant, B., “Transient Heat Flux Measurement Using a Surface Junction Thermocouple,”
Review of Scientific Instruments, Vol. 73, No. 7, 2002, pp. 2781–7.32Mohammed, H., Salleh, H., and Yusoff, M., “Determination of the Effusivity of Different Scratched Coaxial Temperature
Sensors Under Hypersonic Flow,” International Journal of Thermophysics, Vol. 31, 2010, pp. 2305–2322.33Mohammed, H., Salleh, H., and Yusoff, M., “The Effect of Scratch Technique on the Thermal-Product Value of Temper-
ature Sensors,” Thermophysics and Aeromechanics, Vol. 18, No. 1, 2011, pp. 51–64.34Radulescu, M. I. and Hanson, R. K., “Effect of heat loss on pulse-detonation-engine flow fields and performance,” Journal
Of Propulsion And Power , Vol. 21, No. 2, Mar-Apr 2005, pp. 274–285.35Petersen, E. L. and Hanson, R. K., “Measurement of reflected-shock bifurcation over a wide range of gas composition
and pressure,” Shock Waves, Vol. 15, 2006, pp. 333–340.36Laderman, A., Hecht, G., and Oppenheim, A., Temperature – its measurement and control in science and industry,
Reinhold Publishing Corporation, New York, 1962.37Hartunian, R., Russo, A., and Marrone, P., “Boundary-Layer Transition and Heat Transfer in Shock Tubes,” J. Aero.
Sci , Vol. 27, 1960, pp. 587–594.
14 of 14
American Institute of Aeronautics and Astronautics