bouevitch phd thesis
TRANSCRIPT

Probing Biomembranes with Nonlinear Optics
Thesis in Fulfillment of the Requirements for a Philosophy Doctor Degree
by Oleg Bouevitch
Presented to the Senate of the Hebrew University of Jerusalem in 1995


i
TABLE OF CONTENTS ABSTRACT .................................................................................................................... 2 Chapter 1. INTRODUCTION ........................................................................................ 4
1.1 Introduction ................................................................................................... 4 1.1.1 Nonlinear Optics ............................................................................ 4 1.1.2 Previous Applications of Nonlinear Optics in Biology .................................................................................................... 4 1.1.3 Advantages of Nonlinear Optics as a Probe of Biological Systems .................................................................................. 4
1.2 The Problem Statement ................................................................................. 5 1.3 The Purpose of the Work .............................................................................. 5 1.4 The Importance of the Work ......................................................................... 6 1.5 How the Thesis is Built ................................................................................. 6 References - Chapter 1 ......................................................................................... 7
Chapter 2. THEORY OF OPTICAL SECOND HARMONIC GENERATION (SHG) .................................................................................................... 8
2.1. Introduction .................................................................................................. 8 2.2. Physical Origins of Optical Nonlinearity .................................................... 8
2.2.1 Macroscopic Level- Nonlinear Optical Susceptibilities ......................................................................................... 8 2.2.2 Microscopic level- NLO Molecular Polarizabilities ...................... 9
2.3. Relationship Between Microscopic Second Order Molecular Polarizability and Macroscopic Second Order Susceptibility ............................. 12 2.4. Propagation Effects- SHG at an Interface Between Centrosymmetric Media ...................................................................................... 14 References - Chapter 2 ......................................................................................... 15
Chapter 3. PROBING MEMBRANE POTENTIAL WITH QUADRATIC NONLINEAR OPTICS ................................................................................................... 17
3.1 Introduction ................................................................................................... 17 3.2 Experimental Procedures and Arrangement ................................................. 19
3.2.1 Molecular Probes Sensitive to Membrane Potential ...................... 19 3.2.2 Preparation of Hemispherical Lipid Bilayers of Oxidized Cholesterol ............................................................................... 20 3.2.3 Clamping of Voltage to the Bilayer ............................................... 20 3.2.4 Nd:YAG Q-Switched Mode-Locked Laser System ...................... 21 3.2.5 Optical Set-Up ............................................................................... 23 3.2.6 Measurement of Modulation of SHG by Transmembrane Potential ........................................................................ 24
3.3 Results and Discussion ................................................................................. 25 3.3.1 Observation and Characterization of SHG from the Dye-Stained Hemispherical Lipid Bilayer ............................................... 25 3.3.2 Voltage Dependence of SHG ......................................................... 27 3.3.3 Discussion on the Mechanisms of the Voltage Dependence .............................................................................................. 29 3.3.4 Estimate of Possibility of Real-Time Measurements of Membrane Potential with SHG ........................................................... 32 3.3.5 Enhancing Sensitivity and Selectivity of the Method- SHG by Dye Monolayer on Rough Silver Surface .................................. 33
3.4 Conclusion .................................................................................................... 36 References - Chapter 3 ......................................................................................... 37

ii
Chapter 4. PROBING PHOTOCHEMISTRY OF A MEMBRANE PROTEIN BACTERIORHODOPSIN (BR) WITH SECOND HARMONIC GENERATION - BR-K TRANSITION ................................................... 39
4.1 Introduction ................................................................................................... 39 4.2 Experimental Methodology .......................................................................... 40
4.2.1 Films Preparation ........................................................................... 40 4.2.2 Experimental Arrangement and Procedures .................................. 41
4.3 Theoretical Approach ................................................................................... 42 4.4 Results ........................................................................................................... 47
4.4.1 bR-K Experiment ........................................................................... 47 4.4.1.1 SHG Measurements ........................................................ 47 4.4.1.2 Second Order Polarizabilities of bR and K ..................... 49 4.4.1.3 SHG Interference Experiment and Induced Dipole Change Upon bR-K Transition ........................................ 51
4.4.2 Deionized Membrane Experiment .................................................. 53 4.4.2.1 SHG Measurements ........................................................ 53 4.4.2.2 Induced Dipole Change Upon Deionization of Purple Membrane .................................................................... 55
4.5 Discussion ..................................................................................................... 57 4.5.1 Estimation of Experimental Errors ................................................ 57 4.5.2 Correlations Between Linear and Nonlinear Optical Properties of bR Chromophore ................................................................ 58 4.5.3 Integration of the Results ............................................................... 59 4.5.4 Structural Parameters that Govern the Observed Induced Dipole ......................................................................................... 61 4.5.5 Ground and Excited State Dipole Moment Changes Upon bR-K Transition ............................................................................. 62
4.6 Conclusion ..................................................................................................... 63 4.7 Appendix ....................................................................................................... 64
4.7.1 Account for Self-Absorption ......................................................... 64 4.7.2 Calculation of Mole Fractions ........................................................ 64
References - Chapter 4 ......................................................................................... 65 Chapter 5. APPLICATION OF THIN PURPLE MEMBRANE FILMS FOR AUTOCORRELATION OF FEMTOSECOND PULSES ..................................... 71
5.1 Introduction ................................................................................................... 71 5.1.1 Autocorrelation Techniques ............................................................ 71 5.1.2 Bacteriorhodopsin (bR) ................................................................. 72
5.2 Numerical Estimates ..................................................................................... 72 5.2.1 Coherence Length in bR Films ...................................................... 72 5.2.2 Nonlinear Optical Coefficients of bR Films .................................. 74
5.3 Experimental Procedures and Apparatus ...................................................... 74 5.3.1 Films Preparation ........................................................................... 74 5.3.2 Ti:Sapphire Femtosecond Laser System ....................................... 75 5.3.3 Detection of the SHG as a Function of the Incidence Angle ........................................................................................................ 75 5.3.4 Autocorrelator Set-Up ................................................................... 77
5.4 Results and Discussion ................................................................................. 77 5.4.1 Maker Fringes Experiment ............................................................ 77 5.4.2 Autocorrelation of Femtosecond Pulses ........................................ 79 5.4.3 bR Films as a Medium for Autocorrelation: Advantages and Disadvantages ............................................................... 79

iii
5.5 Conclusion .................................................................................................... 81 References - Chapter 5 ......................................................................................... 81
Chapter 6. EQUIPPING A MOLECULAR PROBE WITH A NANOANTENNA PRODUCES A PARTICLE WITH GIGANTIC OPTICAL NONLINEARITIES ...................................................................................... 83
6.1. Introduction .................................................................................................. 83 6.2. Description of the method of preparation of dye-colloid aggregates ............................................................................................................ 85 6.3. Properties of dye-colloid aggregates ........................................................... 86
6.3.1. Structure- TEM studies of LM films ............................................ 86 6.3.2. Physical properties of LM films ................................................... 88
6.3.2.1. Conductivity .................................................................. 88 6.3.2.2. Stability .......................................................................... 88
6.3.3. Optical properties of colloidal aggregates .................................... 88 6.3.3.1. Absorption spectroscopy of LM films ........................... 89 6.3.3.2. Emission spectroscopy of LM films and aqueous DCA suspensions ........................................................... 91 6.3.3.3. Optimization of SH scattering from aqueous DCA particles ................................................................ 95
6.4. Estimating the efficiency of second harmonic scattering ............................ 96 6.5. Applications ................................................................................................. 98
6.5.1. PVA-DCA ..................................................................................... 98 6.5.2. Fibroblasts ..................................................................................... 100
6.6. Conclusion and future plans ........................................................................ 102 References ............................................................................................................ 103
THESIS CONCLUSIONS ............................................................................................... 106 SUMMARY ..................................................................................................................... end of thesis

4
FIGURES AND TABLES Figure 3.1 ............................................................. 19 Figure 3.2 ............................................................. 20 Figure 3.3 ............................................................. 21 Figure 3.4 ............................................................. 23 Figure 3.5 ............................................................. 24 Figure 3.6 ............................................................. 26 Figure 3.7 ............................................................. 28 Figure 3.8 ............................................................. 34 Figure 3.9 ............................................................. 35 Figure 4.1 ............................................................. 41 Figure 4.2 ............................................................. 44 Figure 4.3 ............................................................. 47 Figure 4.4 ............................................................. 50 Figure 4.5 ............................................................. 51 Figure 4.6 ............................................................. 54 Figure 4.7 ............................................................. 55 Figure 4.8 ............................................................. 60 Figure 5.1 ............................................................. 73 Figure 5.2 ............................................................. 76 Figure 5.3 ............................................................. 77 Figure 5.4 ............................................................. 78 Figure 5.5 ............................................................. 79 Figure 6.1 ............................................................. 84 Figure 6.2 ............................................................. 86 Figure 6.3 ............................................................. 87 Figure 6.4 ............................................................. 89 Figure 6.5 ............................................................. 91 Figure 6.6A .......................................................... 92 Figure 6.6B .......................................................... 93 Figure 6.7A .......................................................... 95 Figure 6.7B .......................................................... 96 Figure 6.8 ............................................................. 99 Figure 6.9 ............................................................. 101
Table 3.I ................................................... 29 Table 4.I ................................................... 49 Table 4.II .................................................. 52 Table 4.III ................................................ 56

2
ABSTRACT Brief contents of thesis
The present thesis is devoted to application of nonlinear optics to probing biomembranes. Chapter 1 of thesis is a general introduction. Chapter 2 discusses theoretical aspects of optical second harmonic generation (SHG). The technique of probing a bilayer membrane potential with SHG is introduced in Chapter 3 of the thesis. The bacterial membrane protein bacteriorhodopsin (bR) is studied with SHG in Chapter 4. Chapter 5 is devoted to application of thin purple membrane films in nonlinear optics. It is shown that bR films can be used for characterization of femtosecond pulses. Finally, it is shown in Chapter 6 that the surface enhancement phenomena in dye-aggregated silver colloids can be used to create simple and efficient nonlinear optical biomembrane probes.
Chapter 3 - Measurement of membrane potential with SHG
We stained a model lipid bilayer membrane with an electrochromic dye and measured dependence of SHG by the dye-stained bilayer to a change in the voltage clamped across the bilayer. It was found that the dye submonolayer SHG is indeed sensitive to the membrane potential, the sensitivity being in the range of 2-4% for a 40 mV step change of membrane potential difference across ~5 nm bilayer membrane. The observed dependence of SHG on membrane potential was ascribed to the membrane potential sensitivity of the induced dipole of the molecular probe used to stain the membrane. In addition, we electrochemically adsorbed the charged molecular probes used in the lipid bilayer experiment at a rough silver surface from aqueous solution. The results obtained indicated that there is a significant increase of SHG from a rough silver surface upon adsorption of about a monolayer of the dye at the surface of the silver plate. Therefore, the surface enhancement phenomena can be used to enhance SHG signal as a monitor of membrane potential. This possibility is studied in more detail in Chapter 6. Chapter 4 - Probing photochemistry of bacteriorhodopsin with SHG
We compared the SHG of the initial pigment state bR568 with the photo-chemically generated K intermediate at 77 oK and derived from our data informa-tion on the induced dipole of these two states. The change of SHG amplitude and phase which occurs when a known portion of bR molecules in a film goes to K

3
state was measured, and these data were translated into the change of induced dipole of bR chromophore at bR-K transition. It was concluded that the induced dipole ratio of K relative to bR568 was 1.13. An additional study of an artificial form of bR, called "deionized membrane", which mimics the red-shifted K state, pointed out that induced dipole of the retinal chromophore in this form of bR is also bigger than in the initial pigment state, by about 7%. All these results were analyzed in terms of current theoretical understandings of SHG in conjugated polyenes. Finally, we analyzed the data in terms of prevalent models that could define this primary event in bR. It was concluded that there is an indication to an increase of the excited state dipole moment of the retinal chromophore at bR-K transition. Chapter 5 - Autocorrelating femtosecond pulses with thin bR films
The applicability of bR films as a medium for autocorrelation of femtosecond laser pulses was studied. A bR film was inserted into a traditional non-collinear Michelson autocorrelator, and an autocorrelation of 120-fs 790-nm pulses from a Ti:sapphire laser was recorded. No broadening was detected as compared to an autocorrelation of fs pulses with a thin slice of a β-barium borate crystal. Among the advantages of bR films are tunability of their optical nonlinearity, low cost, ease of reproduction, and stability.
Chapter 6 - A study of nanoantennae equipped molecular probes with gigantic optical nonlinearities
The aggregate particles of electrochromic membrane potential sensitive dye and silver colloid have been produced in solution. These DCA have gigantic optical nonlinearities since they combine a nonlinear optical chromophore with a silver nanoantenna to produce a particle that could be selectively placed to enhance in specific locations in a biosystem the optical nonlinearities used as a probe of biological structure and function. These results are especially interesting in light of demonstrated sensitivity of SHG by the dye submonolayer to the membrane potential (see Chapter 3 for details).

4
Chapter 1. INTRODUCTION 1.1 Introduction
1.1.1 Nonlinear Optics Nonlinear optics is an area of considerable current interest. Nonlinear
optical phenomena are formally described by the optically induced polarization density, P, which can be expanded as a power series in the electric field. The second order term in this expansion, which is composed of the square of the incident electric field and the second order susceptibility, governs the best understood of nonlinear optical processes. This second order term is responsible for such non-linear effects as second harmonic generation, sum and difference frequency generation, the rectification of light, and the electrooptic (Pockells) ef-fect.
1.1.2 Previous Applications of Nonlinear Optics in Biology There have been relatively few direct applications of such second order
processes to understanding the structure and function of biological systems. The only investigations to date have used second harmonic generation (SHG). One set of these investigations used the characteristics of SHG and second harmonic microscopy from rat tail tendon to understand details of the structure of this biological system. 1-3 Another set of such studies was aimed at both structural4 and functional5 questions that were related to the nature of light induced proton pumping in the membrane protein bacteriorhodopsin.
1.1.3 Advantages of Nonlinear Optics as a Probe of Biological Systems From the viewpoint of biological applications, SHG, as a unique
experimental method, has a number of essential advantages over other tools which are routinely used by biophysicists in their research. First, it is an optical method, which allows one to collect information without a contact with the sample and in parallel over a wide area of the sample with high spatial resolution. Second, the fundamental emission used to produce SHG can be in the infrared and this is especially important in preventing photodamage to sensitive and easy-to-bleach biological systems. Third, by its very nature SHG is inherently sensitive to anisotropy of the sample and therefore the undesirable background from

5
symmetric bulk of the sample is eliminated. This makes SHG especially sensitive to interfaces6 and oriented layers which are often a major issue of interest. Fourth, the microscopic nonlinearity of different biomolecules can vary by several orders of magnitude. This makes SHG a selective probe of only those molecules which exhibit high nonlinear optical (NLO) coefficients. Fifth, as far as the highly polarizable molecules are concerned, the molecular nonlinearity is strongly dependent on the electronic structure of the molecules7 which is influenced by the microenvironment. As a result, the method of SHG becomes not only structural, but also functional probe of certain biosystems, such as dye-stained lipid mem-branes or retinal proteins. Sixth, the SHG method has a three-dimensional resolution, normally associated with NLO processes. 8 And finally, since SHG is an instantaneous process, the temporal resolution of the technique is limited in principle only by the laser pulsewidth, which can be in the femtosecond time domain. All these advantages of SHG make it a unique method which in certain cases allows one to obtain information inaccessible by other means.
1.2 The Problem Statement
The following problems are studied in the present thesis: • How can nonlinear optics be applied to the study of biological systems? • What information is it possible to obtain with the use of SHG as a probe
of biological systems? • Whether biological materials, in their turn, can be used for nonlinear
optics, and if yes, how?
1.3 The Purpose of the Work
The purpose of the present work is to answer the questions put in the Problem Statement section on an example of two biological systems: a lipid bilayer and a membrane protein bacteriorhodopsin (bR).

6
1.4 The Importance of the Work
In view of the above listed advantages of nonlinear optics as a probe of biological systems, the application of SHG to the specific biosystems regarded in the present thesis should be most interesting. First, it should lead to the development of SHG methodology in its application to biosystems. Second, it is important to glean a new information about bacteriorhodopsin which could shed some light at the mechanism of a photon energy storage which occurs in this protein. Third, a rather unexpected application of a protein as an effective nonlinear optical medium could establish interesting links between a biomaterial and, for example, optical computers of the future. Finally, probing membrane potential with nonlinear optics should open new perspectives in studying electrical activity of living cells with unprecedented temporal and spatial resolution.
1.5 How the Thesis is Built
The present thesis is devoted to application of SHG to probing of biological systems. Two systems are studied. The first system is a dye-stained lipid bilayer of oxidized cholesterol. It is considered in Chapter 3. The main topic of discussion in Chapter 3 is application of SHG to measuring the lipid membrane potential. The second system is a bacterial membrane retinal-containing protein bacteriorhodopsin (bR). It is regarded in Chapter 4. In this chapter, the attention is concentrated on first stages of photon energy storage observed in bR. The experimental methodology of probing photochemistry of retinal proteins with SHG is developed and discussed in detail. In Chapter 5, an example application of bR films in nonlinear optics is given. Specifically, a thin film was made out of bR which was shown to be suitable for characterization of femtosecond laser pulses. Chapter 6 is devoted to the search of new ways to increase sensitivity and selectivity of nonlinear optical probing of biosystems. A concept of nanoantennae equipped nonlinear optical molecular probes is introduced and realized experimentally. The unique optical properties of new probes are studied and described.
To introduce the reader into the physical and methodological aspects of
SHG, the Chapter 2 was included into the thesis. Its main purpose is to provide the reader with useful and most relevant references and to discuss the problems directly related to the experimental and theoretical methodologies developed in this work.

7
The biological systems regarded in the present thesis differ significantly
one from the other. The same is true for the scientific methods presently available for the study of each of these systems. This is why the author found it necessary to provide each chapter with its own short Introduction and Conclusion sections. In addition, the whole thesis is framed with general Introduction and Conclusion sections.
References - Chapter 1 1. I. Freund, M. Deutsch, and A. Sprecher, "Connective tissue polarity.
Optical second-harmonic microscopy, crossed-beam summation, and small-angle scattering in rat-tail tendon". Biophys. J. 50, 693-712 (1986).
2. I. Freund, M. Deutsch, and A. Sprecher, "Optical second-harmonic scattering in rat-tail tendon". Biophys. J. 50, 693-712 (1986).
3. S. Roth and I. Freund, "Optical second-harmonic generation in rat-tail tendon". Biopolymers 20, 1271-1290 (1981).
4. J. Huang and A. Lewis, "Determination of the absolute orientation of the retinyldiene chromophore in purple membrane by a second-harmonic interference technique". Biophys. J. 55, 835-842 (1989).
5. J. Huang, Z. Chen, and A. Lewis, "Second-harmonic generation in purple membrane-poly(vinyl alcohol) films: probing the dipolar characteristics of the bacteriorhodopsin chromophore in bR570 and M412". J. Phys. Chem. 93, 3314-3320 (1989).
6. Y. R. Shen, "Surface properties probed by second-harmonic and sum-frequency generation". Nature 337, 519-525 (1989).
7. J. Zyss and D. S. Chemla. “Quantum Electronics - Principles and Applications.” In Nonlinear Optical Properties of Organic Molecules and Crystals, ed. D. S. Chemla and J. Zyss. 1. New York: Academic Press, 1987.
8. T. Wilson and C. Sheppard. Theory and Practice of Scanning Optical Microscopy. London: Academic Press, 1984.

8
Chapter 2. THEORY OF OPTICAL SECOND HARMONIC GENERATION (SHG)
2.1. Introduction
The aim of this section is to briefly review the theoretical background of optical second harmonic generation (SHG) by providing key references both to the basics and to the latest trends in this field. No attempt is made to include all the aspects and kinds of SHG. Instead, only the problems, directly related to the subject of the present study, are mentioned.
This chapter is built as follows. First, the optical nonlinearity, both at
macroscopic and microscopic levels, is discussed in Section 2.2. Second, the way of calculation of macroscopic susceptibilities is presented which accounts for the orientational distribution of nonlinear optical chromophores (Section 2.3). Third, the propagation effects are considered in Section 2.4.
2.2. Physical Origins of Optical Nonlinearity
2.2.1 Macroscopic Level- Nonlinear Optical Susceptibilities The response of electric charges in matter to a powerful optical field is
formally described by the multipole density P(r,t) induced by the electric field. The multipole density P(r,t) can be expanded as a power series in the fields1
P(r,t) = ∑j=1
• P(j)(r,t) (2.1)
where P(j)(r,t) =
⌡⌠o
+•dτ1 ⋅⋅⋅ ⌡⌠
o
+•dτj⌡⌠dρ1 ⋅⋅⋅⌡⌠dρ j κ(j)(ρ1,τ1⋅⋅⋅ρ j,τj) • E(ρ1,τ1)⋅⋅⋅E(ρ j,τj) (2.2)
Here, τi ≡ (t-ti) and ρ i ≡ (r-ri), and κ(j) are j-th order response functions of matter. The fact that κ(j) depend only on ρ i and τi reflects time invariance and the principle of causality, as well as assumed spatial homogeneity of the medium. 2, 3

9
Since the order of j fields in (2.2) can be specified by j! ways, one applies the symmetrization procedure3 to define a unique Κ(j) by
Κ(j) = 1j! ∑
p
j!κ(j) (2.3)
where the summation is performed over all permutations of the (τi,ρ i). By taking the Fourier transform of (2.2), taking into account (2.3) and neglecting the non-local response of the medium, one gets P(j)(ω) = χ(j)(ω;ω1⋅⋅⋅ωj) • E(ω1)⋅⋅⋅E(ωj) (2.4) where the electric-dipole susceptibilities of j-th order χ(j)(ω;ω1⋅⋅⋅ωj) are connected with the nonlinear local response functions Κ(j)(τ1⋅⋅⋅τj) via Fourier transformation
χ(j)(ω;ω1⋅⋅⋅ωj) = ⌡⌠o
+•dτ1 ⋅⋅⋅ ⌡⌠
o
+•dτj Κ
(j)(τ1⋅⋅⋅τj) e-i(ω1τ
1 + ⋅⋅⋅ + ω
jτ
j)
(2.5) The expression (2.4) has a simple physical interpretation: when charges in a medium are influenced by strong harmonic fields at frequencies ω1⋅⋅⋅ωj , the movement of the charges around their equilibrium positions is no longer harmonic. As a result, a set of new frequencies ω = ±ω1±ω2±⋅⋅±ωj appears in the polarization spectrum.
2.2.2 Microscopic level- NLO Molecular Polarizabilities On microscopic level, the optical nonlinearity of organic materials comes
from nonlinear polarization of individual molecules (or segments of polymer chains) by an optical field. To understand the macroscopic nonlinearity which is of interest in practical applications of nonlinear optics, one must address the issue of nonlinear optical response to the level of individual molecules.
Quantum mechanical calculation, based on the density matrix formalism,
can be used to find the expressions for linear and nonlinear molecular polarizabilities on the basis of known wavefunctions of a molecule. 4 Theoretically, it is possible to calculate the nonlinear polarizabilities of a molecule on the basis of the complete set of transition dipole moments, energy levels, and damping constants. This information, however, is often unavailable,

10
especially for big molecules. Fortunately, in certain cases the general formalism can be simplified. Particularly, the two-level approximation5 was shown to work well for molecules, whose optical properties, in the spectral region of interest, are dominated by a single charge-transfer transition. In the case of SHG, the dominating component of second order polarizability can be written as4, 6
βz'z'z'(-2ω;ω,ω) = e2
2meωng fδµex
⎩⎪⎨⎪⎧
1(ωng−ω+ιΓ)(ωng−2ω+ιΓ) +
+ ⎭⎪⎬⎪⎫1
(ωng+ω−ιΓ)(ωng+2ω−ιΓ) + 1
(ωng+ω−ιΓ)(ωng−ω+ιΓ) (2.6)
where ωng is the energy of transition, ω is the fundamental frequency, Γ is the damping constant, f is the transition oscillator strength, and δµex is the induced dipole of the transition, i. e. the difference of the dipole moments of excited and ground electronic states. Far from the resonance, (2.6) can be written in a form5, 7
βz'z'z'(-2ω;ω,ω) = 3e2h-2
2me fδµex
W(W2-(h-ω)2)(W2-(2h-ω)2)
(2.7)
where W is the energy of the transition.
The physical origin of second order optical nonlinearity of charge-transfer molecules can be can be understood from a following consideration. When an oscillating electric field is applied to a charge-transfer molecule, the flow of electric charge is "promoted" in one direction and "inhibited" in the other. In other words, the molecule acts as an "optical diode" in a sense that the molecular polarizability, which parallels the conductivity of a diode, is bigger at one direction of the electric field than at the opposite one. As a result, the spectrum of molecular polarization contains the second harmonic of the driving electric field which means that the molecule has a non-zero second order polarizability β. Nonetheless, one must note that this "optical diode" presentation is based on consideration of charge movements only in the ground state of the molecule. In reality, charge distributions both in ground and in excited states of the molecule are important, since induced dipoles of molecules are involved. This can be seen from (2.6) and (2.7). The picture is therefore oversimplified. It does catch, though, some qualitative trends.
As is seen from the previous discussion, both macroscopic and microscopic nonlinear optical constants were derived mathematically as
11
coefficients in power series expansion of macroscopic or microscopic polarizations. The term which is linear in electric field describes "linear" optical phenomena, whereas the higher order terms describes "nonlinear" optical phenomena. The appearance of both kinds of terms in the same expression for polarizations probably reflects the fact that linear and nonlinear optical properties of molecules consist, physically, an integral whole. In this connection, a number of interesting ideas were introduced by Marder et al. 8, 9 These authors regarded the molecular polarizabilities, α, β, γ, and δ, of linear polymethine dyes, as a function of some effective external or internal electric field F directed along the charge-transfer axis of the molecule. The field F, through Coulombic interactions with the π-electron system, changes the ratio of the two limiting resonance structures, neutral and charge-separated ones, which incorporate into the ground (and excited) state structure(s) of the molecule. The mixing of the zero-order neutral and charge-separated resonance structures largely controls the electronic properties of a molecule. The field F influences these properties, which are described by the polarizabilities. Another way of looking at the action of the field F is to think that it changes the π-bond length alternation parameter which was shown10, 11 to be directly related to the linear and higher order polarizabilities of conjugated organic molecules. Thus, one can write for a dipole moment µ as a function of F and small perturbing electric field E,
µ(F,E) = µο(F) + αο(F)E + βο(F)E2 + γο(F)E3 + γο(F)E4 + ⋅⋅⋅ (2.8) This equation takes an advantage from the fact that the dipole moment of linear charge-transfer molecules is directed along the long axis of the molecule, and that both electric fields, F and E, are parallel to that long axis. By remembering that the right side of Eq. (2.8) is in fact the Taylor series, we can write
αο(F) = ⎪⎪⎪∂µ(F)
∂E E∅0
βο(F) = 12
⎪⎪⎪∂2µ(F)
∂E2 E∅0
= 12
⎪⎪⎪∂α(F)
∂E E∅0
γο(F) = 16
⎪⎪⎪∂3µ(F)
∂E3 E∅0
= 13
⎪⎪⎪∂β(F)
∂E E∅0
(2.9)
Since the Taylor series expansion of µ with respect to E holds for each value of F, the derivative relations between the nonlinear polarizabilities are expected to be valid as a function of F; in other words,

12
αο(F) = ∂µ(F)∂F
βο(F) = 12 ∂2µ(F)∂F2 =
∂α(F)∂F
γο(F) = 16 ∂3µ(F)∂F3 =
13 ∂β(F)∂F (2.10)
The last statement, which maybe is trivial mathematically, has an interesting physical meaning. It establishes a fundamental derivative relations between linear and nonlinear (static) polarizabilities of conjugated organic molecules. The relations (2.10) can be corrected to include the optical region of the spectrum. It is important to note that both numerical calculations and experimental studies on linear polymethine dyes seem to confirm the validity of the above stated relationships between linear and nonlinear polarizabilities. 9 2.3. Relationship Between Microscopic Second Order Molecular Polarizability and Macroscopic Second Order Susceptibility
The second order susceptibility of a nonlinear organic material χ(2) is a sum of microscopic molecular polarizabilities over a unit volume. Most often, the nonlinearity of a single kind of organic molecules dominates. For perfectly ordered molecules, χ(2) is the contraction of a sixth-rank orientation tensor with the third-rank second order susceptibility tensor, 12
χABC(2)(-2ω;ω,ω) = CAaCBbCCcβabc(-2ω;ω,ω) (2.11)
where A, B, C denote the laboratory axes X, Y, or Z, and a, b, c denote the molecular axes x, y, or z. βabc is the second order polarizability tensor of the molecules of interest. CAa (CBb; CCc) denote direction cosines between axes A, a (B, b; C, c). For partially ordered molecules, χABC(2)(-2ω;ω,ω) = <d(φ,θ,ψ)CAaCBbCCc> βabc(-2ω;ω,ω)
= DABCabcβabc(-2ω;ω,ω) (2.12) where d(φ,θ,ψ) is a distribution function written down as a function of the Euler angles φ, θ, and ψ as defined in Ref. 13

13
When the molecules on a surface or within a thin film are uniformly distributed about the surface normal, i. e. when the distribution function d does not depend on φ, many components of the second order susceptibility tensor vanish. (All samples, investigated in the present thesis, were rotationally invariant about the surface normal.) The vanishing components of χ(2)(-2ω;ω,ω) can be figured out by considering the parity of direction cosines. Indeed, random φ means that all direction cosines involving the surface normal are even while the others are odd. Let us number the direction cosines CXx = 1, CXy = 2, ..., CZz = 9. The three-dimensional tensor D of rank 6 can be rewritten as a nine-dimensional tensor of rank 3. The new tensor is denoted as D ijk, i,j,k= 1..9. The integrals involving only cosines number 7..9 are nonzero. All other nonzero elements must include one of even cosines 7-9 and two of the remaining six odd cosines 1..6. From these elements, the integrals of a type D i,i+3,j, where i= 1..3 and j= 7..9, are zero at random φ. Besides, from the symmetry considerations we have: D 24k = -D 15k, D 16k = -D 34k, D 26k = -D 35k, D ijk = D i+3,j+3,k, at i,j= 1..3 and k= 7..9. In summary, the four independent elements of χ(2)(-2ω;ω,ω) are
χxxz(2) = ∑i'j'k=1
3D i'j+6'k
βijk (2.13a)
χxyz(2) = ∑i'j'k=1
3D i'j+6'k+3βijk (2.13b)
χzxx(2) = ∑i'j'k=1
3D i+6'j'k
βijk (2.13c)
χzzz(2) = ∑i'j'k=1
3D i+6'j+6'k+6βijk (2.13d)
The resulting layout of χ(2) is:
χ(2)(-2ω;ω,ω) = ⎣⎢⎡
⎦⎥⎤0 0 χxxz(2)
0 0 χxyz(2)
χxxz(2) χxyz(2) 0
0 0 -χxyz(2)
0 0 χxxz(2)
-χxyz(2) χxxz(2) 0
χzxx(2) 0 00 χzxx(2) 00 0 χzzz(2)
(2.14) Here, the 3 3x3 matrices are the X, Y, and Z components along the first rank (the first index, corresponding to SH photon). We note that when the Kleinmann

14
symmetry relations14 are valid, χxyz(2) =0 and χzxx(2) = χxxz(2) . Thus, the number of
independent components of χ(2) reduces to 2. 2.4. Propagation Effects- SHG at an Interface Between Centrosymmetric Media
The phenomenon of SHG was observed for the first time in a medium (quartz) having non-zero second order electric-dipole susceptibility. 15 This relatively simple but important case of SHG has been considered theoretically. 1, 4,
6 When a medium has a center of symmetry, the bulk electric-dipole χ(2) vanishes; however, the medium still has its bulk nonlinearity originating from electric-quadrupole and magnetic-dipole terms. 16 Though these terms do not emit any macroscopic waves in a homogeneous isotropic medium, they can produce SH wave reflected from an interface, as a result of interaction of incoming and reflected fundamental waves. 17 Besides, there is an intrinsic nonlinearity of an interface between centrosymmetric media. This nonlinearity was shown18 to consist of several parts. The first part is an electric-dipole susceptibility arising from the lack of a center of symmetry at the interface. The second part is an electric quadrupole susceptibility. The third part, also of quadrupole origin, comes from field discontinuity at the interface. 17 As is seen from detailed theoretical analysis, 17-19 the bulk incorporation has to be taken into account when utilizing SHG as a surface probe.
The surface nonlinearity, which is sensitive to the interface structure, can be modified by a molecular (sub)monolayer adsorbed at an interface. This change due to a monolayer adsorption is Δχs(
2) = χA(2) + χI(
2) (2.15)
where χA(
2) is the second order susceptibility of the adsorbate layer placed away from the interface, and χI(
2) is the second order susceptibility of the interface
modified by interaction of adsorbate with the surface. Depending on the kind of the surface, the relative incorporation of the terms into Δχs(
2) may be different.
The adsorbates on metals and semiconductors can significantly modify the surface states and optical transitions. It was shown that rhodium surface nonlinearity is drastically reduced20 by adsorption of oxygen monolayer. It was concluded that χs(
2) of rhodium surface is reduced through localization of sub-
surface free electrons by oxygen molecules. Similarly, it was shown that some species chemisorbed to a silicon surface tend to localize the dangling bonds at the surface which are the main source of surface nonlinearity of silicon. As a result

15
of adsorption, the surface nonlinearity of silicon is considerably reduced. 21 In contrast to metals and semiconductors, adsorption of molecular species to a dielectric usually does not change the intrinsic surface nonlinearity of the dielectric; the change of total surface nonlinearity arises from the simple addition of the molecular submonolayer nonlinearity to that of the interface. 18, 22 References - Chapter 2 1. N. Bloembergen. Nonlinear Optics. New York: Benjamin, 1965. 2. P. N. Butcher. Nonlinear Optical Phenomena. Columbus: Ohio State
University Press, 1965. 3. C. Flytzanis. “Quantum Electronics: A Treatise.” ed. H. Rabin and C. L.
Tang. 1, Part A. New York: Academic Press, 1975. 4. Y. R. Shen. The Principles of Nonlinear Optics. New York: Wiley, 1984. 5. J. L. Oudar and D. S. Chemla, "Hyperpolarizabilities of nitroanilines and
their relations to the excited state dipole moment". J. Chem. Phys. 66, 2664-2668 (1977).
6. J. Zyss and D. S. Chemla. “Quantum Electronics - Principles and Applications.” In Nonlinear Optical Properties of Organic Molecules and Crystals, ed. D. S. Chemla and J. Zyss. 1. New York: Academic Press, 1987.
7. C. C. Frazier, M. A. Harrey, M. P. Cockerman, H. M. Hand, E. A. Chauchard, and C. H. Lee, "Second-harmonic generation in transition-metal-organic compounds". J. Phys. Chem. 90, 5703-5706 (1986).
8. S. R. Marder, C. B. Gorman, F. Meyers, J. W. Perry, G. Bourhill, J.-L. Brédas, and B. M. Pierce, "A unified description of linear and nonlinear polarization in organic polymethine dyes". Science 265, 632-635 (1994).
9. C. B. Gorman and S. R. Marder, "An investigation of the interrelationships between linear and nonlinear polarizabilities and bond-length alternation in conjugated organic molecules". Proc. Natl. Acad. Sci. USA 90, 11297-11301 (1994).
10. S. R. Marder, D. N. Beratan, and L.-T. Cheng, "Approaches for optimizing the first electronic hyperpolarizability of conjugated organic molecules". Science 252, 103-106 (1991).
11. S. R. Marder, J. W. Perry, G. Bourhill, C. B. Gorman, B. G. Tiemann, and K. Mansour, "Relation between bond-length alternation and second electronic hyperpolarizability of conjugated organic molecules". Science 261, 186-189 (1993).

16
12. T. L. Mazely and W. M. Hetherington III, "Second-order susceptibility tensors of partially ordered molecules on surfaces". J. Chem. Phys. 86, 3640-3647 (1987).
13. H. Goldstein. Classical Mechanics. Cambridge: Addison-Wesley, 1953. 14. D. A. Kleinmann, "Nonlinear dielectric polarization in optical media".
Phys. Rev. 126, 1977-1979 (1962). 15. P. A. Franken, A. E. Hill, C. W. Peters, and G. Weinreich, "Generation of
optical harmonics". Phys. Rev. Lett. 7, 118 (1961). 16. N. Bloembergen, R. K. Chang, S. S. Jha, and C. H. Lee, "Optical second-
harmonic generation in reflection from media with inversion symmetry". Phys. Rev. 174, 813-822 (1968).
17. P. Guyot-Sionnest and Y. R. Shen, "Local and nonlocal surface nonlinearities for surface optical second-harmonic generation". Phys. Rev. B 35, 4420-4426 (1987).
18. P. Guyot-Sionnest, W. Chen, and Y. R. Shen, "General considerations on optical second-harmonic generation from surfaces and interfaces". Phys. Rev. B 33, 8254-8263 (1986).
19. Y. R. Shen, "Surface properties probed by second-harmonic and sum-frequency generation". Nature 337, 519-525 (1989).
20. H. W. K. Tom et al., "Surface studies by optical second-harmonic generation: the adsorption of O2, CO, and sodium on the Rh (111) surface".
Phys. Rev. Lett 52, 348-351 (1984). 21. H. W. K. Tom and G. D. Aumiller, "Observation of rotational anisotropy in
the second-harmonic generation from a metal surface". Phys. Rev. B 33, 8818-8821 (1986).
22. G. Berkovic, Y. R. Shen, G. Marowsky, and R. Steinhoff, "Interference between second-harmonic generation from a substrate and from an adsorbate layer". J. Opt. Soc. Am. B 6, 205-208 (1989).

17
Chapter 3. PROBING MEMBRANE POTENTIAL WITH QUADRATIC NONLINEAR OPTICS
3.1 Introduction
The results of this chapter demonstrate for the first time that the second or-der nonlinear optical phenomenon of second harmonic generation (SHG) can be used as a monitor of a bilayer membrane potential. The novel method of monitor-ing membrane potential with SHG could be of considerable significance as a new tool in the arsenal of biophysicists interested in investigating the electrical pro-cesses that govern biological function.
Optical techniques for monitoring membrane potential were introduced
two decades ago by L. B. Cohen and his colleagues1 and are now used in a wide variety of research problems. 2 Presently, the most popular optical mode for monitoring membrane potential is fluorescence. In this linear spectroscopic approach the fluorescence intensity is monitored as a function of membrane potential. It has been shown that the fluorescence intensity of a dye can be altered by membrane potential primarily in one of three ways: first by a reorientational mechanism in which a membrane-bound dye tilts in response to an electric field; 3 second, by a voltage-dependent redistribution mechanism in which the fluorescent dye partitions into the membrane as a function of the electrical potential; 4 and third, by an electrochromic mechanism in which the electric field directly perturbs a dye's electronic transition. 5 Such an optical methodology has been found to be very useful in answering a variety of biological questions which require parallel detection of membrane potential over a defined area with relatively high spatial resolution.
In view of the availability of an optical methodology for monitoring alter-ations in the membrane potential, what is the importance for biology of probing potentials of membranes with SHG? First, it should be noted that the fundamental laser emission that is used to elicit the SHG can be in the infrared and the infrared nature of the light source should be specifically significant in preventing damage to the biological system and to the fluorescent voltage sensitive probe which readily bleaches as a result of the visible illuminating light source. In addition, unlike the case of fluorescence, in SHG the molecules endocytotically internalized into the cell will not contribute to the observed signal. This results from the fact that symmetry considerations forbid SHG in an

18
isotropic medium in the electric dipole approximation.* Therefore, only those asymmetrically distributed molecules in the membrane will be responsible for the signal without any of the background normally seen when fluorescence is used as the probe. Moreover, because the second harmonic signal is generated instantaneously the only limitation to the kinetic detection of membrane potential with this technique, besides the signal to noise considerations to be discussed below, is in the time response of the dye and that is very fast (femtoseconds) for the electrochromic molecules that we have chosen for the measurements reported in this chapter. Furthermore, in terms of microscopy, second harmonic microscopy will allow the interrogation of thick tissue slices, such as networks of neurons in brain slices, that can be monitored with the added three dimensional spatial resolution normally associated with non-linear optical processes. 6 Of special importance in this regard is the dramatic reduction in scattering that occurs with the infrared light that is used to elicit the second harmonic signal. Finally, it should be noted that surface enhancement phenomena that have been used very effectively in such linear processes as Raman scattering have only a marginal effect on fluorescent signals. In terms of non-linear optical phenomena however, these enhancement factors can not only be applied, but, the enhancement observed for non-linear processes can be four orders of magnitude greater than those observed in Raman scattering. 7 Thus, one can conceive of an experiment in which a nanometer sized silver particle, that is chemically directed to a specific subset of membrane proteins, can be used to enhance selectively the SHG of dye molecules in close proximity to this subset of proteins. Such an approach, together with our demonstration of the membrane potential sensitivity of SHG, holds promise of eventually developing an optical, non-contact, analog to the extremely successful method of patch clamping for measuring the electrical properties of membranes around specific protein channels. Therefore, for all of these reasons the study of alterations in the surface SHG as a function of changes in cell membrane potential should be most interesting.
In this chapter we present the first steps in this new approach to membrane
potential measurements. For this demonstration of the inherent sensitivity of SHG to membrane potential we chose dye molecules that undergo internal charge transfer and can bind and orient in a lipid bilayer. Such molecules fall in the category of dyes that respond to membrane potential by an electrochromic mechanism, 5 and large second harmonic signals have already been observed for
* See Chapter 2 for details. * See Chapter 2.3 for details. * See Chapter 2.4 for details * See Chapter 4 for more details about bacteriorhodopsin and purple membrane. * To prepare the film, we dissolved a 5 g sample of polyvinyl alcohol (PVA), MW 25,000, Sigma, in 25 ml of double distilled water by boiling for 10 min. The concentrated suspension of DCA

19
monolayers of these compounds. 8 Further, we demonstrated for the first time the sensitivity of SHG to membrane potential using a hemispherical lipid bilayer stained with a potentiometric dye. Finally, we detected a several orders of magni-tude surface enhancement of SHG by a potentiometric dye-silver complex.
3.2 Experimental Procedures and Arrangement
3.2.1 Molecular Probes Sensitive to Membrane Potential The dyes/molecular voltage sensitive probes used in the experiments were
synthesized by procedures adapted from Hassner et al. 9 The structures of dyes are shown in Figure 3.1.
Structure of a probe di-4-ANEPPS5 is also included for comparison. As is seen from this figure, the probes consist of a pyridinium styryl optical chromophore and a couple of hydrophobic hydrocarbon chains which serve as "anchors" ensuring adsorption of the whole molecule to a lipid bilayer. The molecules presented in Figure 3.1 differ by the length of alcyl chains and by the kind of the (hydrophilic) end groups. The amphipathic character of the molecular probes ensures the adsorption of the molecules to a lipid membrane in a highly oriented
Figure 3.1. Structures of potential sensitive dyes.

20
fashion. Before the experiment, the dyes were added to the 0.1 M KCl bathing solution from 1 mM stock solutions in ethanol.
3.2.2 Preparation of Hemispherical Lipid Bilayers of Oxidized Cholesterol All the experiments were performed on dyes that were inserted at a
concentration of approximately 1% in a hemispherical bilayer membrane of oxidized cholesterol. The hemispherical bilayer is a bubble of approximately 3 mm diameter with walls consisting of a bilayer membrane (Figure 3.2).
The bubble, which is filled with a 0.1 M KCl solution in which there is be-tween 0.3 - 0.5 % ethanol, sits at the tip of a Teflon pipette. It is inserted into a 1 cm x 1 cm glass cuvette that is filled with the same solution as is in the bubble. The detailed procedure of forming such hemispherical bilayers is described elsewhere. 10 This model membrane system has been frequently used to char-acterize the potentiometric responses of fluorescent dyes. 3, 5
In order to ensure adsorption of dye molecules only to the outer side of the
hemispherical lipid bilayer, the dye solution was added only to outer bathing solu-tion. As a result of adsorption, the dye molecules were oriented in the membrane with their hydrophobic tails being present in the middle of the bilayer, and the hy-drophilic polar groups looking outwards into the solution surrounding the bubble.
3.2.3 Clamping of Voltage to the Bilayer A pair of Ag-AgCl wire electrodes were used to apply the voltage to the
lipid bilayer membrane. The electrodes were prepared by electrochemical cycling
Lipid bilayer
5 nm
WaterWater
Pipette
Figure 3.2. Hemispherical lipid bilayer.

21
of a clean silver wire, 0.5 mm in diameter and 50-100 mm long, in 0.1 N HCl vs a silver anode at a current of 0.5 mA during several hours. One of thereby made electrodes was in a contact with the KCl solution inside the bubble, while the other was placed into the outer solution. Since the resistance of a lipid membrane is much higher than the resistance of a surrounding KCl solution, the most of the voltage present at the electrodes, was applied across the lipid bilayer. The voltage applied to the membrane typically ranged between 20-50 mV. Although the exact pattern of the electrical potential in the vicinity of the membrane is somewhat complicated by presence of ion layers near the membrane surface, it was estimated that the voltage-induced electric fields on the membrane surface are of the order of 105 V/cm. 11
3.2.4 Nd:YAG Q-Switched Mode-Locked Laser System A simple and reliable low-repetition rate Q-switched Nd:YAG laser
system with a pulsed pump was used, for a long time, as a "working horse" in a variety of non-linear optical experiments. In terms of our applications, however, this system is not quite optimal. Typical light output of such a system is a 10 Hz train of a light pulses with energy of about 10-100 mJ released during only 10 ns. Since we are dealing with rather sensitive samples, such as lipid membranes, more delicate probing is required.
The Nd:YAG laser used in the present experiments was a cw lamp-pumped, acousto-optically Q-switched and mode-locked Coherent Antares 76-S laser system. Its output consisted of short trains of mode-locked pulses under a Q-switched (QS) envelope. The pulsewidth of a mode-locked (ML) pulse and a Q-switched envelope was 100 ps and 300 ns, respectively; at a 76 MHz repetition rate of ML pulses, about 23 ML pulses were present under a single QS envelope (see Fig. 3.3).
QS envelope
Time
Intensity
FWHM 300 ns
13.2 ns
ML pulse
FWHM 100 ps
Figure 3.3. The temporal structure of a Q-switched laser pulse.

22
The repetition rate of QS pulses could be varied between a few Hz and 1.2 kHz; in the present experiments it was set to be 400 Hz. Since the QS pulse envelope of our laser is about 30 times wider than a QS pulse from a Nd:YAG laser with a pulsed pump, the laser damage of a sample is diminished. On the other hand, the peak intensity of our pulse, which is a crucial parameter in non-linear optical experiments, is higher, and this is due to the mode-locked structure of a QS pulse. An additional important advantage of this laser is that it was designed to work at repetition rates of QS pulses up to 1.2 kHz, which is much higher than a repetition rate of a Nd:YAG laser pumped with a pulsed lamp, usually 10-20 Hz. This allows the extensive averaging of the SH signal over many thousands of shots to be easily performed.

23
3.2.5 Optical Set-Up
The optical arrangement is shown in Figure 3.4. The laser pulses were passed through a half-wave plate and a Glan-Thompson laser prism polarizer. The 1064 nm laser power was adjusted to give <100 mW on the sample in a spot size of 100 micron (FWHM) on the bottom of the hemispherical bilayer after the laser had been filtered through a colored glass filter which blocked emissions at wave-lengths above 600 nm. The second harmonic signal at a wavelength 532 nm was reflected from the bottom of the bilayer and was passed through an interference filter with a bandwidth of 1 nm followed by a Glan-Thompson prism polarizer. Finally, the signal was directed onto a Hamamatsu R1477 photomultiplier. In some of the preliminary experiments, a 30 cm monochromator was used to select the second harmonic wavelength from that of the fundamental. The angle θ of the incident fundamental beam relative to the surface normal was chosen to be ~60o to maximize the second harmonic signal within the constraints of our experimental geometry and in accordance with the expectation that I(2ω) ∝ sec2(θ).12 The Teflon tip was mounted on a motor-driven X-Y-Z translation stage which allowed the hemispherical bilayer to be freely translated in all three dimensions.
Nd:YAGQS:MLLASER
COMPUTERINTERFACE
1 2
PHOTO-MULTIPLIER
GATED INTEGRATORSAND BOXCAR AVERAGERS
1K
SWITCHER
CUVETTE ANALYZINGPOLARIZER
INTERFERENCE FILTERPHASE PLATE
POLARIZER
FILTER
LENS F=15 CMLENS F=5 CM
CUVETTE
PIPETTE
HLB
IR BEAM IR BEAM
SH BEAM
ELECTRODES
Figure 3.4. A diagrammatic representation of the experimental arrangement used to determine the voltage dependence of the second harmonic response from a dye/molecular probe labeled hemispherical lipid bilayer (HLB).

24
3.2.6 Measurement of Modulation of SHG by Transmembrane Potential The second harmonic signal and its voltage dependence were detected as
shown in Fig 3.4 and schematically diagrammed in Figure 3.5.
The electronics was synchronized by a triggering pulse from the Q- switcher of the laser as shown in Figure 3.5. The photomultiplier output was con-nected to two Stanford Research (SR250) gated integrators and boxcar averagers. One of these, la-beled 1 in Figure 3.4, was used in 'toggle polarity' mode. In this mode, the integrator reversed the polarity of the input signal after each triggering, adding it to the moving average of the integrator. The 'toggle' TTL output of the integrator followed this polarity and the TTL output was used to produce bipolar rectangular voltage of ±20 mV which was applied to the hemispherical bilayer. Such as arrangement allowed one to accumulate the difference between the energies of every two successive pulses (generated at membrane potentials of opposite sign) directly in integrator 1. This signal was stored in the internal capacitor of the boxcar. In other words the energy of a pair of pulses changed the charge of this capacitor. Integrator 2 simply measured the overall energy of the second harmonic signal. Special care was taken so that the coefficients of boxcar amplification for both polarities were identical. In addition, shot-to-shot noise of the laser was reduced to 10-15% by careful adjustment of the laser Q-switcher and mode-locker. Second-order field dependencies, together with long-term instability of the membrane itself, led to noise of 40-50% in the second harmonic
- + - + - +
-
+
-
+
-
+
Q-switchertriggering pulses
"Toggle"output of integrator
Voltage clampedto the bilayer
Laser pulses
SH signal
Boxcar averager
Time
Time
Time
Time
Time
Time
Figure 3.5. A diagrammatic illustration of the sequence of steps from laser triggering to boxcar averaging of the signal from the pho-tomultiplier that detects the second harmonic signal corresponding to the membrane potential change.

25
signal. Thus, in order to detect a second harmonic modulation due to membrane potential changes that are of the order of several percent of the total second harmonic intensity, at least 3-5 thousand shots per measurement were accumulated. In our experiments, we were able to measure 3% modulation in second harmonic signal with an accuracy that was better than 50% of this modulation. To suppress zero drifts in the registering electronics and those caused by instability in the hemispherical bilayer voltage clamping electrodes were switched several times during the experiment. This switching was equiva-lent to reversing the phase of the reference signal in our phase-sensitive mea-surement. Every time the electrodes were switched the signal representing the second harmonic modulation {dI(2ω)} increased/decreased by approximately the same value thereby giving us confidence that we indeed were observing the optical response to membrane potential modulation. Both signals representing the second harmonic response {dI(2ω)} and second harmonic amplitude {I(2ω)} were digitized and stored in an IBM PC computer. Relative second harmonic response was obtained by dividing the change in dI(2ω), due to the electrode switching, by I(2ω).
3.3 Results and Discussion
3.3.1 Observation and Characterization of SHG from the Dye-Stained Hemispherical Lipid Bilayer Previous experimental results had demonstrated that the potential sensitive
dyes di-n-ANEPPS or di-n-ASPPS exhibit second harmonic generation (SHG) with high efficiency when oriented in monolayer films. 8 The results presented in this chapter extend these results in two directions. First, we have prepared hemispherical lipid bilayers (HLB) stained with these dyes at a concentration of 1% as indicated above. With this dye to lipid ratio and based on the previous results obtained on these molecules we estimated a surface susceptibility of 2 x 10-16 esu. For such a surface susceptibility we should get approximately 40 photons per QS pulse of our laser which emits 260 MW/cm2 peak intensity at the fundamental emission of the laser at 1.06 µm. At first glance such a value seems rather small; however, at a repetition rate of 400 Hz, 16000 photons accumulate in only 1 sec and this should be readily detectable even with an ordinary non-cooled photomultiplier using the technique described above which is based on gated integration and boxcar averaging. In spite of the fact that such a signal should be detectable in terms of detector sensitivities it could be easily overwhelmed, in our experimental arrangement, by the presence of the reflection of the fundamental of

26
the laser. In fact, the infrared (IR) beam of the laser is not reflected by the tip of the hemispherical bilayer which was the region illuminated and, moreover, the second harmonic was generated at an angle that was similar to what would be expected for the reflection angle. Thus, we essentially were able to detect the SHG without the presence of any background from the fundamental frequency of the laser.
The SHG from the tip of the dye stained hemispherical bilayer that was observed at 532 nm was well-defined both in terms of its spectrum and in terms of following the temporal nature of the laser pulse. To initially demonstrate the presence of SHG from the HLB we used the dye merocyanine 540 and slowly translated the HLB at a rate of 10 µm/sec across a partially focused fundamental beam (FWHM 0.10 mm) while recording the SHG. Figure 3.6 shows a typical result of such an experiment.
The laser worked in a TEMoo mode which had a Gaussian lateral intensity distribution. During the translation, the HLB bottom "probed" areas of different local intensity of the IR beam which led to a correspondent change in the SH signal which was recorded as a function of time. Since the translation was at constant velocity, the form of curve thereby obtained was close to Gaussian. This fact is illustrated by the dashed curve representing the best Gaussian fit of the experimental data. The relatively good fit that was obtained proves that the second harmonic signal was generated by the probe-labeled bilayer. The slight
2001000-100-2000
1
2
3
4
5FitData
HLB position, µm
SH in
tens
ity, a
. u.
Figure 3.6. The result of slow (10 µm/sec) vertical translation at constant velocity of HLB through the IR laser beam focused to 100 microns (FWHM).

27
asymmetry of peak is thought to be caused by effects associated with the finite curvature of the HLB and the long-term instability of the probe-labeled HLB. The fact that the second harmonic signal does not fall to zero when the bilayer is out of the beam probably results from dye molecules adsorbed to the walls of the cuvette in which the HLB was generated. The probe in this experiment was merocyanine 540. This probe was added to the HLB by introducing the dye into the surrounding 0.1 M KCl solution at a concentration of 3 µM. All measurements were performed at a room temperature. The laser intensity was 300 W/cm2; the peak intensity of the QS:ML laser pulse was about 260 MW/cm2; the illumination area on the bilayer was 3∞104 cm2 at the sample. In this experiment, the fundamental beam was s-polarized and the SH beam was p-polarized.
We tried to determine the threshold of the fundamental laser intensity at which the second harmonic signal of merocyanine is degraded. This occurred at an intensity of 1 GW/cm2. At this intensity we succeeded to see an exponential decrease in the signal (data not shown) which is probably due to destruction of the dye molecules by laser heating since the voltage across the bilayer was still detected. In spite of these results we were unable to see any degradation of the second harmonic signal at such intensities when we used the dyes shown in Figure 3.1.
3.3.2 Voltage Dependence of SHG With the confidence we developed in seeing the SHG from an HLB we
proceeded to monitor this SHG signal as described above. A typical result is displayed in Figure 3.7.
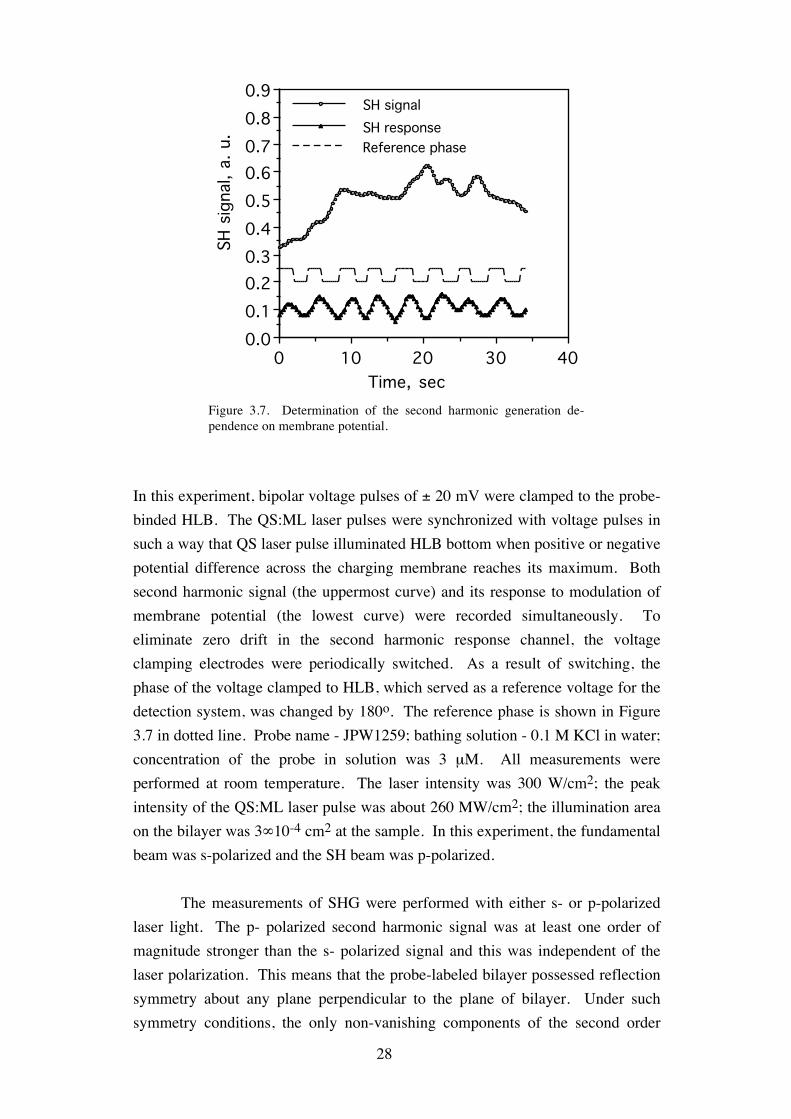
28
In this experiment, bipolar voltage pulses of ± 20 mV were clamped to the probe-binded HLB. The QS:ML laser pulses were synchronized with voltage pulses in such a way that QS laser pulse illuminated HLB bottom when positive or negative potential difference across the charging membrane reaches its maximum. Both second harmonic signal (the uppermost curve) and its response to modulation of membrane potential (the lowest curve) were recorded simultaneously. To eliminate zero drift in the second harmonic response channel, the voltage clamping electrodes were periodically switched. As a result of switching, the phase of the voltage clamped to HLB, which served as a reference voltage for the detection system, was changed by 180o. The reference phase is shown in Figure 3.7 in dotted line. Probe name - JPW1259; bathing solution - 0.1 M KCl in water; concentration of the probe in solution was 3 µM. All measurements were performed at room temperature. The laser intensity was 300 W/cm2; the peak intensity of the QS:ML laser pulse was about 260 MW/cm2; the illumination area on the bilayer was 3∞10-4 cm2 at the sample. In this experiment, the fundamental beam was s-polarized and the SH beam was p-polarized.
The measurements of SHG were performed with either s- or p-polarized
laser light. The p- polarized second harmonic signal was at least one order of magnitude stronger than the s- polarized signal and this was independent of the laser polarization. This means that the probe-labeled bilayer possessed reflection symmetry about any plane perpendicular to the plane of bilayer. Under such symmetry conditions, the only non-vanishing components of the second order
4030201000.00.10.20.30.40.50.60.70.80.9
SH signalSH responseReference phase
Time, sec
SH s
igna
l, a.
u.
Figure 3.7. Determination of the second harmonic generation de-pendence on membrane potential.

29
surface susceptibility χ are χzxx and χzzz.* The second order surface susceptibility components of the probe-labeled hemispherical bilayer, χzxx and χzzz, and their response to the transmembrane electric field, Dsp and Dpp, were determined from the measured second harmonic intensities, respectively Isp and Ipp, which are proportional to the square of the modulus of the corresponding susceptibilities. (The values Dsp and Dpp are simply the relative changes in SH signal caused by membrane potential modulation. )
Table 3.I provides comparative data for the three dyes, JPW1234,
JPW1259, and JPW1290. For the dyes JPW1234 and JPW1259, the value | χzxx|2/ |χzzz|2 is also given.
Table 3.I. Nonlinear optical responses of the dyes to transmembrane potential modulation.
Dye Dsp, % Dpp, % |χzxx|2/ |χzzz|2 JPW1234 2.2 ±0.8 2.2 ±0.8 1.0 ±0.5 JPW1259 3.7 ±0.8 2.8 ±0.9 1.2 ±0.5 JPW1290 3.2 ±1.0 2.2 ±0.9 ---
3.3.3 Discussion on the Mechanisms of the Voltage Dependence The molecules synthesized for these measurements have been designed
with appropriate donor and acceptor groups and engineered to bind to and orient within a lipid bilayer in order to exhibit a direct electronic response to alterations in membrane potential. As a result of this design, a change in the wavelength of the absorption maximum of such molecules is detected as a function of membrane potential and this translates into changes in the fluorescence intensity, which is the method that is presently used with such molecules to detect membrane voltage. 5 However, because the presence of strong donor and acceptor groups in these molecules can perturb π electron systems and result in large alterations in the molecular dipole in the vertically excited state, it is well known that these molecular species generally exhibit large nonlinear responses. Therefore, it seemed likely that the very same molecules, that have been shown to be effective in monitoring membrane potential using fluorescence methods would also be strong generators of second harmonic light. Furthermore, since the intensity of the second harmonic signal is related to the induced dipole it was a likely possibility that this signal would be inherently sensitive to membrane potential. * See Chapter 2.3 for details.

30
It is important to realize that a wide range of results have been obtained on the potentiometric responses of a variety of molecular probes3, 5, 13 and these results indicate that the second harmonic signal dependence on membrane potential can be caused by one of several factors. These include the orientational response of the dye to membrane potential3 which is often a main incorporation into electric field induced second harmonic generation or EFISH, 14 the possible redistribution of dye molecules with the electric field between different chemical environments such as the lipid membrane and the surrounding solution4 and the direct electronic response of the dye which is described by the cubic polarizability γijkl(-2ω,ω,ω,0). 14 These factors can be expressed as shown below to give the χ(eff), the effective surface susceptibility that is observed. χ(eff) = χ(or) + χ(env) + χ(e) (3.1) For different dyes and for various surroundings, the relative contribution of the terms in Eq. (3.1) will be different. For example, the first term in Eq. (3.1) is big for dyes which are known to rotate well in the membrane. Thus, if we had used merocyanine 540 in the experiments that measured alterations in the second harmonic signal with membrane potential then this term would have a major contribution. 3 Alternately, Nerstian dyes that partition into the membrane with alterations in membrane potential4 would be expected to have a dominant contribution from the second term in Eq. (3.1). Finally, the charge shift probes, 5 like the ones that were used in detecting the alterations in the second harmonic signal with membrane potential, are interesting due to the anticipated direct electronic effect on the second harmonic response to membrane potential which should be exhibited universally in various environments. 15 As noted above, these dyes are thought to undergo a large induced dipole after interacting with a photon. If the induced dipole is altered by the presence of membrane potential then this alteration is directly correlated with the molecular hyperpolarizability on which the surface susceptibility and finally the second harmonic signal depend. Thus, one explanation for our observations of the voltage sensitivity of this class of molecules that we have investigated is a direct effect of the membrane potential on the magnitude of the induced dipole.
In support of the dominant contribution in our results of the last term in Eq. (3.1) is the fact that there is no evidence that such dyes undergo a voltage-dependent partitioning in the membrane and in addition, are not likely to change their orientation in the membrane with membrane potential. The lack of change in orientation is the result of the excellent binding of these molecules in the membrane due to the hydrophobic side chains covalently linked to the aniline

31
nitrogen. The lateral diffusion coefficient of these dyes is equal to 10-8 cm2/s (unpublished results) and this is much less than the square area of the hemispherical lipid bilayer divided by time interval between two successive QS laser pulses, 10-2 cm2/s. This also indicates that migration of the probe molecules along the membrane is unlikely to contribute to the surface susceptibility alterations with membrane potential. Thus, the only term that can effectively describe such electric field induced alterations in the surface susceptibility is the last term in Eq. (3.1).
This external electric field dependence can be described by the electric field dependence of the βzzz component of the second-order polarizability tensor. Using a non-resonant two-level model, 16 βzzz can be expressed as
βz'z'z'(-2ω;ω,ω) = 3e2h-2
2me f
W(W2-(h-ω)2)(W2-(2h-ω)2)
δµex (3.2)
Here W is the energy of transition, hω is the fundamental photon energy, f is the oscillator strength, and δµex is the difference between the dipole moments in the ground and excited electronic states. The voltage dependent alterations in δµex result from the fact that the linear molecular polarizability in the excited state, Pex, is as a rule bigger than in ground state, Pgr, for molecules with long conjugated π- electron systems. 17 Thus we can write
βz'z'z'(-2ω;ω,ω) = 3e2h-2
2me f
W(W2-(h-ω)2)(W2-(2h-ω)2)
(δµex.0 + (Pex - Pgr)E)
(3.3) As a result we get a linear response of the second order polarizability to the electric field E. In this regard it is important to mention that the energy of the electronic transition W also depends on the external electric field due to electrochromism of a molecule (the Stark effect). It is this dependence which produces the electric field dependence of the optical response of these probes in conventional absorption/fluorescence measurement schemes. Furthermore, when either the fundamental or second harmonic photon energy is close to the electronic transition energy W, the electrochromic effect should be taken into account and Eq. (3.3) should be accordingly modified to account for damping. 18 In our case however, the JPW membrane bound dye absorption band is centered around 460 nm which is relatively far from second-harmonic resonance in our case (532 nm) and thus this effect should not be contributing significantly. In addition a reorientational mechanism is precluded by the data presented in Table 3.I since

32
both Dsp and Dpp have the same sign which would not take place if reorientation of these probes is taking place in the electric field. If reorientation of the dipole moment of the molecule was occurring it would lead to a response of opposite sign for these different polarization conditions. Thus all our data support a purely electronic effect as a major contributing factor of the electric field dependence of the surface susceptibility.
The probe molecules bind to the outer side of HLB by their hydrocarbon chains which favor orientation of the pyridinium ring near the aqueous interface. Calculations5, 19 predict that in the excited electronic state the positive charge of molecule is shifted from the pyridinium end towards hydrocarbon chain. In our case, since the dyes were bound to the outer side of HLB, that means the shift of charge is occurring towards the center of the HLB. Since Pex of a molecule is expected to be bigger than Pgr, a positive potential inside the HLB is expected to decrease the induced dipole moment, in accordance with (3.3). This leads to decreasing the second harmonic generation efficiency which we indeed have observed experimentally.
3.3.4 Estimate of Possibility of Real-Time Measurements of Membrane Potential with SHG An important aspect of this work is to arrive at an estimate of whether real-
time measurements of living cell membrane potentials could be made with the unique aspects of second harmonic detection of membrane potential. In such living cellular systems the time response that would be required would be below 1 ms. Since the time response of the second harmonic signal in a purely electronic mechanism is very fast <10 fs, the essential question is whether there is sufficient signal to noise to allow us to detect alterations in <1 ms. For this estimation, assume that the SHG measurement with a standard deviation 1% allows one to monitor the potential with sufficient accuracy. Based on this assumption and the results of this study, we believe that the best laser system for such measurements would be a cw mode-locked near IR laser source (e.g. a titanium sapphire system) working at a rate of 80-100 MHz. Such a laser system provides 1-5% pulse-to-pulse stability which is necessary for the 1% second harmonic detection accuracy we have assumed. Furthermore, the above mentioned accuracy requires at least 104 photons/1 ms, or a 107 photons/s signal power. In view of the above the question that remains is whether such a SHG efficiency can be reached? Let us assume that we are limited by an average intensity of the fundamental laser light which is equal to 300 W/cm2, which was a typical value in our experiments. Such

33
a near IR mode-locked tunable femtosecond laser system, operating at 300W/cm2 average intensity at a 100 MHz repetition rate and a 100 fs pulse duration, yields about 30 MW/cm2 peak intensity of the fundamental which is an order of magnitude less than the typical peak intensities of 260 MW/cm2 employed in the present experiments. Based on the above estimate of SHG from a probe-labeled lipid bilayer, only 1 photon at the second harmonic frequency is emitted per 100 fundamental femtosecond laser pulses which already gives a flux of 106 photons per second. Tuning the fundamental laser to 920 nm wavelength will bring the second harmonic emission into resonance with the electronic transition of these probes which should increase the signal20, 21 by a factor of 100 and yield up to 108 photons per second. Thus, the results obtained clearly indicate that SHG technique is readily applicable to detecting membrane potentials in living cell membranes. It should be noted in this regard that, the enhancement factors mentioned in the introduction, that are applicable if surface enhancement with silver particles is employed have not been incorporated into these calculations. With such enhancements the time resolution of the method can be improved.
3.3.5 Enhancing Sensitivity and Selectivity of the Method- SHG by Dye Monolayer on Rough Silver Surface So far, we demonstrated the sensitivity of SHG to the membrane potential
averaged over the illuminated area of the membrane. To measure localized membrane potentials, e.g., those around specific membrane protein channels, it is necessary to increase the amount of light emitted by a molecular probe. It has been known that SHG can be enhanced in the vicinity of a surface of a free-electron metal. For example, the efficiency of SHG from a silver-air or silver-water interface increased by several orders of magnitude upon roughening of the silver surface. 20, 21 A 50-fold increase of SHG was observed when about a monolayer of pyridine was adsorbed on electrochemically roughened silver surface. 22 The increase is thought to be associated with enhancement of local electric fields due to local surface-plasmon and lightning rod effects on the surface of nanometer-sized rod-like protrusions present on a rough surface.
As a first step in demonstration of enhancement of SHG in the vicinity of
a rough surface of a free-electron metal, we have chosen to investigate the en-hancement of a monolayer SHG of the potential-sensitive dyes adsorbed onto a rough silver surface. It is known that Raman scattering from monolayers of potential sensitive styryl dyes, such as di-4-ANEPPS, can be enhanced by several orders of magnitude by depositing the monolayer onto a heated silver film. 23

34
However, to the best of our knowledge, no study was performed on surface enhance-ment of SHG from a monolayer of charge-transfer dyes possessing high nonlinear optical constants. It would be of interest to estimate the surface enhancement of SHG by a monolayer of the same dyes that were used for monitoring the membrane potential with SHG. For this purpose, we compared SHG from a monolayer of JPW1259 dye deposited on a fused silica slide, with the SHG by the dye-covered rough silver surface. The dye monolayer on a fused silica substrate was prepared by spin-coating. The dye-covered rough silver surface was prepared in a following way. First, an 1-mm thick silver plate was mechanically polished and roughened in an electrolytical cell containing 0.1 M KCl solution in double-distilled water. The electrolytical cycling was performed four times, with the charge transfer about 36 mC/cm2 per cycle. Second, the dye solution was added to the electrolytical cell at a concen-tration of several hundreds of nanomoles, and the negative potential was applied to the silver plate in order to adsorb the positively charged dye to the surface of the plate. The arrangement of the cell (see Figure 3.8) allowed one to illuminate the roughened silver plate with the emission of Nd:YAG laser and to collect the diffusely scattered SH emission over a wide solid angle.
The intensity of a diffusely scattered SH emission was measured as a
function of the potential of roughened silver electrode for several concentrations of the dye. During the measurement, the negative voltage was applied to the electrode. For every given concentration of the dye, the voltage was increased in steps of 50 mV from 0 to about -1 V, and SHG at every value of this voltage was measured. The results of this experiment are presented in Figure 3.9.
PMTAg
Electrodes
Lens
HP filter
LP filter
IR beam
ELECTROLYTIC CELL
Figure 3.8. The experimental set-up used to measure the SHG from a dye-covered rough silver surface. Ag, silver plate; LP and HP, low-pass and high-pass filters, respectively; PMT, photomul-tiplier.

35
In this figure, the measured SHG intensity is plotted against the (negative) potential of the rough silver electrode for a set of aqueous concentrations of the (cationic) dye JPW1259. As is seen from this figure, the SHG intensity in the absence of the dye does not depend on potential of the electrode. When the dye was present, however, the sig-nal almost always showed a gradual increase until a certain value of the voltage was reached. The value of this increase was maximal at a concentration of the dye equal to 600 nM. We believe that at this concentration of the dye about a monolayer of the JPW1259 dye was adsorbed at the silver surface. At smaller concentration, less than a monolayer was adsorbed; and at bigger concentration, more than a monolayer was adsorbed at the surface, which led to decrease of SHG, as has been observed for pyridine. 22 The SHG signal for the smallest non-zero dye concentration used, 150 nM, is nearly constant. This probably results from a weaker adsorption of the dye from a highly diluted solution, which is counterbalanced by a laser-induced desorption of the dye molecules.
The maximal SHG intensity was at a concentration of the dye of 600 nM.
At this concentration, the SHG was about 3 orders of magnitude stronger than the intensities of SHG from a molecular monolayer spin-coated onto a fused silica plate. The exact value of enhancement was somewhat dependent on the conditions of preparation of the rough silver surface, and on estimations of the fraction of diffusely scattered light collected by the optical system. Besides, the magnitude of SHG from a dye-covered rough silver surface was strongly
1.00.80.60.40.20
1
2
no dye0.15 µM dye0.6 µM dye2.5 µM dye
U , V
SH in
tens
ity, a
. u.
Ag-AgCl
Figure 3.9. Enhancement of SHG by a rough silver surface.

36
dependent on the time interval between the end of electrolytic cycling and the addition of the dye into the solution. When the dye was added after 3 or more minutes after finishing the cycling, a weak or no increase at all of SHG relative to the rough silver surface was observed. We think that the clean silver surface is necessary in order the surface enhancement to be operative in this case. During the time interval between finishing the cycling and adding the dye, the silver surface can get contaminated by other molecules present in solution. 22 These molecules could prevent the dye molecules from direct contact with the silver surface. The latter observation, however, is difficult to match with purely electromagnetic mechanism of SHG enhancement. Thus, chemical mechanisms of enhancement are possibly operative in this case. Most probably, the surface nonlinearity of silver itself is modified by adsorbed dye molecules, which can be partially responsible for the enhancement of SHG observed in this experiment.* 3.4 Conclusion
In conclusion, we have demonstrated that the electric potential of a lipid membrane can be monitored by surface second harmonic generation. A hemispherical bilayer of oxidized cholesterol stained by potential sensitive styryl dyes was used for this demonstration. A qualitative explanation, based on a two level model and a direct electronic response of the induced dipole of a molecule to an external electric field correlates well with our observations. The results obtained clearly indicate that direct measurements of membrane potentials in living cells are possible with this method and such measurements can be obtained with the required time resolution. The surface enhancement phenomena were demonstrated to significantly increase the level of a non-linear optical signal. The intrinsic sensitivity of the technique, which promises excellent signal to noise and other important advantages, portends extensive use of this new approach.
* See Chapter 2.4 for details

37
References - Chapter 3 1. L. B. Cohen, B. M. Saltzberg, H. V. Davilla, W. N. Ross, D. Landowne, A.
S. Waggoner, and C. H. Wang, "Changes in axon fluorescence during activity: molecular probes of membrane potential". J. Membr. Biol. 19, 1-36 (1974).
2. L. M. Loew. “Spectroscopic Membrane Probes.” Chapt. 14-21. Boca Raton, Fl.: CRC Press Inc., 1988.
3. P. R. Dragsten and W. W. Webb, "Mechanism of the membrane potential sensitivity of the fluorescent membrane probe merocyanine 540". Biochemistry 17, 5228-5240 (1978).
4. P. J. Sims, A. S. Waggoner, C.-H. Wang, and J. F. Hoffman, "Studies on the mechanism by which cyanine dyes measure membrane potential in red blood cells and phosphatidylcholine vesicles". Biochemistry 13, 3315-3330 (1974).
5. E. F. Fluhler, V. G. Burnham, and L. M. Loew, "Spectra, membrane binding, and potentiometric responses of new charge shift probes". Biochemistry 24, 5749-5755 (1985).
6. T. Wilson and C. Sheppard. Theory and Practice of Scanning Optical Microscopy. London: Academic Press, 1984.
7. J. Wessel, "Surface-enhanced optical microscopy". J. Opt. Soc. Am. B 2, 1538-1541 (1985).
8. J. Y. Huang, A. Lewis, and L. Loew, "Nonlinear optical properties of potential sensitive styryl dyes". Biophys. J. 53, 665-670 (1988).
9. A. Hassner, D. Birnbaum, and L. M. Loew, "Charge-shift probes of membrane potential. Synthesis". J. Org. Chem. 49, 2546-2551 (1984).
10. H. T. Tien. Bilayer Lipid Membranes. New York: Dekker, 1974. 11. S. McLaughlin, "The electrostatic properties of membranes". Annu. Rev.
Biophys. Biophys. Chem. 18, 113-136 (1989). 12. T. F. Heinz, C. K. Chen, D. Ricard, and Y. R. Shen, "Spectroscopy of
molecular monolayers by resonant second-harmonic generation". Phys. Rev. Lett. 48, 478-481 (1982).
13. A. Duclic, "Some aspects of optical nonlinearity in a new class of conjugated molecules". Chem. Phys. 37, 57-61 (1979).
14. L.-T. Cheng, W. Tam, S. H. Stevenson, G. R. Meredith, G. Rikken, and S. R. Marder, "Experimental investigations of organic molecular nonlinear optical polarizabilities. 1. Methods and results on benzene and stilbene derivatives". J. Phys. Chem. 95, 10631-10643 (1991).

38
15. L. M. Loew, S. Scully, L. Simpson, and A. S. Waggoner, "Evidence for a charge-shift electrochromic mechanism in a probe of membrane potential". Nature 281, 497-499 (1979).
16. J. Zyss and D. S. Chemla. “Quantum Electronics - Principles and Applications.” In Nonlinear Optical Properties of Organic Molecules and Crystals, ed. D. S. Chemla and J. Zyss. 1. New York: Academic Press, 1987.
17. K. Clays and A. Persoons, "Hyper-Raleygh scattering in solution". Rev. Sci. Instrum. 63, 3285-3289 (1992).
18. Y. R. Shen. The Principles of Nonlinear Optics. New York: Wiley, 1984. 19. L. M. Loew, G. W. Bonneville, and J. Surow, "Charge-shift optical probes
of membrane potential. Theory". Biochemistry 17, 4065-4071 (1978). 20. C. K. Chen, A. R. B. de Castro, and Y. R. Shen, "Surface-enhanced second
harmonic generation". Phys. Rev. Lett. 46, 145-148 (1981). 21. G. T. Boyd, T. Rasing, J. R. R. Leite, and Y. R. Shen, "Local-field
enhancement on rough surfaces of metals, semimetals, and semiconductors with the use of optical second-harmonic generation". Phys. Rev. B 30, 519-526 (1984).
22. C. K. Chen, T. F. Heinz, D. Ricard, and Y. R. Shen, "Detection of molecular monolayers by optical second-harmonic generation". Phys. Rev. Lett. 46, 1010-1012 (1981).
23. J. Y. Huang, A. Lewis, and L. Loew, "Absorption and vibrational spectra of the surface properties of molecular monolayers with large light-induced dipole alterations". Spectrochimica Acta 44A, 793-803 (1988).
39
Chapter 4. PROBING PHOTOCHEMISTRY OF A MEMBRANE PROTEIN BACTERIORHODOPSIN (BR) WITH SECOND HARMONIC GENERATION - BR-K TRANSITION
4.1 Introduction
Second-harmonic generation (SHG) has been employed as a unique method to characterize the structure and function of biological systems. 1-3 In this chapter, we extend the previous applications of this probe in order to understand the mechanism of the photochemistry of the light induced proton pump bacteri-orhodopsin (bR) which is found in the purple membrane (PM) of Halobacterium halobium.
Numerous studies4-6 have been aimed at trying to resolve the fundamental
photochemical interactions in bR7 but this problem remains one of the outstanding questions in biophysics. In terms of the primary photochemical event it is known that within 450 femtoseconds the initial pigment state traverses the excited state and reaches the ground state photoproduct, called J. 8, 9 During this process, which occurs with 70% quantum efficiency, 10, 11 >23% of the photon energy is stored. 12 The question is what are the molecular processes involved in this photochemically based transformation.
The first intermediate that can be stabilized after photon absorption is not
J but K. K is produced from J in 3 picoseconds and lives for microseconds. K however can be stabilized at liquid nitrogen temperatures indefinitely and this has led to numerous studies being performed with a variety of spectroscopic tech-niques. 5, 6, 13
In terms of the optical spectroscopies available, non-linear optical interac-
tions provided by SHG, provide a set of unique advantages both experimentally and from the point of view of the information that can be extracted on structure and function of bR. The obtainable fundamental information includes details on the absolute structural orientation of the chromophore2 and the induced dipole, δµex, of the chromophore in the protein. 3 This information is obtained with an experimental technique that is relatively simple to implement, is non-bleaching using infrared probing beams, and has a large signal to noise ratio due to the gigantic non-linearities exhibited by bR. It is important to note that the near res-onant bR hyperpolarizability3, 14 measured at 1.064 µ, that is related to the induced dipole δµex of the bR chromophore, is 1.15 times bigger than the largest

40
resonant hyperpolarizability measured in specially optimized synthetic organic compounds. 15
In this chapter we compare the SHG of the initial pigment state bR568
with the photochemically generated K intermediate at 77 oK and derive from our data information on the induced dipole, δµex, of these two states. The data obtained is compared to a variety of bR states that can be produced with absorption maxima that mimic the red-shifted K state and all these results are analyzed in terms of the current theoretical understandings of SHG in conjugated polyenes. Finally, we analyze the data in terms of prevalent models that could define this primary event in bR.
4.2 Experimental Methodology
4.2.1 Films Preparation Two kinds of bR films were used in the experiments. Purple membrane-
poly(vinyl alcohol) (PM-PVA) films were chosen for their excellent optical quality and long-term stability. 16 Electric field-sedimented PM films17 possess a defined orientation of the PM fragments that stack onto a SnO2-covered glass in a highly oriented fashion that results in strong (p-polarized) SH signals.
Both kinds of films are prepared according to established procedures: 3, 16,
17 PM-PVA films - 5 g of PVA, Sigma, M.W. 25000, was dissolved by
boiling in 25 ml of 50 mM HEPES buffer adjusted to pH 7. PM - in the same buffer was carefully washed and per film produced a 0.5 ml of an OD 10 suspen-sion was used. 3-4 ml of the PVA solution at room temperature was gently mixed with 0.5 ml of the PM suspension and degassed. The resulting PM-PVA suspen-sion was spread onto a fused quartz plate, 5 cm in diameter. A slow flow of fil-tered dried air was used to dry the film overnight. The thickness of the dried film was about 0.2 mm with an OD of between 0.1 - 0.2. The absorption spectrum did not differ from that of an aqueous PM suspension at pH 7.
Electric field-sedimented PM films - PM was washed in double-distilled
water several times. 0.1 - 0.2 ml of the suspension was spread between a SnO2 - covered glass plate and a flat silver electrode. The distance between electrodes was 2 mm. Both electrodes touched the suspension and an electric field of 20-30

41
V/cm was applied for not more than 1 min. Excess water was then removed and the sample dried overnight in a humid environment.
4.2.2 Experimental Arrangement and Procedures The experimental arrangement (Figure 4.1) included a Q-switched mode-
locked Nd:YAG laser as the source of the fundamental exciting wavelength at 1064 nm.
The laser was operated at a frequency
of 80 Hz with an 80 mW average power, and a 2 mm beam diameter. In addition, there was the required polarizing and directing optics together with an x-cut quartz crystal followed by a rotatable glass plate (RGP). The x-cut quartz crystal was employed as a source of defined second-harmonic (SH) emission. The sample was cooled in an optical cryostat and the SH signal at 532 nm was detected with a cooled RCA C3104 photomultiplier. A set of appropriate spectral filters/monochromator were used to cut off the fundamental emission. The bR could be switched between photostationary states in which there were various concentrations of bR and K using a variety of light sources. These were a cw argon ion laser emitting light in the blue green and an incandescent lamp with appropriate filters for wavelength selection that were used to produce the bR/K species. A He-Ne laser and a diode laser emitting at 670 nm were also used in order to return the K species to bR.
A film of light-adapted bR containing 100% all-trans retinal (ATR) was
cooled down in the dark to 77 oK. The amplitude and phase of the second order susceptibility tensor components describing SHG at a wavelength of 532 nm
Pλ/2 F
x-cut RGP
F IF
LM PMT
Ar+He-NeDiode laser
QS:MLNd:YAG
bRα
Cryostat
L
Fiber
P
Figure 4.1. Experimental arrangement: QS:ML Nd:YAG, Coherent "Antares" Q-switched mode-locked Nd:YAG laser; P, Glan-Thompson polarizer; λ/2, phase plate; F, filter; x-cut, quartz plate; RGP, rotatable glass plate; L, lens; IF, 532 nm interference filter; M, 20 cm monochromator; PMT, cooled RCA C3104 photomultiplier.

42
(fundamental wavelength of 1064 nm) was then determined by measuring SHG signals from a bR film illuminated with cw visible light at various wavelengths using different polarization angles of the linearly polarized fundamental laser beam. The illumination with visible light shifted photostationary concentrations of the bR568 and K photointermediates and this resulted in a change of the SH intensity and phase. These changes of the magnitude and phase of the SHG caused by changes in the relative bR/K composition of the film induced with the visible light were recorded and processed to assess the change of the induced dipole of the retinal chromophore of bR upon the bR568->K transition.
The measurement of phase of SHG, or the phase of second order
susceptibility of bR film, was performed in the following way. A 1.196-mm thick x-cut quartz plate was inserted into the path of the fundamental infrared beam (Figure 4.1). The plate itself generated SH signal that had intensity equal to that of the bR film when the plate is tuned to one of the maxima of Maker fringes. The phases of SHG from the both sources were, of course, fixed relative to the phase of (squared) fundamental emission; they were determined by the phases of corresponding second order susceptibilities. The rotatable glass plate, marked as RGP in Figure 4.1, was placed between the two SHG sources (the x-cut plate and the bR film) to serve as a dispersive element modulating relative phase of the squared fundamental wave and the wave of SH generated by the quartz plate. From the interference pattern from the two SHG sources, obtained by slow (0.5o/min) rotating of the glass plate, the phase of nonlinear susceptibility of the bR sample can be determined. 18
4.3 Theoretical Approach
Since a main objective of this work is to obtain information on the induced dipoles in the bR, K and other states of bR we first review the theoretical approach that leads from the observed macroscopic SHG intensities to the induced dipoles of the chromophore that are of interest to us. The intensity I2ω of the SHG is related to the non-linear susceptibility χ(2). The non-linear susceptibility is related to the molecular hyperpolarizability tensor β.
Quantum-chemical calculations19 and Stark effect spectroscopy experi-
ments20 have demonstrated that the lowest energy electronic transition of the retinylidene chromophore includes a significant degree of charge transfer (CT) character along the long molecular axis z'. Since the SH frequency is close to the frequency of this transition, the near-resonant hyperpolarizability tensor β is

43
dominated by only one component and this component, βz'z'z', is shown below21,
22
βz'z'z' = e2
2meωng fδµex
⎩⎪⎨⎪⎧
1(ωng−ω+ιΓ)(ωng−2ω+ιΓ) +
+ ⎭⎪⎬⎪⎫1
(ωng+ω−ιΓ)(ωng+2ω−ιΓ) + 1
(ωng+ω−ιΓ)(ωng−ω+ιΓ) (4.1)
where ωng is the transition frequency, ω is the exciting laser frequency, f is oscillator strength of the transition, δµex is the induced dipole, and Γ is the damping constant. As can be seen in the above expression, the induced dipole, δµex , is proportional to βz'z'z' and can be calculated from ωng, f, Γ, and βz'z'z'. The values ωng and f are calculated from the known absorption spectra of bR568 and K. 23 The contribution of the lowest electronic transition into the absorption spectra of bR568 and K is approximated with a log-normal function. This allows one to minimize possible incorporation from higher electronic transitions into calculated values of ωng and f.
The incorporation of other higher electronic states into β itself is thought to be negligible, for several reasons. First, there is ample experimental evidence (see for a example Chemla and Zyss 22) that the two-level approximation of the second order polarizability, β, works remarkably well for CT molecules. Second, there is a good correlation between the induced dipoles of retinal Schiff bases obtained, on the one hand, from SHG3, 24 and, on the other, from the very different technique of Stark effect spectroscopy. 20 It is important that the induced dipoles calculated based on the SH results of these investigations were also based on this same two level model and comparisons with Stark effect spectroscopy were within 5-6%. Third, the higher electronic states are off-resonant and should not change considerably in the bR-K transition.

44
The absorption spectra of bR and K are shown in Figure 4.2. The value of
ΓbR was taken from the literature. 8 The value of ΓK was estimated experimentally by comparing phases of near-resonant complex χ(2)bR and χ(2)K. The value of molecular hyperpolarizability βz'z'z' of retinal chromophore can be found from component(s) of tensor of non-linear susceptibility χ(2). The connection between the molecular hyperpolarizability βz'z'z' and components of the macroscopic non-linear susceptibility χ(2) can be written25 as:
χ(2)zzz = NL2ωLωLω<cos3θ>βz'z'z' (4.2) χ(2)zxx = χ(2)xzx= χ(2)xxz= (N/2)L2ωLωLω<cosθsin2θ>βz'z'z' (4.3)
Since our films are rotationally invariant, all the other components of χ(2) =0. In equations (4.2) and (4.3), θ is the molecular inclination angle relative to the surface normal of the film, N is the density of the molecules, L2ω and Lω are the Lorentz-type local field factors defined as L2ω=(n2ω2+2)/3 (Lω=(nω2+2)/3) and <> indicates the averaging over all orientations. The average molecular inclination angle θ and distribution of θ of retinal in electric field-sedimented PM and PM-PVA films can be determined from measurements of SHG with different input/output polarizations; besides, it is available from literature. 2, 3 Finally, the second order susceptibility tensor for the case of SHG is directly related to macroscopic SH signals21, 22
242220181614120
20
40
60
80
, cm *10
Extin
ctio
n co
eff.,
10
M c
m-3
-1-1
ν -1 -3
bR
K
Figure 4.2. Absorption spectra of bR568 and K. 23 Squares, bR568; circles, K. Solid line, log-normal fit.

45
I2ω/Iω2 = 32π3ω2
c3εω ε2ω |e2ω . χ(2) : eωeω|2 •
• 2exp(-(αω+α2ω/2)z)⎣⎢⎡
⎦⎥⎤cosh(Δαz)-cos(πz/Lcoh)
(Δα)2+(π/Lcoh)2 , (4.4)
Lcoh ≡ λ/4|n2ω-nω| ,
Δα ≡ αω - 12 α2ω ,
where εω (ε2ω), nω (n2ω), and αω (α2ω) are dielectric constants, indices of refraction, and absorption coefficients of a film at frequencies ω and 2ω, respectively, χ(2) is the second order susceptibility, e2ω and eω are the unit vectors denoting the direction of the electric field vectors of the light waves at 2ω and ω, respectively, z is the length of the beam path inside the film, and Lcoh is so-called coherence length. Note that the films used are practically transparent at the fundamental laser frequency ω, so we assumed αω =0. Thus, the SHG intensities can be related to the induced dipole of the retinal chromophore in bR if conservative assumptions are made concerning the dielectric constants involved.
It is important to note that both the bR-K transition and deionization of the membrane (see below) are accompanied by a red-shift in the absorption maximum of the bR chromophore. The value of the shift in both cases is about 30 nm. Theoretically, it could change the indices of refraction, n2ω and nω, of the film, which would lead to the change of the local field correction factors and (complex) Fresnel transmission coefficients. However, all these effects are insignificant as we show below.
To estimate the order of magnitude of these effects, we calculated the
incorporation of the absorption peak around λο=568 nm into the complex index of refraction, n=n'-iæ where æ = αλ/4π, n'-1=2æ(ω0-ω)/γ and a typical absorption coefficient of the electric field-sedimented bR film at 568 nm is α(λο)=2.3*103 cm-1. For the value of γ, the full width at half maximum (FWHM) of the bR absorption contour was taken. The estimate gives æ ≤ 0.94*10-2 and n'-1 < 0.005. The last value is in line with the experimental esti-mations of coherence length of the near-resonant SHG in bR films. 26-28 The calculations show that during the transition bR568->bR600 (or bR568->K), the local field factor changes by < 0.05%, and the complex Fresnel factors change by < 0.1% (module) and < 0.2o (phase). It is clear that such small effects need not be accounted for and thus they were neglected in the data analysis.

46
At liquid nitrogen temperatures, the K state of bR can be stabilized. 5, 6, 13 By illuminating a bR sample containing molecules in the initial pigment state bR568 with green or yellow light, a certain amount of molecules can be driven into the K state. However, a back photoreaction exists driving bR molecules in the K state back to the initial state. Since the absorption spectra of bR568 and K states strongly overlap (see Figure 4.2), one can not drive all the molecules to K by illuminating the sample with visible light. Nonetheless, we can calculate the molar ratio of the bR568 and K states in the sample at the known wavelength of the illuminating light and deduce from our measurements the values of the second order susceptibilities of (hypothetic) bR samples containing 100% of bR568 or 100% of K. The details of this calculation can be seen in the second part of Appendix.

47
4.4 Results
4.4.1 bR-K Experiment 4.4.1.1 SHG Measurements We measured SHG by PM-PVA bR films at 77 oK illuminated with cw
visible light at a set of wavelengths. The results are shown in Figure 4.3.
This figure displays the SHG intensity as a function of wavelength and intensity of the visible cw light used to switch bR molecules between the bR and K states. The average intensity of the p-polarized fundamental laser beam at 1064 nm, used to produce SHG, was kept constant at a level of 2.5 W/cm2. The SHG signals observed at illumination of the sample with green light (488 or 514.5 nm - squares or circles in Figure 4.3, respectively) were divided by the SHG signals which were observed when the sample was illuminated with red light (632.8 nm at an intensity of 100 mW/cm2 ). The filled triangle in Figure 4.3 is the SH signal from the film illuminated by 514 nm light normalized by the SH signal when the same film was subsequently illuminated by a 680 nm light at an intensity of about 5 mW/cm2. The normalized signals are plotted in Figure 4.3 against the intensity of green light. This form of presentation of the data was chosen because at red illumination almost all bR molecules return to the initial pigment state. With green
1000010001001010.00.10.20.30.40.50.60.70.80.91.0
488 nm - 633 nm514 nm - 633 nm514 nm - 680 nm
Intensity of cw light, mW/cm
Norm
aliz
ed S
H in
tens
ity
2
Figure 4.3. Second harmonic (SH) signal Ipp(2ω) at 532 nm from the purple membrane - poly(vinyl alcohol) (PM-PVA) film at 77 oK. The signal is shown as a function of intensity of visible light used to pump the K state.

48
illumination, a certain amount of the molecules (about 51%, depending on wavelength) goes to K state. Therefore, the experimental points in Figure 4.3 represent the relative decrease of the SHG intensity when a known part of the molecules goes from the bR568 to K state.
The excellent stability of the film, i. e. the absence of bleaching of the film
by either of infrared or cw visible beams, was proved by the fact that, as can be seen from this figure, the average values of SHG do not depend on the intensity of the switching light. Indeed, at liquid nitrogen temperatures both bR568 and K states are stable (there are no thermal backreactions) and therefore the relative bR/K composition, which determines the value of SHG signal, is not influenced by the intensity of the switching light. It depends only on its wavelength. Thus, the possible changes of the SHG intensity with the intensity of the cw monochromatic light, when the fundamental light intensity is constant, could only be caused by deterioration of the film. Such changes were not observed even at the intensity of the cw illumination reaching 2 W/cm2. In addition, the quadratic dependence of the SHG signal on fundamental light intensity was checked (data not shown) to make sure that the measurements were performed with infrared light intensity well below the damage level of the film. Analogous experiments were performed with electric field-sedimented films and, after correction for self-absorption, gave similar results.
From these experimental results, we calculated the ratio
ρ≡ χ(2)zzz(K)/χ(2)zzz(bR) on the basis of formulas (4.4) above and (1A) and (4A) in the Appendix. To obtain hyperpolarizability of retinal chromophore from χ(2)zzz, one has to know the molecular inclination angle θ (see formulas (4.2) and (4.3)). One of the ways of determination of θ consists in measuring SH signals at three values of the angle of polarization of linearly polarized fundamental emission, equal to 0o, 45o, and 90o. 25 We performed such measurements for a bR film with two maximally different one from another bR568/K compositions. Again, the intensity of the fundamental laser beam at 1064 nm was kept constant, and the sample was illuminated with visible monochromatic light at different wavelengths in order to change the relative bR568/K composition of the film. For every wavelength, the SHG intensities were measured at input/output polarizations depicted as pp, 45p, sp, ps, and ss. The SHG intensities were normalized by the p-polarized component of SHG intensity observed with the p-polarized fundamental beam, Ipp. In other words, Ipp=1 by definition for every wavelength. The results are presented in Table 4.I.

49
Table 4.I: Polarization dependence of SHG at 532 nm from electric-field oriented dried PM films under different illumination conditions at 77 oK. Polarization condition Illuminating
wavelengths, nm Normalized SHG I/Ipp a
pp 514.5 (670) 1.0(1.0) 45p 514.5 (670) 0.47(0.46) sp 514.5 (670) 0.09(0.09) ps 514.5 (670) 0.01(0.01) ss 514.5 (670) 0.01(0.01) a The values out of parentheses and in parentheses are for the case of illuminating the sample with the light at a wavelength 514.5 and 670 nm, respectively.
The values without parentheses represent SHG for the case when a film was illuminated with a monochromatic light at 514.5 nm, which drove 51% of the molecules into the K state. Values in parentheses represent analogously normal-ized SHG signals observed when the sample was illuminated with red light at a wavelength of 670 nm, which returned all molecules back into the initial bR568 state. It is seen from Table 4.I that the SHG intensities, normalized by Ipp, for the film with 51% of K appeared to be equal to corresponding intensities for the film with 0% of K within the experimental error, about 0.01. We calculated that this error corresponds to accuracy of measurement of θ = 7o. Thus, no reorientation of bR chromophore was detected upon the bR->K transition. It has been shown using time-resolved linear dichroism that the angles relative to the surface normal of θbR = θK29 and our experiments have provided additional verification to these results.
4.4.1.2 Second Order Polarizabilities of bR and K The equality of θbR and θK simplifies calculation of βK/βbR, which is nec-
essary for obtaining ratio of induced dipoles sought for, δµexK/δµexbR. It follows from (4.2) and (4.3) that
βK/βbR = χ(2)K/χ(2)bR, φ(βK)-φ(βbR) = φ(χ(2)K)-φ(χ(2)bR), (4.5)
where φ(β) and φ(χ(2)) are the phases of β and χ(2). To calculate δµexK/δµexbR, we define the conversion factors, FbR and FK, relating δµex to β, via the depen-dence

50
δµexbR ≡ (FbR/fbR)βbR, (4.6) δµexK ≡ (FK/fK)βK,
where f is oscillator strength of the transition. Formulas (4.6) and (4.1) define factors F as a function of ω, ωng, and Γ. Figures 4.4A and 4.4B illustrate as a function of laser wavelength (Figure 4.4A) and the value of the assumed damping constant of K, ΓK, (Figure 4.4B) the difference in the phase shifts of the bR and K susceptibilities, φ(χ(2)K)-φ(χ(2)bR) (outer vertical axes in Figures 4.4A, 4.4B), and the ratio of above defined conversion factors FK/FbR (inner vertical axes in Figures 4.4A, 4.4B).
In Figures 4.4A and 4.4B, the value of 1200 cm-1 was taken for the damping constant of the bR568 state, ΓbR, which is in accordance with the results on femtosecond hole-burning. 8 The damping constant for the K state was estimated
12001000800600400-40
-30
-20
-10
0
10
0.8
1.0
1.2
1.4
1.6
1.8
λ
F /
F
, nm
, deg
ree
φ(χ
)−φ
(χ
)
(2)
K(2
)bR K
bR
2000150010000.8
1.0
1.2
1.4
1.6
1.8
-40
-30
-20
-10
0
10
, cmΓK- 1
φ(χ
)−φ
(χ
)
(2)
(2)
KbR
A B Figure 4.4. The phase shift (in degrees) between the second order susceptibilities of the PM-PVA film consisting of bR molecules in the K and bR568 states, and the factor FK, that converts βz'z'z' to δµex for bR molecules in the K state (see Equation 4.6). This factor is normalized by the FbR factor of the bR568 state. Both values are calculated and plotted as a function of (Figure 4.4A) fundamental emission wavelength and (Figure 4.4B) the damping constant of the K state ΓK. The phase shift is shown as a dashed-dotted line and the conversion factors ratio is shown as a solid line. In this calculation, the values of 568 nm and 1200 cm-1 were used, respectively, as the resonant frequency and the damping constant of the bR molecule in the bR568 state. For the K state in Figure 4A, these values are taken to be 600 nm and 1500 cm-1. In calculations rep-resented in Figure 4.4B, the fundamental wavelength is 1064 nm.

51
to be ΓK = 1500 cm-1 from the second harmonic interference experiment described in the Materials and Methods section above.
4.4.1.3 SHG Interference Experiment and Induced Dipole Change Upon bR-K Transition Note that the absolute values of phases of χ(2)K or χ(2)bR are not needed in
calculations of mole fractions of bR568 and K (see Equations 3A and 4A in the Appendix) and in the calculation of δµexK/δµexbR. We therefore restricted ourselves to the measurement of the phase shift of χ(2) which occurs when a film containing only bR568 species is illuminated with green light at 514.5 nm driving about half of the molecules to the K state. Such a shift is equal to the phase shift of the SH interference pattern observed after the green light illumination relative to the interference pattern observed before the illumination. Figure 4.5 illustrates phase shift measurements between the SH signal from a bR film containing 100% of bR568 and the SH signal from a film containing a mixture of 49% bR568 and 51% of K.
From this measurement, a phase shift of about 6o between second order suscepti-bilities was obtained. The result is in a good agreement with the calculations
3432302826240.2
0.4
0.6
0.8
1.0
1.2
Rotation angle of the glass plate, degree
SHG
inte
nsity
, a. u
.
Figure 4.5. Second harmonic interference patterns obtained with the electric field-sedimented bR film and X-cut 1.196 mm -thick quartz plate. The film was switched between bR and K states by illuminating the film with light at 514.5 and 670 nm at an intensity about 100 mW/cm2 for 10 min. Boxes + solid line, 514.5 nm illu-mination; circles + dashed line, 670 nm illumination.

52
predicting a value of 11.2o for the nonlinear susceptibility phase shift of a (hypothetic) film containing 100% of K relative to the susceptibility of a film containing 100% of bR568 at a wavelength 1064 nm using a damping constant of the K state ΓK = 1500 cm-1 (see Figures 4.4A, 4.4B).
The results of the measurements and calculations are summarized in Table 4.II. The results of 5 independent experiments with different bR film types
yielded similar values for induced dipoles ratio δµKδµbR with average value of 1.13.
Table 4.II: Comparison of the nonlinear optical properties of bacteriorhodopsin molecule in the bR568 and K states. Expt. # Film type O D λ1, λ2 [nm]a CK(λ1),
CK(λ2)b I2ω(λ1)I2ω(λ2)
c
1 PM-PVA 0.105 514.5, 632.8 0.509, 0.182 0.882 2 PM-PVA 0.105 488, 632.8 0.513, 0.182 0.873 3 PM-PVA 0.105 514.5, 680 0.509, 0.0 0.846 4 ELECTRIC
FIELD SEDIMENTED (EFS)
1.3 514.5, 670 0.509, 0.0 0.86
5 EFS 3 514.5, 670 0.509, 0.0 0.851 Table 4.II (continued)
Expt. # βKβbR d
FKFbR d fK
fbR e Induced
dipole δµKδµbR
1 0.828 1.34 0.987 1.12 2 0.817 1.34 0.987 1.11 3 0.854 1.34 0.987 1.16 4 0.83 1.34 0.987 1.13 5 0.84 1.34 0.987 1.14 a The SHG at 532 nm (fundamental emission at 1064 nm) by PM films was measured with continuous illumination at the wavelengths shown in this column. b The following values of absorption cross-sections of the bR intermediates are taken23 for the calculation of the mole fractions of K CK(λ1) and CK(λ2): σbR(488 nm) = 6.49*10-17 cm2; σK(488 nm) = 4.2*10-17 cm2; σbR(514.5 nm) = 1.22*10-16 cm2; σK(514.5 nm) = 8.02*10-17 cm2;

53
σbR(632.8 nm) = 5.35*10-17 cm2; σK(632.8 nm) = 1.64*10-16 cm2; σbR(680 nm) = 0.0*10-17 cm2; σK(680 nm) = 4.6*10-17 cm2 . The quantum yields of the bR->K and K->bR photoreactions are taken to be ΦbR->K= 0.64; ΦK->bR= 0.94 independently on wavelength. 10, 11
c The measured values of SH intensities are corrected for self-absorption according to Eq. 1A in the Appendix. d In these calculations, the resonant wavelengths and damping constants of bR568 and K states are taken to be 568 nm and 1200 cm-1; 600 nm and 1500 cm-1, respectively. F-factors are defined in formula (4.6). e The ratio of oscillator strengths fK/fbR was calculated on the basis of the molar absorption spectra of the bR568 and K photointermediates (Figure 4.2). The contribution of higher electronic transitions was subtracted from the absorption spectra by fitting spectra with a log-normal function.
4.4.2 Deionized Membrane Experiment Prolonged sedimentation of purple membrane by an electrophoretic
method causes a blue membrane with a red shift in the absorption maximum. 30 We believe that the electric field used for sedimentation deionizes the membrane by extracting cations which shift the absorption from 570 nm to 600 nm at neutral pH. 31-34 An alternate way to achieve what appears to be the same result is to lower the pH and this purple to blue transition occurs at a pKa = 2.9.
4.4.2.1 SHG Measurements We have measured the effect that the deionization produced by an electric
field has on SHG of the membrane. To increase the accuracy of the experiment, we worked with the same membrane monitoring SHG continuously during application of electric field, rather than measuring the SHG from two different film samples, light-adapted and deionized. To monitor the second harmonic from such an electric field deionized film, we slightly changed the experimental set-up described in the Experimental Methodology section. Specifically we removed the optical cryostat used in bR-K experiment and arranged that infrared light was able to pass through a small hole in a glass-covered Ag electrode during the application of the electric field. For the experiment the purple membrane film was prepared by the electrophoretic method17 from 50 microliter of 3.4 mg/ml water suspension. Then it was light-adapted and covered with 50 microliter of double-distilled water. The silver electrode was in contact with the upper part of the water drop, so that the drop was "sandwiched" between a bR film on a SnO2

54
glass electrode which can be called 1 and the silver plate electrode, called 2. The distance between electrodes 1 and 2 was 2 mm and the applied voltage was 5 V. The measurements of SH signal were performed at various polarizations of the incoming laser beam to assess possible reorientation of the membrane fragments during the deionized membrane formation. Both pp- and sp-polarized signals were monitored. 25
Upon wetting of the film, the SHG signal dropped rapidly, and the ratio
Ipp/Isp decreased. This indicated that the degree of orientation of the membrane fragments decreased. However, when the electric field was turned on, the SH signal again increased and reached the plateau marked "bR LA" in Figure 4.6.
At this moment, the Ipp/Isp ratio again increased and remained constant during the rest of the experiment. Thus, the rapid initial increase of the SHG signal after the electric field was turned on is caused by alignment of the purple membrane (PM) fragments by external electric field. (This is similar to the alignment which is observed when oriented PM films of this kind are prepared). In approximately 3 minutes after the voltage was turned on, a slight drop of the SHG intensity was observed. Note that this time no reorientation of the membrane fragments was detected. Auxiliary absorption experiments have shown that in 3 minutes after turning on the voltage, under our experimental conditions, the absorption
86420-2-40.0
0.2
0.4
0.6
0.8
1.0
1.2
550
600
650
700
Time, min
bR LAbR DI
Electric field on
Figure 4.6. Electric field-induced deionization of the purple membrane monitored by SHG. Second harmonic intensity (small dots, top) and absorption maximum wavelength λmax of the film (big squares, bottom) are plotted versus time. The electric field was switched on at t = 0 minutes.

55
maximum of the membrane shifts from 568 to 600 nm. Big boxes in Figure 4.6 indicate the membrane absorption maximum as a function of time which was measured in a separate experiment. A good correlation in time is seen in Figure 4.6 between the drop of SH intensity from "bR LA" to the "bR DI" level and the change of the position of the absorption maximum from 568 to 600 nm. The experiment was repeated several times, and the results were steadily reproduced. We therefore attributed the drop in the SH intensity to the formation of deionized membrane ("bR DI" in Figure 4.6).
4.4.2.2 Induced Dipole Change Upon Deionization of Purple Membrane To calculate the induced dipole change upon deionization of the
membrane according to the methodology described above, the absorption spectra of light-adapted and deionized membranes should be known. We have measured the absorption spectra of the same membrane before and after a 4 min application of the electric field, and the results are presented in Figure 4.7.
The relative change of the induced dipole of the retinal chromophore in
bR upon deionization of the membrane was calculated on the basis of formulas (4.1)-(4.4) in the text and (1A) in the Appendix using the methodology developed for the bR-K experiment. It was assumed that the deionized membrane contained
2826242220181614120
20
40
60
80
ν
Extin
ctio
n co
eff.,
10
*M
cm
-3-1
-1
, cm *10- 1 - 3
Figure 4.7. Absorption spectra of bR568 and bR600 (deionized membrane). Squares, light-adapted bR568 (bR LA); circles, bR600 (bR DI). Solid lines, log-normal fit of the lowest electronic transition bands.

56
100% of bR600. As noted above, the comparison of SHG in the sp- and pp- polarization geometry as a result of deionization of the membrane indicated that the orientation of the retinal chromophore does not change upon deionization of the membrane. Polarization measurements are much more sensitive to variations in molecular orientation than simply measurements of the SHG intensities. Therefore we assumed that no reorientation of the retinal chromophore occurs during deionization, and
βbR600/βbR568 = χ(2)bR600/χ(2)bR568, φ(βbR600)-φ(βbR568) = φ(χ(2)bR600)-φ(χ(2)bR568), (4.7)
in analogy with equations (4.5).
The results of the absorption and nonlinear optical measurements for deionized membrane are summarized in Table 4.III. The value of the induced dipole ratio, calculated on the basis of our experimental data, appeared to be δµbR600δµbR568 = 1.07.
Table 4.III: Comparison of the nonlinear optical properties of the bacteriorhodopsin molecule in the bR568 and bR600 states. O D IbR600
IbR568 a
βbR600βbR568
FbR600FbR568
b
fbR600fbR568
c Induced
dipole δµbR600δµbR568
0.5 0.76+0.05 0.87+0.04 1.30+0.02 1.06+0.05 1.07+0.09 a The measured values of the SH intensities were corrected for self-absorption according to Eq. 1A in the Appendix. b The damping constant for bR600 was taken to be 1350 cm-1. F-factors are defined as δµbR ≡ (FbR/fbR)βbR. c The ratio of the oscillator strengths was estimated from the corresponding absorption spectra (Figure 4.7).

57
4.5 Discussion
4.5.1 Estimation of Experimental Errors The value of the relative induced dipole change of the retinal chromophore
in going from bR568 to K (see Table 4.II) depends on several values taken from the literature, namely the quantum yields of bR-K and K-bR photoreactions, the ratio of oscillator strengths, λmax and the Γ of both states. We have used recently accepted values for the quantum yields of the forward, bR->K, and backward, K->bR, photoreactions, equal to ΦbR->K= 0.64+0.04; ΦK->bR= 0.94+0.06 that do not depend on wavelength. 10, 11 The absorption spectrum of K, necessary for calculation of the oscillator strength and λmax , is not fully established. We have taken the absorption spectrum of K from the work of Varo et al. 23 This spectrum has a λmax at 600 nm for the K state at room temperature, whereas our measurements were performed at 77 oK. It is believed that the λmax of the K state at 77 oK is red-shifted relative to the λmax of the K state at room temperature35 but there is no agreement about the value of this red shift. We note that whatever this further red shift would be, its account would only increase the calculated value of induced dipole of K. We therefore have adopted λmaxK = 600 nm in our calculations to make sure that any additional red shift of the λmaxK of K at low temperature does not influence our qualitative conclusions.
Another systematic error could arise from an error in estimation of the
damping constants, ΓbR and ΓK. There are estimations of ΓbR in the literature8 but the value of ΓK was never measured. The SH interference results, presented in Figure 4.5, assumed a value of 1500 cm-1 for ΓK. In Figure 4.4B this damping constant for K was varied around this value, and the results (the ratio FK/FbR determined above, and phase shift φ between χ(2) of bR568 and χ(2) of K species) are relatively insensitive to the value of ΓK. For example, it is seen from Figure 4.4B that a 100 cm-1 error in ΓK corresponds to only a 2% error in FK/FbR . By taking into account all possible errors, we calculated that the experimental error in determination of induced dipole ratio in the bR-K experiment was less than
0.1. The induced dipole ratio was calculated to be δµKδµbR = 1.13. Therefore, our
SHG measurements indicate that there is an increase of induced dipole of the retinal chromophore in going from bR to K. This is the case even though it is generally believed that the K intermediate has chromophore in the 13-cis configuration and the results on comparing all trans and 13 cis configuration of retinal indicate that the cis form generally has a lower induced dipole. 27

58
We turn now to the results on deionized membrane, bR600, presented in Table 4.III. The absorption spectra of bR600 were measured rather than taken from the literature (Figure 4.7), and the λmax and oscillator strength were calculated directly from these spectra. The value of ΓbR600 was taken to be 1350 + 100 cm-1 on the basis of a comparison of the absorption spectra of bR568 and bR600. An analysis of the experimental errors as discussed above has yielded the value of the experimental error in the induced dipole ratio for this case of 9%. Although the induced dipole of deionized bR exceeds the induced dipole of light adapted bR by only 7%, i. e. on the order of the experimental error, our data strongly suggest that there is an increase of the induced dipole of the retinal chromophore upon deionization of the purple membrane and this is similar to the bR->K transition.
4.5.2 Correlations Between Linear and Nonlinear Optical Properties of bR Chromophore The obvious regularity that can be seen in the data on the induced dipoles
in both the K and deionized membranes, is that the increase of the induced dipole of the retinal chromophore is accompanied by a red-shift in the wavelength of the absorption maximum, λmax. Indeed, both the K state and the deionized form of bR are red-shifted relative to the light-adapted (LA) form, and for both species an increase of δµex relative to δµex of the LA form of bR was observed. This trend is supported by the data on the induced dipoles of the dark-adapted and acidic forms of bR28 and even by data on the δµex of protonated n-butylamine retinal Schiff base (PRSB), in dioxane solution. 20
These observations can be explained by noting that the PRSB molecule is
a substituted polyene in which the first electronic transition has a charge transfer character. It is known that the position of the optical absorption maximum of such molecules is related to the degree of delocalization of the π-electron system of the polyene36 which is directly influenced by substituents on the polyene chain and by interactions of the chromophore with its protein environment. On the other hand, the second-order polarizability β and induced dipole δµex of many substituted organic molecules with delocalized electron distributions are sensitive to π-electron delocalization. Recently, this has been elegantly described by Marder et al. 15, 37 These authors use the bond-length alternation parameter <δr>, which is simply the average difference in distance between adjacent C-C and C=C atoms in the π-electron bridge, as a measure of the influence of donor/acceptor strengths of polyene end groups on delocalization in the polyene

59
chain. According to their calculations, the functional dependence of δµex as a function of <δr> has a bell-like shape. For cyanines or neutral chromophores substituted with strong donor/acceptor <δr> =0 and δµex =0. The function reaches a maximum when <δr> reaches some non-zero value, between 0.03 to 0.05 Å, 15 and than again decreases, reaching the minimum at some maximal <δr>=0.11 Å for an unsubstituted polyene. If we assume that the induced dipole δµex of PRSB in different environments depends on <δr> in this way, we can explain the correlation between λmax and δµex seen in our data both for the K state (see Table 4.II) and for the deionized form of the purple membrane (see Table 4.III) in terms of sensitivity of both λmax and δµex to bond length alternation <δr> which, in its turn, depends on the immediate environment of the chromophore which is different in different species.
4.5.3 Integration of the Results It would be of interest to plot values of δµex as a function of <δr> for
light-adapted bR, K, and deionized membrane. Unfortunately, not much is known about the values of <δr> of the above species. The only data reported so far include the average values of single and double bonds in all-trans retinal (ATR) 38 and in a close analog of a protonated retinal Schiff base, N-methyl-N-phenylretinal iminium perchlorate (NIP), 39 measured by x-ray diffraction. As can be deduced from these data, the polyene chain of ATR has a high degree of bond alternation with <δr>=0.124 Å, and the bond alternation parameter of NIP molecule is equal to 0.08 Å. The polyene backbone of these molecules is therefore highly bond alternated, and it can be expected that a decrease of the bond alternation parameter <δr> is accompanied by an increase of the induced dipole, δµex, as it follows from Marder's theory. 15, 37
A well-known spectroscopic measure of the degree of the π-electron delo-
calization is the frequency of the C=C stretching vibrational mode. This C=C stretching frequency has been shown to be directly correlated to the absorption maxima of bR and its intermediates. 36 In view of these previous correlations we have plotted in Figure 4.8 the λmax and δµex obtained from the results in this the-sis and in a previous work28 as a function of the C=C vibrational frequency, νc=c, of the retinylidene chromophore of light-adapted bR, dark-adapted bR, the K state (at 77 oK), acidic and deionized membranes, and PRSB in dioxane solution. The results on deionized membrane and K are indicated in bold text. Absorption maxima of the various bR states are shown with circles, and induced dipole values are represented with squares. The RR data are taken from Refs. 5, 40-42

60
The induced dipole of the all-trans PRSB is taken from Ref. 20 For each of the functional dependencies presented in Figure 4.8 quazilinear relationships are seen.
The fact that the induced dipole δµex of PRSB in different bR forms and inter-mediates exhibits a linear dependence, as has been observed for plots of λmax ver-sus νc=c, is most interesting. It should be stressed that experimental points in Figure 4.8 represent the PRSB in very different conditions, including a photointermediate, K, the initial species of bR, two kinds of blue membrane (acidic and deionized), dark-adapted bR, and the PRSB molecule in solution. Despite this and the fact that some of the data is collected from other work, almost a linear, monotonically decreasing dependence of δµex versus νc=c is observed. This correlation allows us to propose a hypothesis that increases of δµex in the retinal chromophore are associated with increase of delocalization of π electrons in the polyene chain of the retinal.
156015501540153015201510200
300
400
500
600
700
0.4
0.6
0.8
1.0
1.2
1.4
Abs. max. wavelength, nmInduced dipole rel. to LA bR
, cm
, nm
δµ/δµ
PRSB in solution
bR DAbR LA
K bR Acidic
bR DI
λm
ax
bRC=Cν - 1
Figure 4.8. Induced dipole values (squares, right vertical scale) and ab-sorption maxima (circles, left vertical scale) of PRSB as a function of the C=C stretch vibrational frequency νc=c in various environments. The values of the induced dipole δµex are divided by δµex of light-adapted bR.

61
4.5.4 Structural Parameters that Govern the Observed Induced Dipole The above mentioned alterations in π electrons delocalization can result
from certain changes in the chromophore environment and/or conformation. To get a better understanding of the factors that could effect the induced dipole and the bond alternation, it is important to note a number of factors that are known to influence λmax and νc=c of bR. These include weak electrostatic interactions be-tween PRSB and its counter ion in the protein relative to what exists in solution, 43-45 and ring/chain s trans planarity enforced by the protein relative to the s cis twisted retinal conformation that prevails in solution. 46, 47 In addition, polarizable groups of a solvent were shown to red-shift λmax of the retinal chro-mophore in solution48, 49 and, therefore, one can suppose that polarizable groups present in the microenvironment of retinal in bR could also be partially responsible for red-shifts in absorption. In spite of these understandings, the factors that affect the further red-shift observed when the K photochemical intermediate is generated, are not fully understood. This is also the case when one tries to understand the mechanisms underlying the energy storage that is observed in bR and all retinylidene proteins as a result of the photochemistry.
One explanation of the effects that are observed as a result of the primary
photochemistry is that isomerization of the chromophore induces a charge separa-tion between the Schiff base and its counter ion. 50 A second suggestion involves a twisting of retinal C=C double bonds51 and/or twisting of the C=N double bond52 that could induce a red-shift and some energy storage. A third suggestion was based on assuming that retinal in bR upon absorption of light exhibited a large induced dipole that perturbed the surrounding protein conformation to stabilize this redistribution of charge. 53 In all models of bR photochemistry there is a general agreement that positive charge is delocalized into the retinal chain as a result of the light-induced processes. The factors that could stabilize this charge redistribution in the retinal chromophore of K could be a combination of the same factors that are suggested to induce the red-shifts seen in bR.

62
4.5.5 Ground and Excited State Dipole Moment Changes Upon bR-K Transition An interesting problem in the discussion of these models is the question of
which electronic states are responsible for the observed increase in the induced dipole. All our data to date, when interpreted in terms of results in the literature, indicate that the increase in the induced dipole in going from bR to K has a contribution from an increase in the excited state dipole of the retinal chromophore. This suggestion is based on the following considerations. The data of Mathies and Stryer on Stark effect spectroscopy of retinal Schiff bases in solution20 supports the view that the direction of positive charge movement upon optical excitation of protonated retinal Schiff base is from the Schiff base nitrogen towards the β-ionone ring. On the other hand, it is known from vibrational spectroscopy36 that the photochemical bR - K transition is accompanied by positive charge movement in ground state in the same direction, which lowers the C=C stretching frequency. Therefore, if we assumed that the excited state dipole does not change upon the bR - K transition, we would get a decrease of induced dipole in going from bR to K and this contradicts our observations. Thus, the only remaining possibility is to assume that as a result of the bR - K transition the dipole moment of the excited state changes, and this change is bigger than the alteration in the ground state dipole.
Nonetheless, the alterations in the ground state dipole that must be occur-
ring as a result of the observed stabilized electron redistributions in going from bR to K can be partially responsible for the observed energy storage in this transition. A simple calculation can be used to show that the 11.6 kcal/mole energy storage observed as a result of the primary event in bR54 can be obtained when a unit negative charge is moved by 0.4 Å towards another unit negative charge initially placed at a distance of 2.6 Å in an environment with a dielectric constant taken to be 2. This charge movement would correspond to a ground state dipole change equal to 2.3 Debye, or only 10% of the induced dipole of the retinal chromophore in bR. 3, 20 This indicates that the change in the ground state dipole moment in going from bR to K can be a significant factor in the observed energy storage.

63
4.6 Conclusion
In conclusion, the nonlinear optical properties of bacteriorhodopsin chro-mophore in the bR568 and K states are investigated by second-harmonic genera-tion. The comparison of amplitudes and phases of the second-order nonlinear op-tical polarizabilities of the retinal chromophore in the two states has revealed a noticeable increase of the induced dipole of the retinal upon transition bR568 -> K. The results have been explained in terms of recent theoretical understandings of the non-linear optical properties of polyenes. Within the context of these understandings, it has been concluded that there is an increase of the excited state dipole moment of the retinal chromophore at bR-K transition.

64
4.7 Appendix
4.7.1 Account for Self-Absorption One has to take into account the self-absorption of the emission at the
second harmonic (SH) frequency that is different for the bR and K photointermediates. This is especially true for optically thick samples. In the calculation of self-absorption correction coefficients, we neglected the depletion of the fundamental wave amplitude and modeled the change in the amplitude A2ω of the wave at SH frequency with the following differential equation:
dA2ω
dx = α-κA2ω, α = ( )CbRχ(2)(bR)+CKχ(2)(K) : EωEω,
κ = 12( )CbRεbR(2ω) + CKεK(2ω) CPM, where α is the coefficient describing the
linear growth of the SH amplitude A2ω with the distance x as a result of the SHG process, κ is the loss because of self-absorption, ε is the extinction coefficient, and CPM is the concentration of bR molecules in the film. At the boundary condition A2ω(0) = 0, the solution of the equation has the form A2ω(x)= ακ(1-exp(-κx)) , or for the SHG intensity I2ω we get: I2ω ~ |A2ω(x0)|2 = ⎝⎜
⎛⎠⎟⎞ακ
2( )1-exp(-κx0) 2, where x0 is the length of the beam path inside the film.
Therefore, to correct the experimentally observed value µ≡ I2ω(λ1)I2ω(λ2) for self-ab-
sorption, one has to multiply µ by the factor
γ = κ2(λ1)(1-exp(-κ(λ2)x0))2
κ2(λ2)(1-exp(-κ(λ1)x0))2 ,
(1A)
κ = 12(CbRεbR(2ω)+CKεK(2ω)) CPM,
where εbR (εK) and CPM are the extinction coefficients of bR568 (K) and mole concentration of the purple membrane in the film, respectively.
4.7.2 Calculation of Mole Fractions
The mole fractions of bR568 and K, which are present when a bR film at a temperature of 77 oK is illuminated with cw monochromatic light at a wavelength λ of intensity Iλ, can be calculated using the known values of the corresponding cross-sections and quantum yields10, 11, 23

65
CbR = K2
K1+K2 , CK =
K1K1+K2
, K1=IλσbR(λ)ΦbR->K, K2=IλσK(λ)ΦK->bR,
(2A) where σ(λ) is the absorption cross-section of the corresponding photointermediate, and Φ is the quantum yield of the photoreaction which is independent on wavelength. It is seen from (2A) that CbR and CK do not depend on Iλ. With the mole fractions of the K intermediate known at a set of wavelengths, one can calculate the nonlinear surface susceptibility ratio ρ≡χ(2)zzz(K)/χ(2)zzz(bR) from the following equation:
I(2ω) ∝ |CbRχ(2)zzz(bR)+CKχ(2)zzz(K)|2 =
= | |CbR|χ(2)zzz(bR)|+CK|χ(2)zzz(K)|ei(φK-φbR) 2 , (3A)
where φK-φbR is the phase shift between χ(2)zzz(K) and χ(2)zzz(bR). The expression for ρ takes the form of the solution of a quadratic equation
ρ=-b- b2-4ac
2a , where a = I2ω(λ2)I2ω(λ1) CK2(λ1) - CK2(λ2),
b=2cos(φK-φbR)⎝⎜⎛
⎠⎟⎞I2ω(λ2)
I2ω(λ1)CbR(λ1)CK(λ1)-CbR(λ2)CK(λ2) , (4A)
c=I2ω(λ2)I2ω(λ1) CbR2(λ1) - CbR2(λ2),
where I2ω(λ2), I2ω(λ1) are SH intensities detected with cw
monochromatic illumination at wavelengths λ2 and λ1, and CK(λι), CbR(λι) are the mole fractions of K and bR568 at the above illumination conditions. References - Chapter 4 1. I. Freund, M. Deutsch, and A. Sprecher, "Connective tissue polarity.
Optical second-harmonic microscopy, crossed-beam summation, and small-angle scattering in rat-tail tendon". Biophys. J. 50, 693-712 (1986).
2. J. Huang and A. Lewis, "Determination of the absolute orientation of the retinylidene chromophore in purple membrane by a second-harmonic interference technique". Biophys. J. 55, 835-842 (1989).
3. J. Huang, Z. Chen, and A. Lewis, "Second-harmonic generation in purple membrane-poly(vinyl alcohol) films: probing the dipolar characteristics of

66
the bacteriorhodopsin chromophore in bR570 and M412". J. Phys. Chem. 93, 3314-3320 (1989).
4. R. A. Mathies, S. W. Lin, J. B. Ames, and W. T. Pollard, "From femtoseconds to biology: Mechanism of bacteriorhodopsin's light-driven proton pump". Annu. Rev. Biophys. Biophys. Chem. 20, 491-518 (1991).
5. M. S. Braiman and R. A. Mathies, "Resonance Raman spectra of bacteri-orhodopsin's primary photoproduct: evidence for a distorted 13-cis retinal chromophore". Proc. Natl. Acad. Sci. USA 79, 403-407 (1982).
6. K. J. Rothchild, H. Marrero, M. Braiman, and R. Mathies, "Primary photochemistry of bacteriorhodopsin: comparison of Fourier transform infrared difference spectra with resonance Raman spectra". Photochem. Photobiol. 40, 675-679 (1984).
7. R. R. Birge, "Nature of the primary photochemical events in rhodopsin and bacteriorhodopsin". Biochim. Biophys. Acta 1016, 293-327 (1990).
8. R. A. Mathies, C. H. B. Cruz, W. T. Pollard, and C. V. Shank, "Direct observation of the femtosecond excited-state cis-trans isomerization in bacteriorhodopsin". Science 240, 777-779 (1988).
9. J. Dobler, W. Zinth, W. Kaizer, and D. Oesterhelt, "Excited-state reaction dynamics of bacteriorhodopsin studied by femtosecond spectroscopy". Chem. Phys. Lett. 144, 215-220 (1988).
10. R. Govindjee, S. P. Balashov, and T. G. Ebrey, "Quantum efficiency of the photochemical cycle of bacteriorhodopsin". Biophys. J. 58, 597-608 (1990).
11. J. Tittor and D. Oesterhelt, "The quantum yield of bacteriorhodopsin". FEBS Lett. 263, 269-273 (1990).
12. J. K. Lanyi, "Proton transfer and energy coupling in the bacteriorhodopsin photocycle". J. Bioenerg. Biomembr. 24, 169-179 (1992).
13. O. A. Askipetrov, N. N. Akhmediev, N. N. Vsevolodov, D. A. Esikov, and D. A. Shutov, "Photochromism in nonlinear optics: photocontrolled second-harmonic generation by bacteriorhodopsin molecule". Sov. Phys. Dokl. 32, 219-220 (1987).
14. K. Clays, E. Hendrickx, M. Triest, T. Verbiest, A. Persoons, C. Dehu, and J.-L. Brédas, "Nonlinear optical properties of proteins measured by hyper-Rayleigh scattering in solution". Science 262, 1419-1422 (1993).
15. S. R. Marder, L.-T. Cheng, B. G. Tiemann, A. C. Friedli, M. Blanchard-Desce, J. W. Perry, and J. Skindhoj, "Large first hyperpolarizabilities in push-pull polyenes by tuning of the bond length alternation and aromaticity". Science 263, 511-514 (1994).

67
16. Z. Chen, A. Lewis, H. Takei, and I. Nebenzahl, "Bacteriorhodopsin oriented in polyvinyl alcohol films as an erasable optical storage medium". Appl. Opt. 30, 5188-5196 (1991).
17. G. Varo, "Dried oriented purple membrane samples". Acta Biol. Acad. Sci. Hung. 32, 301-310 (1981).
18. K. Kemnitz, K. Bhattacharyya, J. M. Hicks, G. R. Pinto, K. B. Eisenthal, and T. F. Heinz, "The phase of second-harmonic light generated at an interface and its relation to absolute molecular orientation". Chem. Phys. Lett 131, 285-290 (1986).
19. R. Birge and L. M. Hubbard, "Molecular dynamics of cis-trans isomerization in rhodopsin". J. Am. Chem. Soc. 102, 2195-2205 (1980).
20. R. Mathies and L. Stryer, "Retinal has a highly dipolar vertically excited singlet state: Implications for vision". Proc. Natl. Acad. Sci. USA 73, 2169-2173 (1976).
21. Y. R. Shen. The Principles of Nonlinear Optics. New York: Wiley, 1984. 22. D. S. Chemla and J. Zyss. “Nonlinear Optical Properties of Organic
Molecules and Crystals.” 1. New York: Academic Press, 1987. 23. G. Varo and J. K. Lanyi, "Kinetic and spectroscopic evidence for an
irreversible step between deprotonation and reprotonation of the Schiff base in the bacteriorhodopsin photocycle". Biochemistry 30, 5008-5015 (1991).
24. J. Huang, A. Lewis, and T. Rasing, "Second harmonic generation from Langmuir-Blodgett films of retinal and retinal Schiff bases". J. Phys. Chem. 92, 1756-1759 (1988).
25. T. L. Mazely and W. M. Hetherington, "Second-order susceptibility tensors of partially ordered molecules on surfaces". J. Chem. Phys. 86, 3640-3647 (1987).
26. A. V. Sharkov and T. Gillbro, "Second harmonic generation in oriented purple membrane films under picosecond light excitation". Thin Solid Films 202, L9-L14 (1991).
27. Z. Chen. Thesis, Cornell University, 1994. 28. Z. Chen, M. Sheves, A. Lewis, and O. Bouevitch, "A comparison of the
second harmonic generation from light-adapted, dark-adapted, blue, and acid purple membrane". Biophys. J. 67, 1155-1160 (1994).
29. C. Wan, J. Qian, and C. K. Johnson, "Conformational motion in bacteriorhodopsin: the K to L transition". Biochemistry 30, 394-400 (1991).
30. A. A. Kononenko, E. P. Lukashev, A. V. Maximychev, S. K. Chamorovsky, A. B. Rubin, S. F. Timashev, and L. N. Chekulaeva, "Oriented purple-membrane films as a probe for studies of the mechanism of bacteriorhodopsin functioning. I. The vectorial character of the external

68
electric-field effect on the dark state and the photocycle of bacteriorhodopsin". Biochim. Biophys. Acta 850, 162-169 (1986).
31. Y. Kimura, A. Ikegami, and W. Stoeckenius, "Salt and pH-dependent changes of the purple membrane absorption spectrum". Photochem. Photobiol. 40, 641-646 (1984).
32. C.-H. Chang, J.-G. Chen, R. Govindjee, and T. Ebrey, "Cation binding by bacteriorhodopsin". Proc. Natl. Acad. Sci. USA 82, 396-400 (1985).
33. T. C. Corcoran, K. Z. Ismail, and M. A. El-Sayed, "Evidence for the involvement of more than one metal anion in the Schiff base deprotonation process during the photocycle of bacteriorhodopsin". Proc. Natl. Acad. Sci. USA 84, 4094-4098 (1987).
34. M. Ottolenghi and M. Sheves, "Synthetic retinals as probes for the binding site and photoreactions in rhodopsins". J. Membr. Biol. 112, 193-212 (1989).
35. T. L. Brack and G. H. Atkinson, "Picosecond time-resolved resonance Raman spectrum of the K-590 intermediate in the room temperature bacteriorhodopsin photocycle". J. Molec. Struct. 214, 289-303 (1989).
36. B. Aton, A. G. Doukas, R. H. Callender, B. Becher, and T. G. Ebrey, "Resonance Raman studies of the purple membrane". Biochemistry 16, 2995-2999 (1977).
37. S. R. Marder, D. N. Beratan, and L.-T. Cheng, "Approaches for optimizing the first electronic hyperpolarizability of conjugated organic molecules". Science 252, 103-106 (1991).
38. T. Hamanaka, T. Mitsui, T. Ashida, and M. Kakudo, "The crystal structure of all-trans retinal". Acta Cryst. B28, 214-222 (1972).
39. B. D. Santasiero and M. N. G. James, "Crystal structure of N-methyl-N-phenylretinal iminium perchlorate: a structural model for the bacteriorhodopsin chromophore". JACS 112, 9416-9418 (1990).
40. T. Kitagawa and A. Maeda, "Vibrational spectra of rhodopsin and bacteri-orhodopsin". Photochem. Photobiol. 50, 883-894 (1989).
41. M. A. Marcus, A. T. Lemley, and A. Lewis, "Implications of modelling the chromophore of rhodopsin and bacteriorhodopsin with resonance Raman spectra of retinal Schiff bases". J. Raman Spectr. 8, 22-25 (1979).
42. S. O. Smith and R. A. Mathies, "Resonance Raman spectra of the acidified and deionized forms of bacteriorhodopsin". Biophys. J. 47, 251-254 (1985).
43. P. E. Blatz, J. H. Mohler, and H. V. Navangul, "Anion-induced wavelength regulation of absorption maxima of Schiff bases of retinal". Biochemistry 11, 848-855 (1972).

69
44. H. J. M. de Groot, S. O. Smith, J. Courtin, E. v. d. Berg, C. Winkel, J. Lugtenburg, R. G. Griffin, and J. Herzfeld, "Solid-state 13C and 15N NMR study of the low pH forms of bacteriorhodopsin". Biochemistry 29, 6873-6883 (1990).
45. A. Albeck, N. Livnah, H. Gottlieb, and M. Sheves, "13C NMR studies of model compounds for bacteriorhodopsin: factors affecting the retinal chromophore chemical shifts and absorption maximum". JACS 114, 2400-2411 (1992).
46. T. Schreckenbach, B. Walckhoff, and D. Oesterhelt, "Specificity of the retinal binding site of bacteriorhodopsin: chemical and stereochemical requirements for the binding of retinol and retinal". Biochemistry 17, 5353-5359 (1978).
47. G. S. Harbison, S. O. Smith, J. A. Pardoen, J. M. L. Courtin, J. Lugtenburg, J. Herzfeld, R. A. Mathies, and R. G. Griffin, "Solid-state 13C NMR detection of a perturbed 6-s-trans chromophore in bacteriorhodopsin". Biochemistry 24, 6955-6962 (1985).
48. C. S. Irving, G. W. Byers, and P. A. Leermakers, "Effect of solvent polarizability on the absorption spectrum of all-trans -Retinylpyrrolidiniminium perchlorate". JACS 91:8, 2141-2143 (1969).
49. C. S. Irving, G. W. Byers, and P. A. Leermakers, "Spectroscopic model for the visual pigments. Influence of microenvironmental polarizability". Biochemistry 9, 858-864 (1970).
50. B. Honig, T. Ebrey, R. H. Callender, U. Dinur, and M. Ottolenghi, "Photoisomerization, energy storage, and charge separation: a model for light energy transduction in visual pigments and bacteriorhodopsin". Proc. Natl. Acad. Sci. USA 76, 2503-2507 (1979).
51. R. Birge and L. Hubbard, "Molecular dynamics of trans-cis isomerization in bathorhodopsin". Biophys. J. 34, 517-534 (1981).
52. Y. Gat, M. Grossjean, I. Pinevsky, H. Takei, Z. Rothman, H. Sigrist, A. Lewis, and M. Sheves, "Participation of bacteriorhodopsin active-site lysine backbone in vibrations associated with retinal photochemistry". Proc. Natl. Acad. Sci. USA 89, 2434-2438 (1992).
53. A. Lewis, "The molecular mechanism of excitation in visual transduction and bacteriorhodopsin". Proc. Natl. Acad. Sci. USA 75, 549-554 (1978).
54. R. R. Birge, T. M. Cooper, A. F. Lawrence, M. B. Masthay, C.-F. Zhang, and R. Zidovetzki, "Revised assignment of energy storage in the primary photochemical event in bacteriorhodopsin". JACS 113, 4327-4328 (1991).

70

71
Chapter 5. APPLICATION OF THIN PURPLE MEMBRANE FILMS FOR AUTOCORRELATION OF FEMTOSECOND PULSES
5.1 Introduction
So far, we were dealing with application of non-linear optics in biology. During our studies, it was found that certain biological materials, such as bacteriorhodopsin* (bR) films, possess high nonlinear optical constants. The present chapter shows that bR can be used as a practical material for nonlinear optics. This is a little example what biology, in its turn, can give to nonlinear optics.
This section is built in the following manner. First, a brief remainder is
given about what is laser pulse autocorrelation and what is bR. Second, some numerical estimates of optical properties of bR films, which are important for this experiment, are given. Finally, the experiment itself is described and discussed.
5.1.1 Autocorrelation Techniques Autocorrelation is a common technique widely applied for measuring
widths of laser pulses in femtosecond and picosecond time domains. In this technique, the laser pulse is split into two pulses which interact in a nonlinear medium, via nonlinear optical susceptibilities, producing an optical signal with a different frequency and/or in a different direction relative to the incident laser beam. This signal detected as a function of the time delay between interacting pulses can measure the width of the original light pulse. As a rule, the lowest order non-linear optical process of second harmonic generation (SHG) is employed to produce the autocorrelation signal. In the process of SHG, the signal at twice the fundamental optical frequency is generated instantaneously when two pulses meet in a non-linear medium. Thin slices of nonlinear media are used to minimize pulse broadening effects that distort true autocorrelation signals. 1 The broadening effects become important when the duration of the laser pulses being measured is in the femtosecond time domain. In this chapter we demonstrate the use of a unique biological membrane with significant non-linear optical characteristics in autocorrelation of ultrashort pulses.
* See Chapter 4 for more details about bacteriorhodopsin and purple membrane.

72
5.1.2 Bacteriorhodopsin (bR) Bacteriorhodopsin (bR) is an unique photon energy transducing protein
found in the crystalline membrane, the purple membrane, of a halophylic bacterium Halobacterium halobium. The protein is composed of a protein polymer chain that is linked covalently to a conjugated polyene chromophore called retinal. Absorption of a photon by the retinal chromophore of bR drives a chain of conformational changes in the retinal and in the protein, which eventually leads to translocation of a proton against the electrochemical mem-brane gradient. A significant number of studies were performed with the aim of understanding the mechanism of action of bR which is interesting both from a fundamental and applied viewpoint. In this connection non-linear optical properties of bR have also been investigated. These include four-wave mixing2 and SHG with nano- 3-5 and picosecond pulses. 6, 7 Studies of the SHG have found that the retinal chromophore of bR exhibits an extremely large second-order polarizability3 which is naturally optimized by opsin. 7 Note that bR-containing membrane fragments are very easy to orient by sedimentation from suspension onto a transparent electrode8 which further enhances the second order susceptibility of bR films. 4
5.2 Numerical Estimates
Below, we calculate the dependence of SHG from a bR film as a function of the angle of incidence. The results of calculation, presented in Subsection 5.2 (a), will be useful for experimental estimation of coherence length in bR films. Besides, a numerical estimate is made of the value of second order susceptibility of the films used. It can be found in Subsection 5.2 (b).
5.2.1 Coherence Length in bR Films The SHG intensity from a thin slab of nonlinear medium absorbing at the
SH frequency 2ω can be written as9, 10
I2ω/Iω2 = 32π3ω2
c3ε(ω) ε(2ω) |e2ω . χ(2) : eωeω|2 Ω(z) (5.1)

73
where ε(ω) and ε(2ω) are dielectric constants of the medium at frequencies ω and 2ω, respectively, χ(2) is the second order susceptibility tensor, and Ω(z) has the form
Ω(z) ≡ 2exp(-(α2ω/2)z)⎣⎢⎡
⎦⎥⎤cosh((α2ω/2)z)-cos(πz/Lcoh)
(α2ω/2)2+(π/Lcoh)2 , (5.2)
z ≡ Xo/ 1-nω-2sin2(θ) , where Xo is the slab thickness, λ is the fundamental wavelength in air, α2ω is the absorption coefficient of the medium at SH frequency, θ is the angle of incidence, and Lcoh ≡ λ/4�n2ω-nω� is so-called coherence length. It is seen from (5.1) and (5.2) that the value of n2ω-nω bears information about dispersion in the medium and can be estimated from the experimentally measured dependence of I2ω(θ).
For instance, if the length of the slab Xo is much bigger than Lcoh, the dependence I2ω(θ) will exhibit, due to oscillations of Ω term, a set of intermediate maxima known as Maker fringes. 11 In Figure 5.1, the term Ω is calculated as a function of the incidence angle θ for three values of coherence length, equal to 20, 5, and 1 µ, for a 10 µ thick film.
The autocorrelation signal is generated in the direction of k2ω, the SH wave vector, satisfying the condition
806040200.01
.1
1
10
100
θ
Ω
L = 25µcoh
L = 5µcoh
L =1µcoh
, deg
Figure 5.1. Oscillatory term Ω(θ) in (5.2) calculated at three values of the coherence length, Lcoh, for a 10 µ - thick bR film with the absorption coefficient α2ω = 0.3 and refraction index nω = 1.1.

74
k2ω = kω1 + kω2 (5.3) where kω1 and kω2 are the wave vectors of two inter-correlating fundamental beams.
5.2.2 Nonlinear Optical Coefficients of bR Films We can calculate the second order susceptibility χzzz(2)bR of the bR films
used in these experiments with the formula
χzzz(2)bR = Nl2ωlωlω<cos3ϕ>βξξξ (5.4) where N is the density of bR molecules, lω and l2ω are Lorentz-type local-field factors for fundamental and SH emissions, ϕ is the molecular inclination angle of the retinal chromophore relative to the film surface normal, taken to be 65o, 4 βξξξ is second order molecular polarizability of the retinal chromophore in bR, taken to be 2.5 X 10⁻²⁷ esu3 and <> means averaging over all orientations. Substitution of these values into Eq. (5.4), for a Gaussian distribution of angles around ϕ=65o +5o, yields an estimation for χzzz(2)bR = 5.4 X 10⁻⁹ esu for an electrophoretically sedimented bR film of thickness 10 µ with optical density (OD) at 568 nm equal to 1. The effective values of the second order susceptibility, however, are expected to be smaller because of self-absorption of the SH emission. The experimentally determined second order susceptibilities of >1.05 X 10⁻⁹ esu and 1.16 X 10⁻⁹ esu were reported for electrophoretically produced bR films at a wavelength of 860 nm6 and 1064 nm5, respectively. With further decrease of the film thickness, the self-absorption effects become unimportant and the effective second-order susceptibility of bR film exceeds that of KDP which is 2.34 X 10⁻⁹ esu. 9 5.3 Experimental Procedures and Apparatus
5.3.1 Films Preparation The electrophoretically sedimented bR film was prepared according to an
established procedure. 8 Briefly, the bR containing purple membrane suspension was rinsed in double-distilled water several times and 0.1 - 0.2 ml of the suspension at pH 7 with a protein concentration of 3.4 mg/ml was spread between a SnO2 - covered glass electrode and a flat silver plate. The distance between

75
electrodes was fixed by a spacer to be 2 mm. Both electrodes touched the suspension. An electric field of 20-30 V/cm was applied to the electrodes ("+" to the SnO2 electrode) for 1 min which caused electrophoretic sedimentation of membrane fragments onto the glass. The excess water was then carefully removed with a pipette and the sample dried overnight in a humid atmosphere to avoid cracking of the film. The films used in the experiments had a thickness of 10 µ. The absorption spectrum of the film showed a diffuse peak at 568 nm with full width at half maximum (FWHM) of 120 nm. The optical density of the films used in the experiments was about 1.0 at 568 nm.
5.3.2 Ti:Sapphire Femtosecond Laser System A Coherent Radiation Mira Model 900 Ti:sapphire laser, pumped by a cw
Innova 300 argon ion laser, was used in this experiment. The Kerr lens modelocking technique was applied to modelock the Mira laser. Briefly, the optical cavity of the laser was specifically designed in order to be sensitive to changes in the spatial profile of the beam caused by self-focusing effect (which is a result of optical Kerr effect) in the Ti:sapphire crystal. The self-focusing is observed only in modelocked (ML) regime, and the optical cavity design ensures smaller round-trip losses for ML regime in comparison to cw regime. As a result, once having appeared, the ML emission mode grows at a cost of the cw mode. Finally, the ML operation mode is established. In addition, group velocity dispersion compensation was applied in the Mira laser in order to obtain nearly transform-limited femtosecond pulses.
In the present experiment, the laser was operated in TEMoo mode at a
wavelength of 790 nm. It produced 120-fs pulses at a repetition rate of 76 MHz. The noise in the laser output was smaller than 2%.
5.3.3 Detection of the SHG as a Function of the Incidence Angle The SHG from a bR film as a function of the incident angle was measured
with an experimental arrangement diagrammatically represented in Figure 5.2.

76
A p-polarized fundamental laser beam was directed onto the sample film mounted on a stage that could be rotated. A motor was used to rotate the stage at a known (constant) speed of about 0.5o/sec. The whole set-up allowed for measurement of the transmitted second harmonic (SH) intensities in the range of incidence angles of 0o-80o. The SH signal generated by the film was filtered and detected by a photomultiplier. The computer-controlled lock-in amplifier Stanford Research Model 850 recorded the SH signal as a function of time which was eventually re-calculated into the incidence angle. The experimental error of determination of the incident angle was estimated to be <2o. The SH signal, thanks to its big amplitude, was recorded practically without any noise.
PMTP A
bR film
Femtosecond pulses
C
θ F
Lock-in amplifier
Figure 5.2. Experimental arrangement used in the measurement of the incident angle dependence of the SH signal. C, chopper; P, polarizer; A, analyzer; F, filter; PMT, photomultiplier. The film of bR was mounted on a rotatable stage to modulate the incidence angle.

77
5.3.4 Autocorrelator Set-Up The laser pulsewidth was measured with a traditional Michelson-type non-
collinear autocorrelator.
The length of one of the arms of the correlator was modulated at a frequency of 4 Hz. The two beams, 50 mW each, were focused onto the surface of bR film (Figure 5.3) by a lens with a focal distance of 5 cm, and then blocked by a di-aphragm. The autocorrelation signal generated at the SH frequency was detected in the direction that bisects the outcoming fundamental laser beams, according to (5.3). 5.4 Results and Discussion
5.4.1 Maker Fringes Experiment Figure 5.4 shows the experimental dependence of the SH signal from the
bR film as a function of the angle of incidence θ of a single p-polarized fundamental beam. No sharp Maker fringes are seen in this graph. Based on Figures 5.1 and 5.4 and Eqs. (5.1) and (5.2) we can conclude that in our conditions the coherence length Lcoh is bigger than the thickness of the film, 10 µ.
Femtosecond pulses
PMTω, 2ω
2ω
ω, 2ω
bR film
Oscilloscope
FFD
VD
Figure 5.3. The autocorrelation experiment. FD and VD, fixed and variable delay femtosecond pulse paths, respectively; F, filter; PMT, photomultiplier. The fundamental laser beams were blocked after the bR film and were not allowed to reach the PMT. The autocorrelation signal was filtered out both spatially and spectrally as shown in this figure.

78
This is in agreement with earlier observations5 made for such films in the case of 10 ns Nd:YAG laser pulses at a wavelength of 1.064 µ. The observation that Lcoh ≥ 10 µ means that, despite proximity of the SH frequency 2ω, 395 nm, to the absorption maximum of bR, 568 nm, which shifts 2ω close to the region of anomalous dispersion of the near-resonant medium, the refraction index difference n2ω-nω is sufficiently low not to introduce an essential phase mismatch in the process of SHG by a 10 µ -thick film.
The estimation of Lcoh for bR films used in these experiments shows that the coherence length remains high enough, Lcoh ♠ 24 µ, even for the case when SH wavelength is in the region of maximal anomalous dispersion of bR film which is 568 ± 60 nm.
8060402000
20
40
60
80
100
Angle of incidence, deg
SHG,
a. u
.
Figure 5.4. Dependence of SHG from a bR film as a function of the incidence angle. A p-polarized fundamental laser beam was used, and the p-polarized SH signal was detected as shown in Figure 5.2.

79
5.4.2 Autocorrelation of Femtosecond Pulses The autocorrelation signal obtained with a bR film is shown in Figure 5.5.
The FWHM of the peak detected in the direction of k2ω (5.3) was measured to be 220 fs. This value is a typical FWHM for our laser and does not exceed the values routinely obtained with a thin slice of the beta-barium borate (BBO) crys-tal. It is expected, however, that at extremely small laser pulsewidths, about 10-20 fs, the dispersive effects will make problematic the use in autocorrelators of inorganic crystals such as BBO. For example, the group velocity mismatch of type I SHG at 750 nm in widely employed BBO crystal is 225 fs per mm. 1
5.4.3 bR Films as a Medium for Autocorrelation: Advantages and Disadvantages The results presented in this chapter prove possibility of accurate
measurement of 120-fs pulses with bR films. Can shorter pulses, say 20-fs pulses, be autocorrelated with bR films? Thin bR films do not exhibit strong resonant absorption in the near infrared region, which makes negligible effects of the laser pulse broadening due to the group velocity dispersion. Still, one must remember that near-resonant character of bR nonlinearity can distort the spectrum
1.00.50.0-0.5-1.00
20
40
60
80
100
Delay time, ps
Auto
corr
elat
ion
sign
al, a
. u.
220 fs
Figure 5.5. Autocorrelation of femtosecond pulses obtained with a thin film of bacteriorhodopsin as a non-linear medium. The experimental arrangement is shown in Figure 5.3. The full width at half maximum (FWHM) of the peak is 220 fs.

80
of an ultrashort SH pulse if the bandwidth of the latter is comparable to absorption bandwidth of bR which is 120 nm. This spectral distortion would, of course, distort the pulseshapes observed in the autocorrelation experiment. Thus, near-resonant bR nonlinearity has both advantages and disadvantages. The advantage is the big magnitude of bR nonlinearity (see calculation in Subsection 5.2.2), and the disadvantage is the possible presence of resonance-induced distortions which could broaden a 20-fs pulse. Nonetheless, since the absorption spectrum of bR, like the spectra of visual pigments, is very diffuse, one might hope to minimize this kind of broadening effects by working at some optimal distance from the main resonance at 568 nm. Unfortunately, the unavailability of a 20-fs laser system prevented us, so far, from testing this possibility experimentally.
The suitability of thin organic and some inorganic crystals for
ultrabroadband SHG in 100-fs time domain was demonstrated recently12 with 100 micron-thick KDP and 1 micron-thick 2-methyl-4-nitroaniline crystals. To avoid broadening of femtosecond pulses, very thin crystals have to be used. In this regard, the thickness of electrophoretically sedimented bR films can be easily modulated by varying the sedimentation time and/or by varying the magnitude of the electric field. The film thickness can be reduced, without any degradation of the optical quality of the film, to a value as small as 1 µ if necessary.
Among advantages of bR films over poled polymers13 and thin organic
crystals12 is the simplicity of the film producing procedure. A good bR film can be made in hours and serve for years. In the case of necessity, the film can be easily replaced without any realignment of the autocorrelator. Moreover, the resonant second order polarizability of bR can be tuned to the desired wavelength in the visible. For instance, deionization of the membrane, lowering the pH to 2 or simply prolonged sedimentation of membrane fragments in electric field during preparation of the film causes a red-shift in the bR absorption maximum from 568 to 600 nm. 14 The replacement of the retinal chromophore by synthetic or other natural chromophores allows one to shift the absorption maximum of purple membrane to virtually any wavelength. 15, 16 As a result of this tuning the second order polarizability of bR comes into a resonance with a variety of femtosecond laser sources and pulsewidths of lasers delivering a few milliwatts of power could be measured. In terms of the optical transparency it should be noted that when the absorption of the chromophore in the visible region discussed above does not exceed an optical density of 1 the dry protein films are practically transparent (OD < 0.5) in the wavelength regions from 0.3-0.51; 0.63-3; 3.1-3.4; 3.5-5.9; 10-

81
12; and 12.7-15 microns which makes them an attractive non-linear optical material for use with many lasers. 5.5 Conclusion
In conclusion, we have measured pulsewidth of a 790-nm wavelength, 76-MHz repetition rate, 120-fs laser pulses by autocorrelation using a 10 µ thick electrophoretically sedimented film of bacteriorhodopsin as a nonlinear optical material. Thin bR films offer the advantage of moderate broadening of femtosecond pulses (which is thought to be negligible even for ultrashort pulses), the second order susceptibility larger than 10-9 esu, which in addition can be tuned to any wavelength in the yellow-red and probably near infrared regions, low cost of the material, simplicity and reproducibility of film production, and stability of the films at room temperature and humidity. References - Chapter 5 1. R. J. Ellington and C. L. Tang, "High-repetition rate femtosecond pulse
generation in the blue". Opt. Lett. 17, 343-345 (1992). 2. G. R. Kumar, S. J. Wategaonkar, and M. Roy, "Laser unduced transient
gratings in bacteriorhodopsin". Opt. Commun. 98, 127-131 (1993). 3. J. Huang, Z. Chen, and A. Lewis, "Second-harmonic generation in purple
membrane-poly(vinyl alcohol) films: probing the dipolar characteristics of the bacteriorhodopsin chromophore in bR570 and M412". J. Phys. Chem. 93, 3314-3320 (1989).
4. J. Huang and A. Lewis, "Determination of the absolute orientation of the retinylidene chromophore in purple membrane by a second-harmonic interference technique". Biophys. J. 55, 835-842 (1989).
5. Z. Chen, M. Sheves, A. Lewis, and O. Bouevitch, "A comparison of the second harmonic generation from light-adapted, dark-adapted, blue, and acid purple membrane". Biophys. J. 67, 1155-1160 (1994).
6. A. V. Sharkov and T. Gillbro, "Second harmonic generation in oriented purple membrane films under picosecond light excitation". Thin Solid Films 202, L9-L14 (1991).
7. O. Bouevitch, A. Lewis, and M. Sheves, "Probing bacteriorhodopsin photochemistry with non-linear optics: comparing the second harmonic Generation of bR and the Photochemically Induced Intermediate K". J. Phys. Chem. 99, 10648-10657 (1995).

82
8. G. Varo, "Dried oriented purple membrane samples". Acta Biol. Acad. Sci. Hung. 32, 301-310 (1981).
9. Y. R. Shen. The Principles of Nonlinear Optics. New York: Wiley, 1984. 10. D. S. Chemla and J. Zyss. “Nonlinear optical properties of organic
molecules and crystals.” In Quantum Electronics: Principles and Applications, 1. Academic Press, Inc., 1987.
11. J. Jerphagnon and S. K. Kurtz, "Maker fringes: a detailed comparison of theory and experiment for isotropic and uniaxial crystals". J. Appl. Phys. 41, 1667-1681 (1970).
12. J. O. White, D. Hulin, M. Joffre, A. Migus, and A. Antonetti, "Ultrabroadband second-harmonic generation in organic and inorganic thin crystals". Appl. Phys. Lett. 64, 264-266 (1994).
13. M. Eich, B. Reck, D. Y. Yoon, C. G. Willson, and G. C. Bjorklund, "Novel second-order nonlinear optical polymers via chemical cross-linking-induced vitrification under electric field". J. Appl. Phys. 66, 3241-3247 (1989).
14. Y. Kimura, A. Ikegami, and W. Stoeckenius, "Salt and pH- dependent changes of the purple membrane absorption spectrum". Photochem. Photobiol. 40, 641-646 (1984).
15. M. A. Marcus, A. Lewis, E. Racker, and H. Crespi, "Physiological and structural investigations of bacteriorhodopsin analogs". Biochem. Biophys. Res. Commun. 78, 669-675 (1977).
16. R. S. H. Liu, E. Krogh, X.-Y. Li, D. Mead, L. U. Colmenares, J. R. Thiel, J. Ellis, D. Wong, and A. E. Asato, "Analyzing the red-shift characteristics of azulenic, naphthyl, other red-fused and retinyl pigment analogs of bacteriorhodopsin". Photochem. Photobiol. 58, 701-705 (1993).

83
Chapter 6. EQUIPPING A MOLECULAR PROBE WITH A NANOANTENNA PRODUCES A PARTICLE WITH GIGANTIC OPTICAL NONLINEARITIES 6.1. Introduction
The application of nonlinear optics (NLO) to investigate biological
problems is a field of considerable interest. Such applications include second harmonic generation as a probe of the induced dipole of the retinal chromophore in the light activated membrane protein bacteriorhodopsin, 1 the absolute direction of chromophores in membranes, 2 the ability to uniquely monitor the potential of cell membranes. 3 Other important applications of non-linear optics are in the field of imaging where it has been elegantly shown4 that two photon fluorescence can be used to increase, by a factor of 2, the lateral resolution of a far field optical microscope. In spite of such interesting applications, nonlinear optics is often restricted by a relatively low efficiency of the nonlinear interactions that underlie these processes. It is therefore highly desirable to increase the sensitivity and selectivity of the NLO probes that are used for probing the structure and the function of biological systems. Thus, the object of this chapter is to report on experiments that permit the use of well-known surface enhancement phenomena, similar to those observed for Raman scattering, to increase the efficiency of non-linear optical probes while allowing for freely and selectively placing these probes in a biological system such as a cell.
A number of investigations have shown that surface enhancement
phenomena work not only for Raman scattering but also for some nonlinear optical processes. 5-8 It is believed that a so called electromagnetic mechanism is, at least in part, responsible for the observed enhancement in both cases. The electromagnetic enhancement originates from a resonance between incoming or outgoing electromagnetic field and localized plasmons present in nanometer scale protrusions on a surface of a free-electron metal or within a free-electron metal nanoparticle. 6, 9 A tendency of an electric field to concentrate near sharp protrusions, known as the "lightning rod" effect, is believed to play an additional role in surface enhancement. 6, 10 Many researchers believe that, in terms of the magnitude of the enhancement and chemical stability, silver is probably the best choice between different metals that can include gold, platinum, aluminium etc.
In view of the above considerations, we focused on an approach to equip a
non-linear optical molecular probe with a "nanoantenna" which would increase both the absorption cross-section of the probe as well as its ability to emit light (see Figure 6.1). Specifically, this involved first, choosing a means to produce

84
freely dispersed nanometer sized silver particles and second to coat these particles with molecules that have significant non-linear optical properties.
A number of ways are known to produce silver nanoparticles. These
include Ag+ reduction in a glass host, 11 vacuum evaporation of electrically discontinuous silver island films onto flat substrates, 12 lithographic production of nanoarrays, 8 electrochemical growth of nanowires (unpublished results), and reduction of silver ions in aqueous solution to produce a colloid. 13 It should be pointed out that in view of our interest in biological applications of such nanoantennae-equipped molecular probes, we were especially interested in
EXCI
TATI
ON
EXCI
TATI
ON
probe
NAprobe
NONL
INEA
REM
ISSION
FLUORESCENCE
A
B Figure 6.1. The concept of a nanoantenna-equipped molecular probe. A. A traditional probe. B.
A nanoantenna-equipped probe.

85
methods which could yield silver nanoparticles dispersed in an aqueous solution. This was one of the reasons why we chose to work with silver colloids. In fact, it is known that Raman scattering of Rhodamine 6G is enhanced by a factor of 104 - 106 when the dye is adsorbed to aqueous silver colloid. 13 Therefore, it was expected that a very efficient nonlinear optical probe could be prepared with the use of such silver colloids.
6.2. Description of the method of preparation of dye-colloid aggregates
As a first step, we tried to coat the silver colloid nanoparticles with different dyes. After a number of tests based on trial and error it was found that certain dyes could be adsorbed to colloidal silver, forming what we call hereupon a "dye-colloid aggregate" (DCA). The procedure of preparation of DCA, which are studied in the present work, was prompted by publication of a preparation procedure of "Liquid Metal" (LM) films by Gordon et al. 14 that exhibited a significant SERS activity. These authors adsorbed different metal complexes onto a surface of colloidal silver by shaking together an organic solution of the complexes with a silver colloid which led to the appearance of a bright, mobile film at the interface between a water and organic solvent interface. The film was similar in its physical appearance and its properties to previously reported "metal liquid-like films", or MELLFs. 15
In our preliminary studies it was found that the method of preparation
Gordon et al. 14 of the films has a rather general character. It appeared to work well not only for the specific metal complexes used by Gordon et al., 14 but also for charged electrochromic dyes3 that we have shown have significant non-linear optical properties16 and can be used to monitor the potential across a biological membrane. 3 In addition it was found that LM films can be formed with other interesting molecules such as rhodamine 6G (Rh6G) or oxazine 725 (Ox725). We found also that these films can be formed with gold sols. Thus, the establishment of LM films as a result of "dying" a silver or gold colloid seems to be a general phenomenon.
We have extended these studies on liquid metal films to produce the type
of silver particles that was the original objective in this research. As a starting point a silver sol was prepared as described previously. 13, 17 This sol was mixed with a CH2Cl2 solution of the dye of interest at a concentration of 10-4 - 10-6 M by vigorously shaking together both solutions for ~ 10 sec. Within seconds after

86
mixing, a LM film appeared at the interface between the organic solvent and water indicating adsorption of dye to the silver colloid (see Figure 6.2).
The film often covered the aqueous/organic phase, as well as the walls of the vessel used. In addition, the silver colloid present in the aqueous phase aggregated and this resulted in a change of its color from brown-yellow to dark brown. The colloid aggregation apparently resulted from adsorption of the dye to the colloid particles. The aggregated colloid in the aqueous phase is depicted as "DCA aqueous suspension" in Figure 6.2. We found that both the interfacial LM film and the DCA aqueous suspension exhibit similar and very interesting nonlinear optical properties. In spite of our main interest in the dispersed particles in the aqueous phase for microscopic applications we also investigated the resulting interfacial LM film.
6.3. Properties of dye-colloid aggregates
6.3.1. Structure- TEM studies of LM films The structure of LM films was investigated by TEM microscopy. The
TEM nickel grids were used as a film support. Before the experiment, the grids were covered with a thin layer of collodion (Pelco, 2%) that was strengthened with a vacuum-evaporated layer of carbon. The LM films were transferred onto collodion-covered grids by dipping the grid into water, moving it under a LM film floating on the surface of water, and withdrawing upwards. Except for minute drying, no additional sample processing was required. Figure 6.3 shows a typical TEM view of a LM film.
DCA aqueous suspension
Organic phase
Interfacial LM film
Air
Figure 6.2. A schematic view of the systems under study.

87
It is seen that the film consists of a monolayer of densely packed colloidal
particles. Spheres, rods, and flat triangles and rectangles are the dominant shapes. Almost all the room in the plane of the monolayer is taken by the particles, empty spaces being relatively rare. Thus, LM films adjust automatically in order to form self-assembled dense colloidal monolayers. Our monolayers are qualitatively different from the monolayers of Freeman et al. 18 obtained by adsorption of colloidal particles to a polymer surface. The main force holding together the monolayers of Freeman et al. is the specific interaction between a colloidal particle and the polymer substrate. In our case however, the monolayers seem to form as a result of particle-particle interaction; the role of the water-organic or water-air interface consists simply in ensuring a two-dimensional geometry of the system. The particles "float" at a phase interface, like a fat-covered iron pin carefully put on the surface of water. We note that we successfully used our method to produce LM films not only from Ag colloid but also from a monodispersed Au colloids like those used by Freeman et al. 18

88
6.3.2. Physical properties of LM films 6.3.2.1. Conductivity The conductivity of silver LM films deposited on fused silica slides was
measured with a sensitive Keithley Model 617 electrometer by carefully (and simultaneously) applying to the film two point electrodes placed at a distance of 1 inch one from another. In contrast to previous reports about nonconductivity of similar films, 14, 15 it was found that LM films were, though poor, conductors with a resistance between the two electrodes in the range of 100 - 1000 MOhm. In some rare cases, however, no conductance at all was detected. These observations point out that, in general, there exist electrical contacts between neighboring silver particles in an LM films. Indeed, the existence of such contacts is suggested by the electron microscopy data presented in Figure 6.3. The frequency of the interparticle electrical contacts can be probably estimated from the value of the resistance measured.
6.3.2.2. Stability LM films at an organic-aqueous interface were found to be stable for
weeks if stored in a stoppered vessel in the dark at 4 oC. LM films deposited on fused silica slides had a tendency to deteriorate if left for a few weeks in air at room temperature. The deterioration sometimes resulted in losing the characteristic golden color of the films which grew white like an ordinary silver coating. This was followed by a dramatic decrease of the electrical resistivity of the films. We attribute this to deterioration of the dye coating of the silver particles.
6.3.3. Optical properties of colloidal aggregates We studied the optical properties of LM films and aqueous DCA
suspensions prepared with different dyes. The results, presented in this subsection, are broken in two parts. The first part (6.3.3.1) reports about absorptive properties of the LM films, which reflects the ability of a nanoantenna depicted in Figure 6.1 to receive the incoming radiation. The second part (6.3.3.2) reports on the emittive properties of both the LM films and aqueous DCA systems.

89
6.3.3.1. Absorption spectroscopy of LM films In order to study the enhancement of the absorption properties of the
molecular probes by the nanoantennae, we investigated the absorption of LM films with a UV-VIS-NIR absorption spectroscopy. The absorption spectra of LM monolayers transferred onto fused silica slides are shown in Figure 6.4.
The LM monolayer films were obtained with the same type of silver
colloid and three different types of dyes, JPW1234, Rh6G, and Ox725. The films were yellow-reddish in color and resembled, as already mentioned, a gold coating. The color shades as observed by the eye were clearly different for the films formed with different dyes.
A common feature of all three spectra shown in Figure 6.4 is a negative peak at 320 nm. The remaining part of all three graphs consists of two positive peaks in each of the spectra of the three LM films produced with JPW1234, Rh6G, and Ox725. The first peak in the spectrum occurs at 420, 450, and 440 nm respectively while the second absorption is at 620, 700, and 730 nm.
As has been noted above there are considerable similarities in terms of
certain physical properties between the LM (liquid metal) films produced by Gordon et al. 14 from specific metal complexes and the MELLFs ( metal liquid like films) that have been investigated by Efrima and coworkers. 19 These latter
9007005003000.0
0.5
1.0
JPW
Ox725Rh6G
, nm
Abso
rptio
n
λ
Figure 6.4. Absorption spectra of LM monolayers deposited on fused silica.

90
MELLFs were produced by stabilizing silver at an aqueous-organic interface with a surfactant which had no absorption in the visible region of the spectrum. These workers recorded the absorption spectra of such MELLFs and discovered a negative peak which occurred at 320 nm. An analogous peak was also observed by Gordon et al. 14 in their system.
We have also found such a negative absorption peak in our LM films (see
Figure 6.4) which were prepared by stabilizing silver with a variety of dyes. Efrima and coworkers attributed the negative peak at 320 nm to the colloidal nature of the films they investigated. Therefore, our films are colloidal in nature.
In addition to the above, Garoff et al. 20 and Craighead and Glass21 nearly
a decade and half ago investigated the absorption of silver island films on which were deposited dye molecules. They focused on the modification of the absorption of the silver island film by the dye and found that the plasmon resonance peak of the film was split by the presence of the dye into two peaks. The position of the long wavelength component of these two peaks correlated with the relative visible absorption of the dye. Their results were explained in the framework of Mie theory; this work established that there was a significant degree of electromagnetic interaction between the silver particles and the dye. The results of the electromagnetic calculations indicated that a large fraction of the electromagnetic energy collected by the particle was deposited in the dye. 20, 21
The spectra of our LM films show all of the absorption features mentioned
above. They include the splitting of the plasmon resonance peak and the correlation between the absorption maxima of the dye and the position of the long wavelength component. Thus, we can conclude that there exists a strong electromagnetic interaction between the silver colloid and the dye. It is important to mention that such an interaction leads to a significant deposition of the electromagnetic energy that is received by the silver into the dye molecule.

91
6.3.3.2. Emission spectroscopy of LM films and aqueous DCA suspensions The luminescence properties of LM films illuminated with a Nd:YAG
laser at 1.064 µm were studied with the experimental set-up shown in Figure 6.5.
Briefly, a Q-switched mode-locked Nd:YAG laser with a 1.06 µm
emission and a 400 Hz repetition rate was directed onto the surface of a LM film floating on water. The laser emission was passed through an attenuator, polarizer, a λ/2 phase plate, and a filter which rejected any residual fluorescence from the Nd:YAG crystal as well as SH generated in the optics. The diffusely scattered luminescence from a sample LM film was collected with a 1:1.8 camera objective with a focal distance of 5 cm. The scattered light at the fundamental laser wavelength was filtered out by a glass piece obtained from Nd:YAG laser goggles, so that the luminescence spectrum remained practically unmodified by the filter. A miniature 20-cm monochromator with a holographic grating was used to scan the spectrum. Finally, the optical signal was measured with an RCA C3104 cooled photomultiplier tube.
The LM films were produced as detailed in Section 6.2. The
concentration of silver in colloid was 1 mM. The concentrations of dyes in methylene chloride were 0.023 mM, 0.2 mM, and 2 mM for JPW1234, Rh6G, and Ox725 dyes, respectively. The monolayer LM films were brought to the upper aqueous surface by introducing with a glass pipette air bubbles (1-2 ml of
Laseremission
Attenuator
Photodiode
Monochromator
PMT
Lensf= 20 cm
PolarizerPhase plateFilter
ObjectiveFilter
Sample Figure 6.5. Experimental arrangement for study of emission properties of LM films.

92
air) under the film that was floating between the organic and aqueous phases. Films covering the surface of water showed no visible degradation during the experiment.
For the measurements of luminescence spectra from aqueous DCA
suspensions, we modified the set-up depicted in Figure 6.5 so that the laser beam entered through the bottom quartz window of a cylindrical Raman cuvette into which the suspension under study was placed. The laser beam passed upwards along the cuvette axis and was partially focused by a long focal length lens so that the beam diameter inside the cuvette was 1 mm. The cuvette had an inner diameter of 8 mm. A micro stirrer was used to mix the cuvette contents with a thin glass stick during the experiments. The diffusely scattered luminescence from the suspension along the laser beam path was collected as in previous experiments. No modifications of the luminescence collection optical system was made. We note that this optical configuration is very similar to the arrangement often applied for the study of Raman scattering in solution.
The luminescence spectra of LM films and aqueous DCA suspension
detected at 1.1 W/cm2 average illumination intensity are shown in Figures 6.6A and 6.6B, respectively.
7006506005505004504000.0
0.2
0.4
0.6
0.8
1.0 JPW1234
Ox725Rh6G
Lum
ines
cenc
e, a
. u.
λ
x10(smoothed)
x1
, nm
Figure 6.6A. Luminescence spectra of LM films on the surface of water with 1.064 µ Nd:YAG laser illumination.

93
Figure 6.6A shows the luminescence spectra of LM films prepared with
JPW1234, Rh6G, and Ox725 dyes. Figure 6.6B shows analogous spectra of DCA particles prepared with JPW1234 and Rh6G dispersed in an aqueous medium. In addition a spectrum of silver colloid aggregated in 0.1M KCl is shown in Figure 6.6B. It is seen that, as far as the JPW1234 and Rh6G are concerned, there is a considerable similarity between the spectra obtained in LM films or DCA particles (see Figure 6.6A and 6.6B). In discussing these spectra let us consider for clarity three wavelength regions relative to the second harmonic wavelength, >532 nm, =532 nm, and <532 nm.
• >532 nm: This region is normally associated with two photon luminescence.
The ratio of the two photon luminescence which occurs in the region >532 nm for the different dyes is correlated with the relative quantum yield of the linear fluorescence. For example, the highly fluorescent dye Rh6G produces a "luminescent" DCA with a larger two photon emission than the JPW1234 dye which is normally non-fluorescent when in solution. The origin of the luminescence is not completely understood, especially the two peak structure clearly seen for Rh6G and, to a lesser extent, for the JPW1234 films/particles. The luminescence peaks from the Rh6G film occur at wavelengths of 573 and 579 nm. We believe that these peaks can be attributed to surface enhanced hyper Raman scattering from the dye coating, or to nonlinear fluorescence from the dye-colloid aggregates, or both. In any case, this phenomenon is to the best of our knowledge observed for the first time. It is most interesting and undoubtedly deserves further study.
7006506005505004504000.0
0.2
0.4
0.6
0.8
1.0Rh6GJPW1234
0.1M KCl
, nm
Lum
ines
cenc
e, a
. u.
λ
x10(smoothed)
x1
Figure 6.6B. Luminescence spectra of aqueous DCA suspension at 1.064 µ Nd:YAG laser illumination.

94
• =532 nm: This sharp peak is associated with second harmonic (SH), or hyper
Raleigh, scattering. The SH scattering efficiency of films/particles formed with JPW1234 dye is higher than the Rh6G particles. This relates to the high value of the second order polarizability of these styryl dyes. 22
• <532 nm: In this region the luminescence occurs from multiphoton
interactions. No multiphoton luminescence from JPW-based films/particles was detected, whereas the spectrum of Rh6G-based films/particles clearly exhibits distinguishable multiphoton luminescence at wavelengths of 450-500 nm which, again, correlates with a highly luminescent character of the Rh6G dye. Note that the data to the left from a vertical line at 500 nm in Figures 6.6A and 6.6B are smoothed and multiplied by 10 in order to make evident the presence of multiphoton luminescence from Rh6G particles.
In spite of this similarity there are also differences in the pattern of the
observed non-linear luminescence from the LM films and the DCA particles. First, the ratio of SH scattering peak to the 2 photon luminescence peak is bigger for LM films than for aqueous DCA. Second, only a very weak luminescence, less than 1% of the LM films luminescence, was detected with Ox725-based aqueous DCA. Because of its small value, it is not shown in Figure 6.6B.
The aggregation of the colloid seems to be an important factor ensuring a
high value of SH scattering by a colloid. It appears that a silver colloid aggregated in an aqueous solution of 0.1M KCl has a SH scattering efficiency of the same order of magnitude as a JPW1234-colloid complex. With Rh6G on the other hand the intensity of the SH scattering is reduced. These effects are illustrated in Figure 6.6B. It also seen in these spectra that the salt aggregated colloid exhibits "pure" SH scattering with negligible two- or multiphoton luminescence. Thus, the role of a dye in establishing the luminescence spectrum of a DCA probably consists of (a) modifying SH scattering efficiency of the aggregated silver colloid and (b) introducing defined two photon (or multiphoton) luminescence peaks into the emission spectrum of DCA.

95
6.3.3.3. Optimization of SH scattering from aqueous DCA particles
We studied the dependence of the strength of the SH scattering at 532 nm as a function of concentration of silver in the colloidal suspension and of the dye in the methylene chloride solution before the mixing of the colloid and dye solutions. The results are presented in Figures 6.7A for JPW1234 and 6.7B for Rh6G. For each experimental point, DCA were prepared by mixing of 10 ml of silver colloid with 10 ml of the organic solution of the dye in a standard 20-ml scintillation tube.
Let us consider first the results obtained for the potentiometric dye JPW1234. As is seen from Figure 6.7A, for every degree of dilution of the silver colloid, corresponding to a concentration of silver in the aqueous suspension of 1, 0.33, and 0.1 mM, there is an optimal concentration of dye of 7, 20, and 70 µM, respectively, which maximizes the intensity of the nonlinear light scattering at 532 nm. It is seen that there is an approximate direct proportionality relationship between the silver concentration used and the optimal concentration of the JPW1234 dye. We attribute this fact to the existence of an optimal coverage of a single colloidal particle by the dye which maximizes the light scattering at the SH frequency by tuning the degree of the colloid aggregation and/or the degree of the dye-particle interaction.
10001001010
10
20
1 mM0.33 mM0.1 mM
Dye concentration, µM
SH s
igna
l, a.
u.
Ag concentration:JPW1234
Figure 6.7A. Dye/colloid concentration dependence of SH scattering by DCA produced with JPW1234.

96
However, the same behavior was not observed for Rh6G dye. The maximal signal was observed at approximately the same concentration of Rh6G, about 0.2-0.3 mM, for the three aqueous concentrations of silver, equal to 1, 0.33, and 0.1 mM (see Figure 6.7B). This, together with the much bigger Rh6G concentrations which one has to use in order to maximize the SH scattering signal by DCA, points out to a different mechanism of interaction between the Rh6G dye and silver particles as compared to JPW1234 dye. Finally, extremely weak aqueous SH scattering was observed when the Ox725 dye was used to produce aqueous DCA suspension, though the LM films were still obtained with this dye at a variety of relative dye/silver concentrations. We note also that, for each of the three dyes used, a considerable SH scattering signal in solution was only observed when the silver colloid was aggregated.
6.4. Estimating the efficiency of second harmonic scattering
We estimated experimentally the number of photons at 532 nm emitted by a single dye-coated silver particle at a given intensity of Nd:YAG illumination. To do so, we calibrated the detection system sensitivity in mV per a given number of photons entering the input slit of the monochromator at 532 nm per single Q switched (QS) pulse. The experimental set-up was essentially identical to that
1000010001001010
2
4
6
8
10
1 mM0.33 mM0.1 mM
Dye concentration, µM
SH s
igna
l, a.
u.
Ag concentration:
Rh6G
Figure 6.7B. Dye/colloid concentration dependence of SH scattering by DCA produced with Rhodamine 6G.

97
used in the aqueous DCA luminescence measurements. We placed 3 ml of ordinary silver colloid, diluted to 0.1 M of silver, into the Raman cuvette and illuminated the cuvette with a doubled Nd:YAG emission at 532 nm. The colloid was needed merely to provide effective scattering of the incident 532 nm beam. Special care was taken to pass the 532 nm beam exactly along the path of the infrared laser emission used in the luminescence measurements. The power of incident 532 nm illumination was high enough, 100 mW, so that a measurement of the light power scattered by the colloid and collected onto the input slit of the monochromator was possible with a standard calibrated power meter. Next a set of standard neutral density filters was inserted before the monochromator in order to reduce the 532 nm signal to a level which was well below the saturation limit of the photomultiplier. The extinction of each of the filters was carefully measured on a spectrophotometer. As a result of the calibration procedure, it was estimated that about 8 photons at 532 nm at the input slit of the monochromator per single QS pulse are needed in order to produce at the output of the detection system a signal of 1 mV.
With this estimation of the system sensitivity at hand, we determined the
number of photons per second generated by a single colloidal particle in a detection volume of the DCA suspension at an average infrared illumination intensity of 3 W/cm2. It appeared that about 6.6x10⁴ photons were generated per QS pulse in a detection volume of 1.5x10⁻³ cm3. By taking into consideration the known concentration of colloidal particles, it was estimated that the detection volume contained about 4.25 million particles. Finally, the 532 nm photon flux by a single dyed colloidal particle, at a QS frequency of 400 Hz, was found to be 6 photons/s.
The investigation of the DCA suspension under a light microscope has shown that the particles exist in suspension in a highly aggregated form. Since second order nonlinear optical processes are prohibited in an isotropic medium, the SH scattering by a single symmetric colloidal particle should vanish. Therefore, it seems reasonable that aggregation is a necessary condition for efficient SH scattering to be observed.
In this regard, one can easily estimate that a particle of aggregated colloid
with a mean diameter of 0.5 µm, containing about 120 small colloidal particles like those seen in the electron micrograph in Figure 6.3, emits over 720 SH photons per second. Such a signal should be readily noticed in a light micrograph as a small bright point of light which we have indeed observed experimentally as described below.

98
6.5. Applications 6.5.1. PVA-DCA To demonstrate the applicability of aggregated dye-coated colloidal
particles as a new kind of nonlinear optical probe for light microscopy, we immobilized the particles by inserting them into a polyvinyl alcohol (PVA) film.* The sample, called "PVA-DCA", was investigated in a light microscope equipped with a cooled CCD camera. A set of interchangeable color filters was used in order to view the sample at specific wavelengths. The typical micrographs of the probes distributed throughout a 0.2 mm-thick PVA film are shown in Figure 6.8.
* To prepare the film, we dissolved a 5 g sample of polyvinyl alcohol (PVA), MW 25,000, Sigma, in 25 ml of double distilled water by boiling for 10 min. The concentrated suspension of DCA was added (1 ml) to 5 ml of PVA, mixed and degassed. The mixture was spread on a 2 inch circular fused silica slide and left for drying overnight.

99
Figure 6.8. (Turned by 90o) Light micrographs of DCA embedded into a PVA film: A) general view; B) 1-photon scattering; C) 2-photon luminescence; and D) 2-photon (second harmonic, hyper Raleigh) scattering at 532 nm. Bar, 20 micron. The first two images, A and B, were obtained at an ordinary white light illumination. The image A gives the reader an idea of how a typical sample film looks. The black points are DCA. The image B is obtained in the dark field illumination geometry. The white points are DCA which scatter light much stronger than a PVA support. The images C and D are obtained at 3W/cm2

100
illumination by a Nd:YAG laser at 1.064 µm with no illumination in the visible. The image C is taken with a yellow filter cutting down emission at 532 nm completely and passing the yellow-red light. The image D is obtained with an 532 nm interference filter. In both cases, the residual infrared emission, scattered by a sample, was cut off by a special filter. Thus, images B and D display one- and two-photon scattering, and image C displays two-photon luminescence by the probes. In order to help the reader find correlations between positions of emitting probes, we connected the brightest points of the images with an imitation of the Dipper. It is seen that many of the probes seen as dark points in image A and/or as white points in image B, emit both green and yellow light as was expected based on spectroscopic results described above. We note that the direct estimation of signal levels based on the data presented in Figure 6.8 concurs with the estimation performed in previous section. Thus, the results prove the unique utility of dye-colloid aggregates, or nanoantennae-equipped molecular probes, in nonlinear optical microscopy with the use of a variety of nonlinear optical processes.
6.5.2. Fibroblasts As a next step towards utilizing the nanoantennae probes in cellular
microscopy, we adsorbed the probes to a cellular membrane. For this experiment, 50 µl of aqueous suspension of DCA, prepared with the JPW1234 potentiometric dye, was added to a dish culture of cow corneal stroma cells. Within several minutes, the DCA sedimented down to the bottom of the culture dish on which the cells were grown.

101
Figure 6.9, top, shows the general view of probe covered cells. The probes are seen as dark spots. Since no monodispersion of probes was made at this stage, they had a variety of sizes and shapes, the size varying from 0.5 to 12 µm. A black arrow in Figure 6.9, top, points to a small probe which is about 0.5 µm in size so that it is hardly seen in this figure. Then the white light illumination was turned off, and the sample was illuminated with a Nd:YAG laser at 1.064 µm at an average intensity of 3W/cm2. As in the previous experiment, an IR blocker
Figure 6.9. An experiment with a cell culture. Bar, 20 micron.

102
was used to cut off any linearly scattered laser emission. Figure 6.9, bottom, shows the picture taken by a CCD camera coupled to the microscope after several tens of seconds of exposure. The emission from the point probe marked with black arrow in the upper part of the figure is also seen as a bright point marked with white arrow at the bottom of Figure 6.9. Thus, only emitting probes are seen with no background from the rest of the sample whatsoever. 6.6. Conclusion and future plans
In conclusion, we prepared submicrometer size aggregated particles con-sisting of silver colloidal particles and electrochromic membrane potential sensitive dye. The particles were found to exhibit gigantic nonlinear optical properties due to the surface enhancement phenomena. At small infrared illumination intensities of only 3 W/cm2, the particles emit two photon lumines-cence and second harmonic scattering, the signal fluxes being big enough to easily allow the CCD based microimaging. It is important to stress that the par-ticles can be selectively associated with specific regions in a biological system such as a cell in order to selectively enhance in that region nonlinear optical interactions as a probe of biological structure and function. The results on ab-sorption spectroscopy of dye colloid aggregates in the form of dense colloidal monolayers strongly indicate to a significant degree of electromagnetic coupling between the silver colloidal particle and the adsorbed dye molecule. The results on absorption/emission spectroscopy of the dye colloid aggregates strongly support the concept of nanoantenna equipped nonlinear optical molecular probes introduced in this chapter.
Further development of the nanoantennae-equipped nonlinear optical
molecular probes will include: • Demonstrating the membrane potential sensitivity. The results of
luminescence spectroscopic studies indicate that the emittive properties of the probes depend on the kind of the dye used. Moreover, the absorption spectroscopy data point out to a significant degree of electromagnetic interaction between the silver particles and the dye coat. Therefore, it is reasonable to expect that such parameters of the probe luminescence, such as intensity and peaks position, will be sensitive to the electronic structure of the dye. In this regard, it is encouraging that the sensitivity of nonlinear polarizability of the JPW family of potentiometric probes has already been demonstrated in our previous experiment (see Chapter 3 and Ref. 3) Since we

103
were using a potentiometric dye JPW1234 to coat the silver particles, we anticipate a direct sensitivity of nonlinear optical signal from our probes to the membrane potential. Future experiments must establish the degree of this sensitivity, as well as prompt another possible mechanisms of the probes sensitivity to membrane potential or to another important physiological cell parameter.
• Monodispersing the probes. The standardization of the probes size, as well as their better stabilization in aqueous environment, should make the probes more useful in a variety of applications.
• Connecting the probes to a specific sites in a cell membrane. Probably one of most interesting applications of nanoantennae equipped molecular probes lies in optical research of neural networks. The possibility of parallel, non-contact nonlinear optical monitoring the membrane potential in a neural culture with nanometric spatial resolution will open new perspectives in understanding the mechanisms of activity of brain cells. This application requires, however, that the probes be conjugated to specific membrane channels. Such a conjugation could be realized using immunolabelling techniques23 which are at present routinely applied for labeling with colloidal gold particles.
References 1. O. Bouevitch, A. Lewis, and M. Sheves, "Probing bacteriorhodopsin
photochemistry with non-linear optics: comparing the second harmonic generation of bR and the photochemically induced intermediate K". J. Phys. Chem. 99, 10648-10657 (1995).
2. J. Huang and A. Lewis, "Determination of the absolute orientation of the retinylidene chromophore in purple membrane by a second-harmonic interference technique". Biophys. J. 55, 835-842 (1989).
3. O. Bouevitch, A. Lewis, I. Pinevsky, J. P. Wuskell, and L. M. Loew, "Probing membrane potential with nonlinear optics". Biophysical Journal 65, 672-679 (1993).
4. S. W. Hell, "Improvement of lateral resolution in far-field fluorescence light microscopy with offset beams". Opt. Comm. 106, 19-24 (1994).
5. C. K. Chen, A. R. B. d. Castro, and Y. R. Shen, "Surface-enhanced second harmonic generation". Phys. Rev. Lett. 46, 145-148 (1981).
6. G. T. Boyd, T. Rasing, J. R. R. Leite, and Y. R. Shen, "Local-field enhancement on rough surfaces of metals, semimetals, and semiconductors with the use of optical second-harmonic generation". Phys. Rev. B 30, 519-526 (1984).

104
7. J. Wessel, "Surface-enhanced optical microscopy". J. Opt. Soc. Am. B 2, 1538-1541 (1985).
8. A. Wokaun, J. G. Bergman, J. P. Heritage, A. M. Glass, P. F. Liao, and D. H. Oslon, "Surface second-harmonic generation from metal island films and microlithographic structures". Phys. Rev. B 24, 849-856 (1981).
9. A. Otto, I. Mrozek, H. Grabhorn, and W. Akemann, "Surface-enhanced Raman scattering". J. Phys.: Condens. Matter 4, 1143-1212 (1992).
10. G. T. Boyd, Y. R. Shen, and T. W. Hänsch, "Continuous-wave second-harmonic generation as a surface microprobe". Opt. Lett. 11, 97-99 (1986).
11. N. Kalyaniwalla, J. W. Haus, R. Inguva, and M. H. Birnboim, "Intrinsic optical bistability for coated silver spheroidal particles". Phys. Rev. A 42, 5613-5621 (1990).
12. P. Royer, J. P. Goudonnet, R. J. Warmack, and T. L. Ferrel, "Substrate effects on surface-plasmon spectra in metal-island films". Phy. Rev. B 35, 3753-3759 (1987).
13. P. Hildebrandt and M. Stockburger, "Surface-Enhanced resonance Raman spectroscopy of Rhodamine 6G adsorbed on colloidal silver". J. Phys. Chem. 88, 5935-5944 (1984).
14. K. C. Gordon, J. J. McGarvey, and K. P. Taylor, "Enhanced Raman scattering from "Liquid Metal" films formed from silver sols". J. Phys. Chem. 93, 6814-6817 (1989).
15. D. Yogev and S. Efrima, "Novel silver metal liquidlike films". J. Phys. Chem. 92, 5754-5760 (1988).
16. J. Y. Huang, A. Lewis, and L. Loew, "Nonlinear optical properties of potential sensitive styryl dyes". Biophys. J. 53, 665-670 (1988).
17. P. C. Lee and D. Meisel, "Adsorption and surface-enhanced Raman of dyes on silver and gold sols". J. Phys. Chem. 86, 3391-3395 (1982).
18. R. G. Freeman, K. C. Grabar, K. J. Allison, R. M. Bright, J. A. Davis, A. P. Guthrie, M. B. Hommer, M. A. Jackson, P. C. Smith, D. G. Walter, and M. J. Natan, "Self-assembled metal colloid monolayers: an approach to SERS substrates". Science 267, 1629-1632 (1995).
19. S. Efrima, "Metal Liquid-Like films". Critical Reviews in Surface Chemistry 1, 167-215 (1991).
20. S. Garoff, D. A. Weitz, T. J. Gramila, and C. D. Hanson, "Optical absorption resonances of dye-coated silver-island films". Opt. Lett. 6, 245-247 (1981).
21. H. G. Craighead and A. M. Glass, "Optical absorption of small metal particles with adsorbed dye coats". Opt. Lett. 6, 248-250 (1981).
22. J. Y. Huang, A. Lewis, and L. Loew, "Nonlinear optical properties of potential sensitive styryl dyes". Biophys. J. 53, 665-670 (1988).

105
23. J. E. Beesley, "Colloidal gold: a New Perspective for Cytochemical Marking". Oxford University Press, 1989.

106
THESIS CONCLUSIONS
As a result of the studies of SHG as a probe of biomembranes, the following conclusions were reached: • Nonlinear optical phenomenon of second harmonic generation (SHG) can be
applied for monitoring the potential of a dye-stained biological membrane. It was shown experimentally, for the first time, that surface SHG from a potentiometric dye-stained hemispherical lipid bilayer of oxidized cholesterol is sensitive to the voltage applied across the bilayer, the sensitivity being in the range of 2-4% for a 40 mV step change in the membrane potential. Our results indicate that direct electronic response of the induced dipole of the dye molecule to an external electric field is responsible for voltage sensitivity of surface SHG from the dye-stained membrane. The signal level estimations, together with demonstrated possibility of enhancement of SHG at a surface of a free-electron metal, point out to the possibility of real-time membrane potential measurements with the required temporal resolution. The advantages of this new method of monitoring the membrane potential with SHG include infrared probing, inherent surface sensitivity, and fast electronic response of molecular probes to a membrane potential change.
• Nonlinear optical properties and induced dipole of the membrane protein
bacteriorhodopsin (bR) chromophore in the bR568 and K states can be investigated by SHG. It was found in our experimental studies that there is an increase of induced dipole of the bR chromophore upon transition bR-K. The increase of the induced dipole upon bR-K transition was correlated with current models of primary photochemistry of bR. The results, interpreted in terms of available spectroscopic and crystallographic data, point out to a substantial increase of the excited state dipole moment of the bR chromophore upon bR-K transition. The experimental and theoretical methodology, de-veloped for this experiment, can be readily extended for comparison of induced dipoles of chromophores in other retinal proteins in different states.
• Thin films of bR were found to be a practical nonlinear optical material for
autocorrelation of femtosecond light pulses. Thin films of bR have an advantage of negligible broadening of 120-fs pulses at a wavelength of 790 nm, effective second order susceptibility larger than 10-9 esu, which can be tuned to the desirable wavelength in the visible region of the spectrum, feasibility of film production, and stability of its optical properties.

107
• Surface enhancement phenomena can be used to produce a submicrometer size particle with gigantic optical nonlinearities. We used this approach producing dye-colloid aggregate (DCA) particles in solution. These DCA, which are in essence a nanoantennae equipped molecular probes, could be selectively placed to enhance in specific locations in a biological system optical nonlinearities as a probe of biological structure and function. The DCA have been experimentally demonstrated to be suitable for the light mi-croscopy of biosystems.

108
SUMMARY 1. Contents of thesis
The present thesis is devoted to application of nonlinear optics to probing biomembranes. Chapter 1 of thesis is a general introduction. Chapter 2 discusses theoretical aspects of second harmonic generation (SHG). The technique of probing biomembrane potential with SHG is introduced in Chapter 3 of the thesis. A number of essential advantages of this new technique over the presently available fluorescence and absorption techniques are highlighted. These include infrared probing, specific surface sensitivity, possibility of effective surface enhancement, and fast mechanism of response to a change in membrane potential. The bacterial membrane protein bacteriorhodopsin (bR) is studied in Chapter 4. It is shown that the induced dipoles of the bR chromophore in different states of the protein can be compared using SHG as an experimental tool. We found that the induced dipole of the bR chromophore increases in going from the initial pigment state to an intermediate state, called K, which was stabilized at low temperature. The observation of the increase of induced dipole indicates that there is an increase of the excited state dipole moment of the bR chromophore in going from the initial state to K. Chapter 5 is devoted to application of thin bR films in nonlinear optics. It is shown that bR films can be used for characterization of femtosecond pulses. The autocorrelation of 120-fs pulses from a tita-nium:sapphire laser was measured with an electrophoretically sedimented bR film. The rest of the thesis (Chapter 6) discusses the ways of increasing the spatial resolution of nonlinear optical probing, as well as the magnitude of the nonlinear optical signal itself. The surface enhancement phenomena in dye-aggregated silver colloids enabled us to create simple and efficient nonlinear optical probes which are described in Chapter 6. 2. Theory of SHG
The main source of optical nonlinearity in our studies, at a microscopic level, was the nonlinearity of small organic molecules with charge transfer (CT) character of the first electronic transition in the visible region of the spectrum. The second harmonic oscillations of the molecular dipole caused by powerful optical field in the infrared were near resonant in frequency with the lowest electronic transition. It is known that under such conditions, the optical nonlinearity of charge transfer molecules is well described by the two level model. 1 The two level model establishes a direct proportionality relationship

109
between the second order molecular polarizability and the induced dipole. The induced dipole is by definition a difference between the excited and the ground state dipole moments of a molecule. 1 3. Measurement of membrane potential with SHG
Optical techniques for probing the cellular membrane potential were introduced by Cohen et al. 2 about two decades ago and are now widely used in a variety of the research problems. 3 The most popular technique for monitoring the membrane potential is fluorescence by a membrane bound dye. By measuring slight spectral shifts of fluorescence, or slight changes of fluorescence intensity, one judges about change in the membrane potential. It was found that the observed sensitivity of the dye fluorescence to a membrane potential is caused, in general, by a combination of three factors. First, the dye partitioning between the membrane and aqueous environments can be sensitive to a potential of the membrane. 4 Second, a dye can rotate in the membrane in response to a change in the membrane potential5 and this can result in changes of fluorescence intensity. Finally, the electronic level structure of the dye can be perturbed as a result of interaction of molecular dipole with the external electric field induced by a membrane potential which is translated in spectral shifts of fluorescence (electrochromic mechanism). 6
For our studies, we have chosen charge shift molecular probes which respond to a change in the membrane potential mainly through the electrochromic mechanism. 6 Previous results indicated that these molecules possess high nonlinear optical (NLO) constants. 7 It was intuitively expected that, since the NLO properties of the dye, according to the two-level model, are sensitive to dipole structure of the dye, a membrane-bound molecular submonolayer SHG will be a sensitive probe of the membrane potential. For the first experimental test of this idea we have chosen to work with a model bilayer membrane of oxidized cholesterol. We stained this membrane with a submonolayer (dye/lipid ratio of 1:100) of an electrochromic dye and measured dependence of SHG to a change in the voltage clamped across the bilayer. It was found that the submonolayer SHG is indeed sensitive to a membrane potential, the sensitivity being in the range of 2-4% for a 40 mV step change of membrane potential difference across a 5 nm bilayer membrane. No indication of potential induced reorientation of the dye was detected. The observed dependence of SHG on membrane potential was ascribed to the membrane potential sensitivity of the induced dipole of the molecular probe.

110
The power of SHG observed in the hemispherical bilayer experiment was
of the order of 104 photons/s at 300 W/cm2 average laser illumination intensity. Since for a practical measurement of localized membrane potential much higher levels of the SHG signal are required, it deemed necessary to search for a way to increase sensitivity of the method, as well as the absolute signal fluxes. In this regard, it is known from the literature that nonlinear optical interactions can be enhanced at a surface of a free electron metal, such as silver. 8 To study how a monolayer SHG from the dyes used for monitoring membrane potential is modified at a silver surface, we electrochemically adsorbed the charged dye molecules at a rough silver surface from aqueous solution. The results obtained indicated that there is a significant increase of SHG from a rough silver surface upon adsorption of about a monolayer of the dye at the surface of the silver plate. The amount of photons emitted from a unit square of the dye-covered rough silver surface was estimated to be some 3 orders of magnitude bigger than the amount of photons emitted at similar conditions by a dye monolayer deposited on a fused silica slide. 4. Probing photochemistry of bacteriorhodopsin with SHG
Despite the extensive research of bacteriorhodopsin (bR), the mechanism by which this unique bacterial membrane protein transforms the photon energy into the transmembrane proton gradient remains one of outstanding problems in biophysics. In terms of the primary photochemical event it is known that it takes the initial pigment state ≤450 femtoseconds to traverse the excited state and to reach the ground state photoproduct J, storing 23% of the photon energy. 9 The first intermediate that can be stabilized after photon absorption is not J but K, which is produced from J.
Numerous studies of K were performed with a variety of spectroscopic
techniques. 10-12 The fundamental information obtained with SHG about other bR states includes details on the absolute structural orientation of the chromophore13 and the induced dipole of the chromophore in the protein. 14 This information was obtained with an experimental technique that is relatively simple to implement, is non-bleaching using infrared probing beams, and has a large signal to noise ratio due to the huge nonlinearities exhibited by bR.
We compared the SHG of the initial pigment state bR568 with the photochemically generated K intermediate at 77 oK and derived from our data

111
information on the induced dipole of these two states. For this purpose, we made a film out of bR and measured SHG by this film at infrared illumination. Successive illumination of bR film at different wavelengths in the blue-green and red regions of spectrum drove certain part of bR molecules to the K state and back. The change of SHG amplitude and phase which occurs when a known portion of bR molecules in a film goes to K state was measured experimentally, and these data were translated into the change of induced dipole of bR chromophore at bR-K transition using the two level model mentioned above. It was shown that induced dipole of the retinal chromophore increases in going from bR to K. The induced dipole ratio of K relative to bR568 was found to be 1.13. An additional study of an artificial form of bR, called "deionized membrane", which mimics the red-shifted K state, pointed out that induced dipole of the retinal chromophore in this form of bR is also bigger than in the initial pigment state, by about 7%. All these results were analyzed in terms of the current theoretical understandings of SHG in conjugated polyenes. Finally, we analyzed the data in terms of prevalent models that could define this primary event in bR. It was concluded that there is an indication to an increase of the excited state dipole moment of the retinal chromophore at bR-K transition. 5. Autocorrelating femtosecond pulses with thin bR films
Thin bR films were found to be a practical optical material in various applications. 15-17 Our studies supported a big value of second order optical nonlinearity reported for electrophoretically sedimented bR films. 18 Prompted by these observations, we attempted to apply thin bR films for characterization of femtosecond pulses. First, we analyzed experimentally and theoretically the Maker fringes pattern19 of these films. Based on this analysis, it was concluded that the coherence length is bigger than the film thickness, 10 µm. Second, a bR film was inserted into a traditional non-collinear Michelson autocorrelator, and an autocorrelation of 120-fs 790-nm pulses from a Ti:sapphire laser was recorded. No broadening was detected as compared to an autocorrelation of fs pulses with a thin slice of a β-barium borate crystal. The results were discussed in light of general application of a near resonant medium for autocorrelation of shorter pulses than were used in this experiment, e.g. 20-fs pulses. The evident advantage of the big value of near resonant second order nonlinearity is opposed by spectral distortions introduced by a resonant medium into the signal. The spectral distortions are necessarily translated into the distortions of temporal profile of autocorrelation. However, since the absorption spectrum of bR, like the spectra of visual pigments, is very diffuse, one might hope to minimize this kind of broad-

112
ening by working at some "optimal" distance from the absorption maximum of bR chromophore. It is important to mention in this regard that bR absorption can be easily "tuned" to a desirable wavelength in the visible and near infrared regions20-
23 both by a replacement of bR chromophore with synthetic retinals20, 21 and by adaptation of bR to various environments, such as acidified environment. 22, 23 In addition, bR films offer an advantage of low cost, ease of reproduction, and stability.
6. A study of nanoantennae equipped molecular probes with gigantic optical nonlinearities
A new concept of nanoantennae equipped molecular probes suitable for nonlinear optical microscopy of biosystems is introduced in Chapter 6. A submicrometer size aggregate of dye-covered free electron nanoparticles serves as antenna receiving incoming electromagnetic emission. The emissive properties of aggregated colloidal particles are greatly influenced by the dye adsorbed to the colloid. The probes, obtained with a variety of dyes, were characterized structurally and spectroscopically. It was found that, depending on the dye used, the probes are capable of emitting 1) two photon luminescence; 2) hyper Raleigh scattering; 3) multiphoton luminescence. The signal levels of hyper Raleigh scattering from a 0.5 µm aggregated probe particle were experimentally estimated to be 720 photons/s at average infrared illumination intensity of only 3 W/cm2.
To demonstrate the utility of probes in nonlinear optical microscopy, the
probes were distributed in a polyvinyl alcohol film and microimaged at infrared illumination in green and yellow light. The comparison of micrographs obtained with different color filters proved the capability of probes to emit light in the visible corresponding to second harmonic scattering and two photon luminescence. The next step consisted in adsorbing the probes to a cow corneal stroma living cells in a dish culture and imaging them both at visible and infrared illumination.
As an additional result of our studies of dye-colloid aggregates, it was
found that the dye covered silver and gold nanoparticles are capable of forming well structured self-assembled colloidal monolayers at a phase interface. These new physicochemical systems are of considerable interest both from fundamental viewpoint24, 25 and in connection with utilization of these monolayers for surface enhanced Raman scattering. 26, 27 The monolayers were studied in Chapter 6 with absorption and emission spectroscopy and TEM microscopy. The results

113
obtained helped us in estimations of nonlinear optical signal from a single particle, as well as pointed out to a significant degree of dye-colloid electromagnetic interaction establishing the unique absorption and luminescence properties of the probes.
References - Summary 1. J. Zyss and D. S. Chemla. “Quantum Electronics - Principles and
Applications.” In Nonlinear Optical Properties of Organic Molecules and Crystals, ed. D. S. Chemla and J. Zyss. 1. New York: Academic Press, 1987.
2. L. B. Cohen, B. M. Saltzberg, H. V. Davilla, W. N. Ross, D. Landowne, A. S. Waggoner, and C. H. Wang, "Changes in axon fluorescence during activity: molecular probes of membrane potential". J. Membr. Biol. 19, 1-36 (1974).
3. L. M. Loew. “Spectroscopic Membrane Probes.” Chapt. 14-21. Boca Raton, Fl.: CRC Press Inc., 1988.
4. P. J. Sims, A. S. Waggoner, C.-H. Wang, and J. F. Hoffman, "Studies on the mechanism by which cyanine dyes measure membrane potential in red blood cells and phosphatidylcholine vesicles". Biochemistry 13, 3315-3330 (1974).
5. P. R. Dragsten and W. W. Webb, "Mechanism of the membrane potential sensitivity of the fluorescent membrane probe merocyanine 540". Biochemistry 17, 5228-5240 (1978).
6. L. M. Loew, S. Scully, L. Simpson, and A. S. Waggoner, "Evidence for a charge-shift electrochromic mechanism in a probe of membrane potential". Nature 281, 497-499 (1979).
7. J. Y. Huang, A. Lewis, and L. Loew, "Nonlinear optical properties of potential sensitive styryl dyes". Biophys. J. 53, 665-670 (1988).
8. C. K. Chen, A. R. B. d. Castro, and Y. R. Shen, "Surface-enhanced second harmonic generation". Phys. Rev. Lett. 46, 145-148 (1981).
9. J. K. Lanyi, "Proton transfer and energy coupling in the bacteriorhodopsin photocycle". J. Bioenerg. Biomembr. 24, 169-179 (1992).
10. M. S. Braiman and R. A. Mathies, "Resonance Raman spectra of bacteri-orhodopsin's primary photoproduct: evidence for a distorted 13-cis retinal chromophore". Proc. Natl. Acad. Sci. USA 79, 403-407 (1982).
11. K. J. Rothchild, H. Marrero, M. Braiman, and R. Mathies, "Primary photochemistry of bacteriorhodopsin: comparison of Fourier transform

114
infrared difference spectra with resonance Raman spectra". Photochem. Photobiol. 40, 675-679 (1984).
12. O. A. Askipetrov, N. N. Akhmediev, N. N. Vsevolodov, D. A. Esikov, and D. A. Shutov, "Photochromism in nonlinear optics: photocontrolled second-harmonic generation by bacteriorhodopsin molecule". Sov. Phys. Dokl. 32, 219-220 (1987).
13. J. Huang and A. Lewis, "Determination of the absolute orientation of the retinylidene chromophore in purple membrane by a second-harmonic interference technique". Biophys. J. 55, 835-842 (1989).
14. J. Huang, Z. Chen, and A. Lewis, "Second-harmonic generation in purple membrane-poly(vinyl alcohol) films: probing the dipolar characteristics of the bacteriorhodopsin chromophore in bR570 and M412". J. Phys. Chem. 93, 3314-3320 (1989).
15. Z. Chen, A. Lewis, H. Takei, and I. Nebenzahl, "Bacteriorhodopsin oriented in polyvinyl alcohol films as an erasable optical storage medium". Appl. Opt. 30, 5188-5196 (1991).
16. G. R. Kumar, S. J. Wategaonkar, and M. Roy, "Laser unduced transient gratings in bacteriorhodopsin". Opt. Commun. 98, 127-131 (1993).
17. D. V. G. L. N. Rao, F. J. Aranda, B. J. Wiley, J. A. Akkara, D. L. Kaplan, and J. F. Roach, "Mirrorless all-optical bistability in bacteriorhodopsin". Appl. Phys. Lett. 63, 1489-1491 (1993).
18. A. V. Sharkov and T. Gillbro, "Second harmonic generation in oriented purple membrane films under picosecond light excitation". Thin Solid Films 202, L9-L14 (1991).
19. J. Jerphagnon and S. K. Kurtz, "Maker fringes: a detailed comparison of theory and experiment for isotropic and uniaxial crystals". J. Appl. Phys. 41, 1667-1681 (1970).
20. R. S. H. Liu, E. Krogh, X.-Y. Li, D. Mead, L. U. Colmenares, J. R. Thiel, J. Ellis, D. Wong, and A. E. Asato, "Analyzing the red-shift characteristics of azulenic, naphthyl, other red-fused and retinyl pigment analogs of bacteriorhodopsin". Photochem. Photobiol. 58, 701-705 (1993).
21. M. A. Marcus, A. Lewis, E. Racker, and H. Crespi, "Physiological and structural investigations of bacteriorhodopsin analogs". Biochem. Biophys. Res. Commun. 78, 669-675 (1977).
22. A. Albeck, N. Livnah, H. Gottlieb, and M. Sheves, "13C NMR studies of model compounds for bacteriorhodopsin: factors affecting the retinal chromophore chemical shifts and absorption maximum". JACS 114, 2400-2411 (1992).

115
23. S. O. Smith and R. A. Mathies, "Resonance Raman spectra of the acidified and deionized forms of bacteriorhodopsin". Biophys. J. 47, 251-254 (1985).
24. S. Efrima, "Metal Liquid-Like films". Critical Reviews in Surface Chemistry 1, 167-215 (1991).
25. D. Yogev and S. Efrima, "Novel silver metal liquidlike films". J. Phys. Chem. 92, 5754-5760 (1988).
26. K. C. Gordon, J. J. McGarvey, and K. P. Taylor, "Enhanced Raman scattering from "Liquid Metal" films formed from silver sols". J. Phys. Chem. 93, 6814-6817 (1989).
27. R. G. Freeman, K. C. Grabar, K. J. Allison, R. M. Bright, J. A. Davis, A. P. Guthrie, M. B. Hommer, M. A. Jackson, P. C. Smith, D. G. Walter, and M. J. Natan, "Self-assembled metal colloid monolayers: an approach to SERS substrates". Science 267, 1629-1632 (1995).