borrowers with large balances: rising student debt … · economic studies at brookings 3 ///...
TRANSCRIPT

THE BROOKINGS INSTITUTION | February 2018
Borrowers with Large Balances: Rising Student Debt and Falling Repayment Rates
Adam Looney
THE BROOKINGS INSTITUTION
Constantine Yannelis
NYU STERN
ECONOMIC STUDIES AT BROOKINGS
2 /// Borrowers with Large Balances: Rising Student Debt and Falling Repayment Rates
Contents
Acknowledgements ................................................................................................................ 3
I. Introduction .................................................................................................................... 4
II. Data and Context ........................................................................................................ 6
III. The Increase in Borrowers with Large Balances ....................................................... 8
IV. Changes in the characteristics of large-balance borrowers ..................................... 13
V. Outcomes for Borrowers with Large Balances ......................................................... 18
Earnings and Income ....................................................................................................... 18
Default and Repayment .................................................................................................. 20
VI. Why aren’t large-balance borrowers repaying their loans? ..................................... 23
VII. Concluding Remarks ............................................................................................... 28
References ............................................................................................................................29
ECONOMIC STUDIES AT BROOKINGS
3 /// Borrowers with Large Balances: Rising Student Debt and Falling Repayment Rates
STATEMENT OF INDEPENDENCE
The authors did not receive financial support from any firm or person for this article or from any firm or person with a financial or political interest in this article. They are currently not an officer, director, or board member of any organization with an interest in this article.
ABSTRACT
We examine the distribution of student loan balances and repayment rates in the United States using administrative student loan data. We show that increases in credit limits and expansions in credit availability resulted in rising borrowing amounts, and that the share of borrowers holding very large balances has surged. For instance, the share of borrowers leaving school with more than $50,000 of federal student debt increased from 2 percent in 1992 to 17 percent in 2014. Consequently, a small share of borrowers now owes the majority of loan dollars in the United States. Although these large-balance borrowers have historically strong labor market outcomes and low rates of default, repayment rates have slowed significantly between 1990 and 2014 reflecting, in part, changes in the characteristics of students, the schools they attended, and the rising amounts borrowed. A decomposition analysis indicates that changes in the types of institutions attended, student demographics, default rates, and increased participation of alternative repayment plans and forbearance largely explain the decrease in student loan repayment.
ACKNOWLEDGEMENTS
We thank to Jack Britton, Bruce Chapman, Natalie Cox, Sue Dynarski, Hilary Gelfond, Caroline Hoxby, Vivien Lee, Holger Mueller, Jeff Perry, Daniel Rees, Nick Turner, and David Wessel as well as seminar participants at the Federal Reserve Board, Tongji University and the Higher Education Economics and Finance Conference for helpful suggestions and comments. Any views or interpretations expressed in this paper are those of the authors and do not necessarily reflect the views of the Treasury or any other organization.
ECONOMIC STUDIES AT BROOKINGS
4 /// Borrowers with Large Balances: Rising Student Debt and Falling Repayment Rates
I. Introduction
Rising default rates among student loan borrowers have prompted researchers, policymak-
ers, and the general public to ask why borrowers default, whether students have taken on
too much debt, and what the implications are for student aid policy (Ionescu 2009; Loch-
ner and Monge-Naranjo 2011; Looney and Yannelis 2015.) In an earlier paper, we showed
that increases in the number of new borrowers at for-profit and public two-year community
college students lead to a surge in student loan defaults (Looney and Yannelis 2015). For
these borrowers, it was not the size of their debts, which were small, but their ability to pay:
many had dropped out, or attended programs that failed to lead to a decent job, or were
economically disadvantaged to start with. In 2015, half of defaulted borrowers owed less
than $10,000. In many cases, borrowers defaulted at the first instance after leaving school,
suggesting they had neither the means to pay nor the wherewithal to enroll themselves in
programs to avoid default. The high default rates among low-balance borrowers and low-
default rates elsewhere gives the impression that the major problems in the student loan
program are isolated among borrowers with relatively small balances.
In reality, the expansion in student lending—and its associated risks to students and
taxpayers—was more pervasive across all types of postsecondary education and among
graduate students, parents, as well as undergraduates. And problems are apparent if less
visible among borrowers accumulating large student debts. In this paper, we draw on ad-
ministrative data to examine the changing experience of borrowers who accumulate bal-
ances above $50,000. Borrowers rarely accumulate such debts. Only 2 percent of borrow-
ers owed that much in 1990 and only 5 percent in 2000. But higher loan limits, the elimi-
nation of limits on PLUS loans, expansions of loan eligibility to online programs (including
online graduate programs), and rising costs have allowed many borrowers to accumulate
not-before-seen levels of debt. By 2014, the share of student borrowers with balances over
$50,000 had reached 17 percent. Today, they account for the majority of outstanding stu-
dent debt owed to the government.
Because such borrowers were mostly graduate students, often at selective institutions,
or parents who passed a credit check, they are perceived to be low risk. Indeed, default
rates are not even published for certain types of such loans. When they are, however, de-
fault rates are not by themselves a reliable measure of loan performance because many
borrowers use income driven repayment plans, long deferrals, or forbearances to postpone
or avoid default even in the face of unmanageable debts. For example, while default rates
began to fall in the mid-2010s, rather than signaling improvements in loan payments, re-
payment rates (the share of the original balance students had repaid after 3 or 5 years) fell.
Today, for the first time, more large-balance borrowers are falling behind on their pay-
ments than are making progress reducing their debts.
The increase in borrowing among graduate, parent, and high-balance undergraduate
borrowers has many troubling similarities to the increase in borrowing at for-profit and
public two-year community colleges that resulted in high rates of default. A growing share
of large-balance borrowers took-out loans to attend for-profit schools, which have poor re-
payment outcomes and worse labor market outcomes compared to other institutions
ECONOMIC STUDIES AT BROOKINGS
5 /// Borrowers with Large Balances: Rising Student Debt and Falling Repayment Rates
(Looney and Yannelis 2015). For borrowers starting to repay loans in 2000, less than 5
percent of borrowers with repayment balances above $50,000 borrowed to attend for-
profit institutions. In 2014 that share surpassed 20 percent. Historically, most large bor-
rowers were graduate and professional borrowers. Today, they are increasingly likely to be
parents and independent undergraduate borrowers, whose economic outlook tends to be
riskier, and less likely to support substantial borrowing over time.
Beyond the types of borrowers and institutions involved, loan sizes and loan perfor-
mance have changed in worrying ways. The sheer dollar amounts owed by these students
is well above historical norms, and given the long amortization schedules typical of large-
balance borrowers, the total costs of these loans, including principal and interest, are con-
suming a rising share of some borrowers’ lifetime incomes. Many large- balance borrowers
who are not in default have low repayment rates, and repayment rates have slowed over
time. The median borrower who originally owed less than $50,000 in the early 2000s paid-
off his or her debt within ten years of entering repayment, while the median borrower who
had borrowed more than $50,000 in debt while in school still owed about 75 percent of the
original balance. A potentially worrying trend starting in the early 2010s is that large-bal-
ance borrowers, for the first time, owe more than their initial repayment amount in the first
years of repayment—on average they are falling behind rather than making progress. In
addition to the recession, this trend coincides with the introduction of new repayment op-
tions, such as income driven repayment, and take-up of forbearances, policies that allow
borrowers to reduce or suspend their payments without defaulting.
Looking beyond the aggregate trends, the variation in repayment rates across individ-
ual institutions for graduate and parent borrowers is just as broad as the variation in un-
dergraduate outcomes, suggesting that even though average outcomes for borrowers may
be positive, many borrowers at higher-risk institutions are experiencing much worse out-
comes. Thus, a relatively small share of borrowers may have large impacts on aggregate
repayment and taxpayer burden.
These trends have outsized implications for the budgetary effects of the loan program
and the well-being of students. Despite the fact that large-balance borrowers have low de-
fault rates and represent only a small fraction of defaulted borrowers, they now account for
almost half of all dollars in default. Those defaults impose costs both on the students them-
selves as well as on taxpayers from uncollected loans and costs of collection.
To examine the factors contributing to the increase in loan non-repayment between
2001 and 2011, we perform a Blinder (1973) - Oaxaca (1973) decomposition. The results
indicate that approximately 90 percent of the change in repayment rates between 2001 and
2011 is associated with changes in observables: shifts in the types of institutions borrowers
attend, increases in default rates, and changes in borrower demographics are each associ-
ated with approximately 10-20 percent of the decrease in student loan repayment. About
40-50 percent of the decrease in repayment rates is associated with changes in repayment
options, such as alternative repayment plans and loan forbearance, with forbearance play-
ing the largest role.
The results of this paper have implications for policies designed to improve student
outcomes and reduce risks to students and taxpayers associated with unpayable loans. Be-
cause a small subset of borrowers accounts for the majority of dollars in default, changes
targeted to a small number of individuals and institutions could have large implications for
taxpayers and the students involved. Screening large-balance borrowers, restoring limits
ECONOMIC STUDIES AT BROOKINGS
6 /// Borrowers with Large Balances: Rising Student Debt and Falling Repayment Rates
on credit, eliminating certain types of loans, and applying institutional accountability rules
to graduate or parent loans would reduce adverse outcomes improve economic welfare.
(Lochner and Monge-Naranjo 2011; Lochner and Monge-Naranjo 2015; Cox 2016). This
paper also contributes to a growing literature that documents facts about the student loan
market, which is now the largest source of non-mortgage household debt in the United
States (Avery and Turner 2012; Brown et al. 2014; Looney and Yannelis 2015). The paper
is closely related to Lochner and Monge-Naranjo (2014), who study alternative repayment
measures for student loan default. However, our paper emphasizes the distribution of loan
balances and the impact of large-balance borrowers on repayment.
Section II discusses the administrative data used in the paper and provides a brief over-
view of student loan programs in the United States. Section III presents new facts about
the rise of large-balance borrowers and how increases student loan borrowing limits al-
lowed borrowers to accumulate those balances. Section IV discusses changes in the char-
acteristics of large-balance borrowers and the institutions they attended. Section V pre-
sents new facts about the labor market and repayment outcomes of large-balance borrow-
ers. Section VI presents a decomposition of repayment balances. Section VII concludes.
II. Data and Context
The main analysis data consists of a random sample of federal administrative data from
the National Student Loan Data System (NSLDS). The NSLDS is the main database used
to administer federal direct and federally guaranteed student loans, and contains billions
of loan observations on more than 70 million student borrowers from 1970 to present. The
vast majority of student loans are administered under federal programs, so the NSLDS
gives an accurate overview of the U.S. student loan market.1 The analysis sample is drawn
from a random 4 percent of administrative student loan data. To ensure randomization
and that the same borrowers are followed over time, the sample selected using the last four
digits of borrowers’ social security numbers. This sample is matched to de-identified earn-
ings records from tax data.2 It consists of approximately 46 million annual observations on
4 million borrowers.
Balance sizes are measured in the year a borrower enters repayment. “Repayment year”
is the year in which a borrower’s last loan enters repayment. We focus on loans made under
the Federal Direct Loan Program (DL). The DL program began in 1992, and since 2010, all
new federal student loans were made under DL. The unit of analysis in our sample is a
borrower separating from an institution and starting to repay a loan.
Student Loans in the United States
While small institutional and federal student loan programs have existed in the United
States prior to the 1960s, the modern federal student loan program began with the Higher
Education Act of 1965. By 2014 there were over 40 million student loan borrowers in the
. . . 1. See Baum and Johnson (2015), Brown et al. (2014) and Ionescu (2009) for an overview of the US student loan program.
2. Specifically, we matched loan information from the NSLDS to de-identified tax data. We obtained students’ demographic
information from the Free Application of Federal Student Aid (FAFSA). For further discussion of the NSLDS and our sam-
ple construction, see Looney and Yannelis (2015). Variables are defined analogously to Looney and Yannelis (2015) un-
less noted otherwise.
ECONOMIC STUDIES AT BROOKINGS
7 /// Borrowers with Large Balances: Rising Student Debt and Falling Repayment Rates
United States, with an outstanding loan balance of over $1.1 trillion. In 2014 the outstand-
ing volume of student loan debt was surpassed only by mortgage debt.3
The vast majority of student loans in the United States are federal loans. Borrowers
must fill out the Free Application of Federal Student Aid (FAFSA) in order to be eligible for
federal student loans. Congress sets interest rates, and in recent years those rates have been
fixed at rates between 3.4 and 8.5 percent, depending on the type of loan and year of orig-
ination. Because the terms on federal loans are favorable, only a small share of loans are
issued by private lenders.
Undergraduate and certain graduate federal loans fall into two general categories, sub-
sidized and unsubsidized loans.4 Borrowers are eligible for subsidized loans based on a
needs test, and the main difference between the programs is that interest does not accrue
while borrower are enrolled for subsidized loans. Loan limits are determined by students’s
academic level and dependency status. The Department of Education classifies borrowers
as “dependent” or “independent” from their parents for financial aid purposes. All borrow-
ers above the age of 24, as well as graduate borrowers, military veterans, married borrowers
and borrowers with children are automatically classified as independent. Graduate stu-
dents and parents may be eligible for “PLUS” loans for costs that are not met by other loan
types. These loans are limited by cost of attendance rather than a statutory limit. Parent
borrowers face a credit check to determine eligibility. Loan limits have been increased pe-
riodically; the last increase was in 2007.
When borrowers exit school, they typically enter repayment following a six-month
grace period.5 The standard payment plan is a ten year fixed plan but borrowers may elect
alternative repayment plans. Borrowers with high balances are eligible for extended repay-
ment, which offers borrowers 25 years to repay the loan. Borrowers also may choose from
a variety of income-driven repayment plans. Under these plans borrowers pay only 10 or
15 percent of their disposable income. Some of the plans offer loan forgiveness after a spec-
ified duration of 20 or 25 years.6 Take-up of these plans was low until the introduction of
the Income Based Repayment plan in 2009. Currently about one fifth of borrowers are in
some form of income-driven repayment plan, and their aggregate balances account for
roughly two fifths of balances. Borrowers are always able to prepay the loan in full.
Borrowers are also eligible for deferment and forbearance programs that suspend pay-
ments (but not necessarily interest accrual) while in school or when students face circum-
stances like unemployment, financial hardship, or during military service.
A borrower is in default if a payment is more than 270 days late. If a borrower defaults,
their wages above a threshold can be garnished and they may be placed into the Treasury
Offset Program, in which certain federal payments like tax refunds are allocated to paying
loans and fees. Student loans are effectively non-dischargeable in bankruptcy.
. . . 3. Bleemer et al. (2017), Looney and Yannelis (2016) and Lochner and Monge Naranjo (2011) provide detailed discussions
of trends and institutional details regarding federal student loan programs in the United States. Isen, Goodman and Yan-
nelis (2018) discuss the liquidity effects of student loans.
4. Graduate borrowers ceased to be eligible for subsidized loans after July1, 2012. Parents are not eligible for subsidized
loans.
5. Parent loans enter repayment immediately on issue, but may be deferred (with interest accruing) while their children are in
school. In practice, many parent borrowers choose deferral, often for long durations.
6. Borrowers eligible for Public Sector Loan Forgiveness are eligible after 10 years of payments.
ECONOMIC STUDIES AT BROOKINGS
8 /// Borrowers with Large Balances: Rising Student Debt and Falling Repayment Rates
III. The Increase in Borrowers with Large Balances
An increasing share of students owe high loan burdens with the fraction of borrowers owing
more than $50,000 more than doubling between 2000 and 2014 (Figure 1). Both the share
of large-balance borrowers and the share of dollars they owe increased. The left panel of
figure 1 shows the number of large-balance borrowers each year. In 2014, only about 5 mil-
lion of the 40 million outstanding student loan borrowers owed more than $50,000. The
right panel shows that these borrowers account for the majority of student loan dollars
outstanding. This is comparable to mortgage lending, where a subset of high-income bor-
rowers hold the majority of outstanding balances (Adelino, Schoar and Severino 2016). A
relatively small share of borrowers accounts for the majority of outstanding student loan
dollars, so the outcomes of this small group of individuals has outsized implications for the
loan system and for taxpayers.
FIGURE 1: NUMBER OF BORROWERS AND TOTAL DOLLARS HELD BY SIZE OF DEBT
Notes: The figure on the left shows the number of borrowers (in thousands) for borrowers with more than or less
than $50,000 each year. The figure on the right shows student loan dollars outstanding (in millions of 2014 dol-
lars). Source: 4 percent sample of the NSLDS.
Panel A: Borrowers Panel B: Balances
ECONOMIC STUDIES AT BROOKINGS
9 /// Borrowers with Large Balances: Rising Student Debt and Falling Repayment Rates
Figure 2 shows the share of borrowers with repayment balances above $25,000,
$50,000, $100,000 and $150,000 each year. The figure shows that the share of large-bal-
ance borrowers increased rapidly over the past decade and a half, with a particularly sharp
increase in the past seven years.
While loan burdens over $50,000 were once relatively rare—the portion of borrowers
with balances over $50,000 and even $100,000 has surged. In 1990, fewer than 5 percent
of borrowers had loan balances above $25,000 and almost no borrowers had loan volumes
above $100,000. By 2015, more than 40 percent of borrowers had balances above $25,000
and more than 5 percent of borrowers had loan balances above $100,000.
The concentration of debt among a relatively small set of borrowers intensifies at even
higher debt levels. For instance, there are roughly 170,000 students and parents who owe
more than $250,000 in federal student loans in 2014. While these borrowers represent
only 0.4 percent of all borrowers, they represent almost 5 percent of the total federal port-
folio, or almost $54 billion dollars.
FIGURE 2: SHARE OF BORROWERS WITH LARGE BALANCES
Notes: This figure shows the share of borrowers entering repayment each year with balances exceeding each
threshold (in 2014 dollars). Source: 4 percent sample of the NSLDS.
ECONOMIC STUDIES AT BROOKINGS
10 /// Borrowers with Large Balances: Rising Student Debt and Falling Repayment Rates
These borrowers represent a high concentration of federal investment and thus may
pose large economic and financial risks for the borrower and to taxpayers. For instance, at
current PLUS interest rates (6.3 percent) and under the standard 25-year repayment plan,
the interest costs over the course of a loan equal the principal balance (i.e. a $250,000 loan
results in almost $250,000 of interest over the course of a loan). Moreover, large-balance
borrowers are likely to represent large beneficiaries of programs like income drive repay-
ment or public-sector loan forgiveness, which involve discharges of debt after a period of
years and which have no cap on the amount discharged. As a result, more of these pro-
grams’ subsidies are directed towards large-balance borrowers than to lower-balance bor-
rowers, which has implications for the total amount of subsidy, how progressive subsidies
are, and which kinds of students, institutions, and programs benefit from these lending
programs.
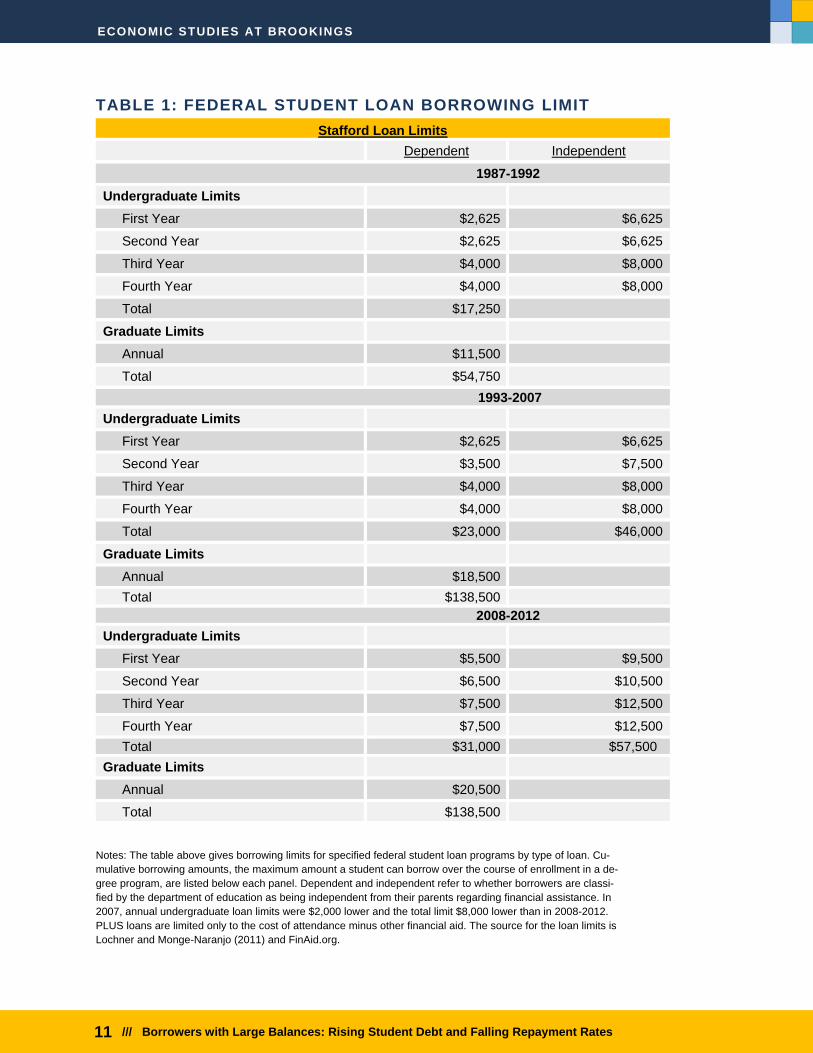
Increases in the number of large-balance borrowers is related to loan limit increases
for graduate and parent borrowers, and to a lesser extent, undergraduate borrowers. In
1993 and 2007, borrowing limits increased to the levels shown in Table 1. For example,
cumulative undergraduate borrowing limits increased from $37,250 in 1987 to $46,000 in
2007 (Lochner and Monge-Naranjo 2011).
ECONOMIC STUDIES AT BROOKINGS
11 /// Borrowers with Large Balances: Rising Student Debt and Falling Repayment Rates
TABLE 1: FEDERAL STUDENT LOAN BORROWING LIMIT
Notes: The table above gives borrowing limits for specified federal student loan programs by type of loan. Cu-
mulative borrowing amounts, the maximum amount a student can borrow over the course of enrollment in a de-
gree program, are listed below each panel. Dependent and independent refer to whether borrowers are classi-
fied by the department of education as being independent from their parents regarding financial assistance. In
2007, annual undergraduate loan limits were $2,000 lower and the total limit $8,000 lower than in 2008-2012.
PLUS loans are limited only to the cost of attendance minus other financial aid. The source for the loan limits is
Lochner and Monge-Naranjo (2011) and FinAid.org.
Stafford Loan Limits
Dependent Independent
1987-1992
Undergraduate Limits
First Year $2,625 $6,625
Second Year $2,625 $6,625
Third Year $4,000 $8,000
Fourth Year $4,000 $8,000
Total $17,250
Graduate Limits
Annual $11,500
Total $54,750
1993-2007
Undergraduate Limits
First Year $2,625 $6,625
Second Year $3,500 $7,500
Third Year $4,000 $8,000
Fourth Year $4,000 $8,000
Total $23,000 $46,000
Graduate Limits
Annual $18,500
Total $138,500
2008-2012
Undergraduate Limits
First Year $5,500 $9,500
Second Year $6,500 $10,500
Third Year $7,500 $12,500
Fourth Year $7,500 $12,500
Total $31,000 $57,500
Graduate Limits
Annual $20,500
Total $138,500
ECONOMIC STUDIES AT BROOKINGS
12 /// Borrowers with Large Balances: Rising Student Debt and Falling Repayment Rates
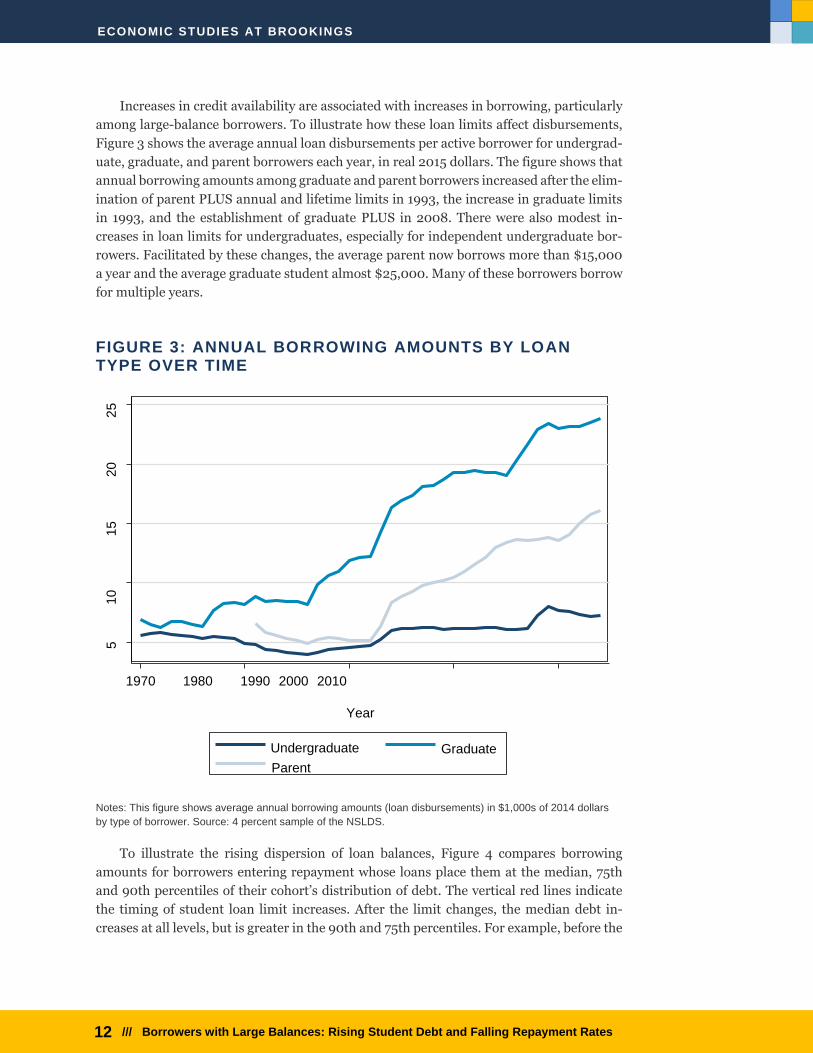
Increases in credit availability are associated with increases in borrowing, particularly
among large-balance borrowers. To illustrate how these loan limits affect disbursements,
Figure 3 shows the average annual loan disbursements per active borrower for undergrad-
uate, graduate, and parent borrowers each year, in real 2015 dollars. The figure shows that
annual borrowing amounts among graduate and parent borrowers increased after the elim-
ination of parent PLUS annual and lifetime limits in 1993, the increase in graduate limits
in 1993, and the establishment of graduate PLUS in 2008. There were also modest in-
creases in loan limits for undergraduates, especially for independent undergraduate bor-
rowers. Facilitated by these changes, the average parent now borrows more than $15,000
a year and the average graduate student almost $25,000. Many of these borrowers borrow
for multiple years.
FIGURE 3: ANNUAL BORROWING AMOUNTS BY LOAN TYPE OVER TIME
Notes: This figure shows average annual borrowing amounts (loan disbursements) in $1,000s of 2014 dollars
by type of borrower. Source: 4 percent sample of the NSLDS.
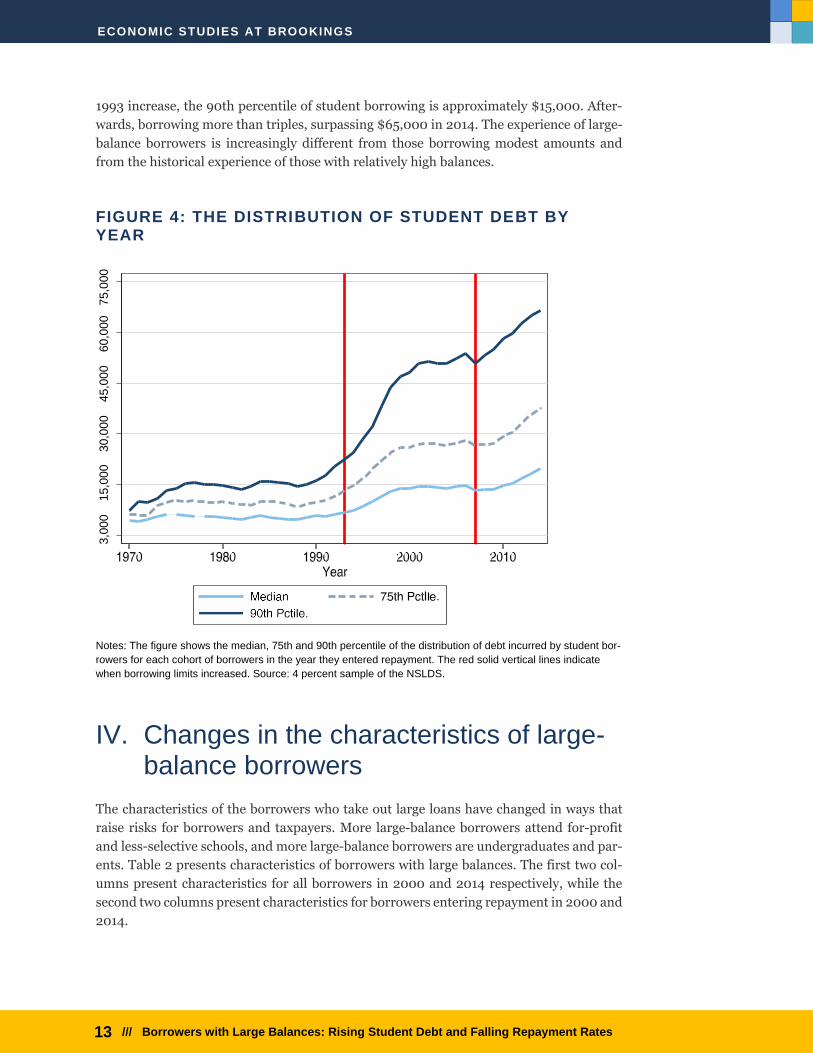
To illustrate the rising dispersion of loan balances, Figure 4 compares borrowing
amounts for borrowers entering repayment whose loans place them at the median, 75th
and 90th percentiles of their cohort’s distribution of debt. The vertical red lines indicate
the timing of student loan limit increases. After the limit changes, the median debt in-
creases at all levels, but is greater in the 90th and 75th percentiles. For example, before the
5
1
0
1
5
2
0
2
5
1970 1980 1990 2000 2010
Year
Undergraduate
Parent
Graduate
ECONOMIC STUDIES AT BROOKINGS
13 /// Borrowers with Large Balances: Rising Student Debt and Falling Repayment Rates
1993 increase, the 90th percentile of student borrowing is approximately $15,000. After-
wards, borrowing more than triples, surpassing $65,000 in 2014. The experience of large-
balance borrowers is increasingly different from those borrowing modest amounts and
from the historical experience of those with relatively high balances.
FIGURE 4: THE DISTRIBUTION OF STUDENT DEBT BY YEAR
Notes: The figure shows the median, 75th and 90th percentile of the distribution of debt incurred by student bor-
rowers for each cohort of borrowers in the year they entered repayment. The red solid vertical lines indicate
when borrowing limits increased. Source: 4 percent sample of the NSLDS.
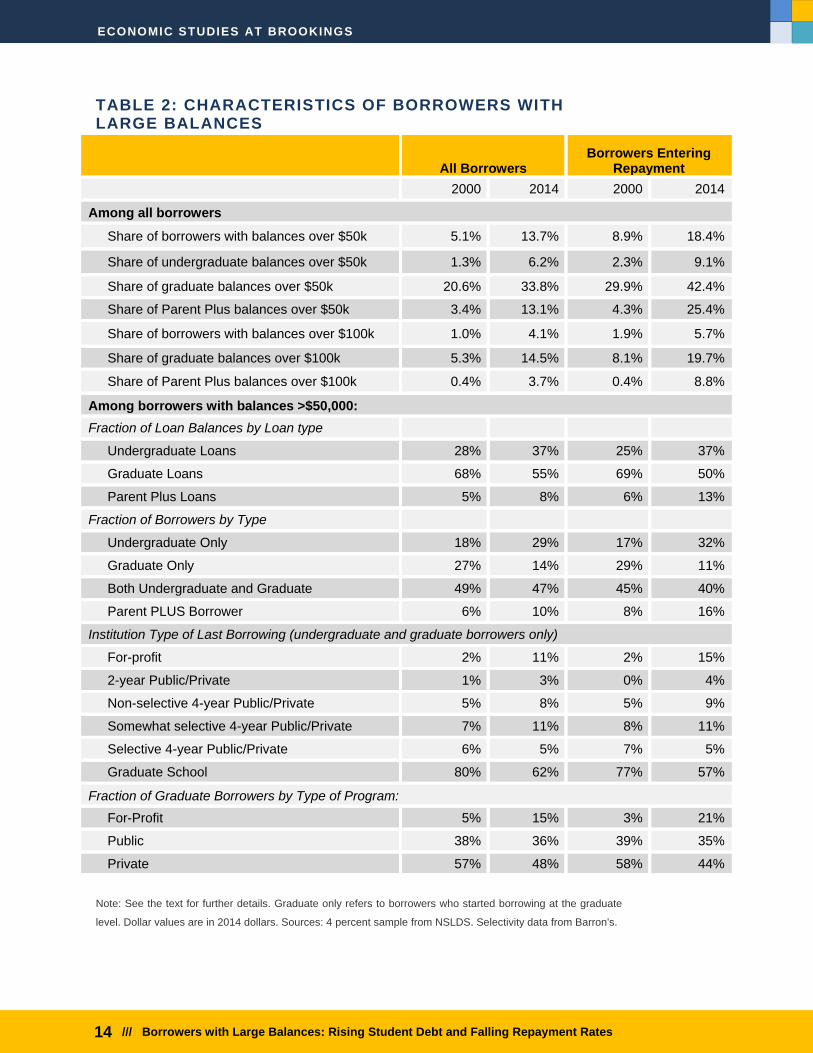
IV. Changes in the characteristics of large-balance borrowers
The characteristics of the borrowers who take out large loans have changed in ways that
raise risks for borrowers and taxpayers. More large-balance borrowers attend for-profit
and less-selective schools, and more large-balance borrowers are undergraduates and par-
ents. Table 2 presents characteristics of borrowers with large balances. The first two col-
umns present characteristics for all borrowers in 2000 and 2014 respectively, while the
second two columns present characteristics for borrowers entering repayment in 2000 and
2014.
3,0
00
15,0
00
30,0
00
45,0
00
6
0,0
00
75
,000
ECONOMIC STUDIES AT BROOKINGS
14 /// Borrowers with Large Balances: Rising Student Debt and Falling Repayment Rates
TABLE 2: CHARACTERISTICS OF BORROWERS WITH LARGE BALANCES
Note: See the text for further details. Graduate only refers to borrowers who started borrowing at the graduate
level. Dollar values are in 2014 dollars. Sources: 4 percent sample from NSLDS. Selectivity data from Barron's.
All Borrowers Borrowers Entering
Repayment
2000 2014 2000 2014
Among all borrowers
Share of borrowers with balances over $50k 5.1% 13.7% 8.9% 18.4%
Share of undergraduate balances over $50k 1.3% 6.2% 2.3% 9.1%
Share of graduate balances over $50k 20.6% 33.8% 29.9% 42.4%
Share of Parent Plus balances over $50k 3.4% 13.1% 4.3% 25.4%
Share of borrowers with balances over $100k 1.0% 4.1% 1.9% 5.7%
Share of graduate balances over $100k 5.3% 14.5% 8.1% 19.7%
Share of Parent Plus balances over $100k 0.4% 3.7% 0.4% 8.8%
Among borrowers with balances >$50,000:
Fraction of Loan Balances by Loan type
Undergraduate Loans 28% 37% 25% 37%
Graduate Loans 68% 55% 69% 50%
Parent Plus Loans 5% 8% 6% 13%
Fraction of Borrowers by Type
Undergraduate Only 18% 29% 17% 32%
Graduate Only 27% 14% 29% 11%
Both Undergraduate and Graduate 49% 47% 45% 40%
Parent PLUS Borrower 6% 10% 8% 16%
Institution Type of Last Borrowing (undergraduate and graduate borrowers only)
For-profit 2% 11% 2% 15%
2-year Public/Private 1% 3% 0% 4%
Non-selective 4-year Public/Private 5% 8% 5% 9%
Somewhat selective 4-year Public/Private 7% 11% 8% 11%
Selective 4-year Public/Private 6% 5% 7% 5%
Graduate School 80% 62% 77% 57%
Fraction of Graduate Borrowers by Type of Program:
For-Profit 5% 15% 3% 21%
Public 38% 36% 39% 35%
Private 57% 48% 58% 44%
ECONOMIC STUDIES AT BROOKINGS
15 /// Borrowers with Large Balances: Rising Student Debt and Falling Repayment Rates
Changes in the characteristics of borrowers suggests that students are borrowing to
attend institutions with lower labor market outcomes and worse loan performance
(Mueller and Yannelis 2018). In general, the table shows that the majority of large-balance
borrowers took-out loans to pay for graduate school, and individuals with graduate degrees
tend to have high incomes and low loan non-repayment rates. However, the share of bor-
rowers taking-out large loan balances to go to graduate school has declined between 2000
and 2014 while there has been an increase in undergraduate and parent borrowing. The
share of large-balance borrowers who last attended less-selective schools generally in-
creased. And the share of graduate large-balance borrowers who attended a for-profit in-
stitutions for graduate school increased from 5 to 15 percent between 2000 and 2014.
In general, it is difficult for a dependent undergraduate borrower to accumulate a large
balance given their lower annual and lifetime loan limits. Independent undergraduate bor-
rowers are an exception. They have larger loan limits, have more unsubsidized loans while
in school (resulting in faster interest accumulation), and may take more years to graduate,
meaning that they borrow for more years and accumulate more interest. Combined with
the fact that the number of independent borrowers has increased in recent years, a surpris-
ing number of undergraduates end-up with more than $50,000 of debt.
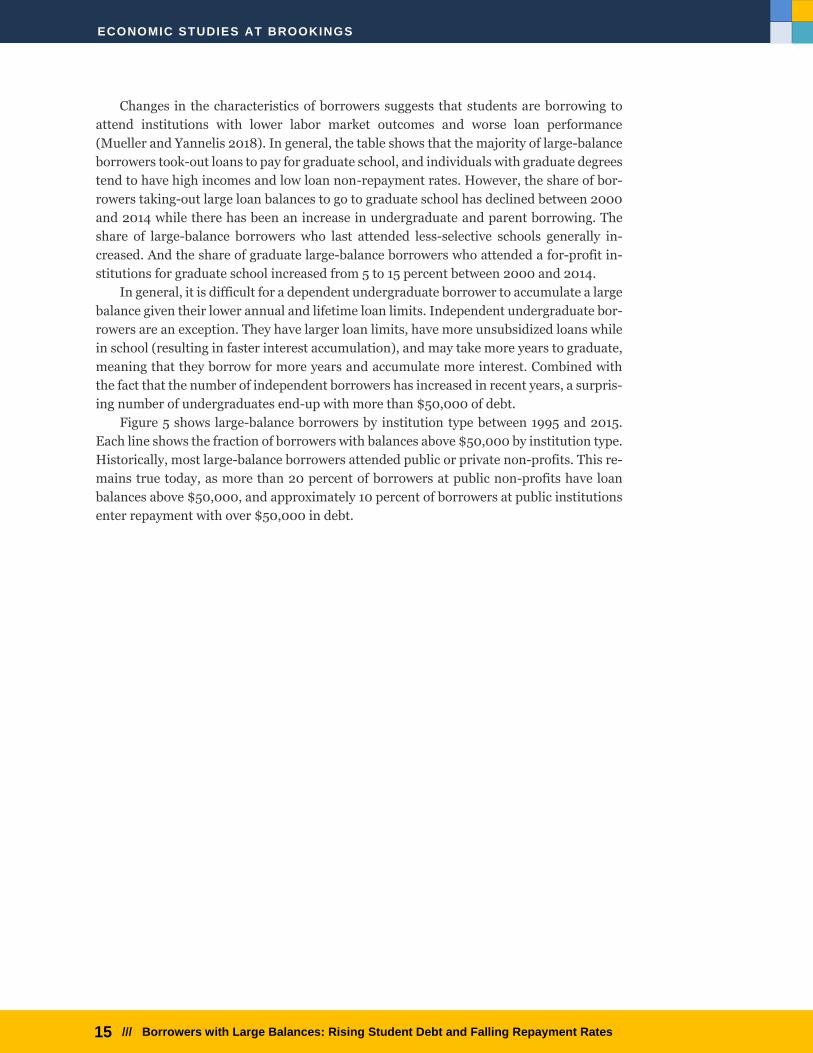
Figure 5 shows large-balance borrowers by institution type between 1995 and 2015.
Each line shows the fraction of borrowers with balances above $50,000 by institution type.
Historically, most large-balance borrowers attended public or private non-profits. This re-
mains true today, as more than 20 percent of borrowers at public non-profits have loan
balances above $50,000, and approximately 10 percent of borrowers at public institutions
enter repayment with over $50,000 in debt.
ECONOMIC STUDIES AT BROOKINGS
16 /// Borrowers with Large Balances: Rising Student Debt and Falling Repayment Rates
FIGURE 5: BORROWERS WITH LARGE BALANCES BY TYPE OF INSTITUTION ATTENDED
Notes: This figure shows the share of borrowers with balances above $50,000 (in 2014 dollars) by type of insti-
tution last attended. Source: 4 percent sample of the NSLDS.
Figure 5 shows the recent growing share of borrowers at for-profit institutions. In 1995,
for-profits were the institutions type with the smallest share of students with balances
above $50,000. By 2014, for-profits surpassed public two-year community colleges, and
more than 5 percent of for- profit borrowers accumulate over $50,000 in borrowing by the
year that they enter repayment. While the fraction of borrowers with debts over $50,000
declined at other institution types following the conclusion of the Great Recession, this
share continued to rise at for-profits.
The changes in the type of borrower and type of institution have implications for bor-
rower outcomes because, on average, the shift away from graduate borrowers at selective
schools and increases in borrowing at for-profit institutions means borrowers are more
likely to have worse economic and loan outcomes.
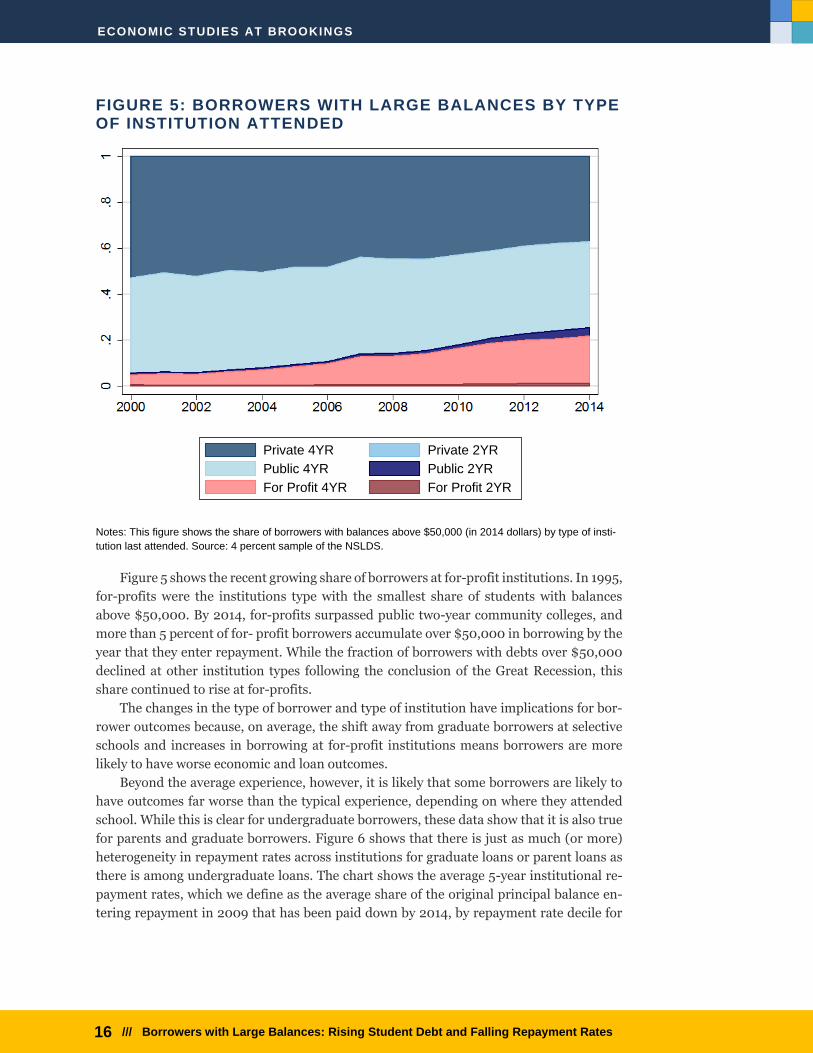
Beyond the average experience, however, it is likely that some borrowers are likely to
have outcomes far worse than the typical experience, depending on where they attended
school. While this is clear for undergraduate borrowers, these data show that it is also true
for parents and graduate borrowers. Figure 6 shows that there is just as much (or more)
heterogeneity in repayment rates across institutions for graduate loans or parent loans as
there is among undergraduate loans. The chart shows the average 5-year institutional re-
payment rates, which we define as the average share of the original principal balance en-
tering repayment in 2009 that has been paid down by 2014, by repayment rate decile for
0.2
.4.6
.81
2000 2002 2004 2006 2008 2010 2012 2014repay_year
Private 4YR Private 2YR
Public 4YR Public 2YR
For Profit 4YR For Profit 2YR
ECONOMIC STUDIES AT BROOKINGS
17 /// Borrowers with Large Balances: Rising Student Debt and Falling Repayment Rates
each type of loan. For example, the chart shows that at the bottom 10 percent of institu-
tions, parent PLUS borrowers owed 30 percent more in 2014 than in 2009, while the aver-
age parent repayment rate was zero in the second lowest decile.
FIGURE 6: DIFFERENCES IN REPAYMENT RATES ACROSS INSTITUTIONS AND BORROWER TYPES
Notes: This figure shows the average fraction of the initial repayment balance repaid 5 years after beginning
repayment for institutions ranked by repayment decile for undergraduate, graduate, or parent PLUS loans. Insti-
tutions are divided into deciles defined by the average institutional repayment rate for each borrower type. Within
each decile, each bar represents the average 5-year repayment rate for borrowers at those institutions. Source:
4 percent sample of the NSLDS.
Compared to undergraduate borrowers, repayment rates for parents are lower, largely
because parents often defer payments while the student is in school. Similarly, repayment
rates for graduate students are lower because they typically choose longer amortization
schedules. However, the chart also shows that the variation across institutions in graduate
and parent repayment rates is just as large as the variation in repayment rates across un-
dergraduate institutions. In other words, increases in borrowing among graduate students
and parents, especially at low-performing institutions, is likely to impose risks on those
borrowers and taxpayers.
ECONOMIC STUDIES AT BROOKINGS
18 /// Borrowers with Large Balances: Rising Student Debt and Falling Repayment Rates
V. Outcomes for Borrowers with Large Balances
Earnings and Income
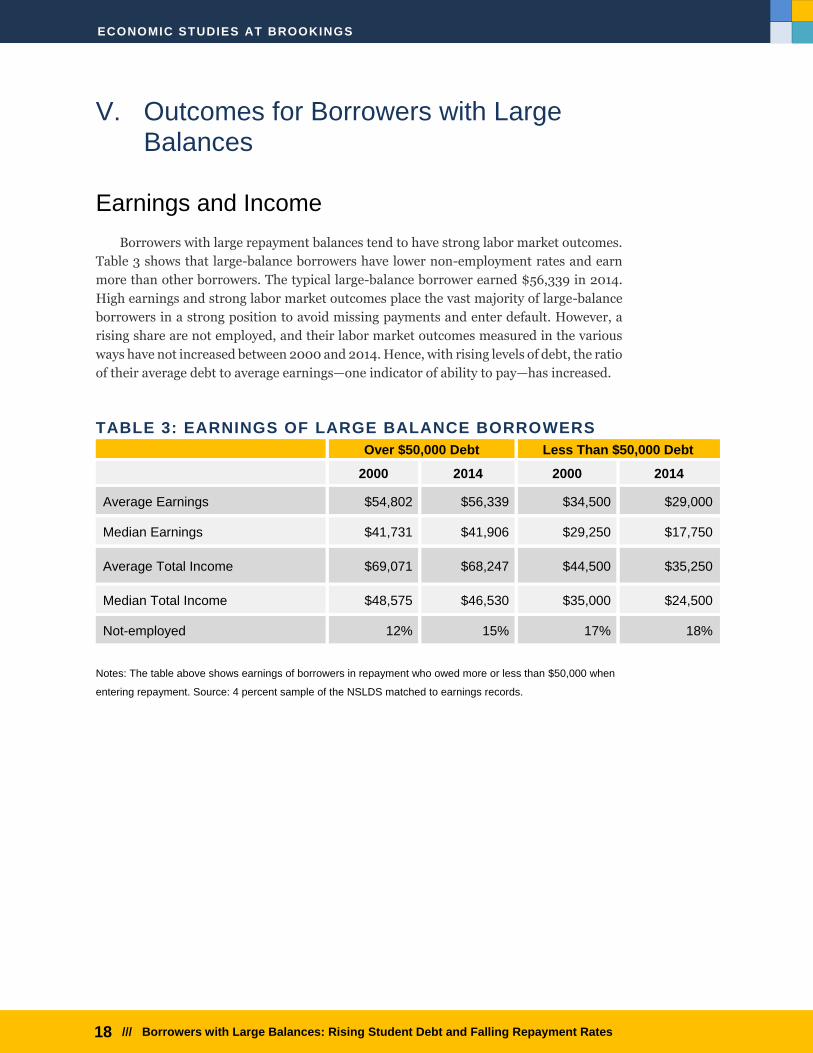
Borrowers with large repayment balances tend to have strong labor market outcomes.
Table 3 shows that large-balance borrowers have lower non-employment rates and earn
more than other borrowers. The typical large-balance borrower earned $56,339 in 2014.
High earnings and strong labor market outcomes place the vast majority of large-balance
borrowers in a strong position to avoid missing payments and enter default. However, a
rising share are not employed, and their labor market outcomes measured in the various
ways have not increased between 2000 and 2014. Hence, with rising levels of debt, the ratio
of their average debt to average earnings—one indicator of ability to pay—has increased.
TABLE 3: EARNINGS OF LARGE BALANCE BORROWERS
Over $50,000 Debt Less Than $50,000 Debt
2000 2014 2000 2014
Average Earnings $54,802 $56,339 $34,500 $29,000
Median Earnings $41,731 $41,906 $29,250 $17,750
Average Total Income $69,071 $68,247 $44,500 $35,250
Median Total Income $48,575 $46,530 $35,000 $24,500
Not-employed 12% 15% 17% 18%
Notes: The table above shows earnings of borrowers in repayment who owed more or less than $50,000 when
entering repayment. Source: 4 percent sample of the NSLDS matched to earnings records.
ECONOMIC STUDIES AT BROOKINGS
19 /// Borrowers with Large Balances: Rising Student Debt and Falling Repayment Rates
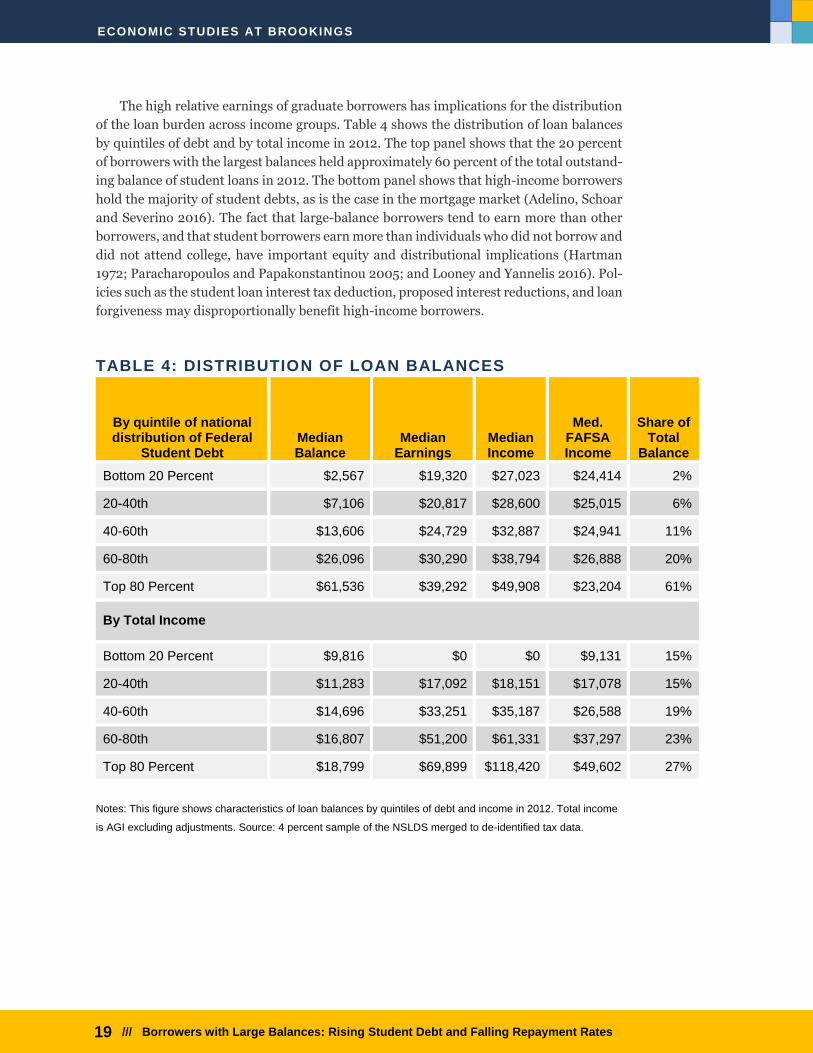
The high relative earnings of graduate borrowers has implications for the distribution
of the loan burden across income groups. Table 4 shows the distribution of loan balances
by quintiles of debt and by total income in 2012. The top panel shows that the 20 percent
of borrowers with the largest balances held approximately 60 percent of the total outstand-
ing balance of student loans in 2012. The bottom panel shows that high-income borrowers
hold the majority of student debts, as is the case in the mortgage market (Adelino, Schoar
and Severino 2016). The fact that large-balance borrowers tend to earn more than other
borrowers, and that student borrowers earn more than individuals who did not borrow and
did not attend college, have important equity and distributional implications (Hartman
1972; Paracharopoulos and Papakonstantinou 2005; and Looney and Yannelis 2016). Pol-
icies such as the student loan interest tax deduction, proposed interest reductions, and loan
forgiveness may disproportionally benefit high-income borrowers.
TABLE 4: DISTRIBUTION OF LOAN BALANCES
By quintile of national distribution of Federal
Student Debt Median Balance
Median Earnings
Median Income
Med. FAFSA Income
Share of Total
Balance
Bottom 20 Percent $2,567 $19,320 $27,023 $24,414 2%
20-40th $7,106 $20,817 $28,600 $25,015 6%
40-60th $13,606 $24,729 $32,887 $24,941 11%
60-80th $26,096 $30,290 $38,794 $26,888 20%
Top 80 Percent $61,536 $39,292 $49,908 $23,204 61%
By Total Income
Bottom 20 Percent $9,816 $0 $0 $9,131 15%
20-40th $11,283 $17,092 $18,151 $17,078 15%
40-60th $14,696 $33,251 $35,187 $26,588 19%
60-80th $16,807 $51,200 $61,331 $37,297 23%
Top 80 Percent $18,799 $69,899 $118,420 $49,602 27%
Notes: This figure shows characteristics of loan balances by quintiles of debt and income in 2012. Total income
is AGI excluding adjustments. Source: 4 percent sample of the NSLDS merged to de-identified tax data.
ECONOMIC STUDIES AT BROOKINGS
20 /// Borrowers with Large Balances: Rising Student Debt and Falling Repayment Rates
Default and Repayment
Borrowers with large repayment balances are less likely than other borrowers to default on
their loans. In 2009, only about 4 percent of large-balance borrowers defaulted, whereas
about approximately 17 percent of borrowers without large balances defaulted within three
years of entering repayment. While cohort default rates have fluctuated over time for all
borrowers, default rates have remained stable and quite low for large-balance borrowers.
This is no surprise as large-balance borrowers have relatively strong labor market out-
comes, higher educational attainment, are more likely to attend selective schools, and are
likely to be better able to insure themselves against adverse shocks (e.g. unemployment
spells or health problems).
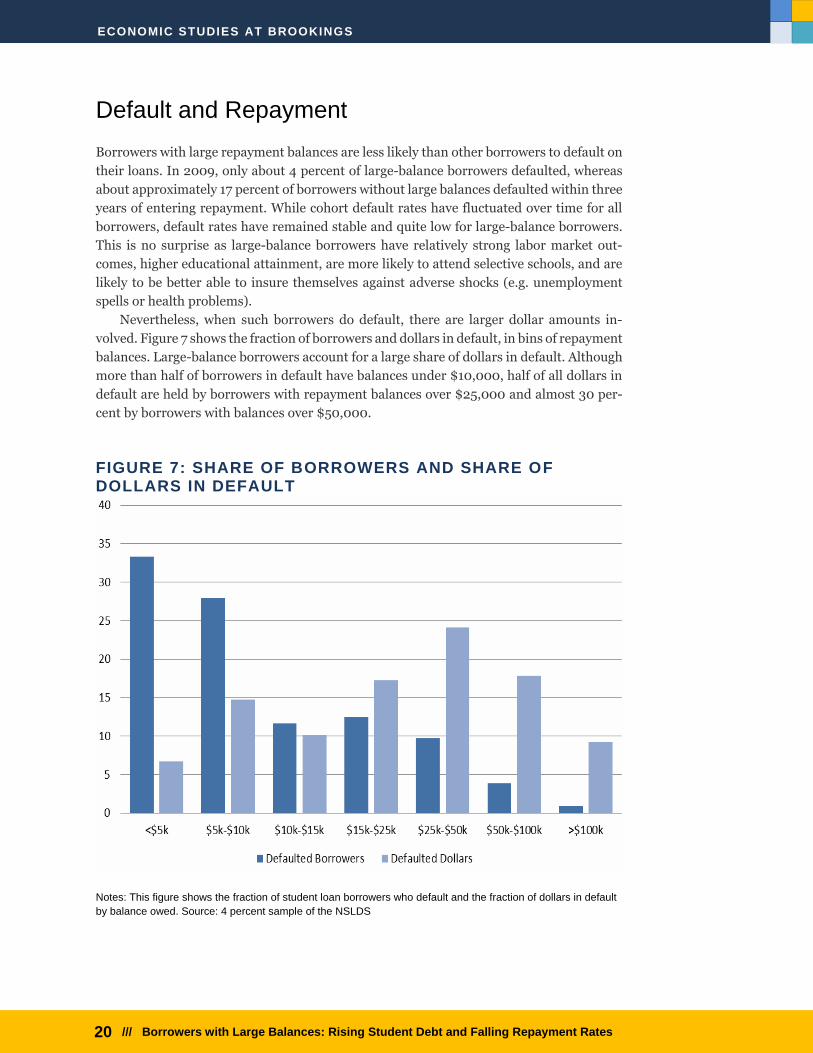
Nevertheless, when such borrowers do default, there are larger dollar amounts in-
volved. Figure 7 shows the fraction of borrowers and dollars in default, in bins of repayment
balances. Large-balance borrowers account for a large share of dollars in default. Although
more than half of borrowers in default have balances under $10,000, half of all dollars in
default are held by borrowers with repayment balances over $25,000 and almost 30 per-
cent by borrowers with balances over $50,000.
FIGURE 7: SHARE OF BORROWERS AND SHARE OF DOLLARS IN DEFAULT
Notes: This figure shows the fraction of student loan borrowers who default and the fraction of dollars in default
by balance owed. Source: 4 percent sample of the NSLDS
ECONOMIC STUDIES AT BROOKINGS
21 /// Borrowers with Large Balances: Rising Student Debt and Falling Repayment Rates
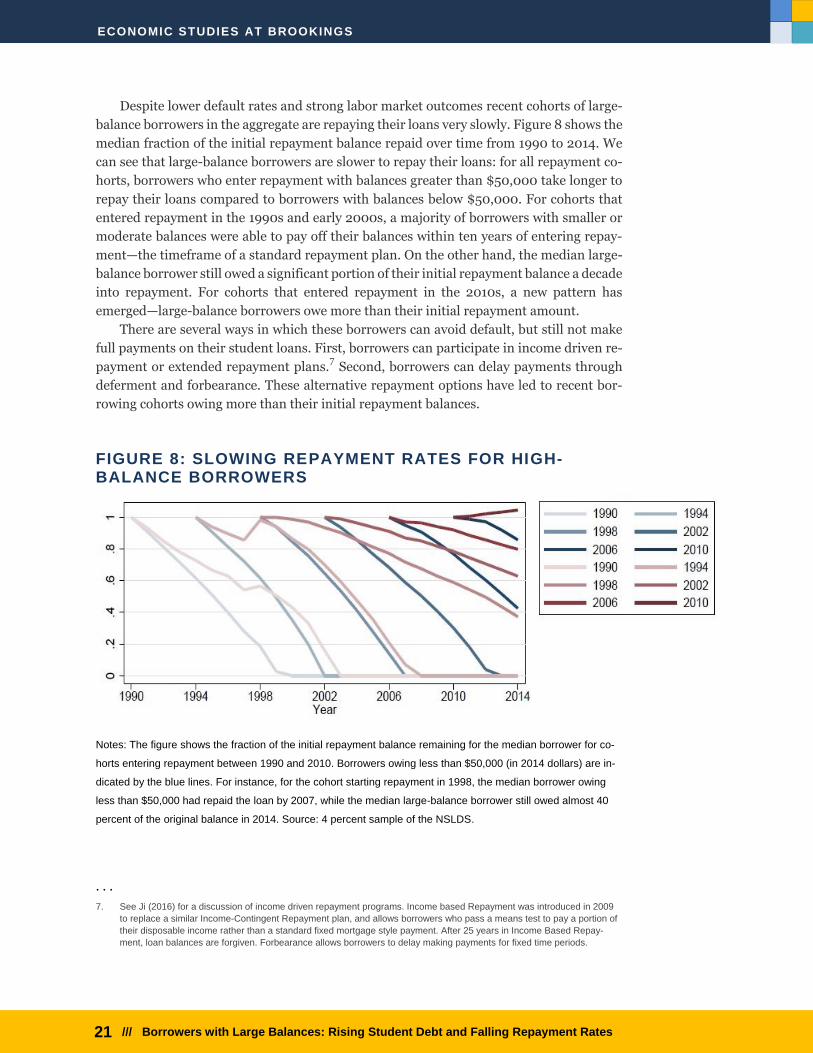
Despite lower default rates and strong labor market outcomes recent cohorts of large-
balance borrowers in the aggregate are repaying their loans very slowly. Figure 8 shows the
median fraction of the initial repayment balance repaid over time from 1990 to 2014. We
can see that large-balance borrowers are slower to repay their loans: for all repayment co-
horts, borrowers who enter repayment with balances greater than $50,000 take longer to
repay their loans compared to borrowers with balances below $50,000. For cohorts that
entered repayment in the 1990s and early 2000s, a majority of borrowers with smaller or
moderate balances were able to pay off their balances within ten years of entering repay-
ment—the timeframe of a standard repayment plan. On the other hand, the median large-
balance borrower still owed a significant portion of their initial repayment balance a decade
into repayment. For cohorts that entered repayment in the 2010s, a new pattern has
emerged—large-balance borrowers owe more than their initial repayment amount.
There are several ways in which these borrowers can avoid default, but still not make
full payments on their student loans. First, borrowers can participate in income driven re-
payment or extended repayment plans.7 Second, borrowers can delay payments through
deferment and forbearance. These alternative repayment options have led to recent bor-
rowing cohorts owing more than their initial repayment balances.
FIGURE 8: SLOWING REPAYMENT RATES FOR HIGH-BALANCE BORROWERS
Notes: The figure shows the fraction of the initial repayment balance remaining for the median borrower for co-
horts entering repayment between 1990 and 2010. Borrowers owing less than $50,000 (in 2014 dollars) are in-
dicated by the blue lines. For instance, for the cohort starting repayment in 1998, the median borrower owing
less than $50,000 had repaid the loan by 2007, while the median large-balance borrower still owed almost 40
percent of the original balance in 2014. Source: 4 percent sample of the NSLDS.
. . .
7. See Ji (2016) for a discussion of income driven repayment programs. Income based Repayment was introduced in 2009
to replace a similar Income-Contingent Repayment plan, and allows borrowers who pass a means test to pay a portion of
their disposable income rather than a standard fixed mortgage style payment. After 25 years in Income Based Repay-
ment, loan balances are forgiven. Forbearance allows borrowers to delay making payments for fixed time periods.
ECONOMIC STUDIES AT BROOKINGS
22 /// Borrowers with Large Balances: Rising Student Debt and Falling Repayment Rates
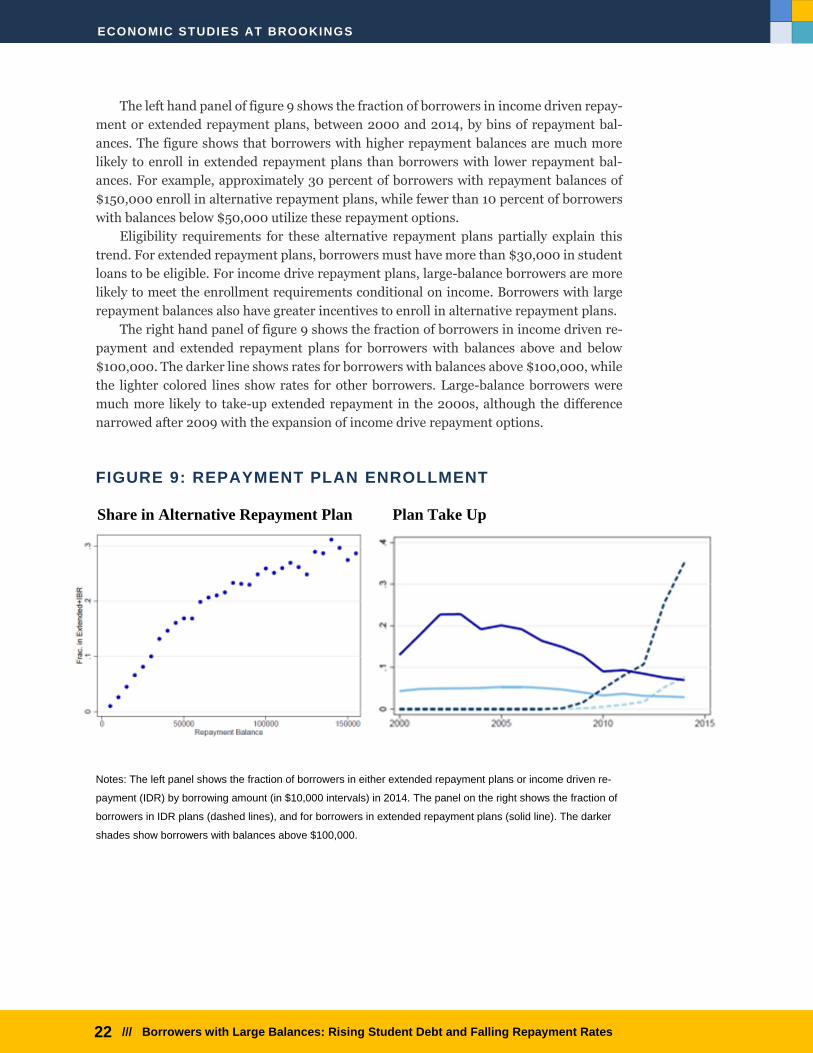
The left hand panel of figure 9 shows the fraction of borrowers in income driven repay-
ment or extended repayment plans, between 2000 and 2014, by bins of repayment bal-
ances. The figure shows that borrowers with higher repayment balances are much more
likely to enroll in extended repayment plans than borrowers with lower repayment bal-
ances. For example, approximately 30 percent of borrowers with repayment balances of
$150,000 enroll in alternative repayment plans, while fewer than 10 percent of borrowers
with balances below $50,000 utilize these repayment options.
Eligibility requirements for these alternative repayment plans partially explain this
trend. For extended repayment plans, borrowers must have more than $30,000 in student
loans to be eligible. For income drive repayment plans, large-balance borrowers are more
likely to meet the enrollment requirements conditional on income. Borrowers with large
repayment balances also have greater incentives to enroll in alternative repayment plans.
The right hand panel of figure 9 shows the fraction of borrowers in income driven re-
payment and extended repayment plans for borrowers with balances above and below
$100,000. The darker line shows rates for borrowers with balances above $100,000, while
the lighter colored lines show rates for other borrowers. Large-balance borrowers were
much more likely to take-up extended repayment in the 2000s, although the difference
narrowed after 2009 with the expansion of income drive repayment options.
FIGURE 9: REPAYMENT PLAN ENROLLMENT
Notes: The left panel shows the fraction of borrowers in either extended repayment plans or income driven re-
payment (IDR) by borrowing amount (in $10,000 intervals) in 2014. The panel on the right shows the fraction of
borrowers in IDR plans (dashed lines), and for borrowers in extended repayment plans (solid line). The darker
shades show borrowers with balances above $100,000.
Share in Alternative Repayment Plan Plan Take Up
ECONOMIC STUDIES AT BROOKINGS
23 /// Borrowers with Large Balances: Rising Student Debt and Falling Repayment Rates
VI. Why aren’t large-balance borrowers repaying their loans?
Why are more recent borrowers repaying their loans at a slower rate than earlier cohorts?
In this section we use a Blinder (1973) and Oaxaca (1973) decomposition to analyze why
repayment rates have slowed for borrowers. The decomposition aims to illustrate how re-
payment rates would have changed between 2001 and 2011 under the counterfactual that
the observables and repayment options remained constant during that period. The decom-
position method uses a basic linear regression model that defines repayment as a function
of repayment plan choice, default rates, and other borrowers’ characteristics. These char-
acteristics are used to predict how repayment rates would have changed by holding model
parameters constant, and applying the estimated model to borrowers from earlier cohorts.
The change in explanatory variables over time, multiplied by the estimated coefficient,
gives the share of the gap in repayment rates over time that is explained by the model.
The underlying assumption of the decomposition approach is that the relationship be-
tween observables and repayment rates remained constant between 2001 and 2011. Under
this assumption, we use the model to predict how repayment rates would have changed
due to differences in observable characteristics, holding other factors constant. Whether
we can draw a causal relationship from the decomposition depends on whether we can
make a causal interpretation from the regression model used to predict repayment. For
example, the strong estimated relationship between income-driven repayment and repay-
ment rates over time may have a causal interpretation if alternative repayment schedules
directly allow borrowers to repay their loans at a slower rate. On the other hand, income-
driven repayment may only be correlated with repayment rates through other unobserva-
ble channels such as access to family resources or financial sophistication.
The goal of this analysis is to explain why repayment rates have slowed and to deter-
mine the relative magnitudes of various factors. For example, what is the relative contribu-
tion of the increase in income-driven repayment plans to the slowdown in repayment, rel-
ative to changes in the composition of borrowers?
ECONOMIC STUDIES AT BROOKINGS
24 /// Borrowers with Large Balances: Rising Student Debt and Falling Repayment Rates
TABLE 5: DETERMINANTS OF NON-PAYMENT
Notes: The dependent variable in each specification is the fraction of the initial repayment balance outstanding
(unpaid) three years after entering repayment. The sample includes the 2001 and 2011 repayment cohorts. Col-
umn (5) restricts the sample to borrowers who owe less than $50,000 when they enter repayment. Column (6)
restricts the sample to borrowers who owe more than $50,000 in the year that they enter repayment. Column
(7) restricts the sample to the 2001 repayment cohort, and column (8) restricts the sample to the 2011 repay-
ment cohort. Source: 4 percent sample of the NSLDS matched to de-identified tax records. *p<.1, **p<.05,
***p<.01
(1) (2) (3) (4) (5) (6) (7) (8) (9)
Sample Full Full Full Full Full <50k >50k 2001 2011
For-Profit 2-Year 0.016
(0.073) 0.008
(0.044)
0.086***
(.005)
0.02
(0.079)
0.212***
(0.007)
For-Profit 4-Year 0.086***
(0.002) 0.098***
(0.003)
0.048***
(0.012)
0.021***
(0.005)
0.079***
(0.003)
Public 2-Year 0.093***
(0.002) 0.065***
(0.003)
0.035***
(0.003)
0.033***
(0.006)
0.057***
(0.002)
Public 4-Year 0.022***
(0.003) 0.042***
(0.003)
0.026**
(0.010)
-0.043***
(0.006)
0.026***
(0.003)
Public 2-Year -0.004*
(0.002) 0.002
(0.002)
0.017***
(0.003)
0.003
(0.003)
0.006**
(0.002)
Default 0.147***
(0.002) 0.216***
(0.003)
0.112***
(0.005)
0.215***
(0.004)
0.194***
(0.003)
Repay. Balance 0.013***
(0.000) 0.062***
(0.001)
0.004***
(0.000)
0.024***
(0.001)
0.014***
(0.000)
Earnings -0.010***
(0.001) -0.010***
(0.001)
-0.005***
(0.000)
0.007***
(0.000)
0.008***
(0.001)
Family Income -0.006***
(0.000) -0.004***
(0.000)
0.000
(0.001)
-0.002***
(0.000)
-
0.003***
(0.000)
Depend 0.058***
(0.002) -0.011***
(0.002)
-0.030***
(0.008)
0.019***
(0.003)
0.010***
(0.002)
Pell 0.000***
(0.000) 0.000***
(0.000)
0.000***
(0.000)
0.000***
(0.000)
0.000***
(0.000)
IBR 0.057***
(0.004)
0.036***
(0.005)
0.011
(0.006)
0.000
(.)
0.034***
(0.004)
Extended Repay. 0.048***
(0.006)
0.047***
(0.008)
-0.011
(0.008)
0.126***
(0.018)
0.052***
(0.007)
Forbearance 0.188***
(0.001)
0.201***
(0.002)
0.127***
(0.003)
0.179***
(0.003)
0.203***
(0.002)
Observations 168429 168429 168429 162338 168429 142074 20264 44596 117742
ECONOMIC STUDIES AT BROOKINGS
25 /// Borrowers with Large Balances: Rising Student Debt and Falling Repayment Rates
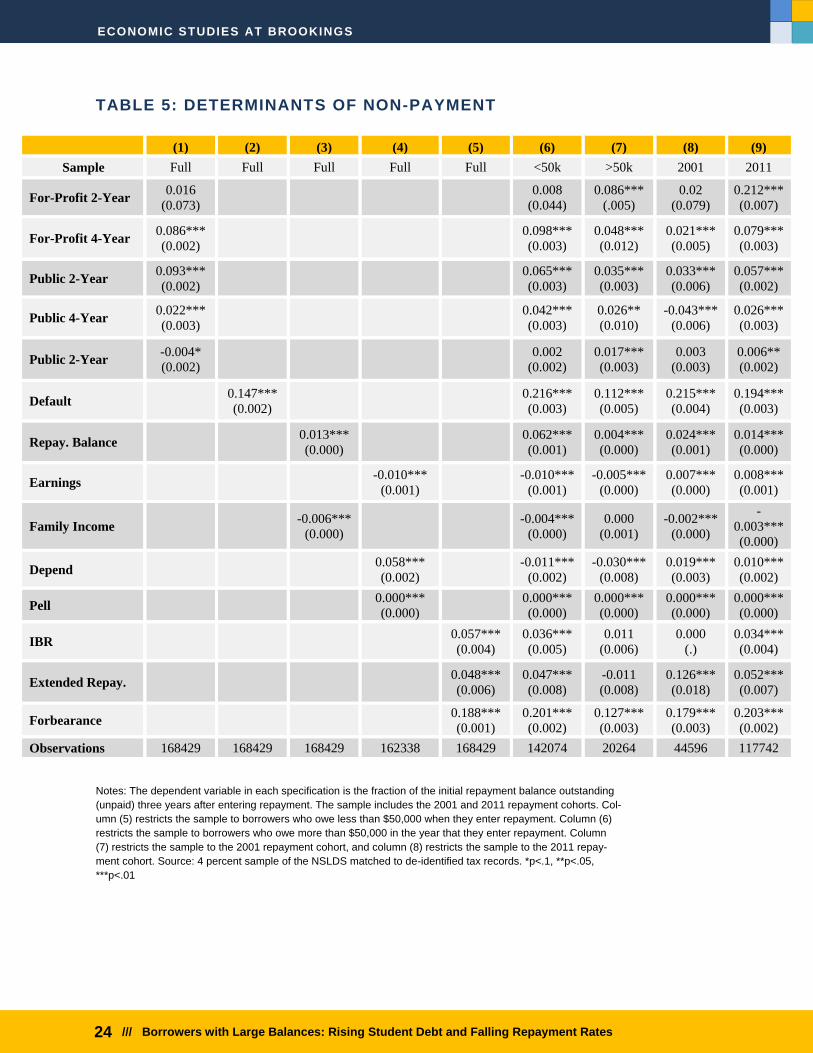
Table 5 presents regression results from the loan repayment model. These are used to
generate coefficient to simulate counterfactual repayment rates in the decomposition anal-
ysis. The outcome is the fraction of borrowers’ initial repayment balance that has been re-
paid, three years into repayment. Between 2001 and 2011, the fraction of the initial repay-
ment balance that remains after three years increased by 10.6 percentage points, from 79.7
percent to 90.5 percent. The results indicate that school type, default, labor market out-
comes and repayment plan choices are all associated with loan repayment. Borrowers at
for-profit institutions and public two-year community colleges (non-traditional borrowers)
repay a lower fraction of their initial repayment balance three years after entering repay-
ment. Non-traditional borrowers repay on average between three and eight percentage
points less than borrowers at four-year private institutions. This is consistent with findings
from Looney and Yannelis (2015) that non-traditional borrowers have problems repaying
their student loans. Borrowers at four-year public schools tend to repay their balances at a
slightly faster rate than borrowers at four year private institutions. Borrowers with higher
family income and earnings also repay their loans at a faster rate, which is consistent with
previous research (Knapp and Seaks 1992; Field 2014 ; Lochner and Belley 2007).
Unsurprisingly, default is strongly associated with borrowers not repaying loans, and
borrowers who default within three years of entering repayment have typically repaid 15
percentage points less than other borrowers. Alternative repayment plans such as IBR and
extended repayment are also strongly predictive of lower loan repayment. Forbearance and
larger repayment balances are also associated with lower loan repayment. It is worth noting
that the coefficient on repayment balances probably underestimates the true relationship
between repayment balances and repayment over time. The observed effects are statisti-
cally significant at the .05 level or higher. The fact that the initial repayment balance ap-
pears both in the denominator of the dependent variable and as a regressor can induce
division bias. This attenuates the observed effects of repayment balances on repayment
rates over time, leading to a downward bias (Borjas 1980).
Columns (8) and (9) of table 5 split the sample between the 2001 and 2011 periods.
The results largely support the identifying assumption that the relationship between ob-
servables and repayment rates remained constant between 2001 and 2011. The coefficients
on most regressors are similar in sign and magnitude, although in some 2001 estimates are
statistically insignificant due to the smaller sample size. Columns (6) and (7) split the sam-
ple between borrowers who enter repayment with more than and less than $50,000 in
debt. Again the relationship between the share of the initial balance repaid and changes in
explanatory variables remains similar across both samples.
ECONOMIC STUDIES AT BROOKINGS
26 /// Borrowers with Large Balances: Rising Student Debt and Falling Repayment Rates
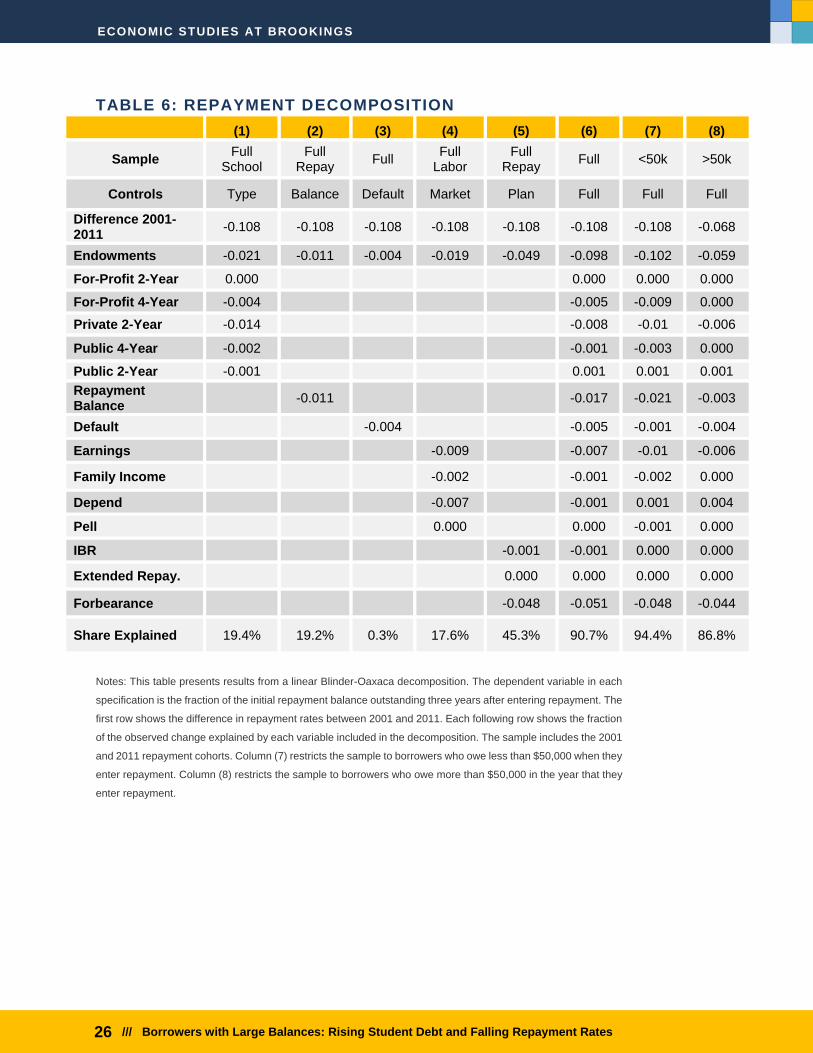
TABLE 6: REPAYMENT DECOMPOSITION
(1) (2) (3) (4) (5) (6) (7) (8)
Sample Full
School Full
Repay Full
Full Labor
Full Repay
Full <50k >50k
Controls Type Balance Default Market Plan Full Full Full
Difference 2001-2011
-0.108 -0.108 -0.108 -0.108 -0.108 -0.108 -0.108 -0.068
Endowments -0.021 -0.011 -0.004 -0.019 -0.049 -0.098 -0.102 -0.059
For-Profit 2-Year 0.000 0.000 0.000 0.000
For-Profit 4-Year -0.004 -0.005 -0.009 0.000
Private 2-Year -0.014 -0.008 -0.01 -0.006
Public 4-Year -0.002 -0.001 -0.003 0.000
Public 2-Year -0.001 0.001 0.001 0.001
Repayment Balance
-0.011 -0.017 -0.021 -0.003
Default -0.004 -0.005 -0.001 -0.004
Earnings -0.009 -0.007 -0.01 -0.006
Family Income -0.002 -0.001 -0.002 0.000
Depend -0.007 -0.001 0.001 0.004
Pell 0.000 0.000 -0.001 0.000
IBR -0.001 -0.001 0.000 0.000
Extended Repay. 0.000 0.000 0.000 0.000
Forbearance -0.048 -0.051 -0.048 -0.044
Share Explained 19.4% 19.2% 0.3% 17.6% 45.3% 90.7% 94.4% 86.8%
Notes: This table presents results from a linear Blinder-Oaxaca decomposition. The dependent variable in each
specification is the fraction of the initial repayment balance outstanding three years after entering repayment. The
first row shows the difference in repayment rates between 2001 and 2011. Each following row shows the fraction
of the observed change explained by each variable included in the decomposition. The sample includes the 2001
and 2011 repayment cohorts. Column (7) restricts the sample to borrowers who owe less than $50,000 when they
enter repayment. Column (8) restricts the sample to borrowers who owe more than $50,000 in the year that they
enter repayment.
ECONOMIC STUDIES AT BROOKINGS
27 /// Borrowers with Large Balances: Rising Student Debt and Falling Repayment Rates
Table 6 presents the results of the decomposition exercise. The results indicate that
changes in observables account for approximately 90 percent of the change in repayment
rates between 2001 and 2011. Between 2001 and 2011, repayment rates declined by 10.8
percentage points. The first column indicates that approximately 20 percent of the de-
crease is associated with changes in the types of institutions that borrowers attended. This
is largely driven by increased enrollment in for-profits and public two-year community col-
leges, where borrowers are more likely to default and less likely to repay their loans.
Column (2) indicates that changes in initial repayment balances account for roughly
10 percent of the increase in non-repayment between 2001 and 2011. Again, this may un-
derestimate the true effect due to division bias (Borjas 1980) stemming from measurement
error in variables on both sides of the estimating equation. Column (3) indicates that the
increase in default rates between 2001 and 2011 accounts for approximately 10 percent of
the increase in non-repayment. Although this is not insignificant, much of the policy debate
and school sanctions surrounding student loan distress has focused on default rates when
changes in default rates account for a relatively small share of changes in actual repayment
rates. Default rates may thus not be the right outcome of focus, given that other factors
explain larger fraction of the decrease in repayment. Column (4) indicates that changes in
family and borrower labor market outcomes and characteristics are associated with ap-
proximately 15 percent of the decrease in repayment rates. Column (5) indicates that be-
tween 40-50 percent of the decrease in repayment rates is associated with participation
changes in repayment plans and forbearance, with forbearance playing a larger role than
income-driven repayment and extended repayment plans. This suggests that while many
borrowers are avoiding default, they are still finding ways to avoid repaying their student
loans.
While we do not observe the reason why borrowers are entering forbearance, there are
a number of reasons why forbearance may have increased during this period. First, stu-
dents can be granted forbearance due to economic hardship, and labor market outcomes
deteriorated for students during this time (Looney and Yannelis 2015). Second, students
who reenroll in school can delay payments there was a surge in enrollment and borrowing
during the period in question, particularly in the for-profit sector. Finally, incentives
changed during this period due to the introduction of Public Sector Loan Forgiveness and
Teacher Loan Forgiveness, as borrowers who expect forgiveness have incentives to delay
payments.
Column (6) includes all explanatory variables, and the results remain largely similar
except for the increase in default rates, which is associated with almost a fifth of the de-
crease in repayment rates. Columns (7) and (8) repeat the analysis, splitting the sample by
borrowers with more than and less than $50,000 in debt at the time of repayment. The
results are broadly similar, although default explains almost none of the decrease in repay-
ment for high-balance borrowers, and changes in repayment plans explain a larger share.
This is consistent with earlier evidence that large-balance borrowers are able to avoid de-
fault, but are more likely to take-up repayment options that allow them to avoid making
payments.
ECONOMIC STUDIES AT BROOKINGS
28 /// Borrowers with Large Balances: Rising Student Debt and Falling Repayment Rates
VII. Concluding Remarks
This paper shows that a relatively small number of borrowers account for the majority
of student loan dollars. While these borrowers historically have had stronger labor market
outcomes and avoid default, they represent a significant share of dollars in default and
avoid repaying their loans. Worryingly, non-repayment rates have increased in the past
decade. The increase in non-repayment is largely explained by changes in student de-
mographics, the type of institutions in which they enroll, changes in default rates, and most
importantly the increased participation of alternative repayment options such as IBR and
forbearance. These changes mean more borrowers will struggle with their loans and that
the impact on government finances from non-payment will rise. Three trends are of special
concern. First, an increasing share of large-balance borrowers enroll in for-profit institu-
tions, which tend to have worse loan and labor market outcomes than other types of insti-
tutions. Second, repayment rates are decreasing. Third, new programs such as Public Ser-
vice Loan Forgiveness and IBR forgive balances after set time periods. All of these factors
could have important fiscal and welfare consequences in the future.
The credit supplement to the Federal Budget reports that graduate and parent loans
are not subsidized (at least, according to federal scoring rules for federal loans) and that
recoveries on defaulted loans are high, giving the impression that defaulted loans do not
impose costs on taxpayers. However, these estimates fail to account for the costs of recov-
ery and, if these projections prove incorrect then the fiscal costs could be much larger. At a
time when the pool of borrowers is changing, loan amounts exceed historical experience,
and recent repayment plans offer substantial opportunities for debt forgiveness, historical
experience may not be a good indicator of future experience.
The welfare implications of the distribution of loan balances and repayment are less
clear. Student loans exist to alleviate credit constraints, but does lifting these constraints
for large-balance borrowers enhance their welfare? Screening for large-balance borrowers
who are likely to avoid repayment could have substantial welfare impacts (Cox 2016; Loch-
ner and Monge-Naranjo 2011; Sun and Yannelis 2016; Looney and Yannelis 2018). Exam-
ining the risk characteristics of by large-balance borrowers or the programs they attend
could have direct fiscal implications, benefits to taxpayers, and improvements in borrower
outcomes.
The evidence in this paper is intended to be helpful to policymakers attempting to un-
derstand the consequences of the expansion in credit and borrowing and in designing pol-
icies to reduce risks to students and taxpayers and to promote better educational outcomes.
The finding suggest that the selective reduction in credit could reduce or reverse unin-
tended consequences or costs of lending programs. For instance, reducing loan limits,
eliminating certain types of high-cost loans, strengthening institutional accountability sys-
tems, and applying accountability rules to graduate and parent loans could reduce adverse
outcomes, reduce risks on taxpayers, and improve economic outcomes.
ECONOMIC STUDIES AT BROOKINGS
29 /// Borrowers with Large Balances: Rising Student Debt and Falling Repayment Rates
REFERENCES
Adelino, Manuel, Antoinette Schoar, and Felipe Severino. (2016) “Credit supply and
house prices: evidence from mortgage market segmentation.” Review of Finan-
cial Studies, forthcoming.
Avery, C., and S. Turner. (2012) "Student Loans: Do College Students Borrow Too Much—
Or Not Enough?." The Journal of Economic Perspectives 26.1: 165-192.
Baum, S., and M. C. Johnson (2015): “Student Debt: Who Borrows Most? What Lies
Ahead?,” Urban Institute Working Paper.
Bleemer, Z., Brown, M., Lee, D., Strair, K. and van der Klauuw (2017): “Echoes of Rising
Tuition in Students’ Borrowing, Educational Attainment, and Homeownership in
Post-Recession America, Federal Reserve Bank of New York Research Paper,
July 820
Blinder, A. S. (1973)."Wage Discrimination: Reduced Form and Structural Variables."
Journal of Human Resources 8 no. 4: 436-55.
Borjas, George J. "The relationship between wages and weekly hours of work: The role of
division bias." The Journal of Human Resources 15.3 (1980): 409-423.
Brown M., A. Haughwaut, W. Van der Klauuw, and J. Scally (2014): “Measuring Student
Debt and its Performance,” Federal Reserve Bank of New York Staff Reports.
Cellini, S. and Goldin, C. (2014): "Does Federal Student Aid Raise Tuition? New Evidence
on For-Profit Colleges." American Economic Journal: Economic Policy, 6(4):
174-206.
Chapman, B. (1997): “Conceptual Issues and the Australian Experience with Income Con-
tingent Charges for Higher Education,” The Economic Journal, 107(422), 738–
751.
-- (2006): “Income Contingent Loans for Higher Education: International Reform,”
Handbook of the Economics of Education, 2, Editors, Eric Hanushek and Finis
Welch, 1453– 1503.
Cox, N. (2016) “Pricing, Selection and Welfare in the Student Loan Market: Evidence
from Borrower Repayment Decisions” Unpublished Mimeo.
Field, E. (2014): “The Effects of Student Loans on Long-Term Household Financial Sta-
bility,” American Economic Journal: Applied Economics, 1(1), 1–21.
ECONOMIC STUDIES AT BROOKINGS
30 /// Borrowers with Large Balances: Rising Student Debt and Falling Repayment Rates
Hartman R. (1972): “Equity Implications of State Tuition Policy and Student Loans,”
Journal of Political Economy, 80(3), 142-171.
Ionescu, F. (2009): “The Federal Student Loan Program: Quantitative Implications for
College Enrollment and Default Rates,” Review of Economic Dynamics, 12(1),
205-231.
Isen, A., Goodman, S. and C. Yannelis (2018): “A Day Late and a Dollar Short: Liquidity
and Household Formation among Student Borrowers,” Unpublished Mimeo.
Ji, Y. (2016) “Job Search under Debt: The Aggregate Implications of Student Loans” Un-
published Mimeo.
Knapp, L. G., and T. G. Seaks (1992): “An Analysis of the Probability of Default on Feder-
ally Guaranteed Student Loans,” The Review of Economics and Statistics, 74(3),
404– 411.
Lochner, L., and P. Belly (2007): “The Changing Role of Family Income and Ability in De-
termining Educational Achievement,” Journal of Human Capital, 1(1) 37-89.
Lochner, L., and A. Monge-Naranjo (2011): “The Nature of Credit Constraints and Hu-
man Capital,” American Economic Review, 101(6), 2487–2529.
-- (2014). “Default and Repayment Among Baccalaureate Degree Earners”. No. w19882.
National Bureau of Economic Research.
--(2015): “Student Loans and Repayment: Theory, Evidence and Policy,” Handbook of the
Economics of Education.
Looney, A. and C. Yannelis, (2015) “A Crisis in Student Loans? How Changes in the Char-
acteristics of Borrowers and the Institutions they Attended Contributed to Rising
Loan Defaults” Brookings Papers on Economic Activity 2015(2), 1-89.
-- (2016) “Is High Student Loan Debt Always a Problem?” SIEPR Policy Brief.
--(2018) “The Consequences of Student Loan Credit Expansions: Evidence from Three
Decades of Default Cycles,” Unpublished Mimeo
Lucca, D., Nadauld, T., and Shen, K. (2015): “Credit Supply and the Rise in College Tui-
tion: Evidence from the Expansion of Federal Student Aid Programs.” Federal
Reserve Bank of New York Research Paper, July, 733.
ECONOMIC STUDIES AT BROOKINGS
31 /// Borrowers with Large Balances: Rising Student Debt and Falling Repayment Rates
Marx, B., and L. Turner (2015): “Borrowing Trouble: Student Loans, the Cost of Borrow-
ing, and Implications for the Effectiveness of Need-Based Grant Aid,” Un-
published Mimeo.
Mueller, H., and C. Yannelis (2018): “The Rise in Student Loan Defaults in the Great Re-
cession,” Journal of Financial Economics.
Psacharopoulos, G., and G. Papakonstantinou (2005): “The Real University Cost in a
“Free” Higher Education Country,” Economics of Education Review, 24(1), 103–
108.
Oaxaca, R. (1973). “Male-Female Wage Differentials in Urban Labor Markets.” Interna-
tional Economic Review 14 no. 3: 693-709
Sun, S. T, and C. Yannelis (2016): “Credit Constraints and College Enrollment: Evidence from
Financial Deregulation” Review of Economics and Statistics 98(1): 12-24.
Yannelis, C. (2017a) “Asymmetric Information in Student Loans”, Unpublished Mimeo.
Yannelis, C. (2017b) “Strategic Default on Student Loans”, Unpublished Mimeo.
The Brookings Economic Studies program ana-lyzes current and emerging economic issues fac-ing the United States and the world, focusing on ideas to achieve broad-based economic growth, a strong labor market, sound fiscal and monetary policy, and economic opportunity and social mo-bility. The research aims to increase understand-ing of how the economy works and what can be done to make it work better.
Questions about the research? Email [email protected]. Be sure to include the title of this paper in your inquiry.
© 2018 The Brookings Institution | 1775 Massachusetts Ave., NW, Washington, DC 20036 | 202.797.6000