borehole geology and hydrothermal alteration of … · borehole geology and hydrothermal alteration...
TRANSCRIPT
GEOTHERMAL TRAINING PROGRAMME Reports 2012 Orkustofnun, Grensasvegur 9, Number 29 IS-108 Reykjavik, Iceland
695
BOREHOLE GEOLOGY AND HYDROTHERMAL ALTERATION OF WELL OW-912B, OLKARIA GEOTHERMAL FIELD, KENYA
Irene J. Ronoh Kenya Electricity Generating Company, Ltd. – KenGen
P.O. Box 785 – 20117 Naivasha KENYA
[email protected], [email protected]
ABSTRACT
OW-912B is a directional well in the Olkaria Domes geothermal field. It was drilled to a depth of 2998 m in a N90°E direction and the production casing was set at 846 m depth. A maximum formation temperature of 306°C was measured at 2980 m depth. The injectivity index, calculated after well testing, was 47 lpm/bar, which is among the lowest values recorded in the Domes field. Rock types identified in the well include pyroclastics, rhyolites, tuffs, trachytes and basalts. Rhyolitic dyke intrusions were encountered at 1068 and 2990 m. Changes in the rate of penetration were noted at depths where intrusives were penetrated. Parameters controlling hydrothermal alteration in the well are temperature, rock type, fluid chemistry and permeability. The first appearance of epidote occurred at 950 m and four alteration zones were identified based on the alteration mineral assemblages. These are a zeolite-illite zone, a chlorite-illite zone, an epidote-chlorite-illite zone and an actinolite-epidote-chlorite-illite zone. The top 136 m is unaltered. Nine minor feed zones were encountered in the well. Shallow permeable zones are associated with loss of circulation zones and stratigraphic boundaries while deeper feed zones are identified from heat-up temperature profiles and changes in the intensity of alteration. Thirty one fluid inclusions analysed from quartz crystals at depths of 756 and 1438 m indicated homogenization temperatures ranging from 160 to 300°C. Boiling conditions were encountered between 1000 and 1180 m, associated with high permeability. The elevated temperatures at this depth resulted in the formation of garnet between 1048 and 1068 m. By comparing the current formation temperature, alteration mineralogy and fluid inclusion measurements, the indications are that the area around the well is in a state of equilibrium. The well is drilled in the direction of an up-flow zone encountering high temperature but low permeability, resulting in the well being a poor producer.
1. INTRODUCTION
The African plate has been splitting into two tectonic plates, namely: the Somali plate and the Nubian plate along a thin divergent plate boundary in the East African Rift. It runs north to south from the Afar Triple Junction at the Red Sea in the north to Beira, Mozambique in the south (Lagat, 2004). It crosses two regions of topographic uplift, the Ethiopian dome to the north and the Kenyan dome to the south,
Ronoh 696 Report 29
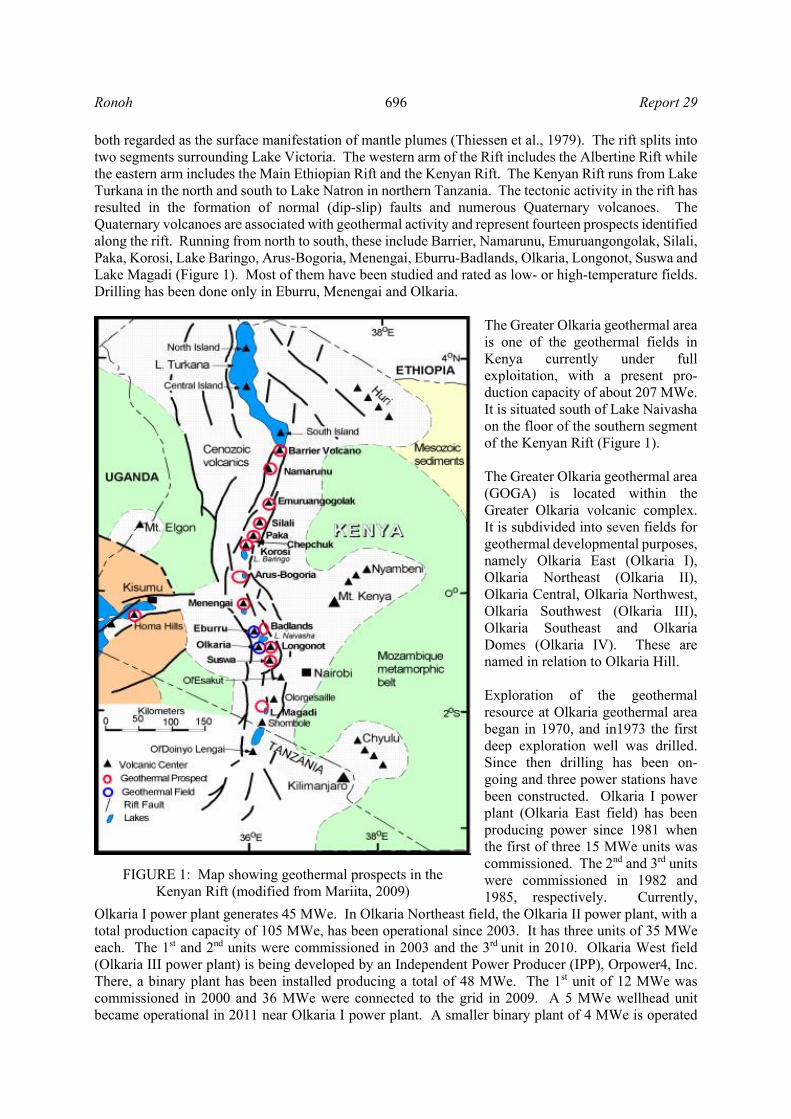
both regarded as the surface manifestation of mantle plumes (Thiessen et al., 1979). The rift splits into two segments surrounding Lake Victoria. The western arm of the Rift includes the Albertine Rift while the eastern arm includes the Main Ethiopian Rift and the Kenyan Rift. The Kenyan Rift runs from Lake Turkana in the north and south to Lake Natron in northern Tanzania. The tectonic activity in the rift has resulted in the formation of normal (dip-slip) faults and numerous Quaternary volcanoes. The Quaternary volcanoes are associated with geothermal activity and represent fourteen prospects identified along the rift. Running from north to south, these include Barrier, Namarunu, Emuruangongolak, Silali, Paka, Korosi, Lake Baringo, Arus-Bogoria, Menengai, Eburru-Badlands, Olkaria, Longonot, Suswa and Lake Magadi (Figure 1). Most of them have been studied and rated as low- or high-temperature fields. Drilling has been done only in Eburru, Menengai and Olkaria.
The Greater Olkaria geothermal area is one of the geothermal fields in Kenya currently under full exploitation, with a present pro-duction capacity of about 207 MWe. It is situated south of Lake Naivasha on the floor of the southern segment of the Kenyan Rift (Figure 1). The Greater Olkaria geothermal area (GOGA) is located within the Greater Olkaria volcanic complex. It is subdivided into seven fields for geothermal developmental purposes, namely Olkaria East (Olkaria I), Olkaria Northeast (Olkaria II), Olkaria Central, Olkaria Northwest, Olkaria Southwest (Olkaria III), Olkaria Southeast and Olkaria Domes (Olkaria IV). These are named in relation to Olkaria Hill. Exploration of the geothermal resource at Olkaria geothermal area began in 1970, and in1973 the first deep exploration well was drilled. Since then drilling has been on-going and three power stations have been constructed. Olkaria I power plant (Olkaria East field) has been producing power since 1981 when the first of three 15 MWe units was commissioned. The 2nd and 3rd units were commissioned in 1982 and 1985, respectively. Currently,
Olkaria I power plant generates 45 MWe. In Olkaria Northeast field, the Olkaria II power plant, with a total production capacity of 105 MWe, has been operational since 2003. It has three units of 35 MWe each. The 1st and 2nd units were commissioned in 2003 and the 3rd unit in 2010. Olkaria West field (Olkaria III power plant) is being developed by an Independent Power Producer (IPP), Orpower4, Inc. There, a binary plant has been installed producing a total of 48 MWe. The 1st unit of 12 MWe was commissioned in 2000 and 36 MWe were connected to the grid in 2009. A 5 MWe wellhead unit became operational in 2011 near Olkaria I power plant. A smaller binary plant of 4 MWe is operated
FIGURE 1: Map showing geothermal prospects in the Kenyan Rift (modified from Mariita, 2009)
Report 29 697 Ronoh
by Oserian Development Company (ODC) for its domestic use in the company. This brings the current production capacity from the Greater Olkaria Geothermal area to 207 MWe. Additional power plants are currently under construction in Olkaria East Field; Olkaria I power plant will be expanded and will consist of the 4th and 5th units of 70 MWe each. In Olkaria Domes Field, where the Olkaria IV power plant is under construction, the 1st and 2nd units of 70 MWe each are expected to be commissioned by 2014. Since the onset of drilling in the Greater Olkaria geothermal area in 1973, when the first exploration well was drilled to a depth of 1003 m, more than one hundred wells have been drilled. Deep drilling technology to a depth of about 3000 m has been adopted with wells proving more productive. A directional drilling technique has been used in Olkaria with success as most wells intersect more productive aquifers than if they were drilled vertically. This report presents an analysis of data from well OW-912B, which is located in the southeast of Olkaria Domes field. The aim of the study is to analyse drill cuttings, sampled every 2 m to identify the subsurface stratigraphy and hydrothermal alteration in the well. Aquifers and feed zones are located while an assessment of the thermal conditions in well OW-912B and the surrounding wells is made. 2. OVERVIEW OF GEOLOGY, GEOCHEMICAL AND GEOPHYSICAL SETTING 2.1 Regional geology Rifting within the East African rift occurred along the north-south weak collisional zone at the contact between the Archean Tanzania craton and Proterozoic orogenic belts (Smith and Mosley, 1993). Volcanic activities in the Kenyan Rift started during the late Oligocene to early Miocene in the area known as the Turkana Rift (Baker et al., 1971, 1972; Kampunzu and Mohr, 1991; Smith, 1994; Lagat et al., 2005). Extensive basaltic and phonolitic eruptions occurred in the Miocene and these were preceded by uplifting of the Kenyan Dome (Thompson and Dodson, 1963; Baker and Wohlenberg, 1971; Baker et al., 1971, 1972; Omenda, 1998). In late Miocene, rift faulting began resulting in large volumes of Pliocene ignimbritic tuffs erupting within the graben structure. These rocks include the Mau and Kinangop tuffs. The eruptions of trachytes, basalts, basaltic trachyandesites, and trachyandesites occurred in the early Pleistocene. These rocks, commonly known as the Plateau trachytes, were deposited on the graben floor along the fissures within the rift-bounding faults (Lagat et al., 2005). An extensive rift-floor grid-faulting event followed resulting in faulting of the plateau rocks on the graben, creating high angle normal faults within the rift floor. The open fractures on the rift floor served as conduits for the Quaternary volcanic activity of mafic to felsic composition. The youngest of the rift-fill volcanic materials includes Pleistocene-Holocene rhyolites, trachytes, basalts, phonolites, and pyroclastics. Olkaria is the only region along the rift where a comendite formation is exposed on the surface (Omenda, 1998). 2.2 Greater Olkaria volcanic complex The Greater Olkaria volcanic complex is in the central sector of the Kenyan Dome. The dome has a crustal thickness of 30-35 km (Mechie et al., 1997). The age of initiation of the complex is unknown but is estimated to be between 22-20 ka BP based on its relationship to the age of the high-stands in the local lakes (Clarke et al., 1990; MacDonald et al., 2008). Evolution of the complex occurred in six stages characterized by steep-sided domes, lavas and/or pyroclastic rocks, or as thick lava flows of restricted lateral extent.
Ronoh 698 Report 29
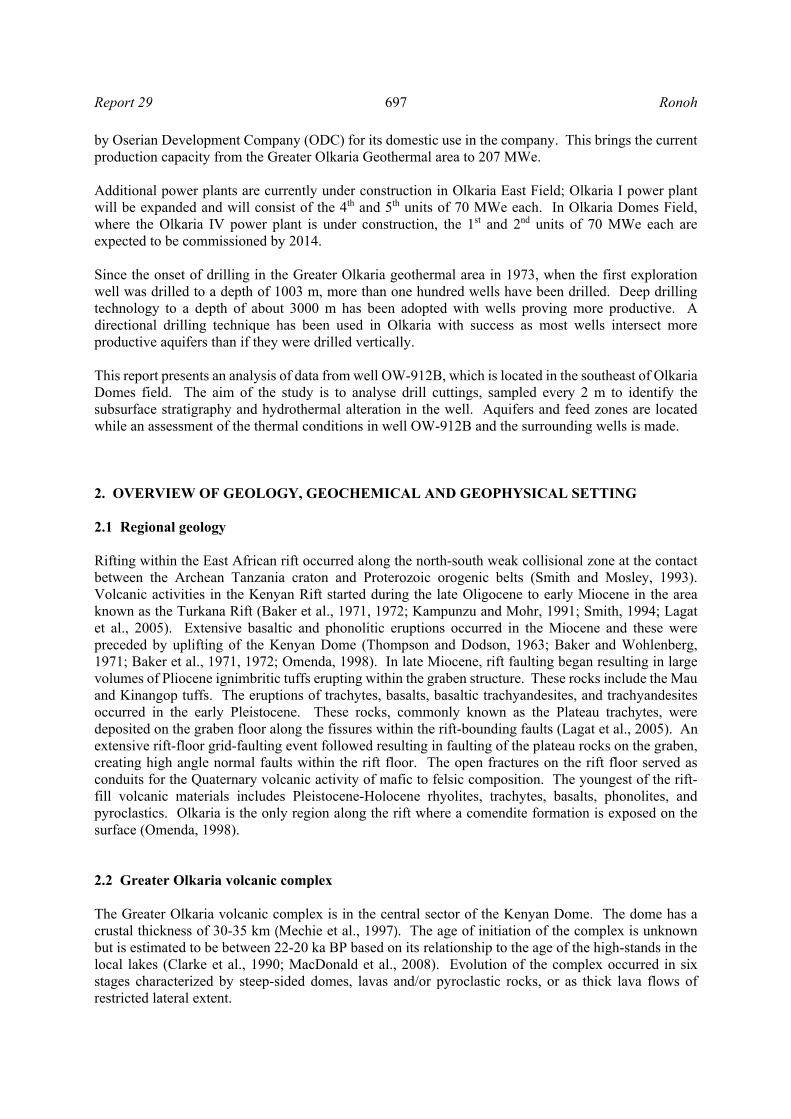
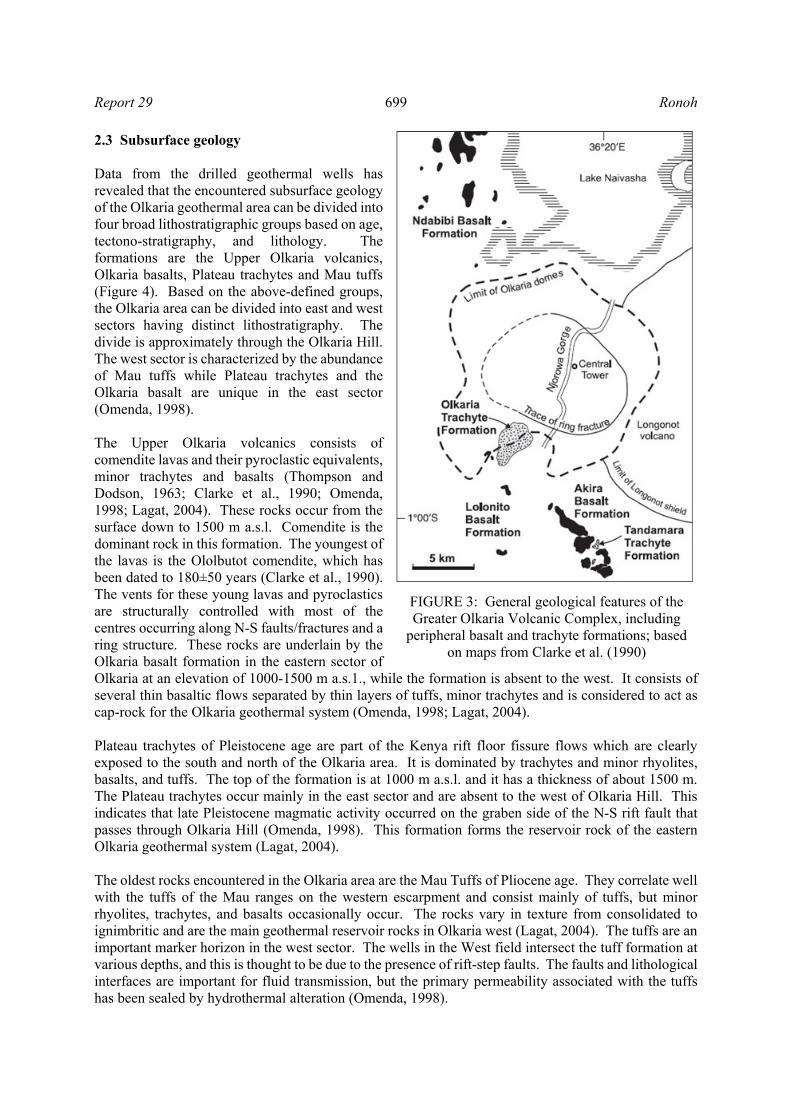
The earliest sequence exposed is the Olkaria Trachyte formation (Ot) and Maiella pumice formation (Mp), which are widespread to the west of the complex and are thought to have been erupted from vents within it. The trachyte lavas are exposed mainly in gullies and ridges in the southwest part of the complex (MacDonald et al., 2008; Marshall et al., 2009). The trachyte eruption was followed by the caldera collapse forming a depression 11 × 7.5 km across, which is now represented by the trace of a ring structure, (Clarke et al, 1990). The collapse is associated with eruption of welded pyroclastic rocks of the Ol Njorowa pantellerite formation (O1) in Figure 2. The Lower comendite formation (O2) represents the post-caldera activity linked to the eruption of peralkaline rhyolitic lavas and pyroclastic rocks (Op2). The predominantly dome-building phase of the Middle comendite member (O3) followed, with the eruption of thick surge deposits (Op3). This led to the resurgence of the caldera floor and the formation of the short, thick lava flows of the Upper comendite member (O4). The most recent activities were the eruptions of very thick flows of comendite (O5) from a north-south fissure zone by the youngest flow, Ololbutot, dated to 180+50 BP (Clarke et al., 1990). Mafic eruptions occurred to the north and south of the Olkaria field (Figure 3). To the south is the Lolonito basalt formation (Ba1) dated to about 400,000 years BP. The formation may represent an early phase of the generally younger Akira basalt formation (Ba2), which consists of lavas and scoria and spatter cones (Clarke et al., 1990; MacDonald et al., 2008). The formation is generally of the same age as the Tandamara trachyte formation (Tt) in the southeast of the complex and is composed of welded scoriaceous lapilli and blocks and some lava. To the north of the Olkaria field, mafic volcanism occurred on the Ndabibi plains, an 11 km wide low-lying area between the Greater Olkaria volcanic complex and the Eburru volcanic complex (Figure 3). Faulted lavas and pyroclastic cones of pre-caldera age comprise the Ndabibi basalt formation (Bn) (Clarke et al., 1990). The basalt-trachyte suite is formed by a combination
of fractional crystallization, magma mixing and resorption of earlier-formed crystals. Matrix glass in metaluminous trachytes has a peralkaline rhyolitic composition, indicating that the eruptive rhyolites may have formed by fractional crystallization of trachyte (MacDonald et al., 2008).
FIGURE 2: Stratigraphic column for the Greater Olkaria volcanic complex; units O1 to O5/Op5 and Ot are from the Olkaria complex; LP1 to LP8 units are Longonot pumice falls (Marshall et al., 2009)
Report 29 699 Ronoh
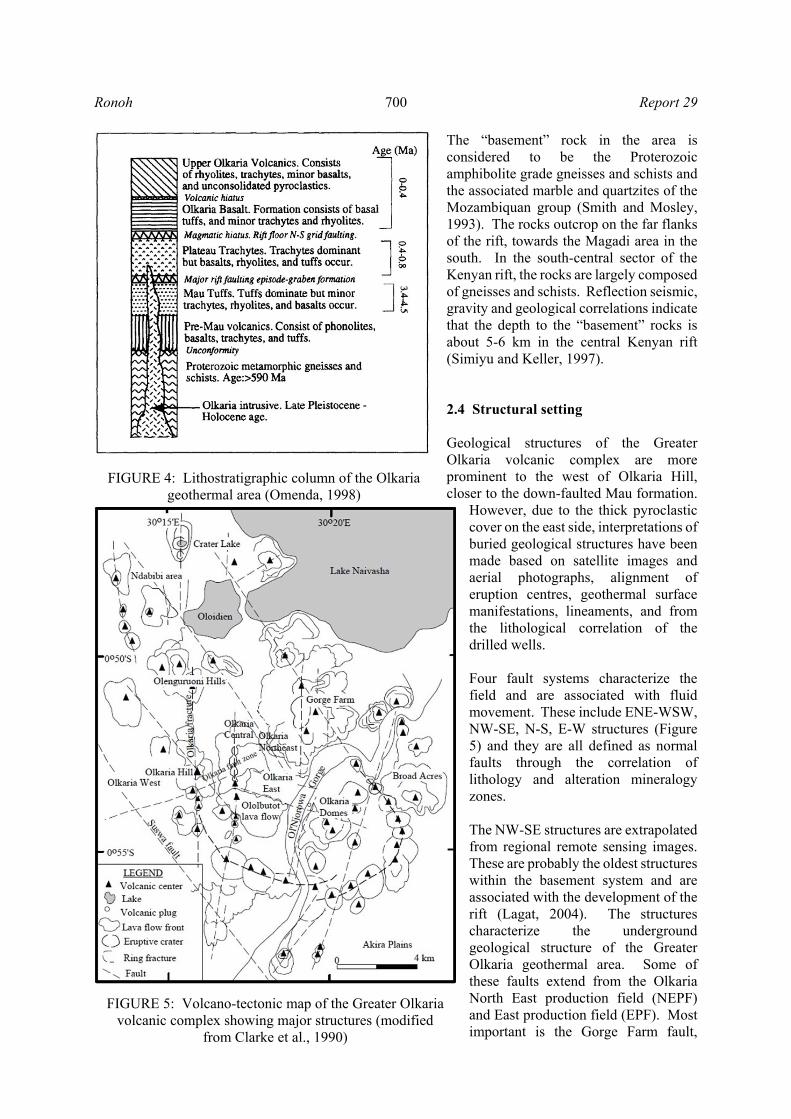
2.3 Subsurface geology Data from the drilled geothermal wells has revealed that the encountered subsurface geology of the Olkaria geothermal area can be divided into four broad lithostratigraphic groups based on age, tectono-stratigraphy, and lithology. The formations are the Upper Olkaria volcanics, Olkaria basalts, Plateau trachytes and Mau tuffs (Figure 4). Based on the above-defined groups, the Olkaria area can be divided into east and west sectors having distinct lithostratigraphy. The divide is approximately through the Olkaria Hill. The west sector is characterized by the abundance of Mau tuffs while Plateau trachytes and the Olkaria basalt are unique in the east sector (Omenda, 1998). The Upper Olkaria volcanics consists of comendite lavas and their pyroclastic equivalents, minor trachytes and basalts (Thompson and Dodson, 1963; Clarke et al., 1990; Omenda, 1998; Lagat, 2004). These rocks occur from the surface down to 1500 m a.s.l. Comendite is the dominant rock in this formation. The youngest of the lavas is the Ololbutot comendite, which has been dated to 180±50 years (Clarke et al., 1990). The vents for these young lavas and pyroclastics are structurally controlled with most of the centres occurring along N-S faults/fractures and a ring structure. These rocks are underlain by the Olkaria basalt formation in the eastern sector of Olkaria at an elevation of 1000-1500 m a.s.1., while the formation is absent to the west. It consists of several thin basaltic flows separated by thin layers of tuffs, minor trachytes and is considered to act as cap-rock for the Olkaria geothermal system (Omenda, 1998; Lagat, 2004). Plateau trachytes of Pleistocene age are part of the Kenya rift floor fissure flows which are clearly exposed to the south and north of the Olkaria area. It is dominated by trachytes and minor rhyolites, basalts, and tuffs. The top of the formation is at 1000 m a.s.l. and it has a thickness of about 1500 m. The Plateau trachytes occur mainly in the east sector and are absent to the west of Olkaria Hill. This indicates that late Pleistocene magmatic activity occurred on the graben side of the N-S rift fault that passes through Olkaria Hill (Omenda, 1998). This formation forms the reservoir rock of the eastern Olkaria geothermal system (Lagat, 2004). The oldest rocks encountered in the Olkaria area are the Mau Tuffs of Pliocene age. They correlate well with the tuffs of the Mau ranges on the western escarpment and consist mainly of tuffs, but minor rhyolites, trachytes, and basalts occasionally occur. The rocks vary in texture from consolidated to ignimbritic and are the main geothermal reservoir rocks in Olkaria west (Lagat, 2004). The tuffs are an important marker horizon in the west sector. The wells in the West field intersect the tuff formation at various depths, and this is thought to be due to the presence of rift-step faults. The faults and lithological interfaces are important for fluid transmission, but the primary permeability associated with the tuffs has been sealed by hydrothermal alteration (Omenda, 1998).
FIGURE 3: General geological features of the Greater Olkaria Volcanic Complex, including
peripheral basalt and trachyte formations; based on maps from Clarke et al. (1990)
Ronoh 700 Report 29
The “basement” rock in the area is considered to be the Proterozoic amphibolite grade gneisses and schists and the associated marble and quartzites of the Mozambiquan group (Smith and Mosley, 1993). The rocks outcrop on the far flanks of the rift, towards the Magadi area in the south. In the south-central sector of the Kenyan rift, the rocks are largely composed of gneisses and schists. Reflection seismic, gravity and geological correlations indicate that the depth to the “basement” rocks is about 5-6 km in the central Kenyan rift (Simiyu and Keller, 1997). 2.4 Structural setting Geological structures of the Greater Olkaria volcanic complex are more prominent to the west of Olkaria Hill, closer to the down-faulted Mau formation.
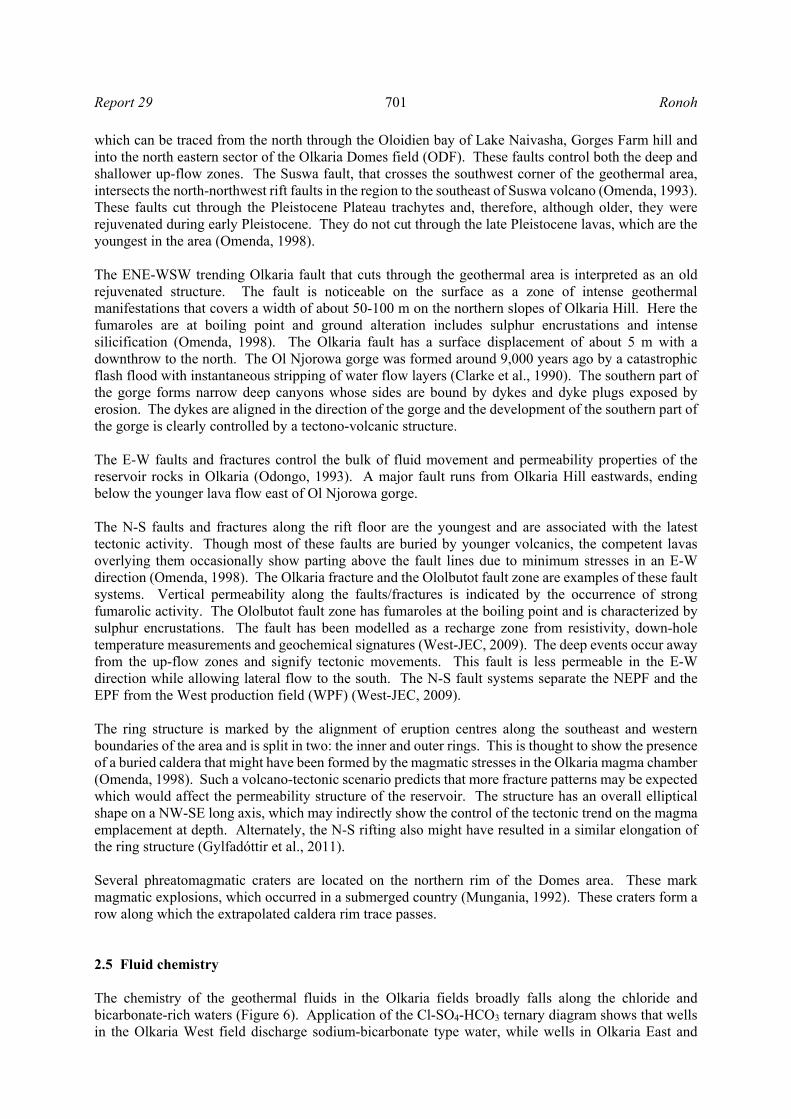
However, due to the thick pyroclastic cover on the east side, interpretations of buried geological structures have been made based on satellite images and aerial photographs, alignment of eruption centres, geothermal surface manifestations, lineaments, and from the lithological correlation of the drilled wells. Four fault systems characterize the field and are associated with fluid movement. These include ENE-WSW, NW-SE, N-S, E-W structures (Figure 5) and they are all defined as normal faults through the correlation of lithology and alteration mineralogy zones. The NW-SE structures are extrapolated from regional remote sensing images. These are probably the oldest structures within the basement system and are associated with the development of the rift (Lagat, 2004). The structures characterize the underground geological structure of the Greater Olkaria geothermal area. Some of these faults extend from the Olkaria North East production field (NEPF) and East production field (EPF). Most important is the Gorge Farm fault,
FIGURE 4: Lithostratigraphic column of the Olkaria geothermal area (Omenda, 1998)
FIGURE 5: Volcano-tectonic map of the Greater Olkaria volcanic complex showing major structures (modified
from Clarke et al., 1990)
Report 29 701 Ronoh
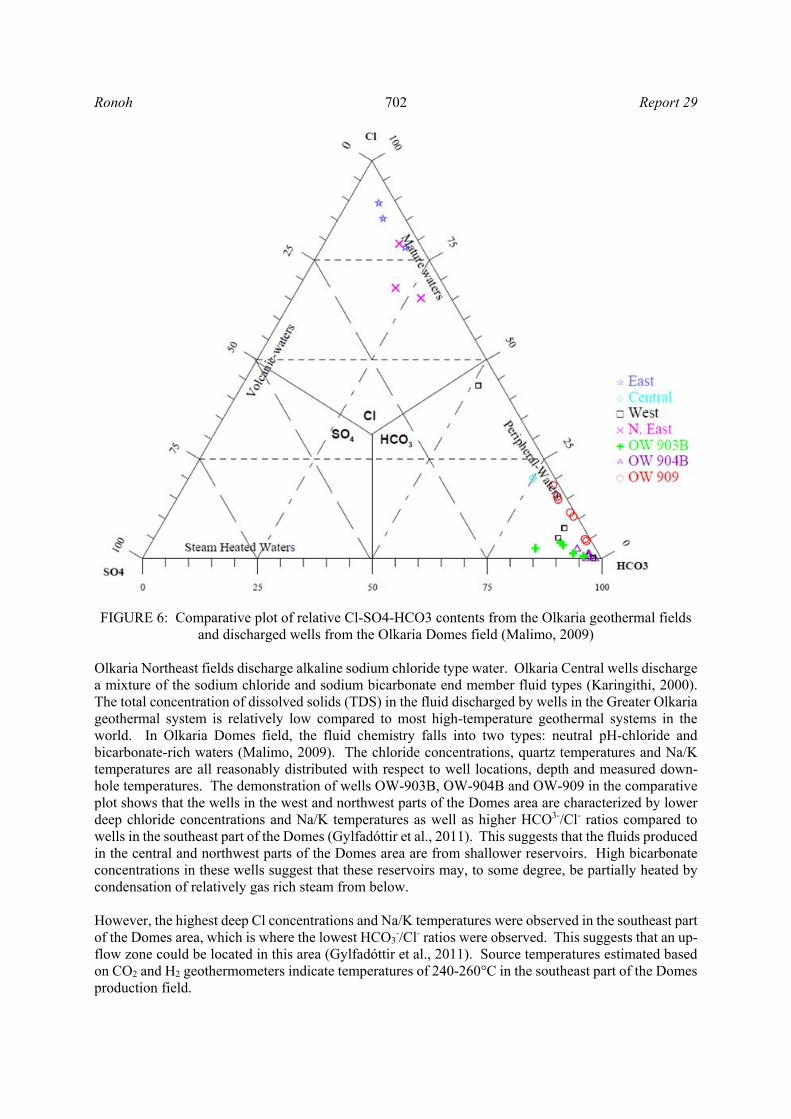
which can be traced from the north through the Oloidien bay of Lake Naivasha, Gorges Farm hill and into the north eastern sector of the Olkaria Domes field (ODF). These faults control both the deep and shallower up-flow zones. The Suswa fault, that crosses the southwest corner of the geothermal area, intersects the north-northwest rift faults in the region to the southeast of Suswa volcano (Omenda, 1993). These faults cut through the Pleistocene Plateau trachytes and, therefore, although older, they were rejuvenated during early Pleistocene. They do not cut through the late Pleistocene lavas, which are the youngest in the area (Omenda, 1998). The ENE-WSW trending Olkaria fault that cuts through the geothermal area is interpreted as an old rejuvenated structure. The fault is noticeable on the surface as a zone of intense geothermal manifestations that covers a width of about 50-100 m on the northern slopes of Olkaria Hill. Here the fumaroles are at boiling point and ground alteration includes sulphur encrustations and intense silicification (Omenda, 1998). The Olkaria fault has a surface displacement of about 5 m with a downthrow to the north. The Ol Njorowa gorge was formed around 9,000 years ago by a catastrophic flash flood with instantaneous stripping of water flow layers (Clarke et al., 1990). The southern part of the gorge forms narrow deep canyons whose sides are bound by dykes and dyke plugs exposed by erosion. The dykes are aligned in the direction of the gorge and the development of the southern part of the gorge is clearly controlled by a tectono-volcanic structure. The E-W faults and fractures control the bulk of fluid movement and permeability properties of the reservoir rocks in Olkaria (Odongo, 1993). A major fault runs from Olkaria Hill eastwards, ending below the younger lava flow east of Ol Njorowa gorge. The N-S faults and fractures along the rift floor are the youngest and are associated with the latest tectonic activity. Though most of these faults are buried by younger volcanics, the competent lavas overlying them occasionally show parting above the fault lines due to minimum stresses in an E-W direction (Omenda, 1998). The Olkaria fracture and the Ololbutot fault zone are examples of these fault systems. Vertical permeability along the faults/fractures is indicated by the occurrence of strong fumarolic activity. The Ololbutot fault zone has fumaroles at the boiling point and is characterized by sulphur encrustations. The fault has been modelled as a recharge zone from resistivity, down-hole temperature measurements and geochemical signatures (West-JEC, 2009). The deep events occur away from the up-flow zones and signify tectonic movements. This fault is less permeable in the E-W direction while allowing lateral flow to the south. The N-S fault systems separate the NEPF and the EPF from the West production field (WPF) (West-JEC, 2009). The ring structure is marked by the alignment of eruption centres along the southeast and western boundaries of the area and is split in two: the inner and outer rings. This is thought to show the presence of a buried caldera that might have been formed by the magmatic stresses in the Olkaria magma chamber (Omenda, 1998). Such a volcano-tectonic scenario predicts that more fracture patterns may be expected which would affect the permeability structure of the reservoir. The structure has an overall elliptical shape on a NW-SE long axis, which may indirectly show the control of the tectonic trend on the magma emplacement at depth. Alternately, the N-S rifting also might have resulted in a similar elongation of the ring structure (Gylfadóttir et al., 2011). Several phreatomagmatic craters are located on the northern rim of the Domes area. These mark magmatic explosions, which occurred in a submerged country (Mungania, 1992). These craters form a row along which the extrapolated caldera rim trace passes. 2.5 Fluid chemistry The chemistry of the geothermal fluids in the Olkaria fields broadly falls along the chloride and bicarbonate-rich waters (Figure 6). Application of the Cl-SO4-HCO3 ternary diagram shows that wells in the Olkaria West field discharge sodium-bicarbonate type water, while wells in Olkaria East and
Ronoh 702 Report 29
Olkaria Northeast fields discharge alkaline sodium chloride type water. Olkaria Central wells discharge a mixture of the sodium chloride and sodium bicarbonate end member fluid types (Karingithi, 2000). The total concentration of dissolved solids (TDS) in the fluid discharged by wells in the Greater Olkaria geothermal system is relatively low compared to most high-temperature geothermal systems in the world. In Olkaria Domes field, the fluid chemistry falls into two types: neutral pH-chloride and bicarbonate-rich waters (Malimo, 2009). The chloride concentrations, quartz temperatures and Na/K temperatures are all reasonably distributed with respect to well locations, depth and measured down-hole temperatures. The demonstration of wells OW-903B, OW-904B and OW-909 in the comparative plot shows that the wells in the west and northwest parts of the Domes area are characterized by lower deep chloride concentrations and Na/K temperatures as well as higher HCO3-/Cl- ratios compared to wells in the southeast part of the Domes (Gylfadóttir et al., 2011). This suggests that the fluids produced in the central and northwest parts of the Domes area are from shallower reservoirs. High bicarbonate concentrations in these wells suggest that these reservoirs may, to some degree, be partially heated by condensation of relatively gas rich steam from below. However, the highest deep Cl concentrations and Na/K temperatures were observed in the southeast part of the Domes area, which is where the lowest HCO3
-/Cl- ratios were observed. This suggests that an up-flow zone could be located in this area (Gylfadóttir et al., 2011). Source temperatures estimated based on CO2 and H2 geothermometers indicate temperatures of 240-260°C in the southeast part of the Domes production field.
FIGURE 6: Comparative plot of relative Cl-SO4-HCO3 contents from the Olkaria geothermal fields and discharged wells from the Olkaria Domes field (Malimo, 2009)
Report 29 703 Ronoh
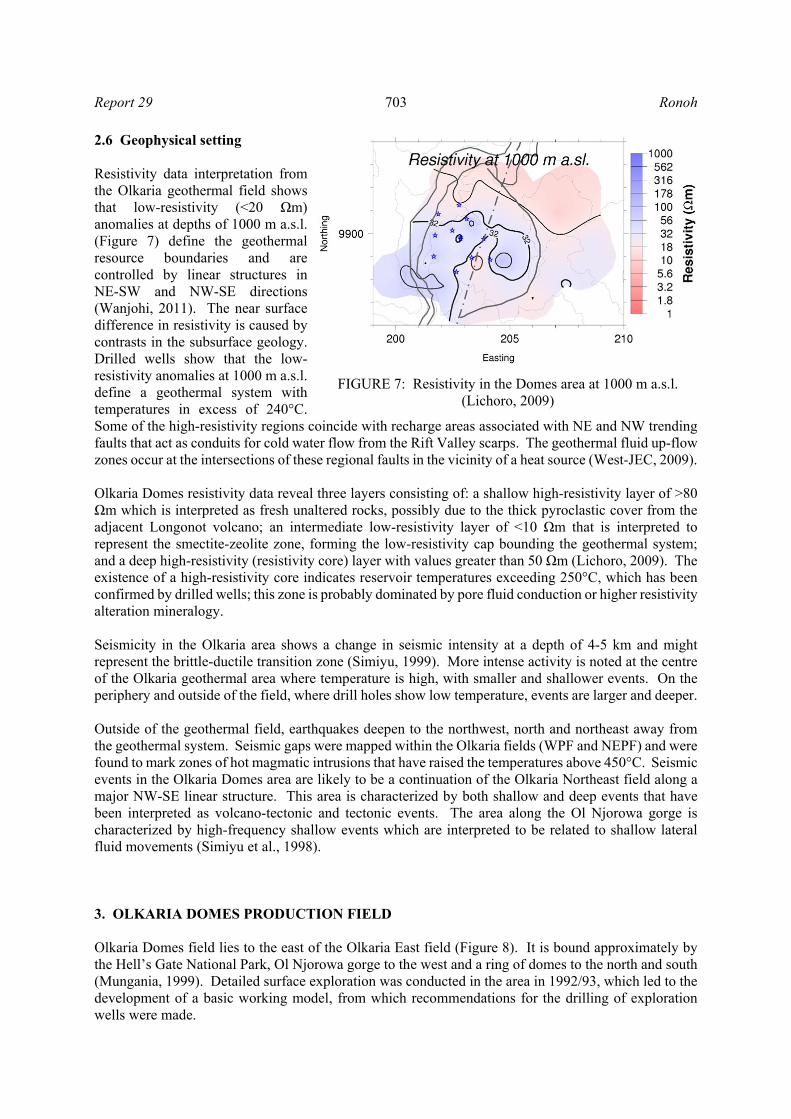
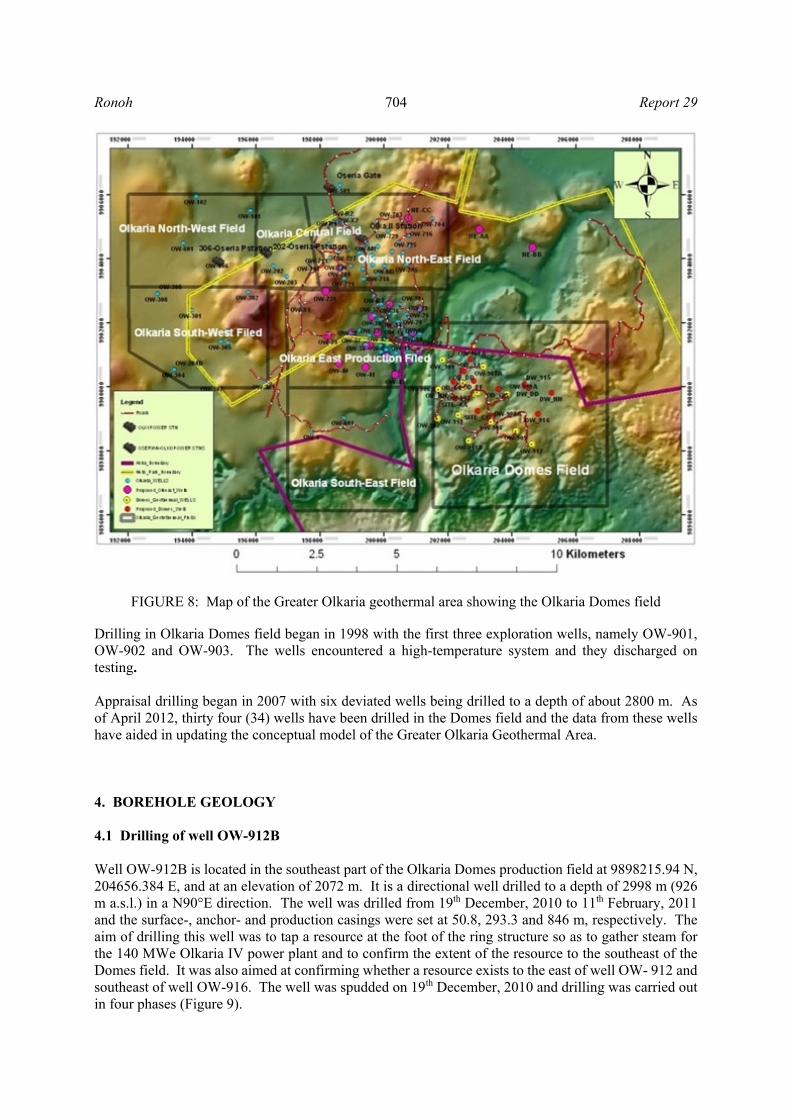
2.6 Geophysical setting Resistivity data interpretation from the Olkaria geothermal field shows that low-resistivity (˂20 Ωm) anomalies at depths of 1000 m a.s.l. (Figure 7) define the geothermal resource boundaries and are controlled by linear structures in NE-SW and NW-SE directions (Wanjohi, 2011). The near surface difference in resistivity is caused by contrasts in the subsurface geology. Drilled wells show that the low-resistivity anomalies at 1000 m a.s.l. define a geothermal system with temperatures in excess of 240°C. Some of the high-resistivity regions coincide with recharge areas associated with NE and NW trending faults that act as conduits for cold water flow from the Rift Valley scarps. The geothermal fluid up-flow zones occur at the intersections of these regional faults in the vicinity of a heat source (West-JEC, 2009). Olkaria Domes resistivity data reveal three layers consisting of: a shallow high-resistivity layer of >80 Ωm which is interpreted as fresh unaltered rocks, possibly due to the thick pyroclastic cover from the adjacent Longonot volcano; an intermediate low-resistivity layer of ˂10 Ωm that is interpreted to represent the smectite-zeolite zone, forming the low-resistivity cap bounding the geothermal system; and a deep high-resistivity (resistivity core) layer with values greater than 50 Ωm (Lichoro, 2009). The existence of a high-resistivity core indicates reservoir temperatures exceeding 250°C, which has been confirmed by drilled wells; this zone is probably dominated by pore fluid conduction or higher resistivity alteration mineralogy. Seismicity in the Olkaria area shows a change in seismic intensity at a depth of 4-5 km and might represent the brittle-ductile transition zone (Simiyu, 1999). More intense activity is noted at the centre of the Olkaria geothermal area where temperature is high, with smaller and shallower events. On the periphery and outside of the field, where drill holes show low temperature, events are larger and deeper. Outside of the geothermal field, earthquakes deepen to the northwest, north and northeast away from the geothermal system. Seismic gaps were mapped within the Olkaria fields (WPF and NEPF) and were found to mark zones of hot magmatic intrusions that have raised the temperatures above 450°C. Seismic events in the Olkaria Domes area are likely to be a continuation of the Olkaria Northeast field along a major NW-SE linear structure. This area is characterized by both shallow and deep events that have been interpreted as volcano-tectonic and tectonic events. The area along the Ol Njorowa gorge is characterized by high-frequency shallow events which are interpreted to be related to shallow lateral fluid movements (Simiyu et al., 1998). 3. OLKARIA DOMES PRODUCTION FIELD Olkaria Domes field lies to the east of the Olkaria East field (Figure 8). It is bound approximately by the Hell’s Gate National Park, Ol Njorowa gorge to the west and a ring of domes to the north and south (Mungania, 1999). Detailed surface exploration was conducted in the area in 1992/93, which led to the development of a basic working model, from which recommendations for the drilling of exploration wells were made.
FIGURE 7: Resistivity in the Domes area at 1000 m a.s.l. (Lichoro, 2009)
Ronoh 704 Report 29
Drilling in Olkaria Domes field began in 1998 with the first three exploration wells, namely OW-901, OW-902 and OW-903. The wells encountered a high-temperature system and they discharged on testing. Appraisal drilling began in 2007 with six deviated wells being drilled to a depth of about 2800 m. As of April 2012, thirty four (34) wells have been drilled in the Domes field and the data from these wells have aided in updating the conceptual model of the Greater Olkaria Geothermal Area. 4. BOREHOLE GEOLOGY 4.1 Drilling of well OW-912B Well OW-912B is located in the southeast part of the Olkaria Domes production field at 9898215.94 N, 204656.384 E, and at an elevation of 2072 m. It is a directional well drilled to a depth of 2998 m (926 m a.s.l.) in a N90°E direction. The well was drilled from 19th December, 2010 to 11th February, 2011 and the surface-, anchor- and production casings were set at 50.8, 293.3 and 846 m, respectively. The aim of drilling this well was to tap a resource at the foot of the ring structure so as to gather steam for the 140 MWe Olkaria IV power plant and to confirm the extent of the resource to the southeast of the Domes field. It was also aimed at confirming whether a resource exists to the east of well OW- 912 and southeast of well OW-916. The well was spudded on 19th December, 2010 and drilling was carried out in four phases (Figure 9).
FIGURE 8: Map of the Greater Olkaria geothermal area showing the Olkaria Domes field
Report 29 705 Ronoh
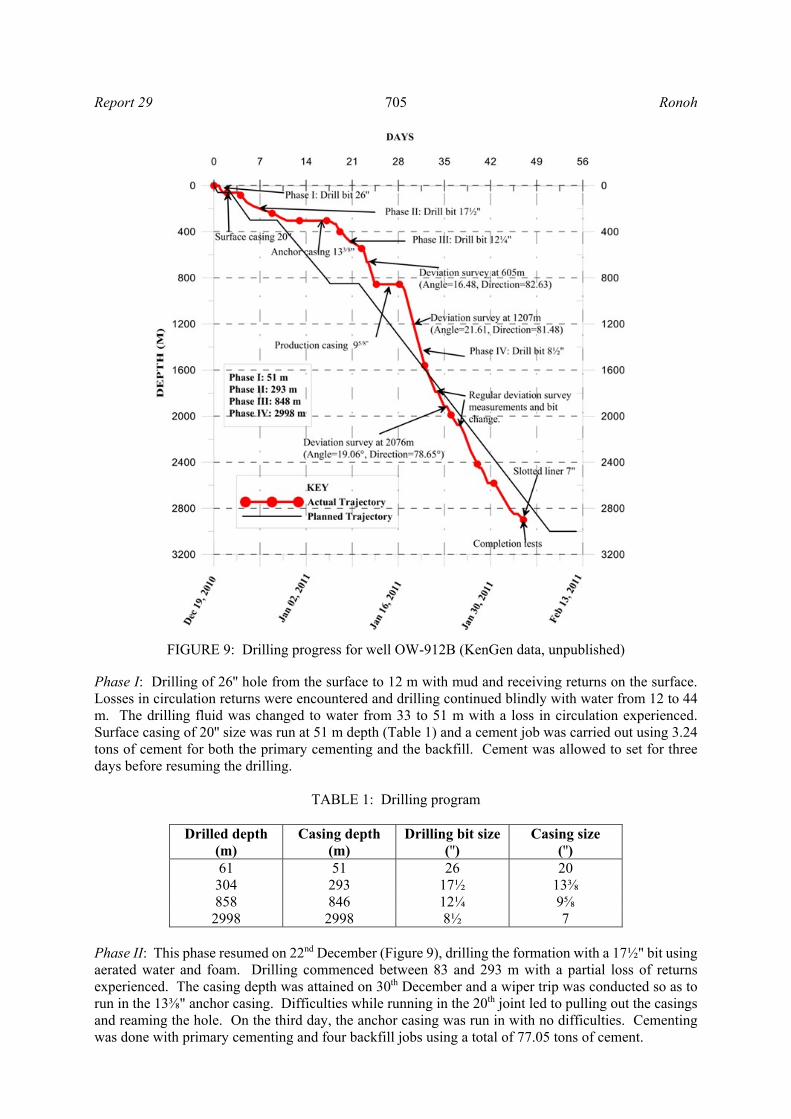
FIGURE 9: Drilling progress for well OW-912B (KenGen data, unpublished)
Phase I: Drilling of 26'' hole from the surface to 12 m with mud and receiving returns on the surface. Losses in circulation returns were encountered and drilling continued blindly with water from 12 to 44 m. The drilling fluid was changed to water from 33 to 51 m with a loss in circulation experienced. Surface casing of 20'' size was run at 51 m depth (Table 1) and a cement job was carried out using 3.24 tons of cement for both the primary cementing and the backfill. Cement was allowed to set for three days before resuming the drilling.
TABLE 1: Drilling program
Drilled depth (m)
Casing depth (m)
Drilling bit size ('')
Casing size ('')
61 51 26 20 304 293 17½ 13⅜ 858 846 12¼ 9⅝
2998 2998 8½ 7 Phase II: This phase resumed on 22nd December (Figure 9), drilling the formation with a 17½" bit using aerated water and foam. Drilling commenced between 83 and 293 m with a partial loss of returns experienced. The casing depth was attained on 30th December and a wiper trip was conducted so as to run in the 13⅜" anchor casing. Difficulties while running in the 20th joint led to pulling out the casings and reaming the hole. On the third day, the anchor casing was run in with no difficulties. Cementing was done with primary cementing and four backfill jobs using a total of 77.05 tons of cement.
Ronoh 706 Report 29
Phase III: Phase three began on January 5th, with water and foam using a 12¼" drill bit; no losses were encountered down to a depth of 400 m; then the drill string was pulled out of hole to run in an angle, build the Bottom Hole Assembly (BHA), and kick off (KOP at 400 m) with the rate of build at 3° per 30 m. A deviation survey was conducted to confirm the angle had been built while drilling with a mud motor to 846 m, with loss of circulation encountered at 652-666 m and at 700-716 m. Two stops were made to change the BHA and carry out a deviation survey. The 9⅝" production casing was set at 846 m; subsequently, 56.08 tons of cement were used for the cementing.
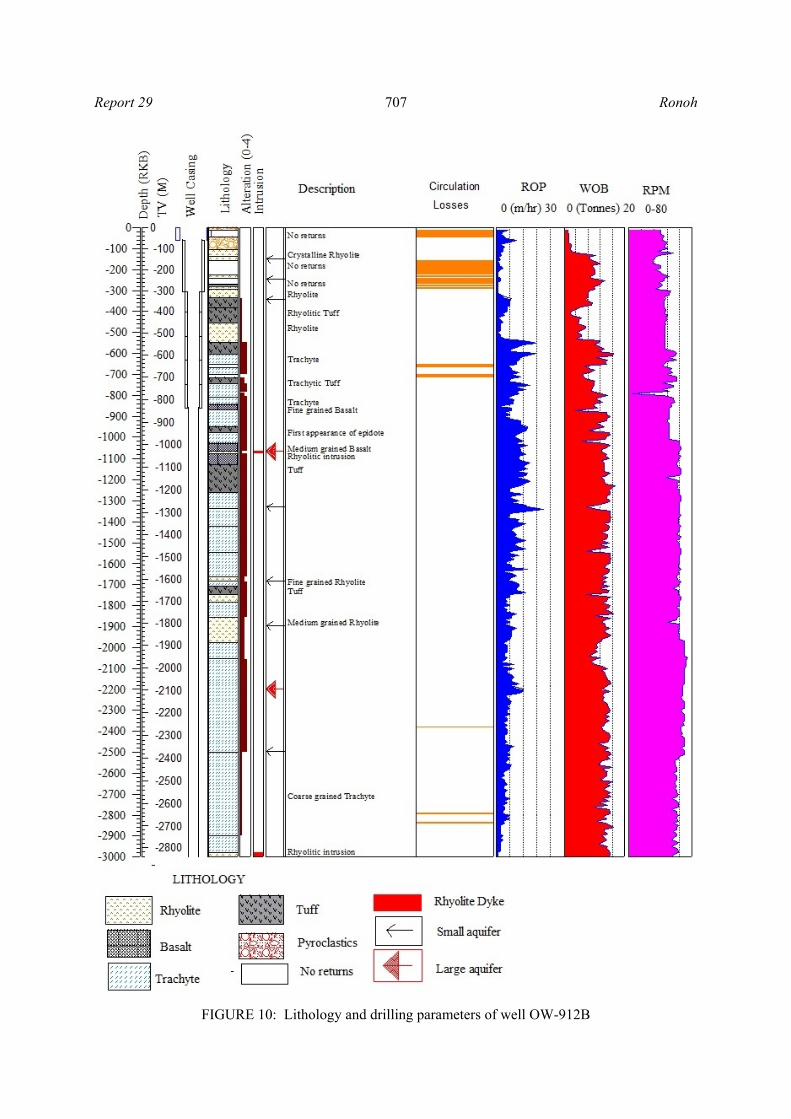
Phase IV: The drilling of the production phase kicked off on 16th January with the drilling of 8½" hole from 848 to 2998 m using aerated water and foam with partial loss of circulation between 2440-2444, 2786-2794 and 2836-2842 m. However, the minor losses could be related to the pipe connection during drilling. To control the development of the azimuth and inclination, drilling was regularly stopped for survey measurements. The lateral displacement was attained at a total depth of 800 m. Pulling out of the hole for a bit change was executed several times at depths below 2500 m due to hard formations. With a very low rate of penetration, drilling of the formation came to an end on February 10th. Reaming to clean the hole was performed before running in hole of the 7" slotted liners. Completion tests began on 12th February and, after two days, the master valve was installed. 4.2 Sampling and analytical methods Cutting samples from well OW-912B were taken at 2 m intervals with a few metres experiencing partial-to-total loss of circulation returns. An aerated drilling technique commenced early during drilling to ensure better sample collection and to avoid clogging of the production zones. Geosweeps were not carried out during the drilling operation since mixing of cuttings was not suspected. No cores were collected in this well; therefore, all the descriptions and interpretations are based on cutting samples. Four analytical methods were employed during sample analyses. These included: binocular microscope analysis, petrographic microscope analysis, X-Ray Diffractometer (XRD) analysis and fluid inclusion analysis. Binocular microscope was used in the initial analysis of rock cuttings to identify colour(s) of the cuttings, rock type(s), grain size, rock fabrics, alteration mineralogy and intensity, vein and vesicle infillings and lithological boundaries. Fifty samples were carefully selected for petrographic analyses. In thin sections, confirmation of the rock types, alteration minerals and alteration mineral sequences were observed. X-ray Diffractometer (XRD) analysis was used particularly to identify clay minerals. Twenty seven samples were selected for XRD analysis and the results are listed in Appendices I and II. A fluid inclusion analysis was done on two quartz crystals to determine the temperatures at which they were formed during crystallization (homogenization temperature, Th). 4.3 Lithology The lithology of well OW-912B (Figure 10) can be summarized as being both extrusive rocks and intrusions. The classification of the different lithologies was based on colour, texture and mineralogical composition. The following description of the rock formation is based on binocular observations aided by petrographic and XRD analyses. The quoted depths refer to the measured depths (MD) not the true vertical depths (TVD). The analyses were not corrected for the lag time. LogPlot from Rockware (2007) was used to present the lithological and mineralogical data. Pyroclastics (0-102 m) The pyroclastics form the uppermost parts of the well at 0-12 and 44-102 m below the surface. The formations are separated by a shallow loss zone. The matrix exhibits a reddish brown colour with abundant oxidation. It consists of unconsolidated material mainly soil, quartz and feldspars, obsidian glass, pumice and other lithic fragments. The deeper rock units show slight alteration to clays.
Report 29 707 Ronoh
FIGURE 10: Lithology and drilling parameters of well OW-912B
Ronoh 708 Report 29
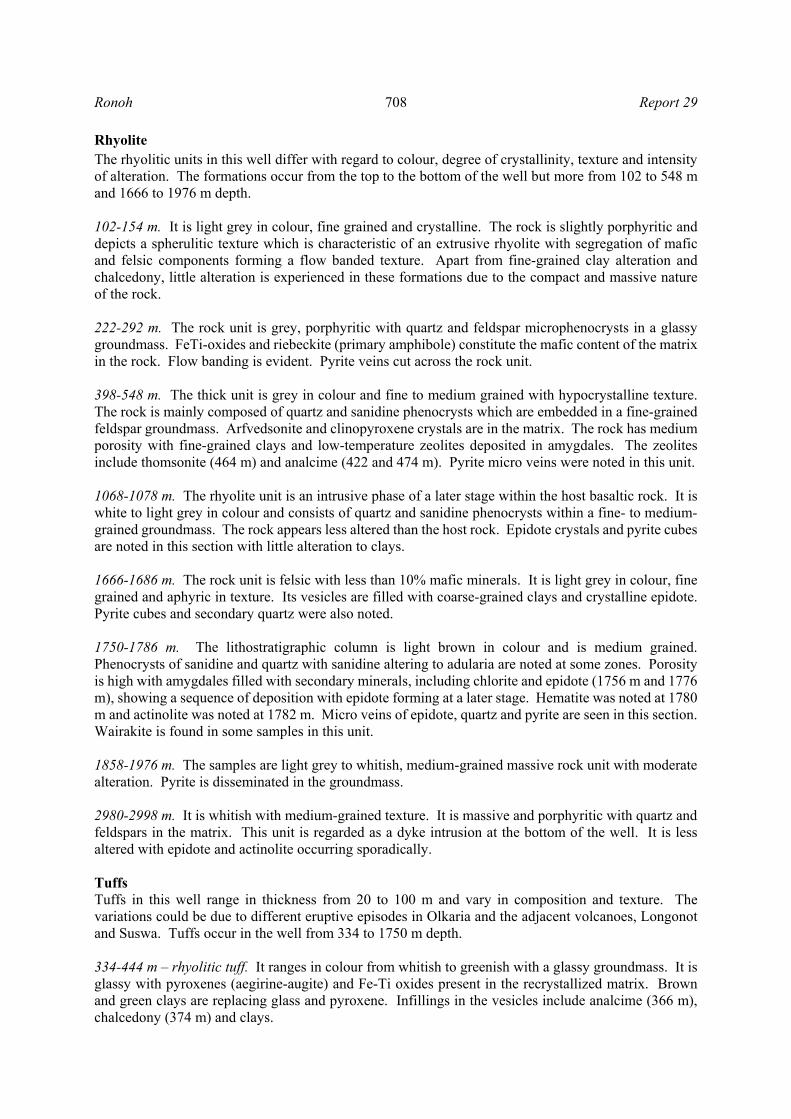
Rhyolite The rhyolitic units in this well differ with regard to colour, degree of crystallinity, texture and intensity of alteration. The formations occur from the top to the bottom of the well but more from 102 to 548 m and 1666 to 1976 m depth. 102-154 m. It is light grey in colour, fine grained and crystalline. The rock is slightly porphyritic and depicts a spherulitic texture which is characteristic of an extrusive rhyolite with segregation of mafic and felsic components forming a flow banded texture. Apart from fine-grained clay alteration and chalcedony, little alteration is experienced in these formations due to the compact and massive nature of the rock. 222-292 m. The rock unit is grey, porphyritic with quartz and feldspar microphenocrysts in a glassy groundmass. FeTi-oxides and riebeckite (primary amphibole) constitute the mafic content of the matrix in the rock. Flow banding is evident. Pyrite veins cut across the rock unit. 398-548 m. The thick unit is grey in colour and fine to medium grained with hypocrystalline texture. The rock is mainly composed of quartz and sanidine phenocrysts which are embedded in a fine-grained feldspar groundmass. Arfvedsonite and clinopyroxene crystals are in the matrix. The rock has medium porosity with fine-grained clays and low-temperature zeolites deposited in amygdales. The zeolites include thomsonite (464 m) and analcime (422 and 474 m). Pyrite micro veins were noted in this unit. 1068-1078 m. The rhyolite unit is an intrusive phase of a later stage within the host basaltic rock. It is white to light grey in colour and consists of quartz and sanidine phenocrysts within a fine- to medium-grained groundmass. The rock appears less altered than the host rock. Epidote crystals and pyrite cubes are noted in this section with little alteration to clays. 1666-1686 m. The rock unit is felsic with less than 10% mafic minerals. It is light grey in colour, fine grained and aphyric in texture. Its vesicles are filled with coarse-grained clays and crystalline epidote. Pyrite cubes and secondary quartz were also noted. 1750-1786 m. The lithostratigraphic column is light brown in colour and is medium grained. Phenocrysts of sanidine and quartz with sanidine altering to adularia are noted at some zones. Porosity is high with amygdales filled with secondary minerals, including chlorite and epidote (1756 m and 1776 m), showing a sequence of deposition with epidote forming at a later stage. Hematite was noted at 1780 m and actinolite was noted at 1782 m. Micro veins of epidote, quartz and pyrite are seen in this section. Wairakite is found in some samples in this unit. 1858-1976 m. The samples are light grey to whitish, medium-grained massive rock unit with moderate alteration. Pyrite is disseminated in the groundmass. 2980-2998 m. It is whitish with medium-grained texture. It is massive and porphyritic with quartz and feldspars in the matrix. This unit is regarded as a dyke intrusion at the bottom of the well. It is less altered with epidote and actinolite occurring sporadically. Tuffs Tuffs in this well range in thickness from 20 to 100 m and vary in composition and texture. The variations could be due to different eruptive episodes in Olkaria and the adjacent volcanoes, Longonot and Suswa. Tuffs occur in the well from 334 to 1750 m depth. 334-444 m – rhyolitic tuff. It ranges in colour from whitish to greenish with a glassy groundmass. It is glassy with pyroxenes (aegirine-augite) and Fe-Ti oxides present in the recrystallized matrix. Brown and green clays are replacing glass and pyroxene. Infillings in the vesicles include analcime (366 m), chalcedony (374 m) and clays.
Report 29 709 Ronoh
548-602 m – lithic tuff: The colour ranges from grey-bluish-greenish with lithics of glassy and trachytic components embedded in a fine-grained ashy groundmass. Minor pyrite and calcite veins and greenish clays are the only alteration minerals in this zone. 722-742 m – lithic tuff: This rock unit is heterogeneous with mixed scoraceous, trachytic and rhyolite fragments cemented in a fine-grained feldspar matrix. A replacement of chalcedony by quartz in veins is observed in the cuttings. Infillings of clays and pyrite are common and albite is evident in some samples. 950-980 m – trachytic tuff: Brown vitric tuff with feldspar material in an ashy matrix. The formation is highly altered. This marks the first appearance of epidote. 1130-1184 m – lithic tuff: This unit is light grey with fragments of basalt and trachyte noted in a glassy matrix. Pumiceous fragments are present but appear altered and bleached to white. Amygdales are filled by silica and coarse-grained clays. The formation shows moderate to high intensity of alteration. 1710-1750 m - trachytic tuff: Brown with tuffaceous groundmass with altered feldspar laths which are altered to green clays. Porosity is low due to silica infillings and tight micro veins with silica material are observed. The unit is highly altered. Basalt Few basaltic formations were penetrated in this well with colours ranging from dark grey to brownish. A fine-grained unit occurs at 842-866 m and depicts a holocrystalline groundmass composed of plagioclase, anhedral clinopyroxene and FeTi-oxide. Alteration of olivine gives it a reddish tinge but the plagioclase and pyroxene appear fresh. A medium-grained basaltic formation occurs at 1032-1130 m with a thin rhyolitic intrusion intruding the unit at 1068-1078 m. Plagioclase and pyroxene phenocrysts are altered to albite and clays, respectively. Trachyte Trachytes in the well occur from 604 m to the bottom depth, forming stratigraphic sequences with rhyolite, basalt and tuff. The units vary depending on colour, texture and intensity of alteration. 604-700 m. The stratigraphic unit is grey to brown in colour. It is fine- to medium-grained and consists of phenocrysts of feldspars and FeTi-oxide. Alteration of feldspars to albite and pyroxenes to clays is noted with abundant quartz micro veins in the unit. High intensity of alteration is indicated by the alteration minerals deposited. 742-842 m. The unit appears brecciated at the top with colours ranging from grey to green to light grey. It is fine grained with a feldspar rich groundmass. The rock is highly altered with vesicles which are partially filled with quartz, calcite and clays. Feldspar laths are highly altered. Chalcedony is replaced by quartz. 866-950 m. The formation is medium to coarse grained with phenocrysts of sanidine and aegirine-augite. The rock is light grey to light brown in colour and shows flow banding texture. Alteration of feldspars to coarse-grained clays and albite is common. 980-1032 m. The formation appears brecciated with mixed basaltic and trachytic fragments. It is light grey with quartz and feldspars in a fine-grained matrix. FeTi-oxide is embedded in the matrix and constitutes the mafic component of the rock. 1260-1336 m. The lithostratigraphic unit is light brown in colour with a medium-grained texture and porphyritic with sanidine and hornblende. Alteration intensity is high with feldspars and pyroxenes altered to clays. The first occurrence of wollastonite occurs at 1260 m and actinolite at 1276 m.
Ronoh 710 Report 29
1336-1438 m. It is brown to light brown, aphyric and medium-grained rock with relic flow texture. It is moderately altered with epidote and coarse-grained clays forming sequences in amygdales. Quartz veins are noted. 1438-1544 m. The formation is whitish to light grey with a fine-grained texture. Less alteration is recorded in this zone but minor clays and epidote were observed in the vesicles. A quartz vein was identified at 1452 m. 1544-1666 m. This unit has colour ranging from light brown to brown with a fine- to medium-grained groundmass. It is recrystallized with feldspars showing flow texture. It is weakly porphyritic with feldspar phenocrysts in the matrix. Pyrite is disseminated in the groundmass. Chalcedony and quartz veins are abundant, and epidote and prehnite were observed in the cutting. 1690-1710 m. It is a grey, fine-grained equi-granular rock with a high intensity of alteration. Feldspar laths depict flow texture. The alteration is marked by quartz veins, epidote, prehnite, albite, wollastonite and actinolite. 1800-1858 m. It is a brown, medium-grained rock unit with feldspar phenocrysts. The groundmass consists of stumpy tiny feldspar laths aligned in preferred directions, a characteristic of trachytic flow texture. This unit is highly altered and marked by epidote, albite and chlorite alteration minerals. 1976-2148 m Grey fine-grained lava, which is aphyric and appears recrystallized. It appears fractured and highly altered. High-temperature minerals characterize this unit. These include quartz, prehnite, epidote, wollastonite and actinolite. 2148-2500 m. The rock is fine grained, aphyric and light brown to brown in colour. Flow banding is evident and pyrite is disseminated in the groundmass. Moderate to high intensity of alteration is recorded with calcite replacing feldspar at 2312 m. 2500-2900 m. This thick lava sequence is fine to medium grained and massive. It is light grey to light brown with a low intensity of alteration. Feldspar phenocrysts are subjected to alteration with replacement by calcite noted at some depths. 2900-2980 m. It is whitish in colour and medium grained with sanidine phenocrysts and bluish riebeckite (amphibole) in the matrix. Low intensity of alteration in the rock is recorded while low rates of penetration were experienced during drilling due to the massive texture of the rock (Figure 10). 4.4 Intrusions Intrusions in this well occur at 1068-1078 m and from 2990 m to the bottom of the hole. They are rhyolitic in composition and are identified by their massive, tight and compact nature, hence less altered, as well as having a relatively coarser texture than the host rock. They also show oxidation where the heating effect has been prominent along their boundaries with the surrounding host rocks. As the intrusions were penetrated, changes in the drilling parameters occurred especially in the rate of penetration and rotations per minute (Figures 10). The thickness of the lowest intrusion is unknown as it is found right at the bottom of the well.
Report 29 711 Ronoh
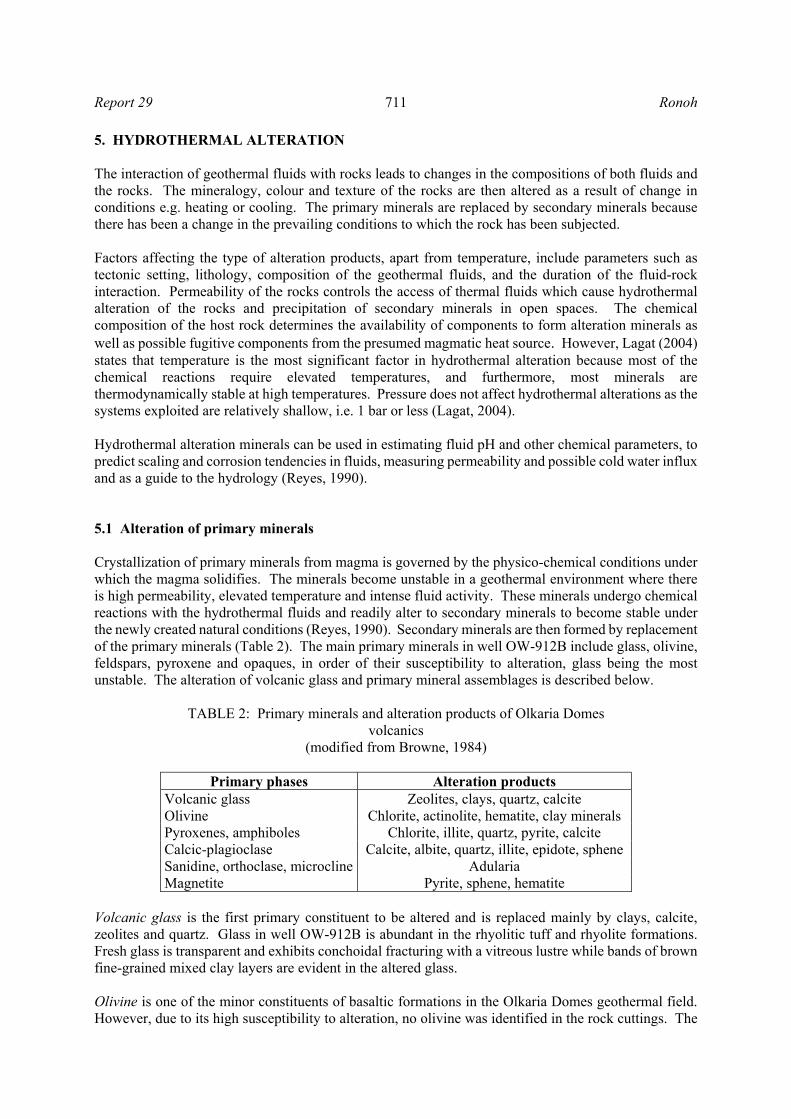
5. HYDROTHERMAL ALTERATION The interaction of geothermal fluids with rocks leads to changes in the compositions of both fluids and the rocks. The mineralogy, colour and texture of the rocks are then altered as a result of change in conditions e.g. heating or cooling. The primary minerals are replaced by secondary minerals because there has been a change in the prevailing conditions to which the rock has been subjected. Factors affecting the type of alteration products, apart from temperature, include parameters such as tectonic setting, lithology, composition of the geothermal fluids, and the duration of the fluid-rock interaction. Permeability of the rocks controls the access of thermal fluids which cause hydrothermal alteration of the rocks and precipitation of secondary minerals in open spaces. The chemical composition of the host rock determines the availability of components to form alteration minerals as well as possible fugitive components from the presumed magmatic heat source. However, Lagat (2004) states that temperature is the most significant factor in hydrothermal alteration because most of the chemical reactions require elevated temperatures, and furthermore, most minerals are thermodynamically stable at high temperatures. Pressure does not affect hydrothermal alterations as the systems exploited are relatively shallow, i.e. 1 bar or less (Lagat, 2004). Hydrothermal alteration minerals can be used in estimating fluid pH and other chemical parameters, to predict scaling and corrosion tendencies in fluids, measuring permeability and possible cold water influx and as a guide to the hydrology (Reyes, 1990). 5.1 Alteration of primary minerals Crystallization of primary minerals from magma is governed by the physico-chemical conditions under which the magma solidifies. The minerals become unstable in a geothermal environment where there is high permeability, elevated temperature and intense fluid activity. These minerals undergo chemical reactions with the hydrothermal fluids and readily alter to secondary minerals to become stable under the newly created natural conditions (Reyes, 1990). Secondary minerals are then formed by replacement of the primary minerals (Table 2). The main primary minerals in well OW-912B include glass, olivine, feldspars, pyroxene and opaques, in order of their susceptibility to alteration, glass being the most unstable. The alteration of volcanic glass and primary mineral assemblages is described below.
TABLE 2: Primary minerals and alteration products of Olkaria Domes volcanics
(modified from Browne, 1984)
Primary phases Alteration products Volcanic glass Zeolites, clays, quartz, calcite Olivine Chlorite, actinolite, hematite, clay minerals Pyroxenes, amphiboles Chlorite, illite, quartz, pyrite, calcite Calcic-plagioclase Calcite, albite, quartz, illite, epidote, sphene Sanidine, orthoclase, microcline Adularia Magnetite Pyrite, sphene, hematite
Volcanic glass is the first primary constituent to be altered and is replaced mainly by clays, calcite, zeolites and quartz. Glass in well OW-912B is abundant in the rhyolitic tuff and rhyolite formations. Fresh glass is transparent and exhibits conchoidal fracturing with a vitreous lustre while bands of brown fine-grained mixed clay layers are evident in the altered glass. Olivine is one of the minor constituents of basaltic formations in the Olkaria Domes geothermal field. However, due to its high susceptibility to alteration, no olivine was identified in the rock cuttings. The
Ronoh 712 Report 29
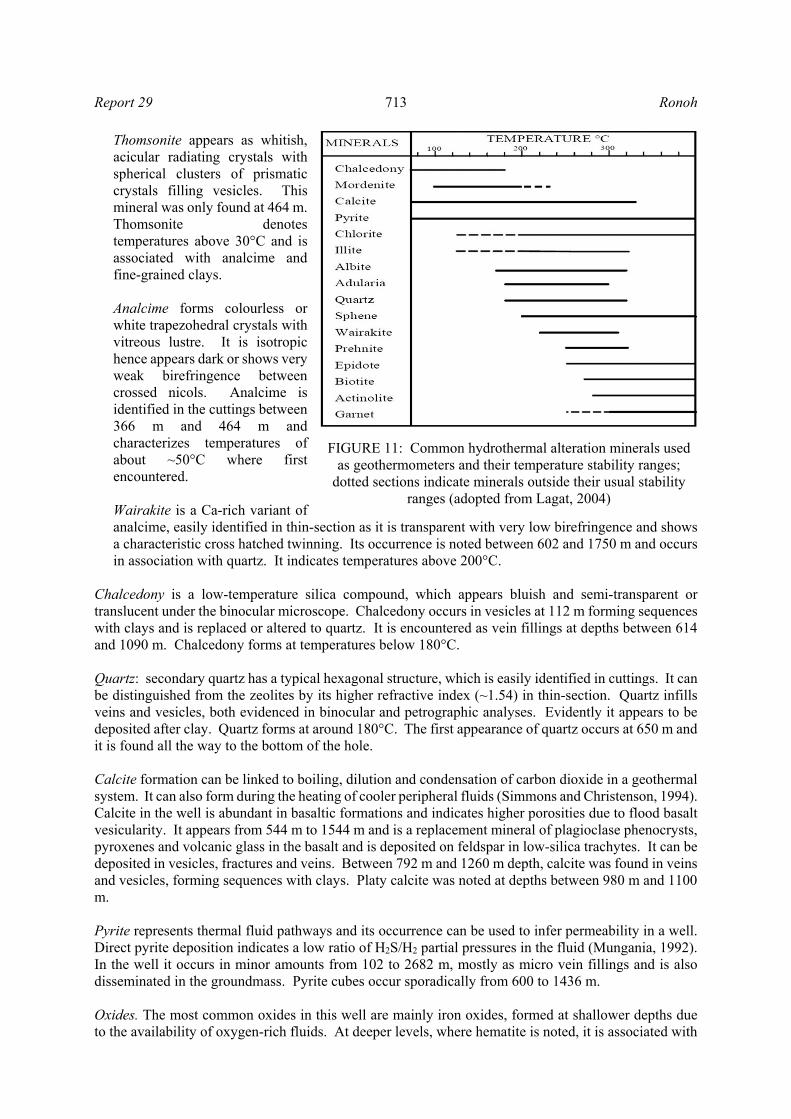
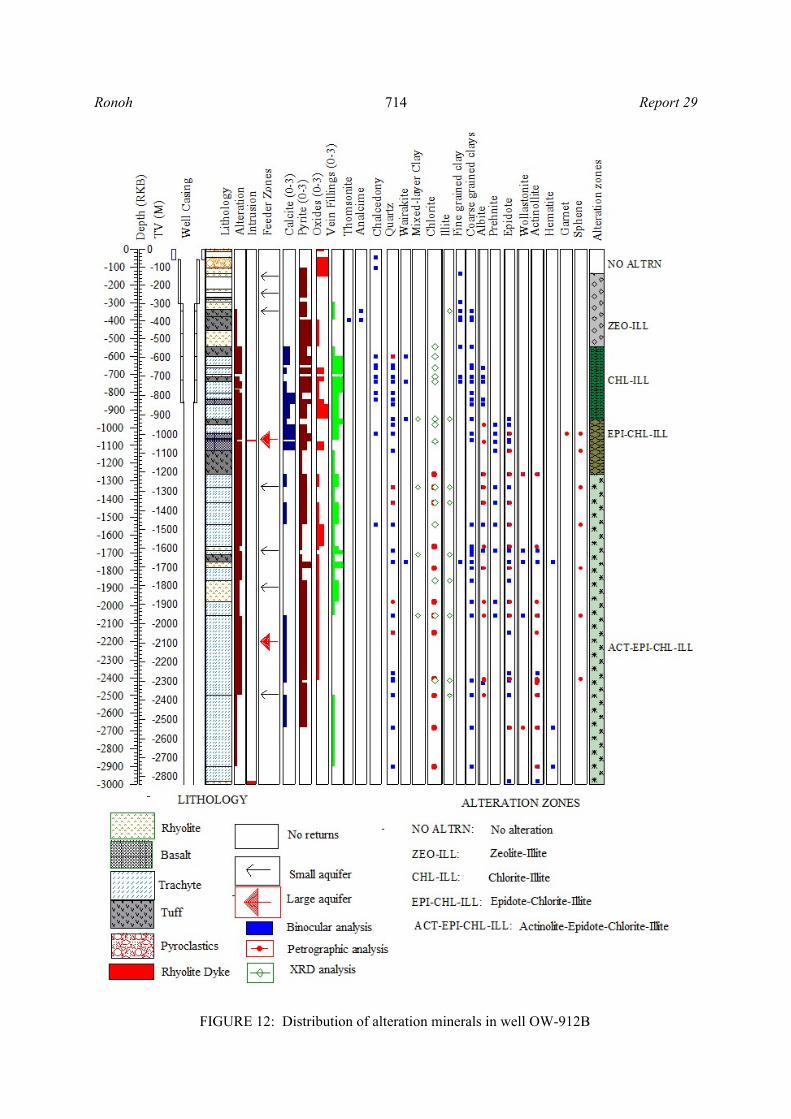
iron content in the olivine leads to the formation of hematite and reddish clays while chlorite and other green clays are formed with the presence of the magnesium constituent. Feldspars are the most abundant minerals found in most igneous rocks. Plagioclase is a major mineral in basalts while sanidine is a rock forming mineral in trachytes. Plagioclase appears almost like quartz except it is often milky white and has a characteristic brownish alteration. In crystalline rocks it is readily identified by its low relief and conspicuous polysynthetic twinning. Zoning is noted in most of the crystals. It also occurs as a fine groundmass in rocks exhibiting porphyritic textures. Plagioclase is more resistant to alteration than olivine and volcanic glass and starts to alter at relatively deep levels and may be only partially altered to albite, epidote and wairakite. Sanidine is white under binocular microscope and appears colourless in thin section. It has a low relief and weak birefringence and is distinguished from plagioclase by simple twinning. It alters to adularia. Pyroxene. The most dominant varieties present in most of the rock units encountered in well OW-912B are the clinopyroxenes. They occur in the groundmass but are most conspicuous as mafic phenocrysts varying from augite, aegirine to aegirine-augite. These pyroxenes can be identified by the presence of nearly right angle cleavage, inclined extinction and pleochroism of the sodium pyroxenes. Pyroxenes also show similar resistance to alteration as plagioclase and are mainly seen altering into clays and then actinolite at deeper levels below 2200 m depth. Amphiboles form the mafic component of most of the rocks in the well. It is identified in thin section by the perfect cleavage at angles of about 124° and by strong pleochroism. The most common amphiboles in well OW-912B are riebekite and arfvedsonite. Hornblende occurs at depth. In thin sections, riebekite is dark blue, arfvedsonite is brown and hornblende is brown in colour and pleochroic to green. Opaque minerals occur in minor amounts as part of the mafic component in the rocks. Magnetite is isotropic and thus appears opaque in transmitted light. It occurs as idiomorphic, disseminated or irregularly shaped aggregates within the groundmass. It is observed in the cuttings from 220 m and in thin section from 80 m. It appears to be altered to sphene between 1000 and 2054 m at depth. 5.2 Distribution of hydrothermal minerals Although hydrothermal alteration has changed the primary minerals in different ways and magnitude, often the original textures and minerals are still recognizable. The main hydrothermal minerals in the Olkaria Domes field are zeolites, fine- to coarse-grained clays, albite, actinolite, biotite, calcite, chlorite, chalcedony, epidote, prehnite, hematite, illite, adularia, secondary Fe-Ti oxides, pyrite, titanite (sphene) and quartz. In addition, minor amounts of wairakite, wollastonite and garnet are present. Mineral associations in vesicles are common and consist of two or more of the following minerals: illite, chlorite, quartz, calcite, epidote and pyrite with the paragenetic sequence varying with depth and temperature. Hydrothermal alteration is not a function of subsurface temperature only; the rock composition also influences the kinetics of the hydrothermal alteration mineral formation. The mineral stability ranges of the alteration minerals in most wells in the Olkaria field are found in Figure 11 and their distribution in well OW-912B is summarized in Figure 12. Zeolites are a group of authigenic minerals which precipitate extensively from alkaline to weakly acidic hot water in active geothermal areas. The zeolite assemblage and zone are principally controlled by temperature and the chemical composition of host rocks and subordinately by permeability, composition of geothermal fluids, and age of a geothermal area and host rocks (Lijima, 1980). Zeolites occurring in the well are described below.
Report 29 713 Ronoh
Thomsonite appears as whitish, acicular radiating crystals with spherical clusters of prismatic crystals filling vesicles. This mineral was only found at 464 m. Thomsonite denotes temperatures above 30°C and is associated with analcime and fine-grained clays. Analcime forms colourless or white trapezohedral crystals with vitreous lustre. It is isotropic hence appears dark or shows very weak birefringence between crossed nicols. Analcime is identified in the cuttings between 366 m and 464 m and characterizes temperatures of about ~50°C where first encountered. Wairakite is a Ca-rich variant of analcime, easily identified in thin-section as it is transparent with very low birefringence and shows a characteristic cross hatched twinning. Its occurrence is noted between 602 and 1750 m and occurs in association with quartz. It indicates temperatures above 200°C.
Chalcedony is a low-temperature silica compound, which appears bluish and semi-transparent or translucent under the binocular microscope. Chalcedony occurs in vesicles at 112 m forming sequences with clays and is replaced or altered to quartz. It is encountered as vein fillings at depths between 614 and 1090 m. Chalcedony forms at temperatures below 180°C. Quartz: secondary quartz has a typical hexagonal structure, which is easily identified in cuttings. It can be distinguished from the zeolites by its higher refractive index (~1.54) in thin-section. Quartz infills veins and vesicles, both evidenced in binocular and petrographic analyses. Evidently it appears to be deposited after clay. Quartz forms at around 180°C. The first appearance of quartz occurs at 650 m and it is found all the way to the bottom of the hole. Calcite formation can be linked to boiling, dilution and condensation of carbon dioxide in a geothermal system. It can also form during the heating of cooler peripheral fluids (Simmons and Christenson, 1994). Calcite in the well is abundant in basaltic formations and indicates higher porosities due to flood basalt vesicularity. It appears from 544 m to 1544 m and is a replacement mineral of plagioclase phenocrysts, pyroxenes and volcanic glass in the basalt and is deposited on feldspar in low-silica trachytes. It can be deposited in vesicles, fractures and veins. Between 792 m and 1260 m depth, calcite was found in veins and vesicles, forming sequences with clays. Platy calcite was noted at depths between 980 m and 1100 m. Pyrite represents thermal fluid pathways and its occurrence can be used to infer permeability in a well. Direct pyrite deposition indicates a low ratio of H2S/H2 partial pressures in the fluid (Mungania, 1992). In the well it occurs in minor amounts from 102 to 2682 m, mostly as micro vein fillings and is also disseminated in the groundmass. Pyrite cubes occur sporadically from 600 to 1436 m. Oxides. The most common oxides in this well are mainly iron oxides, formed at shallower depths due to the availability of oxygen-rich fluids. At deeper levels, where hematite is noted, it is associated with
FIGURE 11: Common hydrothermal alteration minerals used as geothermometers and their temperature stability ranges;
dotted sections indicate minerals outside their usual stability ranges (adopted from Lagat, 2004)
Ronoh 714 Report 29
FIGURE 12: Distribution of alteration minerals in well OW-912B
Report 29 715 Ronoh
baked contacts between dikes and colder host rocks. Chalcedony and quartz veins are aligned by a thin layer of oxides and a chilled margin. Oxidation becomes rare at depths below 2682 m. Titanite (sphene) is identified in a thin section at 1032 m by its characteristic brown colour under crossed nicols and its anhedral crystal shape. Titanite is an alteration product of opaque minerals and is associated with temperatures above 200°C (Figure 11). Adularia forms minute anhedral to euhedral crystals that are usually diamond shaped. It occurs as a replacement of plagioclase or primary K-feldspars and is occasionally deposited in veins as well as forming incrustations in fissured rocks. It is found replacing sanidine from 604 m depth. Albite. Albitization is the replacement of plagioclase phenocrysts by hydrothermal albite. It is whitish to grey, translucent, usually cloudy and with an equant anhedral to subhedral crystal shape. With increase in temperature, the polysynthethic twinning of plagioclase disappears and changes to cloudy as albite is formed. Albite is noted from 666 m to bottom and infers temperatures above 180°C. Prehnite is translucent, partly vitreous with an irregular or uneven fracture and one good and distinct cleavage. It occurs as rounded to nearly spherical in the binocular microscope and in thin section, it forms a radiating group of crystals with strong birefringence (high order interference colours) and a "bow-tie" structure. This feature, along with its transparent and non pleochroic nature is used to differentiate it from epidote, which shows yellow pleochroism. It is formed at temperatures above 240°C and is associated with epidote, wollastonite, chlorite and actinolite. This mineral was first noted under a binocular microscope at 866 m depth. Epidote shows a systematic textural development with increasing depth. First crystals are anhedral and form fine-grained aggregates, while in deeper zones they are idiomorphic, tabular, radiated or fibrous with a greenish to yellowish colour. Epidote fills fractures and vesicles, and occurs as a replacement of primary plagioclase and pyroxene. The first appearance of epidote was noted at 950 m where it formed mineral associations with mainly quartz, prehnite, wollastonite and actinolite. The occurrence of epidote indicates temperatures above 240°C. Wollastonite. In the cuttings, it appears as an aggregate of elongated fine radiating crystals with a typical white to grey colour. It is white to colourless in thin section with a low interference colour of first order grey. It was first observed at 1260 m and is associated with quartz, epidote, prehnite and actinolite. The first appearance of wollastonite marks a temperature of 270°C. Actinolite is an intermediate member between ferro-actinolite and tremolite series solid solution minerals of the amphibole group. It is variably green to grey-green in colour, depending on the amount of iron, silky to vitreous, occurring as radiating or fibrous and very compact or as thin, elongated laths like crystal aggregates. In thin section it is pale green to dark green showing pronounced pleochroism with moderate relief. The interference colours are dominated by green and brown depending on the iron and magnesium content. Actinolite is observed sporadically from 1276 m to bottom, and appears both as a replacement of clinopyroxenes and vesicle fillings, forming sequences with quartz and clays. It occurs in association with wollastonite and epidote and denotes temperatures of over 280°C. Garnet occurs as cubic minerals with orange red to brown colours and is found as subhedral crystal aggregates. In thin section, garnet has a moderately high relief, exhibits no cleavage and is isotropic. It was identified both under binocular analysis and in thin sections between 1046 m to 1068 m. The presence of garnet normally indicates temperatures of over 300°C (Bird et al., 1984). Clay minerals are water-rich phyllosilicates that form by hydrous alteration of primary silicate minerals and as precipitates and requires the presence of water in liquid and/or vapour form. The composition, structure and morphology of clay minerals depend on various factors including parent rock, temperature, fluid composition/amount, pH, etc. (Ahmed, 2008; Njue, 2010). These minerals occur in the well
Ronoh 716 Report 29
ranging from low-temperature smectites, occurring at shallower depths, to chlorite and illite deeper down at relatively higher temperature; hence, identifying the clays can also indicate temperature (Franzson, 1998). Clay minerals identified from X-ray diffraction, petrography and binocular microscope analysis are described below.
Fine-grained clays are fine layers of brown material, which appear to be replacing plagioclase and pyroxenes and also as infillings of vesicles at shallow depths down to 742 m. They are easily identified under the microscope and are mostly composed of mixed-layer clays. Coarse-grained clays are mostly characterized by chlorite and illite. They are identified from binocular and petrographic analysis, having edges which appear fibrous and more defined. In cases where the fine and coarse clays occur together, the latter overlay the former because they are formed later. These clays occur at 344 m to the bottom of the hole and are formed at higher temperatures than the fine-grained clay. Kaolinite is bright green to white in colour, replaces K-feldspar and occurs as a vein and vesicle filling mineral. It is identified from XRD analysis by 7.15 Å for the untreated and glycolated, and completely collapses after being heated to 550°C. It occurs in low intensity above 442 m. It is found with illite and chlorite clays between 672 and 696 m and is in the transitional zone to a higher temperature chlorite-illite zone. This could infer an earlier formation of kaolinite at this depth with chlorite and illite forming later. It can form at temperatures up to 200°C. Mixed layer clays are identified from XRD analysis from 962 to 2178 m depth with a high intensity of illite/chlorite mixtures. The peaks for the illite/chlorite clay mixture have an unchanged peak of 12.50Å for all runs. Chlorite forms green radiating, fibrous microscopic crystals or anhedral aggregates with a stacked structure. In thin section it is pale green, devoid of pleochroism, has perfect cleavage and low birefringence maximum interference colours of first order grey. It has XRD unchanged peaks of 14.50 and 7.28 Å for the untreated and glycolated and completely collapses after being heated to 550°C. Chlorite occurs below 548 m replacing mafic primary minerals and plagioclase, and predominantly filling vesicles forming a depositional sequence with a mixed layer component. It marks a minimum temperature of 200°C and occurs in association with quartz, epidote, prehnite, actinolite and wollastonite. Illite: is not easily identified in thin section and in cuttings but in XRD analysis it depicts no change in its peaks at 10 Å in the untreated, glycolated and when heated to 550°C. Illite is a replacement of K-feldspars and occurs as a vein and vesicle filling and is noted from 377 to 2616 m. It indicates temperatures of more than 200°C but can form at lower temperatures from 120°C (Figure 11).
5.3 Vein and vesicle fillings Deposition of alteration minerals in veins, vesicles and vugs depends on various factors such as porosity, permeability, temperature, fluid composition and the duration of the interactions (Browne, 1978). Tuffs and basalts in well OW-912B display an initial highly vesicular matrix but the open voids have been gradually filled with secondary minerals deposited at their respective precipitation temperatures and fluid composition. The first minerals precipitating and starting to fill the voids at 112 m include chalcedony and fine-grained clays. Zeolites (thomsonite and analcime), which form at temperatures below 120°C, form depositional sequences with fine-grained clays. These clays predominantly form as wall linings in vesicles. Calcite and pyrite infill vesicles under a wide range of temperatures and denote the intensity of permeability in the well. As temperature increases and hydrothermal alteration progresses, these minerals are altered to relatively high-temperature stable varieties as quartz, wairakite, chlorite, prehnite, epidote and actinolite. The vein fillings that could be identified under the binocular
Report 29 717 Ronoh
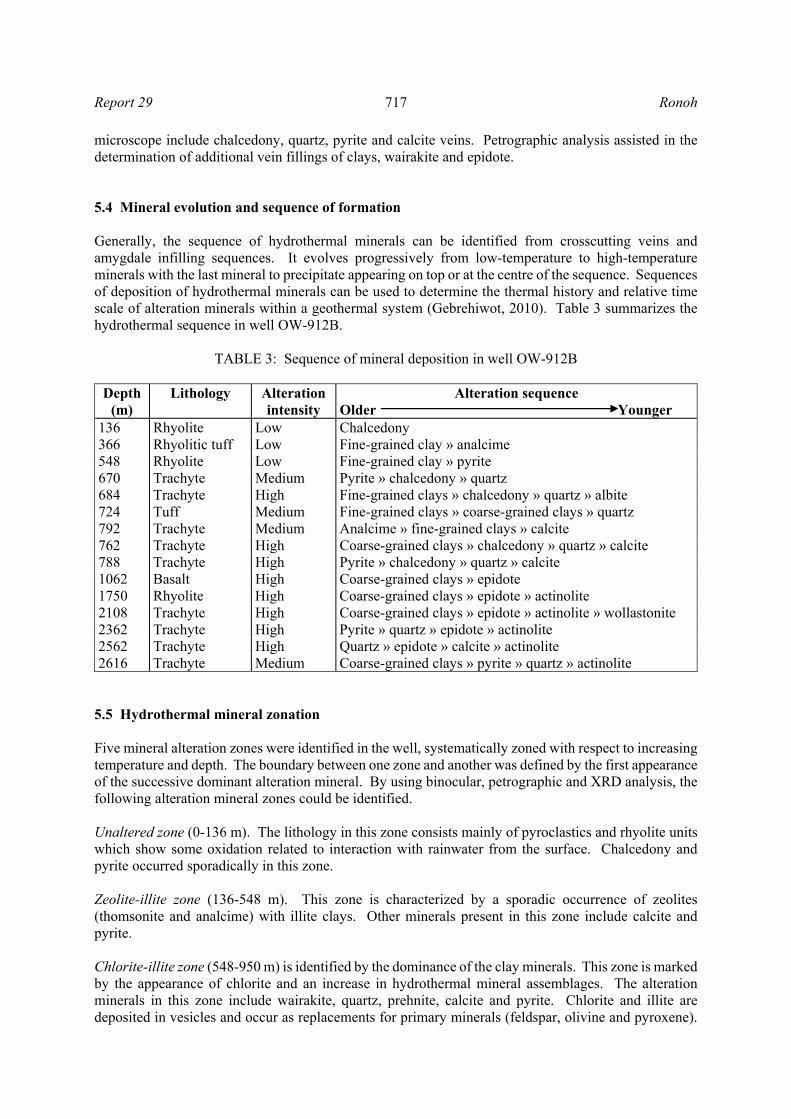
microscope include chalcedony, quartz, pyrite and calcite veins. Petrographic analysis assisted in the determination of additional vein fillings of clays, wairakite and epidote. 5.4 Mineral evolution and sequence of formation Generally, the sequence of hydrothermal minerals can be identified from crosscutting veins and amygdale infilling sequences. It evolves progressively from low-temperature to high-temperature minerals with the last mineral to precipitate appearing on top or at the centre of the sequence. Sequences of deposition of hydrothermal minerals can be used to determine the thermal history and relative time scale of alteration minerals within a geothermal system (Gebrehiwot, 2010). Table 3 summarizes the hydrothermal sequence in well OW-912B.
TABLE 3: Sequence of mineral deposition in well OW-912B
Depth (m)
Lithology Alteration intensity
Alteration sequence Older Younger
136 Rhyolite Low Chalcedony 366 Rhyolitic tuff Low Fine-grained clay » analcime 548 Rhyolite Low Fine-grained clay » pyrite 670 Trachyte Medium Pyrite » chalcedony » quartz 684 Trachyte High Fine-grained clays » chalcedony » quartz » albite 724 Tuff Medium Fine-grained clays » coarse-grained clays » quartz 792 Trachyte Medium Analcime » fine-grained clays » calcite 762 Trachyte High Coarse-grained clays » chalcedony » quartz » calcite 788 Trachyte High Pyrite » chalcedony » quartz » calcite 1062 Basalt High Coarse-grained clays » epidote 1750 Rhyolite High Coarse-grained clays » epidote » actinolite 2108 Trachyte High Coarse-grained clays » epidote » actinolite » wollastonite 2362 Trachyte High Pyrite » quartz » epidote » actinolite 2562 Trachyte High Quartz » epidote » calcite » actinolite 2616 Trachyte Medium Coarse-grained clays » pyrite » quartz » actinolite
5.5 Hydrothermal mineral zonation Five mineral alteration zones were identified in the well, systematically zoned with respect to increasing temperature and depth. The boundary between one zone and another was defined by the first appearance of the successive dominant alteration mineral. By using binocular, petrographic and XRD analysis, the following alteration mineral zones could be identified. Unaltered zone (0-136 m). The lithology in this zone consists mainly of pyroclastics and rhyolite units which show some oxidation related to interaction with rainwater from the surface. Chalcedony and pyrite occurred sporadically in this zone. Zeolite-illite zone (136-548 m). This zone is characterized by a sporadic occurrence of zeolites (thomsonite and analcime) with illite clays. Other minerals present in this zone include calcite and pyrite. Chlorite-illite zone (548-950 m) is identified by the dominance of the clay minerals. This zone is marked by the appearance of chlorite and an increase in hydrothermal mineral assemblages. The alteration minerals in this zone include wairakite, quartz, prehnite, calcite and pyrite. Chlorite and illite are deposited in vesicles and occur as replacements for primary minerals (feldspar, olivine and pyroxene).
Ronoh 718 Report 29
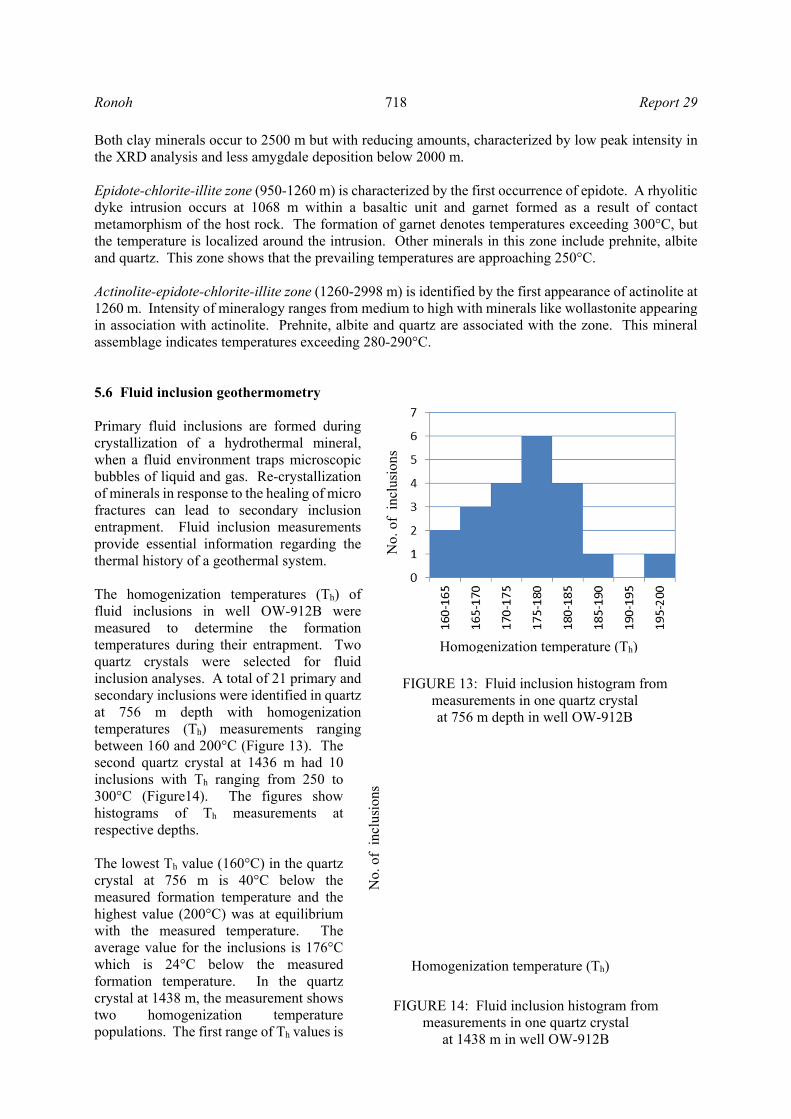
Both clay minerals occur to 2500 m but with reducing amounts, characterized by low peak intensity in the XRD analysis and less amygdale deposition below 2000 m. Epidote-chlorite-illite zone (950-1260 m) is characterized by the first occurrence of epidote. A rhyolitic dyke intrusion occurs at 1068 m within a basaltic unit and garnet formed as a result of contact metamorphism of the host rock. The formation of garnet denotes temperatures exceeding 300°C, but the temperature is localized around the intrusion. Other minerals in this zone include prehnite, albite and quartz. This zone shows that the prevailing temperatures are approaching 250°C. Actinolite-epidote-chlorite-illite zone (1260-2998 m) is identified by the first appearance of actinolite at 1260 m. Intensity of mineralogy ranges from medium to high with minerals like wollastonite appearing in association with actinolite. Prehnite, albite and quartz are associated with the zone. This mineral assemblage indicates temperatures exceeding 280-290°C. 5.6 Fluid inclusion geothermometry Primary fluid inclusions are formed during crystallization of a hydrothermal mineral, when a fluid environment traps microscopic bubbles of liquid and gas. Re-crystallization of minerals in response to the healing of micro fractures can lead to secondary inclusion entrapment. Fluid inclusion measurements provide essential information regarding the thermal history of a geothermal system. The homogenization temperatures (Th) of fluid inclusions in well OW-912B were measured to determine the formation temperatures during their entrapment. Two quartz crystals were selected for fluid inclusion analyses. A total of 21 primary and secondary inclusions were identified in quartz at 756 m depth with homogenization temperatures (Th) measurements ranging between 160 and 200°C (Figure 13). The second quartz crystal at 1436 m had 10 inclusions with Th ranging from 250 to 300°C (Figure14). The figures show histograms of Th measurements at respective depths. The lowest Th value (160°C) in the quartz crystal at 756 m is 40°C below the measured formation temperature and the highest value (200°C) was at equilibrium with the measured temperature. The average value for the inclusions is 176°C which is 24°C below the measured formation temperature. In the quartz crystal at 1438 m, the measurement shows two homogenization temperature populations. The first range of Th values is
FIGURE 13: Fluid inclusion histogram from
measurements in one quartz crystal at 756 m depth in well OW-912B
FIGURE 14: Fluid inclusion histogram from measurements in one quartz crystal
at 1438 m in well OW-912B
No.
of
incl
usio
ns
Homogenization temperature (Th)
No.
of
incl
usio
ns
Homogenization temperature (Th)
Report 29 719 Ronoh
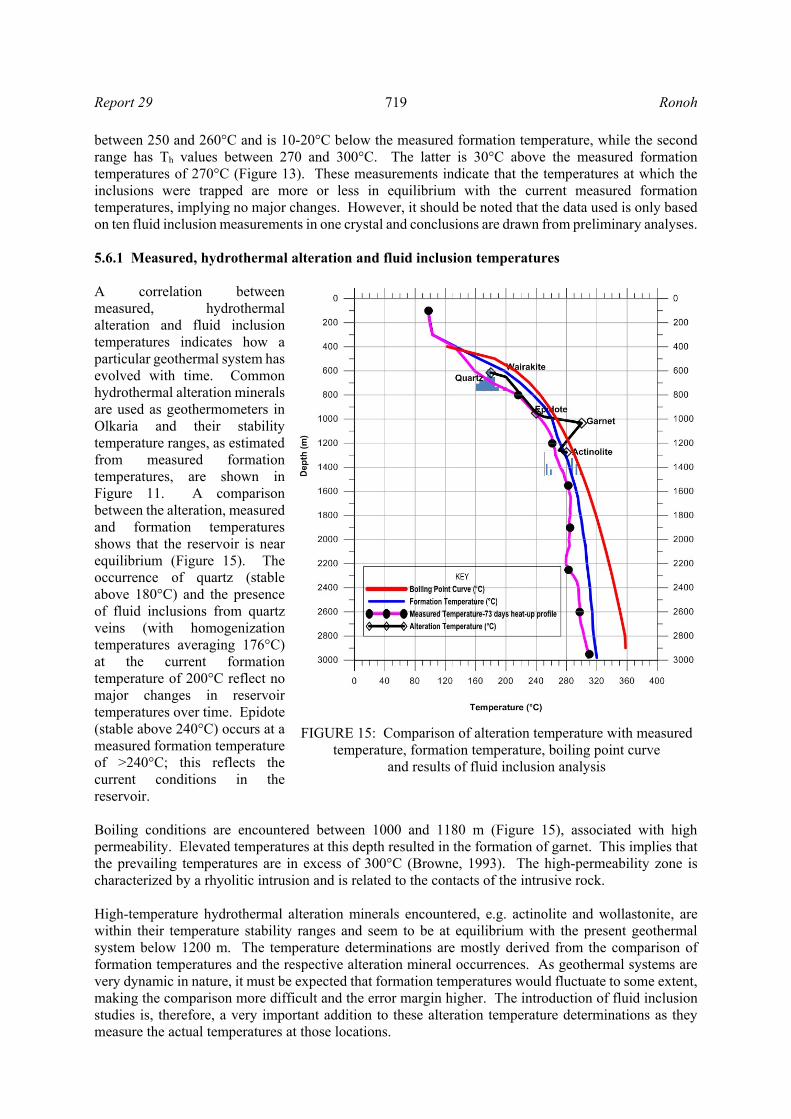
between 250 and 260°C and is 10-20°C below the measured formation temperature, while the second range has Th values between 270 and 300°C. The latter is 30°C above the measured formation temperatures of 270°C (Figure 13). These measurements indicate that the temperatures at which the inclusions were trapped are more or less in equilibrium with the current measured formation temperatures, implying no major changes. However, it should be noted that the data used is only based on ten fluid inclusion measurements in one crystal and conclusions are drawn from preliminary analyses. 5.6.1 Measured, hydrothermal alteration and fluid inclusion temperatures A correlation between measured, hydrothermal alteration and fluid inclusion temperatures indicates how a particular geothermal system has evolved with time. Common hydrothermal alteration minerals are used as geothermometers in Olkaria and their stability temperature ranges, as estimated from measured formation temperatures, are shown in Figure 11. A comparison between the alteration, measured and formation temperatures shows that the reservoir is near equilibrium (Figure 15). The occurrence of quartz (stable above 180°C) and the presence of fluid inclusions from quartz veins (with homogenization temperatures averaging 176°C) at the current formation temperature of 200°C reflect no major changes in reservoir temperatures over time. Epidote (stable above 240°C) occurs at a measured formation temperature of >240°C; this reflects the current conditions in the reservoir. Boiling conditions are encountered between 1000 and 1180 m (Figure 15), associated with high permeability. Elevated temperatures at this depth resulted in the formation of garnet. This implies that the prevailing temperatures are in excess of 300°C (Browne, 1993). The high-permeability zone is characterized by a rhyolitic intrusion and is related to the contacts of the intrusive rock. High-temperature hydrothermal alteration minerals encountered, e.g. actinolite and wollastonite, are within their temperature stability ranges and seem to be at equilibrium with the present geothermal system below 1200 m. The temperature determinations are mostly derived from the comparison of formation temperatures and the respective alteration mineral occurrences. As geothermal systems are very dynamic in nature, it must be expected that formation temperatures would fluctuate to some extent, making the comparison more difficult and the error margin higher. The introduction of fluid inclusion studies is, therefore, a very important addition to these alteration temperature determinations as they measure the actual temperatures at those locations.
FIGURE 15: Comparison of alteration temperature with measured temperature, formation temperature, boiling point curve
and results of fluid inclusion analysis
Ronoh 720 Report 29
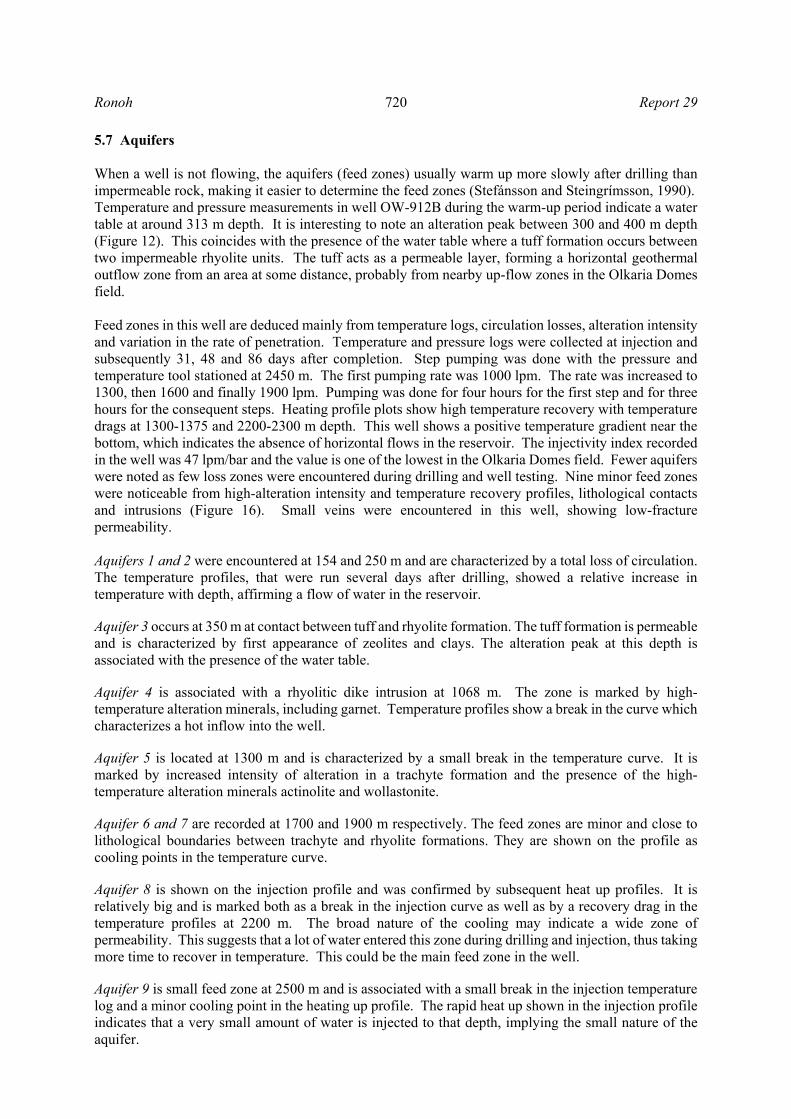
5.7 Aquifers When a well is not flowing, the aquifers (feed zones) usually warm up more slowly after drilling than impermeable rock, making it easier to determine the feed zones (Stefánsson and Steingrímsson, 1990). Temperature and pressure measurements in well OW-912B during the warm-up period indicate a water table at around 313 m depth. It is interesting to note an alteration peak between 300 and 400 m depth (Figure 12). This coincides with the presence of the water table where a tuff formation occurs between two impermeable rhyolite units. The tuff acts as a permeable layer, forming a horizontal geothermal outflow zone from an area at some distance, probably from nearby up-flow zones in the Olkaria Domes field. Feed zones in this well are deduced mainly from temperature logs, circulation losses, alteration intensity and variation in the rate of penetration. Temperature and pressure logs were collected at injection and subsequently 31, 48 and 86 days after completion. Step pumping was done with the pressure and temperature tool stationed at 2450 m. The first pumping rate was 1000 lpm. The rate was increased to 1300, then 1600 and finally 1900 lpm. Pumping was done for four hours for the first step and for three hours for the consequent steps. Heating profile plots show high temperature recovery with temperature drags at 1300-1375 and 2200-2300 m depth. This well shows a positive temperature gradient near the bottom, which indicates the absence of horizontal flows in the reservoir. The injectivity index recorded in the well was 47 lpm/bar and the value is one of the lowest in the Olkaria Domes field. Fewer aquifers were noted as few loss zones were encountered during drilling and well testing. Nine minor feed zones were noticeable from high-alteration intensity and temperature recovery profiles, lithological contacts and intrusions (Figure 16). Small veins were encountered in this well, showing low-fracture permeability. Aquifers 1 and 2 were encountered at 154 and 250 m and are characterized by a total loss of circulation. The temperature profiles, that were run several days after drilling, showed a relative increase in temperature with depth, affirming a flow of water in the reservoir. Aquifer 3 occurs at 350 m at contact between tuff and rhyolite formation. The tuff formation is permeable and is characterized by first appearance of zeolites and clays. The alteration peak at this depth is associated with the presence of the water table. Aquifer 4 is associated with a rhyolitic dike intrusion at 1068 m. The zone is marked by high-temperature alteration minerals, including garnet. Temperature profiles show a break in the curve which characterizes a hot inflow into the well. Aquifer 5 is located at 1300 m and is characterized by a small break in the temperature curve. It is marked by increased intensity of alteration in a trachyte formation and the presence of the high-temperature alteration minerals actinolite and wollastonite. Aquifer 6 and 7 are recorded at 1700 and 1900 m respectively. The feed zones are minor and close to lithological boundaries between trachyte and rhyolite formations. They are shown on the profile as cooling points in the temperature curve. Aquifer 8 is shown on the injection profile and was confirmed by subsequent heat up profiles. It is relatively big and is marked both as a break in the injection curve as well as by a recovery drag in the temperature profiles at 2200 m. The broad nature of the cooling may indicate a wide zone of permeability. This suggests that a lot of water entered this zone during drilling and injection, thus taking more time to recover in temperature. This could be the main feed zone in the well. Aquifer 9 is small feed zone at 2500 m and is associated with a small break in the injection temperature log and a minor cooling point in the heating up profile. The rapid heat up shown in the injection profile indicates that a very small amount of water is injected to that depth, implying the small nature of the aquifer.
Report 29 721 Ronoh
FIGURE 16: Temperature profiles with feed zones in well OW-912B
Ronoh 722 Report 29
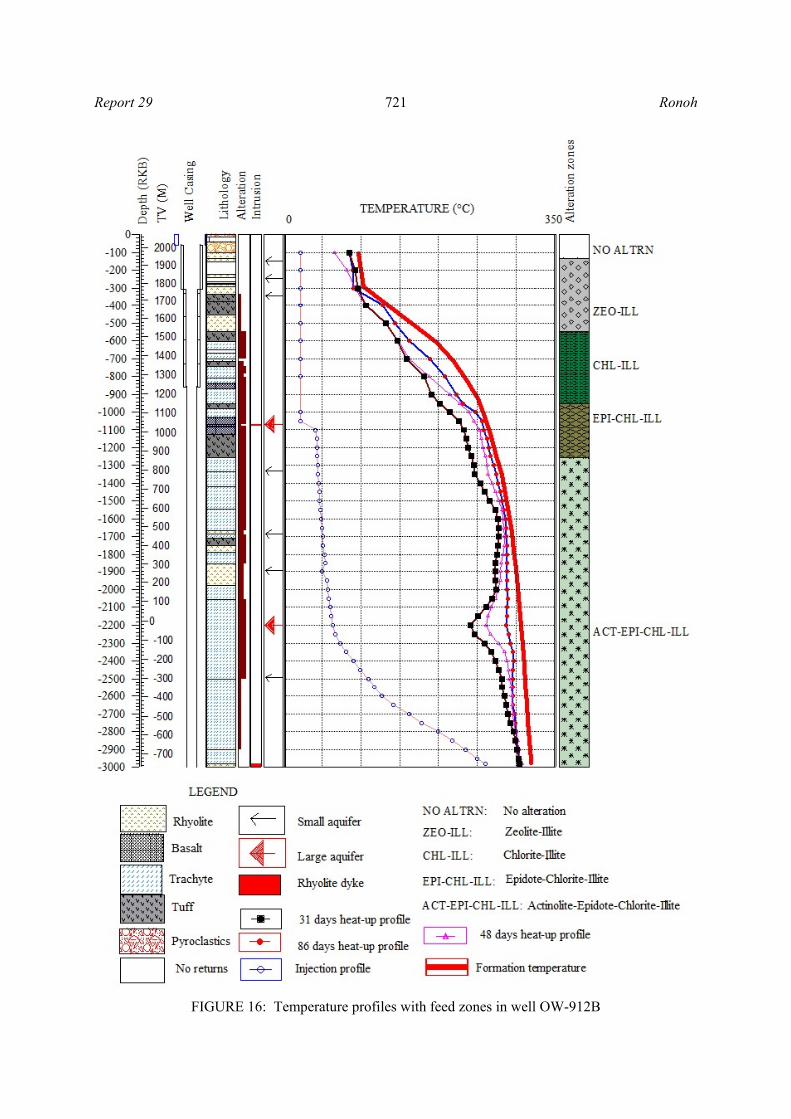
6. GEOLOGICAL CROSS-SECTION ACROSS THE OLKARIA DOMES WELLS Hydrothermal alteration minerals can be used to observe changes in the reservoir. Temperature dependent minerals are viable when determining the entrance to the reservoir and the production casing depths. The alteration intensity is a quantity of fluid flow through the rock. Therefore, it is an indication of porosity/permeability. Isograds give a general picture of the temperature distribution in a geothermal system as they delineate the first appearance of an index mineral. However, a definite isograd (e.g. the epidote isograd) does not necessarily represent a definite temperature. The distribution of hydrothermal mineral isograds may not be distinctly parallel to the isothermal contours, indicating that some thermal changes could have taken place in a geothermal reservoir over time. An attempt was made to compare
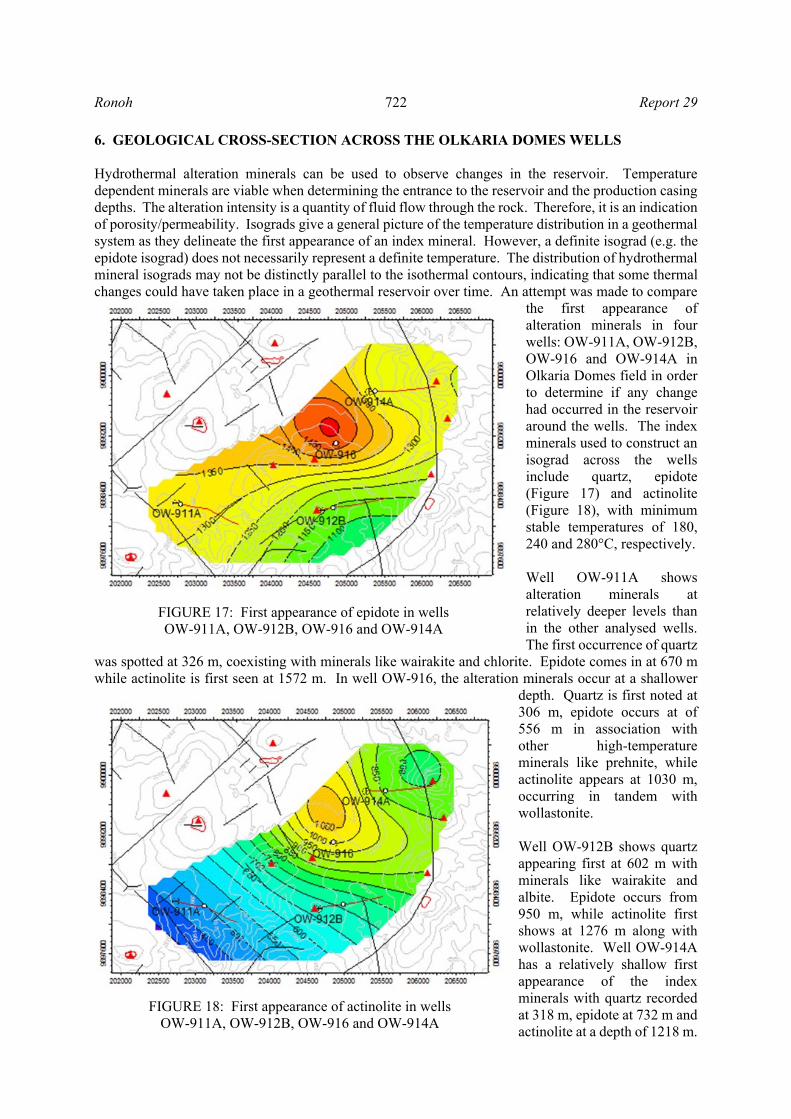
the first appearance of alteration minerals in four wells: OW-911A, OW-912B, OW-916 and OW-914A in Olkaria Domes field in order to determine if any change had occurred in the reservoir around the wells. The index minerals used to construct an isograd across the wells include quartz, epidote (Figure 17) and actinolite (Figure 18), with minimum stable temperatures of 180, 240 and 280°C, respectively. Well OW-911A shows alteration minerals at relatively deeper levels than in the other analysed wells. The first occurrence of quartz
was spotted at 326 m, coexisting with minerals like wairakite and chlorite. Epidote comes in at 670 m while actinolite is first seen at 1572 m. In well OW-916, the alteration minerals occur at a shallower
depth. Quartz is first noted at 306 m, epidote occurs at of 556 m in association with other high-temperature minerals like prehnite, while actinolite appears at 1030 m, occurring in tandem with wollastonite. Well OW-912B shows quartz appearing first at 602 m with minerals like wairakite and albite. Epidote occurs from 950 m, while actinolite first shows at 1276 m along with wollastonite. Well OW-914A has a relatively shallow first appearance of the index minerals with quartz recorded at 318 m, epidote at 732 m and actinolite at a depth of 1218 m.
FIGURE 17: First appearance of epidote in wells OW-911A, OW-912B, OW-916 and OW-914A
FIGURE 18: First appearance of actinolite in wells OW-911A, OW-912B, OW-916 and OW-914A
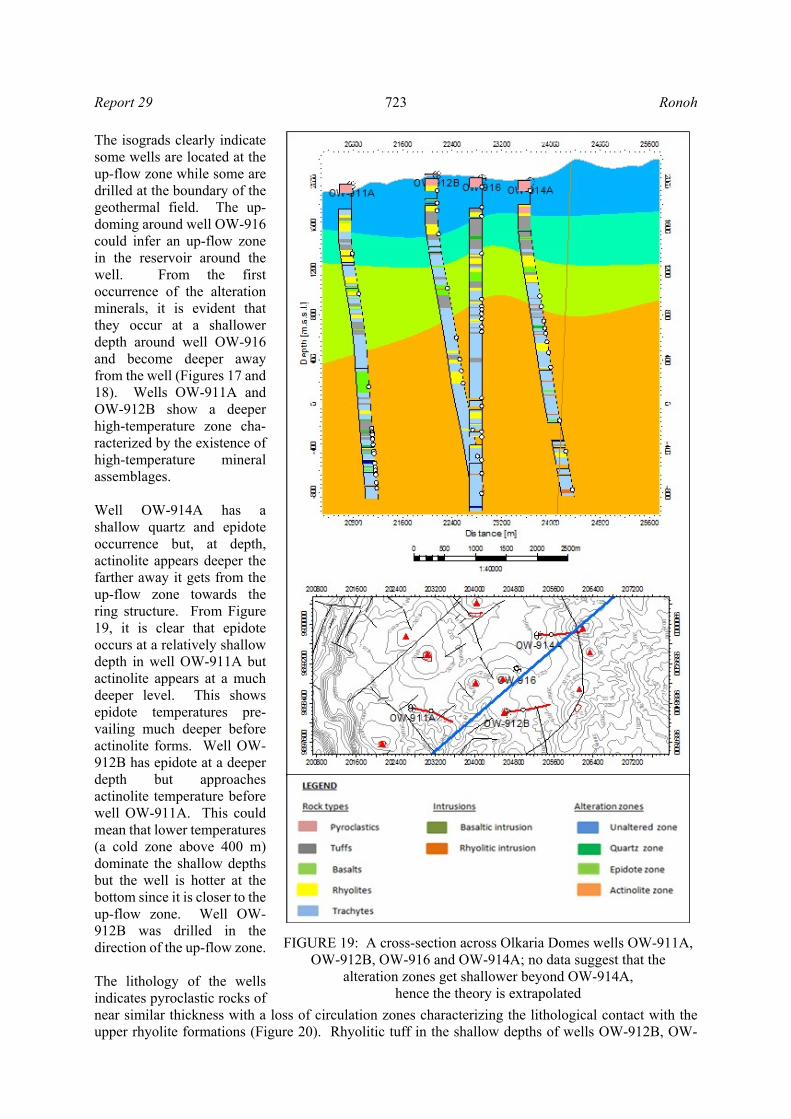
Report 29 723 Ronoh
The isograds clearly indicate some wells are located at the up-flow zone while some are drilled at the boundary of the geothermal field. The up-doming around well OW-916 could infer an up-flow zone in the reservoir around the well. From the first occurrence of the alteration minerals, it is evident that they occur at a shallower depth around well OW-916 and become deeper away from the well (Figures 17 and 18). Wells OW-911A and OW-912B show a deeper high-temperature zone cha-racterized by the existence of high-temperature mineral assemblages. Well OW-914A has a shallow quartz and epidote occurrence but, at depth, actinolite appears deeper the farther away it gets from the up-flow zone towards the ring structure. From Figure 19, it is clear that epidote occurs at a relatively shallow depth in well OW-911A but actinolite appears at a much deeper level. This shows epidote temperatures pre-vailing much deeper before actinolite forms. Well OW-912B has epidote at a deeper depth but approaches actinolite temperature before well OW-911A. This could mean that lower temperatures (a cold zone above 400 m) dominate the shallow depths but the well is hotter at the bottom since it is closer to the up-flow zone. Well OW-912B was drilled in the direction of the up-flow zone. The lithology of the wells indicates pyroclastic rocks of near similar thickness with a loss of circulation zones characterizing the lithological contact with the upper rhyolite formations (Figure 20). Rhyolitic tuff in the shallow depths of wells OW-912B, OW-
FIGURE 19: A cross-section across Olkaria Domes wells OW-911A, OW-912B, OW-916 and OW-914A; no data suggest that the
alteration zones get shallower beyond OW-914A, hence the theory is extrapolated
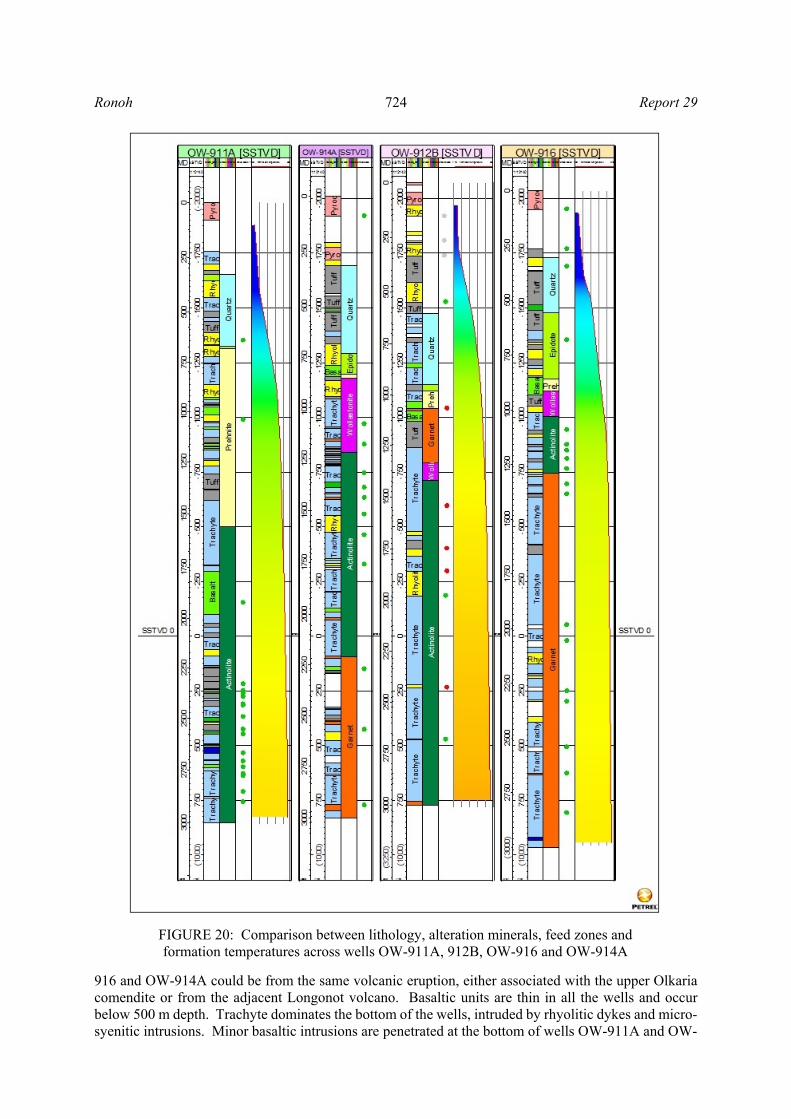
Ronoh 724 Report 29
916 and OW-914A could be from the same volcanic eruption, either associated with the upper Olkaria comendite or from the adjacent Longonot volcano. Basaltic units are thin in all the wells and occur below 500 m depth. Trachyte dominates the bottom of the wells, intruded by rhyolitic dykes and micro-syenitic intrusions. Minor basaltic intrusions are penetrated at the bottom of wells OW-911A and OW-
FIGURE 20: Comparison between lithology, alteration minerals, feed zones and formation temperatures across wells OW-911A, 912B, OW-916 and OW-914A
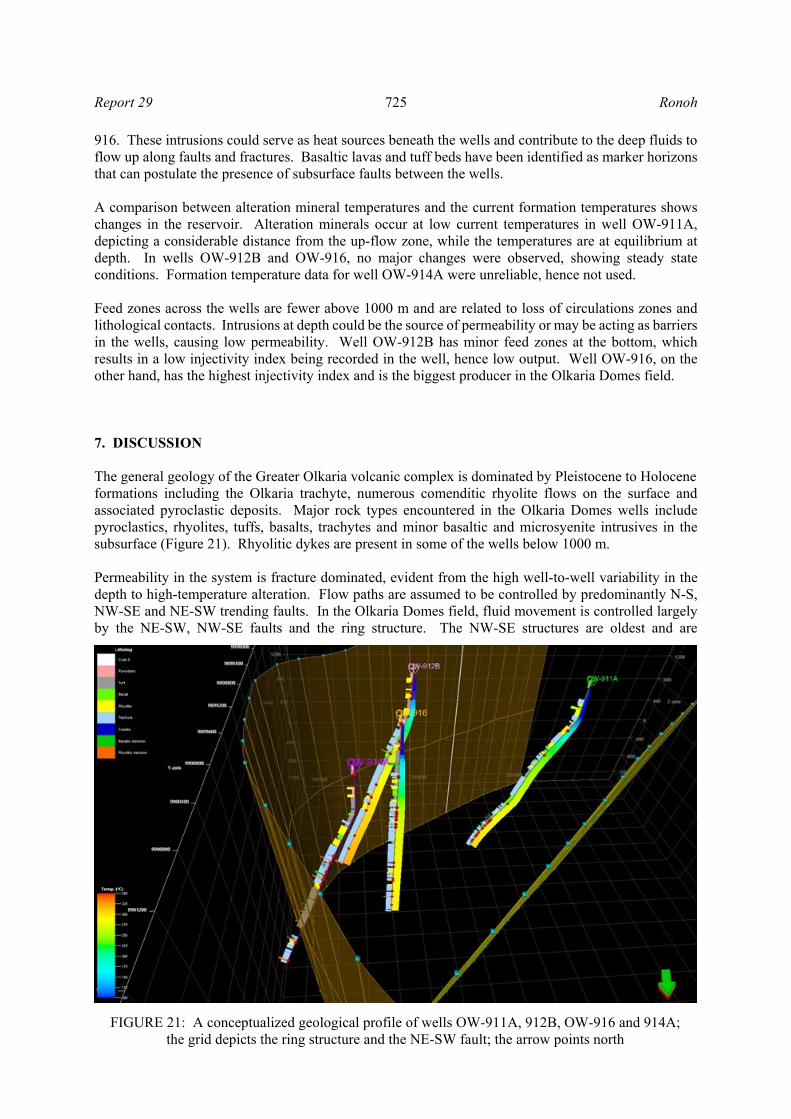
Report 29 725 Ronoh
916. These intrusions could serve as heat sources beneath the wells and contribute to the deep fluids to flow up along faults and fractures. Basaltic lavas and tuff beds have been identified as marker horizons that can postulate the presence of subsurface faults between the wells. A comparison between alteration mineral temperatures and the current formation temperatures shows changes in the reservoir. Alteration minerals occur at low current temperatures in well OW-911A, depicting a considerable distance from the up-flow zone, while the temperatures are at equilibrium at depth. In wells OW-912B and OW-916, no major changes were observed, showing steady state conditions. Formation temperature data for well OW-914A were unreliable, hence not used. Feed zones across the wells are fewer above 1000 m and are related to loss of circulations zones and lithological contacts. Intrusions at depth could be the source of permeability or may be acting as barriers in the wells, causing low permeability. Well OW-912B has minor feed zones at the bottom, which results in a low injectivity index being recorded in the well, hence low output. Well OW-916, on the other hand, has the highest injectivity index and is the biggest producer in the Olkaria Domes field. 7. DISCUSSION The general geology of the Greater Olkaria volcanic complex is dominated by Pleistocene to Holocene formations including the Olkaria trachyte, numerous comenditic rhyolite flows on the surface and associated pyroclastic deposits. Major rock types encountered in the Olkaria Domes wells include pyroclastics, rhyolites, tuffs, basalts, trachytes and minor basaltic and microsyenite intrusives in the subsurface (Figure 21). Rhyolitic dykes are present in some of the wells below 1000 m. Permeability in the system is fracture dominated, evident from the high well-to-well variability in the depth to high-temperature alteration. Flow paths are assumed to be controlled by predominantly N-S, NW-SE and NE-SW trending faults. In the Olkaria Domes field, fluid movement is controlled largely by the NE-SW, NW-SE faults and the ring structure. The NW-SE structures are oldest and are
FIGURE 21: A conceptualized geological profile of wells OW-911A, 912B, OW-916 and 914A; the grid depicts the ring structure and the NE-SW fault; the arrow points north
Ronoh 726 Report 29
associated with the formation of the rift. They control the deep and shallow movement of geothermal fluid (West-JEC, 2009). The NE-SW faults are probably shallow and are among those structures intersected at shallow levels in the drilled wells in the Domes field. The ring structure is intersected by well OW-914A at 2270 m depth and is marked by a major loss of circulation (Figure 21). Hydrothermal minerals in well OW-912B are mainly deposited in veinlets, vugs and as replacements of primary minerals. The amount of calcite and pyrite is abundant above 1100 m depth and these minerals infill veins and vesicles, inferring high permeability and porosity of the rocks. However, their occurrence is sporadic at the bottom. The system progressively evolves to form high-temperature minerals like epidote at 950 m, garnet at 1048 m, wollastonite at 1260 m and actinolite at 1276 m depth. Four hydrothermal mineral zonations were recognized. In order of increasing depth, they are: (1) the zeolite-illite zone, (2) the chlorite-illite zone, (3) the epidote-chlorite-illite zone, and (4) the actinolite-epidote-chlorite-illite zone. The upper 136 m are unaltered. The occurrence of garnet at 1048 m depicts temperatures approaching 300°C (Browne, 1993). This could be associated with the rhyolitic intrusion at 1068 m depth, formed at the contact metamorphic zone at a narrow depth range. The homogenization temperatures of fluid inclusions in quartz crystals selected for analysis show a reliable prediction of past to present subsurface temperatures. Thirty one inclusions were analysed with temperatures ranging from 160 to 300°C. A quartz crystal at 756 m shows the lowest Th value of 160°C, which is 40°C lower than the measured formation temperature, and the highest value of 200°C, which is at equilibrium with the measured temperature. In the quartz crystal at 1438 m, the lowest Th value of 250°C is 20°C lower than the measured formation temperature, while the highest Th value 300°C is 30°C higher than the measured formation temperature of 270°C. These preliminary measurements indicate a state of equilibrium with the current measured formation temperatures, implying that no major changes, either heating up or cooling, has occurred in the reservoir around well OW-912B. The subsurface temperature distribution in well OW-912B was estimated from a comparison of temperature profiles from temperature recovery tests, shut-in temperature profiles, hydrothermal alteration mineralogy and fluid inclusion measurements. The injection temperature profile plot (Figure 16) indicates a feed zone at around 1068 m, which is further confirmed by the subsequent heat up profiles. It also shows feed zones at 1300, 1900, 2200 and 2600 m depth. However, the well is impermeable below 2600 m. The heating (recovery) profiles show the temperature recovery, although there is a recovery drag at depths of 1300, 1880 and 2200 m. This suggests that significant volumes of water entered during drilling and injection, thus the formation is taking time to recover. The heat up profiles further confirm the presence of feed zones at 1100, 1300, 1600, 1900 and 2200-2300 m depth. The main feed zone in the well is at 2200-2300 m. According to the temperature logs, the reservoir temperature around well OW-912B is between 280 and 300°C, while the highest measured temperature recorded from the well is 306°C. By comparing alteration minerals and current formation temperature in the four Olkaria Domes wells, OW-911A, OW-912B, OW-916 and OW-914A, it can be noted that alteration minerals occur at lower current temperatures in well OW-911A, depicting cooling at shallower depths in the well, while current formation temperatures at depth show a state of equilibrium. The deeper occurrence of quartz, epidote and actinolite in this well shows that it is probably located on the boundary of the Olkaria Domes field. An up-doming in the alteration mineralogy isotherm exists around well OW-916 which could infer an up-flow zone in the reservoir around the well. Wells OW-916 and OW-912B show no major changes in temperatures from the alteration mineralogy temperature and the formation temperature in Figure 20. Well OW-914A is in the vicinity of the hot up-flow zone and crosses the ring structure at depth, creating a major feed zone in the well.
Report 29 727 Ronoh
8. CONCLUSIONS
The geology of well OW-912B consists of pyroclastics, tuffs, rhyolites, basalts and trachytes. Minor rhyolite intrusions are encountered. Few losses of circulation zones occur at shallower depths in the well.
Hydrothermal alteration mineral assemblages in well OW-912B are mainly controlled by temperature, rock type, fluid composition and permeability. Mineral sequences evolving from low-temperature minerals grading to high-temperature minerals implies a history of heating. The formation of garnet at 1068 m implies that there is relatively high vertical permeability by way of a thin unit of a rhyolite intrusion.
Four hydrothermal zonations recognized in well OW-912B, based on alteration mineralogy, include: zeolite-illite, chlorite-illite, epidote-chlorite-illite and actinolite-epidote-chlorite-illite.
Sources of permeability include fractures and thermally induced joints and lithological contacts. From the analyses, well OW-912B is a hot well but depicts low permeability. Few minor feed zones were identified in the well; the main feed zone is between 2200-2300 m.
Well OW-912B was drilled in the direction of an up-flow zone, encountering high temperatures but low permeability, resulting in the well being a poor producer.
Temperatures encountered in the eastern part of Olkaria Domes geothermal field exceed 250°C, indicating a high-temperature reservoir. The extent of the resource is unknown; step out drilling is ongoing to confirm the boundary.
Rhyolitic dykes and syenitic intrusions characterize the intrusive rock units in the wells and form the domes (ring structure).
A comparison between the current measured formation, alteration mineralogy and fluid inclusion measurements indicates that the area around wells OW-916, OW-914A and OW-912B is in a state of equilibrium. However, slight cooling is experienced at shallower depth in well OW-911A.
From deep occurrences of high-temperature minerals in well OW-911A, there is a possibility that the well is situated near the boundary of the Olkaria Domes geothermal field.
ACKNOWLEDGMENTS
My sincere appreciation goes to UNU-GTP and the Government of Iceland for granting me this scholarship to participate in the six months training programme. Special thanks to the UNU Geothermal Training Programme staff, Dr. Ingvar Birgir Fridleifsson, Mr. Lúdvík S. Georgsson, Ms. Thórhildur Ísberg, Mr. Ingimar Gudni Haraldsson, Mr. Markús A.G. Wilde and Ms. Málfrídur Ómarsdóttir. Thank you all very much for the coordination in achieving this great research. I feel honoured to have been supervised by Ms. Anette K. Mortensen, Dr. Björn S. Hardarson, and Dr. Hjalti Franzson. Thank you very much for tirelessly guiding me throughout this research work and for sharing with me lots of valuable knowledge. I acknowledge the assistance and advice from Dr. Gudmundur Heidar Gudfinnsson, Mr. Steinþór Níelsson, Mr. Sigurdur Sveinn Jónsson and Dr. Gudmundur Ómar Fridleifsson. Thank you. I extend my gratitude to the entire Iceland GeoSurvey (ÍSOR) staff who took part in the programme. I am grateful to my employer, the Kenya Electricity Generating Company, Ltd. – KenGen - for nominating and granting me leave to attend this vital course. Special thanks go to the team that prepared and availed samples and data for use in this project. My very sincere gratitude goes to my loving family and friends back home in Kenya for their encouragement and prayers; God bless you all.
Ronoh 728 Report 29
To the 2012 UNU fellows, thank you all for the good times and the ideas we exchanged during the entire period; it was a real pleasure meeting and interacting with each and every one of you. Borehole geology class, it has been fun learning with you.
REFERENCES Ahmed, M., 2008: Borehole geology and hydrothermal mineralization of well HN-08, Hellisheidi geothermal field, SW-Iceland. Report 8 in: Geothermal training in Iceland 2008. UNU-GTP, Iceland 1-29. Baker, B.H., Mohr, P.A, and Williams, L.A.J., 1972: Geology of the Eastern Rift System of Africa. Geological Society of America, Special Paper 136, 1-67. Baker, B.H., Williams, L.A.J., Miller, J.A., and Fitch, F.J., 1971: Sequence and geochronology of the Kenya Rift volcanics. Tectonophysics, 11, 191-215. Baker, B.H., and Wohlenberg, J., 1971: Structural evolution of the Kenya Rift Valley. Nature, 229, 538-542. Bird, D.K., Schiffman, P., Elders, W.A., Williams, A.E., and McDowell, S.D., 1984: Calc-silicate mineralization in active geothermal systems. Economic Geology, 79, 671-695. Browne, P.R.L., 1978: Hydrothermal alteration in active geothermal systems. Ann. Rev. Earth Planet. Sci., 6, 229-250. Browne, P.R.L., 1984: Subsurface stratigraphy and hydrothermal alteration of the eastern section of the Olkaria geothermal field, Kenya. Proceedings of the 5th New Zealand Geothermal workshop, Geothermal Institute, Auckland, 33-41. Browne, P.R.L., 1993: Application of mineralogical methods to assess the thermal stabilities of geothermal reservoirs. Proceedings of the 18th Workshop on Geothermal Reservoir Engineering, Stanford University, California, 73-78. Clarke, M.C.G., Woodhall, D.G., Allen, D., and Darling G., 1990: Geological, volcanological and hydrogeological controls on the occurrence of geothermal activity in the area surrounding Lake Naivasha, Kenya, with coloured 1:100 000 geological maps. Ministry of Energy, Nairobi, 138 pp. Franzson, H., 1998: Reservoir geology of the Nesjavellir high-temperature field in SW-Iceland. Proceedings of the 19th Annual PNOC-EDC Geothermal Conference, Manila, 13-20. Gebrehiwot Mesfin, K., 2010: Subsurface geology, hydrothermal alteration and geothermal model of northern Skardsmýrarfjall, Hellisheidi geothermal field. University of Iceland, MSc thesis, UNU-GTP, report 5, 65 pp. Gylfadóttir, S.S., Halldórsdóttir, S., Arnaldsson, A., Ármannsson, H., Árnason, K., Axelsson, G., Einarsson, G.M., Franzson, H., Fridriksson, Th., Gudlaugsson, S.Th., Gudmundsson, G., Hersir, G.P., Mortensen, A.K., and Thordarson, S., 2011: Revision of the conceptual model of the Greater Olkaria Geothermal system – Phase I. Report 3. KenGen, Kenya, consultancy services for geothermal resource optimization study of the Greater Olkaria geothermal field carried out by Mannvit Consult., ISOR, Vatnskil and Verkis Eng., 100 pp.
Report 29 729 Ronoh
Kampunzu, A.B., and Mohr, P., 1991: Magmatic evolution and petrogenesis in the East African Rift System. In: Kampunzu, A.B., and Lubala, R.T. (eds.), Magmatism in extensional structural settings: The Phanerozoic African plate. Springer-Verlag, Germany, 85-136. Karingithi, C.W., 2000: Geochemical characteristics of the Greater Olkaria geothermal field, Kenya. Report 9 in: Geothermal training in Iceland 2000. UNU-GTP, Iceland, 165-188. Lagat, J.K., 2004: Geology, hydrothermal alteration and fluid inclusion studies of the Olkaria Domes geothermal field, Kenya. University of Iceland, MSc thesis, UNU-GTP, Iceland, report 2, 71 pp. Lagat, J.K., Arnórsson, S., and Franzson, H., 2005: Geology, hydrothermal alteration and fluid inclusion studies of Olkaria Domes geothermal field, Kenya. Proceedings of the World Geothermal Congress, Antalya, Turkey, 14 pp. Lichoro, C.M., 2009: Joint 1-D inversion of TEM and MT data from Olkaria Domes geothermal area, Kenya. Report 16 in: Geothermal training in Iceland 2009. UNU-GTP, Iceland, 289-318. Lijima, A., 1980: Geology of natural zeolites and zeolitic rocks. Pure & Applied Chemistry, 52, 2115-2130. MacDonald, R., Belkin, H.E., Fitton, J.G., Rogers, N.W., Nejbert, K., Tindle, A.G., and Marshall, A.S., 2008: The roles of fractional crystallization, magma mixing, crystal mush remobilization and volatile-melt interactions in the genesis of a young basalt-peralkaline rhyolite suite, the Greater Olkaria volcanic complex, Kenya Rift Valley. J. Petrology, 49, 1515-1547. Malimo, S.J., 2009: Interpretation of geochemical well test data for wells OW-903B, OW-904B and OW-909, Olkaria Domes field, Kenya. Report 17 in: Geothermal training in Iceland 2009. UNU-GTP, Iceland, 319-344. Mariita, N.O., 2009: Exploration history of Olkaria geothermal field by use of geophysics. Paper presented at “Short Course IV on Exploration for Geothermal Resources”, organized by UNU-GTP, KenGen and GDC, Lake Naivasha, Kenya, 13 pp. Marshall, A.S., MacDonald, R., Rogers, N.W., Fitton, J.G., Tindle, A.G., Nejbert, K., and Hinton, R.W., 2009: Fractionation of peralkaline silicic magmas: the Greater Olkaria volcanic complex, Kenya Rift Valley. J. Petrology, 50, 323-359. Mechie, J., Keller, G.R., Prodehl, C., Khan, M.A. and Gaciri, S.J., 1997: A model for the structure, composition and evolution of the Kenya Rift. Tectonophysics, 278, 95-118. Mungania, J., 1992: Preliminary field report on geology of Olkaria volcanic complex with emphasis on Domes area field investigations. Kenya Power Company, internal report. Mungania J., 1999: Summary of the updates of the geology of Olkaria Domes geothermal field. KenGen, internal report. Njue L.M., 2010: Borehole geology and hydrothermal mineralization of well HE-27, Hellisheidi geothermal field, SW-Iceland. Report 24 in: Geothermal training in Iceland 2010. UNU-GTP, Iceland, 463-492. Odongo, M.E.O., 1993: A geological review of Olkaria geothermal reservoir based on structure. Proceedings of the 15th New Zealand Geothermal Workshop, Geothermal Institute, Auckland, 169-173.
Ronoh 730 Report 29
Omenda, P.A., 1993: Geological investigation of Suswa geothermal prospect, Kenya. Kenya Power Company internal report, 22 pp. Omenda, P.A., 1998: The geology and structural controls of the Olkaria geothermal system, Kenya. Geothermics, 27-1, 55-74. Reyes, A.G., 1990: Petrology of Philippine geothermal systems and the application of alteration mineralogy to their assessment. J. Volc. Geoth. Res., 43, 279-309. RockWare, 2007: LogPlot program. Rockware Inc. Simiyu, S.M., 1999: Seismic velocity analysis in the Olkaria geothermal field. Proceedings of the 24th Workshop on Geothermal Reservoir Engineering, Stanford University, Stanford, Ca, 7 pp. Simiyu, S.M., and Keller, G.R., 1997: Integrated geophysical analysis of the East African Plateau from gravity anomalies and recent seismic studies. Tectonophysics, 278, 291-314. Simiyu, S.M., Oduong, E.O., and Mboya, T.K., 1998: Shear wave attenuation beneath the Olkaria volcanic field. KenGen, internal report. Simmons, S.F., and Christenson, B.W., 1994: Origin of calcite in a boiling geothermal system. American J. Science, 294, 361-400. Smith, M., 1994: Stratigraphic and structural constraints on mechanisms of active rifting in the Gregory Rift, Kenya. In: Prodehl, C., Keller, G.R., and Khan, M.A., (eds.): Crustal and upper mantle structure of the Kenya rift. Tectonophysics, 236, 3-22. Smith, M., and Mosley, P., 1993: Crustal heterogeneity and basement influence on the development of the Kenya rift, East Africa. Tectonics, 12, 591-606. Stefánsson, V., and Steingrímsson, B.S., 1990: Geothermal logging I, an introduction to techniques and interpretation (3rd edition). Orkustofnun, Reykjavík, report OS-80017/JHD-09, 117 pp. Thiessen, R., Burke, K., and Kidd, W.S.F., 1979: African hotspots and their relation to the underlying mantle. Geology, 7, 263-266. Thompson, A.O., and Dodson, R.G., 1963: Geology of the Naivasha area. Geological Survey Kenya, report No. 55. Wanjohi, A., 2011: Geophysics report east of Olkaria Domes (Akira) geothermal field. KenGen, internal report, 34 pp. West-JEC, 2009: The Olkaria optimization study (phase ii). KenGen, Kenya, final reservoir analysis report. West Japan Engineering Consultants, Inc., 301 pp.
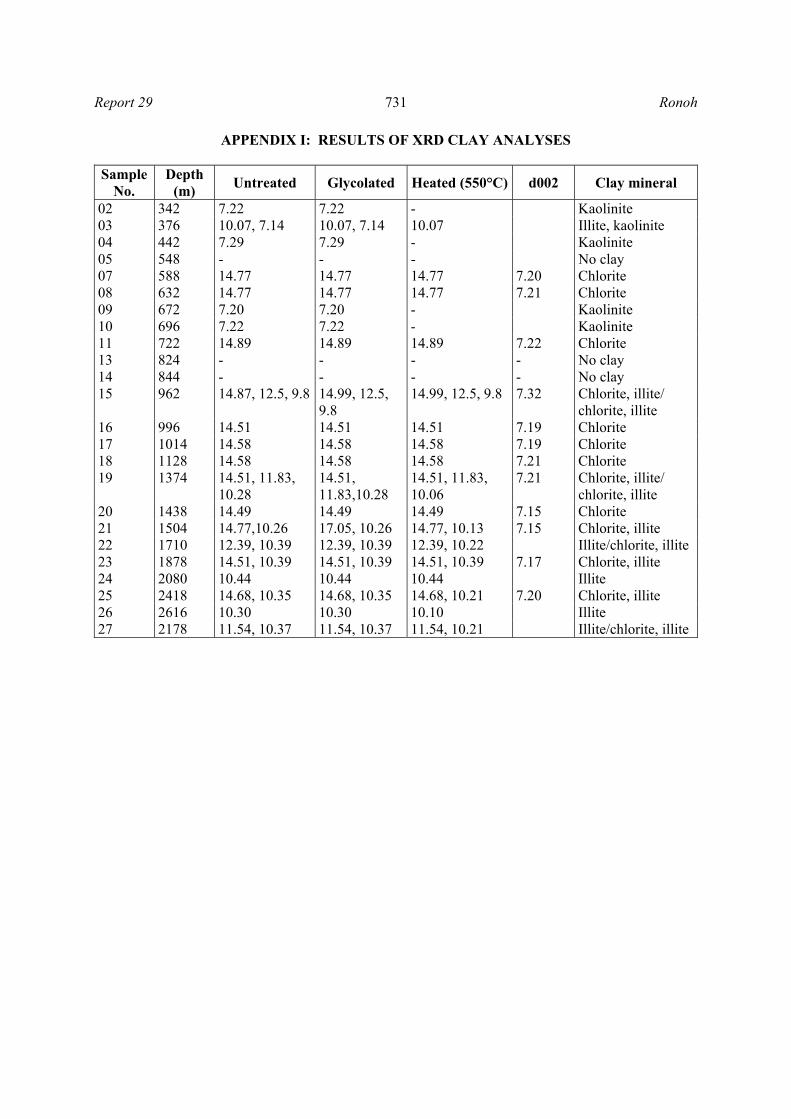
Report 29 731 Ronoh
APPENDIX I: RESULTS OF XRD CLAY ANALYSES Sample
No. Depth
(m) Untreated Glycolated Heated (550°C) d002 Clay mineral
02 342 7.22 7.22 - Kaolinite 03 376 10.07, 7.14 10.07, 7.14 10.07 Illite, kaolinite 04 442 7.29 7.29 - Kaolinite 05 548 - - - No clay 07 588 14.77 14.77 14.77 7.20 Chlorite 08 632 14.77 14.77 14.77 7.21 Chlorite 09 672 7.20 7.20 - Kaolinite 10 696 7.22 7.22 - Kaolinite 11 722 14.89 14.89 14.89 7.22 Chlorite 13 824 - - - - No clay 14 844 - - - - No clay 15 962 14.87, 12.5, 9.8 14.99, 12.5,
9.8 14.99, 12.5, 9.8 7.32 Chlorite, illite/
chlorite, illite 16 996 14.51 14.51 14.51 7.19 Chlorite 17 1014 14.58 14.58 14.58 7.19 Chlorite 18 1128 14.58 14.58 14.58 7.21 Chlorite 19 1374 14.51, 11.83,
10.28 14.51, 11.83,10.28
14.51, 11.83, 10.06
7.21 Chlorite, illite/ chlorite, illite
20 1438 14.49 14.49 14.49 7.15 Chlorite 21 1504 14.77,10.26 17.05, 10.26 14.77, 10.13 7.15 Chlorite, illite 22 1710 12.39, 10.39 12.39, 10.39 12.39, 10.22 Illite/chlorite, illite 23 1878 14.51, 10.39 14.51, 10.39 14.51, 10.39 7.17 Chlorite, illite 24 2080 10.44 10.44 10.44 Illite 25 2418 14.68, 10.35 14.68, 10.35 14.68, 10.21 7.20 Chlorite, illite 26 2616 10.30 10.30 10.10 Illite 27 2178 11.54, 10.37 11.54, 10.37 11.54, 10.21 Illite/chlorite, illite
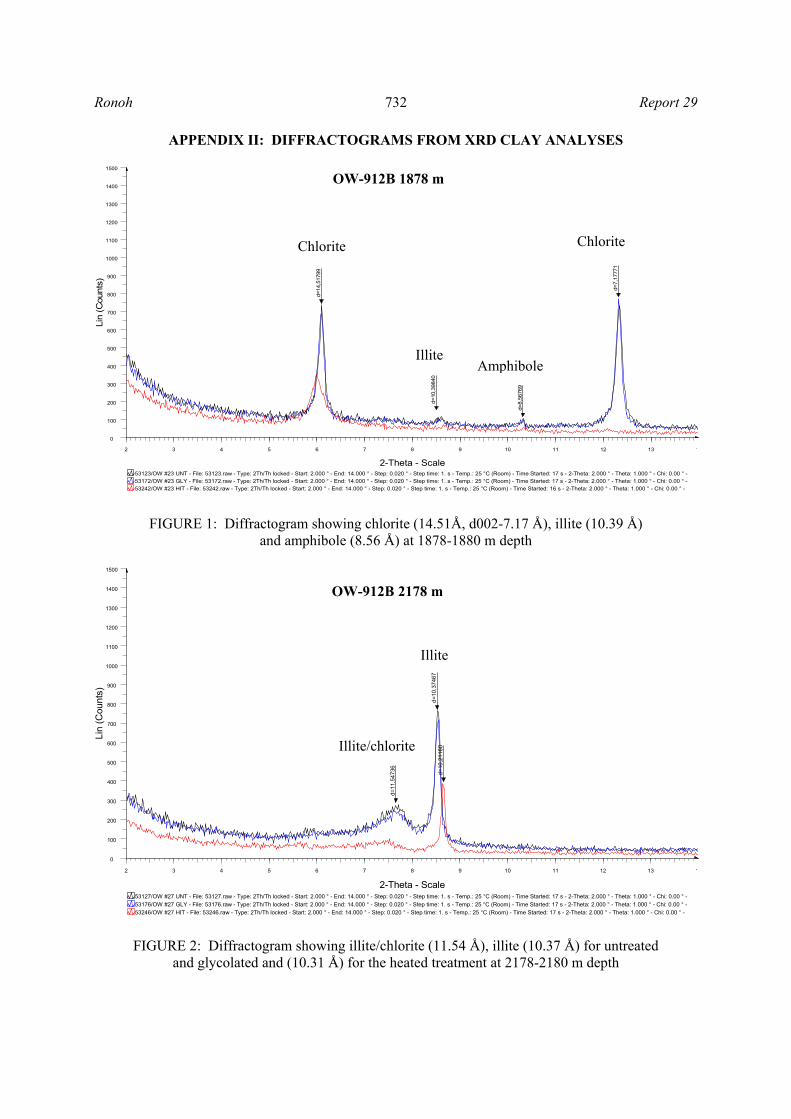
Ronoh 732 Report 29
APPENDIX II: DIFFRACTOGRAMS FROM XRD CLAY ANALYSES
FIGURE 1: Diffractogram showing chlorite (14.51Å, d002-7.17 Å), illite (10.39 Å) and amphibole (8.56 Å) at 1878-1880 m depth
FIGURE 2: Diffractogram showing illite/chlorite (11.54 Å), illite (10.37 Å) for untreated and glycolated and (10.31 Å) for the heated treatment at 2178-2180 m depth
53242/OW #23 HIT - File: 53242.raw - Type: 2Th/Th locked - Start: 2.000 ° - End: 14.000 ° - Step: 0.020 ° - Step time: 1. s - Temp.: 25 °C (Room) - Time Started: 16 s - 2-Theta: 2.000 ° - Theta: 1.000 ° - Chi: 0.00 ° -
53172/OW #23 GLY - File: 53172.raw - Type: 2Th/Th locked - Start: 2.000 ° - End: 14.000 ° - Step: 0.020 ° - Step time: 1. s - Temp.: 25 °C (Room) - Time Started: 17 s - 2-Theta: 2.000 ° - Theta: 1.000 ° - Chi: 0.00 ° -
53123/OW #23 UNT - File: 53123.raw - Type: 2Th/Th locked - Start: 2.000 ° - End: 14.000 ° - Step: 0.020 ° - Step time: 1. s - Temp.: 25 °C (Room) - Time Started: 17 s - 2-Theta: 2.000 ° - Theta: 1.000 ° - Chi: 0.00 ° -
Lin
(Cou
nts
)
0
100
200
300
400
500
600
700
800
900
1000
1100
1200
1300
1400
1500
2-Theta - Scale
2 3 4 5 6 7 8 9 10 11 12 13 1
d=10
,398
40
d=7,
1777
1
d=14
,517
99
d=8,
5676
9
53246/OW #27 HIT - File: 53246.raw - Type: 2Th/Th locked - Start: 2.000 ° - End: 14.000 ° - Step: 0.020 ° - Step time: 1. s - Temp.: 25 °C (Room) - Time Started: 17 s - 2-Theta: 2.000 ° - Theta: 1.000 ° - Chi: 0.00 ° - 53176/OW #27 GLY - File: 53176.raw - Type: 2Th/Th locked - Start: 2.000 ° - End: 14.000 ° - Step: 0.020 ° - Step time: 1. s - Temp.: 25 °C (Room) - Time Started: 17 s - 2-Theta: 2.000 ° - Theta: 1.000 ° - Chi: 0.00 ° -
53127/OW #27 UNT - File: 53127.raw - Type: 2Th/Th locked - Start: 2.000 ° - End: 14.000 ° - Step: 0.020 ° - Step time: 1. s - Temp.: 25 °C (Room) - Time Started: 17 s - 2-Theta: 2.000 ° - Theta: 1.000 ° - Chi: 0.00 ° -
Lin
(C
ounts
)
0
100
200
300
400
500
600
700
800
900
1000
1100
1200
1300
1400
1500
2-Theta - Scale
2 3 4 5 6 7 8 9 10 11 12 13 1
d=11
,547
36
d=10
,374
67d=
10,2
1160
OW-912B 1878 m
Chlorite
IlliteAmphibole
Chlorite
OW-912B 2178 m
Illite
Illite/chlorite