boost your confidence (intervals) with · pdf fileboost your confidence (intervals) with sas...
TRANSCRIPT

BOOST YOUR CONFIDENCE (INTERVALS) WITH SAS
Brought to you by:
Peter Langlois, PhD Birth Defects Epidemiology & Surveillance Branch,
Texas Dept State Health Services

Background
Confidence Interval Definition
• DEFINITION: An interval around a statistic that contains the true underlying value of the statistic (the population parameter) a certain amount of the time

Confidence Interval Definition
• Example: a survey of 50 SAS programmers finds that the average IQ is 130 + 10
• If we did 100 surveys, the average IQ should be between 120 and 140 in 95 of them

Confidence Interval Definition
• 95% confidence interval bounded by the upper 95% confidence limit and the lower 95% confidence limit
• 95% just conventional. Can have for e.g.:– 90% CIs (narrower)– 99% CIs (wider)
• CI for any level (95% etc) is narrower if based on more observations
General Formula• Can make CIs around almost any statistic
you calculate, for example…
• Data summaries (1 var) such as:– Categorical variables: proportion– Continuous variables: mean
• Statistics resulting from hypothesis tests (2+ vars):– Correlation, regression slope– Relative risk, odds ratios

Using Confidence Intervals
Why Use CIs?
• Gives audience idea of impact of chance• Gives reasonable bounds on your
result(s)• Can check if your data are compatible
with a certain value– (From data summary): Does 95%
confidence interval of IQ in SAS programmers include 100?
– (From hypothesis testing): Is occurrence of schizophrenia higher in SAS programmers or SPSS users? (Does relative risk = 1.00?)

Why Not Use CIs?
• Some organizations consider their figures to be a census, not a sample
• Increases statistical work for staff
• Some data users may find the concept confusing

Overlapping CIs vs Hypothesis Tests
• Example: Want to compare prevalence of schizophrenia in SAS vs SPSS users
• You could:(A) Calculate schizophrenia prevalence and
95% CI for each group and see if overlap OR
(B) Calculate prevalence ratio of one group vs another, and see if includes 1.00
Overlapping CIs vs Hypothesis Tests
• Answer: (B) usually better• Why? More statistical power
• Why even consider the first approach?– Easier to do if already have data summaries
published– Can’t anticipate all comparisons readers will
want to make

Confidence Intervals For Data Summaries
CIs for Means
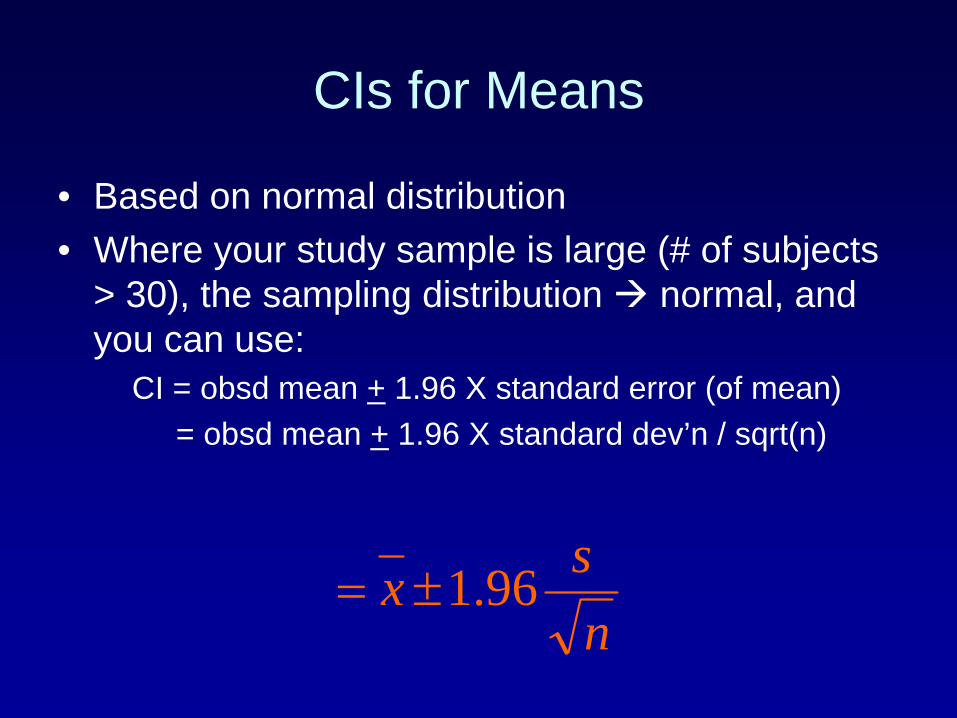
• Based on normal distribution• Where your study sample is large (# of subjects
> 30), the sampling distribution normal, and you can use:
CI = obsd mean + 1.96 X standard error (of mean)= obsd mean + 1.96 X standard dev’n / sqrt(n)
nsx 96.1

CIs for Means: Using SAS
• Let SAS do it!
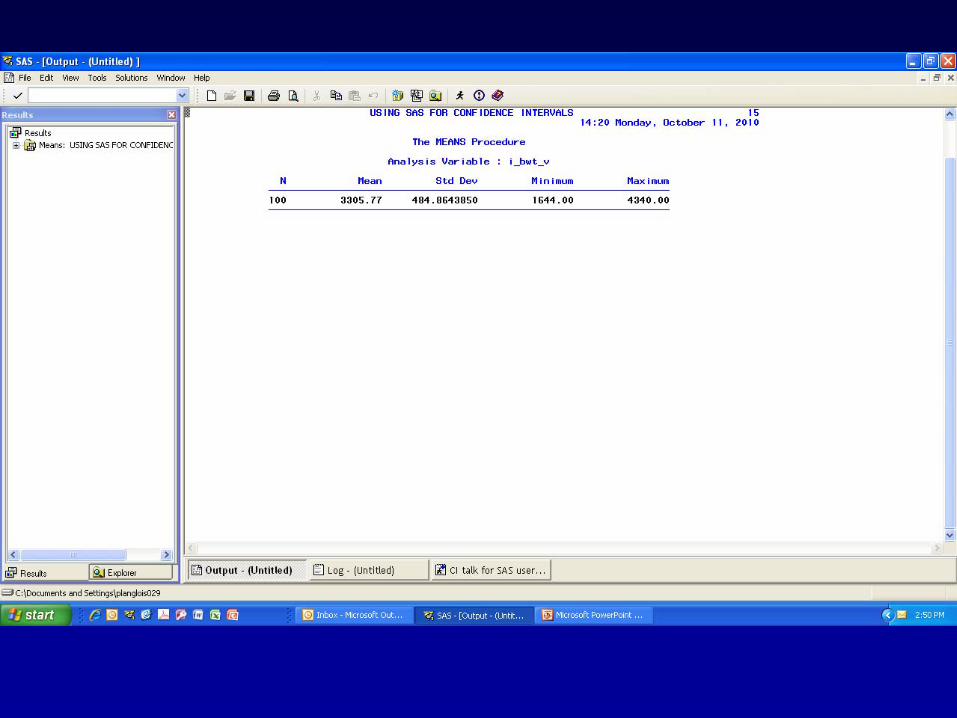
• Recall: Using SAS for simple desc stats:
proc means;var <variable name>;
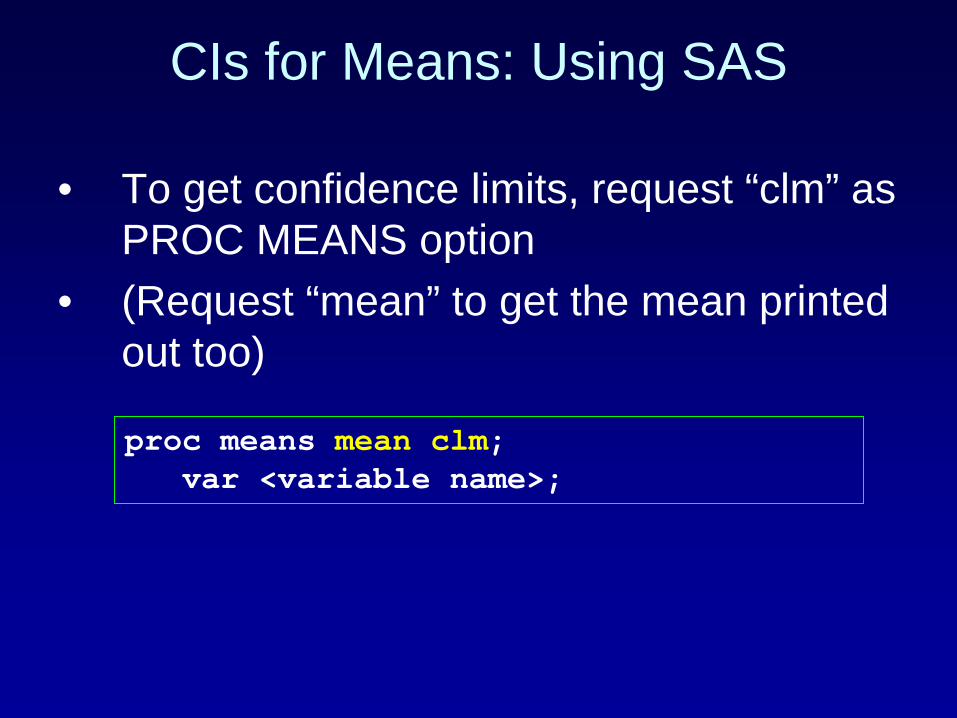
CIs for Means: Using SAS
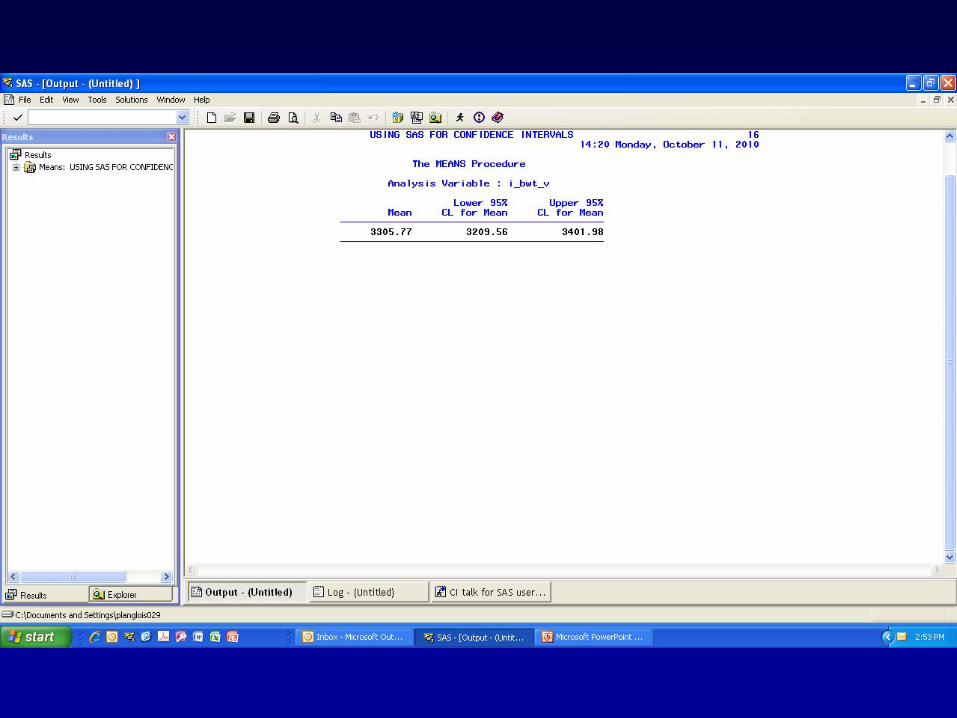
• To get confidence limits, request “clm” as PROC MEANS option
• (Request “mean” to get the mean printed out too)
proc means mean clm;var <variable name>;

CIs for Proportions• Based on binomial
distribution• Where your study
sample is large (# with and without the characteristic > 5), the sampling distribution normal, and you can use:
• = obsd proportion + 1.96 X SE of prop’n
n
ppp
196.1
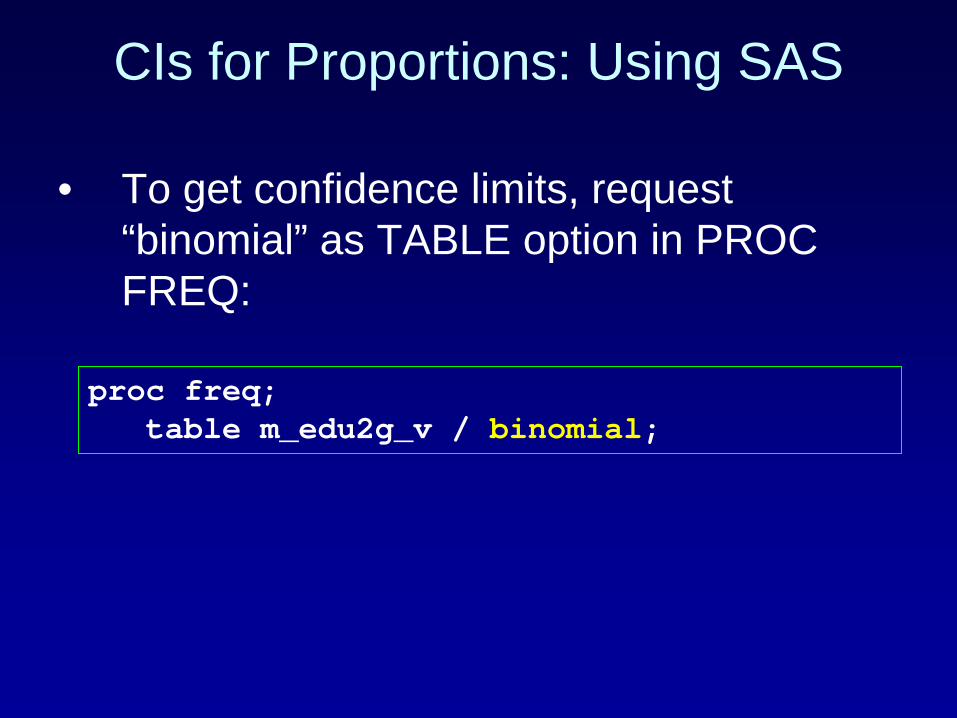
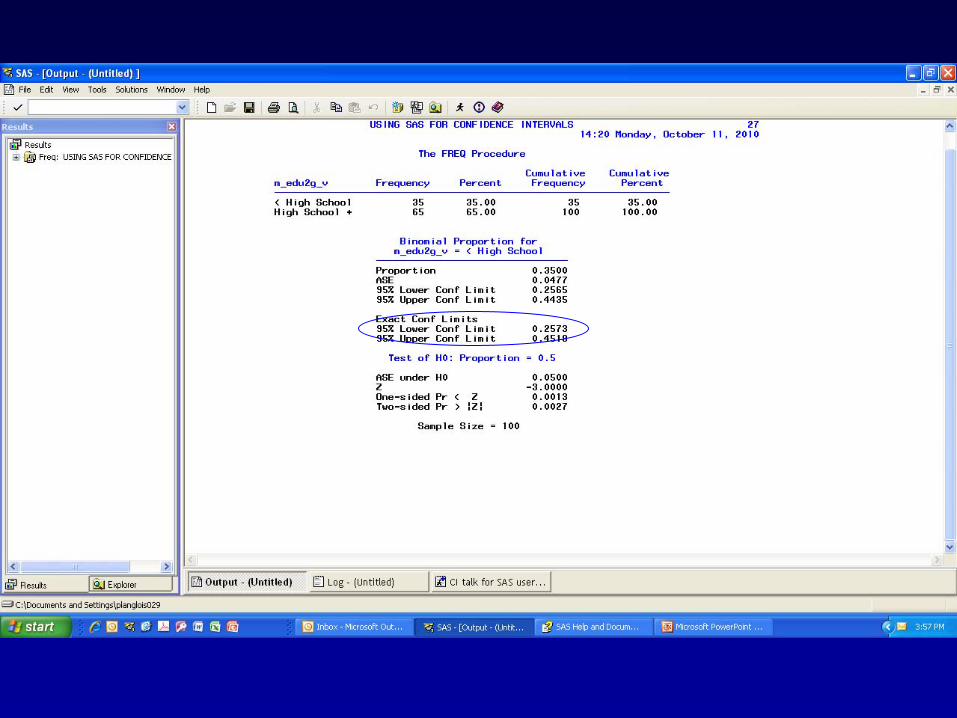
CIs for Proportions: Using SAS
• To get confidence limits, request “binomial” as TABLE option in PROC FREQ:
proc freq;table m_edu2g_v / binomial;

CIs for Rates of Rare Outcomes
• Follows Poisson distribution
• Standard error based on number of cases
CIs for Rates of Rare OutcomesPREVALENCE BASED ON < 30 CASES
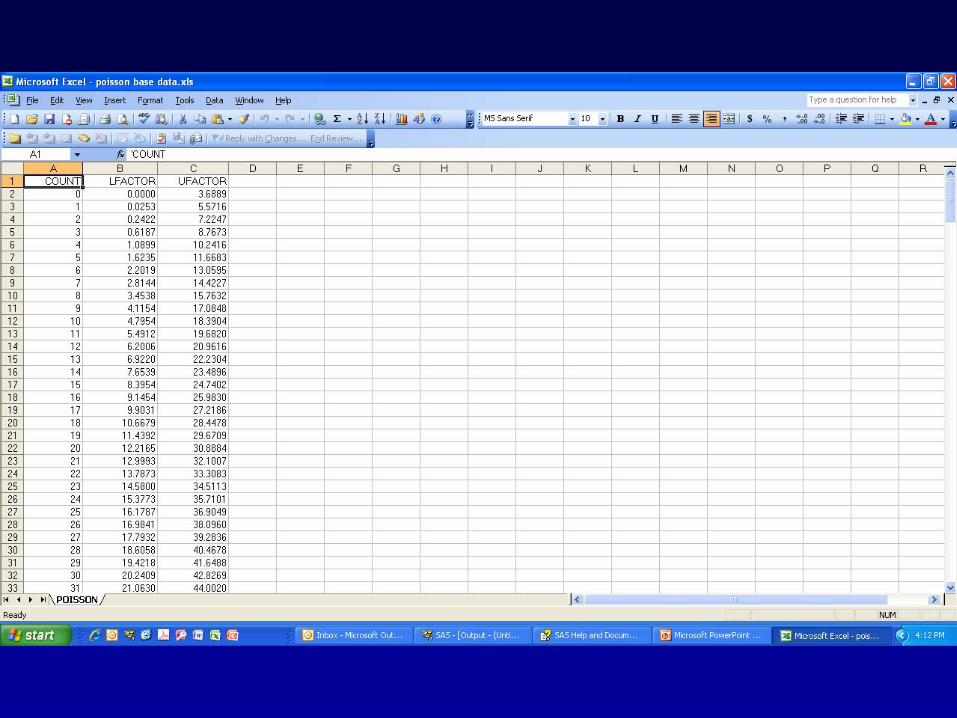
• Find upper and lower 95% conf limits for # cases:– In table (e.g. poisson.xls)– Using PEPI program POISSON
• Multiply both by (10000) and divide by # population or live births to express as birth prevalence
CIs for Rates of Rare Outcomes
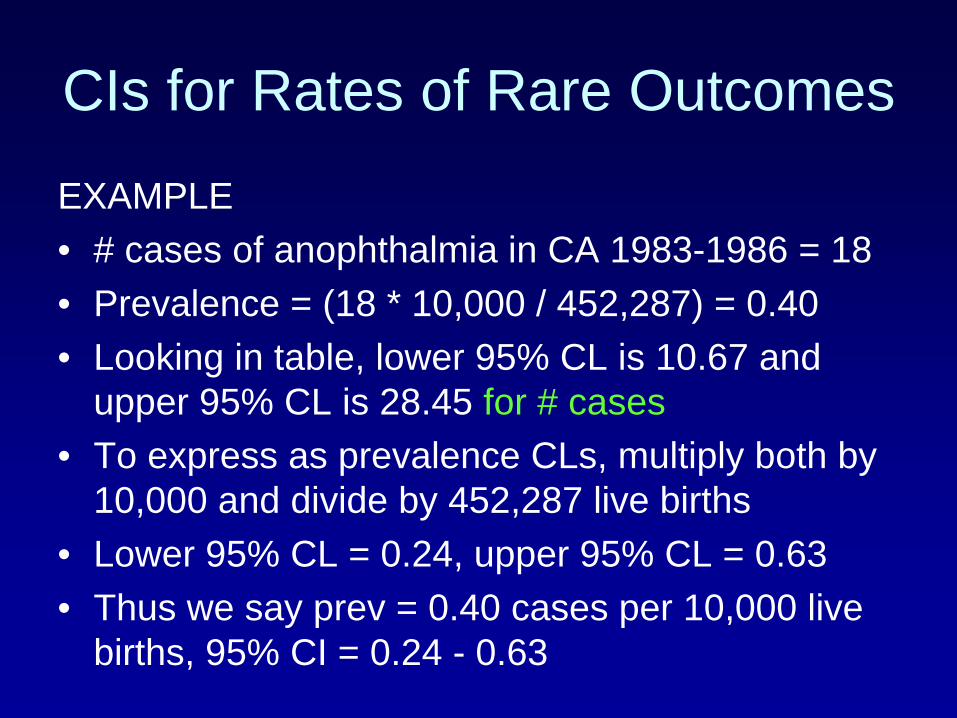
EXAMPLE• # cases of anophthalmia in CA 1983-1986 = 18• Prevalence = (18 * 10,000 / 452,287) = 0.40• Looking in table, lower 95% CL is 10.67 and
upper 95% CL is 28.45 for # cases• To express as prevalence CLs, multiply both by
10,000 and divide by 452,287 live births• Lower 95% CL = 0.24, upper 95% CL = 0.63• Thus we say prev = 0.40 cases per 10,000 live
births, 95% CI = 0.24 - 0.63
CIs for Rates of Rare Outcomes
PREVALENCE BASED ON 30+ CASES
• Considered large # cases (more or less)
• Poisson normal distribution• Can use normal approximation in SAS code • Several equations for doing this, yielding
similar results
CIs for Rates of Rare Outcomes
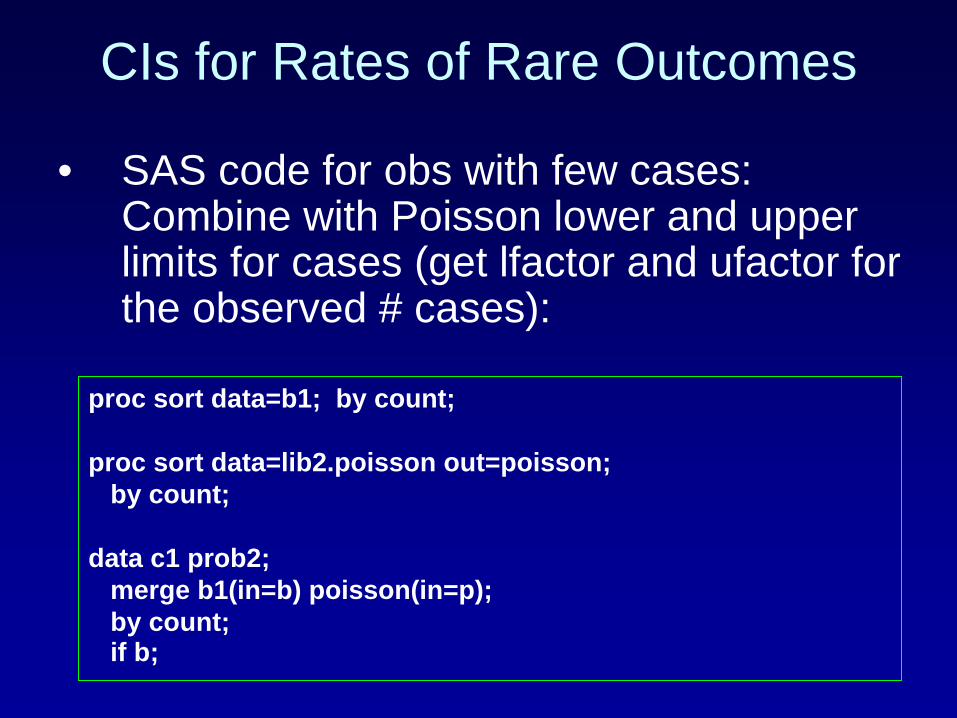
• SAS code for obs with few cases: Combine with Poisson lower and upper limits for cases (get lfactor and ufactor for the observed # cases):
proc sort data=b1; by count;
proc sort data=lib2.poisson out=poisson;by count;
data c1 prob2;merge b1(in=b) poisson(in=p);by count;if b;

CIs for Rates of Rare Outcomes• SAS code: Calculate CIs for obs with
many cases toodata c2;
set c1;calcrate = count * 10000 / births;if count le 30 then do;
calclcl = lfactor * 10000 / births;calcucl = ufactor * 10000 / births;end;
else if count > 30 then do;calclcl = ((count / births) - (1.96 * sqrt(count) / births)) * 10000;calcucl = ((count / births) + (1.96 * sqrt(count) / births)) * 10000;end;
rate = round(calcrate,.01);lcl = round(calclcl,.01);ucl = round(calcucl,.01);rename count=cases;

Reminder
• To compare groups (e.g. whether rates are statistically different), can calculate 95% confidence intervals and see if they overlap
• Better to do hypothesis testing
Confidence Intervals For Statistics From
Hypothesis Tests / Measures of Association
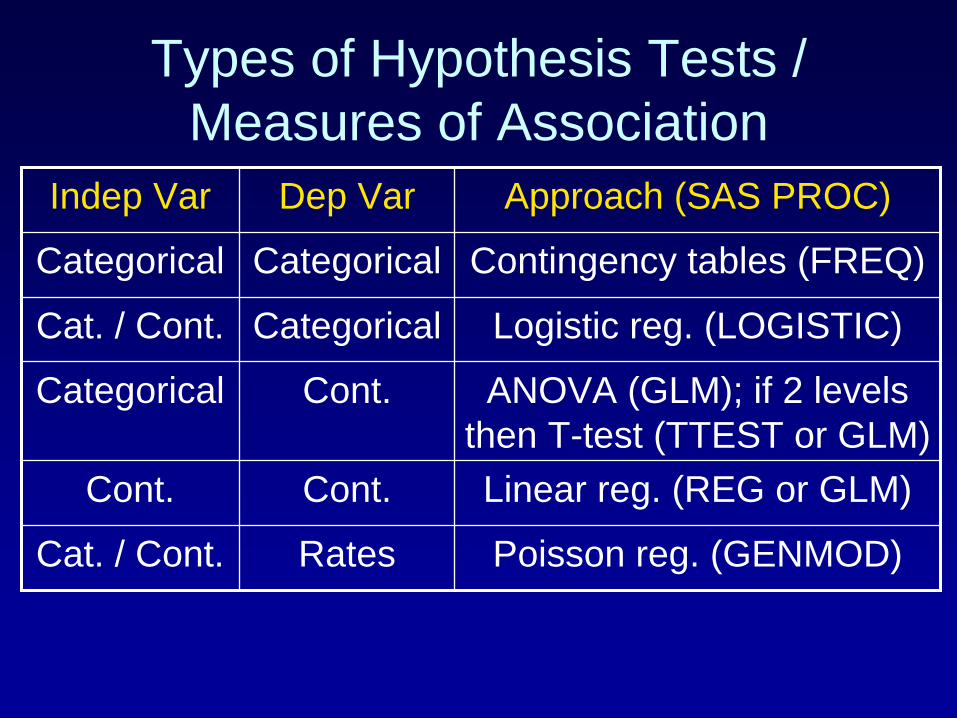
Types of Hypothesis Tests / Measures of Association
Indep Var Dep Var Approach (SAS PROC)
Categorical Categorical Contingency tables (FREQ)
Cat. / Cont. Categorical Logistic reg. (LOGISTIC)
Categorical Cont. ANOVA (GLM); if 2 levels then T-test (TTEST or GLM)
Cont. Cont. Linear reg. (REG or GLM)
Cat. / Cont. Rates Poisson reg. (GENMOD)
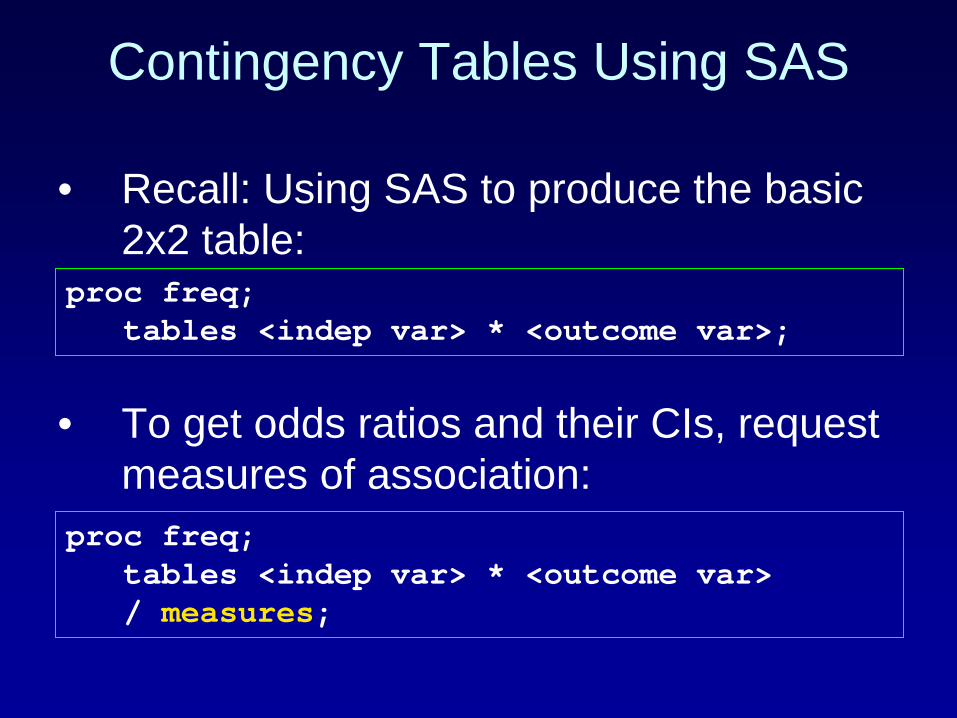
Contingency Tables Using SAS
• Recall: Using SAS to produce the basic 2x2 table:
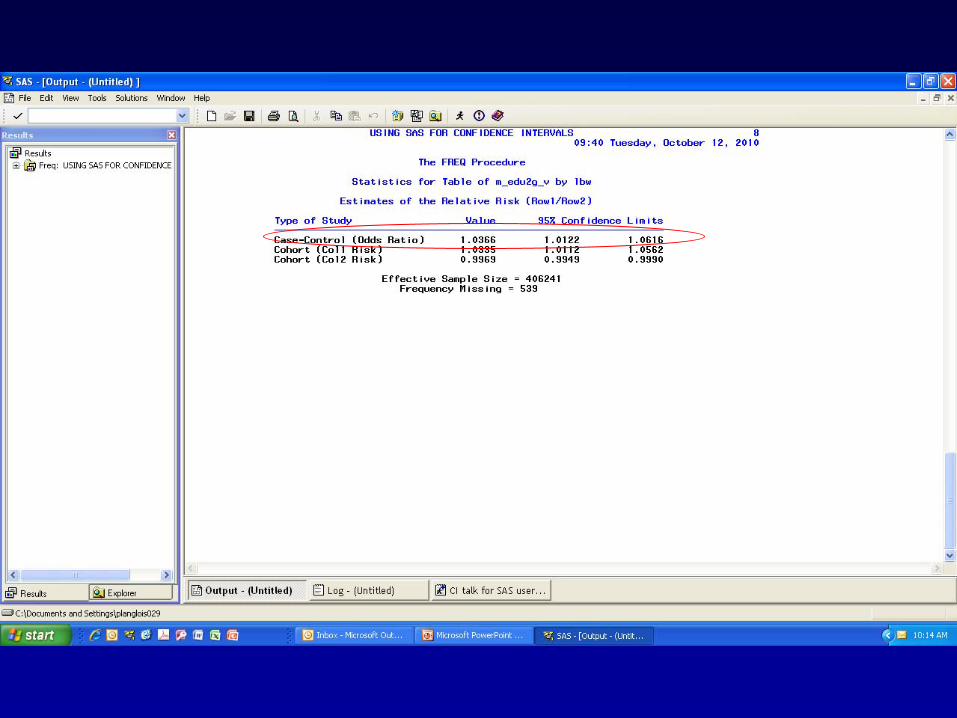
• To get odds ratios and their CIs, request measures of association:
proc freq;tables <indep var> * <outcome var>;
proc freq;tables <indep var> * <outcome var> / measures;
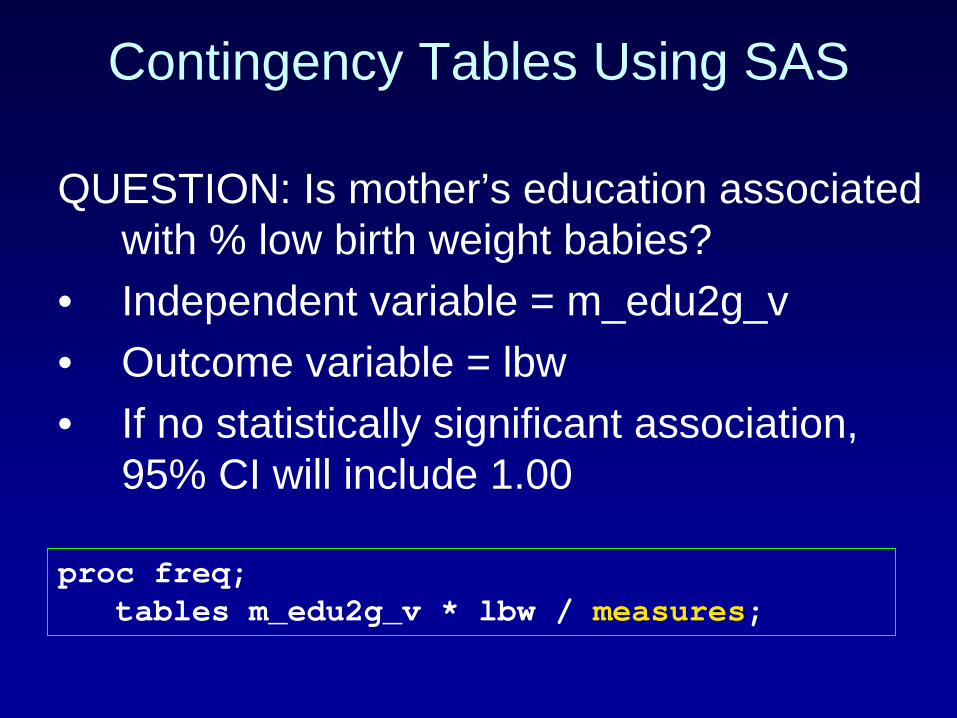
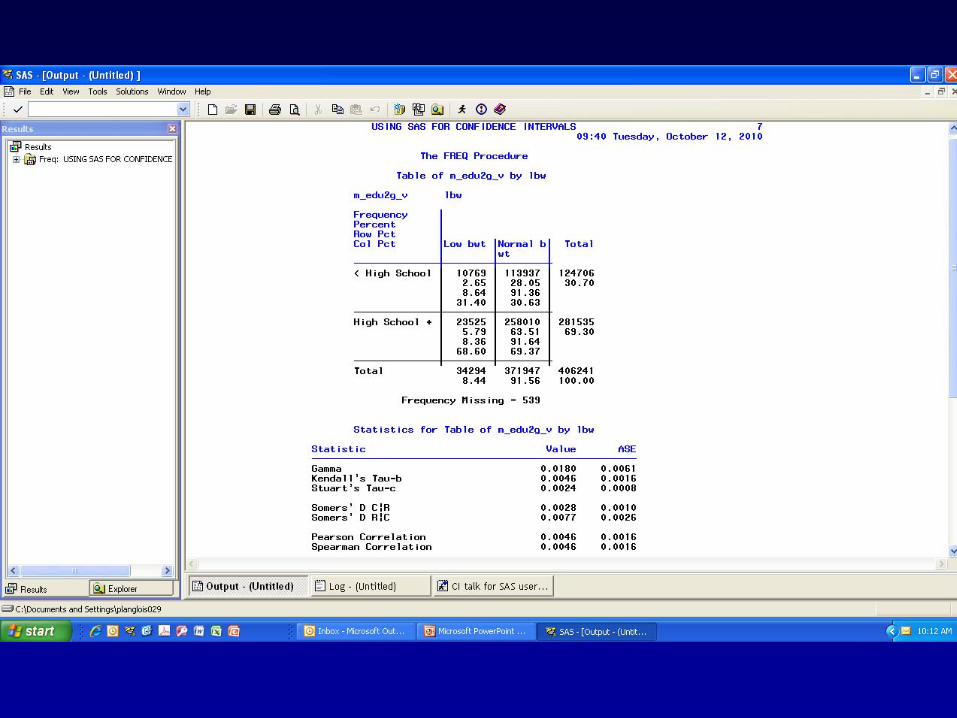
Contingency Tables Using SAS
QUESTION: Is mother’s education associated with % low birth weight babies?
• Independent variable = m_edu2g_v• Outcome variable = lbw• If no statistically significant association,
95% CI will include 1.00
proc freq;tables m_edu2g_v * lbw / measures;

Logistic Regression: Using SAS• Can use PROC LOGISTIC in SAS; nice
since it will exponentiate the slope (b) and its 95% confidence interval
• Basic syntax:
• For low birthweight example:
proc logistic;model <outcome var> = <independent var>;
proc logistic;model lbw = m_edu2g_v;
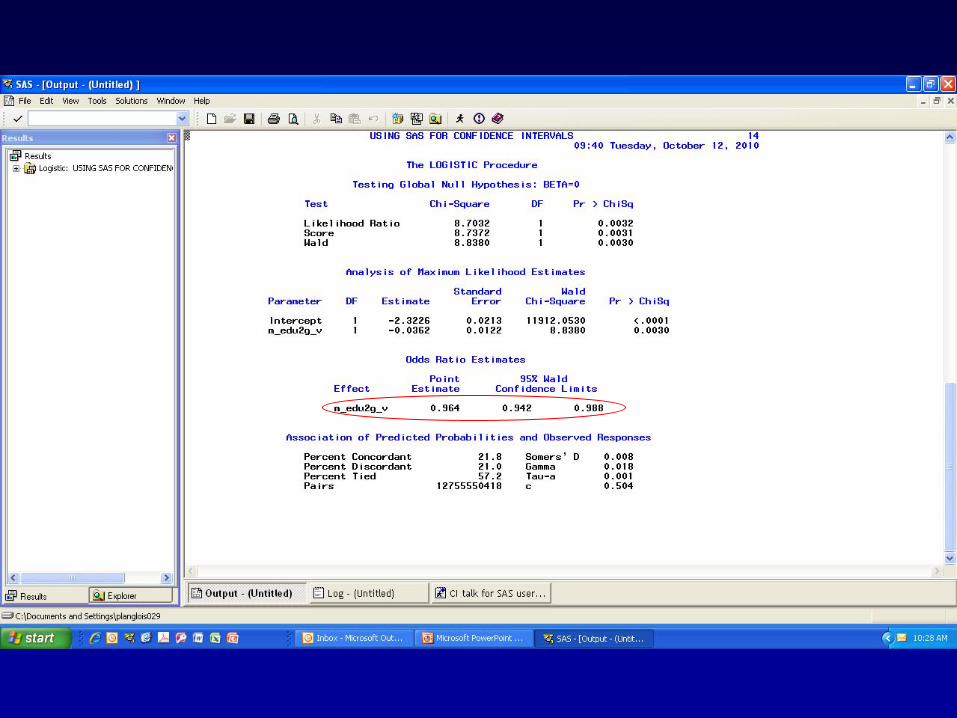
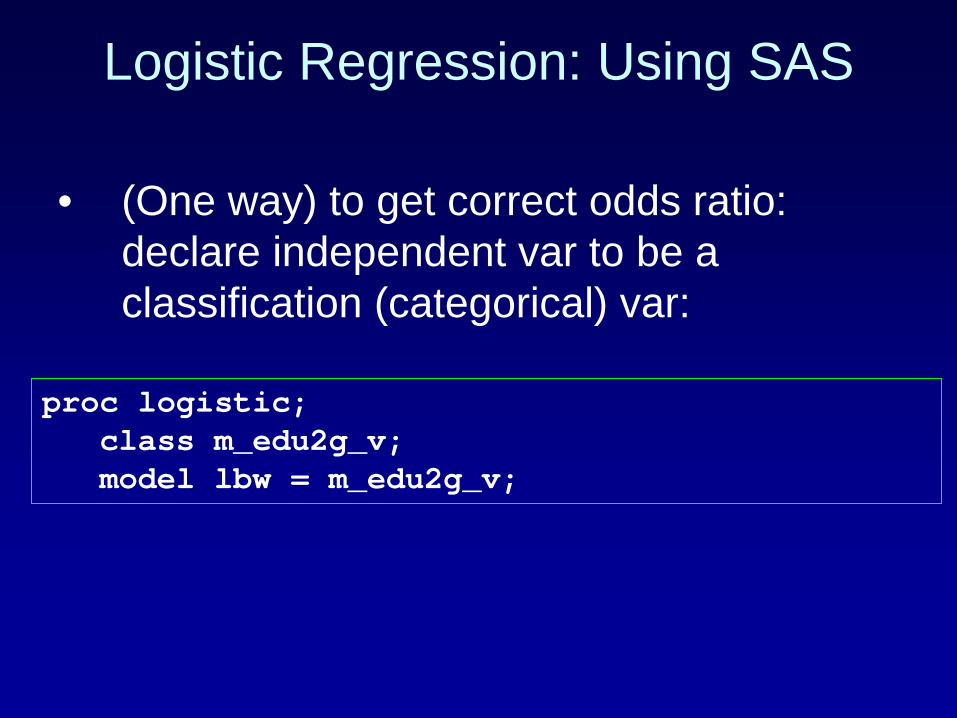
Logistic Regression: Using SAS
• (One way) to get correct odds ratio: declare independent var to be a classification (categorical) var:
proc logistic;class m_edu2g_v;model lbw = m_edu2g_v;
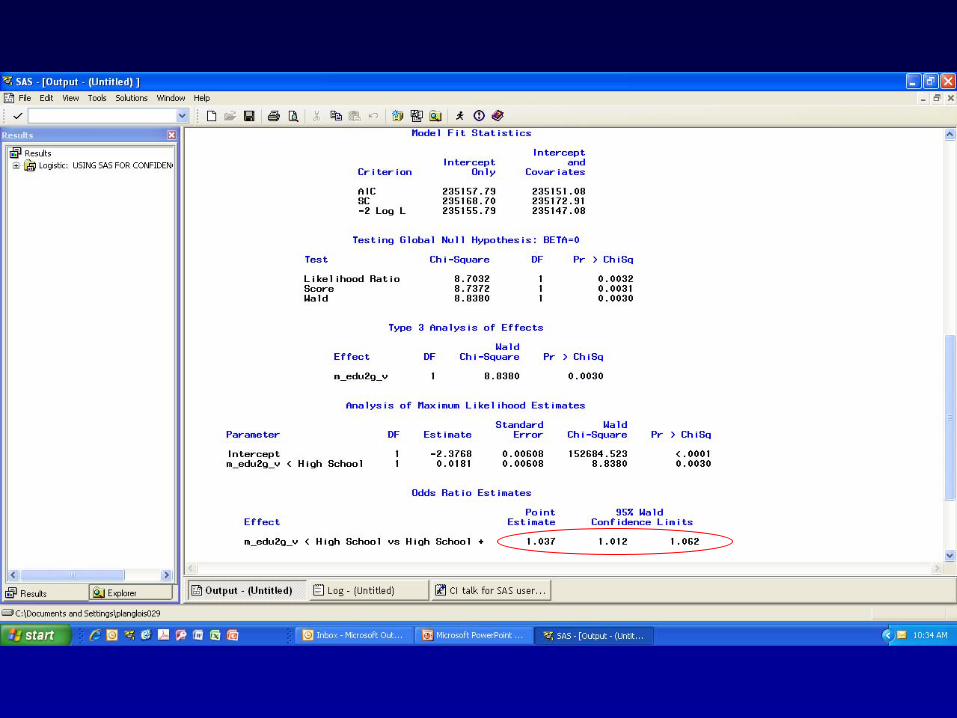
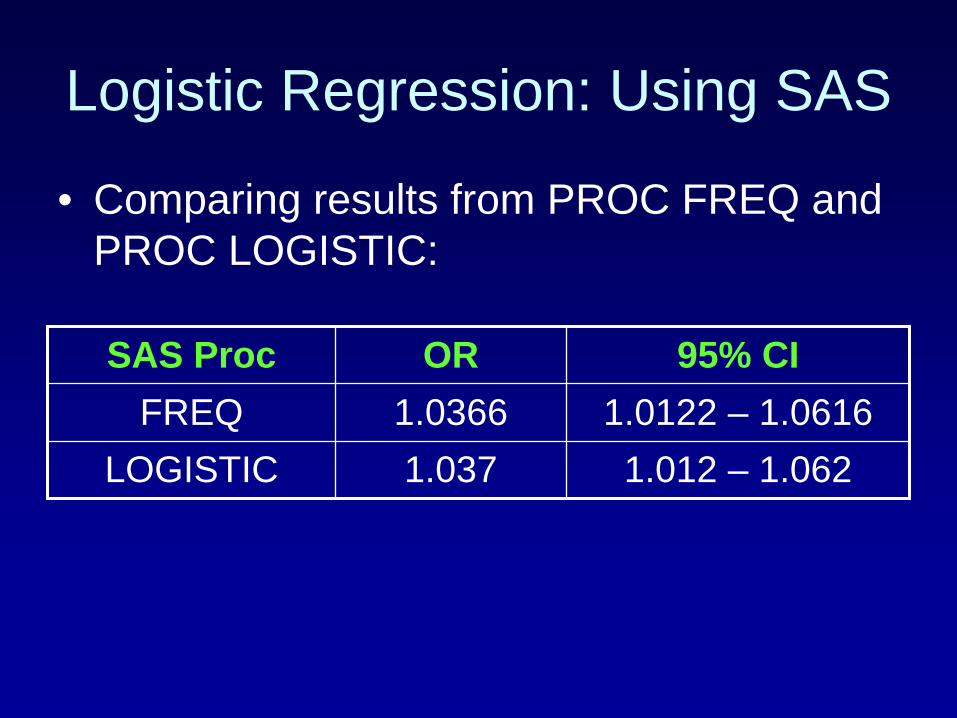
Logistic Regression: Using SAS
• Comparing results from PROC FREQ and PROC LOGISTIC:
SAS Proc OR 95% CIFREQ 1.0366 1.0122 – 1.0616
LOGISTIC 1.037 1.012 – 1.062
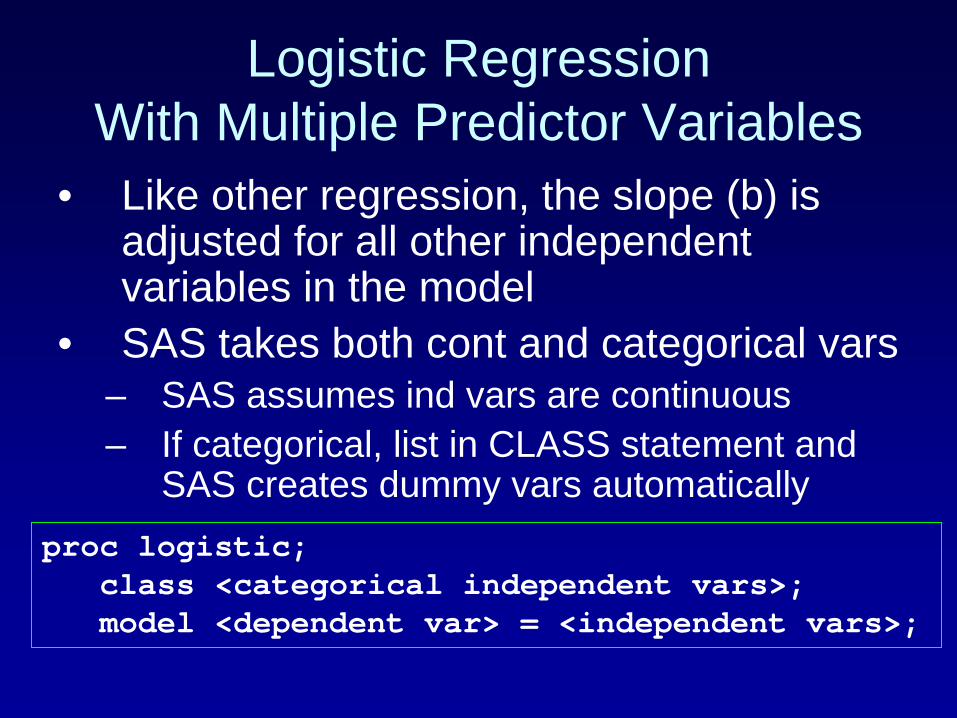
Logistic Regression With Multiple Predictor Variables
• Like other regression, the slope (b) is adjusted for all other independent variables in the model
• SAS takes both cont and categorical vars– SAS assumes ind vars are continuous– If categorical, list in CLASS statement and
SAS creates dummy vars automaticallyproc logistic;
class <categorical independent vars>;model <dependent var> = <independent vars>;