bone marrow mesenchymal stem cells: improving transgene
TRANSCRIPT

JBUON 2018; 23(6): 1893-1903ISSN: 1107-0625, online ISSN: 2241-6293 • www.jbuon.comE-mail: [email protected]
ORIGINAL ARTICLE
Correspondence to: Herminia Martínez-Rodríguez, PhD. Autonomous University of Nuevo Leon, School of Medicine, Department of Biochemistry and Molecular Medicine. Ave. Francisco I. Madero y Eduardo Aguirre Pequeño Col. Mitras Centro, Monterrey, Nuevo Leon, Mexico. Postal code 64460.Tel: +52 81 8329 4173, Fax: +52 81 8333 7747, E-mail: [email protected]; [email protected]: 01/05/2018; Accepted: 29/05/2018
Bone marrow mesenchymal stem cells: improving transgene expression level, transfection efficiency and cell viabilityCarlos Gonzalez-Villarreal1, Salvador Said-Fernandez1, Adolfo Soto-Dominguez2, Gerardo Padilla - Rivas1, Elsa Garza-Treviño1, Humberto Rodriguez Rocha2, Herminia Martinez - Rodriguez1 1Autonomous University of Nuevo León, School of Medicine, Department of Biochemistry and Molecular Medicine and 2Department of Histology, Monterrey Nuevo Leon, Mexico
Summary
Purpose: Advanced cancer is a catastrophic medical condi-tion that is generally treated with surgery and conventional anticancer drugs, which are very toxic and often fail. A prom-ising alternative is using genetically engineered mesenchy-mal stem cells. A popular method for genetically engineering mesenchymal stem cells (MSCs) is by employing transfection reagents. Nevertheless, a serious limitation of this procedure is its consistently low transfection efficiency. Therefore, the utility of transfection reagents in regenerative medicine - including cancer treatment - might increase strikingly by increasing their transfection efficiency and maintaining, to the greatest extent possible, cell viability and transgene ex-pression levels. The purpose of this study was to analyze vari-ous effects on gene expression level, transfection efficiency, and cell viability by increasing the volume of transfection reagents and the plasmid DNA mass.
Methods: Mouse bone marrow MSCs were transfected with trademarked Xfect®, Turbofect® or Lipofectamine 3000® and the plasmid pTracer-EF-His-A® expressing the green fluores-cent protein (GFP). Additionally, we tested a protocol modi-
fication recommended by the Xfect manufacturer. The GFP expression level, transfection efficiency, and cell viability were evaluated together using a performance index.
Results: By doubling the quantities recommended by the manufacturers (reagent volume), plasmid DNA mass or both variables and by following a modified Xfect method, the transfection efficiency improved to 70%, the cell viabil-ity did not diminish, and the performance index increased to 47.7% with respect to the values determined using the original Xfect protocol.
Conclusion: Transgene expression levels, transfection ef-ficiency, and cell viability may be strikingly improved, by increasing the volume of the transfectant agent, the plasmid DNA mass or both, beyond those recommended by transfec-tion kit manufacturers.
Key words: cancer treatment, cell viability, gene level ex-pression, MSCs transfection improving, performance index, transfection efficiency
Introduction
Advanced cancer is generally treated with surgery and chemotherapy. One of the most used chemotherapies for advanced colorectal cancer is FOLFOX-6, which includes 5-fluoruracil, oxalipla-tin and leucovorin [1]. In general, all conventional anticancer drugs used to treat cancer are very toxic, and mortality has diminished only by 13% over
the past 35 years [2], in other words, conventional chemotherapy does not offer what we would expect. As a promising alternative, multipotent stromal fibroblast-shaped mesenchymal stem cells (MSCs) are used in preclinical studies and clinical trials [3]. These cells are the central element used in regen-erative medicine due to their exceptional biological
This work by JBUON is licensed under a Creative Commons Attribution 4.0 International License.

Improved MSCs-transfection efficiency1894
JBUON 2018; 23(6): 1894
characteristics [4,5]. Several of these characteristics include their abundance in bone marrow and adi-pose tissue [6], from which they may be isolated and expanded easily. Additionally, MSCs have rel-atively low immunogenicity, allowing allogeneic transplantation and, in autologous transplantation, a nearly non-existent risk of infection, rejection of implanted cells or ethical limitations. MSCs have two additional remarkable attributes: homing and feasibility for to be genetically engineered. These two features allow MSCs to carry, express and deliv-er transgene protein products inside wounded tis-sues or tumors [7], precisely where they are needed. To be useful for healing tissues or organs, or for fighting tumors, engineered MSCs must exert an effective and safe therapeutic activity. To reach this, a stable and sustained expression of transgenes, carried by engineered MSCs, must be succeeded. Accordingly, adequate molecular vehicles, trans-porting and expressing transgenes of interest, and efficient procedures to introduce them into the cells are essential elements to produce abundant and efficacious engineered MSCs as therapeutic tools. The procedure of introducing plasmids into eu-karyotic cells is called transfection. Under appro-priate conditions, transfected MSCs may efficiently express those transgenes carried by plasmids [8]. Besides, in contrast with viruses, plasmids are not replicated, are not immunogenic and eventually are eliminated by the cells cultured in vitro [9] or when plasmids are inoculated into experimental animals [10], and even in human beings [11]. Thus, the risk of producing undesirable and permanent iatrogenic effects is negligible. The low risk of causing long-term iatrogenic effects allows the use of plasmids to transfect MSCs, and, with time, to use transfected MSCs in preclinical trials [12]. Regarding the procedures to transfect cells, three requirements must be considered: a) the qual-ity of the transfection reagent (cell-permeating rea-gent to DNA); b) the volume of this reagent; and c) the proportion of plasmid (DNA) mass/reagent volume applied to an MSC monolayer. While sev-eral approaches have been explored, transfection is usually conducted using commercial cationic lipids (lipofection) [9,13]; however, traditional methods fail to achieve high transfection levels and low MSC mortality [14]. Additionally, according to our experience, all these reagents are cytotoxic, the intensity of gene expression can vary according to the assay conditions and the transfection reagent. The volume of transfection reagent used on each cell monolayer is also critical, because an exces-sive concentration of it may produce high trans-fection efficiency, along with high cell mortality. Conversely, a low concentration of the transfection
reagent may produce low cell mortality and low transfection efficiency. Alternatively, the propor-tion of transfection reagent volume/DNA mass is also critical: high or low transfection efficiency may be obtained, depending on whether a correct com-bination of these two variables is used. Manufac-turers of transfection reagents usually include with their products the instructions for using them. Fol-lowing these instructions, the typical transfection efficiency is 5-25% [15] without considering cell mortality. In this study, we investigated whether varying the proportion and quantity of transfec-tion reagent/plasmid DNA mass might improve the transfection efficiency and the percentage viability of transfected MSCs by comparing three transfec-tion products.
Methods
Laboratory animals
Balb-c mice aged 4-8 weeks and weighing 20-25 g were used as a source of bone marrow-derived mesen-chymal stem cells (BM-MSCs).
MSC isolation
The mice were sacrificed in a CO2 chamber and their femurs and tibias dissected under aseptic conditions. The epiphyses were removed from the bones using surgical tweezers. The bone marrow (BM) from all bones was collected and mixed into a 25 cm2 screw-capped gas-permeable culture flask (Corning, NY, USA) by perfus-ing 2-4 mL of DMEM F-12 culture medium with 1-mL syringe (Becton Dickinson and Company, Franklin Lakes, NJ, USA). The syringe was armed with a 26-gauge hypo-dermic needle. The DMEM F-12 was supplemented with 10% fetal bovine serum (FBS), gentamycin 100 μg/mL, and amphotericin B 2.5 μg/mL. All DMEM F-12 sup-plements were purchased from Gibco (Thermo Fisher Scientific, Grand Island, NY, USA). Hereafter, the supple-mented DMEM-F12 will be referenced as DMEM-S. The culture flask containing the mouse BM was augmented with 5 mL DMEM-S and incubated at 37°C in a moist atmosphere of 5% CO2. After 24 hrs, the spent medium and non-adherent cells were discarded. The same culture flask, now with a monolayer of cells, was supplemented with 5 mL of fresh DMEM-S. Once the cell monolayers reached 80% confluence, the procedure was repeated until the cell cultures reached passage 3-4.
Characterization of mouse BM-MSCs
Characterization of the BM-MSCs was conducted by identifying BM-MSC markers by immunocytochemistry and by validating the pluripotency of these cells.
BM-MSC identification
The mouse BM-MSC expression of the typical MSC surface markers (CD105 and CD90) was determined as follows: from 90% confluent cultures in 25 cm2 culture flasks, as previously described, viable cells were har-
Improved MSCs-transfection efficiency 1895
JBUON 2018; 23(6): 1895
vested and counted using a Neubauer chamber (Thermo Fisher Scientific). Cell viability was determined by using the trypan blue exclusion test. First, 6×10⁴ cells were poured into 4-well Lab-Tek® microchambers (Nunc®, Thermo Fisher Scientific, Waltham, Massachusetts, USA) and incubated overnight at 37°C in a moist atmosphere of 5% CO2, allowing the cells to attach to the substrate. Immunolabeling was performed by using monoclonal anti-CD105 and anti-CD90 as the primary antibodies (US Biologicals, Salem, Massachusetts, USA), previ-ously diluted 1:25 and 1:200 with phosphate buffered saline (PBS [v/v]), respectively. As secondary antibodies, goat biotinylated polyvalent anti-mouse and anti-rabbit antibodies were used. The secondary antibody and rea-gents were included in the Mouse and Rabbit Specific HRP/DAB (ABC) Detection IHC Kit (Abcam, Burlingame, California, USA). These determinations were performed by following the manufacturers’ recommendations. Sub-sequently, Harris hematoxylin counterstaining was per-formed, according to Llewellyn [16].
Validation of BM-MSC pluripotency
The pluripotency of the BM-MSCs was ascer-tained by evaluating their capacity to differentiate into osteoblasts and chondroblasts [17]. Both assays were performed using the Mouse Mesenchymal Stem Cell Functional Identification Kit (R&D Systems, Inc., Min-neapolis, Minnesota, USA) as follows:
BM-MSC differentiation into osteoblasts
The cells (3×10⁴) were plated on each well of a 4-well Lab-Tek® microchamber (Nunc®, ThermoSci-entific, Waltham, Massachusetts, USA) with each well containing 300 μL StemXVivo® osteogenic/adipogenic base media (R&D Systems, Inc., Minneapolis, Minne-sota, USA). These preparations were incubated at 37°C in a moist atmosphere of 5% CO2 for approximately 2 days, until the monolayers reached 50-70% confluence. The spent medium was replaced with 300 μL supple-mented osteogenic medium (αMEM basal culture me-dium supplemented with 10% FBS, gentamycin 50 μg/mL, amphotericin B 2.5 μg/mL and 15 μL Mouse/Rat Osteogenic supplement 20X (provided with the Mouse Mesenchymal Stem Cell Functional Identification Kit). The osteogenic supplement was composed of ascorbate-phosphate, β-glycerol phosphate, and recombinant hu-man BMP-2. The spent supplemented osteogenic me-dium was replaced by 300 μL of fresh supplemented osteogenic medium every 3 days for 21 days [4]. The BM-MSC differentiation to osteoblasts was validated by staining these cells with Von Kossa stain [18]. Osteo-blasts and chondroblasts were observed using a light-field microscope (Leica DM IL Led, Wetzlar, Germany), at a magnification of 100 or 400 diameters. The micro-scope was equipped with a digital camera, Leica, model DFC295 (Leitz Park in Wetzlar, Germany). Those cells containing typical dark brown-colored nodules (calcium deposits) were identified as osteoblasts [18].
BM-MSC differentiation to chondroblasts
The spent culture medium of the MSC monolayers was replaced with fresh DMEM-S to which an insulin,
transferrin, selenium (ITS) supplement (item number 390418, R&D Systems) and a chondrogenic supplement (dexamethasone, ascorbate-phosphate, proline, pyruvate and recombinant human TGF-β3) were added. The ITS supplement was supplied with the Mouse Mesenchymal Stem Cell Functional Identification Kit (R&D Systems). The spent culture medium was replaced by an equal volume of fresh chondrogenic-supplemented medium every 2-3 days for a total of 21 days. MSC-derived chon-droblasts were identified by staining the cells with alcian blue. Such chondroblasts displayed a blue color from the alcian blue staining for proteoglycans in the matrix[19].
Plasmids
Transfection assays were performed using the plasmid pTracer-EF-His-A® (Invitrogen, ThermoFisher, Waltham, Massachusetts, USA). These plasmids con-tain a green fluorescent protein (GFP) gene, which is expressed constitutively through a cytomegalovirus (CMV) promoter. As an expression vector, it includes a multicloning site (MCS) with several common restric-tion sites downstream from the EF1α promoter, a pUC replication origin for high replication in bacteria and an ampicillin resistance gene for the selection of bacte-ria (along with a zeocin resistance gene for eukaryotic selection). Calcium competent Escherichia coli DH5α [19] was used to amplify pTracer-EF-His-A®. These bacteria were transformed using the heat shock technique using 5 ng plasmid DNA and were plated on Luria-Bertani (LB) agar supplemented with ampicillin 50 μg/mL in a plastic 90 mm diameter Petri dish (Becton-Dickinson). A single colony was raised. Bacteria from this colony were spread into a 5 mL screw-capped polystyrene (Falcon, Corning, NY, USA) test tube containing 2-3 mL LB medium and incubated at 37°C for 18 hrs. From this culture, 0.5 mL was transferred to a sterile 250 mL capacity borosilicate Erlenmeyer flask containing 50 mL LB-ampicillin medi-um and incubated overnight at 37°C, with agitation in an orbital shaker (Maxq 4450, ThermoScientific) adjusted to 200 rpm. The plasmids were purified by employing a Qiagen Plasmid Midi kit (Qiagen, Germantown, USA), following the manufacturer’s instructions. All buffers and solutions were provided with the aforementioned kit. The plasmid DNA purity and the concentration were determined by measuring its absorbance at 260 nm and 280 nm using a Nanodrop® 2000 spectrometer (Thermo Scientific). A >1.80 260/280 ratio was considered accept-able plasmid DNA purity.
Transfection
The BM-MSC transfection efficiency produced was assessed for the following variations in the assay conditions: a) volumes of three different transfection reagents; b) plasmid DNA mass; and c) combinations of transfection reagents and plasmid DNA mass that were evaluated and compared with each other, as de-scribed in Table 1. BM-MSCs (6×10⁴) were seeded into one well of a 24-well clear microplate (Falcon, Corning, NY, USA.). Transfections were performed using each of
Improved MSCs-transfection efficiency1896
JBUON 2018; 23(6): 1896
the 16 assay conditions and one of the three following transfection reagents: Clontech Xfect® transfection rea-gent (Clontech, Takara, Mountain View, California, USA), Turbofect® (Invitrogen) and Lipofectamine 3000® (Ther-moFisher Scientific). All of the abovementioned reagents were supplied with their kits, accompanied by respective instructions for their use. These instructional guidelines are briefly described as follows (the reagents supplied with the kits are annotated in italics, and extra reagents or laboratory supplies, and their brands used by us are shown in parenthesis; in all cases, pTracer-EF-His-A® plasmid, from the same batch, was used): Xfect. Into a 0.6-mL microcentrifuge tube (Corning) containing 100 μL Xfect buffer, add the required plasmid amount (1 μg DNA pTracer-EF-His-A®). Pour the intended concentra-tion of Xfect polymer reagent, previously vortexed (0.3 μL). Incubate the mixture for 10-15 min. Pour the transfec-tion mixture into the well containing the cell monolayer (mouse BM-MSCs). Shake it gently and incubate the preparation for 4 hrs at 37°C in moist 5% CO2. Change the medium and incubate the preparation for 48 hrs un-der the same conditions. Observe transfected MSCs with an epifluorescence microscope. Lipofectamine 3000®. Into a 0.2 mL microcentrifuge tube, pour 25 μL of a reduced-serum media (we used Optimem media [Gibco]). Add the intended concentration of Lipofectamine 3000 reagent (0.75 μL). Add two 0.2 mL microcentrifuge tubes with 25 μL Optimem culture medium. In the first tube, pour 0.75 μL Lipofectamine 3000 reagent. To the second tube, add 1 μg of plasmid DNA. Mix the content of both tubes and incubate for 10-15 min at room temperature. Pour the mixture, dropwise, into a microplate well containing the cell (BM-MSC) monolayer and incubate for 48 hrs. Ob-serve the fluorescent transfected cells. Turbofect transfec-tion reagent®. Into a 0.6 μL microcentrifuge tube, add the required plasmid DNA mass (1 μg) dissolved in a final volume of 100 μL with Optimem. Add 2 μL of Turbofect. Incubate the preparation for 15-20 min at room tempera-ture. Pour the transfection mixture, dropwise, into the well containing the cell monolayer (mouse BM-MSCs). Incubate the microplate for 48 hrs at 37°C in 5% CO2 and
observe the preparation with a fluorescence microscope. All the above-mentioned protocols and assay conditions (proportions of reagent volume/plasmid DNA mass) are referred to hereafter as the original protocols and assay conditions.
Modified protocol for Xfect
The modification made to the Xfect original proto-col consisted of changing the non-adherent transfection complex step (Xfect and non-adherent cells mixed with the spent culture medium) to 48 hrs post-transfection (thus, immediately before fluorescence analysis) instead of 4 hrs (as suggested by the manufacturer). This proto-col is referred to hereafter as the modified Xfect protocol. All experiments were performed three times in duplicate. After 48 hrs of transfection, the BM-MSC monolayers were fixed by adding into each well ice-cold methanol: acetone 1:1 (v:v) for 20 min; they were then washed twice with PBS and counterstained with 4’,6-diamidino-2-phenylindole (DAPI) (Vector Labora-tories Inc., Burlingame, California, USA) by pouring the DAPI solution directly onto the BM-MSC preparations, as instructed for this reagent by the manufacturer. Four fields, randomly chosen, of transfected BM-MSC slides were observed using an epifluorescence microscope (Nokia Eclipse 50i) for GFP/DAPI-positive cell identifi-cation and photographed with a Sight DS-2MV coupled to the microscope.
Level of gene expression
The level of gene expression was a semi-quanti-tative parameter, estimated according to the signal in-tensity of green fluorescence observed in the majority of the BM-MSCs. These cells were counted manually with the aid of the 32-bit software ImageJ, developed by the National Institutes of Health (NIH), freely avail-able online: https://imagej.nih.gov/ij/download.html. The signal intensity shown by most cells in 5 microscopic fields, randomly selected, was estimated as follows: +, the lowest signal intensity; ++, low intensity; +++, high intensity; and ++++, the highest intensity.
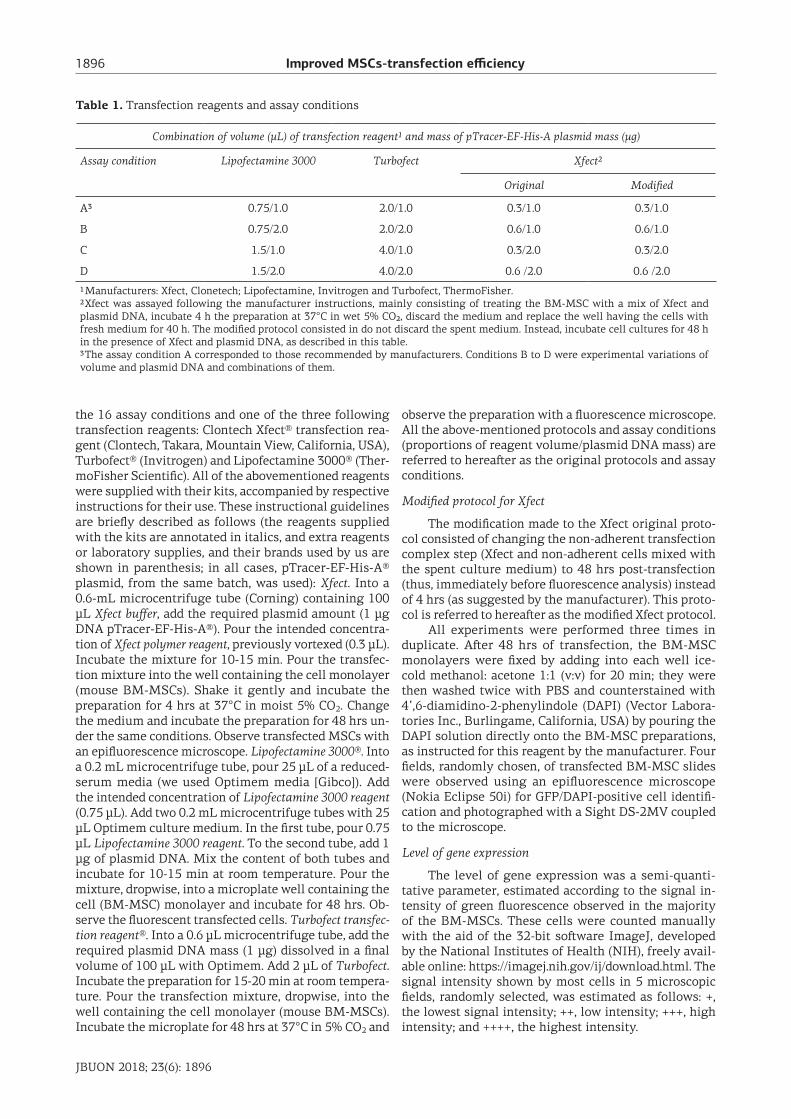
Combination of volume (µL) of transfection reagent1 and mass of pTracer-EF-His-A plasmid mass (µg)
Assay condition Lipofectamine 3000 Turbofect Xfect2
Original Modified
A3 0.75/1.0 2.0/1.0 0.3/1.0 0.3/1.0
B 0.75/2.0 2.0/2.0 0.6/1.0 0.6/1.0
C 1.5/1.0 4.0/1.0 0.3/2.0 0.3/2.0
D 1.5/2.0 4.0/2.0 0.6 /2.0 0.6 /2.0 1 Manufacturers: Xfect, Clonetech; Lipofectamine, Invitrogen and Turbofect, ThermoFisher.2 Xfect was assayed following the manufacturer instructions, mainly consisting of treating the BM-MSC with a mix of Xfect and plasmid DNA, incubate 4 h the preparation at 37°C in wet 5% CO2, discard the medium and replace the well having the cells with fresh medium for 40 h. The modified protocol consisted in do not discard the spent medium. Instead, incubate cell cultures for 48 h in the presence of Xfect and plasmid DNA, as described in this table.3 The assay condition A corresponded to those recommended by manufacturers. Conditions B to D were experimental variations of volume and plasmid DNA and combinations of them.
Table 1. Transfection reagents and assay conditions
Improved MSCs-transfection efficiency 1897
JBUON 2018; 23(6): 1897
Transfection efficiency
The transfection efficiency in each experimental condition was determined by applying the following equation:
where % TE is the percentage of transfection efficiency, NGFPC is the number of green fluorescent BM-MSCs, and TNDAPI is the total number of cells showing nuclei stained with DAPI.
Cell viability
The viability of BM-MSCs, transfected under each condition as shown in Table 1, was determined by cul-turing these cells in 96-well black polystyrene plates (Corning, NY, USA) with DMEM-S at 37°C in moist 5% CO2 for 48 hrs. The viability analysis was performed by using the Cytoselect® Viability Assay kit (Cell Biolabs), following the manufacturer’s instructions. The results were obtained by fluorescence analysis using a plate
%T = N ×100T
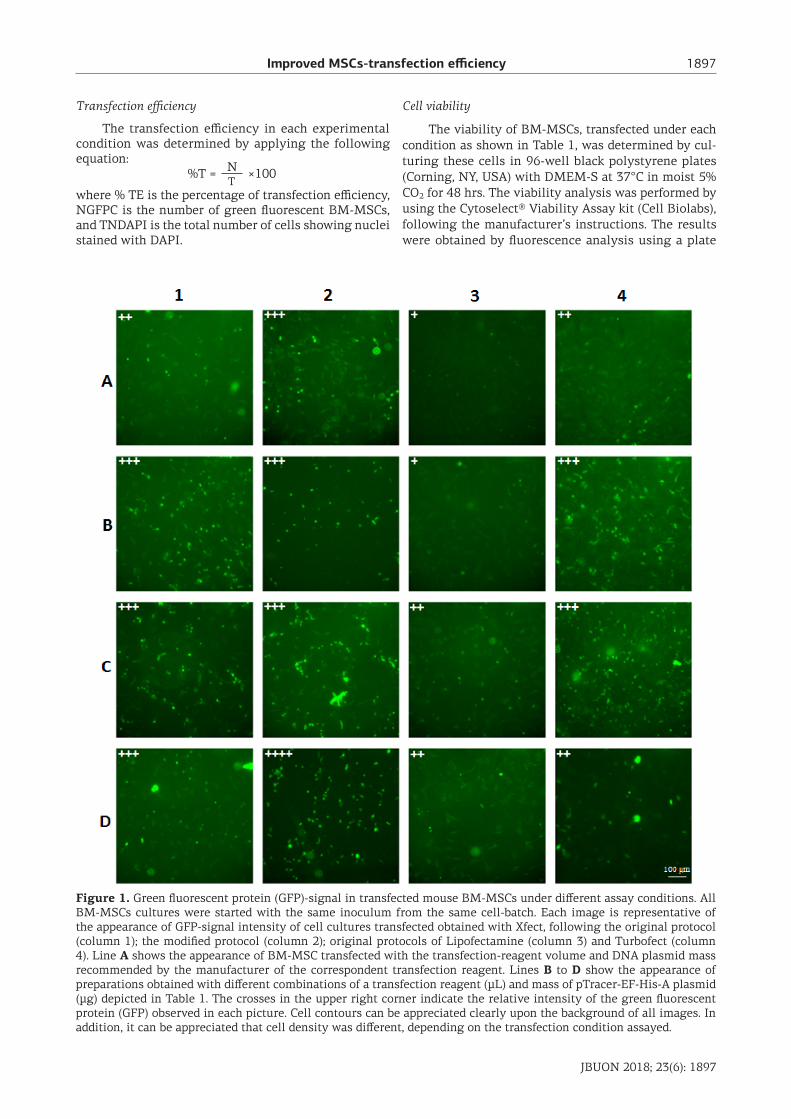
Figure 1. Green fluorescent protein (GFP)-signal in transfected mouse BM-MSCs under different assay conditions. All BM-MSCs cultures were started with the same inoculum from the same cell-batch. Each image is representative of the appearance of GFP-signal intensity of cell cultures transfected obtained with Xfect, following the original protocol (column 1); the modified protocol (column 2); original protocols of Lipofectamine (column 3) and Turbofect (column 4). Line A shows the appearance of BM-MSC transfected with the transfection-reagent volume and DNA plasmid mass recommended by the manufacturer of the correspondent transfection reagent. Lines B to D show the appearance of preparations obtained with different combinations of a transfection reagent (μL) and mass of pTracer-EF-His-A plasmid (μg) depicted in Table 1. The crosses in the upper right corner indicate the relative intensity of the green fluorescent protein (GFP) observed in each picture. Cell contours can be appreciated clearly upon the background of all images. In addition, it can be appreciated that cell density was different, depending on the transfection condition assayed.
Improved MSCs-transfection efficiency1898
JBUON 2018; 23(6): 1898
reader a Cytation 3 multi-mode reader (Biotek, Winooski, Vermont, USA), at an excitation wavelength (λ) of 485 nm (λ485) and an emission wavelength of 515 nm (λ515).
Estimation of efficiency/cell viability transfection balance
This parameter was obtained by calculating the ef-ficiency/cell viability.
Performance index
The performance index was calculated to evaluate the combination of all three features under the assay conditions (signal intensity, transfection efficiency, and cell viability). These calculations were performed by ap-plying the following equation:
PI = (SI+TE+CV)/3where PI is the performance index, SI is the signal in-tensity of BM-MSCs expressing the GFP gene, TE is the transfection efficiency, and CV is the cell viability. The GFP-gene expression level, expressed initially as + to ++++ (Figure 1), was converted to numbers (1-4) and
multiplied by 10 to allow the inclusion of this parameter in the PI equation.
Statistics
SPSS software V.15 (SPSS Inc., Chicago, IL, USA) was used to obtain the average ± standard deviation (SD) and conduct the statistical analyses. Transfection efficiency and cell viability were determined for the 16 assay transfection conditions included in the current study. Significant (p<0.05) differences between groups or intragroup results (Table 2) were analyzed by applying the Kruskal-Wallis H- and the Mann-Whitney U-tests.
Ethical considerations
The present study is part of a larger one, which was authorized by the Scientific Research and Bioethics Committee and the Institutional Animal Care Commit-tees of the School of Medicine, Autonomous University of Nuevo Leon, Mexico (BI15-005). The mice were han-dled according to the Mexican NOM-062-ZOO-1999 regulations.
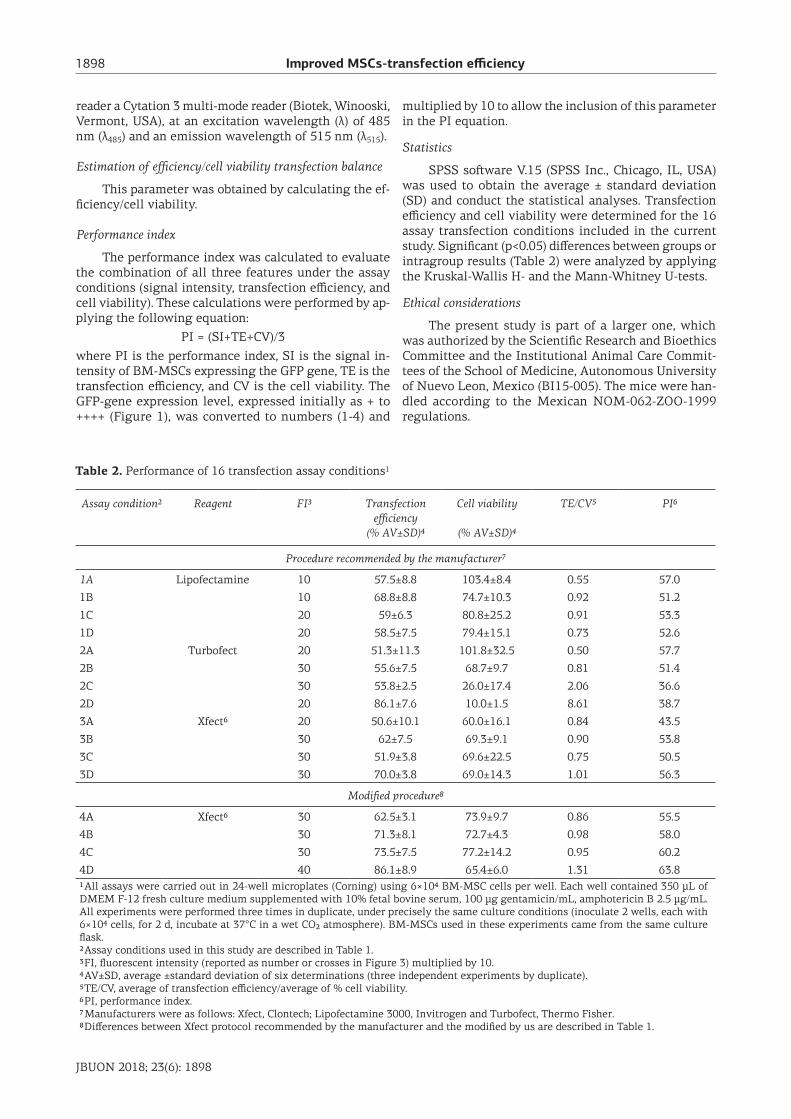
Assay condition2 Reagent FI3 Transfection efficiency
(% AV±SD)4
Cell viability
(% AV±SD)4
TE/CV5 PI6
Procedure recommended by the manufacturer7
1A Lipofectamine 10 57.5±8.8 103.4±8.4 0.55 57.0
1B 10 68.8±8.8 74.7±10.3 0.92 51.2
1C 20 59±6.3 80.8±25.2 0.91 53.3
1D 20 58.5±7.5 79.4±15.1 0.73 52.6
2A Turbofect 20 51.3±11.3 101.8±32.5 0.50 57.7
2B 30 55.6±7.5 68.7±9.7 0.81 51.4
2C 30 53.8±2.5 26.0±17.4 2.06 36.6
2D 20 86.1±7.6 10.0±1.5 8.61 38.7
3A Xfect6 20 50.6±10.1 60.0±16.1 0.84 43.5
3B 30 62±7.5 69.3±9.1 0.90 53.8
3C 30 51.9±3.8 69.6±22.5 0.75 50.5
3D 30 70.0±3.8 69.0±14.3 1.01 56.3
Modified procedure8
4A Xfect6 30 62.5±3.1 73.9±9.7 0.86 55.5
4B 30 71.3±8.1 72.7±4.3 0.98 58.0
4C 30 73.5±7.5 77.2±14.2 0.95 60.2
4D 40 86.1±8.9 65.4±6.0 1.31 63.81 All assays were carried out in 24-well microplates (Corning) using 6×10⁴ BM-MSC cells per well. Each well contained 350 μL of DMEM F-12 fresh culture medium supplemented with 10% fetal bovine serum, 100 μg gentamicin/mL, amphotericin B 2.5 μg/mL. All experiments were performed three times in duplicate, under precisely the same culture conditions (inoculate 2 wells, each with 6×10⁴ cells, for 2 d, incubate at 37°C in a wet CO2 atmosphere). BM-MSCs used in these experiments came from the same culture flask.2 Assay conditions used in this study are described in Table 1. 3 FI, fluorescent intensity (reported as number or crosses in Figure 3) multiplied by 10.4 AV±SD, average ±standard deviation of six determinations (three independent experiments by duplicate).5 TE/CV, average of transfection efficiency/average of % cell viability.6 PI, performance index. 7 Manufacturers were as follows: Xfect, Clontech; Lipofectamine 3000, Invitrogen and Turbofect, Thermo Fisher.8 Differences between Xfect protocol recommended by the manufacturer and the modified by us are described in Table 1.
Table 2. Performance of 16 transfection assay conditions1

Improved MSCs-transfection efficiency 1899
JBUON 2018; 23(6): 1899
Results
Mouse BM-MSC characterization
Figure 2 shows that nearly all adherent mouse BM cells from passage 5 were CD90+ and CD105+. Figure 3 shows that the great majority of cells derived from BM-MSCs stained intensely with al-cian blue (Figure 3A), indicating that these cells produced a considerable quantity of glycosamino-glycans. In contrast, Figure 3B shows several dark-brown nodules, which were stained by Von Kossa stain, denoting abundant intracellular deposits of calcium.
GFP expression by BM-MSCs
Figure 1 shows a panel of results obtained with all transfection conditions. This group of images shows apparent variability in the number of trans-fected BM-MSCs and in their intensity of fluores-cence as a measurable effect of the GFP expression, which depended on the transfection reagent used, its volume and the combinations of transfection re-agent volume and plasmid mass. The highest GFP signal intensity (++++) in the majority of cells is shown in the image 2D, corresponding the modi-fied Xfect protocol column, using a combination of 0.6 μL Xfect/2.0 μg pTracer-EF-His-A plasmid
Figure 2. Mouse bone marrow (BM) showing surface CD90 and CD105 markers. Mouse BM monolayers form the 5th passage, cultured in DMEM F-12 medium supplemented with fetal bovine serum 10%, gentamycin 100 μg /mL, ampho-tericin B 2.5 μg/mL were labeled by immunocytochemistry with primary anti-CD90 (A) or anti-CD105 (B) monoclonal antibodies and polyvalent mouse and rabbit as secondary antibodies. The reaction was revealed with Harris hematoxy-lin and a substrate chromogen solution. Positive staining is observed as an intense brown color on practically all cells from both A and B Figures.
A B
Figure 3. Multipotency of BM-MSCs. Cells derived from BM-MSCs were intensely stained in a green-bluish color with alcian blue (A), denoting the presence of abundant glycoseminoglycans. Nearly all cells were stained with the Von Ko-ssa colorant, showing an intense brown-pink color (B), indicating that these cells internalized a considerable quantity of calcium deposits.
A B
Improved MSCs-transfection efficiency1900
JBUON 2018; 23(6): 1900
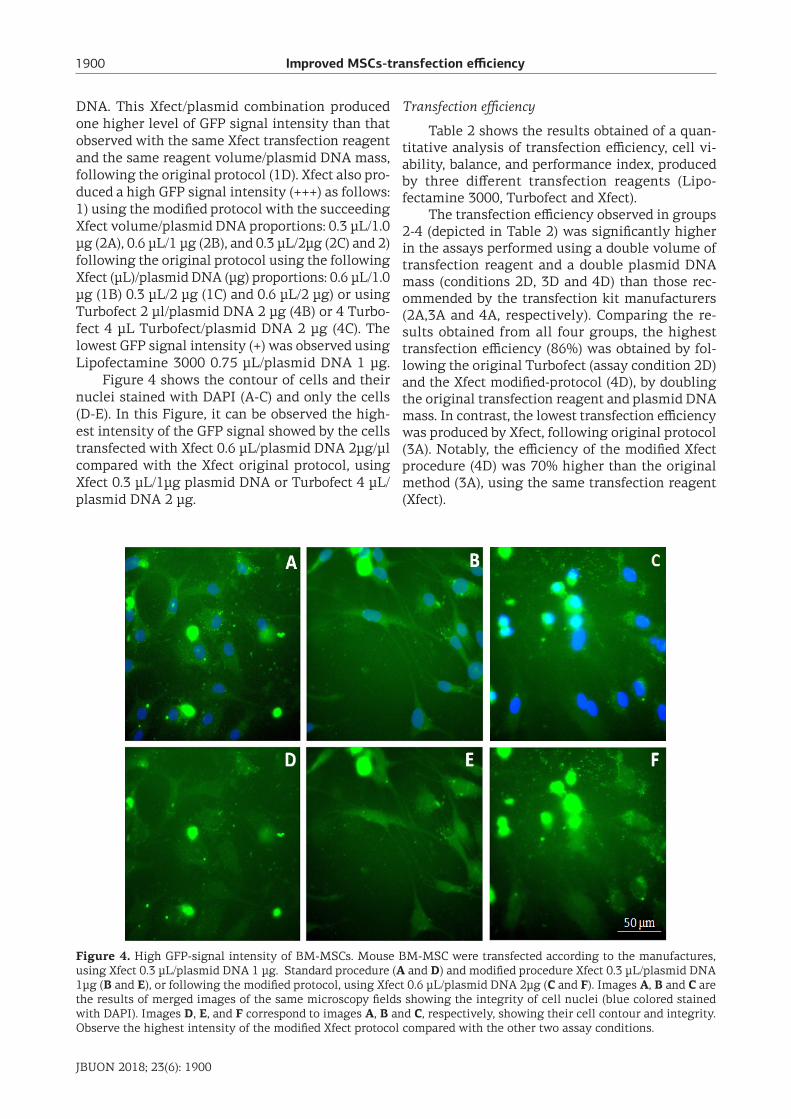
DNA. This Xfect/plasmid combination produced one higher level of GFP signal intensity than that observed with the same Xfect transfection reagent and the same reagent volume/plasmid DNA mass, following the original protocol (1D). Xfect also pro-duced a high GFP signal intensity (+++) as follows: 1) using the modified protocol with the succeeding Xfect volume/plasmid DNA proportions: 0.3 μL/1.0 μg (2A), 0.6 μL/1 μg (2B), and 0.3 μL/2μg (2C) and 2) following the original protocol using the following Xfect (μL)/plasmid DNA (μg) proportions: 0.6 μL/1.0 μg (1B) 0.3 μL/2 μg (1C) and 0.6 μL/2 μg) or using Turbofect 2 μl/plasmid DNA 2 μg (4B) or 4 Turbo-fect 4 μL Turbofect/plasmid DNA 2 μg (4C). The lowest GFP signal intensity (+) was observed using Lipofectamine 3000 0.75 μL/plasmid DNA 1 μg. Figure 4 shows the contour of cells and their nuclei stained with DAPI (A-C) and only the cells (D-E). In this Figure, it can be observed the high-est intensity of the GFP signal showed by the cells transfected with Xfect 0.6 μL/plasmid DNA 2μg/μl compared with the Xfect original protocol, using Xfect 0.3 μL/1μg plasmid DNA or Turbofect 4 μL/plasmid DNA 2 μg.
Transfection efficiency
Table 2 shows the results obtained of a quan-titative analysis of transfection efficiency, cell vi-ability, balance, and performance index, produced by three different transfection reagents (Lipo-fectamine 3000, Turbofect and Xfect). The transfection efficiency observed in groups 2-4 (depicted in Table 2) was significantly higher in the assays performed using a double volume of transfection reagent and a double plasmid DNA mass (conditions 2D, 3D and 4D) than those rec-ommended by the transfection kit manufacturers (2A,3A and 4A, respectively). Comparing the re-sults obtained from all four groups, the highest transfection efficiency (86%) was obtained by fol-lowing the original Turbofect (assay condition 2D) and the Xfect modified-protocol (4D), by doubling the original transfection reagent and plasmid DNA mass. In contrast, the lowest transfection efficiency was produced by Xfect, following original protocol (3A). Notably, the efficiency of the modified Xfect procedure (4D) was 70% higher than the original method (3A), using the same transfection reagent (Xfect).
Figure 4. High GFP-signal intensity of BM-MSCs. Mouse BM-MSC were transfected according to the manufactures, using Xfect 0.3 μL/plasmid DNA 1 μg. Standard procedure (A and D) and modified procedure Xfect 0.3 μL/plasmid DNA 1μg (B and E), or following the modified protocol, using Xfect 0.6 μL/plasmid DNA 2μg (C and F). Images A, B and C are the results of merged images of the same microscopy fields showing the integrity of cell nuclei (blue colored stained with DAPI). Images D, E, and F correspond to images A, B and C, respectively, showing their cell contour and integrity. Observe the highest intensity of the modified Xfect protocol compared with the other two assay conditions.

Improved MSCs-transfection efficiency 1901
JBUON 2018; 23(6): 1901
Cell viability
By comparing the cell viability of the BM-MSCs (Table 2), after being transfected the mouse BM-MSCs, the lowest viability was produced by Turbofect (2D), and the highest viability, was pro-duced by lipofectamine 3000 (1A). The range of cell viability was 10.0% to 103.4%. By doubling the volume and DNA plasmid in the 1A and 2 D assay conditions, the cell viability decreased to 27% and 90% with respect to cell viability observed with the reagent volume and plasmid DNA recommended by the respective manufacturers. The above differ-ences were statistically significant. On the other hand, no significant differences in cell viability were observed by increasing the transfection vol-ume of Xfect or plasmid DNA mass with respect to the cell viability produced by the original or modified protocol, using the reagent/ plasmid DNA recommended by the Xfect manufacturer.
Balance between transfection efficiency and cell viability
Table 2 shows the balance between transfec-tion efficiency (TE) and cell viability (CV) in all 16 BM-MSC transfection assay conditions, which was expressed as TE/CV. The best balance was observed for the 3D assay condition, followed by the ratios for 4B and 4C. The balances >1.00 or <0.1, respec-tively, indicate a predominance of TE over CV or vice versa. The worst balance, showing ratios >1.00 was observed in 2C, followed by 2D, and the worst balance, showing ratios < 1.00 were produced by the assay condition 2A followed by 1A.
Performance index
The PI range was 43.5 (3A) to 63.8 (4D). The PI of the modified Xfect protocol (4D) was 46.7% higher than the original protocol (3A). On the oth-er hand, by doubling the Lipofectamine or Turbo-fect volume and the plasmid DNA (1D and 3D), the PI diminished (7.7 % and 33%, respectively) with respect to the PIs observed by following the respective manufacturer recommendations (1Aand 3A).
Discussion
We have demonstrated a method to improve the performance of three prestigious trademarked reagents [20,21] and a plasmid carrying a preferred reporter to transfect mouse BM-MSCs. This report-er allows the identification and evaluation of the physical state of the cell and is designed to carry transgenes and to express and deliver the respec-tive gene products in cell cultures and laboratory
animals; moreover, due to homing, MSCs may de-liver transgene products precisely to the wounded organ or tissue or tumor [3]. Considering that trans-fected MSCs are excellent transgene vehicles, the goal of this article was to describe a procedure to improve the performance of mouse BM-MSC trans-fection methods using commercial products. Our current contribution might increase the efficacy of MSCs to regenerate organs and tissues and to fight cancer. We focused on the performance of a set of three closely related features of transfection: the expres-sion level of the gene of interest, transfection ef-ficiency and cell viability. The higher the values for each of these three variables, the higher the per-formance of this feature set. We have shown here that an imbalance of any of these three variables clearly diminishes the transfection performance. To evaluate this phenomenon, we used a performance index (PI), which allowed us to readily identify the best and worst transfection protocols and assay conditions (combinations of transfection reagent and plasmid DNA mass). We showed that the two features that more highly influence performance are transfection efficiency and viability. Thus, we calculated a ratio of these two features as an ad-ditional measure to evaluate the balance between them. We evaluated the expression level of the gene of interest using as a reporter the GFP because this protein is easily detected by the fluorescence intensity of transfected cells. We evaluated this feature on a scale from 1 to 4 and, to give it more weight in the PI calculations, these numbers were multiplied by 10. The expression level of a gene depends on many factors, such as enhancers, gene promoters, and expression factors. Nevertheless, we disregarded all these factors as confounders because the only variables that we introduced in our experiments were the volume of transfection reagents and plasmid DNA mass. Thus, the fluo-rescence intensity of GFP was possibly due to a combined effect of each transfection reagent on the metabolism of the BM-MSCs and the number of plasmid DNA copies internalized by the cells. Accordingly, when the manufacturers’ directions were followed, Lipofectamine produced the lowest, Turbofect an intermediate and Xfect the highest expression level of GFP. When the reagent volume and plasmid DNA mass were doubled, the GFP expression level increased by 34% with respect to the GFP expression by following the original Xfect´s protocol. Another factor that strongly in-fluenced the expression level of GFP was the modi-fied Xfect protocol. This modification increased the GFP expression level to 50% compared with that
Improved MSCs-transfection efficiency1902
JBUON 2018; 23(6): 1902
observed using the original protocol. We noted a strong diminution of fluorescence of the BM-MSCs treated with 0.3-0.9 μL Xfect and 3 μL plasmid DNA (data not shown). This fact strongly suggests that an excess of transfection agent, plasmid DNA or both may be toxic for cells and it is in accord with that of a previous study [22]. The transfection pro-tocol also influenced the expression level of GFP substantially. We experimented with a modified transfection protocol using Xfect. In this modifica-tion, instead of changing the medium 4 hrs after Xfect and plasmid DNA complexes were added to the BM-MSC cultures, the cells were incubated for 48 hrs in the presence of Xfect and plasmids. This change constituted one of the most significant modifications, producing a doubling of the GFP expression level. This adjustment might improve the expression level of many transgenes, such as among transfected cells from various origins and with the use of different transfection reagents. Transfection efficiency was the main feature of the assay conditions and modified protocols evaluated in this study. The noteworthy increase in transfection efficiency was achieved by doubling the transfection Turbofect or Xfect volume and the plasmid DNA mass, along with avoiding changing the medium prior to 48 hrs after starting transfec-tion with Xfect (modified Xfect protocol). The com-bination of doubling the Xfect volume and plasmid DNA mass and modifying the protocol increased the transfection efficiency strikingly compared with the protocol and instructions recommended by the Xfect manufacturer. The function of transfection reagents is to per-meabilize cells to non-viral molecular carriers [22]. This transfection agent feature implies a cytotoxic effect on cells [20]. Thus, an insufficient volume of the transfection agent may result in a low trans-fection efficiency and a low expression level of the transgene of interest. Conversely, an excessive vol-ume of the transfection agent may result in a high transfection efficiency, with a low cell viability. Both effects were observed in the current study. For example, by doubling the recommended volume of Turbofect, the transfection efficiency increased, whereas the cell viability significantly diminished. An excess of plasmid DNA mass may also exert a deleterious effect on cells, while a deficiency of this genetic material may result in a low transfec-tion efficiency, as observed with Turbofect. An ex-cess of transfection agent and plasmid DNA mass may further diminish the cell viability, as observed with Turbofect. Therefore, the best results might be obtained by identifying a balance between the volume of the transfection reagent and the plasmid DNA mass. We analyzed this fact by calculating
the ratio of transfection efficiency/cell viability as determined under each of the 16 assay conditions here evaluated. Accordingly, an optimal balance between transfection efficiency and plasmid DNA mass was observed with lipofectamine and Xfect, following the protocol recommended by the manu-facturers for the former and with a doubling of the Xfect volume and plasmid DNA mass providing the best balance using Xfect. Furthermore, this ratio also indicates whether the transfection efficiency is surpassing cell viability or vice versa. Both situ-ations are undesirable. Notwithstanding, by vary-ing the proportion of the reagent volume or the plasmid DNA mass, a good balance may be found. Despite identifying a suitable ratio to analyze the balance between transfection efficiency and cell viability, we observed that superior results might be obtained by including the level of expression in the analysis. Thus, we calculated a PI, which is the sum of all the transfection features of the protocols followed, transfection efficiency and cell viability, divided by three. This PI allowed us to identify the best assay conditions and transfection protocol. The modified Xfect protocol (assay condi-tion 4D), showed the highest expression level and expression efficiency, maintaining the same viabil-ity observed with the original protocol (3A). Closely following the abovementioned results were those for lipofectamine with a doubling of the volume of this reagent or by doubling its volume and plas-mid DNA mass. In conclusion, transgene expres-sion levels, transfection efficiency, and cell viability may be strikingly improved, obtaining a greater quantity of transfected MSCs and upgrading transgene expression. This improvement may be achieved by increasing the volume of the transfec-tion agent, the plasmid DNA mass or both beyond those recommended by transfection reagent and kit manufacturers. In the particular case of Xfect, the performance index may be further improved by incubating the cells in the presence of the trans-fection mixture for 48 hrs instead of 4 hrs and by doubling the Xfect volume and plasmid DNA mass. The balance between the abovementioned transfec-tion features must be carefully adjusted by apply-ing a transfection efficiency/cell viability ratio and a performance index, as currently described.
Acknowledgements
González-Villarreal holds a doctoral fellowship by CONACyT.
Conflict of interests
The authors declare no conflict of interests.
Improved MSCs-transfection efficiency 1903
JBUON 2018; 23(6): 1903
References
1. Garza-Trevino EN, Rodriguez-Gonzalez MS, Delgado Gonzalez P et al. Remarkably higher efficacy and a wid-er safety window for nonfrontline over first-line drug combinations in the adenocarcinoma colo 320dm cell line. JBUON 2017;22:1115-21.
2. Crawford S. It is time for a new paradigm for systemic cancer treatment? Lessons from a century of cancer chemotherapy. Frontiers in Pharmacology. Pharmacol Anticancer Drugs 2013;4:1-21.
3. González-Villarreal C, Martínez-Rodríguez HG, Said-Fernández S. How desirable and undesirable features of naïve or genetically reengineered mesenchymal stem cells are being considered in preclinical or clinical as-says. JBUON 2017;22:812-30.
4. Pittenger MF, Mackay AM, Beck SC et al. Multilineage Potential of Adult Human Mesenchymal Stem Cells. Science 1999;284:143-7.
5. Caplan A. Mesenchymal stem cells. J Orthop Res 1991;9:641-50.
6. Zuk PA, Zhu M, Mizuno H et al. Multilineage cells from human adipose tissue: implications for cell-based therapies. Tissue Eng 2001;7:211-28.
7. Caplan A. Mesenchymal stem cells and gene therapy. Clin Ortop Relat Res 2000;379 (Suppl):S67-S70.
8. Studeny M, Marini FC, Champlin RE, Zompetta C, Fidler IJ, Andreeff M. Bone marrow-derived mesenchy-mal stem cells as vehicles for interferon-beta delivery into tumors. Cancer Res 2002;62:3603-08.
9. Kim TK, Eberwine JH. Mammalian cell transfec-tion: the present and the future. Anal Bioanal Chem 2010;397:3173-8.
10. Maruyama H, Higuchi N, Nishikawa Y et al. Kidney-targeted naked DNA transfer by retrograde renal vein injection in rats. Hum Gene Ther 2002;13:455-68.
11. Williams PD, Kingston PA. Plasmid-mediated gene therapy for cardiovascular disease. Cardiovasc Res 2011;91:565-76.
12. Wang T, Liao TA, Zhong SB. Transfection of bone mar-row mesenchymal stem cells using green fluorescence
protein labeled hVEGF165 recombinant plasmid medi-ated by liposome. Asian Pac J Trop Med 2013;6:739-42.
13. Felgner PL, Gadek TR, Holm M et al. Lipofection: a highly efficient, lipid-mediated DNA-transfection pro-cedure. Proc Natl Acad Sci 1987;84:7413-7.
14. Baksh D, Song L, Tuan RS. Adult mesenchymal stem cells: characterization, differentiation, and application in cell and gene therapy. J Cell Mol Med 2004; 8:301-16.
15. Gheisari Y, Soleimani M, Azadmanesh K, Zeinali S. Multipotent mesenchymal stromal cells: optimization and comparison of five cationic polymer-based gene delivery methods. Cytotherapy 2008;10:815-23.
16. Llewellyn BD. Nuclear staining with alum hematoxy-lin. Biotech Histochem 2009;84:159-77.
17. Dominici M, Le Blanc K, Mueller I et al. Minimal cri-teria for defining multipotent mesenchymal stromal cells. The International Society for Cellular Therapy position statement. Cytotherapy 2006;8:315-7.
18. van Griensven, M., Zeichen, J., Tschernig, T., Seekamp, A., Pape, H-C. A modified method to culture human os-teoblast from bone tissue specimens using fibrin glue. Exp Toxicol Pathol 2002;54:25-9.
19. Surgical pathology - Histology. Staining manual - Carbohydrates. Alcian Blue Ph 2.5 - Acid mucopoly-saccharides. [https://library.med.utah.edu/WebPath/HISTHTML/MANUALS/ALCIAN.PDF]
20. Tie JK, Jin DY, Stafford DW. Human vitamin K epoxide reductase and its bacterial homologue have different membrane topologies and reaction mechanisms. J Biol Chem 2012;287:33945-55.
21. Gedaly R, Galuppo R, Daily MF et al. Targeting the Wnt/β-catenin signaling pathway in liver cancer stem cells and hepatocellular carcinoma cell lines with FH535. PLoS One 2014, Jun18;9(6):e99272. doi: 10.1371/journal.pone.0099272.
22. Salimzadeh L, Jaberipour M, Hosseini A, Ghaderi A. Non-viral transfection methods optimized for gene de-livery to a lung cancer cell. Avicenna J Med Biotechnol 2013;5:68-77.