bolivia reducing maternal and infant...
TRANSCRIPT

Report No. 126362
JUNE 20, 2018
BOLIVIA
Reducing Maternal and Infant Mortality: A multi-project evaluation of 16 years of World Bank support to the health sector

© 2018 International Bank for Reconstruction
and Development / The World Bank
1818 H Street NW
Washington DC 20433
Telephone: 202-473-1000
Internet: www.worldbank.org
Attribution—Please cite the work as follows:
World Bank. 2018. Bolivia—Reducing Maternal
and Infant Mortality: A multi-project evaluation
of 16 years of World Bank support to the health
sector. Independent Evaluation Group, Project
Performance Assessment Report 126362.
Washington, DC: World Bank.
This work is a product of the staff of The World
Bank with external contributions. The findings,
interpretations, and conclusions expressed in
this work do not necessarily reflect the views of
The World Bank, its Board of Executive
Directors, or the governments they represent.
The World Bank does not guarantee the
accuracy of the data included in this work. The
boundaries, colors, denominations, and other
information shown on any map in this work do
not imply any judgment on the part of The
World Bank concerning the legal status of any
territory or the endorsement or acceptance of
such boundaries.
RIGHTS AND PERMISSIONS
The material in this work is subject to copyright.
Because The World Bank encourages
dissemination of its knowledge, this work may be
reproduced, in whole or in part, for
noncommercial purposes as long as full
attribution to this work is given.
Any queries on rights and licenses, including
subsidiary rights, should be addressed to
World Bank Publications, The World Bank
Group, 1818 H Street NW, Washington, DC
20433, USA; fax: 202-522-2625; e-mail:

Report No.: 126362
PROJECT PERFORMANCE ASSESSMENT REPORT
BOLIVIA
HEALTH SECTOR REFORM PROJECT (IDA Q0940, IDA 32440)
SECOND PHASE OF THE HEALTH SECTOR REFORM PROGRAM (IDA 3541A, IDA 35410)
EXPANDING ACCESS TO REDUCE HEALTH INEQUITIES
(IDA 43820)
June 20, 2018
Human Development and Economic Management Independent Evaluation Group

ii
Currency Equivalents (annual averages)
Currency Unit = Bolivian Bolivianos (BOB)
1999 $1.00 BOB 5.72 2000 $1.00 BOB 6.02 2001 $1.00 BOB 6.52 2002 $1.00 BOB 7.06 2003 $1.00 BOB 7.61 2004 $1.00 BOB 7.91 2005 $1.00 BOB 8.09 2006 $1.00 BOB 8.00 2007 $1.00 BOB 8.00 2008 $1.00 BOB 7.35 2009 $1.00 BOB 7.03 2010 $1.00 BOB 7.02 2011 $1.00 BOB 7.01 2012 $1.00 BOB 6.89 2013 $1.00 BOB 7.01 2014 $1.00 BOB 6.91 2015 $1.00 BOB 6.90 2016 $1.00 BOB 6.92 All dollar amounts are U.S. dollars unless otherwise indicated.
Abbreviations APL Adaptable Program Loan CAI Comité de Análisis de Información en Salud (Health Information Analysis Committee) CAS Country Assistance Strategy CPF Country Partnership Framework DGSS Dirección General de Servicios de Salud (General Office of Health Services) DHS Demographic and Health Survey DPT Diphtheria, pertussis, and tetanus EDSA Encuesta Nacional de Demografía y Salud EXTENSA Programa Nacional para la Extensión de Cobertura de Seguros (National Program for the
Expansion of Health Insurance) FPS Fondo Nacional de Inversión Productiva y Social (National Fund of Productive and Social
Investment) GDP gross domestic product HIB Haemophilus influenzae type B vaccine ICR Implementation Completion and Results Report IDA International Development Association IEG Independent Evaluation Group IMCI Integrated Management of Childhood Illness INE Instituto Nacional de Estadística (National Institute of Statistics) KPI key performance indicator M&E monitoring and evaluation MAR Mecanismo de Asignación de Recursos (Resource Allocation Mechanism) MBP Mother-Baby Package MDG Millennium Development Goal MOH Ministry of Health NGO nongovernmental organization PAD project appraisal document

PAHO Pan-American Health Organization PAI Programa Ampliado de Inmunizaciones (Expanded Program of Immunization) PDO project development objective PPAR Project Performance Assessment Report PRONACS Proyecto Nacional de Calidad de Salud (National Program of Quality) PRSP Poverty Reduction Strategy Paper SAFCI Salud Familiar Comunitaria Intercultural (Intercultural, Family and Community Health) SBS Seguro Básico de Salud (Basic Health Insurance) SEDES Servicios Departamentales de Salud (Departmental Health Services) SICE Sistema de Información Clínico Estadístico (Statistical Clinical Information System) SICOF Sistema de Control Financiero de Salud (Financial Management Control System) SNIS Sistema Nacional de Información en Salud (National Health Information System) SNMN Seguro Nacional de Maternidad y Niñez (National Maternal and Child Insurance) SOAPS Software de Atención Primaria en Salud (Primary Health Care Software) SSPAM Seguro de Salud para el Adulto Mayor (Health Insurance for the Senior Citizen) SU SALUD Seguro Universal en Salud (Universal Health Insurance) SUMI Seguro Universal Materno-Infantil (Universal Mother-Child Insurance) SUS Sistema Único de Salud (Unified Health System) UDAPE Unidad de Análisis de Políticas Sociales y Económicas (Unit Responsible for Social and
Economic Policy Analysis) URS Unidad de Reforma de Salud (Health Reform Unit) WHO World Health Organization Fiscal Year
Government: January 1 – December 31
Director-General, Independent Evaluation Ms. Caroline Heider Director, Human Development and Economic Management Mr. Auguste Tano Kouame Manager, Corporate and Human Development Ms. Emanuela Di Gropello Task Manager Ms. Mercedes Vellez


v
Contents Abbreviations ...................................................................................................................... ii Principal Ratings ............................................................................................................... vii Key Staff Responsible ...................................................................................................... viii Preface ................................................................................................................................. x
Summary ........................................................................................................................... xii Health Sector Reform Project (APL I) .......................................................................... xii Second Phase of the Health Sector Reform Program (APL II) ................................... xiv
Expanding Access to Reduce Health Inequities (APL III) .......................................... xvi Lessons ....................................................................................................................... xviii
1. Background and Context................................................................................................. 1
Health Sector ................................................................................................................... 1
Issues and Challenges ..................................................................................................... 3
National Priorities ........................................................................................................... 3
2. Health Sector Reform Project (APL I) ............................................................................ 4
Objectives, Design, and Relevance ................................................................................. 4
Implementation ............................................................................................................. 11
Achievement of the Objectives ..................................................................................... 13
Efficiency ...................................................................................................................... 20
Ratings .......................................................................................................................... 20
3. Second Phase of the Health Sector Reform Program (APL II) .................................... 25
Objectives, Design, and Relevance ............................................................................... 25
Implementation ............................................................................................................. 28
Achievement of the Objectives ..................................................................................... 30
Efficiency ...................................................................................................................... 35
Ratings .......................................................................................................................... 35
4. Expanding Access to Reduce Health Inequities (APL III) ........................................... 38
Objectives, Design, and Relevance ............................................................................... 38
Implementation ............................................................................................................. 44
Achievement of the Objectives ..................................................................................... 46
Efficiency ...................................................................................................................... 53
Ratings .......................................................................................................................... 54
5. A 16-Year Program: Conclusions and Lessons ............................................................ 58

vi
APL Contributions ........................................................................................................ 58
Lessons .......................................................................................................................... 60
References ......................................................................................................................... 62
Boxes
Box 2.1. Health Sector Reform Project (APL I) Components ............................................ 8 Box 3.1. Second Phase of the Health Sector Reform Program (APL II) Components ..... 26 Box 4.1. Expanding Access to Reduce Health Inequities (APL III) Components ........... 41 Table
Table 2.1. Key Performance Indicators for APL I and II ................................................... 5 Appendixes
Appendix A. Basic Data Sheet .......................................................................................... 69
Appendix B. Methodology................................................................................................ 75
Appendix C. Economic, Social, and Health Indicators .................................................... 79
Appendix D. Bolivia: Comparison of Public Health Insurance Schemes ........................ 83
Appendix E. Key Performance Indicators and Results Framework ................................. 84
Appendix F. Triggers for the Health Sector Reform Program .......................................... 91
Appendix G. Bono Juana Azurduy and World Bank Support .......................................... 92
Appendix H. Health Information Systems in Bolivia ....................................................... 93
Appendix I. Project-Specific Analysis: Statistics and Others ........................................... 95
Appendix J. List of Persons Met ..................................................................................... 109

vii
Principal Ratings Health Sector Reform Project (APL I) (IDA Q0940, IDA 32440)
ICR* ICR Review* PPAR Outcome Satisfactory Satisfactory Satisfactory Institutional Development
High Substantial -
Sustainability Highly likely likely - Risk to Development Outcome
- - Moderate
Bank Performance Satisfactory Satisfactory Moderately satisfactory
Borrower Performance Satisfactory Satisfactory Moderately satisfactory
* The Implementation Completion and Results (ICR) report is a self-evaluation by the responsible Global Practice. The ICR Review is an intermediate IEG product that seeks to independently validate the findings of the ICR.
Second Phase of the Health Sector Reform Program (APL II) (IDA 3541A, IDA 35410)
ICR ICR Review PPAR Outcome Moderately satisfactory Moderately satisfactory Moderately
satisfactory Risk to Development Outcome
Moderate Moderate Moderate
Bank Performance Satisfactory Moderately satisfactory Moderately satisfactory
Borrower Performance Moderately satisfactory Moderately satisfactory Moderately satisfactory
Expanding Access to Reduce Health Inequities (APL III) (IDA 43820)
ICR ICR Review PPAR Outcome Moderately satisfactory Moderately unsatisfactory Moderately
satisfactory Risk to Development Outcome
Moderate Moderate Moderate
This report was prepared by Mercedes Vellez (lead author) and Carla Pazce, who assessed the project in March 2018. The report was peer reviewed by Denise Vaillancourt and panel reviewed by Judyth L. Twigg. Yezena Yimer and Carla Fabiola Coles provided administrative support.

viii
Bank Performance Moderately satisfactory Moderately unsatisfactory Moderately satisfactory
Borrower Performance Moderately satisfactory Moderately unsatisfactory Moderately satisfactory
Key Staff Responsible Health Sector Reform Project (APL I) (IDA Q0940, IDA 32440)
Project Task Manager/
Leader Division Chief/ Sector Director Country Director
Appraisal Daniel Cotlear Xavier Coll Isabel Guerrero Completion Juan Pablo Uribe Ana-Maria Arriagada Marcelo Giugale
Second Phase of the Health Sector Reform Program (APL II) (IDA 3541A, IDA 35410)
Project Task Manager/
Leader Division Chief/ Sector Director Country Director
Appraisal Daniel Cotlear Xavier Coll Isabel Guerrero
Completion Marcelo Bortman Keith Hansen Carlos Felipe Jaramillo
Expanding Access to Reduce Health Inequities (APL III) (IDA 43820)
Project Task Manager/
Leader Division Chief/ Sector Director Country Director
Appraisal Marcelo Bortman Keith Hansen Carlos Felipe Jaramillo Completion Andre C. Medici Daniel Dulitzky Alberto Rodriguez

ix
IEG Mission: Improving World Bank Group development results through excellence in independent evaluation.
About this Report
The Independent Evaluation Group assesses the programs and activities of the World Bank for two purposes: first, to ensure the integrity of the World Bank’s self-evaluation process and to verify that the World Bank’s work is producing the expected results, and second, to help develop improved directions, policies, and procedures through the dissemination of lessons drawn from experience. As part of this work, IEG annually assesses 20-25 percent of the World Bank’s lending operations through fieldwork. In selecting operations for assessment, preference is given to those that are innovative, large, or complex; those that are relevant to upcoming studies or country evaluations; those for which Executive Directors or World Bank management have requested assessments; and those that are likely to generate important lessons.
To prepare a Project Performance Assessment Report (PPAR), IEG staff examine project files and other documents, visit the borrowing country to discuss the operation with the government, and other in-country stakeholders, interview World Bank staff and other donor agency staff both at headquarters and in local offices as appropriate, and apply other evaluative methods as needed.
Each PPAR is subject to technical peer review, internal IEG Panel review, and management approval. Once cleared internally, the PPAR is commented on by the responsible World Bank country management unit. The PPAR is also sent to the borrower for review. IEG incorporates both World Bank and borrower comments as appropriate, and the borrowers’ comments are attached to the document that is sent to the World Bank’s Board of Executive Directors. After an assessment report has been sent to the Board, it is disclosed to the public.
About the IEG Rating System for Public Sector Evaluations
IEG’s use of multiple evaluation methods offers both rigor and a necessary level of flexibility to adapt to lending instrument, project design, or sectoral approach. IEG evaluators all apply the same basic method to arrive at their project ratings. Following is the definition and rating scale used for each evaluation criterion (additional information is available on the IEG website: http://ieg.worldbankgroup.org).
Outcome: The extent to which the operation’s major relevant objectives were achieved, or are expected to be achieved, efficiently. The rating has three dimensions: relevance, efficacy, and efficiency. Relevance includes relevance of objectives and relevance of design. Relevance of objectives is the extent to which the project’s objectives are consistent with the country’s current development priorities and with current World Bank country and sectoral assistance strategies and corporate goals (expressed in Poverty Reduction Strategy Papers, Country Assistance Strategies, Sector Strategy Papers, and Operational Policies). Relevance of design is the extent to which the project’s design is consistent with the stated objectives. Efficacy is the extent to which the project’s objectives were achieved, or are expected to be achieved, taking into account their relative importance. Efficiency is the extent to which the project achieved, or is expected to achieve, a return higher than the opportunity cost of capital and benefits at least cost compared with alternatives. The efficiency dimension is not applied to development policy operations, which provide general budget support. Possible ratings for Outcome: highly satisfactory, satisfactory, moderately satisfactory, moderately unsatisfactory, unsatisfactory, highly unsatisfactory.
Risk to Development Outcome: The risk, at the time of evaluation, that development outcomes (or expected outcomes) will not be maintained (or realized). Possible ratings for Risk to Development Outcome: high, significant, moderate, negligible to low, not evaluable.
Bank Performance: The extent to which services provided by the World Bank ensured quality at entry of the operation and supported effective implementation through appropriate supervision (including ensuring adequate transition arrangements for regular operation of supported activities after loan/credit closing), toward the achievement of development outcomes. The rating has two dimensions: quality at entry and quality of supervision. Possible ratings for Bank Performance: highly satisfactory, satisfactory, moderately satisfactory, moderately unsatisfactory, unsatisfactory, highly unsatisfactory.
Borrower Performance: The extent to which the borrower (including the government and implementing agency or agencies) ensured quality of preparation and implementation, and complied with covenants and agreements, toward the achievement of development outcomes. The rating has two dimensions: government performance and implementing agency(ies) performance. Possible ratings for Borrower Performance: highly satisfactory, satisfactory, moderately satisfactory, moderately unsatisfactory, unsatisfactory, highly unsatisfactory.

x
Preface This is the Project Performance Assessment Report (PPAR) for the adaptable program loan (APL) series consisting of the Health Sector Reform Project (APL I); the Second Phase of the Health Sector Reform Program (APL II); and the Expanding Access to Reduce Health Inequities project (APL III). APL I was approved on June 16, 1999, supported by an International Development Association (IDA) credit of $25 million and $19 million of government counterpart financing. By project closing on December 31, 2003, actual project costs totaled $26.26 million, for which the World Bank disbursed a total of $22 million. APL II was approved on June 28, 2001, with estimated total project costs of $70.3 million to be financed by a $35 million IDA credit and government contributions. By project closing on June 30, 2008, project costs were $47.8 million funded by government contributions of $7.7 million and World Bank disbursements of $40 million. Due to the depreciation of the dollar against the special drawing rights (SDR), the World Bank disbursed $5 million more than estimated at appraisal. APL III was approved on January 24, 2008, and closed on December 31, 2015. Total project costs were $26.2 million, $18.5 million of which was financed through an IDA credit, and $7.7 million was contributed by the government. After several restructurings the total IDA disbursement was about $10.28 million. This multiproject PPAR serves the accountability and learning purposes of the Independent Evaluation Group (IEG). It evaluates the extent to which the APL series achieved its intended outcomes, and offers an opportunity to draw lessons from the long-term engagement of the World Bank in Bolivia’s health sector reform to inform and guide future investments in the health sector. APL I and III were flagged for a field-based assessment at IEG review stage. While APL I was rated satisfactory, a PPAR was recommended due to a strong demand for learning from results-based approaches, which were starting to be applied in World Bank projects. APL III was also flagged for further assessment because the outcome rating was downgraded from moderately satisfactory to moderately unsatisfactory due to insufficient evidence of achievement of project objectives provided by the Implementation Completion and Results (ICR) report. This report was prepared by Mercedes Vellez, Evaluation Officer, and Carla Pazce, consultant IEGHC. The findings of the report are based on a review of World Bank documents (Project Appraisal Documents, ICRs and IEG ICR Reviews, World Bank Group country strategies, and relevant sector strategies); a review of external academic and policy literature (impact evaluations and health systems studies); analyses of secondary data (demographic and health surveys and health management information systems); interviews with internal and external stakeholders; and site visits. A mission to Bolivia was undertaken by Mercedes Vellez and Carla Pazce from February 26 to March 9, 2018, during which interviews were conducted with government officials and technical staff, health service providers, relevant development partners, and other involved persons. The team also visited the Departmental Health Services (Servicios Departamentales de Salud; SEDES) of Oruro and Santa Cruz, which were chosen in consultation with the government and the World Bank’s Bolivia team. The mission included site visits to the Children’s and Women’s Hospitals in La Paz and the rural health facility Virgen de

xi
Concepcion in Sica Sica. Interviews were also conducted in Washington, DC, with additional relevant World Bank staff. IEG gratefully acknowledges all those who made time for interviews and provided documents and information and expresses its gratitude to the World Bank’s office in La Paz for the logistical and administrative support provided to the mission. Following standard IEG procedures, a copy of the draft report was sent to the relevant government officials and agencies for their review and feedback. No Comments were received from the Borrower.

xii
Summary Bolivia’s poor maternal and child health outcomes were of great concern in the 1990s. Infant and child mortality rates were 67 and 92 per 1,000 live births in 1998, and maternal mortality was 390 per 100,000 live births, risking Bolivia’s achievement of the Millennium Development Goals (MDGs).
The capacities of the Bolivian health system were insufficient to respond to the need for health care access, availability, affordability, quality, and equity. Health facilities lacked essential drugs and equipment needed to provide good care. In addition to scarce and inefficiently distributed health workers, heath staff were often poorly trained, compromising the quality of treatment. The Expanded Immunization program had too little funding, poor communication strategies, and unreliable data, which led to declining immunization rates starting in 1996. Cultural and economic barriers limited demand for both preventive and curative care.
Compounding these problems, most of the population had been excluded from the social security system, which was financed through payroll contributions, due to high levels of labor informality. This left a substantial share of the population at risk of impoverishment because of catastrophic expenditures in health. To increase affordability and financial protection the Bolivian government launched the National Maternal and Child Insurance (Seguro Nacional de Maternidad y Niñez; SNMN) for pregnant women and children under 5 in 1996, which later expanded the package of services covered.
The World Bank supported the government’s health sector reforms through a series of Adaptable Program Loans (APLs) over 16 years, including the 1999 Health Sector Reform Project, 2001 Second Phase of the Health Sector Reform Program, and 2008 Expanding Access to Reduce Health Inequities. The reforms supported by these projects are the subject of this Project Performance Assessment Report (PPAR).
Health Sector Reform Project (APL I)
The objectives of the first phase were to (i) increase coverage of health services; (ii) increase quality of health services; (iii) empower communities to improve their health status; (iv) strengthen local capacity to respond to health needs; and (v) reduce infant and child mortality.
The project’s outcome is rated satisfactory. The relevance of objectives is rated substantial since they were responsive to country conditions, consistent with Bolivia’s National Development Plan, and aligned with World Bank strategies for the country at project appraisal, completion, and currently. Despite the emphasis on the need to improve distributional health impacts, the project’s objectives lacked an explicit focus on equity.
The relevance of design is rated substantial. The project’s results chain was well conceived and tackled key dimensions of the health system, such as health financing, affordability, availability and access, structural and process quality, management and accountability, and health information systems. The programmatic nature of the selected lending instrument was

xiii
appropriate to support the government’s ambitious reforms, which addressed such long-term development challenges as improving maternal and child health outcomes. The project design was innovative in strategically defining common outcome indicators. Those indicators were used to trigger subsequent phases of the APL, as result-based approach to lending, as local management and accountability tool, and to support the project’s monitoring and evaluation (M&E) framework.
The achievement of objective 1—to increase coverage of health services—is rated substantial. The World Bank contributed to strengthening the immunization program, which led to vaccination rates above the 85 percent target by project closing. Disparities in full immunization coverage between poorest and richest children were progressively reduced in the period 1998–2008. The growth in national financing of vaccines was sustained. The share of births attended by health personnel more than doubled from the start of the APL series, reaching almost 90 percent in 2016. The project contributed to improved capacity in the health care system to respond to most common child health needs, such as pneumonia and diarrhea, as the number of cases attended increased, despite decreasing prevalence rates.
The achievement of objective 2—to increase quality of health services—is rated substantial. World Bank efforts supporting the implementation of the Integrated Management of Childhood Illness (IMCI) and for the Mother-Baby Package (MBP) protocols, including training and investments in physical rehabilitation of health facilities, plausibly improved the quality of maternal and child health care services. The completeness of prenatal care improved during the APL I, and early neonatal mortality also decreased according to program targets. However, quality of health care services is hard to measure, and there is no evidence of improvements in process quality that would account for higher resolutive capacity of health personnel and adherence to protocols due to a lack of health facility surveys.
The achievement of objective 3—to empower communities to improve their health status—is rated modest. APL I supported the empowerment of indigenous and native populations to use health care services, through the incorporation of culture-friendly practices into the MBP and IMCI protocols, availability and reimbursement of traditional drugs, implementation of the Basic Native and Indigenous Insurance, social consultations with largest indigenous organizations, and the Pregnant Women's Bill of Rights. Scarcity of measurable outcomes in this area limits the assessment of achievement of this objective and the World Bank’s contribution.
The achievement of objective 4—to strengthen local capacity to respond to health needs—is rated substantial. The introduction of performance agreements between the Ministry of Health and all nine of the country’s departments helped strengthen the capacity and accountability of the health districts in the new decentralization context. Performance agreements cascaded down from the project’s results-based approach, and foresaw implicit rewards for compliance based on recognition, while helping to identify capacity gaps to achieve annual performance goals. Even though the signature of these performance agreements is no longer a current practice, the culture of monitoring primary indicators continues at SEDES. The Basic Health Insurance (Seguro Básico de Salud; SBS) was sustained and has evolved into broader schemes. The National Health Information System (Sistema Nacional de Información en Salud; SNIS) was strengthened through the

xiv
introduction of new software, and training at local and regional levels as well. The World Bank’s support to the SNIS continued through APL II and III.
The achievement of objective 5—reducing infant and child mortality—is rated substantial. Infant and under-five mortality rates significantly declined in Bolivia during APL I. While direct attribution to the APL series cannot be asserted due to lack of an impact evaluation and the multisectoral determinants of infant and child deaths, the World Bank contributed in lowering the economic barriers to access through health insurance, strengthening of the immunization program, and increasing quality and use of health care services.
Efficiency is rated substantial considering the support of cost-effective health interventions (like the immunization program, the MBP and IMCI, and the package of essential services covered by the SBS); an ex ante internal rate of return of 40 percent providing evidence of its high value for money; and overall satisfactory implementation efficiency.
Risk to development outcome is rated moderate. Risk of waning government commitment and ownership is low. The main reforms supported by the program, such as the health insurance system and the immunization program, are well established. Their continuity is assured by a solid legal framework that explicitly earmarks the use of resources for those programs. However, funds are still contingent on the flow of national revenues, and on management of reserves at the central government level.
World Bank performance is rated moderately satisfactory. Quality at entry is rated moderately satisfactory since the APL was an appropriate instrument, APL I design was sufficiently strong and focused on cost-effective health interventions, but project objectives missed an opportunity to emphasize equity issues. Quality of supervision is also rated moderately satisfactory because, although deficiencies in KPIs were identified and corrected, there is no evidence of a systematic tracking of output and intermediate outcome indicators during project implementation.
Borrower performance is rated moderately satisfactory. Government performance is rated moderately satisfactory for the high level of commitment, but the government failed to meet targets for counterpart financing due to economic and fiscal constraints, which affected implementation. Implementing agency performance is rated moderately satisfactory due to the satisfactory performance of the Health Reform Unit (Unidad de Reforma de Salud; URS), and moderately satisfactory performance of the National Fund of Productive and Social Investment (Fondo Nacional de Inversión Productiva y Social; FPS). The reorganization of the FPS had consequences for project implementation delays, yet the agency could increase its pace and executed 95 percent of its assigned budget.
Second Phase of the Health Sector Reform Program (APL II)
By the end of APL I, program triggers were sufficiently met to allow the continuation to the second phase. Like the previous phase, the objectives of APL II were to (1) increase coverage of health services; (2) increase quality of health services; (3) strengthen local capacity to respond to health needs; and (4) reduce infant mortality.

xv
The project’s outcome is rated moderately satisfactory. Like APL I, the relevance of objectives is rated substantial based on similar considerations. The relevance of design continued to be substantial because the results chain followed a logical thread and the project addressed some of the limitations with performance indicators.
The achievement of objective 1—to increase coverage of health services—is rated modest. APL II supported the National Program for the Expansion of Health Insurance (Programa Nacional para la Extensión de Cobertura de Seguros; EXTENSA) to expand coverage of health services to underserved populations through outreach activities and mobile health brigades. Yet progress with immunization coverage stalled during most of the second phase, and skilled birth attendance continued to improve but fell short of targets.
The achievement of objective 2—to increase quality of health services—is rated substantial. APL II supported improvements in structural quality through subprojects financing rehabilitation and refurbishment of health facilities at the primary and secondary levels, as well as the purchase of equipment for health brigades. About half of prioritized EXTENSA municipalities had subproject proposals during APL II. Other quality indicators, such as completeness of prenatal care and neonatal mortality, continued to increase, but at a slower pace than in the previous phase.
The achievement of objective 3—to strengthen local capacity to respond to health needs—is rated substantial. APL II continued its strong focus on strengthening government capacity, contrasting with the lack of an outcome indicator. Nevertheless, APL II successfully continued its support to health insurance management, and largely contributed to the financing of the demographic health surveys to improve diagnosis and hence better decision making at local and central levels. The culture of monitoring results introduced through performance agreements persisted.
The achievement of objective 4—reducing infant mortality—is rated substantial. As in APL I, infant mortality continued its decline during the implementation of this phase.
Efficiency is rated modest because although the implementation of APL II was economically justified ex ante, project implementation was delayed during initial years, and the FPS was slow to execute health subprojects.
Risk to development outcome is rated moderate as in APL I. Government commitment and ownership risks are assessed as low, while institutional and political risks are still assessed as moderate. Despite its strengths, the EXTENSA program was discontinued. The government’s current strategy to expand coverage, the MI SALUD program, raised stakeholders’ concerns about its rather limited coordination with health facilities and accountability to the SEDES.
World Bank performance is rated moderately satisfactory. Quality at entry is rated moderately satisfactory. APL II built on lessons from the previous phase and tackled cultural issues and focused on pockets of underserved populations. While the second phase corrected some shortcomings in the results framework, it did not revise some of the problematic indicators. Quality of supervision is also rated moderately satisfactory because although emphasis was placed on monitoring KPIs, the World Bank did not routinely

xvi
monitor the evolution of output indicators. Borrower performance is rated moderately satisfactory. Government performance is rated moderately unsatisfactory because political instability and insufficient counterpart financing delayed project activities. Project implementation occurred in an environment of uncertainly about the new administration’s position on the health care reform. Changes in URS authorities toward the end of the project hampered the completion of some activities. Tensions between URS and ministry staff due to salary differences were exacerbated by the direct relationship of the URS with the highest authorities at the ministry. Implementing agency performance is rated moderately satisfactory considering the change of its main authorities. URS performance improved thereafter, continuing its monitoring and supervision efforts, but as in APL I there is no evidence of a systematic tracking of output indicators. The FPS execution slowed as a result of incentives established under the National Compensation Law.
Expanding Access to Reduce Health Inequities (APL III)
The objectives of the third phase were to (1) reduce occurrence of critical risk factors affecting maternal and infant health in the target areas so that current gaps between regions are reduced; (2) reduce chronic malnutrition among children under 2 years of age in the target areas; (3) increase health insurance coverage in the target areas; and (4) upgrade the SNIS so that it will be integrated with Bolivia’s new health insurance program. Unlike previous phases, APL III focused on more vulnerable locations for some of its activities. The project’s outcome is rated moderately satisfactory, an upgrade from the IEG project validation ratings. The additional evidence gathered by the IEG team for this PPAR provided the basis for upgrading the efficacy ratings, so that the overall outcome rating is now moderately satisfactory instead of moderately unsatisfactory.
The relevance of objectives is rated substantial considering they were well aligned with country conditions and with government and World Bank strategies. Objectives explicitly included equity and were sufficiently ambitious despite the exclusion of infant and child mortality impacts. APL III entailed a great deal of continuity with the health sector reform of the previous phases.
The relevance of design is rated substantial because the lending instrument was appropriate, the ex ante M&E design was adequate, and the results chain originally envisaged activities that were logically linked to the expected outputs and outcomes. After the reduction of the project’s scope in the 2012 restructuring, however, the World Bank’s flexibility to respond to government requests came at the cost of lessening the causal relationship between project activities and objectives.
The achievement of objective 1—to reduce the occurrence of critical risk factors affecting maternal and infant health in the targeted areas so that current gaps between regions are reduced—is rated substantial. The World Bank financing contributed to improved health care infrastructure, as well as quality assurance processes and accreditation of health facilities. User satisfaction surveys revealed that most patients receiving services were satisfied with the quality of services delivered in the project areas. Data collected during the

xvii
IEG mission show a positive evolution in complete prenatal care and skilled birth attendance coverage, while inequalities in access to essential maternal health care services were reduced.
The achievement of objective 2—to reduce chronic malnutrition among children under 2 years of age in the target areas—is rated modest. The World Bank indirectly contributed to better nutrition outcomes at national level through strengthening health service provision and collaborating with other national programs. Yet lack of outcome data for the project’s prioritized municipalities, and the synergies with other parallel programs with similar goals, limit the plausible attribution of achievement to project activities.
The achievement of objective 3—to increase health insurance coverage in the target areas—is rated substantial. APL III supported actions toward the establishment of a unified health insurance that never materialized. The World Bank was instrumental in building consensus for increasing financing for health insurance and helping the government to pass the health insurance (Law 475) that expanded coverage to other population subgroups not included in previous insurance schemes. There has been a steady increase in the quantity of health services provided free of charge by Law 475 at all levels of care.
The achievement of objective 4—to upgrade the SNIS so that it will be integrated with Bolivia’s new health insurance program—is rated substantial. The World Bank contributed much to strengthening the SNIS for better collection and analysis of health information, management, and decision making. Developed software and information modules were extensively implemented in the SEDES, in all the heads of the referral networks, and across health facilities at primary, secondary, and tertiary levels.
Efficiency is rated modest. Project design exploited synergies with other government programs and was economically justified by a cost benefit analysis. Yet project implementation progress was very slow and not all interventions represented an optimal use of World Bank funds.
Risk to development outcome is rated moderate. While some key reforms were supported by an established legal framework unlikely to be reversed, sustainability of outcomes would be at risk with slowing economic growth and decreased hydrocarbon revenues. Moreover, investments in physical capital made by the project will require considerable maintenance expenditures, and, for new infrastructure, additional human resources in health, imposing high operation costs on autonomous local governments.
World Bank performance is rated moderately satisfactory. Quality at entry is rated moderately satisfactory. The project design tackled the remaining bottlenecks to the continued implementation of the reform. The World Bank’s proposed activities were critical for the achievement of intended outcomes. Risk assessment and mitigation plans, however, overlooked difficulties in establishing a unified health insurance, and the new implementation arrangements, which led to project delays. Quality of supervision is rated moderately satisfactory. Considerable budget and staff resources were used in supervising, monitoring, and reporting on project progress. The World Bank team collaborated closely with the implementing agencies at all stages of the project, and provided them timely support when frequent changes in managerial levels challenged the decision-making processes.
xviii
However, the response to project restructuring was not quick enough since the first restructuring took place five years after project approval, three years after project implementation, and after two years of continuous unsatisfactory project ratings. The number and frequency of project restructurings may reflect the inability of the team to anticipate further changes in project implementation.
Borrower performance is rated moderately satisfactory. Government performance is rated moderately unsatisfactory. Changes in political priorities and frequent turnovers in the leadership of the Ministry of Health challenged project ownership. The government’s ambitious goal of creating a unified health insurance system exceeded its ability to create consensus across the political spectrum. This failure resulted in project execution delays and cancellation of several project activities that reduced the scope of the project interventions. Implementing agency performance is rated moderately satisfactory. Despite initial delays in accommodating the new institutional arrangements, the project implementation unit was integrated into ministry functions and collaboration with other technical areas of the ministry was satisfactory. The FPS managed to execute a substantial amount of project resources as infrastructure investments increased after project were restructured.
Lessons
• The definition of a common results framework is useful to align the efforts of different government levels. The M&E design of APL I was innovative in that it strategically defined a common set of indicators as APL phase triggers, the local management and accountability tool (that is, performance agreements), and key project indicators (KPIs). Although some of the indicators were initially ambiguous and later modified, this focus on common results helped different stakeholders (central government, local governments, World Bank staff) to concentrate efforts on the achievement of these selected areas. There is a risk though of not tracking lower-level indicators measuring progress in activities and outputs.
• A robust results-based approach needs to define a clear mechanism of rewards/sanctions to function well. Otherwise it risks turning into a mere monitoring tool that could lead to perverse incentives. Performance agreements did not have a standard methodology for setting targets at the local level, altering the judgment of performance based on the stringency of targets set. In addition, the approach did not have a clear mechanism for rewards to ensure compliance of local governments with the targets and to sustain the level of effort and interest. Rather, it seemed to be used to monitor results sporadically and improve the capacities of local governments lagging behind through investment subprojects. While a traditional results-based approach (financially) rewards the achievement of results, these performance agreements seemed to act as a tool to flag allocation of funds to those local governments struggling to achieve targets.
• Project design coordinating efforts with parallel programs that have similar goals has a great potential for efficiency, but it raises methodological concerns about the attribution of outcomes. In APL III demand components were sought to be articulated through the Zero Malnutrition and Bono Juana Azurduy programs, aimed at reducing malnutrition and increasing demand for health care services. While coordination with other government programs that have similar goals can enhance efficiency by exploiting

xix
synergies and minimizing duplication of effort, it creates challenges for the attribution of results to the activities of either program. Initial piloting and evaluation intentions were not possible because the conditional cash transfer program was directly launched at the national level, which limited the development of specific M&E arrangements to disentangle program effects.
• While continued focus on quality objectives is certainly commendable, it needs to be accompanied by more robust outcome measures to prove quality enhancements. The prevalence of structural aspects of quality reflects the low baseline of health facilities’ infrastructure conditions as well as the high costs of collecting process quality indicators. It is also consistent with the type of first-generation reforms APL I and II aimed to address (such as expansion of service coverage by ensuring financing for vaccines and public health insurance and infrastructure). APL III aimed at reducing the occurrence of risk factors affecting maternal and child health, but it did not identify appropriate measures, especially on process quality, and instead used complete prenatal coverage and user satisfaction surveys, and other narrow aspect of structural quality.
• Programmatic approaches are suitable where sector knowledge is strong, program objectives are long-term and clear, and country ownership is established. The choice of an APL instrument for the overall program was appropriate because the government’s goals to reduce infant and child mortality were well articulated and would take an extended time, requiring consistency and deepening of reforms over several phases. Strong government ownership of these goals, and a vision for how to pursue them over time, further strengthened the case for an APL. Sufficiently robust triggers, moreover, ensured they did not become inappropriate over time, thus securing continuation of the APL phases. These are useful lessons for the new Multiphase Programmatic Approach.
• Ambitious projects partially relying on a government promise to pass a reform law are likely to need a restructuring. Reallocation of project funds in response to ad hoc government requests may lessen the logic of the results chain and risk the M&E framework from providing sufficient evidence of project achievements. Building on the success of the previous phases, APL III designed activities based on the government’s expectations to transform the health insurance system, which did not occur. The cancellation of related activities and the inclusion of less-aligned activities affected the M&E framework, which was ultimately insufficient to provide evidence of the project’s achievements. Additional data outside the M&E frameworks had to be used by the end of the project. This example highlights the value of evidence-based policy versus less-aligned changes. A reform process could benefit from articulating a learning agenda and process for fine-tuning reforms based on evidence and lessons.
Auguste Tano Kouame Director
Human Development and Economic Management Independent Evaluation Group

1
1. Background and Context 1.1 Bolivia’s total estimated population of 10.7 million in 2015 is highly indigenous and ethnically diverse. Quechuas and Aymaras account for 36 percent of the population, while 35 other groups account for 5 percent. Bolivia’s landlocked territory of 1.1 million square kilometers is divided into 9 departments and 339 municipalities. Geographically, the country’s is composed of the highland plateau (Altiplano), inter-Andean valleys, and plains. While population density is among the lowest in the world—9.9 inhabitants per square kilometer—the country has become highly urban, with 67 percent of the population living in urban areas (World Bank 2015b).
1.2 Bolivia is a lower middle-income country, but a sizable portion of the population still falls below the poverty line. High international commodity prices and large investments in the gas and mining sectors in the late 1990s and early 2000s helped the economy grow at an average 5 percent between 2006 and 2015. That growth, along with large income gains from favorable terms-of-trade, translated into lower poverty rates: moderate poverty decreased from 59 percent in 2005 to 38 percent in 2015, and the Gini Index fell from 0.585 to 0.458 in the same period.1
Health Sector
1.3 The health system in Bolivia is fragmented, with three main subsystems: public sector, social security, and private sector. The public health system is financed through general taxation. Under the decentralized system, local governments manage their own resources, which mainly consist of national tax coparticipation funds based on the population count (around 20 percent of national revenues are transferred to municipalities). Local governments also collect real estate taxes and service fees, but these revenues account for only 7 percent of total health financing. Over two-thirds of the Bolivian health system is publicly financed from these sources. The second largest source of funds is payroll contributions to social security, which account for 32 percent. However, about 60 percent of the working urban population is in the informal sector, so social security covers only 17 percent of the population. Private sector participation is very small.2
1.4 Public service provision is organized in territorial networks of public providers, which are comprised of several health centers, one or more basic hospitals and a general hospital, usually located in a capital city. In total, the public service delivery system has close to 3,000 health facilities, representing 83 percent of all such facilities. In 2011, services provided in public health facilities accounted for 74 percent of all health service use.
1.5 The public network of health facilities is administered mainly by local governments (municipal and departmental) and financed by general government funds (local and central), as well as revenues generated from service provision. The central government pays the salaries of appointed health personnel and retains its stewardship and policy and regulation role. The departmental governments have been given responsibility for allocating human resources among facilities and for paying operation costs of public general hospitals. Municipal governments cover the cost of public basic hospitals and health centers in their

2
territory. Health providers are payed through regular budget allocations. For services covered by public health insurance (Universal Mother-Child Insurance [Seguro Universal Materno-Infantil; SUMI] and Law 475/SIS), providers are paid for their services after submitting claims and reporting to municipal governments the number of services delivered. Except for those services covered by public health insurance schemes, public facilities charge user fees: these are aimed at covering the cost of medical supplies, including pharmaceuticals in the case of in-patient care.
1.6 Bolivia has made advances toward universal health coverage, injecting additional funds (mainly from general revenues) into the health system. Total health expenditure as a percentage of gross domestic product (GDP) increased from 4.3 percent in 2000 to 6.4 percent in 2015, although it remains below the Latin American average of 7.4 percent. Public health expenditure has also risen considerably over the past two decades from 61 to 72 percent of total health expenditure between 1998 and 2014.
1.7 Since most of the population has been excluded from social security, the government created public health insurance for different population groups. In 1996, the National Maternal and Child Insurance (Seguro Nacional de Maternidad y Niñez; SNMN) for pregnant women and children under 5 was created. This was later expanded and turned into the Basic Health Insurance (Seguro Básico de Salud; SBS) and in 2003 became the SUMI until 2013. In addition, there was health insurance for the elderly called Seguro de Salud para el Adulto Mayor (SSPAM). In 2013, the government passed the Comprehensive Health Services Benefits Law (Law 475/SIS), which expanded health coverage. Based on 2011 data, public health insurance schemes covered 24 percent of the total population, with little disparity among socioeconomic groups since eligibility is not based on income but on defined population groups. Considering that social security covers 17 percent of the population, it seems that Bolivia still has a long way to go to achieve universal health coverage.
1.8 Bolivia was ranked 118 out of 188 countries in the United Nations Development Programme Human Development Index in 2015. Between 1998 and 2015, life expectancy at birth rose from 60 to 69 years. Total fertility rate was estimated at 2.92 births per woman in 2015, down from 4.24 in 1998. Noncommunicable diseases accounted for 62 percent of total deaths as of 2015, while the proportion of deaths caused by communicable diseases, and maternal, perinatal, and nutritional conditions decreased from 35 percent in 2000 to 23 percent of total deaths in 2015.3 Chagas, tuberculosis, and malaria are endemic diseases in Bolivia.
1.9 Child and maternal mortality significantly declined in Bolivia during the APL program period, although they remain high compared with the regional average.4 In 1998–2016, neonatal mortality decreased from 34 to 15 per 1,000 live births; infant mortality fell from 67 to 24 per 1,000 live births; and under-five mortality rates declined from 92 to 29 per 1,000 live births. Meanwhile, infant and child mortality in the Latin America and the Caribbean region was about 16.7 and 19.6 per 1,000 live births, respectively, in 2011–2015. Maternal mortality, on the other hand, decreased from 187 to 160 per 100,000 live births between 2000 and 2011 according to government estimates.

3
Issues and Challenges
1.10 Bolivia’s low health care coverage resulted from a combination of factors on both the supply and demand sides. On the supply side, a surge in construction of health centers during the 1990s, particularly in rural areas, had limited impact on reaching underserved areas due to the scarcity of human resources and its inadequate distribution. Deficiencies in technical quality and respectful care of patients also affected health care performance. Health workers were often poorly trained and supervised or lacked the essential drugs and equipment needed to provide good care (World Bank 1999b).
1.11 Prior to the APL series, immunization coverage had been declining because of institutional weaknesses in the Expanded Program of Immunization (Programa Ampliado de Inmunizaciones; PAI), inconsistent allocation of government funds, and lack of a social communications strategy. In addition, vaccines used in much of Latin America at the time, such as Haemophilus influenza type b and Hepatitis b, were not part of the PAI. Moreover, coverage data were unreliable as official estimates based on administrative data were double those of surveys. As the immunizations program weakened, and the government lacked a strategy to provide care for children and their mothers, the quality of services provided in health centers remained a problem.
1.12 Local capacity to attend to health needs had several issues. As Bolivia started its decentralization process with the passing of the Law of Popular Participation in 1994, no instruments were available to decentralize the execution of health interventions. Moreover, implementation of the new framework encountered limited financing and weak systems and institutions. Among them, inadequate incentives, weak information systems, and limited monitoring and accountability.
1.13 Demand-side factors also affected the use of health care services, such as cultural barriers due to ethnic and cultural differences, and economic barriers such as high user fees and cost of medicines. The beliefs and practices of indigenous populations make them uncomfortable and distrustful of western technology and medical practices. This also reflects the lack of voice and empowerment of beneficiaries, and the focus of health care providers on curative care, to the neglect of outreach and preventive activities. On the affordability issues, the launch of the health insurance program for mothers and children provided free access to essential package of health care services for the uninsured.
National Priorities
1.14 The government, within the framework set by the National Dialogue 2000, made the reduction of child and maternal mortality a core component of its health sector strategy, as was reflected in the Strategic Health Plan of 1998. The national dialogue consolidated demands from local and national governments, civil society, and other actors, and culminated in the Poverty Reduction Strategy Paper (PRSP) and the National Dialogue Law that legislated the use of funds liberated through the Heavily Indebted Poor Countries debt relief initiative.

4
1.15 As laid out in the 2001 PRSP, the main health sector objectives were to reduce maternal and child mortality and to bring the principal endemic diseases under control. Five priority areas of actions were envisaged: ensuring the efficient administration of human resources; broadening the health insurance system, which will consolidate the SBS Scheme; keeping the main transmissible diseases under control and strengthening of the epidemiological monitoring system; improving the diet and nutritional status of the population; and developing of a cross-cultural approach to health.
1.16 Through its 2006 National Development Plan, the government launched an ambitious strategy to improve the health status of the population, focused on eliminating social exclusion and reducing existing disparities. The plan included activities in areas such as strengthening health system networks; increasing the coverage, access, and demand for health services, especially in high vulnerability areas; increasing the scope and reach of public services’ messages encouraging healthy behaviors; promoting intercultural health; preventing chronic malnutrition; upgrading the health insurance system; promoting community participation; and strengthening the ministry’s capacity to implement the Essential Functions in Public Health.
2. Health Sector Reform Project (APL I) Objectives, Design, and Relevance
PROJECT DEVELOPMENT OBJECTIVES
2.1 This project was the first of three planned World Bank operations, packaged as a 9-year Adaptable Program Loan (APL), to support the implementation of Bolivia’s health reform program. The overarching objective of the APL program was to help “reduce the infant mortality rate by complementing other interventions in education, rural productivity and water and sanitation” (World Bank 1999b, p.2). The program goal was to reduce infant mortality to 48 per 1,000 live births by the end of the APL series in 2009. The target for the end of phase one, was 60 per 1,000 live births by end 2001.
As stated in the Development Credit Agreement of June 25, 1999, the project objectives were “to reduce the rates of child and infant mortality over the period of the Health Sector Reform Program and, in particular, to contribute to the achievement by the Borrower of the CAS Core Benchmark for infant mortality” (World Bank 1999a, p.9). The project appraisal document (PAD) of March 31, 1999, similarly states that the project objective is to reduce infant mortality but omits a reference to reducing child mortality while referring to the project’s intermediate objectives: “The phase I objectives reflect the program goal of helping to reduce the infant mortality rate. During phase I the two strategies of the overall program will be used, namely: (i) to increase coverage and quality of health services, and to empower communities to improve their health status; and (ii) to strengthen local capacity to respond to health needs” (World Bank 1999b, 3). In line with harmonized guidelines, this project will be evaluated against the Project Development Objective (PDO), as stated in the Development Credit Agreement, which considers both infant and child mortality. In addition, the project will be evaluated against the intermediate objectives since they provide a more informative

5
framework for linking project results with its activities. Thus, the PPAR will evaluate the following five objectives. Objective 1: Increase coverage of health services. Objective 2: Increase quality of health services. Objective 3: Empower communities to improve their health status. Objective 4: Strengthen local capacity to respond to health needs. Objective 5: Reduce infant mortality and child mortality.5
Table 2.1. Key Performance Indicators for APL I and II
Key Performance Indicator
Baseline
Targets APL I
APL II
APL II
extended 1998 2002 2005 2007
1. Coverage of births attended by trained health personnel (%)
36 46 65 66
2. Complete prenatal care attendancea
(%) 28 40 47 57a
3. Early neonatal hospital mortality (per 1,000 live births)b
14.4 11.0 8.0 11.0
4. Number of pneumonia cases attended in health services
68,346 115,000 135,000 157,976
5a. Number of diarrhea cases attended in health services
292,417 400,000 — —
5b. Percent of children of less than five years with three iron dosesc (%)
— — 35 41
6a. Three doses DPT coverage 75% — — — 6b. DPT/Hib/Hepatitis B vaccine coverage with three doses (%)
— 85 90 90
7a. Number of municipalities with three doses DPT coverage less than 80%
212 — — —
7b. Number of municipalities with DPT/Hib/Hepatitis B vaccine coverage of less than 80%
— 83 25 25
8. National financing of vaccines ($, millions)
0.5 4.0 5.5 6.5
Note: Indicators 6a and 7a were to be phased out as Bolivia introduced the pentavalent vaccine. As the closing date for APL II was extended, additional targets were agreed during implementation. Amendments to the credit agreement for APL II did not include said targets, but other project documents did. aThe denominator of this indicator changed during APL II, from “number of pregnant women with first prenatal care control,” to “number of expected births.” bThe scope of this indicator changed from “second and third level health facilities,” “ten largest maternities,” to “15 selected hospitals.” cTo better capture progress in this area, APL II replaced indicator 5a. with 5b. Source: World Bank 1999b, 2009.
2.2 As shown in Table 2.1, the key performance indicators (KPIs) for APL I and II were the same, with some variations that reflect definition adjustments, data availability, and the evolution of the health reform program.6 Neither project objectives nor performance indicators were formally revised, only adjustments to indicators definitions were made during project implementation, following agreement with government authorities.

6
RELEVANCE OF OBJECTIVES
2.3 The relevance of objectives is rated substantial.
2.4 The PDO was responsive to country conditions at the time of appraisal, project completion, and currently. Although declining, infant and child mortality remain a serious health concern in Bolivia. Not only is infant mortality one of the highest in Latin America, second only to Haiti, the rate is almost twice as high in rural areas compared with urban ones, and close to four times as high for those in the poorest quintile relative to the richest one (World Bank 2015b).7 Child and infant mortality are particularly worrisome in the department of Potosí. Chronic malnutrition in children below 3 years is 18.5 percent at national level but reaches 26 percent in rural areas and almost 40 percent for those in the bottom quintile of the distribution (Silva and Batista 2010). Poor nutrition and lack of early stimulation services can lead to significant delays in cognitive and psychosocial development that are hard to overcome later in life. Additionally, highland departments (La Paz, Oruro, and Potosí), with large concentration of indigenous groups, present the highest maternal mortality rates and the lowest levels of institutional deliveries (Silva and Batista 2010).
2.5 The PDO was consistent with Bolivia’s National Action Plan, which had poverty reduction as the centerpiece of the governments’ development program up to the year 2002. The strategy for attaining this goal was to implement actions within a framework of four pillars: opportunity, equity, institutional strengthening, and dignity. The project objectives were consistent with the World Bank’s 2007 Health, Nutrition, and Population strategy, which focuses on improving health outcomes for the poor and vulnerable.
2.6 The project has been relevant to World Bank strategies for Bolivia. The 1998 Country Assistance Strategy (CAS), through its equity pillar, sought to improve the efficiency and quality of basic social services, emphasizing the need to reduce the cultural barriers that prevent the poor from accessing such services (World Bank 1998). In addition, the 1998 CAS strongly emphasized the need to strengthen the results orientation in the public sector, the capacity of local governments, and the process of participatory planning, all of which are important elements of APL I. The project was also expected to directly contribute to improving two of the five variables that constituted the core benchmarks of the CAS (infant and maternal mortality rates). It also would indirectly contribute to the other three core benchmarks (child malnutrition, poverty, and the poverty gap). The 2004 CAS, issued just after project closing, was conceived in an uncertain time of escalating social unrest and conflict (World Bank 2004a). The CAS included the government priority of supporting high visibility programs that address exclusion, inequality, and poverty. In fact, APL I and II were part of an emergency assistance package that included redirecting funds from ongoing International Development Association (IDA) operations to support small but visible social investment projects in the La Paz and El Alto municipalities, severely affected by social conflict at the time.8 The present strategy, the 2015 Country Partnership Framework (CPF), incorporated the renewed World Bank selectivity framework and strongly reflects current government demands (World Bank 2015c). APL I objectives are relevant to the CPF pillar of promoting broad-based and inclusive growth, and its objective of increasing access to selected quality basic services for the poorest rural and urban communities; however, its health-specific content is not as strong as in previous strategies. Despite this, the CPF

7
planned to continue the policy dialogue in health and supported the sector indirectly through the strengthening of Bolivia’s statistical capacity, while it remained open to government’s interest in further engagement.
2.7 The country context, the government’s priorities, and the World Bank strategies emphasized equity issues and called for improved distributional health impacts. Yet equity is not an explicit objective. This is consistent with Independent Evaluation Group (IEG) findings in 2017 that only 8 percent of health sector projects have equity as an objective and thus distributional impacts are rarely monitored or evaluated. Despite this shortcoming in the relevance of objectives, the project design addressed equity implicitly through its support to the public health insurance scheme that finances basic health care for the poor; and the subprojects targeted to poorer municipalities.
PROJECT DESIGN
2.8 This project was the first of a series of three anticipated World Bank operations that would support implementation of Bolivia’s health reform program. The APL was a step beyond traditional investment operations aimed at improving access to health services and sought to channel the strong government commitment for reform into the health sector. The first project was intended to support the introduction of new vaccines, establishment of a new insurance scheme, introduction of performance agreements, revision of treatment protocols for mothers and children, and implementation of demand-driven investment mechanisms. APL II and III were expected to expand the implementation of the demand-driven investments to the national level and to introduce more elaborate forms of the other instruments, depending on their successful implementation. For example, performance agreements could be extended to municipalities or market-based payment mechanisms could be added to their insurance system. This Health Sector Reform Project (APL I) supported three components (Error! Reference source not found.).

8
Box 2.1. Health Sector Reform Project (APL I) Components Component 1. Coverage and quality improvements of the health services and empowerment of communities. (Cost at appraisal: $36.6 million; actual cost: $19.7 million)
This component was designed to
• Support the implementation of a new medium-term plan for immunizations that will: (i) create the capacity to develop and implement immunization policies; (ii) strengthen health services to improve vaccination coverage and introduce new vaccines; and (iii) strengthen the information and surveillance systems.
• Implement new strategies for the Integrated Management of Childhood Illness (IMCI) and for the Mother-Baby Package (MBP) through: (i) strengthening program management to plan, coordinate, and supervise activities; (ii) development of norms, protocols, and supervision instruments; (iii) training of regional and local level staff; and (iv) use of conventional and new mechanisms to enhance two-way communications with indigenous populations.
• Allocate resources based on the poverty index to finance demand-driven local subprojects to strengthen the quality of maternal and child services; the development of social communication activities to strengthen the information, voice and empowerment of beneficiaries; and the implementation of new instruments of health sector management.
Component 2. Strengthening local capacity to respond to health needs. (Cost at appraisal: $5 million; actual cost: $3.7 million)
Through this component the project would:
• Support the implementation of a Basic Health Insurance system by: (i) supporting the creation of a unit to administer and modernize the system; (ii) developing and managing the information system; and (iii) providing technical assistance to municipalities.
• Strengthen the development of the management information system by: (i) supporting the design and implementation of new modules related to the programs supported by the reform; and (ii) invigorating the analysis and use of management information system reports at the local level.
• Strengthen the capacity and accountability of the health districts to manage and supervise the implementation of project activities. The activity will include the introduction of performance contracts that will quantify targets, assign specific responsibility for achieving those targets, and assign resources to achieve those results.
Component 3. Coordination, Monitoring and Evaluation. (Cost at appraisal: $2.4 million; actual cost: $2.9 million)
This component supported the establishment and operation within the Ministry of Health of a management structure appropriate for the coordination of all project activities and the monitoring and evaluation of the project in accordance with the project performance benchmarks.
Source: World Bank 1999b.
2.9 The geographic scope of APL I was national, as several of the project activities aimed at strengthening capacity within the Ministry of Health (MOH), and of local government entities within departments and districts. The purpose was to reinforce the decentralization

9
process by supporting local governments in their problem-solving capacity, results orientation, and financing systems.
2.10 Subprojects to be implemented under component 1 were an exception to national coverage, as their scope was limited to five of the nine departments: La Paz, Cochabamba, Santa Cruz, Oruro, and Chuquisaca. These subprojects were expected to be targeted using a poverty index and would therefore expand access to healthcare serving the most vulnerable segments of the population. This Resource Allocation Mechanism (Mecanismo de Asignación de Recursos; MAR), as it was called, had three main features: (i) resource allocation was based on a weighted formula that considered local human development indexes (70 percent) and population (30 percent), thus prioritizing poorer municipalities; (ii) subproject definition involved the participation of all stakeholders (the community, the health sector and the municipality) in diagnostic assessments and in the setting of local priorities; and (iii) resource allocation was directed not only to strengthening the supply side, but also to increase the demand for services.
2.11 The MAR foresaw the financing of diverse types of subprojects, including reduction of cultural barriers, promotion of safe motherhood, child protection, improved access to services, community participation, outreach services, communications, service extension and transport in remote areas, and improvements to the environment and environmental health through small interventions. Moreover, some of the subprojects were to address specific local needs to ease implementation of the PAI, the SBS, and the IMCI and MBP protocols (World Bank 1999b).
RELEVANCE OF DESIGN
2.12 The relevance of design is rated substantial.
2.13 The project results chain follows a logical thread, although it is more robust for some objectives than others. Project design tackles key dimensions of the health system, such as health financing, affordability, availability and access, structural and process quality, management and accountability, and health information systems.9 The results chain for PDO 1 (increase coverage of health services) is clearly laid out and encompasses supply and systemwide interventions such as strengthening the immunization program (financing arrangements, introduction of new vaccines, information and surveillance) and establishing the SBS, which would enhance availability and affordability of basic health services for the uninsured. For PDO 2 (increase quality of health care services), APL I supports demand-driven subprojects to improve physical infrastructure of health facilities, the design of protocols for maternal and child care services, training for the adoption of protocols, management of drug supplies, referrals, and supervision tools that would lead to better quality of service provision. Increased quality of services would in turn stimulate demand, thus improving service utilization. The results chain for PDO 3 (empowering communities) is less clear. The project aimed to implement demand-driven subprojects in community participation, outreach services, and development of social communication activities. Yet it is not clear whether these social communication activities were to be specific subprojects, perhaps as training, or if communication activities would be embedded in the implementation of subprojects, or if communication activities were to generate interest, inform about the

10
process, or even stimulate subprojects proposals from communities or municipalities. The results chain of PDO 4 (strengthen local capacity to respond to health needs) involved interventions at national and local levels including the implementation of the SBS and the provision of technical assistance to municipalities; improvements in the National Health Information System (Sistema Nacional de Información en Salud; SNIS) and technical support for the use of SNIS reports at local level; and the development of management and supervisory capacities at local and department levels by introducing performance agreements. In addition, better availability of services and structural quality improvements at health facilities would positively affect the capacity of local governments to respond to population health needs. This enhanced capacity of local governments, together with a stronger community engagement, were expected to attract more mothers and their children to the system and to retain them, which would in turn help reducing preventable infant, child, and mother deaths.
2.14 Project design strategically defined the APL instrument phase triggers, the local management and accountability tool, and the project’s monitoring and evaluation (M&E) design as one set of common outcome indicators. Thus, the key project indicators (KPIs) shown in Table 2.1 were the same used in the performance agreements signed with central, regional, and local authorities, as envisioned in component 2 of the project. The credit agreement, moreover, conditioned the regular progression of the project on the annual achievement of at least five of eight targets, or the World Bank reserved the right to review the situation and propose remedial measures. This results-based approach to lending was innovative at the time, and even though funding would not necessarily stop with nonachievement of targets, it created a strong incentive for the central government and departments (through performance agreements) to attain them. The regular monitoring of these indicators by the project coordination unit helped identify barriers of local governments to attaining results and triggered remedial supportive actions in the areas where they were lacking.
2.15 APLs seem well suited for cases where sector knowledge is strong, long-term objectives are clear, and country ownership is established. The choice of an APL instrument for the overall program was appropriate as the government’s goals to reduce infant and child mortality would take an extended time, requiring consistency and deepening of reforms over its different phases. While the APL instrument provides flexibility to adapt to country changes (including decentralization) by adjusting subsequent phases; the ex ante definition of triggers that enables the continuation of the phases may be a limitation. In fact, a recent Operations Policy and Country Services report highlights that triggers could threaten the continuation of the APL when they become inappropriate overtime.10 Yet this does not seem to be the case here. As Bolivia experienced major deviations from the political and social status quo of the time, the APL series continued operating throughout, perhaps due to the critical development issues addressed by the project and the demonstration effect of the accomplishments of the first phase. As a result, the World Bank moved earlier than planned to prepare the second phase of the APL (CASPR 2001).
2.16 Implementation arrangements. The Health Reform Unit (Unidad de Reforma de Salud; URS) of the MOH oversaw overall project coordination, implementation, and M&E of activities, outputs, and project results, including the evolution of the KPIs. Project design foresaw direct accountability of the URS to the Minister of Health. The URS coordinated its

11
activities with the Departmental Health Services (Servicios Departamentales de Salud; SEDES), health districts, municipalities, and other local actors and institutions. Working under the SEDES director, a technical coordinator and an administrator (financed by the URS) was assigned to the five departments that were the focus of the subproject component. This was expected to allow for better coordination and supervision. All nine SEDES and municipalities were expected to sign performance agreements with the MOH and were also potential beneficiaries of the subprojects related to component 1.
2.17 The National Fund of Productive and Social Investment (Fondo Nacional de Inversión Productiva y Social; FPS) was responsible for implementing and overseeing the execution of subprojects, under component 1, such as invitation and evaluation of bids, contracting, and disbursements. In addition, FPS was responsible for registering subprojects with the Secretariat of Public Investments and for handling municipal and departmental counterpart for subprojects. To ensure local level participation in subprojects, 40 percent of investment resources would go to health districts, 40 percent to municipalities, and 20 percent to SEDES. In addition, priority would be given to localities based on their population size and human development indicators.
2.18 District and departmental service providers (public and private), as well as health districts, SEDES, nongovernmental organizations (NGOs), and community groups in the five selected departments could request subprojects. These entities were responsible for providing at least 20 percent of the total subproject cost to cover administrative and supervision expenses, while the minimum contribution for infrastructure and equipment subprojects was 30 percent. SEDES and health districts were expected to present subproject requests using, as a starting point, established district health plans or municipal annual investments. The URS was responsible for launching a national communications campaign to inform the target population about the project, and then both URS and FPS were to work closely in assembling a portfolio of eligible subprojects or investment ideas, and providing technical assistance for project formulation, as needed. Local District Health Councils were responsible for evaluating and approving subprojects in their localities, while projects presented by SEDES were to be evaluated and approved by the ministry and FPS.
Implementation
2.19 Key dates. The project was approved on June 16, 1999, became effective on December 13, 1999, and closed on December 31, 2003. The original closing date was extended once for a year due to delays in the implementation of the subproject investments subcomponent in the last two years of project implementation. These delays were caused by internal factors that compromised FPS performance (high staff rotation and inadequate planning and programming of key activities), coupled with external factors such as delays in the provision of municipal cofinancing, incentives generated by the National Compensation Policy, and political interference.
2.20 Planned versus actual costs, financing and disbursements. The total cost estimated at appraisal was $44 million, which was expected to be financed by the World Bank with $25 million from APL I, and by the government with $19 million (43 percent of total costs) as counterpart financing coming from the National Treasury and municipal funds.

12
2.21 After the four and a half years of implementation, the project did not receive counterpart funds as expected. The actual project cost totaled $26.26 million, 60 percent of the planned amount. The actual cost of component 1, including activities related to the PAI, subprojects, and IMCI/MBP protocols, amounted to just 54 percent of what was originally planned and was the source of most of the deviation from the initial plan. Lack of national counterpart financing affected the PAI due to economic constraints. As a result, in 2003, the program faced a stock deficit for yellow fever, DPT (diphtheria, pertussis, and tetanus), and tuberculosis vaccines, and a shortage of polio and pentavalent vaccines, risking a reversal in immunization coverage. In this event, the World Bank financed purchases of vaccines and syringes to address the shortage (World Bank 2004b).11 At the end of the project, about $3 million (12 percent of the loan amount) remained undisbursed. Total World Bank disbursement was $21.93 million.
FACTORS AFFECTING IMPLEMENTATION
2.22 Outside the government’s control. In 2003, the last year of project implementation, escalating social unrest occurred stemming from the opposition of various groups to several government policies, mainly the exploitation of natural gas.12 The conflict abated with the resignation of President Gonzalo Sanchez de Lozada in October of that year. During this time, project implementation pace was affected by the conflict itself, as well as by contradictory messages regarding decentralization and public health insurance.
2.23 Within the government’s control. As confirmed by various stakeholders interviewed, the relationship between the MOH, URS, and World Bank during most of the project implementation period was strong. This led the ministry to appoint highly qualified staff to the URS, and the World Bank to collaborate closely with the URS in the technical discussions about the reforms supported by the project. But the relationship changed over time as Bolivia had four presidents and five ministers of health during the four-year implementation period. Coordination between the URS and the central government suffered did URS capacity (especially the last year of implementation) due to high staff turnover, political patronage, and fiscal constraints.
2.24 Lack of counterpart funding at the national and municipal level affected the implementation of the immunization program as the government did not meet its commitment to increase the allocation of funds to finance vaccines, while the municipalities were slow in providing counterpart funds for the implementation of health subprojects.
2.25 Restructuring of the FPS, prompted by the 2000 National Compensation Policy, resulted in managerial changes and implementation delays for the health subprojects component. In addition, the project was hindered by limited technical staff and limited budget at the department level within SEDES, especially in the departments of Beni and Pando. This affected implementation and supervision of local activities. Toward the end of the project, in 2002, health districts were transformed into Local Health Boards, which resulted in implementation delays.
2.26 Within the control of URS. Low capacity in SEDES was addressed by the URS, which appointed additional personnel in the regions and increased direct supervision to

13
address the gaps. Issues related to the installation in the URS of a national financing system established in 2002 led to delays in project execution. According to interviews with stakeholders, the highly qualified staff of the URS were committed to project activities and the reforms and focused on monitoring results and learning. However, some stakeholders indicated that the URS became perceived as direct advisors to the minister rather than as neutral implementers of the project capable of broader collaboration.
2.27 Safeguard compliance. No safeguards were triggered by this project. However, during project preparation stage, the World Bank conducted two studies on the cultural patterns of users and providers of health care to better understand barriers that influence the use of services by indigenous groups. The studies included a survey of attitudes and behaviors of the Quechua and Aymara populations, as well as a consultation with potential beneficiaries in the departments of La Paz, Cochabamba, and Santa Cruz. The aim was to explain project objectives and components and discuss ideas about the design of procedures related to the implementation of the health subprojects component. The project implemented social communication strategies based on studies and activities related to perceptions on vaccines, as well as the communication to providers on traditional practices and how to incorporate them. The PAD considered it unnecessary to prepare a separate Indigenous Peoples Development Plan because most of the project beneficiaries were indigenous. The described activities incorporated this feature in project design. The project was assigned a B Environmental Category as it did not represent any significant environmental risk. Beyond this classification, the project introduced practices for the safe disposal of syringes and needles at the primary level, which did not exist in Bolivia.
2.28 Fiduciary compliance. During implementation, six audits of the project’s financial statements were conducted. Based on the recommendations of those audits, plans to improve internal controls were implemented. A 2004 audit of the financial statements, corresponding to the last year of APL I, found that the project complied with the terms of the agreement and applicable laws and regulations, except that the audit report was submitted four months later than stipulated in the agreement. A 2002 procurement audit also found that most internal controls had improved with minor issues related to the maintenance and control of documentation. The FPS, which was responsible for the execution of the health subprojects component, received poor audit results and hired a consulting firm to help them address the major observations, which were corrected. A new financial management assessment of FPS was done to incorporate issues related to the restructuring process it went through in 2000, which led to the preparation of an action plan and close World Bank supervision.
Achievement of the Objectives
OBJECTIVE 1: INCREASE THE COVERAGE OF HEALTH SERVICES
2.29 Achievement of objective 1 is rated substantial.
2.30 Outputs and intermediate outcomes. The project contributed to strengthen the PAI by supporting introduction of a new pentavalent vaccine, implementation of vaccination campaigns, and investments in infrastructure and equipment to improve the cold chain and storage of vaccines. As mentioned by stakeholders consulted, this infrastructure is still being

14
used and is an important milestone in the expansion of immunization coverage in Bolivia. There is no evidence on monitoring of related output and intermediate outcome indicators, such as the dropout rate of tuberculosis-polio vaccine.
2.31 The project contributed to affordability of services by supporting the design and implementation of the SBS through the provision of technical assistance to municipalities on their role in the implementation of the insurance system; design of contract mechanisms for NGOs and other private providers; and support for the functioning of a central management unit and related information systems. To strengthen the development of management information systems, the World Bank financed the purchase of hardware and software; and the creation and operation of information analysis committees at the local level.
2.32 Outcomes. The project activities contributed to increased coverage of many health care services related to maternal and child health.
2.33 Immunization coverage increased. DPT and pentavalent vaccine rates in children under 1 year old have increased from 77 percent in 1998, to 88 percent in 2002, exceeding the 85 percent target at project closing (table C.1 in Appendix C).13 The latest data show that immunization coverage for children under one reached 86 percent in 2016, and when immunizations are compared against children aged 12–23 months, DPT rates reached 99 percent in 2016, above the regional average of 89 percent. In fact, Bolivia’s coverage rates have been higher than the regional average since 2012. Despite initial shortcomings with government counterpart funding, the sustainability of these achievements was possible due to the extraordinary financing efforts made by the government supported by the World Bank’s technical assistance (see below on more financing of vaccines).
2.34 Immunization coverage has increased in a more equitable manner over the project implementation period and thereafter, although it was not an explicit objective.14 The gap in coverage rates for all vaccines between the lowest and the highest income quintile reduced from 0.71 in 1998 to 0.83 in 2003 at the end of APL I. Current data show further improvements with vaccination coverages for the poorest children that are about 0.93 of the rates for the richest.15 More recently, the 2016 Demographic and Health Survey (DHS) finds that municipalities with high poverty levels had 88 percent of pentavalent coverage, above the 86 percent country average; however, the largest gaps in coverage can be seen for the Altiplano region (79.7 percent), for the department of La Paz (76.7 percent), and for children whose mothers have no education (75.7 percent) (INE 2017).
2.35 National financing of vaccines increased over time, although modestly below targets, reflecting the government’s commitment. After negotiations between the MOH and Social Security, it was agreed that 5 percent of their annual income from contributions would provide the additional funds needed to finance the immunization program. The agreement was formalized in the 1999 Budget Administration Law, Law 2042. National financing of vaccines increased from $0.5 million in 1998 to $3.3 million in 2002, but it fell short of the $4 million target during the implementation of APL I (World Bank 2004c, 48). Despite the initial backing of the Budget Administration Law, further regulations were needed to specify that the MOH should use these funds exclusively for the financing of vaccines and syringes, because part of the funds were, at some point, used to finance the

15
payment of other government programs. As other laws and regulations were issued,16 financing of the PAI was secured, allowing sustainability of its achievements. As indicated by stakeholders, the World Bank supported technical assistance for the URS to perform economic analysis underlying the initial laws and regulations. Moreover, World Bank advice and support in the negotiation for greater financing of vaccines during 2000–2005 were considered key to attaining independence from external donors.
2.36 Another substantial accomplishment was the increase in skilled birth attendance. Coverage of births attended by health personnel has more than doubled since the APL program started. It increased from 42 percent in 1998, to 60 percent at the end of APL I, reaching about 90 percent in 2016. Thus, Bolivia has reached its Millennium Development Goal (MDG) of achieving 70 percent institutional birth coverage by 2015, yet it trails the regional average of 94 percent coverage.17
2.37 Results on the capacity of the health care system to respond to the most common health needs of children are positive. Two KPIs relate to the treatment of children under five for symptoms related to pneumonia and diarrhea. Because they are defined as the number of cases treated in health centers, they do not reflect the coverage of health services. Prevalence rates and the total number of children should have been considered for a coverage measurement. According to additional data collected by IEG, the proportion of suspected pneumonia cases that were treated in children under five increased from 28 percent in 1998 to 55 percent in 2016, while prevalence rates have decreased from an estimated 26 percent in 1998 to 12 percent in 2016. This is an important achievement since pneumonia accounts for 18 percent of all deaths of children under five (WHO/UNICEF 2013). On the other hand, diarrhea accounts for 11 percent of deaths in children globally. Bolivia has experienced a reduction in prevalence of diarrhea in children under five—from 25 percent in 1998 to 14 percent in 2016, based on DHS estimates. According to Unit Responsible for Social and Economic Policy Analysis (Unidad de Análisis de Políticas Sociales y Económicas; UDAPE), treatment was given to 46 percent of children under five in 2016, a remarkable increase from 29 percent in 1998.18
OBJECTIVE 2: INCREASE THE QUALITY OF HEALTH SERVICES
2.38 Achievement of objective 2 is rated substantial.
2.39 Outputs and intermediate outcomes. The project contributed to the implementation of the IMCI and MBP strategies, which were adapted from the World Health Organization (WHO) to Bolivia’s context with technical assistance from PAHO. The World Bank financed training of health personnel on the relevant protocols and the design of management instruments to assess progress in this area. More specifically, IMCI training materials were developed based on clinical texts that were adapted to the epidemiology and cultural conditions in Bolivia; 17 IMCI training centers in different parts of the country were created; 1,784 healthcare staff, mainly from primary care centers, were trained; and support for the creation of an interagency committee that included other donors was provided. The results framework included several structural quality indicators (such as percentage of SEDES’s health personnel trained in MBP/IMCI, and proportion of health facilities with IMCI essential drugs), but there is no evidence on their monitoring.19

16
2.40 The project financed 311 subprojects in the five participating departments (La Paz, Oruro, Cochabamba, Chuquisaca, and Santa Cruz), for which the partnering municipalities provided counterpart funds amounting to 20 to 35 percent of the total cost. The IEG team could not find data on the distribution of subprojects funds by locality and type of subproject to corroborate their effective targeting and use of the MAR tool. While subprojects were thought to support both demand and supply activities, project documents state that municipalities showed low levels of interest in community training activities that were expected to stimulate demand, resulting in a reassignment of funds toward infrastructure and equipment subprojects. Some stakeholders suggested to the IEG team that the allocation of MAR funds was used as an incentive for signing and compliance with performance agreements, thus giving additional means for the municipalities to achieve the targets agreed on at the local level. Other stakeholders recalled that subprojects were adjudicated based on the readiness of a previous pre-investment assessment.
2.41 Outcomes. Completeness of prenatal care improved in Bolivia during the APL program. This indicator follows the recommended four-visits standards for efficient control and monitoring of the pregnant woman’s health (WHO 2002).20 The indicator was introduced as a proxy for quality of care since it reflects the ability of the health system to keep pregnant women engaged in prenatal care. Thus, the proportion of pregnant women that have completed prenatal care after receiving the first visit increased from 30 percent in 1998 to 37 percent at the end of APL I, and continues to increase afterwards. World Bank efforts through health insurance programs and the support to implementation of IMCI and MBP standards may have had a positive effect on the quality of prenatal care.
2.42 Mortality rates are gold standards for measuring quality. Early neonatal mortality in secondary and tertiary health facilities decreased from an estimated 14.4 deaths per 1,000 live births in 1998 to 7 at the end of APL I, achieving the target of 11 per 1,000 deaths.21 Caution is warranted in the interpretation of this indicator, however. A higher value may also reflect a better referral system where the most complicated cases reach these higher-level hospitals. The inclusion of this indicator was a priority for the government and the entire system to track this data in preparation for APL II. It conveys information on the quality of the secondary level hospitals (not directly supported by APL I, but later during APL II) and the robustness of the primary level and referral system to detect and rapidly respond to pregnancy complications. A shortcoming of this indicator though is that it may divert efforts to its monitoring when attention could have gone to other areas of project influence. Total neonatal mortality significantly reduced during APL I in Bolivia and onwards. According to DHS estimates, it decreased from 34 per 1,000 live births in 1998 to about 27 per 1,000 live births in 2003. Current values are in the order of 15 per 1,000 live births.22
2.43 To date no health facility survey data are available that could provide robust evidence on the quality of processes, such as whether health care visits are conducted according to standards and national protocols. However, as will be discussed later, patient satisfaction surveys were part of the M&E design for APL III. A 2016 government survey of population and health—Encuesta Nacional de Demografía y Salud (EDSA)—incorporates additional criteria to assess quality of care during prenatal visits (see APL III for more details).

17
OBJECTIVE 3: EMPOWER COMMUNITIES TO IMPROVE THEIR HEALTH STATUS
2.44 Achievement of objective 3 is rated modest.
2.45 Outputs and intermediate outcomes. APL I supported activities to provide services to indigenous and native populations. The project financed anthropological studies in two rural indigenous communities to investigate the reasons for the low demand for health services. It also supported the incorporation of culture-friendly practices into SBS, IMCI, and MBP health care protocols, including the availability and reimbursement of traditional drugs at the primary level of care. Agreements with two of the largest indigenous organizations were formalized to implement SBS in indigenous areas with monitoring by an indigenous health committee. But the implementation of the Basic Native and Indigenous Insurance was later revoked with the SUMI (World Bank 2009). APL I financed 10 scholarships for the Postgraduate Degree in Intercultural Education called the Willaqkuna project that combines occidental and traditional medicine to enhance skills of health professionals in indigenous areas (World Bank 2001b).
2.46 The World Bank supported the design of the Pregnant Women’s Rights Charter that led to the design of the Pregnant Women’s Bill of Rights based on a series of focal groups and surveys of women regarding their expectations when giving birth, cultural practices, and treatment in health facilities. APL II foresaw the implementation of the practice of having health professionals co-sign this bill of rights with pregnant women during their first prenatal consultation, but no information was provided by project closing, despite being a project output indicator. There are no intermediate outcome indicators measuring community empowerment in the results framework of APL I.
2.47 Outcomes. As discussed before, the project lacks clarity on the ways in which it aimed at empowering communities; moreover, there was no specific outcome or intermediate outcome indicator to measure results in this area. The IEG team made considerable efforts to obtain information on subproject type (infrastructure, equipment, or training), entity that requested it (municipality, SEDES, community, other local organization), the locality (important to determine whether rural or indigenous communities were benefited), or the title and amount of the project that would have allowed the identification of communication activities. However, the World Bank team was unable to provide such information due to the long time passed since project closure. Nevertheless, the ICR mentions the low level of interest by municipal governments in community training subprojects to stimulate demand which led to a reassignment of funds to the equipment and infrastructure categories.
2.48 The scarcity of information limits the assessment of achievement of this objective and the World Bank’s contribution. The borrower recognized the importance of undertaking more aggressive actions to effectively involve the communities on health-related decision making (World Bank 2004b p.21). The empowering communities was later excluded from the statement of objectives in APL II.
OBJECTIVE 4: STRENGTHEN LOCAL CAPACITY TO RESPOND TO HEALTH NEEDS
2.49 Achievement of objective 4 is rated substantial.

18
2.50 Outputs and intermediate outcomes. The World Bank contributed to this objective through different channels.
2.51 The World Bank introduced performance agreements with all nine departments to strengthen the capacity and accountability of the health districts in the new decentralization context. The World Bank strongly supported the initial adoption of the agreements, negotiation with regional governments and municipalities, advocating for the importance of signing these agreements in that they could open opportunities to greater financing in lagging areas, and the ability to know the healthcare needs of their constituents. Initially, eight of the nine departments signed the agreements, but toward the end of project all the departmental SEDES had done so. Performance agreements cascaded down from the project’s results-based approach and defined a list of 15 results indicators—containing all the KPIs on Table 2.1—and 10 process indicators with targets set by each SEDES.23 No explicit reward, in terms of added funds, was foreseen for the high-performing departments. Instead the publication of the annual ranking of SEDES based on the number of targets achieved, and recognition from the MOH were the incentives for compliance. One shortcoming was the lack of uniformity in the way targets were set across SEDES since this detracts from the effectiveness of the rankings as an incentive for compliance (World Bank 2004c). The project also supported the evaluation of secondary and tertiary hospitals during 2001 and 2002 to explore possible implementation of the agreements in these instances, which led to pilot experiences with tertiary hospitals in the municipalities of Santa Cruz and El Alto.
2.52 The project supported the implementation of the SBS health insurance, later transformed into SUMI, and currently under Law 475/SIS.24 The World Bank’s contribution was extremely important in that it strengthened state capacity at different levels. At the central level, the project financed the hiring of health economists and through close supervision, consistently participated in the design, adjustments, and decisions related to the package of health services covered. The growth and learning generated inside the URS was determinant in the positioning of the MOH at the time. Although URS staff was not absorbed by the MOH as planned, the quality of the team had a lasting effect in Bolivia’s health system, as suggested by stakeholders, since the SBS continued to be implemented through its later incarnations. Similarly, some of the tools developed to estimate the amount of financing needed for a transition toward universal coverage of the insurance are still being used today. At the departmental and municipal level, training was provided to better equip authorities for the implementation of the insurance system, including the design of contract mechanisms to be used with NGOs and other providers.
2.53 In addition, the World Bank strengthened health information systems through support to the SNIS. Hardware and software were purchased for this purpose, benefitting the system at local and regional levels as well. It should be noted that leadership in this area was taken by the Inter-American Development Bank through a loan operation during implementation of APL I. But World Bank support to the SNIS continued through APL II and III, which furthered improvements to the system including the introduction of financial and service production software, while also supporting the integration among them.25
2.54 The URS was supported by the project through financing of equipment, materials and supplies, and training for its staff. In addition, with project support, the URS procured six

19
audits of project financial statements, and a procurement audit in 2002. Other outputs included financing for a 2001 postcensus national survey on maternal mortality, through an interagency agreement between the National Institute of Statistics (Instituto Nacional de Estadística; INE) and the MOH; evaluation of the SBS; special audits of the Compensatory Health Fund of the SBS in various municipalities; and medical audits for specific cases in secondary level hospitals.
2.55 There is no evidence that output and intermediate outcome indicators related to this objective (such as share of municipalities that fully executed SBS funds; number of SEDES with performance agreements compliance rate higher than 80 percent) have been systematically monitored.
2.56 Outcomes. An important accomplishment of APL I has been the adoption of a results-based approach in the health system. Through the implementation of performance agreements between the MOH and the departments, whose performance indicators matched the project’s key indicators, proved to have a positive effect in regional authorities monitoring practices. Even though the signature of these performance agreements is no longer a current practice, the IEG team could corroborate that some of the departmental SEDES continue the practice of monitoring indicators and have expanded the list to include other indicators relevant for their specific programs.
2.57 During APL I, motivation to meet the targets set in the agreement were reinforced by the Health Information Analysis Committee (Comité de Análisis de Información en Salud; CAI) held at all government levels, which were meant to communicate and discuss health needs and programs based on the achievement of the targets set in performance agreements. To date this practice continues to exist and has proven to be an important project contribution. In addition, the SBS has been maintained and given the political volatility that Bolivia experienced during the implementation of the entire program, this has proved to be an important and sustainable state service.
OBJECTIVE 5: REDUCE INFANT AND CHILD MORTALITY
2.58 Achievement of objective 5 is rated substantial.
2.59 Progress in declining rates of infant and under-five mortality during the implementation of APL I was on track to achieve the program goals for 2011. By the end of APL I, infant and child mortality were 54 and 75 per 1,000 live births.26 The reduction in these indicators has been a major accomplishment for Bolivia and can be traced back to improvements such as lower economic barriers to access, better information systems, better quality of care and strong government commitment. As immunizations are proved to have a significant impact in reducing infant and child mortality, strengthening of the immunization scope and coverage were an important contribution of the project. In 2006 a UDAPE impact evaluation found that public health insurance reduced the risk of infant death in urban areas, albeit not significantly in rural areas. In contrast, its impact on child mortality was significant in rural, but not urban areas. These results are explained by different concentration of health facilities according to care level and thus differences in neonatology and pediatrics service uptakes among these areas.
20
Efficiency
2.60 Efficiency is rated substantial.
2.61 From a technical perspective, APL I supported the strengthening of cost-effective health interventions like the immunization program, IMCI, and MBP, which have proved impact on the reduction of infant mortality. Moreover, the project succeeded in establishing the public insurance scheme SBS that covered a package of cost-effective and priority health interventions for infants, pregnant women, and women of childbearing age (UDAPE 2006).
2.62 The project’s economic analysis estimated high value for money of the planned investments. A cost benefit analysis was conducted at appraisal obtaining an average internal rate of return of 40 percent based on Monte Carlo simulations. No economic evaluation was done at project completion to assess efficiency. The ex ante analysis considered that the project affected the number of averted deaths of children under five, and mothers. Benefits related to the deaths averted considered discounted value of income that the person would earn during the added lifetime, discounted GDP per capita by a factor that reflected that people benefitting from the project were mostly low income. For the analysis, the project considered total project costs, and assumed continued government support between 25 to 35 percent of final year investments, but it did not consider additional government expenditures on children whose lives have been saved by the project. Both benefits and costs were calculated for ten years, estimates were made on prevalence rates for diarrhea and acute respiratory illnesses and resulting mortality rates, while existing literature informed the assumptions on effects of vaccine coverage in the reduction of mortality rates. A Monte Carlo simulation was performed where the values of the project KPIs are assumed to vary. It should be noted that the analysis does not indicate the quantification of project contribution to the reduction of maternal mortality, but most importantly the simulation did not explain possible correlation between the KPIs, nor assumed a gradual increase in coverage.
2.63 Implementation efficiency was satisfactory during most of the project duration, although it suffered in the last year, as delays occurred due to slow implementation of the health subprojects component under FPS and political turmoil in 2003. Within the FPS, institutional inefficiencies and slow counterpart financing from municipalities contributed to the delays.
Ratings
OUTCOME
2.64 Overall outcome is rated satisfactory. The relevance of objectives is rated substantial because objectives were responsive to country conditions at the time of appraisal, project completion, and currently. However, although there is an emphasis on the need to improve distributional health impacts in government as well as World Bank strategies, the project’s objectives lack an explicit focus on equity. The design of the project was substantially relevant, the results chain was well conceived, and the lending instrument was appropriate. Efficacy in the achievement of objectives is rated substantial, except for the objective of empowering communities, which is rated modest for lack of outcome measures.

21
Efficiency is rated substantial considering the project supported cost-effective health interventions, the economic evaluation suggested a high value for money, and that implementation efficiency was satisfactory.
RISK TO DEVELOPMENT OUTCOME
2.65 Risk to development outcome is rated moderate. Risk of waning government commitment and ownership is low. Despite political changes, the project objectives were and continue to be important areas of government strategies. The government, moreover, has shown interest in implementing a universal insurance scheme, which builds on work under the program and would further its impact. Similarly, the current government is committed to the continued financing of vaccines with its own resources and has presented the reduced dependency from international cooperation funds for this purpose as an achievement of the administration.
2.66 The main reforms supported by the program, such as the health insurance system and the immunization program, are well established and likely to continue due to a solid legal framework that explicitly earmarks the use of resources for those programs. In the immunization program, the legal framework helped to attain independence from external donors in financing vaccines. For the implementation of the health insurance, and maintenance of investments in health subprojects, funds are currently available through transfers to municipalities, guaranteed by the legal framework. However, funds are still contingent on the flow of revenues (mainly hydrocarbon taxes), and on management of reserves at the central level. In addition, some stakeholders were concerned about municipalities’ low incentives and capacity for supervision and maintenance, which poses risks for the continued impact of health subprojects.
2.67 Institutional and political risks are moderate. Changes in decentralization rules and their application may affect the increased state capacity and coordination across different levels of government that was gained under the project. While further clarification of roles and responsibilities across ministry, departments, and municipalities would be beneficial for the sector, political forces at the department and central levels may affect the sustainability of project outcomes. For example, some stakeholders have pointed to the lack of communication of the central level with the SEDES, and the diminished functions and resources that this level of government has experienced over time.
BANK PERFORMANCE
2.68 World Bank performance is rated moderately satisfactory.
2.69 Quality at entry is rated moderately satisfactory. Project design was grounded in Bolivia’s health sector needs and reflected government priorities regarding the reduction of infant and maternal mortality. However, it missed the emphasis on equity issues, which were not reflected in the project objectives. Another shortcoming was the adequacy of the monitoring and evaluation design, and the limitations of some KPI (see M&E section below).
2.70 Project design focused on cost-effective interventions like expanding immunization coverage, which has proved impact on the reduction of infant mortality. It simultaneously

22
aimed at improving the quality of care through the introduction of protocols aimed at reducing maternal, infant and child mortality, which perhaps would have less visible impact but would be critical in attaining program goals. As stated by stakeholders, the World Bank was an early supporter of government initiatives, namely the implementation of the health insurance system, creating a unique opportunity to improve its design over time, while building good rapport with the government.
2.71 In addition, the design incorporated and aimed at deepening the decentralization process in Bolivia by supporting and using the mechanisms in place for investment in equipment and infrastructure within the purview of municipalities. The introduction of performance agreements increased coordination between the central, departmental, and municipal levels, and provided an innovative mechanism for mitigating the negative effects resulting from the fragmentation of the decentralized system. While these mechanisms are currently not in place and the government has not continued the close coordination established with the project, the practice of monitoring and communicating results, mainly at the department level, continues today.
2.72 Quality of supervision is rated moderately satisfactory. Seven supervision missions were conducted during the four years of project implementation. During the challenging context of 2003 when political turmoil paralyzed the country, the World Bank was resourceful and coordinated parallel missions related to other projects in the portfolio, effectively intensifying the supervision effort. Stakeholders commended the commitment and high quality of World Bank dialogue and support, particularly in relation to technical discussions of key reforms entailing health economics expertise.
2.73 The World Bank coordination and adaptability to changing circumstances was evident in its relationship with PAHO to allow the purchase of vaccines when government’s financing stopped, and the country faced a shortage risking the sustainability of project’s gains. By convening officials from different levels of government (including departmental and municipal) in the review meetings, the World Bank effectively created an avenue of communication among them, while ensuring a comprehensive understanding and quick resolution of bottlenecks. In the initial stages of APL I, the World Bank supported the ministry and implementation unit with training in the areas of financial management and procurement. Deficiencies in several KPIs were identified during project implementation and were planned to be corrected in the second phase of the program. However, systematic monitoring of output and intermediate outcome indicators was limited.
BORROWER PERFORMANCE
2.74 Borrower performance is rated moderately satisfactory.
2.75 Government performance is rated moderately satisfactory. The government of Bolivia was highly committed to project implementation, giving high priority to the project reflected in the issuing of two decrees that set the legal basis for project implementation. The URS has successfully worked with several administrations, although changes during the last year of implementation caused turnover of URS staff. The government also appointed high-quality staff to the URS, while allowing for direct communication between the implementing

23
unit and the ministry. Departmental authorities, including SEDES, were also interested and involved in project design and implementation, as they participated in consultations and workshops in the design stage, while closely coordinating with URS staff assigned to the focus departments during implementation. Despite the high level of commitment, counterpart financing did not meet plans at appraisal, mainly due to economic and fiscal constraints of the government, which affected implementation of the PAI. Similarly, further changes in the structure of the health system were introduced through a SUMI law in 2002, transforming health districts into Local Health Boards, which resulted in implementation delays.
2.76 Implementing agency performance is rated moderately satisfactory. The performance of the URS was satisfactory, as it was highly committed to the attainment of project objectives, while conducting high-quality technical, financial, and managerial work. Frequent progress reports on KPIs were coupled with high collaboration to meet deadlines. However, more effort could have been placed in monitoring project outputs, mainly those related to health subprojects. The URS was responsive to capacity gaps during implementation and supported SEDES in its monitoring of activities. Toward the end of APL I, political interference and country instability affected URS performance at the technical and administrative level.
2.77 Performance of the FPS was moderately satisfactory. After the National Compensation Law was passed in 2000, reorganization within FPS with consequent changes in incentives affected its performance and resulted in high staff rotation, inadequate planning of key activities, and slow processing of demand-driven requests. Lack of counterpart financing from municipalities contributed to the slow implementation of health subprojects thus affecting the timely completion of project activities. Despite delays, the FPS did a catch-up and could execute 95 percent of the budget assigned to this component.
MONITORING AND EVALUATION
2.78 The quality of M&E is rated modest.
2.79 M&E design. The project defined 8 KPIs and17 output and intermediate outcome indicators in its results framework with complete baseline and target values. Sources of data were specified at appraisal, but not the responsible agency for data collection. The selection of KPIs mostly reflected improvements in coverage and, to a lesser extent, improvements in the quality of health services; no specific outcome indicator tracked progress on the empowerment of communities or the strengthening of local capacities.
2.80 Moreover, some indicators proved to be ill-defined or problematic. The indicators on the treatment of children for symptoms related to pneumonia and diarrhea were defined as number of cases treated at health centers. But it is not possible to assess coverage of pneumonia treatment by merely looking at number of pneumonia cases attended as this could result from changes in prevalence rates, better quality of clinical diagnosis, or even greater coverage (World Bank 2001b, 2004b, 2007). Project documents recognized such shortcomings due to SNIS data limitations and the difficulty estimating prevalence rates. Since pneumonia is an important cause of child mortality, its inclusion is justified despite the

24
shortcoming. Similarly, estimates of diarrhea treatment could have incorporated estimates of prevalence rates, as opposed to only monitoring the number of cases treated.
2.81 The indicator measuring coverage of pentavalent vaccine at the municipality level to track equitable access to immunizations also had caveats. Population estimates at the municipal level produced by the National Institute of Statistics (INE) are not accurate especially for small municipalities, which tend to have inflated population figures (World Bank 2009, 12). The concern with population denominators was raised by several stakeholders interviewed by the IEG team.
2.82 The indicator measuring the extent of national financing of vaccines tracked an important assumption of the project: continued government ownership and commitment, which would contribute to the sustainability of the immunization program. While this factor is beyond the project scope, it indirectly reflects the perception of the PAI’s success and the capacity of the ministry to substantiate the financial support needed to continue and expand its immunization program.
2.83 M&E implementation. M&E activities for KPIs were implemented as planned. Performance agreements became an instrument for better monitoring of results at different levels of government, while strong incentives for monitoring effort resulted from the introduction of a provision in the Development Credit Agreement that made project continuation contingent on reaching the targets for at least five of the eight project indicators. The URS had to support the SEDES in the oversight and monitoring of results at a local level because of capacity limitations, which points to proactiveness on the URS part to address this issue. This in turn affected overall expenses for component 3 that financed activities of the implementing agency.
2.84 Routine reporting was supplemented by surveys and studies financed solely or in part by the project, including the 2001 postcensus national survey on maternal mortality, and the production of Health National Accounts for Bolivia. In addition, special evaluations were conducted on main project topics, such as an evaluation of the SBS, special audits of the Compensatory Fund of the SBS in different municipalities, and medical audits for specific cases in secondary level hospitals.
2.85 The main shortcoming in the implementation of the M&E framework is the lack of evidence of a systematic tracking of output and intermediate outcome indicators during project implementation. Also, an impact evaluation of subprojects was not conducted.
2.86 M&E use. The innovative design of APL I—strategically defining a common set of indicators to be used as project indicators as well as local management and accountability tool—offered a unique opportunity for a results orientation and use of information for decision making. Thus, it was an advantage to use M&E indicators for accountability purposes through performance agreements. As some stakeholders confirmed, the monitoring of performance agreements allowed for the identification of under-performing municipalities, and the subsequent allocation of additional support to achieve targets. For example, by proposing subprojects in municipalities that were behind schedule on correcting equipment, physical infrastructure, or training gaps. Of course, in practice, this has been limited by the
25
adequacy of indicators in tracking coverage, quality, and equity dimensions as explained in M&E design. The URS became aware of the appropriateness of the data produced by SNIS through its regular monitoring activities. With that knowledge, it worked to produce alternate definitions for the next phase of the project, while identifying areas of improvement for health information systems.
3. Second Phase of the Health Sector Reform Program (APL II)
Objectives, Design, and Relevance
PROJECT DEVELOPMENT OBJECTIVES
3.1 The APL program triggers were sufficiently met to allow for the continuation to the second phase.27 As stated in the Development Credit Agreement of August 31, 2001, “The objective of the Project is to reduce the rate of infant mortality in Bolivia by extending the coverage and quality of the Borrower’s health services and strengthening local capacity to respond to health needs” (World Bank 2001a, 14).28 The PDO will be subdivided into four objectives (child mortality and empowerment of communities will not be evaluated as an objective since they were not specified in the credit agreement). Objective 1: Increase coverage of health services. Objective 2: Increase quality of health services. Objective 3: Strengthen local capacity to respond to health needs. Objective 4: Reduce infant mortality.
RELEVANCE OF OBJECTIVES
3.2 The relevance of objectives is rated substantial.
3.3 The project objectives were and continue to be relevant to country conditions, national strategies, and World Bank strategies. Considering that objectives are the same for both APL I and II, the arguments presented in paras 2.5 to 2.8 apply to this project as well.
PROJECT DESIGN
3.4 The second phase of the Health Sector Reform Program continued supporting the interventions introduced during the first phase. As presented in Error! Reference source not found., the project’s three components dealt with the same areas as phase one. The overall approach was to deepen and mainstream the policies and practices introduced but to go further where warranted. For some interventions, the project expanded the geographic scope, for others it focused on reaching the poor and indigenous. The added features of APL II are explained below.
3.5 The second phase expanded the focus on the poor and indigenous in various ways. The project supported the creation and rollout of the National Program for the Expansion of Health Insurance (Programa Nacional para la Extensión de Cobertura de Seguros; EXTENSA). This was an effort to assign health workers to areas where some of the infrastructure investments remained underused. By deploying mobile brigades, communities in remote and underserved areas would be able to increase their use of preventive services,

26
effectively benefitting from the SBS.29 The health teams were composed of local community agents—indigenous where relevant—combined with itinerant health professionals and auxiliary nurses. The local agents would live in the community providing a cultural bridge, while tending to health promotion activities and organizing the work of the health brigades. The project also included activities to empower indigenous beneficiaries of the insurance, by financing the dissemination of rights of indigenous people as users of healthcare services in Aymara, Quechua and Guaraní; training and equipping health advocates that would oversee compliance with SBS rules by providers; implementing user satisfaction surveys disaggregating by ethnic background; and financing national and regional meetings of the National Indigenous Health Council.
3.6 APL II expanded the geographical coverage of some interventions. It expanded the scope of subprojects to include all nine departments in Bolivia. Another modification was the elimination of community training subprojects, giving preference to investments in areas targeted by EXTENSA. Following changes introduced by the 2000 National Compensation Policy, MAR funds would be allocated based on an index of unmet basic needs at the municipality level.30Another variation introduced in the second phase was the expectation that performance agreements would be signed not only with all the SEDES but also with all the districts included in EXTENSA (World Bank 2001b).
Box 3.1. Second Phase of the Health Sector Reform Program (APL II) Components Component 1. Coverage and quality improvements of the SBS and empowerment of communities. (Cost at appraisal: $39.3 million; actual cost: $15.6 million)
• Strengthening policy development, regulation, and monitoring of the SBS, by supporting: improvement of the quality of information on the production of services and on the health status of the population; the development of new policies and the management and supervision of the SBS; and the implementation of activities that empower indigenous users of the SBS.
• Strengthening National Health Programs for Mothers and Children by supporting: continued implementation of the second generation of the Expanded Program of Immunizations and the preparation and implementation of multidonor support program for IMCI, MBP, nutrition and medical waste at the primary level.
Component 2. Local capacity to respond to health needs of the population. (Cost at appraisal: $27.9 million; actual cost: $25.1 million)
• Assignment of health teams to expand the coverage of the SBS by supporting the management of EXTENSA, including targeting techniques to assign the new health teams; the financing, training, and light-equipping of health teams consisting of community workers and itinerant professionals in underserved areas; and technical assistance to municipalities to coordinate work with the newly formed brigades.
• Investment subprojects to expand the coverage of the SBS; these subprojects would finance civil works and equipment required to make an effective use of the new health teams assigned to currently underserved areas.
Component 3. Monitoring of Performance Indicators and Project Coordination. (Cost at appraisal: $3.1 million; actual cost: $7.1 million)

27
Performance agreements assigning resources and setting targets for the expansion of coverage will be signed with regions and selected municipalities and periodically monitored.
Source: World Bank 2001b.
RELEVANCE OF DESIGN
3.7 The relevance of design is rated substantial.
3.8 APL II improved on the design of APL I by addressing some but not all shortcomings. As discussed in para 2.13, the community empowerment objective of APL I was not adequately framed. Moreover, the project’s results framework lacked outcome indicators to gauge progress in this area, weakening the project logic for this objective. APL II framed the support to community empowerment and defined it as encompassing activities that further increase coverage of health services for indigenous populations. Planned activities aimed at bridging the cultural divide by including indigenous communal agents in health brigades, informing and empowering indigenous mothers to decide on the management of their pregnancy, training health advocates in the communities, and measuring satisfaction of indigenous users of health services. Even though community empowerment was not a free-standing objective of APL II, the activities were expected to increase the effective number of SBS beneficiaries. Improving the quality of health services for the indigenous population was expected to increase their use of services and expand coverage.
3.9 The project addressed the limitations of some indicators in its results framework. In APL II, three of the eight KPIs were improved based on the experience and lessons learned under the first project (see table E.3). The definition and scope of the complete prenatal care indicator and the early neonatal mortality indicator were adjusted. Similarly, the diarrhea treatment indicator was replaced by the percent of children that have three iron doses. The replacement addressed the ability to track coverage of nutrition programs and the need to focus more on preventive services. However, the indicator for pneumonia cases treated was not improved. This indicator could have been better defined or replaced in the design of APL II, but it was left untouched and continued to confound changes in prevalence and coverage. The only equity indicator, number of municipalities with pentavalent vaccine coverage lower than 80 percent, retained the shortcomings explained in para 2.82.
3.10 APL II follows the same logical thread as the first phase of the project. The second phase continues to address the same dimensions of the health system as APL I: financing, affordability, availability and access, structural and process quality, management and accountability, and health information systems. APL I and II have the same PDOs, except community empowerment, which was not an objective of APL II. The common PDOs follow the same adequate project logic as those of the first phase (para 2.13). IEG’s reconstruction of the results chain (shown in Appendix I) presents the project’s logic.
3.11 The APL continued to be an adequate instrument for the second phase. The instrument allowed continuity and consistency with the reforms initiated during phase one. APL I had strong performance and, as a result, all but one of the project triggers were met

28
two years ahead of project completion. To avoid implementation delays, it was decided to move to phase two prior to the upcoming change in government. The decision to start APL II earlier than envisaged was justified by the good performance of APL I, the high priority given to project activities in the PRSP, and the widespread support for this project across the political spectrum. Features of the APL made this quick transition possible, namely planned phasing of the program from the beginning, quicker preparation times and costs of APLs, and learning stemming from experience in previous phases.
3.12 Implementation arrangements. For the second phase of the program, the URS was formally absorbed by the General Office of Health Services (Dirección General de Servicios de Salud; DGSS) of the MOH but remained a coherent unit. And while this office would continue to oversee project coordination, implementation, and conduct M&E activities, some adjustments were made to accommodate the continued activities from the phase one, and to create new programs. First, EXTENSA was incorporated under the purview of the DGSS. Second, management agreements were signed between DGSS and other directorates of the ministry that oversaw activities related to the PAI and SNIS, to properly coordinate its implementation and supervision responsibilities. Like APL I, the DGSS had five decentralized units to coordinate local activities, but with the second phase additional units were established in the remaining four departments as APL II expanded the scope of subproject activities nationwide. In addition, PAHO would provide technical assistance to support supervision of PAI and EXTENSA and would finance hiring of five epidemiologists to support implementation in the nine departments.
3.13 FPS remained in charge of the execution of health subprojects under component 2 of APL II, but with some differences. Bolivian investment funds (including FPS) were restructured and merged into a Unique Directory of Funds that became responsible for administering the mechanisms for fund allocation and transfer to municipalities. Based on the 2000 National Compensation Policy, municipalities became responsible for inviting project proposals, evaluating them, and awarding contracts; while the directory of funds would preallocate funds to municipalities based on a formula that considered poverty and demographic indicators to be presented and approved by the MOH. Under this arrangement, FPS was responsible for evaluating proposals that were to be approved by the technical Boards of Directors for Departmental Projects based on criteria set by FPS and the Ministry. Municipalities were responsible for putting out tenders and managing the entire process, while FPS would audit them, and DGSS would monitor.
Implementation
3.14 Key dates. The project was approved on June 28, 2001, became effective on February 21, 2002, and closed on June 30, 2008. The midterm review took place in April 2005. Although the project was not restructured, the original closing date was extended three times for an additional two years due to slow initial implementation caused by frequent changes in the ministry and project management, coupled with a period of political instability and social unrest. By the midterm review, it was already foreseen that the project would have a delayed closing date (World Bank 2009). As in APL I, there was no restructuring of project objectives or formal revision of outcome indicators, only changes in definitions of some

29
indicators, and as the project was being extended, targets for the KPIs for the additional years (2006 and 2007) were negotiated and agreed with the authorities.31
3.15 Planned versus actual costs, financing, and disbursements. The PAD estimated the total cost of phase two of the program to be $70.3 million, with 56 percent of the funds allocated to component 1—comprising activities related to strengthening the SBS, PAI, and implementing IMCI/MBP protocols. World Bank financing was expected to cover half of project costs, while government financing incorporating support from other donors was expected to cover the rest.
3.16 Due to the depreciation of the dollar against the special drawing rights (SDR), available credit funds in dollar terms were greater than expected, resulting in an additional $5 million of funding to the project.32 Actual project costs were $47.8 million (68 percent of appraisal estimates), while government contributions were significantly lower than committed, only $7.7 million (less than a third of initial plans due to the fiscal constrains experienced from 2003 to 2005). Despite the additional funds available from the loan, there was an overall reduction in the amount of resources available due to diminished counterpart financing. As a result, component 1 received only 60 percent of originally foreseen funds, while the cost of implementing component 3, although small, doubled at the end of project implementation compared with appraisal estimates. The project disbursed virtually the entire available loan amount of $40 million.
FACTORS AFFECTING IMPLEMENTATION
3.17 Outside the government’s control. The conflict that started in 2003 continued and worsened and President Carlos Mesa resigned in June 2005. The conflict culminated with interim President Eduardo Rodriguez calling for elections in October. This affected project implementation in the initial years, with the added uncertainty resulting from the new Evo Morales government in 2006. Additional tension emerged in 2007 and 2008 when power struggles arose in the Constitutional Assembly as some departments raised autonomy claims. The fiscal constraints experienced in the first half of project period affected implementation, but the situation improved after a new Hydrocarbons Law was passed in 2005, which resulted in a fiscal surplus of 4 percent of GDP in 2006.
3.18 Within the government’s control. The changes in government authorities, especially in the MOH, affected project implementation and motivated changes in the URS, as discussed in para 2.23. In fact, during the implementation of APL II, the project had five different managers, who coordinated the work of more than a thousand personnel. Like APL I, the government did not contribute the committed amount of counterpart funds, although this was greatly affected by the unfavorable fiscal situation during the first half of project implementation. Implementation arrangements foresaw the incorporation of the URS in the DGSS, but during implementation the unit ceased being under DGSS and moved directly under the minister’s office.
3.19 Within the control of DGSS. In addition to staff turnover in DGSS that resulted from broader changes at the government and ministry level, there were shortcomings in the overall management and supervision effort. Insufficient coordination with the Ministry of

30
Finance led to delays in the provision of counterpart funding, even though the country was experiencing a surplus between 2005 and 2007. Monitoring of progress indicators for the project components were not adequately monitored during this period. Despite the incorporation of the former URS in the structure of the DGSS, stakeholders mentioned the remaining reluctance to work together and coordinated with the project staff, which posed difficulties during project implementation.
3.20 Safeguard compliance. No safeguards were triggered under this project. In the preparation phase, PAHO reviewed reported inadequacies in medical waste management at hospitals and found improvements at the primary level, partly because of APL I support in this area. APL II focused on health establishments at the primary and secondary levels and sought to further improvements by developing medical waste guides and manuals for the insurance program to be used for training and supervision activities at health centers.
3.21 Fiduciary compliance. DGSS had appropriate accounting and internal control systems that were in accordance with accounting standards. All assets, liabilities, and financial transactions were adequately recorded, providing sufficient information for project managing and monitoring activities. During implementation, the borrower complied with all covenants established in the loan agreement, including presenting annual financial and external audit reports with no significant delays, while no major observations were reported. No significant deviations from World Bank procurement guidelines and operation manuals were identified during project implementation. However, toward the end of project implementation, there were concerns about FPS and the accountable nature of its work (World Bank 2007, p.14). These concerns were also echoed by some stakeholders.
Achievement of the Objectives
OBJECTIVE 1: INCREASE COVERAGE OF HEALTH SERVICES
3.22 The achievement of objective 1 of APL II is rated modest.
3.23 Outputs and intermediate outcomes. APL II supported the PAI through the design of methodologies for evaluating the national program; the development of annual and five-year action plans; and the monitoring of vaccination coverage rates. The project designed and rolled out the PAI’s logistical software, but most localities were not using it and information was being processed manually.
3.24 The project also supported the administration of the SBS (later replaced by the SUMI) and the supervision of its quality. SUMI replaced SBS in 2002, continuing with its focus on maternal and child coverage and expanding the number of services covered.33 Through APL II, new management schemes and payment systems for the SUMI were designed and implemented. Outputs in this area include sporadic financial audits of the SUMI, when this was expected to be done regularly, and partial execution of SUMI funds. An average of 85 to 90 percent of insurance funds were executed between 2003 and 2006, even though the project’s target was the full execution of funds in 70 percent of municipalities.

31
3.25 The project supported the design and implementation of the EXTENSA program that provided human resources to reach underserved populations (see para 3.6). A targeting mechanism was designed to identify the localities that the health brigades would serve based on poverty levels and epidemiological needs. During 2003–2007, 124 mobile brigades were deployed, 48 percent of which were entirely financed by the World Bank while 52 percent were cofinanced with the SEDES and municipalities. But the number of brigades deployed fell short of the 150 teams target that the project set as a one of the triggers for APL III.34 However, results were important. EXTENSA’s health brigades covered 200 municipalities each year of implementation, reaching 340,000 people (mostly indigenous), and providing 800,000 maternal and child interventions annually.
3.26 Besides addressing the geographical and economic barriers that prevent targeted communities from accessing health care, EXTENSA also dealt with the quality of health care provision and its effects on the population, considering specific traditional and cultural practices, and in close coordination with local health assistants representing the community. Communities in the department of Beni had positive views of EXTENSA and the quality of its services relative to the care received in health centers (Aizenberg 2011). Stakeholders interviewed also considered the program successful, but the program did not continue.35
3.27 Outcomes. The second phase of the APL continued its support to expanding coverage. Various activities, including the rollout of the EXTENSA program, improvements to the management of the SBS, and the implementation of a second generation PAI, aimed at reaching excluded groups and at expanding the breadth of services provided.
3.28 Progress with immunization coverage stalled during most of the second phase. After reaching a peak of 92 percent in 2001, coverage declined with APL II, reaching a yearly average of 83 percent while missing almost all the annual goals. The target of 90 percent coverage by 2007 was not met, as the pentavalent immunization coverage reached only 82 percent in that year.36 At the same time, financing for vaccines remained below annual goals until the end of APL II in 2007, when government financing reached $8.4 million, exceeding the target of $6.5 million.
3.29 Coverage of births attended by health personnel continued to improve with APL II but fell short of targets. While coverage at the end of APL II fell slightly under the target (64 percent in 2007 compared with a target of 66 percent), current figures largely exceed the targets set for APL I and II. Still, some inequalities remain.37
3.30 The provision of child health care services addressing main causes of child mortality also improved. The number of pneumonia cases of children under five treated in the health center increased over the implementation period, achieving the 2007 APL II target with 156,975 cases treated. Similarly, UDAPE reports that the percentage of children under one year old who have been treated by pneumonia has increased from 20 percent in 2002—the end of APL I—to 29 percent in 2007, but also shows a progressive decline and, as of 2016, 14 percent of children under one have been treated for pneumonia. Despite the number of cases treated as of 2016 is much lower, there is evidence that prevalence has declined.

32
3.31 Unlike APL I, APL II sought to track the coverage of its nutrition programs, recognizing the importance of preventive services and that nutrition is associated with 35 percent of deaths in children under five (World Bank 2001b, WHO/UNICEF 2013). Thus, APL II introduced the indicator “number of children under five with a third dose of iron.” Under the project, iron supplementation coverage has increased from 8 percent to 46 percent in 2007 (against a target of 41 percent). Iron supplement coverage has also been sustained: SNIS data from 2016 show that 58 percent of children under five were given a third iron dose. Iron supplementation for children is extremely important for attaining better health outcomes, as well as educational outcomes. Iron deficiency is the main cause of anemia, which is correlated with a compromised cognitive development, delay in physical growth, and high morbidity in children under two years old. The latest data available estimates that 53 percent of Bolivian children between 6 and 59 months suffers some degree of anemia. This is a decline from 61 percent in 2008, but it is still far above the regional average of about 19 percent for that same age group (INE 2017).
OBJECTIVE 2: INCREASE QUALITY OF HEALTH SERVICES
3.32 Achievement of objective 2 is rated substantial.
3.33 Outputs and intermediate outcomes. The project supported supervision efforts and quality improvements of SBS activities. Protocols for SBS/SUMI interventions were published and distributed; 94 hospitals were evaluated, of which 34 were accredited; and 1,000 health centers were evaluated, of which 310 were accredited. Norms for evaluating and certifying health service providers were published. No information was reported on the percentage of districts and municipalities that carried out a CAI each semester; the number of Pregnant Women’s Bill of Rights signed; or the number of defense advocates trained.
3.34 APL II continued to strengthen the PAI with financing for improving administrative processes and monitoring mechanisms, it also continued investment in training and in cold chain rooms. The expected improvements in the quality of immunization services were observed at the end of project implementation. Between 2003 and 2007, an average of 90 percent of suspect measles cases had an adequate blood sample. The project expected to monitor Acute Flaccid Paralysis rates for children to identify possible polio cases and to certify its eradication, but no information on those rates by locality was available.38 Waste management at the primary level also advanced: norms were updated, and staff were trained to apply them. Six transfer stations for hospital waste were constructed and more than 60 percent of community agents were trained in this area. Supervision of practices related to pathological residues and nutrition activities were carried out, although no detailed information of the findings is available.
3.35 APL II supported health subprojects investing in equipment and infrastructure for the provision of services in underserved areas. Subprojects financed the rehabilitation and refurbishing of primary and secondary level health facilities, as well as the purchase of equipment for health brigades. About 376 projects were executed in 161 municipalities for a total investment of $10.1 million. To reach indigenous women, efforts to adapt health facilities to cultural issues and training of personnel was done in 200 rural centers. Over 1,300 pharmacies were established and managed by trained members of localities. With APL

33
II, the allocation mechanism of funds for subprojects (MAR II) was based on a vulnerability index. This mechanism was appropriate because it continued focusing on the areas where need was greatest. By the end of APL II, the most vulnerable municipalities received 45 percent of the funds, whereas those least vulnerable received only 15 percent. The project envisioned focusing efforts in the EXTENSA municipalities and expected that at least 40 percent of those would present subproject proposals to FPS. This target was exceeded as 45 percent of EXTENSA municipalities presented subproject proposals during 2003 and 2007.
3.36 Outcomes. Completeness of prenatal care continued to increase over time. The proportion of pregnant women receiving four prenatal visits reached 53 percent in 2007, close to the target of 57 percent; but important gains were attained thereafter with current rates around 76 percent in 2016.39 This improvement is confirmed by numbers coming from the DHS, although increases are larger in urban areas.40
3.37 Neonatal mortality exhibited a mild decline. Early neonatal mortality in the 15 largest maternities fluctuated slightly during the implementation of APL II, but at the end of APL II in 2007, there were 11 deaths during the first 7 days of life per 1,000 infants born, meeting the target set. IEG estimates using data from the SNIS for selected hospitals shows an average early neonatal mortality rate of 10 per 1,000 live births in 2016, suggesting mild decreases during the nearly two decades.41
OBJECTIVE 3: STRENGTHEN LOCAL CAPACITY TO RESPOND TO HEALTH NEEDS
3.38 Achievement of objective 3 is rated substantial.
3.39 Outputs and intermediate outcomes. The World Bank contributed to this objective in many ways.
3.40 The project supported the PAI through the design of methodologies for evaluating the national program; the development of annual and five-year action plans; and the monitoring of vaccination coverage rates. The project also supported the administration of the SUMI and the supervision of its quality. New management schemes and payment systems for the SUMI were designed and implemented. As discussed in para 3.36, APL II continued its support to the implementation of health subprojects that channeled investments through municipalities for the provision of services in underserved areas. In addition, all the project interventions involved training and capacity building of public service personnel in a variety of areas, including the application of protocols, the use of various software, as well as management skills.
3.41 The World Bank continued support to the implementation of performance agreements and sought to strengthen the capacity to manage for results at various levels of government. It also continued semiannual monitoring of performance agreements, while dedicating staff to support SEDES in the gathering of information and in their coordination of activities in their jurisdictions. At the end of APL II, performance agreements were signed by seven out of nine departments, and by 55 percent of districts included in EXTENSA, falling short of the 100 percent target. Only 50 percent of SEDES showed a compliance rate higher than 80 percent during the period 2002–2007. A combination of factors may have led to this low compliance,

34
such as the inclusion of multiple indicators, the method for calculating targets, limitations in regular monitoring, and certainly incentives at the department and district levels.42
3.42 Regarding support to health information systems, the project financed the 2003 and 2008 DHSs. While the ICR reports that the SNIS improved its gathering and timely processing of data, it does not provide information on the introduction of external quality controls of the information planned at appraisal, such as cluster surveys, interviews with community leaders, and certification of in-hospital mortality statistics by user committees.
3.43 Outcomes. The second phase of the program continued the support to strengthen local capacity in Bolivia at different levels. As discussed in paras 2.51 to 2.52, all the initiatives and programs related to project components had an element of strengthening government capacity. Support included providing information for adequate decision making; supporting health financing; training human resources; and improving the management of financial systems within the MOH, regional governments, and municipalities. The multidimensional nature of this objective contrasts with the lack of an outcome indicator. By the second phase the project could have attempted to include specific outcome measures to track progress in the achievement of this objective.
3.44 APL II successfully continued its support to health insurance management. While APL I supported various aspects of the design and management of the SBS, APL II supported the expansion of coverage of the SBS through further improvement of payment mechanisms, monitoring, and supervision activities. With the EXTENSA program, the project used best practices to design a mechanism to deploy human resources to serve remote areas, in close coordination with the municipalities and communities involved.
3.45 The World Bank has accompanied and adapted to Bolivia’s decentralization process. The payment mechanisms designed for SBS/SUMI and the investment in subprojects created rules and mainstreamed practices to channel resources to municipalities. By devising financing mechanisms, making resources available to municipalities, and providing technical assistance throughout, the project effectively supported decentralization in Bolivia.
3.46 Regarding health information systems, APL II also focused on the need for estimations of main health outcomes, as opposed to service provision data produced by the SNIS, and thus supported the implementation of both the 2003 and 2008 DHS.43 This is an important contribution to government efforts to better assess the needs of the population and identify gaps in service provision.
3.47 Similarly, APL II continued its support for signing and supervising program agreements with departmental governments and prioritized municipalities. While performance agreements are not yet being used, the culture of results-based management has taken root. In this regard, stakeholders at the department level indicate the continuation of a variation of the performance agreements and the realization of periodical CAI.
OBJECTIVE 4: REDUCE INFANT MORTALITY
3.48 Achievement of objective 4 is rated substantial.

35
3.49 Outcomes. Infant mortality continued its decline during the implementation of this phase. During APL II, the number of infant deaths per 1,000 live births declined from 54 in 2003 to about 50 in 2008. The World Bank contribution was important to this achievement, as various activities supported government capacity to administer, manage, and supervise important programs and elements of the health system, including the SBS, EXTENSA, PAI, and health information systems; while providing targeted support to improve structural quality through targeted investments to improve the service network. This contributed to expanded coverage and improved quality of health provision, while reducing the economic barriers to access for the Bolivian population.
Efficiency
3.50 Efficiency is rated modest.
3.51 The implementation of APL II was economically justified ex ante. The economic analysis performed at appraisal estimated an internal rate of return of 10 percent, and a net present value of $85,000. The analysis assumed a target population of 25 percent of the total population in the country, while the extension of coverage is expected to happen gradually, with 100 percent coverage in 2005. Project benefits included averted child deaths due to diarrhea and pneumonia complications, and maternal deaths prevented using mortality models for each cause of death. Project costs for all components were used for the analysis. Monte Carlo simulations were used to compute the internal rate of return according to varying rates of healthcare coverage. As was the case with APL I, the ICR did not conduct a cost benefit analysis citing insufficient information for that purpose.
3.52 Implementation efficiency lagged during the initial years, as project activities were delayed because of social unrest in 2003 and 2005, with accompanying changes in administration, ministers, and project coordinators. In the face of reduced counterpart funds, the World Bank contributed to financing of vaccines, beyond planned costs at appraisal. URS administrative support, supervision, and project management activities under component 3 rose to $7 million by project closing, amounting to more than twice the appraisal estimates. FPS showed slow execution of health subprojects leading to project delays.
Ratings
OUTCOME
3.53 The overall outcome is rated moderately satisfactory. As for APL I, the relevance of objectives is rated substantial. The substantial rating of the relevance of design is justified by the logical thread of the results chain and because the project addressed some of the limitations with performance indicators. Efficacy in the achievement of objectives was substantial for all of them, except for the objective of increasing coverage of health care services because core indicators fell below targets. Efficiency is rated modest because although the implementation of APL II was economically justified ex ante, project implementation was delayed during initial years, and there was slow execution of health subprojects by the FPS.

36
RISK TO DEVELOPMENT OUTCOME
3.54 Risk to development outcome is rated moderate. As for the first phase project, financial, government commitment, and ownership risks are assessed as low (see paras 2.66 to 2.68). Meanwhile, institutional and political risks are still assessed as moderate. The continuation of the EXTENSA program, implemented during APL II, contributes to the institutional risks discussed in the previous chapter. While the government continues to support the expansion of health care coverage through the MI SALUD program, with a different focus centered on the Intercultural, Family and Community Health (Salud Familiar Comunitaria Intercultural; SAFCI) model, stakeholders were concerned about its direct reporting to the ministry, without clear coordination with health centers or accountability to the SEDES.
BANK PERFORMANCE
3.55 World Bank performance is rated moderately satisfactory.
3.56 Quality at entry is rated moderately satisfactory. The second phase built on lessons learned from the first one, which showed that cultural barriers need to be addressed, and aimed to reach pockets of underserved populations in a more holistic manner through the implementation of the EXTENSA program. Similarly, the World Bank considered successful pilots related to insurance extension interventions implemented in Brazil, Mexico, and Peru and incorporated lessons from those experience into project design, including the use of community agents, and recruitment of added health workers using methods outside of civil service rules. Strong project design and proved results of key reforms enabled main programs (like the insurance system and the PAI) to continue receiving support, even during a period of political transition. In addition, the World Bank adjusted the KPIs into the second phase, although it did not revise the indicators related to pneumonia treatment and immunization coverage by municipality. The objective of strengthening local capacity did not have an outcome measure. Greater effort should have been placed in effectively integrating the URS into the ministry, as tensions and reluctance were detected during phase one.
3.57 Quality of supervision is rated moderately satisfactory. World Bank support during implementation showed great flexibility in adapting to political changes. The involvement of departmental and municipal authorities in various meetings continued during APL II, which helped with communication and understanding of issues, in a context where tensions existed between departments at the central level. Stakeholders commended the World Bank for this role, which ended with program closure. The project had five task team leaders during the seven years of project implementation, perhaps causing some discontinuity in monitoring efforts. While emphasis was placed on monitoring KPIs, the World Bank did not follow up on the evolution of indicators monitoring different project outputs. Monitoring and reporting of intermediate outcome indicators was not afforded sufficient effort, as the URS was unable to gather information related to some indicators for which different areas of the ministry were responsible.

37
BORROWER PERFORMANCE
3.58 Borrower performance is rated moderately satisfactory.
3.59 Overall government performance is rated moderately unsatisfactory. As stated in para 3.15, political instability affected the project, during the first half of project implementation. As was the case with APL I, counterpart financing was insufficient, which delayed project activities. Similarly, uncertainty regarding the position of the incoming government regarding key project reforms, moved the World Bank to adapt to new circumstances, while facing an environment of distrust. The government showed interest in continuing EXTENSA adding a community involvement component within the framework of the SAFCI model. However, the EXTENSA program was later discontinued. Changes in URS authorities toward the end of the project complicated the completion of closing activities, including the production of two important evaluations. Integration of URS into the ministry was resisted, and while additional provisions could have been made for this purpose, the unit was moved directly under the minister’s office, effectively delaying its integration. Tensions between URS and ministry staff due to salary differences were exacerbated by the direct relationship of the URS with the highest authorities at the ministry.
3.60 Implementing agency performance is rated moderately satisfactory. Performance of the URS was affected by changes in its main authorities, resulting from political interference around 2003 and 2004. The instability affected project implementation, and coordination with the Ministry of Finance in relation to securing counterpart funding from the central government. URS performance improved thereafter, continuing their monitoring and supervision efforts. Some shortcomings remained from APL I, in relation to the limited attention to supervision of output indicators. Meanwhile, as referred to in para 2.78, FPS experienced a series of internal changes, while being affected by new incentives established under the National Compensation Law. As a result, the agency showed slow execution of health subprojects while concerns about its commitment to project objectives, and its suitability for implementing the subprojects component was raised by several stakeholders.
MONITORING AND EVALUATION
3.61 The quality of M&E is rated modest.
3.62 M&E design. Project design continued to follow the eight KPIs used in phase one (Table 2.1), with updated annual goals. APL II included 25 output indicators in its results framework. Changes were made to some indicators and their definitions, including replacement of the indicator for treatment of diarrhea with one for iron supplementation services, a change in the denominator of the quality of prenatal care indicator using estimated number of births, focusing of the neonatal hospital mortality in 15 selected hospitals. However, after the experience with the first phase, and even though actions were taken to improve most of the indicators, the project did not address issues with the interpretation of the pneumonia cases treated and the use of immunization coverage by municipality. Regarding M&E responsibilities, the project implementation unit at the DGSS retained responsibility for monitoring and reporting on project results, including performance agreements. Dedicated project staff were assigned to each department to support monitoring of activities and tracking

38
of results. The DGSS, through the project coordination unit, closely monitored the activities of the health teams deployed through EXTENSA, and in 2004 designed and implemented a clear methodology and a software for this purpose (URS 2008).
3.63 M&E implementation. Tending to information needs, the project supplemented existing information from SNIS with surveys, including the 2003 and 2008 DHS, which provided important information on health outcomes associated with the project, and the National Nutrition Survey, which provided a baseline for monitoring and future evaluation of the Zero Malnutrition Program. During implementation, monitoring of some output indicators was assigned to departments of the ministry and the URS did not receive the information, specifically in relation to performance agreements, and departmental and municipal CAI (URS 2008). As a result, these were not regularly monitored and were not included in regular progress reports or assessed during supervision missions. In contrast, great attention was given to monitoring performance agreements, that besides the incentives for their compliance, relied mostly on SNIS data that also had shortcomings in timeliness and quality. As part of the monitoring activities, the project designed and rolled out software to manage information from EXTENSA in all the departments. The software allowed for consolidation of various aspects of the work of the health brigades, including the production of services, geographic and population scope, and other financial and managerial information. The consolidation of information through this software suffered some delays, however, at project closing, the system had updated information for all the departments.
3.64 M&E use. The results orientation of the project continued with APL II, mainly through performance agreements and achievement of project targets. However, as progress at the component level was not monitored with the same level of effort, it is not clear how that informed adjustments in project implementation. As was the case with APL I, the project continued to identify shortcomings in the SNIS and expected to support improvements through the next phase of the APL, influencing its design. The EXTENSA system, implemented with project support, produced a series of reports and indicators that were used to assess the performance of health brigades and better manage their operations.
4. Expanding Access to Reduce Health Inequities (APL III)
Objectives, Design, and Relevance
PROJECT DEVELOPMENT OBJECTIVES
The project was the third and final operation of the APL series approved on January 24, 2008, with an IDA credit of $18.5 million. Unlike the previous two phases, infant and child mortality rates were not part of the project objectives. Instead, as stated in the Financing Agreement and the PAD, the project aimed to
(i) reduce occurrence of critical risk factors affecting maternal and infant health in the target areas so that current gaps between regions are reduced;
(ii) reduce chronic malnutrition among children under 2 years of age in the target areas;

39
(iii) increase health insurance coverage in the target areas; and (iv) upgrade the SNIS so that it will be integrated with Bolivia’s new health insurance
program.
The project also narrowed its focus to more vulnerable locations for some of its activities while keeping others at the national level. Accordingly, performance indicators were defined to measure progress in project areas relative to the rest of the country, and were aimed at measuring access (utilization), coverage, quality, equity, behavioral changes, and health outputs and outcomes. The project included six new KPIs and 12 intermediate outcome indicators. While the PDOs did not change during implementation, the results framework was modified during two level II restructurings by changing two outcome indicator targets and dropping and replacing KPIs.44
RELEVANCE OF OBJECTIVES
The relevance of objectives is rated substantial based on alignment with country conditions, government and World Bank strategies, and the framing of the objectives and their ambitiousness.
The project objectives were relevant to the country context, government strategies, and World Bank strategies during the entire project life and currently. As discussed in the previous sections, maternal, infant and child mortality, malnutrition, and access to appropriate health care services were and continue to be key development challenges. Bolivia is still at the bottom of regional rankings on maternal and child health outcomes despite recent progress in human development indicators.45
Overall, the project objectives were grounded in the government’s commitment to improve the health of the Bolivian population. They are aligned with at least five out of nine objectives of the Strategic Institutional Plan of the MOH 2016–2020 (improve health status of population; advance on universal health coverage; strengthen stewardship role of MOH; improve nutritional status of population, improve effectiveness, efficiency and transparency in public health policies) (MOH 2017). Project objectives are also consistent with the goals of two national programs: Zero Malnutrition and the Bono Juana Azurduy, which provides cash transfers conditional on the use of health services.
As APL III aimed at consolidating achievements of the previous two phases of the APL program, its objectives continue to be relevant to the World Bank’s country and health sector strategies. Objective 3 of expanding health insurance coverage, in particular, responds to the 2007 health sector strategic objective of reducing and preventing poverty due to illness by improving financial protection.
Project objectives were defined at various levels of the results chain. Objectives 1 and 2 reflect health outcomes and impacts, so their alignment with APL’s long-term goals of improving maternal and child health is straightforward.46 Objectives 3 and 4, on the other hand, represent health outputs, so their link with program goals is indirect. That is, the expansion of health insurance would boost the use of health services, which in turn would reduce risk factors related to maternal and child health, including malnutrition. The

40
improvement of health information systems, in turn, would enable health diagnostics and monitoring to improve decision making of policies toward better health outcomes.
The apparent exclusion of infant and child mortality impacts from project objectives is consistent with recent trends in health sector projects support by the World Bank. The shift in objectives from higher-level impacts to output and outcome level is consistent with a more general trend observed in IEG’s 2017 Health Evaluation. Limitations of mortality rate indicators and relatively lengthy periods of time needed to modify such health impacts have been used as a rationale for the shift toward lower-level outcomes (at least in stand-alone 5-year projects).47 The project remained ambitious enough as it included other short-term health outcomes such as malnutrition measures.
The framing of the objectives has some shortcomings. First, the project does not explain what risk factors affecting maternal and child health were expected to be reduced in objective 1. According to WHO, some of these risk factors are high blood pressure, diabetes, other pregnancy-related complications, low birth weight, and malnutrition, which could be detected early through reproductive and child health services such as prenatal care, skilled birth attendance, and child growth control. Since such health services were in fact selected as KPIs, objective 1 could have been framed in a more straightforward way, like increasing coverage of maternal and child care services. But reducing the occurrence of risk factors, not simply increasing coverage, is also about ensuring the provision of health services are of sufficient quality. Second, the project used conjunction words like “so” to join two clauses in a sentence (see, for example, objectives 1 and 4). This would tend to increase the risk of controversy in assessing the achievement of objectives, for which it would depend on the accomplishment of both clauses. The project could have framed its objectives separately, avoiding interlinkages among them.
PROJECT DESIGN
APL III entailed a great deal of continuity with the Health Sector Reform of the previous phases. That is, a focus on results and accountability, expansion of the public health insurance, improvements in health care supply and referral systems, further investments in SNIS, and similar activities. However, it also had some distinctive features. Contrasting with previous phases, the project’s geographic scope focused on underserved municipalities (82 municipalities and 6 peri-urban areas) selected based on risk of food insecurity, number of institutional births, access to drinking water, literacy levels, connection to sewer systems, school attendance rates, and availability of electric power. The third phase also includes equity as an explicit objective.
4.11 The project was designed around four components involving supply, demand, and systemwide interventions (). Activities under component 2 were designed in coordination with two national efforts aimed at stimulating nutrition and demand for health services in the same project areas. One effort was the Zero Malnutrition Program supported by the World Food Program (WFP), UNICEF, PAHO, and others. The program, launched in 2007, was to reduce causes of malnutrition for young children, and pregnant and lactating women through a multisectoral approach. The program strategies included strengthening community participation, reducing micronutrients deficiency, strengthening the IMCI, and strengthening

41
nutritional surveillance (Kopp Valdivia and others 2015). The APL program has been supporting community participation, the implementation of the IMCI, and the strengthening of the SNIS to improve nutritional surveillance, thus evidencing the interlinkage between the APL series and the Zero Malnutrition Program. The second effort was a World Bank Investing in Children and Youth project at a stage of preparation which supported conditional cash transfers to promote the use of basic maternal and child health services with the goal of reducing chronic malnutrition, and infant and maternal mortality.
Box 4.1. Expanding Access to Reduce Health Inequities (APL III) Components
Component 1. Stewardship Role of Health Authorities – Essential Functions in Public Health (IDA $4 million at appraisal; $1.4 million actual)
This component aimed to strengthen capacity of national, regional, and local health authorities to perform Essential Functions in Public Health, which range from surveillance and disease control to social participation, regulation, and M&E. It was divided into three subcomponents:
• Strengthening the National Health Information System (SNIS): this subcomponent was to finance equipment, technical assistance, software tools, training, and communication services to support a structural change in the way data is captured.
• Regulation, results-based management, and culture of accountability: this subcomponent was to support strengthening the capacity of the MOH and departmental and local health authorities.
• Development and implementation of a Proyecto Nacional de Calidad de Salud (National Program of Quality): this subcomponent was to support licensing, certification, and monitoring of health facilities, including hospitals, clinical labs, and blood banks.
Component 2. Family, Community and Intercultural Health (IDA $9.9 million at appraisal; $8.2 million actual)
This component aimed to improve access to maternal and infant health services in the project’s target areas. Activities were to support the development of Intercultural Maternal and Infant Health Referral Networks, complementing the existing EXTENSA health program. These networks were to promote demand for maternal and infant health care by focusing on three goals: increasing the number of safe institutional childbirths; increasing the number of referrals of obstetric emergencies directly from the community; and providing access to a referral system for children with acute respiratory and digestive diseases. It was divided into two subcomponents:
• Development and Strengthening of Intercultural Maternal and Infant Health Referral Network.
• Strengthening of Local Management and Community Participation. Component 3. Health Insurance Program (IDA $3.2 million at appraisal; $0.56 million actual)
This component aimed at supporting the implementation of a new Universal Health Insurance (Seguro Universal en Salud; SU SALUD), which aimed at expanding coverage from SUMI through three subcomponents:
• Strengthening the SU SALUD enrollment system: support the rollout of a national record system for the enrollment of families and individuals. This system will permit the classification of members and coverage according to geographical areas, urban/rural areas,

42
levels of poverty and other demographic characteristics. Under APL 11, SU SALUD’s enrollment system was designed, developed, and tested in two pilot programs (one in a rural area, and other in an urban area). These pilots allowed a dry-run test of the system, and because of issues identified during this process, minor adjustments were made. Currently the software is ready to be implemented in the entire country.
• Development and Strengthening of M&E Management Capacity in the National Unit for Technical and Financed Management (Unidades de Gestión Técnica Y Financiera Nacional) and Departmental units. Strengthen capacity to plan, manage, and carry out M&E of SU SALUD at the national, departmental and municipal levels:
• Development of a M&E system for SU SALUD.
Component 4. Project Administration (IDA $0.9 million at appraisal; $0.6 million actual)
The fourth component was to support project administration with equipment, technical assistance, training, and operating costs to finance the administration of the project, as well as financial and procurement audits. The project would be executed through MOH’s existing staff and structure, eliminating the project implementation unit from earlier phases. The objective of this component would be to support the project’s coordination and administration within the MOH. Source: World Bank 1999b.
Initially, APL III and these two programs would join forces in the 37 most vulnerable locations, and then scale up to serve the remaining prioritized municipalities. But the government decided to quickly launch the conditional cash transfer program at the national level on Mother’s Day 2009, naming it Bono Juana Azurduy. At that time, APL III was not advanced enough in strengthening the supply side in selected municipalities. Still, APL III’s project areas received support from these complementary national programs, so attributing the achievement of outcomes solely to the World Bank is not plausible.
In the 2012 restructuring, the areas of project intervention were reduced to 46 prioritized municipalities based on poverty indicators and deficient access to health services. Most of the activities under subcomponents 1 and 2 were eliminated. Likewise, subcomponent 2.2 was dropped. Pending activities related to the unified health insurance scheme were dropped, and instead the project supported the Cumbre de Salud and the implementation of the Family Health Record (Carpeta Familiar), an information module used at primary care health facilities. In July 2014, a second restructuring added the renovation and construction of the Onco-Hematologic Unit of La Paz Children’s Hospital.48
RELEVANCE OF DESIGN
The relevance of design is rated substantial. Its assessment considers the logic of the results chain, the appropriateness of the lending instrument, and the adequacy of M&E design.
The project’s implicit results chain originally envisaged activities that were logically linked to the expected outputs and outcomes. The design of the project was ambitious, encompassing supply, demand, and systemwide interventions targeted at various levels—national government, local governments, health facilities, and ultimately

43
beneficiaries. The project design in support of the first objective was well conceived, comprising supply-side interventions to improve access to and quality of health care services. The development of Intercultural Maternal and Infant Health Referral Networks jointly with an expansion of the EXTENSA program would contribute to improve access, although EXTENSA did not continued due to the project’s reduction of scope. The project invested in health facilities infrastructure and equipment, quality assurance including accreditation and management tools, and human resource capacity in referral systems. In addition to quality improvements, demand would increase through outreach to local populations, community participation, and public awareness campaigns. The results chain for objective 2 derives from all the efforts toward the improvement of access to quality maternal and child care services in coordination with the Zero Malnutrition Program and the conditional cash transfer Bono Juana Azurduy. Objectives 3 and 4 are interlinked with the first two. The project’s support for the implementation of the health insurance program (strengthening of enrollment system, training for implementation, enrollment campaigns, development for M&E system) would help in expanding health insurance coverage (objective 3), which is expected to boost use of health services and reduce risk factors related to maternal and child health, including malnutrition. Finally, several project activities consistently led to the upgrade of the SNIS (objective 4) including the design and development of information modules, update of human resources in health data, support for health information analysis committee, among others. The improvement of health information systems would enable health diagnostics and monitoring to improve decision making of policies toward better health outcomes.
After the reduction of the project’s scope in the 2012 restructuring, the World Bank’s support to supply-side interventions relied heavily on “bricks and mortar” and structural quality investments. This was a response to the strong government appetite for infrastructure. The FPS executed more than $6.9 million, representing about 70 percent of the loan (World Bank 2016, p. 50).
The World Bank’s flexibility to respond to government requests came at the cost of lessening the causal relationship between project activities and objectives. Community participation, public campaigns, and the creation of new brigades in rural networks were canceled, despite success of the EXTENSA during APL II. Mobile brigades were the indigenous peoples’ preferred way to receive health care because of the cultural closeness with the brigades’ health workers according to a social assessment (World Bank 2007, Annex 10). The use of mobile brigades regained focus later in 2013 with the MI SALUD program.49
The later inclusion of the renovation and construction of the Onco-Hematologic Unit in the 2014 restructuring was aligned with the APL’s goal of reducing child mortality, since it would contribute to the survival of children with cancer. Yet cancer is not the main cause of children’s death according to global burden of disease data. Additionally, even with improved infrastructure, the capacity of performing bone marrow transplants, one of the main drivers of the investment, continues to be a challenge in Bolivia. While structural quality improvements in the Onco-Hematologic Unit were needed, they were not a priority at the beginning of APL III. The financing of this activity is justified by the World Bank’s flexibility and adaptation to respond to government’s requests and its own commitment to invest in children, rather than strategic alignment with project objectives. The engagement and commitment of the World Bank with children with cancer was such that it supported a

44
documentary to raise awareness of the economic and emotional struggle experienced by children and their families during oncologic treatment. The former World Bank Country Manager was the Artistic Supervisor of the documentary called “Corazon de Dragon.”50
The appropriateness of the lending instrument was high. As stated in chapter 2, the APL was appropriate given the long-term development challenges addressed by the project. Long-term program objectives, however, were not strictly the same across phases and project documents. While infant mortality has always been a program goal, sometimes under-five mortality and maternal mortality were also included. This variability does not seem to be a deliberate modification of the long-term program goals, but rather a misreporting issue. According to Operations Policy and Country Services (2017), the ex ante definition of triggers enabling the continuation of the phases has limited the flexibility of APLs, contributing to their discontinued use when triggers became inappropriate. In this case, the APL completed its three planned phases. The preparation of the third phase was contingent on attainment of six triggers, five of which were fully achieved. The trigger on the achievement of eight performance benchmarks was partially achieved because some indicators were ill-defined or affected by factors beyond the control of the project.51 The partial progress in these indicators justified moving ahead with APL III. As a lesson learned from previous phases, APL III defined a different set of KPIs.
Implementation arrangements. In a substantial departure from previous APL phases, a project coordination unit was established and integrated into the MOH for both technical and administrative tasks. The purpose was to improve coordination with other programs, ensure institutional memory, and enhance sustainability of results by absorbing implementation unit staff into the MOH as permanent employees. However, this new arrangement initially created bottlenecks to implementation because of delays in recruiting key personnel to lead and coordinate the implementation of project activities. Stakeholders indicated interviews that the integration of the unit into the MOH had positive results, and that some project staff were eventually absorbed, although it took some time even after project closing. Like in the previous APL phases, the FPS remained responsible for implementing and overseeing the execution of infrastructure subprojects under component 2.
Implementation
Key dates and project costs. APL III was approved on January 24, 2008, became effective on June 19, 2009, and closed on December 31, 2015. The original total costs were $26.2 million, from which $18.5 million were to be financed through an IDA credit, and $7.7 million through the borrower’s contribution.
The project was restructured four times due to a very slow implementation progress during the first three years, which turned activities unlikely to be finished on time. The first project restructuring was in December 2012 when only $2.81 million (15 percent of loan) had been disbursed. Since it was very unlikely the project could be fully implemented in the next 24 months before closing, the restructuring reduced the scope of project components and the credit amount by half. Modifications of the result framework and reallocation of funds among categories followed. The second restructuring, in January 2014, extended the project closing date for six months. The third restructuring was in July 2014

45
when $6.42 million of the loan were disbursed. The results framework was also revised, extended the closing data by 15 more months, and most importantly, adding the renovation and construction of the Onco-Hematologic Unit of La Paz Children’s Hospital. Thus, a greater proportion of loan proceeds were to support infrastructure investments, increasing from about 25 percent ($4.6 million) to about 70 percent ($6.8 million). The fourth restructuring, in August 2015, extended the closing date by two more months to allow for the completion of civil works at the Onco-Hematologic Unit. The total IDA disbursement was about $10.28 million.
Factors affecting implementation. Most factors having an adverse effect on project implementation were within the government’s control. There were delays in the formation of the implementation team that negatively affected project execution, resulting in the need for extension of project closing dates and partially contributing to high project supervision costs. Frequent changes in MOH leadership within the Morales administration may likely have contributed to this. After project approval there were seven different ministers of health. In addition, political opposition and lack of initial consensus on creating a new health insurance program for youth, and later, the attempt to unify the insurance system, also contributed to project delays and the restructuring of project activities.
4.24 Factors outside of government control also affected efficient project implementation. Limited availability of construction firms delayed procurement and planned civil works executed by the FPS. Despite of delays, the FPS managed to execute the increased proportion of project funds reallocated to infrastructure investments from the other components after the two restructurings.
Safeguard compliance. The project followed the safeguards triggered. The project was classified as Environmental Category B (partial environmental assessment), triggering the environmental assessment policy (OP/BP 4.01) due to the impacts of civil works and the likely increase in health medical waste. This assessment recommended close follow-up of physical rehabilitation impacts by an internal unit within the MOH. During the third restructuring, when the project added the renovation and construction of the Onco-Hematologic Unit, an additional environmental assessment was conducted and approved. Its architectural design and engineering plans were appropriate and in compliance with the safeguard policies. There were no land issues because the renovation took place within the hospital complex. On the other hand, the project triggered the Indigenous Peoples safeguard policy (OP/BP 4.10) given its focus on intercultural health for the maternal and infant population, and the fact that most beneficiaries self-identified as indigenous. The project was considered an Indigenous Project, and hence no Indigenous People’s Plan was necessary.
Fiduciary compliance. Financial management arrangements were considered moderately satisfactory throughout the project’s life. Despite low project execution during the first three years, no major shortcomings were identified regarding financial management in either of the two implementing agencies. The FPS executing subprojects presented some financial audits and documentation on financial transactions with some delay. Procurement activities were rated satisfactory over the life of the project. No serious procurement issues were identified by review missions, procurement audits, and IEG mission. The FPS delays in

46
contracting civil works are explained by limited supply of construction firms available to pursue the job.
Achievement of the Objectives
OBJECTIVE 1: REDUCE THE OCCURRENCE OF CRITICAL RISK FACTORS AFFECTING MATERNAL AND INFANT HEALTH IN THE TARGETED AREAS SO THAT CURRENT GAPS BETWEEN REGIONS ARE REDUCED
4.27 Achievement of objective 1 is rated substantial.
4.28 Outputs and intermediate outcomes. Relevant supply side and health systemwide activities were supported by the project to improve the provision of health care services.
4.29 The project helped the government improve quality assurance processes. APL III provided technical assistance to update the accreditation guidelines for primary care health facilities. By the end of the project, about 249 health facilities had initiated a self-evaluation process based on norms, and 22 health facilities had achieved accreditation. The project was also instrumental in building capacity in accordance to the National Program of Quality (Proyecto Nacional de Calidad de Salud; PRONACS). As a result of self-evaluation processes, the project supported action plans and health staff trainings in management of clinical history, quality management methods and medical audits, biosafety norms, and patients’ rights.
4.30 APL III, in coordination with the MOH, supported diagnosis of the internal capacity of health service networks, and the update of the MOH’s norms for characterizing primary care health facilities and hospitals, as well as reference and counterreference procedures. The project contributed to the creation of a georeferenced database of health facilities and networks at the national level. This included carrying out the registry of human resources in health (Registro Único de Recursos Humanos en Salud; RURHS), the first registry of traditional doctors, and the development of the unified system for the registration of health facilities (Registro Único de Establecimientos de Salud; RUES). By the end of the project, 98 percent of health facilities were registered across the nine departments.52
4.31 The project contributed to improve structural quality through investments in health infrastructure. The FPS executed 22 infrastructure subprojects for a total value of $3,320,385 (BOB 22,943,864 at 6.91 exchange rate) distributed across the departments of La Paz (in the municipalities of La Paz and Sica Sica), Cochabamba (in Tacopaya), and Oruro (in Adamarca and Corque). These included the renovation and construction of the Onco-Hematologic Unit. The project also financed equipment for 49 health facilities at primary, secondary, and tertiary levels of care distributed across 17 municipalities and 4 departments (Beni, Cochabamba, La Paz, Oruro) for a value of $5,578,042 (BOB 17,814,273 at 6.91 exchange rate) (MOH 2016, p.22). The IEG mission visited the new building of the Children Hospital in La Paz as well as the rural health facility Virgen de Concepcion in Sica corroborating their functioning and operation.

47
4.32 All intermediate outcome indicators measuring structural, process, and perceived quality achieved their targets. All civil works were finalized, and equipment purchased and installed according to subprojects. Almost all health facilities (94 percent) applied sector regulation norms for primary and secondary care facilities (98 percent) and the PRONACS norms (94 percent), exceeding the targets of 20 percent and 90 percent, respectively. Regarding perceived quality, the project supported the design, application, and publication of the guidelines for user satisfaction surveys. According to the survey, 77 percent of the user population receiving services was satisfied with the quality of services in the project areas, exceeding the target of 30 percent.
4.33 Outcomes. Using project indicators from the results framework, inequalities in access to essential maternal health care services were reduced over time, although point estimates may have not attained specific targets. The ratio between the percentage of pregnant women receiving four prenatal care check-ups in the target areas and the rest of the country increased from 0.54 in 2009 to 0.87 in 2016, exceeding the original target of 0.85 although it fell short of the revised target in 2014 of 0.95. The ratio of institutional delivery coverage also increased from 0.52 in 2009 to 0.75 in 2016, but it did not achieve the target of 0.85.
However, the assessment of project’s achievements related to gap reductions alone is misleading for two reasons. First, because the ratio of prenatal coverage rates between target areas and national levels hides information on the absolute coverage rate, and thus access inequalities could be reduced without access being improved in target areas (a decrease in the denominator would also increase the ratio). Second, because the distinction between project and nonproject areas is diluted in practice due to the project addressing both systemwide and targeted interventions. At the national level, the project has likely contributed to health outcomes through systemwide interventions. On the other hand, the project supported improvements in process quality in all 46 prioritized municipalities, while structural quality improvements were carried out in a reduced number of prioritized municipalities.
SNIS administrative data collected during the IEG mission show a positive evolution in complete prenatal care and skilled birth attendance coverages, although to a lesser extent than survey data.53 Prenatal care in the project’s 46 prioritized municipalities increased more than the national average during 2010–2016 (51 percent increase compared with 47 percent), thus increasing convergence with national levels. Moreover, coverage rates for prioritized municipalities that implemented subprojects in their health facilities networks are even higher, suggesting contribution of the project’s investments in infrastructure in addition to the rest of the activities supported by the project. Complete prenatal coverage was 76 percent in 2016, and institutional delivery was 71 percent.54
4.36 According to EDSA data, coverage of maternal health care services has increased steadily since 2003. The provision of adequate prenatal care has the potential to reduce neonatal and maternal morbidity and mortality to the extent that coverage rates are sufficiently high (Jones 2003). Indeed, prenatal coverage (at least one visit) increased from 90 percent in 2008 to almost 96 percent in 2016 on average, and pregnant women who had at least four prenatal controls also increased from 72 percent in 2008 to 86 percent in 2016, though higher in urban than in rural areas (90 percent compared with 77 percent in 2016)

48
(EDSA 2016, p.42).55 Institutional delivery and skilled birth attendance have also increased more than 18 percentage points during the 2008–2016 period reaching 88 and 90 percent, respectively, according to the last available EDSA 2016. Disparities persist; skilled birth attendance in low-poverty areas reached 94 percent in 2016, while it was about 62 percent in zones with high poverty (EDSA 2016, p.48).
The fundamental assumption in the causal link between increasing utilization and the reduction of risk factors affecting maternal and child health is the quality of the service provided, which would enable early detection of high blood pressure, diabetes, low birth weight, and pregnancy-related complications. The project supported extensive improvements in service quality. User satisfaction surveys show that 77 percent of the patients receiving services were satisfied with the quality of services delivered in the project areas. Moreover, completeness of prenatal care can be considered a quality indicator because it denotes retention of pregnant women in prenatal controls. The EDSA 2016 goes even further into quality measurement by estimating the proportion of women receiving adequate prenatal care according to four principles, which reached 79 percent.56 Starting in 2009, the implementation of a conditional cash transfer program, the Bono Juana Azurduy also had a positive impact on utilization, and hence the contribution of the World Bank to the achievement of outcomes is less plausible.57
OBJECTIVE 2: REDUCE CHRONIC MALNUTRITION AMONG CHILDREN UNDER 2 YEARS OF AGE IN THE TARGET AREAS
Achievement of objective 2 is rated modest.
Outputs and intermediate outcomes. Like objective 1, the project’s outputs supporting improvements in nutrition outcomes were investments in renovation of health facilities and equipment. In addition, the project helped in developing community committees for nutrition surveillance in intervention target areas, being a complement of the Bono Juana Azurduy and the Zero Malnutrition programs. Such programs stimulated demand for health care services and tackled the causes of malnutrition for young children and pregnant and lactating women. The APL also indirectly supported the Zero Malnutrition Program through fostering community participation, supporting the implementation of the IMCI and improvements of the SNIS like the primary health care software (Software de Atención Primaria en Salud; SOAPS).58
Outcomes. Originally, the project proposed the prevalence of exclusive breastfeeding and chronic malnutrition as outcomes indicators. Exclusive breastfeeding plays a vital role in reducing the risk of neonatal mortality (Edmon 2006), expanding birth space and reducing fertility, with its consequent impact on maternal mortality. Children with chronic malnutrition are less likely to achieve their potential development, and more likely to suffer from infectious diseases and even death. Despite the adequacy of these indicators, they were dropped in the 2014 restructuring to avoid duplication because they were being collected by the two national programs. Aa a proxy for measuring progress toward reducing chronic malnutrition, the coverage of height growth control in children under 2 was measured in prioritized project areas. The time series recovered by the IEG team for the period 2009–

49
2015 shows a sustained increase in the proportion of children under 2 receiving height growth controls from 18 to 89 percent in 2015 last available data.59
Since this indicator does not provide compelling evidence on the achievement of objective 2, the IEG team recovered dropped indicators and collected additional data on nutritional outcomes. According to survey data, the prevalence of exclusive breastfeeding for the first 6 months did not change significantly after 2008, remaining at about 60 percent (53 and 70 percent for urban and rural areas, respectively).60 Bolivia’s levels are way above the regional average of 35 percent (PAHO 2016). Had the project have kept the indicator, it would had almost achieved its target of 65 percent.
Iron deficiency is the main cause of anemia in children under 5, which negatively affects cognitive development, growth, and susceptibility to infectious diseases specially in children under 2. High anemia prevalence rates continue to be a serious public health issue in Bolivia. It was reduced significantly in children between 6 and 59 months old from 61 to 54 percent after 2008, yet greatly exceeds the regional average of 18 percent (WHO 2015). More alarming is the prevalence of anemia in children who are 6–23 months old during a critical period for child development—72 percent in 2016 (INE-EDSA 2016).
Regarding chronic malnutrition, the percentage of children under 5 with height-for-age below -2 standard deviations (measuring chronic malnutrition) persistently decreased from about 33 percent in 2003, to 27 in 2008, and 16 percent in 2016, still three percentage points above the regional average (INE-EDSA 2016). By 2016, the project’s target of 22 percent of chronic malnutrition prevalence would have been achieved.
Bolivia’s improvements in nutrition outcomes look promising at the national level, although disparities persist.61 The project indirectly contributed to these achievements through strengthening health service provision and its close collaboration with the Bono Juana Azurduy and the Zero Malnutrition Program. Evidence from an impact evaluation of the conditional cash transfer program, however, suggests that while it had a positive effect on the use of health services by mother and children, it had no significant impacts on malnutrition. Moreover, lack of outcome data for the project’s prioritized municipalities limits the plausible attribution of achievement to project activities.
OBJECTIVE 3: INCREASE HEALTH INSURANCE COVERAGE IN THE TARGET AREAS
Achievement of objective 3 is rated substantial.
Output and intermediate outcomes. The Morales administration was committed to continue efforts to expand public health insurance that started in 1996. During the years before the new 2009 Constitution, debates about coverage and financial sustainability of the health insurance were at the center of the political agenda. The government’s attempts to increase coverage to all people under 21 through the Universal Health Insurance (Seguro Universal en Salud; SU SALUD), failed at Legislative Congress due to political opposition to the new government and its policies. APL III supported the rollout of a digital enrollment system for SU SALUD, which was then used by the recently implemented health insurance for the elderly SSPAM. The enrollment system, which built on previous pilots carried out by

50
APL II, enabled municipalities to identify and register beneficiaries, provide the affiliation card, and transfer per capita funds to health providers in exchange for services. On average, 247,000 people above age 60 were enrolled in the SSPAM per year during 2010–2013. The same system allowed pregnant women and children under 2 to benefit from the Bono Juana Azurduy (MOH 2016). The rationale for affiliating SUMI beneficiaries was less strong as municipalities reimbursed health providers on a fee-for-services basis. The government advanced with the ambitious plan of reorganizing the fragmented and segmented public insurance schemes into a unified health system (Sistema Único de Salud; SUS), including not only the SUMI and SSPAM but also smaller local health insurances provided by departments and municipalities, and social security entities.62
The World Bank supported actions toward the establishment of a unified health insurance. During the expected transition from the SUMI to the SUS, the project supported the design, development, and implementation of software to improve the administrative and financial management of SUMI’s resources at municipal level (Sistema de Control Financiero de Salud; SICOF). This tool allowed municipalities to speed up reimbursement to health providers. The implementation of the SICOF was highlighted as a major achievement of APL III during IEG mission. The SICOF was implemented in all 339 municipalities, and training was provided on the financial administration of the SUMI and SSPAM to about 674 municipal health staff (two per municipality).
The project also helped build consensus for increasing financing for health insurance. It financed the Health Sector Coordination Council in 2012, raising awareness and enabling agreement on the need to increase health financing. Thus, agreement letters were signed between the municipal governments and the MOH to allocate 15 percent of coparticipation funds to finance the implementation of an expanded version of the health insurance. During the IEG mission, local government staff stressed the convening power of the World Bank in facilitating consultations and exchanges between the central MOH and the SEDES. At government request, moreover, the project financed a social public consultation (Cumbre de Salud) to generate interest for the development of a proposal for the integration of several public health insurance programs toward universal health coverage. Political opposition and lack of consensus about the institutional framework required for the unification of the health system contributed to project delays that resulted in project restructuring and cancellation of activities, scope, and the credit amount.63
While there was no agreement or political support among health subsystems and political leaders on the unification of the health system, the government was able to pass Law 475 that created the Comprehensive Health Insurance (Seguro Integral de Salud; SIS) in December 2013, merging the public health insurances SSPAM and SUMI and expanding beneficiary populations and services covered. Beneficiaries affiliation is no longer applicable to receive health care since payment mechanism is fee-for-service as it was under SUMI.64
The project was instrumental in helping the government to pass the health insurance Law 475. It supported its implementation through capacity building workshops, communication and information materials, normative documents and operation manuals, and for health and administrative personnel, including manual for ambulatory services covered by Law 475/SIS and those advancing the SUS.

51
Outcomes. With unification plans, interest in the enrollment system declined, and the project dropped the outcome indicator measuring progress toward enrollment in health insurance in 2012. Even so, the project’s target of 80 percent coverage was unrealistically high considering that by 2011 the public health insurance schemes (SUMI, SSPAM, and local government schemes) covered 24 percent of the total population, and social security coverage was 17 percent (Vidal 2016).
Bolivia does not yet have an affiliation system to register beneficiaries of Law 475/SIS allowing for a quantification of the publicly insured population. The former affiliation system of the SSPAM was discontinued, when the Law 475/SIS merged the SSPAM and the SUMI, combining both mother-child and elderly populations. The indicator introduced by the project to track progress on health insurance coverage, that is the percentage of population registered in Family Health Records (Carpeta Familiar), is inadequate. The perspective of government staff and health experts gathered during the IEG mission is consistent with IEG’s assessment that Carpeta Familiar is not an instrument to measure health insurance coverage.
Without availability of enrollment data, IEG provides evidence for the expansion of health insurance coverage in Bolivia based on theoretical coverage, increased financing, and trends in health service provision.
Bolivia has increased theoretical coverage of public health insurance since the creation of the SNMN in 1996. Law 475/SIS expands health service coverage to other population subgroups not included in previous SUMI (women of reproductive age and people with disabilities). These entitlements are expected to reduce the financial barriers to access, and thus increase utilization as shown for objective 1. The number of services covered also increased from 32 in SNMN, to 92 in SBS, to 547 in SUMI, to more than 1,200 disaggregated services in Law 475/SIS today according to the current nomenclator.
Increased coverage has been accompanied by increased financing. Today municipalities must allocate 15.5 percent of the coparticipation funds for Law 475/SIS-related health services, compared with 10 percent under SUMI. In practice, however, execution of these funds varies across municipalities.65
There has been a steady increase in the quantity of health services provided free of charge by the SUMI and Law 475/SIS at all levels of care. During 2008–16, the number of services provided increased 286 percent. Particularly for primary care, the increase was steeper after the approval of Law 475/SIS. A breakdown by population subgroups shows that services mainly account for children under 5 and pregnant women. Since the implementation of Law 475/SIS, services received by children increased from 9 million in 2014 to 17.6 million in 2016; and health care services for pregnant women also increased from 7.3 million in 2014 to 13.6 million in 2016. As expected, service levels for newly introduced groups, women of reproductive age and persons with disabilities, remain low compared with other covered groups.66 Despite the advances in health insurance coverage, Bolivia still has a long way ahead to achieve universal health coverage, and financing is the main limitation. Government health expenditure per capita remain low ($303 purchasing power parity) compared with the regional average ($557) (WDI 2015).
52
Less is known about the health impacts of the insurance. An early impact evaluation found that maternal and child public health insurance had a positive impact on the probability of having prenatal controls both in urban and rural areas, although disparities persist. Insurance also reduced the risk of infant death in the urban area but not significantly in rural areas. In contrast, the impact on child mortality was significant in rural areas, but not urban areas. These results are explained by different concentration of health facilities according to care level and thus differences in neonatology and pediatrics service uptake in those areas (UDAPE 2006).
OBJECTIVE 4: UPGRADE THE SNIS SO THAT IT WILL BE INTEGRATED WITH BOLIVIA’S NEW HEALTH INSURANCE PROGRAM
Achievement of objective 4 is rated substantial.
Outputs and intermediate outcomes. The project contributed much to strengthening the SNIS for better collection and analysis of health information, management, and decision making. It supported the design, development, and implementation of several information systems.67 In addition to the SICOF, the project financed development and implementation of software for the Carpeta Familiar with the purpose of collecting relevant information on the social determinants of health and risk factors (type of housing and ownership, family income, mother education, family violence, family composition) of families at primary care level. The instrument was inspired by Cuba’s health system and serves as a tool for health promotion and local analysis. The project also supported the SOAPS and Statistical Clinical Information System (Sistema de Información Clínico Estadístico; SICE), which gather information on service provision at primary level and hospital level, respectively. The project also helped finance the design and implementation of a web-based platform that consolidates information on health facilities from the SOAPS and SICE to conduct timely analysis and decision making. It supported the design, and printing of Live Birth Certificate, and the integration of the vital information forms into the SOAPS and SICE systems (MOH 2016).
The project also contributed to the development of software for human resources in health (Software de Registro de Recursos Humanos en Salud SOREH and the RURHS) to register health staff from the public subsystem into a database. This would provide the MOH, the departments, and health networks with have information on staff training, experience, and source of financing to support better management and planning. The Department of Santa Cruz shared with the IEG mission a recently produced report on the gaps in health-related human resources at the department level using data collected by these systems.
In terms of implementation, the project supported the design of the manual for medical certification of vital events; and training and capacity building in health facilities of secondary and tertiary level about the international code of diseases. The implementation of these information systems at health facility level required investments in hardware and networks. Interviews suggest that the World Bank was also instrumental in passing a regulation that allowed municipalities to allocate some portion of the budget surplus created by Law 475/SIS to investment in equipment for information systems.

53
Outcomes. The project contributed to improved health information systems. By the end of the project, achievements were measured by an intermediate outcome indicator showing that all modules included in the SNIS were fully implemented in the SEDES and in all the heads of the referral networks in the intervention areas, exceeding the target of 60 percent. Also, the population registered in Carpeta Familiar in prioritized municipalities increased from 20 percent in 2012 to 80 percent in 2015 (MOH 2016). The SICOF system, implemented in all municipalities, is of utmost importance for managing the payment of health provider claims (from public health facilities, social security, churches, NGOs, private nonprofit, and so on) regarding services covered by health insurance Law 475/SIS. This is an example of integrating SNIS upgrades into the health insurance program, and thus the second clause in the statement of Objective 4 was achieved.
4.63 The SOAPS and SICE systems had a high level of implementation across health facilities at primary, secondary, and tertiary levels by project closing, and their application continues to increase. According to SNIS data collected by IEG, the number of health facilities using the systems grew from 1,943 in 2014 (63 percent) to 2,333 in 2017 (72.1 percent), but there is great variability. Some departments, Chuquisaca, Oruro, and Cochabamba, achieved more than 90 percent implementation, while Beni and Santa Cruz have around 20 percent.68 Evidence from interviews suggest that despite the advances in the information systems, several challenges persist. While the SICOF and SICE digital systems are fully applied, the primary care systems, SOAPS and Carpeta Familiar, are less so because paper format modules continue to be used. Some health facilities still need the necessary hardware to use the systems and many of those also lack network connections. Moreover, the number of staff at the SNIS may not be sufficient to address software technical issues at local governments in a timely manner. Some municipalities and departments have developed their own systems that are better suited to their needs, integrating health with other municipal services. For the moment, the SNIS mirrors the fragmented health system, so there is still a need to further integrate these systems.
Efficiency
4.64 The overall efficiency of the project is rated modest.
4.65 The economic evaluation of APL III suggests the project’s investments are good value for money. The project’s cost benefit analysis estimated an internal rate of return of 9.3 percent at appraisal and 10 percent at completion. Ex ante and ex post analyses used a human capital approach based on increased lifetime earnings to monetize the project’s benefits. Impacts of the project were children saved from malnutrition, and maternal, infant, and child deaths avoided. Ex post analysis plugged in intermediate effects from international literature findings, such as children born from mothers receiving prenatal care are 30 percent less likely to die before the age of 5, 50 percent of maternal deaths can be prevented by ensuring access to essential obstetric care, and children saved from malnutrition would have an earning premium of 10 percent. Because of the multisectoral nature of the determinants of mortality, and to account for targeted nature of project, the analysis assumed that only one-fifth of the impacts could be attributed to the project. However, this seems overestimated since 2012 population estimates in 46 prioritized municipals account for only 7 percent of total population in Bolivia. On the cost side, both analyses included total World Bank

54
disbursements and education expenditures of children whose lives have been saved by the project based on GDP per capital spending in primary and secondary education. Cost estimates at completion were lower presumably to account for the reduced project scope and partial cancellation of credit.
4.66 Implementation efficiency was poor as progress was unsatisfactory at the beginning of the project: by 2012 the project had disbursed only 15 percent of the loan amount. Four factors contributed to the slow progress of implementation: (i) government difficulties building agreement for increasing health financing and hence insurance coverage; (ii) frequent changes in MOH’s authorities delayed the establishment of leadership to begin implementation; (iii) the new organizational arrangements for the project implementation unit to be integrated into regular MOH functions; and (iv) limited availability of construction firms that delayed procurement and planned civil works.
The opportunity to modify the project came five years after approval (three years after project became effective), when half of the total funds and the project scope was reduced. The project was extended three times, postponing the closing date for 23 months (about a 44 percent longer that the original project life). As was noted in project documents, project delays resulted in high project supervision costs from the World Bank budget, about $364,000 from mid FY14 to FY16 in staff time and travel costs.69
The project positively exploited synergies with parallel programs. The project coordinated with other government programs aimed at encouraging demand for maternal and child health services, the Bono Juana Azurduy and the Zero Malnutrition Program, thus avoiding duplication of efforts.
Some project interventions did not represent an optimal use of World Bank funds. As in the previous phases, APL III supported investments in priority areas, such as maternal and child health as well as improving essential functions of the MOH in quality assurance, health management information system, health financing, and expansion of service coverage. The project also supported infrastructure and equipment enhancements in primary health care centers located in prioritized areas. However, toward the end of the project, significant funds shifted to activities that did not represent an efficient use of resources for greatest impact on the proposed development objectives.
Ratings
OUTCOME
The outcome is rated moderately satisfactory. The objectives of APL III were substantially relevant because they were ambitious and aligned with the government and World Bank strategies, although the project could have defined better what risk factors affecting maternal and infant health were expected to be reduced. The project design is rated substantial since it was well conceived at appraisal, but after project restructuring the causal relationship between project activities and objectives lessened. Efficacy in the achievement of the objective to reduce the occurrence of risk factors affecting maternal and infant health, to increase health insurance coverage, and to upgrade the SNIS are all rated substantial. The

55
achievement of objective to reduce chronic malnutrition is rated modest because, although Bolivia’s improvements in nutrition outcomes look promising at the national level, there is limited outcome data for the project’s prioritized municipalities. Efficiency is rated modest considering that the implementation progress was very slow and that some project interventions were not an optimal use of World Bank funds, even though the project design was economically justified by a cost benefit analysis and aimed at exploiting synergies with other government programs. More evidence gathered by the IEG team for this PPAR provided the basis for upgrading the efficacy ratings, so that the overall outcome rating is now moderately satisfactory instead of moderately unsatisfactory.
RISK TO DEVELOPMENT OUTCOME
Risk to development outcome is rated moderate. Project goals continue to be a high priority for the country and therefore likely to continue to be supported by current and future governments. The fact that some key reforms were supported by an established legal framework makes them unlikely to be reversed. For example, the expansion of the health insurance was institutionalized by Law 475/SIS, and the sustainability of information system modules is guaranteed by the normative regulating collection of health management and statistical information by the SNIS (MOH 2016).
In terms of institutional development, moreover, the integration of the project implementing unit into current functions of the MOH, and later incorporation of key personnel into permanent position in the MOH likely ensures continuity in management and administrative processes developed during project implementation.
However, sustainability of outcomes would be at risk with slowing economic growth and decreased hydrocarbon revenues because Bolivia’s high dependence on commodity exports renders the economy vulnerable to less favorable terms-of-trade. Indeed, forecasts of GDP growth rate declined to 3.6 percent per year due to the rapid decline in export prices resulting in fiscal and external deficits. Deterioration in labor markets would imply reduced revenues for social security, while imposing a higher burden for the public health system to provide health care for the insured no longer covered by the social security.
Investments in physical capital made by the project will require considerable maintenance expenditures, and, for new infrastructure, additional human resources in health. This would imply high operation costs to autonomous local governments, which are responsible for maintenance of health facilities and have limited resources from their own tax revenues. Some of these funds are used to hire additional health staff for their health facilities, since nationally appointed staff are insufficient to operate the installed physical capacity. In this regard, the World Bank’s effort to commit municipalities in the allocation of human resources sufficient to operate health facilities are not binding. Without national and local investment in human resources concomitant to the efforts in facility infrastructure, health care services may fall short of achieving desirable health outcomes.
BANK PERFORMANCE
World Bank performance is rated moderately satisfactory.

56
Quality at entry is rated moderately satisfactory. APL III built on previous phases and its objectives were of strategic relevance. The programmatic nature of the selected lending instrument allowed for the targeting of long-term impacts, such as maternal and child mortality rates. The project design tackled the remaining bottlenecks to the continued implementation of the reform and the World Bank’s proposed activities were critical for the achievement of intended outcomes. The World Bank’s proposal was ambitious and complex, covering a broad spectrum of interventions and even coordinating efforts with other parallel programs to exploit synergies and avoid duplication. Moreover, the project’s implementation arrangements were based on an implementation unit fully integrated to the MOH, a distinctive feature from the previous phases. The World Bank’s team, however, may have underestimated the delays associated with a slow transition into the new implementation model, including designation of responsible staff. Risk assessment and mitigation plans did not envisage difficulties in establishing a unified health insurance or associated activities.
Quality of supervision is rated moderately satisfactory. Considerable budget and staff resources were used in supervising, monitoring, and reporting on project progress. Three task team leaders assumed responsibility during project implementation and ensured smooth transitions as local specialists continued providing daily support. The World Bank team collaborated closely with the MOH and the FPS, as well as the implementing agencies, at all stages of the project. It proactively provided timely and precise support to the implementing units in times when organizational restructuring and frequent changes in managerial levels challenged the decision-making processes of the MOH. Positive feedback from stakeholders was received by IEG team about the technical quality of the staff. World Bank reports were candid in assessing the progress of the project’s achievements, including reporting unsatisfactory project ratings.
The World Bank team could have had a quicker response to project restructuring when it became clear the project was not performing according to timelines. The first restructuring took place five years after project approval, three years after project implementation, and after two years of continuous unsatisfactory project ratings.
The World Bank found a common ground with the government and succeeded in restructuring the project according to its current priorities in the health sector, including investments in tertiary level hospitals, although some activities were not strategic for the project objectives. Moreover, changes in project activities consequently required changes in project indicators, making more difficult the tracking of progress in a consistent manner. The number and frequency of project restructurings may reflect the inability of the World Bank team to anticipate further changes in project implementation.
BORROWER PERFORMANCE
4.79 Borrower performance is rated moderately satisfactory.
Government performance is rated moderately unsatisfactory. The government was highly committed to improving maternal and child health, as indicated by the national development plans as well as other national programs focused on malnutrition and conditional cash transfers. At the beginning of the project, the government administration

57
underwent dramatic changes in political priorities, which led to frequent turnovers in MOH leadership, challenging project ownership (seven ministers of health held office during project implementation). Decisions regarding the organizational structure to absorb the project’s implementing unit, and consequent allocation of staff responsible for project management and implementation, were therefore delayed. The government’s ambitious goal of creating a unified health insurance system exceeded its ability to create consensus across the political spectrum. This failure resulted in project execution delays and cancellation of several project activities that reduced the scope of the project interventions, both in terms of target areas and number of activities supported.
Implementing agency performance is rated moderately satisfactory. The project implementation unit was established within the MOH so that project activities could be integrated into regular MOH functions to enhance sustainability and coordination with other programs. This process resulted in initial delays in project execution. Once implementation responsibilities for key personnel were established, the collaboration of the project coordination unit with other technical areas of the MOH was satisfactory. Intentions to convert former project implementing unit staff from previous APL phases into permanent MOH employees did not materialize immediately, although some project staff were absorbed in the areas of planning and information systems after project closing.
On the other hand, the FPS remained responsible for implementing and overseeing the execution of infrastructure subprojects. Despite initial delays and limited availability of construction firms, the FPS managed to execute a substantial amount of project resources as infrastructure investments increased after project restructurings. The FPS executed more than $6.9 million, representing about 70 percent of the World Bank’s loan. The FPS submitted financial audits and documentation with some delay.
MONITORING AND EVALUATION
The quality of M&E is rated modest.
M&E Design. The results framework at appraisal was generally adequate to monitor progress toward the achievement of project objectives. M&E arrangements in this phase eliminated ambiguities from previous APL phases. It included 6 KPIs and 12 intermediate outcome indicators with complete baseline and target values. KPIs associated with the objective of reducing risk factors of maternal and child health measured inequalities in health care utilization, as they were framed as ratios. A shortcoming here is that M&E arrangements did not provide information on coverage levels. It would have been more transparent to present the coverage rates for target areas and national averages separately as this PPAR has done.
M&E Implementation. The ability of the project to track progress of achievement of objectives weakened during implementation. Project restructuring dropped the two outcome-level indicators assessing the reduction of chronic malnutrition (the “percentage of children receiving exclusive breastfeeding at 6 months in the target areas;” and the “percentage of children 2 years old taller than -2Z scores in the target areas”). Arguments on avoiding duplication do not seem to be plausible. The fact that the Bono Juana

58
Azurduy program would collect these data does not seem a rationale for not tracking these indicators. These indicators were replaced by an intermediate outcome indicator whose relationship with malnutrition outcomes was rather indirect. Moreover, its target of 40 percent was underestimated by 2014 as progress was well under way. 70
The project was unable to find an adequate indicator for health insurance coverage. The “percentage of population enrolled in Carpeta Familiar” introduced by the 2014 restructuring was inadequate. It did not measure health insurance coverage, but rather collected information on social determinants of health and risk factors. This was confirmed by stakeholders interviewed. Overall revised indicators were less aligned with the objectives they intended to measure.
M&E use. Despite the project’s support to health management and information systems, there is no evidence on the effective use of the project’s M&E arrangements to change the project’s direction. Project restructuring was a result of delays in executing project activities and shifts in government requests toward infrastructure investments, rather than being guided by the project’s M&E data.
5. A 16-Year Program: Conclusions and Lessons 5.1 Chapters 2, 3, and 4 documented the key success, challenges, and failures of three phases of the APL. Specific project objectives in each phase were well grounded in Bolivia’s development challenges and consistent with government priorities. This chapter takes a broader look at the APL program, summarizing main achievements, assessing its contribution to long-term outcomes, and distilling some lessons for the future World Bank support.
APL Contributions
The APL program made important contributions to the health sector in Bolivia in the period 1999–2016. The series substantially contributed to increased access to and coverage of basic maternal and child health care services. A large proportion of project costs were allocated to the immunization program, a strategy of proven cost-effectiveness. Immunization coverage, moreover, increased in a more equitable way. Another substantial accomplishment was the increase in adequate prenatal care and skilled birth attendance coverage.
The APL efforts in health financing and information systems were partly responsible for this success. First, the targeted increments in the national budget for vaccines and mandatory contributions from social security entities progressively ensured increased resources for the government to fully finance an expanding immunization program without external aid. Another important area was the implementation and strengthening of various maternal and child health insurance schemes. The APL series supported the establishment of the SBS, the SUMI, and its current incarnation, SIS, established by Law 475. Maternal and child public health insurance had a positive impact on the probability of having prenatal controls both in urban and rural areas (UDAPE 2006). Finally, the APL’s continuous support to the SNIS helped to improve the collection and analysis of health information for a better management and decision making. Some of the new systems

59
developed were successfully integrated with the health insurance scheme. Thus, the strengthening of the immunization program, the public health insurance, and the SNIS were important institutional changes and remarkable achievements and have been sustained.
While quality is more difficult to measure, the APL also addressed important building blocks in the improvement of health service quality. Substantial resources were devoted to structural and process quality improvements through infrastructure subprojects and implementation support for IMCI/MBP protocols. While there is no hard evidence of process quality improvements that would measure improvements in the capacity of health personnel and adherence to protocols (for lack of health facility surveys), a recent user satisfaction survey revealed that 77 percent of those receiving health care in APL target areas was satisfied with its quality. It is plausible, moreover, that completeness of prenatal care can be a quality indicator since it denotes retention of pregnant women in prenatal controls, but the introduction of the Bono Juana Azurduy later in 2009, which created incentives for women to complete prenatal visits, renders the argument less convincing. A recent population and health survey (EDSA 2016) estimated that 80 percent of women received prenatal care. Moreover, those visits were performed by qualified personnel, the first visit was before the twentieth week of pregnancy, at least four controls were completed, and the visits were carried out according to protocols (awareness of pregnancy complication symptoms, blood pressure, urine and blood test, height and weight, abdomen measurement, and control of fetal cardiac pulse).
In community empowerment and chronic malnutrition, the APL’s contributions were modest. While demand-side interventions addressing behavioral changes, attitudes toward healthy practices, and social and cultural factors play an important role, they were given less attention than supply-side interventions. The EXTENSA program, whose brigade personnel were trained to respond effectively to communities’ cultural beliefs was not continued during APL III. On the other hand, short-term health impacts like malnutrition are more difficult to achieve and assert attribution than project objectives aimed at lower levels of the results chain.
Although the program addressed key challenges of the health system, the deployment of human resources for health ultimately received less attention than it deserved. The original design of APL III envisaged such interventions, but they were later canceled due to project implementation delays. Advances were made in developing information systems that would enable the MOH to conduct a diagnostic analysis of the current human resources situation. Some preliminary initiatives were made by some local governments demanding more financing for health staff and availability of specialists.
Human resources continue to be an important constraint in the provision of health care services, particularly at specialist levels. A limitation for the development of a critical mass of specialist professionals is the lack of domestic residency programs and the consequent need to receive training abroad in border countries. Arguments against promoting the external generation of human capital are the risk of “brain drain” and the inability of the public sector to attract specialists due to low salaries compared with the private sector. An important challenge in this regard will be the government’s Hospital Plan for 2016–2020, which entails a $1.7 billion investment in construction, upgrade, and equipment in all

60
secondary and tertiary level hospitals, including those for cardiology, oncology, gastroenterology, and nephrology. This plan would widen the gap of specialists’ doctors and human resource constraints. In support for the APL’s infrastructure investments, previous World Bank attempts to get local governments to commit to deploying sufficient human resources were not binding. Going forward the World Bank should persist in providing the government technical advice and support to pave the way for improving the availability of human resources in health. Moreover, the World Bank could explore options to complement infrastructure investments in the initial stages of operations to guarantee sufficient resources to ensure that they function well. This may help build a demonstration effect and empower communities to demand a certain level of health care from their local authorities once the World Bank’s support concludes. Again, this strategy calls for more focus on boosting citizen participation and enhancing demand for quality health care services.
5.8 Infant, child, and maternal mortality declined during the APL program, helping Bolivia to achieve its MDGs. The APL series had greater focus on infant mortality, either explicitly by including it as a project objective, or indirectly by addressing well-known strategies for reducing deaths and their risk factors. Occasionally, under-five mortality and maternal mortality were explicitly included as well, but many project activities, like expansion of insurance coverage and the application of MBP protocols, also benefited maternal health. A 2006 UDAPE impact evaluation found that public health insurance supported by the APL series reduced the risk of infant death in urban areas, and significantly reduced child mortality in rural areas. However, others have argued that the exclusion of women of reproductive age as beneficiaries of the SUMI’s package of services during 2003–2013 has negatively affected the country’s progress in reducing maternal mortality (Silva and Batista 2016, WHO 2016).
5.9 There are limitations in the attribution of mortality reduction goals to project activities. The reduction in maternal mortality cannot be directly attributed to the project due to lack of an impact evaluation. Moreover, the multisectoral determinants of infant, child, and maternal deaths makes it difficult to establish causality between World Bank interventions and the substantive reductions in mortality. However, program contributions can be derived from the individual project achievements and the scope of their interventions since there is a logical relationship between project interventions and mortality rates (see Appendix I Figure I.6). This is not to say that project activities addressed all factors influencing mortality rates. The prevention of maternal deaths, for example, requires a more complex network of services than those needed to prevent infant deaths, such as secondary care, emergency obstetrics services, and blood banks. These activities, although originally envisaged in APL III, were later canceled due to project delays.
Lessons
5.10 The experience of the APL program indicates the following lessons:
5.11 The definition of a common results framework is useful to align the efforts of different government levels. The M&E design of APL I was innovative in that it strategically defined a common set of indicators as APL phase triggers, the local management and accountability tool (that is, performance agreements), and KPIs. Although

61
some of the indicators were initially ambiguous and later modified, this focus on common results helped different stakeholders (central government, local governments, World Bank staff) to concentrate efforts on the achievement of these selected areas. There is a risk though of not tracking lower-level indicators measuring progress in activities and outputs.
5.12 A robust results-based approach needs to define a clear mechanism of rewards/sanctions to function well. Otherwise it risks turning into a mere monitoring tool that could lead to perverse incentives. Performance agreements did not have a standard methodology for setting targets at the local level, altering the judgment of performance based on the stringency of targets set. In addition, the approach did not have a clear mechanism for rewards to ensure compliance of local governments with the targets and to sustain the level of effort and interest. Rather, it seemed to be used to monitor results sporadically and improve the capacities of local governments lagging behind through investment subprojects. While a traditional results-based approach (financially) rewards the achievement of results, these performance agreements seemed to act as a tool to flag allocation of funds to those local governments struggling to achieve targets.
5.13 Project design coordinating efforts with parallel programs that have similar goals has a great potential for efficiency, but it raises methodological concerns about the attribution of outcomes. In APL III demand components were sought to be articulated through the Zero Malnutrition and Bono Juana Azurduy programs, aimed at reducing malnutrition and increasing demand for health care services. While coordination with other government programs that have similar goals can enhance efficiency by exploiting synergies and minimizing duplication of effort, it creates challenges for the attribution of results to the activities of either program. Initial piloting and evaluation intentions were not possible because the conditional cash transfer program was directly launched at the national level, which limited the development of specific M&E arrangements to disentangle program effects.
5.14 While continued focus on quality objectives is certainly commendable, it needs to be accompanied by more robust outcome measures to prove quality enhancements. The prevalence of structural aspects of quality reflects the low baseline of health facilities’ infrastructure conditions as well as the high costs of collecting process quality indicators. It is also consistent with the type of first-generation reforms APL I and II aimed to address (such as expansion of service coverage by ensuring financing for vaccines and public health insurance and infrastructure). APL III aimed at reducing the occurrence of risk factors affecting maternal and child health, but it did not identify appropriate measures, especially on process quality, and instead used complete prenatal coverage and user satisfaction surveys, and other narrow aspect of structural quality.
5.15 Programmatic approaches are suitable where sector knowledge is strong, program objectives are long-term and clear, and country ownership is established. The choice of an APL instrument for the overall program was appropriate because the government’s goals to reduce infant and child mortality were well articulated and would take an extended time, requiring consistency and deepening of reforms over several phases. Strong government ownership of these goals, and a vision for how to pursue them over time, further strengthened the case for an APL. Sufficiently robust triggers, moreover, ensured they

62
did not become inappropriate over time, thus securing continuation of the APL phases. These are useful lessons for the new Multiphase Programmatic Approach.
5.16 Ambitious projects partially relying on a government promise to pass a reform law are likely to need a restructuring. Reallocation of project funds in response to ad hoc government requests may lessen the logic of the results chain and risk the M&E framework from providing sufficient evidence of project achievements. Building on the success of the previous phases, APL III designed activities based on the government’s expectations to transform the health insurance system, which did not occur. The cancellation of related activities and the inclusion of less-aligned activities affected the M&E framework, which was ultimately insufficient to provide evidence of the project’s achievements. Additional data outside the M&E frameworks had to be used by the end of the project. This example highlights the value of evidence-based policy and reform versus less-aligned changes. A reform process could benefit from articulating a learning agenda and process for fine tuning reforms based on evidence and lessons.
References Aizenberg, Lila. 2011. “Hacia una aproximación crítica a la salud intercultural.” Revista Latinoamericana de
Población 5 (9): 49-69.
Apella, I., and Blanco, G. 2015. Effectiveness of Targeting Mechanisms Use d in Social Protection Programs in Bolivia. Social Protection and Labor discussion paper, no. 1506.
Edmond, K., Zandoh, C., Quigley, M., Amenga-Etego, S., Owusu-Agyei, S., Kirkwood, B. 2006. “Delayed Breastfeeding Initiation Increases Risk of Neonatal Mortality.” Pediatrics 117(3), 380-386.
Jones, G. 2003. “How many child deaths can we prevent this year?” Lancet Survival Series (362), 65–71.
IHME (Institute for Health Metrics and Evaluation). 2010. Global Burden of Disease Profile Bolivia.
INE (Instituto Nacional de Estadística). 2017. Indicadores Priorizados de la Encuesta de Demografía y Salud 2016. La Paz, Bolivia.
Kopp Valdivia, C., Rico Aranibar, L., Aguilar, A.M., and Ibiett Vargas, G. 2015. Reporte de Evaluación de pertinencia y efectividad de las estrategias y acciones del programa Desnutrición Cero, La Paz, Bolivia, mimeo.
MOH (Ministerio de Salud y Deporte). 2016. Informe Final de Resultados e Implementación del proyecto de Expansión de Acceso a Servicios para Reducir Inequidades, Programa Adaptable de Crédito APL III, Gestión 2010–2016, Ministerio de Salud.
______. 2016. Estudio Nacional de Mortalidad Materna 2011 Bolivia, Publicación 44, Serie: Documentos de Investigación 2016.
MOH (Ministerio de Salud). 2017. Plan Estratégico Institucional 2016 - 2020. Dirección General de Planificación. Serie Documentos de Política. La Paz: Bolivia.
PAHO (Pan American Health Organization). 2007. Health System Profile: Bolivia. Third Edition., PAHO: Washington, D.C.
______. 2016. Indicadores Básicos. Situación de Salud en las Américas.
Silva, E., and Batista, R. 2010. “Bolivian Maternal Health and Child Health Policies: Successes and Failures.” Canadian Foundation for the Americas. Ottawa, Ontario: FOCAL.
UDAPE (Unidad de Análisis de Políticas Sociales y Económicas) and UNICEF. 2006. Evaluación de Impacto de los Seguros de Maternidad y Niñez en Bolivia 1989–2003, La Paz, Bolivia.

63
______. 2015. Evaluación de Impacto Programa de Salud Materno Infantil “Bono Juana Azurduy,” La Paz, Bolivia.
UDAPE (Unidad de Análisis de Políticas Sociales y Económicas) and Programa de Naciones Unidas para el Desarrollo. 2016. Boletín de Salud. Compendio Objetivos de Desarrollo del Milenio ODM’s. La Paz, Bolivia.
URS (Unidad de Reforma). 2008. Informe Preliminar de Cierre del Proyecto Reforma de Salud APL II. Gerencia Técnica y Gerencia Administrativo Financiera de la Unidad de Proyecto Reforma de Salud, June 30. La Paz, Bolivia.
Vidal, Cecilia. 2016. “Universal Health Coverage Assessment: Bolivia.” Global Network for Health Equity (GNHE).
World Bank. 1998. International Development Association and International Finance Corporation Country Assistance Strategy for the Republic Bolivia, Country Management Unit, Bolivia, Paraguay, Peru, Latin America and the Caribbean Region, Report No. 17890-BO, May 21. Washington, DC: World Bank.
______. 1999a. Development Credit Agreement (Health Sector Reform Project) between Republic of Bolivia and International Development Association, Conformed, June 25. Washington, DC: World Bank.
______. 1999b. Project Appraisal Document on a Proposed Adaptable Program Credit in the Amount of SDR 17.8 million ($25 million equivalent) to the Republic of Bolivia for a Health Sector Reform Project, Human Development Department, Bolivia, Paraguay, Peru Country Management Unit, Latin America and the Caribbean Region, March 31. Washington, DC: World Bank.
______. 2001a. Development Credit Agreement (Health Sector Reform Project – Second Phase) between Republic of Bolivia and International Development Association, Conformed, August 31. Washington, DC: World Bank.
______. 2001b. Project Appraisal Document on a Proposed Adaptable Program Credit in the Amount of SDR 27.6 million ($35 million equivalent) to the Republic of Bolivia in Support of the Second Phase of the Health Sector Reform Program, Human Development Department, Bolivia, Paraguay, Peru Country Management Unit, Latin America and the Caribbean Region, June 12. Washington, DC: World Bank.
______. 2004a. International Bank for Reconstruction and Development, International Development, Association, International Finance Corporation and Multilateral Investment Guarantee Agency, Country Assistance Strategy for the Republic of Bolivia, Bolivia, Ecuador, Peru, and República Bolivariana de Venezuela Country Management Unit, Latin America and the Caribbean Region, Report No. 26838-BO, January 8. Washington, DC: World Bank.
______. 2004b. Implementation Completion Report (PPFI-Q0940 IDA-32440) on an Adaptable Program Credit in the Amount of 17.8 million to the Republic of Bolivia for a Health Sector Reform Project (APL I), Human Development Department, LC6 (Bolivia, Paraguay, Peru and República Bolivariana de Venezuela) Country Management Unit, Latin America and the Caribbean Region, June 9. Washington, DC: World Bank.
______. 2004c. Health Sector Reform in Bolivia: A Decentralization Case Study. World Bank country study. Washington, DC: World Bank.
______. 2007. Project Appraisal Document on a Proposed Credit in the Amount of SDR 11.7 million ($18.5 million equivalent) to the Republic of Bolivia for Expanding Access to Reduce Health Inequities – APL III (Health Sector Reform Project, Third Phase), Human Development Sector Management Unit, Bolivia, Ecuador, Peru, and República Bolivariana de Venezuela Country Management Unit, Latin America and the Caribbean Region, June 20. Washington, DC: World Bank.
______. 2009. Implementation Completion and Results Report (IDA-35410 IDA-3541A) on a Credit in the Amount of SDR 27.6 million ($35 million equivalent) to the Republic of Bolivia for a Health Sector Reform Project, Second Phase, Human Development Sector Management Unit, Bolivia, Ecuador, Peru, and República Bolivariana de Venezuela Country Management Unit, Latin America and the Caribbean Region, January 27. Washington, DC: World Bank.

64
______. 2012. Restructuring Paper on a proposed project restructuring of Expanding Access to Reduce Health Inequities Project (APL III)-former Health Sector Reform – Third Phase (APL III) project, Credit 4380-BO, Report No:73337-BO, Washington DC: World Bank.
______. 2014. Restructuring Paper on a proposed project restructuring of Expanding Access to Reduce Health Inequities Project (APL III)-former Health Sector Reform – Third Phase (APL III) project, Credit 4380-BO, Report No:RES15248, Washington DC: World Bank.
______. 2015b. Bolivia—Systematic Country Diagnostic: Rebalancing Inclusive Growth to Deepen Gains on Poverty and Inequality Reduction. Washington, DC: World Bank Group.
______. 2015c. International Development Association, International Bank for Reconstruction and Development, International Finance Corporation and Multilateral Investment Guarantee Agency, Country Partnership Framework for the Plurinational State of Bolivia for the Period FY16-FY20, Bolivia, Chile, Ecuador, Peru, and República Bolivariana de Venezuela Country Management Unit, Latin America and the Caribbean Region, International Finance Corporation, Multilateral Investment Guarantee Agency, Report No. 100985-BO, November 4. Washington, DC: World Bank.
______. 2016. Implementation Completion and Results Report (IDA-43820-BO) on a Credit in the Amount of SDR 11.7 million ($18.5 million equivalent) to the Plurinational State of Bolivia for Expanding Access to Reduce Health Inequities – APL III (Health Sector Reform Project, Third Phase), Health, Nutrition, and Population Global Practice, Bolivia, Chile, Ecuador, Peru, and República Bolivariana de Venezuela Country Management Unit, Latin America and the Caribbean Region, June 30. Washington, DC: World Bank.
______. 2017. Multiphase Programmatic Approach, Operations Policy and Country Services, July 18. Washington, DC: World Bank.
WHO (World Health Organization) and UNICEF. 2013. Ending preventable child deaths from pneumonia and diarrhea by 2025: The integrated Global Action Plan for Prevention and Control of Pneumonia and Diarrhea (GAPPD).
WHO (World Health Organization). 2002. Antenatal Care Randomized Trial: Manual for the Implementation of the New Model. WHO: Geneva.
______.2015. The Global Prevalence of Anemia 2011. Implementation of the New Model. WHO: Geneva.
______.2016. Recommendations on Antenatal Care for a Positive Pregnancy Experience. WHO: Geneva.
1 Poverty headcount ratio at national poverty line. Data from World Development Indicators. 2 Data on the state of the health system come from Vidal 2016. 3 Data extracted from “Global Health Estimates 2015: Deaths by Cause, Age, Sex, by Country and by Region, 2000-2015.” See: http://www.who.int/healthinfo/global_burden_disease/estimates/en/index1.html 4 See appendix C table C.2 and figure C.1 and C.2. 5 See appendix B table B.1 for a comparison of program and project objectives statements across project documents. 6 It should be noted that the first two projects in the series—APL I and II—have very similar objectives and performance indicators, reflecting the continuation and deepening of reforms expected from the program. For this reason, this section will also describe elements of the APL II, but will expand on distinct aspects of that project in the following chapter. 7 See table C.2 in the appendix C for a comparison of infant mortality rates in the region. 8 The emergency package was expected to contribute to ’urgent short-term financing needs while also assisting with small, focused, and visible social sector investments. Funds would come from a new emergency loan, the

65
advance release of a development policy loan tranche, and redirected funds from existing loans amounting to US$5.7 million. About 10 percent of that amount was from APL I and II, to be allocated as follows: APL I & II: Complejo Hospitalario Miraflores (La Paz) US$399,826 and APL II: Rehabilitation and equipment for two health centers (El Alto) US$200,000. 9 See IEG’s reconstruction of the results chain in appendix I figure I.1. 10 Rigidity of triggers has been cited as a cause for discontinuation of the APL lending instrument. The new multiphase programmatic approach was designed to overcome such shortcomings while maintaining the adaptation features of the APL (World Bank 2017). 11 Through an inter-institutional agreement with PAHO, the World Bank financed the purchase of vaccines and syringes through PAHO’s Rotatory Fund for a total of US$1.29 million, equivalent to 80 percent of the amount needed. 12 This series of events is referred to as the “Gas Wars.” 13 The World Bank was instrumental in the introduction of the pentavalent vaccines in 2000 at the national level, which includes the DPT vaccine plus immunization against Hepatitis B and Haemophilus influenza type B as well. 14 Even though APL I did not have equity as an objective, it did seek to identify pockets of low immunization coverage as a strategy to increase access, as well as to prevent outbreaks that may originate in these localities. Thus, the project monitored the number of municipalities with pentavalent coverage less than 80 percent. According to project documents, 150 municipalities (about half of the total) had coverage rates below 80 percent in 2007, while the target was 25 municipalities, but the indicator does not seem to provide a reliable measure of inequalities. IEG’s own calculations based on SNIS administrative data for immunization and municipality population estimates do not appear to be sufficiently robust either. Data on the distribution of pentavalent coverage in children under 1 year old (Figure I.2 in appendix I) shows a large proportion of municipalities with coverage rates above 100 due to inaccuracy of estimated population at local level. These inaccuracies have been confirmed by stakeholders. 15 See figure I.3 in appendix I on fully immunized children by income quintile. 16 The 2004 Supreme Decree 27488 regulated the implementation of Law 2042, further specifying the yearly share of resources from Social Security to be allocated to the PAI. The decree indicated that 50 percent of funds from Social Security allocated to MOH were to finance the acquisition of vaccines, syringes, and the PAI operating costs from 2007 onwards. Later, the Vaccine Law (Law 3300) issued in 2005, confirmed the allocation rule stated in the Supreme Decree. 17 Based on 2013 estimates, the latest available, for Latin America and the Caribbean as reported in the World Development Indicators (WDI). 18 To estimate the coverage of pneumonias treated, the PPAR team used the number of cases treated of the SNIS, population estimates from WDI, and prevalence rates from the 2016 and 1998 DHS. Similar attempts to estimate coverage of diarrhea treatment using SNIS administrative data and prevalence estimates, resulting in values greater than 100 percent that might be due to inconsistencies in the SNIS data or by the limitations of prevalence estimates coming from DHS. Despite this caveat, both the crude number of cases treated for pneumonia and diarrhea and the, albeit imperfect, estimates of coverage show improvement, which leads the team to conclude that there is progress in this area. 19 See results framework indicators in appendix E. 20 A 2001 multicountry case study, adopted by WHO, concluded that four antenatal care visits were needed to provide an efficient program of care. Current guidelines have increased the number of recommended antenatal visits to eight (WHO 2016). 21 See appendix E, table E.1. 22 See appendix C, figure C.1.

66
23 The indicator of national financing of vaccines was not included in the performance agreements, because this was responsibility of the central government, beyond the scope of departments’ functions. 24 For the evolution and content of the different insurance programs in place in Bolivia during project implementation refer to appendix D. 25 See appendix H for information of the different software developed by APL III that are part of Bolivia’s health information system. 26 See appendix C, figure C.1. 27 See appendix F for more details on achievement of triggers for APL series. 28 The PAD of June 12, 2001, states that the project objective is to reduce infant mortality and omits a reference to reducing child mortality: “The activities of APL2 will aim at the same development objectives as APL1: to increase coverage and quality of health services and related programs that would improve the health of the population, and to empower communities to improve their health status; and to strengthen local capacity to respond to health needs.” (World Bank 2001b, 3). In line with harmonized guidelines, this project will be evaluated against the PDO, as stated in the Development Credit Agreement. 29 The underserved areas where EXTENSA would operate were selected based on poverty levels and epidemiological needs. 30 This criterion was later revised in 2004 and a new formula was implemented based on criteria of vulnerability. Municipalities were categorized in five groups: the most vulnerable municipalities (Group 5) receive 45 percent of the funds available whereas those in Group 1 receive only 15 percent (World Bank 2009). 31 See last column of Table 2.1 in the previous chapter. 32 These funds were used to finance additional infrastructure investments and the 2008 DHS. 33 See appendix D for a comparison of public health insurance systems in Bolivia. 34 See appendix F for a description and analysis of the program triggers. 35 In 2013, the government launched a national program called MI SALUD that also used mobile brigades, but with a focus on promotion, rather than provision of health care. Despite some parallels between the two programs, MI SALUD is not considered a continuation of the EXTENSA. Stakeholders raised concerns that MI SALUD consumes human resources from the MOH, and is not integrated with the local health facilities networks, cannot be organized by department or municipalities, and reports directly to MOH. 36 See figure B.5 in appendix C. 37 2016 DHS data shows that institutional birth rates among municipalities with high poverty rates (62 percent), and women with no education (61 percent) fall below the MDG target of 70 percent. Although less severe, other gaps in coverage can be found for Aymara speakers (73 percent), the department of Potosí (74 percent), and rural areas (76 percent) (INE 2017). 38 The importance of monitoring these rates for these purposes is referred to in the WHO surveillance standards for poliomyelitis. (http://www.who.int/immunization/monitoring_surveillance/burden/vpd/surveillance_type/ active/poliomyelitis_standards/en/) 39 Data produced by SNIS, compiled during the mission. 40 The quality of prenatal control in rural areas increased from 27 percent in 2003 to 77 percent in 2016, while the ratios went from 28 percent in 2003 to about 90 percent in 2016 in urban areas. 41 See table I.1 in appendix I for details on the calculations. 42 See World Bank (2004) Chapter 3 on performance agreements in Bolivia.

67
43 As was the case with the 2003 DHS, various donors pooled resources to finance the 2008 DHS, namely United States Agency for International Development, UNICEF, United Nations Population Fund, United Nations Development Programme, Spanish cooperation, PAHO, Canadian International Development Agency, and the World Bank. The World Bank, through APL II, was the largest contributor, financing 49 percent of the DHS budget. 44 In IEG project validations, a change in targets would raise the issue of a split rating when either the original or the revised target is met and the other one is not. But the split rating finds limited rationale in a PPAR evaluation that provides new additional evidence for which project targets are no longer applicable (including other type of indicators and from different sources). The PPAR evaluates the project using all available information relevant to demonstrating achievement of the objectives without creating artificial distinctions between indicators/data from the project’s results frameworks and other relevant and/or newly gathered information. Thus, outcome trends and direction of changes are evaluative evidence for the achievement of project objectives. See table E.5 in appendix E for details of results framework and targets. 45 See appendix C table C.2 on Comparability of health indicators in Bolivia and Latin America and the Caribbean. 46 See a discussion about program objectives in the Relevance of Design section below. 47 The use of mortality rates as KPIs has some limitations. First, data from a DHS survey are usually 2 to 3 years behind; second, non-survey data may have wide confidence intervals and inaccuracies related to non-sampling errors; third, mortality rates bring challenges on attribution since mortality is beyond the control of the MOH itself at least to some extent; and fourth, their use as performance indicators may distract stakeholders from focusing on other indicators (such as vaccination coverage, prenatal care, and skilled birth attendance) over which they have more control.
49 This national program is operated by physicians trained in the SAFCI approach, who carry out promotion and prevention activities, identification of risk factors in the population, and integral and intercultural curative services through domiciliary visits. Despite their similarities MI SALUD is not considered by either government or World Bank’ staff, a continuation of the EXTENSA. Detractors criticize the limited coordination this central program has with primary care health facilities run by municipalities. 50 See appendix I Box I.2 for a more in-depth discussion on investments in the Onco-Hematologic Unit of the Children’s Hospitals in La Paz. 51 See appendix F table F.1 for triggers of APL program. 52 See appendix table H.1 in appendix H for detailed description of all software supported by the APLIII. 53 Population-based surveys and administrative data are not comparable due to methodological differences, but they are complementary. For example, EDSA survey modules collect information on pregnancies over the past 5 years. On the other hand, administrative data uses population estimates that are prone to inaccuracies. 54 See appendix I table I.2 on coverage maternal health care services. 55 See appendix I figure I.8 on maternal health coverage 2003, 2008, 2016 from ENDSA/EDSA. 56 Adequate prenatal care was defined by four criteria: prenatal care provided by qualified personnel; first prenatal visit before week 20; complete four or more prenatal controls; and prenatal care visits carried out according to protocols (explanation of typical pregnancy complication symptoms, blood pressure, urine and blood test, height and weight, abdomen measurement, and control of fetal cardiac pulse). 57 See appendix G on Impacts of Bono Juana Azurduy. 58 See objective 4 for a more detailed discussion on the project’s support to the SNIS. 59 See appendix I figure I.9 on Growth and monitoring control children under 2. 60 See appendix I figure I.10 on INE-EDSA 2008-2016 Prevalence of exclusive breastfeeding.

68
61 See INE-EDSA 2016 for disaggregated nutrition outcomes by region and department, mother education level, poverty levels, among others. 62 The department of Tarija, for example, offers health insurance (SUSAT) to population not covered by SUMI or SPPAM. It is financed with their high hydrocarbon revenues. The municipality of Santa Cruz de la Sierra has its own health insurance as well. 63 Social security entities opposed unification proposals because positive balance sheets provided low incentives to integrate with the rest of the insurance system. Increased revenues from progressive increases in minimum wage (from BO$400 in 2005 to BO$2,000 in 2017) and higher share of formal workers was not accompanied by increases in supply and health facility capacity. The network of public health facilities is much larger than that of social security’ (particularly in low-density population areas), and about 70 percent of health services are provided in public networks. There is no clear mechanism to cancel out imbalances (cross subsidies) coming from public sector providing health care services to social security beneficiaries, although the SICOF system can make that distinction. 64 See appendix D on comparison of public health insurance. Text of the Law is available at: https://www.minsalud.gob.bo/images/Documentacion/normativa/L475.pdf 65 The causes for low execution in small municipalities are structural. Small municipalities have overestimated population due to population influx during census periods, incentivized by the per capita basis of coparticipation funds. This contrasts with their limited capacity to respond to the health care needs of their populations, thus resulting in budget surplus. On the other hand, 15.5 percent increased financing is not enough for some municipalities with a high migration (La Paz, Santa Cruz de la Sierra) not only because their coparticipation funds are based on an inaccurate population count, but also because of the deficiencies of the reference and counter-reference systems, resulting in many patients seeking basic services in their tertiary hospitals. 66 See appendix I figure I.11 on Number of services provided by SUMI and Law 475/SIS. 67 See appendix H for detailed information systems supported by the project. 68 See appendix I figure I.12 on SOAPS/SICE implementation. 69 See ICR APL III p. 23 and p.43. 70 See appendix B figure X on growth and monitoring control in children under 2 in target.

69
Appendix A. Basic Data Sheet HEALTH SECTOR REFORM PROJECT – APL I (IDA Q0940, IDA 32440)
Table A.1. Key Project Data (amount in $ million)
Appraisal estimate
Actual or current estimate
Actual as % of appraisal estimate
Total project costs 44.0 26.26 60% Loan amount 25.0 21.93 88% Cofinancing -- -- --
Table A.2. Cumulative Disbursements, Estimated and Actual
FY99 FY00 FY01 FY02 FY03 FY04 Appraisal estimate ($M) -- 7.6 18.3 25.0 25.0 25.0 Actual ($M) -- 4.13 8.30 15.8 21.3 22.0 Actual as % of appraisal -- 54 % 45% 63% 85 % 88 % Date of final disbursement: April 30, 2004
Table A.3. Key Project Dates
Project stage Original date Actual date Initiating memorandum 07/30/1998 07/30/1998 Negotiations -- -- Board approval 06/15/1999 06/15/1999 Signing 06/25/1999 06/25/1999 Effectiveness 12/13/1999 12/13/2998 Closing date 12/31/2002 12/31/2003
Table A.4. Staff Time and Cost
Stage of project cycle
Staff time and cost (World Bank budget only) Staff weeks (number)
$ 000s (including travel and
consultant costs) Identification/Preparation 17 Appraisal/ Negotiation 12 Supervision 40 ICR 4 Total 73

70 APPENDIX A
Table A.5. Task Team Members Name Title Unit Lending Daniel Cotlear Sr. Health Economist -- Juan Pablo Uribe Senior Health Specialist -- Supervision/ICR Daniel Cotlear Sr. Health Economist LCHSD Juan Pablo Uribe Senior Health Specialist, TTL -- Patricia Alvarez Operations Officer -- Nicole Schwab Economist, Junior Professional Associate -- Sati Achath Consultant -- Mary Dowling Program Assistant -- Patricia Bernedo Program Assistant -- Monica Claros Team Assistant --
SECOND PHASE OF THE HEALTH SECTOR REFORM PROGRAM - APL II (IDA 3541A, IDA 35410) Table A.6. Key Project Data (amount in $ million)
Appraisal estimate
Actual or current
estimate Actual as % of
appraisal estimate
Total project costs 70.3 47.8 68% Loan amount 35.0 40.2 114% Cofinancing -- -- --
Table A.7. Cumulative Disbursements, Estimated and Actual
FY01 FY02 FY03 FY04 FY05 FY06 FY07 FY08 Appraisal estimate ($M) -- 7.61 17.41 27.84 35.0 35.0 35.0 35.0 Actual ($M) -- 0.50 3.6 9.5 19.3 30.0 35.4 40.2 Actual as % of appraisal -- 7 % 21% 34 % 55 % 86 % 101 % 115 % Date of final disbursement: November 7, 2008
Table A.8. Key Project Dates
Original date Actual date Initiating memorandum 04/23/2001 04/23/2001 Negotiations -- -- Board approval 06/28/2001 06/28/2001 Signing 08/31/2001 08/31/2001

71 APPENDIX A
Effectiveness 02/21/2002 02/21/2002 Closing date 06/30/2006 06/30/2008
Table A.9. Staff Time and Cost
Year and stage of project cycle
Staff time and cost (World Bank budget only) Staff weeks
(number) $ 000s (including travel and consultant costs)
Lending FY01 13 65.76 FY02 4 19.02 Total: 17 84.78 Supervision/ICR FY02 9 46.10 FY03 31 100.25 FY04 36 85.21 FY05 42 115.60 FY06 41 111.10 FY07 26 72.49 FY08 26 96.60 Total: 211 627.35
Table A.10. Task Team Members
Name Title Unit Supervision/ICR Patricia Alvarez Operations Officer LCSHE Carlos Marcelo Bortman Sr Public Health Spec. LCSHH Miriam Cespedes Procurement Assistant LCSPT Monica Claros Program Assistant LCCBO Maria Lucy Giraldo Senior Procurement
LCSPT
José Pablo Gomez-Meza Sr Economist (Health) LCSHH Lourdes Consuelo Linares Sr Financial Management
LCSFM
Zulma Elizabeth Ortiz Consultant CSEBL Vladimir Pary E T Consultant LCSAR Ximena B. Traa-Valarezo E T Consultant LCSSO Victor Villegas Consultant LCSHE Jorge Villena Consultant LCSHH

72 APPENDIX A
EXPANDING ACCESS TO REDUCE HEALTH INEQUITIES PROJECT – APL III (IDA 43820) Table A.11. Key Project Data (amount in $ million)
Appraisal estimate
Actual or current estimate
Actual as % of appraisal estimate
Total project costs 26.2 16.5 89 % Loan amount 18.5 10.3 56 % Cofinancing -- -- --
Table A.12. Cumulative Disbursements, Estimated and Actual
FY07 FY08 FY09 FY10 FY11 FY12 FY13 FY14 FY15 FY16 Appraisal estimate ($M) -- -- 2.08 6.16 10.24 13.32 16.42 18.50 18.50 18.50 Actual ($M) -- -- 0.00 0.30 1.31 2.6 3.3 6.4 9.67 10.28 Actual as % of appraisal -- -- 0.00 5% 13% 20% 20% 35% 52% 56% Date of final disbursement: April 30, 2016
Table A.13. Key Project Dates
Project stage Original date Actual date Initiating memorandum 07/07/2006 09/05/2007 Negotiations 03/15/2007 12/07/2007 Board approval 05/15/2007 01/24/2008 Signing 09/30/2008 09/10/2008 Effectiveness 06/19/2009 06/19/2009 Closing date 01/31/2014 12/31/2015

73 APPENDIX A
Table A.14. Staff Time and Cost
Year and stage of project cycle
Staff time and cost (World Bank budget only) Staff weeks (number) $ 000s (including travel and
consultant costs) Lending FY07 17.27 101.19 FY08 18.94 120.43 Total: 36.21 221.62 Supervision/ICR FY08 6.08 13.01 FY09 27.81 29.70 FY10 23.73 96.13 FY11 28.25 121.52 FY12 30.80 149.78 FY13 29.18 123.24 FY14 33.56 182.04 FY15 32.52 158.79 FY16 21.26 114.18 Total: 233.19 988.39
Table A.15. Task Team Members
Name Title Unit Lending Marcelo Bortman Task Team Leader - Senior Public Health
GHN04
Keith Hansen Vice President GGHVP Daniel Cotlear Lead Economist GHN04 Fabiola Altimari Montiel Senior Counsel LEGLE Xiomara Morel Lead Financial Management Specialist GGO22 Patricia De la Fuente Hoyes Senior Financial Management Specialist GGO22 Lourdes Consuelo Linares Senior Financial Management Specialist GGO22 Luis M. Schwarz Senior Finance Officer WFALA Luz Zeron Senior Financial Management Specialist GGO22 Maria Lucy Giraldo Senior Procurement Specialist LCSPT Ximena B. Traa-Valarezo Social Evaluation Specialist GWADR Jorge Villena Chavez Environment Specialist LCSHD Patricia Alvarez Senior Operations Officer GED04 Jose Pablo Gomez-Meza Sr. Economist -Health LCSHH Julio Velasco Research Analyst GMF04

74 APPENDIX A
Julio Loayza Senior Economist GMF04 Maria Alejandra Velasco Operations Analyst LCCBO Patricia Orna Language Program Assistant GSP04 Miriam Cespedes Program Assistant GGODR Monica Claros Team Assistant LCSHD Teddy Ernesto Landaeta Consultant LCCBO Javier Jahnsen Consultant LCSHD Cecilia Lorena Brady Consultant LCSH Supervision/ICR
Marcelo Bortman Task Team Leader - Senior Public Health Specialist GHN04 Amparo Gordillo-Tobar Task Team Leader - Senior Economist – Health GHN04 Andre Medici Task Team Leader Senior Economist – Health GHN04 Patricia Alvarez Senior Operations Officer GED04 Lourdes Consuelo Linares Senior Financial Management Specialist GGO22 Patricia De la Fuente Hoyes Senior Financial Management Specialist GGO22 Tatiana Perez Financial Specialist Consultant GGO22 Álvaro Larrea Lead Procurement Specialist GGO04 Jose Rasmussen Senior Procurement Specialist GGO04 Julio Sanjines Senior Procurement Specialist GGO04 Monica Tambucho Senior Finance Officer WFALN Maria Virginia Hormazabal Finance Officer WFALN Renata Pantoja Financial Analyst WFALN Elena Segura Senior Counsel LEGLE Maria Alejandra Velasco Operations Analyst LCCBO Susana Perez Executive Assistant LCCBO Patricia Orna Language Program Assistant GSP04 Gabriela Moreno Program Assistant GHN04 Miriam Cespedes Program Assistant GGODR Monica Claros Program Assistant LCCBO Carla Jerez Team Assistant LCCBO Patricia Velasco Team Assistant LCCBO Cristian Pereira Consultant GEDDR Tatiana Duran Consultant GEDDR Maria Lucy Giraldo Consultant GGODR Victor Villegas Consultant GHNDR Luis Eduardo Santalla Consultant LCSFM

75
Appendix B. Methodology Evaluation Questions, Data, and Collection Methods
1. Evaluation questions. This multiproject PPAR aims to shed light on the effectiveness, consolidation, and sustainability of the whole APL program and its investments to secure maternal and child health outcomes. The evaluation questions are closely aligned to the PPAR methodology guidelines and standards.
2. The following are examples of those questions: (1) What has been the relevance of the projects’ objectives? Are they still relevant today? (2) What was the relevance of the projects’ design? (3) What has the World Bank contributed to the achievement of the project objectives? (that is, efficacy assessment); (4) To what extent did the projects achieve their objectives efficiently? and so forth.
3. The APL program and individual project objectives are shown in table B.1.
Table B.1. Identification of Objectives Development Credit
Agreement PAD ICRR This multiproject PPAR
APL1 Program objectives: Helping to reduce the infant
mortality rate Program objectives: Program objectives for APL
series: To reduce infant, child, and maternal mortality rates
PDO: reduce the rates of child and infant mortality
PDO: Reduce the infant mortality rate, through two strategies: (i) to increase coverage and quality of health services, and to empower communities to improve their health status; and (ii) to strengthen local capacity to respond to health needs
PDO: Less clear (no efficacy subratings). ICRR analyzed: 1. Reduction in infant mortality 2.Reduction in maternal mortality 3. Improvements in service coverage and quality and empowerment of communities 4. Strengthening local capacity
PDO: 1. Reduce the rates of child and infant mortality 2. Increase coverage of health services. 3. Increase quality of health services 4. Empower communities to improve their health status 5. Strengthen local capacity to respond to health needs
APL2 Program objectives: To help reduce the infant
mortality rate To reduce infant mortality in Bolivia
PDO: To reduce the rate of infant mortality in Bolivia by extending the coverage and quality of the Borrower’s health services and strengthening local capacity to respond to health needs
PDO: To increase coverage and quality of health services and related programs that would improve the health of the population, and to empower communities to improve their health status; and to strengthen local capacity to respond to health needs
PDO: 1.Reduction of infant mortality 2.Extending overage of health services 3. Extending quality of health services 4.Strengthening Local Capacity to respond to health needs
PDO: 1. Reduce the rate of infant mortality 2. Increase coverage of health services 3. Increase quality of health services 4. Strengthen local capacity to respond to health needs
APL3 Program objectives: Program objectives: reducing
Bolivia’s infant mortality rate. Also “reducing infant and
Program objectives: Reduction of infant, child and maternal mortality rates

76 APPENDIX B
maternal mortality rates by one-third” as per annex p.37
PDO: 1. Reduce occurrence of critical risk factors affecting maternal and infant health in the Target Areas so that current gaps between regions are reduced 2. Reduce chronic malnutrition among children under 2 years of age in the Target Areas 3. Increase health insurance coverage in the Target Areas 4. Upgrade the SNIS so that it will be integrated with the Recipient’s new health insurance program
PDO: 1. Reduce occurrence of critical risk factors affecting maternal and infant health in the targeted areas so that current gaps between regions are reduced 2. Reduce chronic malnutrition among children under 2 years of age in the targeted areas 3. Increase health insurance coverage in the targeted areas 4. Upgrade the National Health Information System (Sistema Nacional de Información en Salud, SNIS) so that it will be integrated with Bolivia’s new health insurance program
PDO: Same as before (left)
PDO: Same as before (left)
4. To answer these questions, the PPAR team sought to improve its understanding of key project dimensions, which are important building blocks of the theory of change toward the achievement of project objectives:
a. The achievements and sustainability of efforts made toward strengthen the immunization program (for example, line item in national budget, tax proceed earmarked for vaccine purchases, government financing versus donors), and the role of other donors.
b. The World Bank’s influence in the sustainability and effectiveness of results-based approaches governing relationships between the Ministry of Health and Health Departments (that is, performance agreements).
c. The evolution and impacts of public health insurance programs (SBS, SUMI, SUS, including the EXTENSA) and implementation challenges facing in the implementation of the health insurance program established by Law 475 approved in December 2013.
d. Allocation and implementation of subprojects by the FPS to support supply-side (rehabilitation) and demand-side (social communication) interventions to enhance the quality of maternal and child services.
e. The advances in health management information systems and strengthening of the SNIS, including the implementation of Carpeta Familiar.
f. The fundamental role of the La Paz Children’ Hospital to provide hematologic services specially for the poor, and its alignment with overall APL III design.
5. While these dimensions are not exhaustive, they are the most salient features of the APL program, and are the foundation of the projects’ objectives. Points b, c, d, and e represent building blocks for the efforts toward strengthen local capacity to respond to health needs (and for enhancing coverage and quality of health care). While both APL I and APL II phases had strengthening local needs as an objective, its conceptualization in project design

77 APPENDIX B
differs. In the first phase, it referred to supporting implementation of the SBS, development of a health management information system, and focusing on accountability of the health districts through performance agreements. In the second phase, it continued to be related to the SBS, but it also included the expansion of SBS/SUMI coverage through health mobile teams (EXTENSA), and support for infrastructure through subprojects to enhance structural quality of health services, which is another way to strengthen local capacity to respond to health needs.
6. Data sources and collection methods. The main data sources and collection methods used in this PPAR were:
• Review of World Bank Group documents (project documents and Bank Group strategies, among others) and external academic and policy literature, such as impact evaluations on public health insurance, and country National Development Plans.
• Interviews with internal and external stakeholders (World Bank staff, government, donors, beneficiaries).
• Secondary data sources (WDI, SNIS, DHS) disaggregated by population subgroups and target municipalities when available (see Appendixes C and I).
• Site visits to health facilities (including the Children’s Hospital in La Paz) and local government SEDES.
Table B.2. Evaluation Matrix for Projects’ Development Outcomes
Data collection methods
Revie
w of
pr
ojec
t do
cum
ents
Revie
w of
Wor
ld
Bank
Gro
up
stra
tegi
es
Revie
w of
ac
adem
ic an
d po
licy l
itera
ture
(N
DP)
Inte
rview
s with
st
akeh
olde
rs
Seco
ndar
y dat
a so
urce
s
Site
visit
s
Relevance Relevance of objectives
YES YES YES YES
Relevance of design
YES YES YES YES (f)
Efficacy Program objectives for APL series: To reduce infant, child, and maternal mortality rates
YES YES [WDI, SNIS, DHS]
APL I & APL II 1.To Increase coverage of health services
YES YES (c) YES (a) YES [WDI, SNIS, DHS]
2.To increase quality of health services
YES YES (d) YES (d) [SNIS, DHS]
YES (d)
3.To empower communities to improve their health status
YES YES (d) YES (c,d) YES (d)
4.To strengthen local capacity to
YES YES (a,b,c,d,e) YES (a,b,c,d,e) [SNIS, FPS]
YES (b,d,e)

78 APPENDIX B
respond to health needs APL III 1.To reduce occurrence of critical risk factors affecting maternal and infant health in the targeted areas so that current gaps between regions are reduced
YES YES (a,c,f) YES (a,c,f) [SNIS, DHS]
YES (f)
2.To reduce chronic malnutrition among children under 2 years of age in the targeted areas
YES YES [parallel programs: conditional
cash transfer]
YES YES [WDI, SNIS, DHS]
3.To increase health insurance coverage in the targeted areas
YES YES (c,e) YES (c,e) YES (c,e) [SNIS, DHS]
4.To upgrade the National Health Information System (Sistema Nacional de Información en Salud, SNIS) so that it will be integrated with Bolivia’s new health insurance program
YES YES (e) YES (e)
Efficiency Quantitative and Qualitative Efficiency
YES YES
Notes: a. The achievements and sustainability of the efforts made toward strengthen the PAI (for example, line item in national budget, tax proceeds earmarked for vaccine purchases, government financing versus donors), and the role of other donors. b. The World Bank’s influence in the sustainability and effectiveness of results-based approaches governing relationships between the Ministry of Health and Health Departments (that is, performance agreements). c. The evolution and impacts of public health insurance programs (SBS, SUMI, SUS, including the EXTENSA). d. Allocation and implementation of subprojects by the FPS to support supply-side (rehabilitation) and demand-side (social communication) interventions to enhance the quality of maternal and child services. e. The advances in SNIS, including the implementation of Carpeta Familiar. f. The fundamental role of the La Paz Children’ Hospital to provide hematologic services specially for the poor, and alignment with project design.

79 APPENDIX C
Appendix C. Economic, Social, and Health Indicators Table C.1. Health Indicators for Bolivia, 1996–2016
Indicator 1996 1997 1998 1999 2000 2001 2002 2003 2004 2005 2006 2007 2008 2009 2010 2011 2012 2013 2014 2015 2016 (p) Coverage and Quality in Service Provision Beneficiary population for Short-Term Social Insurance 1,766,036 2,011,698 1,989,900 2,013,318 2,146,280 2,255,510 2,311,266 2,445,892 2,627,658 2,629,231 2,796,842 3,018,272 3,066,598 3,131,733 3,617,293 3,647,093 3,964,983 4,139,345 4,042,101 4,011,797 4,208,144 Coverage of institutional deliveries (%) (1) 32.6 39.2 42.0 47.0 54.0 56.0 58.0 59.0 60.0 61.9 64.6 63.9 65.0 67.0 69.9 72.8 70.8 72.5 72.2 87.5 85.2 Coverage of adequate prenatal care (%) (1) 26.0 28.0 30.0 31.0 33.0 35.0 34.0 37.0 40.0 44.3 48.9 46.6 46.6 59.1 58.3 58.6 60.3 67.3 68.7 74.8 76.2 Coverage of immunization with 3rd doses of DPT/Pentavalent in children under 1 (%) (1) 70.6 77.5 76.9 85.0 91.0 92.0 88.0 81.0 85.0 84.5 83.1 81.7 83.4 84.5 80.6 83.1 79.7 81.4 86.1 88.6 87.4 Coverage of acute diarrheal diseases (ADDs) care in children under 5 (%) (1) 21.2 25.7 28.5 31.3 37.0 35.0 39.0 43.0 46.0 45.9 47.3 46.9 48.1 46.2 43.6 43.8 49.2 49.6 50.8 49.9 46.3 Coverage of pneumonia care in children under 1 (%) (1) 8.4 14.0 14.0 15.3 17.0 20.0 20.0 20.0 25.0 23.1 24.1 28.6 29.3 29.5 19.5 17.1 18.0 19.3 17.4 15.4 13.9 Annual Parasite Index (API) (per 1,000 inhabitants) (2) 19.4 17.1 24.8 14.3 8.4 4.6 4.0 5.8 4.4 5.5 5.2 4.0 2.8 2.8 3.9 2.0 2.1 1.6 1.6 1.6 1.3 Spraying actions against Chagas (3) 20,570 24,244 11,740 97,667 181,072 333,621 149,388 672,456 171,860 211,368 66,632 30,835 20,825 44,080 23,466 42,388 n.a. n.a. n.a. n.a. n.a. Percentage of women of reproductive age with adequate family planning counseling (4) n.a. n.a. n.a. n.a. n.a. 22.0 25.0 25.0 25.0 27.2 27.1 29.2 30.0 28.1 25.1 25.7 26.6 24.8 n.a. n.a. n.a. Physical Resources (5) Number of inhabitants per health facility 4,112 3,899 3,788 3,684 3,645 3,567 3,456 3,383 3,426 3,216 3,112 3,041 3,003 2,973 2,941 2,901 2,895 2,893 2,862 2,853 2,836 Number of inhabitants per 1st level health facility (6) 4,483 4,243 4,118 3,997 3,949 3,866 3,737 3,667 3,691 3,509 3,414 3,327 3,283 3,237 3,212 3,156 3,161 3,156 3,116 3,106 3,064 Number of inhabitants per 2nd and 3rd level health facility (7) 49,745 48,131 47,266 47,026 47,347 46,119 45,957 43,599 47,806 38,455 35,166 35,369 35,309 36,422 34,949 35,883 34,504 34,679 35,085 35,032 38,011 Number of inhabitants per hospital bed 992 951 959 961 984 998 1,011 991 1,035 952 950 927 944 972 965 973 n.a. n.a. n.a. n.a. n.a. Human Resources (8) Number of physicians per 10.000 inhabitants n.a. n.a. 2.6 2.7 2.6 2.9 2.8 2.8 2.8 2.8 3.0 3.3 4.0 n.a. n.a. n.a. n.a. n.a. n.a. n.a. n.a. Financial Resources (9) Current health expenditures, per capita (in $) 27.6 29.5 30.4 28.5 21.0 23.3 20.7 25.2 20.6 29.0 29.8 32.1 n.a. n.a. n.a. n.a. n.a. n.a. n.a. n.a. n.a. Health Investment expenditures, per capita (in $) 4.1 4.2 4.3 5.0 6.6 4.7 3.6 3.2 4.4 6.4 6.4 7.3 n.a. n.a. n.a. n.a. n.a. n.a. n.a. n.a. n.a. Total health expenditures, per capita (in $.) 31.6 33.7 34.8 33.5 27.7 28.0 24.3 28.4 25.0 35.4 36.1 39.4 n.a. n.a. n.a. n.a. n.a. n.a. n.a. n.a. n.a.
Source: Table extracted from UDAPE (2016) Dossier of Social and Economic Statistics for years 1996 to 2015, translated by the PPAR team. Sources used include INE, Ministry of Health, SNIS, and National Institute of Health Insurance (INASES). Information regarding financial resources was obtained from the Vice-Ministry of Public Investment and External Financing (VIPFE) and the Unit of Fiscal Programming (UPF). (1) Information for 1996–2005 was obtained from the Health Reform Project, Ministry of Health. Starting from 2006 the source is SNIS; the denominator was updated with INE’s population projections. Coverage of deliveries for 2015 was calculated with denominators estimated by INE and adjusted by SNIS; while coverage of prenatal care for 2009–2015 was recalculated with new denominators. (2) Information from the National Malaria Program. (3) Information from the National Chagas Program. (4) Information from SNIS. (5) Data was obtained from INE’s “Anuario Estadístico 2010.” 2011–2013 information comes from SNIS. (6) First-level facilities are health centers and health posts. (7) Second-level (basic hospital) and third-level facility (general hospital and specialized institute). In 2006, second-level health facilities also include health center hospitals and third-level facilities also included specialty hospitals, departmental reference hospital, and health insurance reference hospitals. (8) Information from the salary scale of the Ministry of Health. (9) Current and investment expenditures, for 1996–1999 information from UPF-VIPFE was used, and for 2000–2007 information from the Vice-Ministry of Budget and Public Accounting was used. (p) Preliminary. (n.a.) Not available. Note: Population used to calculate the indicators for physical, human, and financial resources comes from the INE’s population projections. Definitions: Coverage of institutional deliveries = Number of deliveries attended by a doctor or nurse/Number of expected deliveries Coverage of adequate prenatal care = Number of pregnancies with 4 prenatal controls/Number of expected pregnancies Coverage of DPT3 immunization = Children with 3rd doses of DPT vaccine/Population of children under 1 Coverage of ADD care = Number of ADD cases attended/Population of children under 5 Coverage of pneumonia care = Children under 1 who received attention for pneumonia /Population of children under 1 Annual Parasite Index (API) = Cases of malaria attended/Exposed population

80 APPENDIX C
Table C.2. Health Indicators: Bolivia and Latin America and the Caribbean, 1991–2015
Indicator Bolivia Latin America and the Caribbean
1991–1995 1996–2000 2001–2005 2006–2010 2011–2015 1991–1995 1996–2000 2001–2005 2006–2010 2011–2015 Economic and Poverty GDP growth (annual %) 4.11 3.46 3.10 4.60 5.49 3.20 2.78 2.65 3.97 2.14 GINI index (World Bank estimate) ... 60 58 53 47 ... ... ... ... ... GNI per capita, PPP (constant 2011 international $) 3,813 4,278 4,381 4,958 5,764 9,829 10,502 10,736 12,440 13,716 Inflation, consumer prices (annual %) 12.0 6.3 3.1 6.6 6.0 15.4 7.7 5.6 5.3 4.1 Population, total (in million) 7.3 8.0 8.8 9.6 10.4 446.6 485.2 521.0 555.8 590.2 Poverty headcount ratio at national poverty lines (% of population) ... 66.4 62.3 57.2 41.0 ... ... ... ... ... Health Status: Mortality Life expectancy at birth, total (years) 57 60 62 65 68 69 71 72 74 75 Maternal mortality ratio (modeled estimate, per 100,000 live births) 407.8 352.6 317.2 276.4 222.8 127.0 112.4 93.0 86.4 74.0 Maternal mortality ratio (national estimate, per 100,000 live births) 360.0 ... 208.0 268.0 ... ... ... ... ... ... Mortality rate, infant (per 1,000 live births) 77.1 63.8 51.1 40.1 32.7 39.6 31.3 24.6 20.0 16.7 Mortality rate, under-5 (per 1,000 live births) 110.2 88.3 68.2 51.9 41.3 49.3 38.2 29.4 24.3 19.6 Health Systems: Financing Health expenditure, public (% of total health expenditure) 56.6 61.0 64.6 68.1 69.8 47.7 48.1 47.9 48.8 50.7 Health expenditure, total (% of GDP) 3.7 5.2 5.8 5.3 5.8 6.3 6.3 6.4 7.1 7.1 Out-of-pocket health expenditure (% of total expenditure on health) 33.3 31.8 28.4 26.6 24.7 39.8 38.9 40.4 35.9 31.3 Risk Factors: Nutrition and Environmental Low-birthweight babies (% of births) 8.2 6.9 7.3 6.0 ... ... ... ... 9.0 ... Prevalence of stunting, height-for-age (% of children under 5) 35.2 33.1 32.5 27.2 ... ... ... ... ... ... Prevalence of underweight, weight for age (% of children under 5) 11.1 5.9 5.9 4.5 ... ... ... ... ... ... Improved sanitation facilities (% of population with access) 31.3 35.9 40.4 44.9 49.1 68.5 72.3 75.7 78.8 81.7 Improved water source (% of population with access) 71.8 76.7 81.2 85.4 89.1 86.1 88.4 90.5 92.4 94.0 Service Coverage: Immunization, Maternal, Newborn and Child Immunization, DPT (% of children ages 12-23 months) 52.4 66.4 81.0 87.8 95.8 79.0 85.8 92.1 93.0 90.8 Immunization, HepB3 (% of one-year-old children) ... 77.0 80.6 87.8 95.8 ... 84.4 90.1 93.0 90.7 Immunization, measles (% of children ages 12-23 months) 58.0 68.0 90.8 89.4 97.0 82.4 89.8 93.6 94.1 93.3 Antenatal care (any skilled personnel) (% of women with a birth): Q1 (lowest) 22.9 51.7 63.4 79.1 ... ... ... ... ... ... Antenatal care (any skilled personnel) (% of women with a birth): Q5 (highest) 92.7 97.9 97.8 97.4 ... ... ... ... ... ... ARI treatment (% of children under 5 taken to a health provider) 40.0 48.3 51.5 58.6 61.6 ... ... ... ... ... Assistance during delivery (any skilled personnel) (% of births): Q1 (lowest) 11.4 23.2 28.9 39.4 ... ... ... ... ... ... Assistance during delivery (any skilled personnel) (% of births): Q5 (highest) 96.6 97.7 98.7 98.8 ... ... ... ... ... ...

81 APPENDIX C
Births attended by skilled health staff (% of total) 47.2 63.3 63.0 71.1 84.4 ... 86.9 ... ... 94.0 Diarrhea treatment (% of children under 5 receiving oral rehydration and continued feeding) ... 46.5 53.7 29.0 ... ... ... ... ... ...
Diarrhea treatment (% of children under 5 who received ORS packet) 33.4 27.4 28.8 34.9 22.3 ... ... ... ... ... Pregnant women receiving prenatal care (%) 52.5 75.8 79.1 85.8 90.1 ... ... ... ... 96.9 Prevalence of acute respiratory infection (ARI) (% of children under 5): Q1 (lowest) ... 20.1 21.3 24.0 ... ... ... ... ... ...
Prevalence of acute respiratory infection (ARI) (% of children under 5): Q5 (highest) ... 13.9 21.2 17.1 ... ... ... ... ... ...
Prevalence of diarrhea (% of children under 5): Q1 (lowest) ... 23.9 25.0 30.4 ... ... ... ... ... ... Prevalence of diarrhea (% of children under 5): Q5 (highest) ... 12.9 15.2 19.5 ... ... ... ... ... ... Vitamin A supplementation coverage rate (% of children ages 6-59 months) ... 56.0 38.4 38.8 34.0 ... ... ... ... ...
Source: World Development Indicators, January 2018.
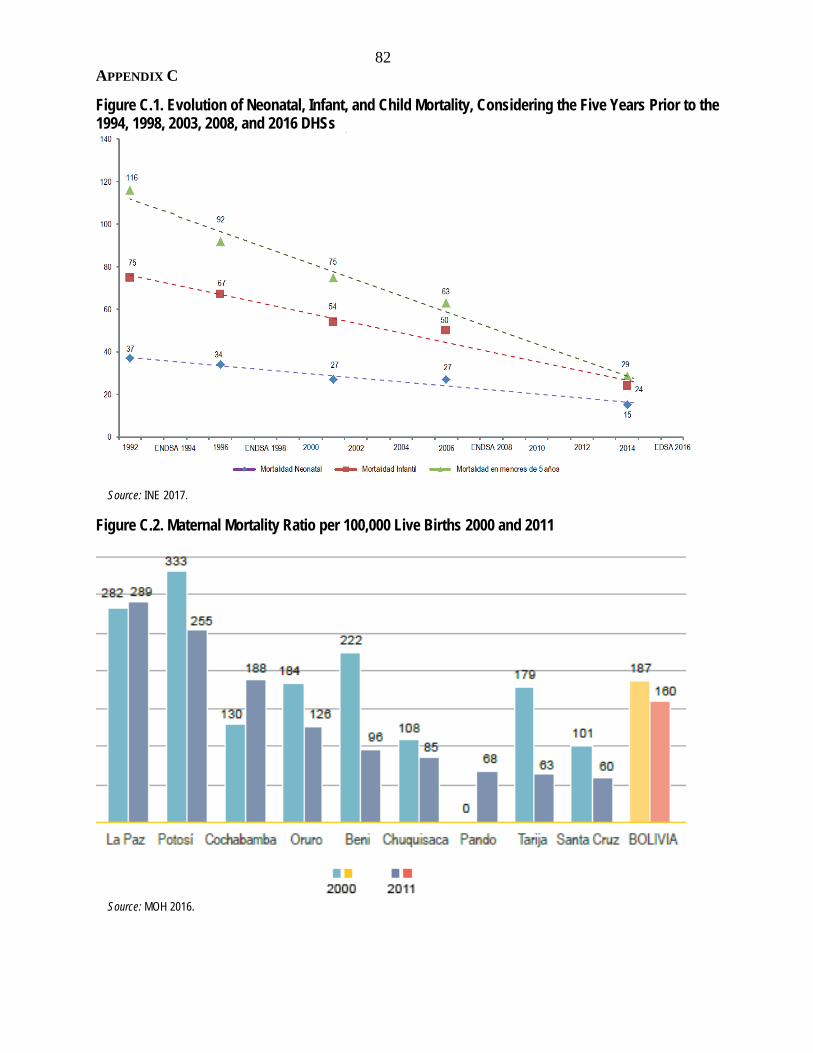
82 APPENDIX C
Figure C.1. Evolution of Neonatal, Infant, and Child Mortality, Considering the Five Years Prior to the 1994, 1998, 2003, 2008, and 2016 DHSs
Source: INE 2017.
Figure C.2. Maternal Mortality Ratio per 100,000 Live Births 2000 and 2011
Source: MOH 2016.

83
Appendix D. Bolivia: Comparison of Public Health Insurance Schemes Table D.1. Bolivia: Comparison of Public Health Insurance Schemes
SNMN National Maternal and Child
Insurance
SBS Basic Health Insurance
SUMI Universal Mother-Child
Insurance
SSPAM Health Insurance for the
Senior Citizen
SIS Integral Health Insurance
Decree 24303 Decree 25265 Law 2426 Law 3323 Law 475
July 1996 December 1998 November 2002 January 2006 December 2013 Objectives Reduce maternal and infant
mortality Warrant access to a package of preventive and curative health care services with a focus of reducing maternal and infant mortality
Provide health care services at all levels to pregnant women, since conception until 6 months after delivery; and to children under 5; reduce financial constraints to access to health care services
Provide health care services free of charge at all levels of care to citizens older than 60 years old without other insurance coverage
Establish and regulate integral access to health care services and financial protection of beneficiary population without short-term social insurance
Beneficiary population Women, children under 5
Women in reproductive age, children under 5, general population
Pregnant women until 6 months after delivery, and children under 5
Population above 60 Pregnant women until 6 months after delivery, children under 5, population above 60, reproductive age women on reproductive health services, people with disabilities
Number of health care services covered
32 92 547 n.a. +1,200
Financing Municipalities: 3.2% of 85% of coparticipation revenues
Municipalities: 6.4% of 85% of coparticipation revenues
Municipalities: 10% of all coparticipation revenues
Municipal resources from hydrocarbon taxes
Municipalities: 15.5% of all coparticipation revenues
Providers Public health facilities and those from Social Security; churches and NGOs through special agreements
Public health facilities and those from Social Security; other providers through special agreements
Mobile health brigades. Public health facilities and those from the Social Security. Churches, NGOs, private nonprofits, and traditional medicine through special agreements
Mobile health brigades. Public health facilities and those from the Social Security. Churches, NGOs, private nonprofits, and traditional medicine through special agreements
Source: PAHO (2007); Law 475

84
Appendix E. Key Performance Indicators and Results Framework Table E.1. Key Performance Indicators for APL I
Indicator Baseline
APL I target
Project-end value
Current value
1998 2002 2002 2016 1. Coverage of births attended by trained health personnel 36% 46% 54% 85.2% 2. Complete prenatal care attendance * 28% 40% 34% 76.4% 3. Early neonatal hospital mortality (per 1,000 live births) ** 14 11 7 10 4. Number of pneumonia cases attended in health services 68,346 115,000 128,244 81,323 5. Number of diarrhea cases attended in health services *** 292,417 400,000 426,697 562,228 6a. Three doses DPT coverage 75% - - - 6b. DPT/Hib/Hepatitis B vaccine coverage with three doses - 85% 100% 87% 7a. Number of municipalities with three doses DPT coverage less than 80% 212 - - - 7b. Number of municipalities with DPT/Hib/Hepatitis B vaccine coverage of less than 80% - 83 53 186
8. National financing of vaccines (millions of $) **** 0.5 4.0 3.3 n.a. Source: World Bank 1999b, 2004b. 2016 values for indicators 1 and 2 were provided by SNIS, the rest were calculated by the PPAR team using administrative data from SNIS reporting systems. Notes: Indicators 6a and 7a were to be phased out as Bolivia introduced the pentavalent vaccine. The current value for this indicator refers to indicators 6b and 7b. * The denominator of this indicator changed during the APL II, from “number of pregnant women with first prenatal care control,” to “number of expected births.” The current value for this indicator refers to the latter. ** The scope of this indicator changed from “second and third level health facilities,” “ten largest maternities,” to “15 selected hospitals.” The current value for this indicator refers to the latter. *** The ICR reported 2001 values for this indicator. **** No information available for current levels of financing. According to a Ministry of Health document, the ministry fulfills the internal financing requirements established in the Vaccines Law (Law 3300). The presentation shows the amount BOB 87.9 million for 2016 ($12.7 million), but it is not clear whether this corresponds to total PAI budget, which part corresponds to the financing of vaccines, or the amount that is nationally financed. (See the presentation at: https://www.minsalud.gob.bo/transparencia/unidad-de-transparencia/rendicion-de-cuentas.)
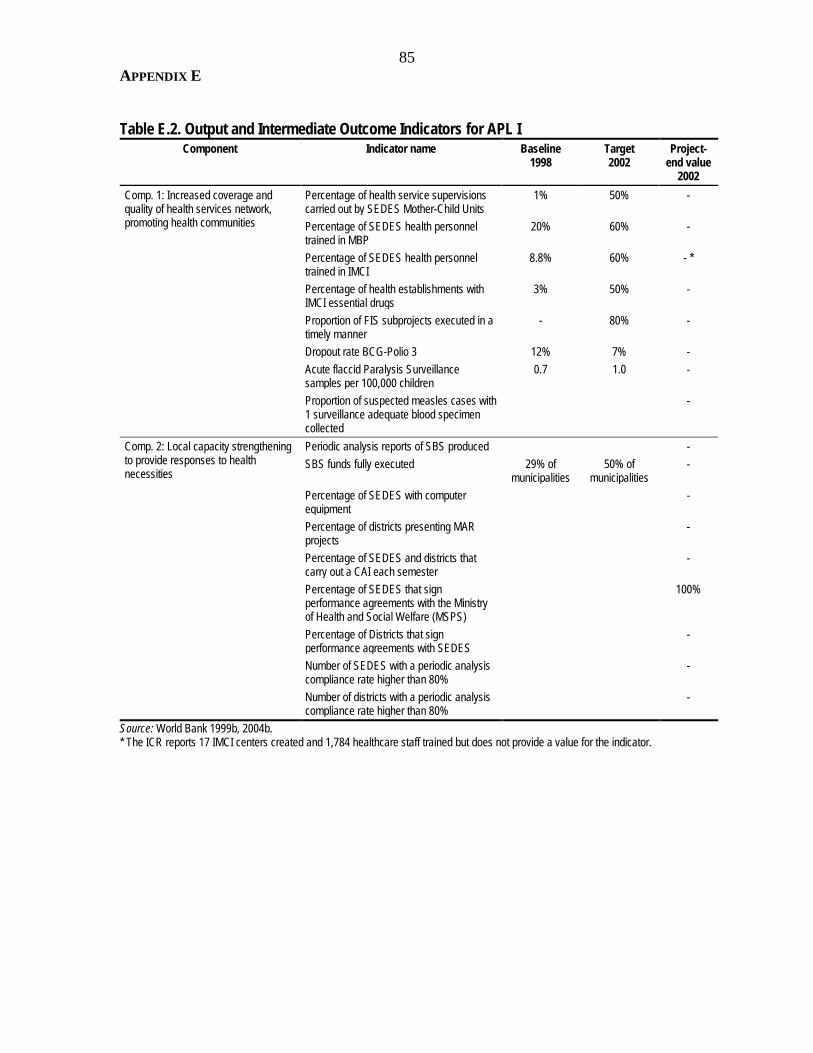
85 APPENDIX E
Table E.2. Output and Intermediate Outcome Indicators for APL I
Component Indicator name Baseline 1998
Target 2002
Project-end value
2002 Comp. 1: Increased coverage and quality of health services network, promoting health communities
Percentage of health service supervisions carried out by SEDES Mother-Child Units
1% 50% -
Percentage of SEDES health personnel trained in MBP
20% 60% -
Percentage of SEDES health personnel trained in IMCI
8.8% 60% - *
Percentage of health establishments with IMCI essential drugs
3% 50% -
Proportion of FIS subprojects executed in a timely manner
- 80% -
Dropout rate BCG-Polio 3 12% 7% - Acute flaccid Paralysis Surveillance samples per 100,000 children
0.7 1.0 -
Proportion of suspected measles cases with 1 surveillance adequate blood specimen collected
-
Comp. 2: Local capacity strengthening to provide responses to health necessities
Periodic analysis reports of SBS produced - SBS funds fully executed 29% of
municipalities 50% of
municipalities -
Percentage of SEDES with computer equipment
-
Percentage of districts presenting MAR projects
-
Percentage of SEDES and districts that carry out a CAI each semester
-
Percentage of SEDES that sign performance agreements with the Ministry of Health and Social Welfare (MSPS)
100%
Percentage of Districts that sign performance agreements with SEDES
-
Number of SEDES with a periodic analysis compliance rate higher than 80%
-
Number of districts with a periodic analysis compliance rate higher than 80%
-
Source: World Bank 1999b, 2004b. * The ICR reports 17 IMCI centers created and 1,784 healthcare staff trained but does not provide a value for the indicator.

86 APPENDIX E
Table E.3. Key Performance Indicators for APL II Indicator
Baseline
APL II target
Project-end value
Current value
2001 2007 2007 2016 1. Coverage of births attended by trained health personnel 51% 66% 64% 85.2% 2. Complete prenatal care attendance 43% 57% 53% 76.4% 3. Early neonatal hospital mortality in 15 selected hospital (per 1,000 live births)
17 11 11 10
4. Number of pneumonia cases attended in health services 124,849 157,976 156,975 81,323 5. Percent of children of less than five years with three iron doses 2% 41% 46% 58% 6. DPT/Hib/Hepatitis B vaccine coverage with three doses 92% 90% 82% 87% 7. Number of municipalities with DPT/Hib/Hepatitis B vaccine coverage of less than 80%
75 25 150 186
8. National financing of vaccines (millions of $) * 2 6.5 8.4 n.a. Source: World Bank 2009. 2016 values for indicators 1 and 2 were provided by SNIS, the rest were calculated by the PPAR team using administrative data from SNIS reporting systems. * No information available for current levels of financing. According to a Ministry of Health document, the ministry fulfills the internal financing requirements established in the Vaccines Law (Law 3300). The presentation shows the amount BOB 87.9 million for 2016 ($12.7 million), but it is not clear whether this corresponds to total PAI budget, which part corresponds to the financing of vaccines, or the amount that is nationally financed. (See the presentation at: https://www.minsalud.gob.bo/transparencia/unidad-de-transparencia/rendicion-de-cuentas.)
Table E.4. Output and Intermediate Outcome Indicators for APL II Component
Indicator name
Baseline 2001
Target 2007
Project-end value 2007
Comp. 1: Coverage and quality improvements of the health services and empowerment of communities
I.A. Strengthening of the Basic Health Insurance Program Improved estimates of health indicators available regularly
SNIS made some progress in gathering and processing data in a timely manner
Financial audits of SBS available regularly Only sporadic audits were undertaken signaling severe problems in some municipalities
SBS funds fully executed 70% of municipalities
For the period 2003-2006, funds executed averaged between 85 and 90% for the three sources available
Priority innovations for SBS designed Management schemes and payment systems implemented
Publication of protocols for SBS interventions Protocols published and distributed Percentage of districts and municipalities that carry out a CAI each semester
-
Accreditation and licensing of primary providers implemented
94 hospitals evaluated – 34 accredited 1,000 health centers evaluated – 310 accredited
Number of Pregnant Women’s Bill of Rights signed - Number of defense advocates trained - I.B. National Programs Share of suspect measles cases with adequate blood sample
> 80% 90% average for 2003-07
AFP rate for <5 year 1/100,000 - Percent of localities where the Expanded Program on Immunization’s logistical software was implemented
80% Most localities processing information manually

87 APPENDIX E
Multidonor programs produced and monitored for nutrition activities, IMCI and medical waste management
-
60% of community agents trained and supervision activities carried out at midterm, including pathological residues and nutritional practices
More than 60% of community agents were trained
Comp. 2: Local capacity to respond to health needs of the population
II.A. National Program of Coverage Extension Targeting completed EXTENSA was implemented in
targeted municipalities TA requests for identified municipalities completed At least 80% - Investment needs for identified municipalities completed
FPS completed all projects for identified municipalities
Programmed municipalities provided with resources, training, support, and monitored
100% -
Percentage of SEDES and districts included in EXTENSA that carry out a CAI each semester
> 80% -
II.B. Investment subprojects to expand the coverage of the SBS Percentage of municipalities included in EXTENSA presenting FPS projects
> 40% 45% during 2003–07
Percentage of FPS subprojects completed within the projected time
> 50% -
Comp. 3: Project coordination and performance agreements
Percentage of SEDES that sign performance agreements with MSPS
100% 80% in 2007
Percentage of districts included in EXTENSA that sign performance agreements with SEDES
100% 55% in 2007
Percentage of SEDES with a performance agreement that show compliance rate higher than 80%
At least 80% On average, compliance rate during 2002–07 was slightly below 50%
Percentage of districts with a performance agreement that show compliance rate higher than 80%
At least 80% -
Source: World Bank 2001b, 2009b.

88 APPENDIX E
Table E.5. Key Performance Indicators for APL III PDO
Indicator name
Baseline (year 2006)
Target YR5
Restructuring Dec 2012
Restructuring July 2014
Revised target 2014
Final value 2015
(i) reduce occurrence of critical risk factors affecting maternal and infant health in the Target Areas so that current gaps between regions are reduced
Ratio between the percentage of pregnant women receiving four prenatal care check-ups in the target areas and the rest of the country
0.66 0.85 - Indicator rephrased: Ratio between the percentage of pregnant women accessing four prenatal care check-ups in the target areas and the rest of the country
0.95 0.89
Ratio between the percentage of institutional deliveries in the target areas and the rest of the country
0.68 0.85 - - 0.89 0.98
(ii) reduce chronic malnutrition among children under 2 years of age in the Target Areas
Percentage of children receiving exclusive breastfeeding at 6 months in the target areas
51 65 - Dropped - -
Percentage of children 2 years old taller than -2Z scores in the target areas
37.6 22 - Dropped. Intermediate Outcome indicator: Percentage of 2-year-old children covered with height growth control (CRED) in the intervention areas of the project. (former intermediate indicator)
40 0.89
(iii) increase health insurance coverage in the Target Areas
Percentage of population enrolled in health insurance in target areas
0 80 Dropped Dropped. New Indicator: Percentage of Target Population Enrolled in Family Registration Form (Carpeta Familiar) the Project Target Areas
60 80
(iv) upgrade the National Health Information System (Sistema Nacional de Información en Salud, SNIS) so that it will be integrated with Bolivia’s new health insurance program
Health insurance reports generated by software system include information about production of services
0 80 Dropped Dropped. Intermediate Outcome indicator: The modules included in the SNIS are fully implemented in the SEDES and all the heads of the referral networks in the intervention areas (former intermediate indicator)
60 100

89 APPENDIX E
Table E.6. Intermediate Outcome Indicators for APL III Component
Indicator name
Baseline (year 2006)
Target YR5
Restructuring July 2014
New/revised target
Final value
Comp 1: The Ministry of Health and Sports (MOH), the departments and local authorities improved their capacity to perform critical Essential Functions in Public Health, Monitoring and evaluation, Sector policy and investment coordination, and quality control (habilitation accreditation
The SNIS includes the new information modules
30 100 Dropped - -
The modules included in the SNIS are fully implemented in the 9 SEDES, the 9 Department and all the heads of the referral networks in the intervention areas
0 100 Now is PDO indicator - -
The health units apply the sector regulation norms and the PRONACS norms
0 80 - 40 94
Monitoring and Evaluation of the project done with regular reports from the information system providing the data (reports should have the data disaggregated by area, region, municipality, indigenous and nonindigenous, rural and urban)
0 80 Dropped - -
Comp 2: Design and strengthening of the Maternal and Infant Health Network in the Project target areas
% of referral networks evaluated as satisfactory in the yearly quality assessment
0 80 Dropped - -
% of pregnant women receiving prenatal care within the first 20 weeks of pregnancy in the areas of intervention
55 60 Dropped - -
% mothers receiving postnatal care within 10 days of delivery in the areas of intervention
0 70 Dropped - -
Percentage of children under 2 years old who participate in the growing monitoring sessions in the areas of intervention
66 80 Now is PDO indicator - -
Percentage Indigenous people satisfied with the delivery services received
0 60 Dropped - -
New Indicator: Percentage of health units in the target areas following approved norms for primary and secondary health care facilities
20 98

90 APPENDIX E
New Indicator: Percentage of civil works concluded in the health facilities in the areas of intervention
100 100
New Indicator: Percentage of equipment installed in health facilities in the areas of intervention
100 100
Comp 3: Increase the health insurance coverage and the quality of the health services provided through the health insurance
Percentage of target population enrolled at the national level
0 80 Dropped - -
Percentage of municipalities achieving 80% of the management performance tracers at the national level
0 40 Dropped - -
Percentage of population receiving services satisfied with the quality of the services
0 30 Indicator rephrased: Percentage of user population receiving services satisfied with the quality of services in the project areas
30 76.5

91
Appendix F. Triggers for the Health Sector Reform Program Table F.1. Triggers for APL Program
Trigger as defined by PADs Trigger type
Quantified trigger
Achievement of
triggers for APL II
(PAD APL II)
Achievement of triggers for APL
III (PAD APL III)
Triggers for APL II and APL III 1. The achievement of the performance benchmarks Outcome
Institutional Yes Met (7 out of 8 met)
Partially achieved
1.1 Coverage of births attended by trained health personnel Outcome Yes Met Met 1.2 Complete prenatal care attendance Outcome Yes Not met Met 1.3 Early neonatal hospital mortality (per 1,000 live births) in 15
hospitals Outcome Yes Met Unclear –
problematic indicator
1.4 Number of pneumonia cases attended in health services Outcome Yes Met
Unclear – problematic
indicator 1.5 Number of diarrhea cases attended in health services
(Trigger for APL III replaced with “Percent of children of less than five years with three iron doses”)
Outcome Yes Met Not met
1.6 DPT/Hib/Hepatitis B vaccine coverage with three doses Outcome Yes Met Not met 1.7 Number of municipalities with DPT/Hib/Hepatitis B vaccine
coverage of less than 80% Outcome Yes Met Unclear –
problematic indicator
1.8 National financing of vaccines (millions of $) Institutional Yes Met Met Trigger for APL II only 2. Sufficiently high credit disbursements to indicate a need for
second phase funding Project
Implementation No Met -
Triggers for APL III only 3. Performance agreements will continue to be signed and
monitored for all regions and at least three large municipalities
Institutional Yes - Met
4. SBS will continue to be use d as an instrument to finance basic health care for the poor, continue to be implemented by municipalities and regulated by MSPS. Financial controls and audits will have been strengthened
Institutional No - Met
5. EXTENSA will have deployed no less than 150 health teams, and financing of the new teams will become absorbed into national budgets
Output Institutional In part - Met
6. The new vaccines would be incorporated into the national schedule with nationwide coverage and would be fully financed by the government
Output Institutional No - Met
7. An equitable system to finance municipal investments in basic health will be put in place, along with clearly defined financing mechanisms
Institutional No - Met
Source: Prepared by IEG based on World Bank 1999b, 2001b, 2004b, 2007, 2009.

92
Appendix G. Bono Juana Azurduy and World Bank Support 1. The conditional cash transfer program Bono Juana Azurduy (BJA) was established in 2009 to reduce maternal and infant mortality and lessen chronic malnutrition of children under 2. The BJA provides cash transfers to pregnant women and their children without social security health insurance coverage conditional on attending pre‐ and post‐natal controls, having an institutional birth, and attending child health visits.
2. An impact evaluation prepared by UDAPE and the Ministry of Health (UDAPE 2015) based on the ESNUT 2012 (Encuesta de Salud y Nutrición) found that:
• Despite massive awareness and knowledge about the BJA (only 87 percent of reproductive age women), BJA’s participation rate was low due to lack of information, bureaucratic delays, and required documentation (it enrolled 34 percent of pregnant women and almost 50 percent of children under 1).
• BJA had a positive impact in early capture of pregnant women (before 20 weeks), in the probability of having at least one prenatal control and completing four controls.
• No significant effects were found in institutional delivery at the national level. • Participating children 0–23 months had 1.1 to 3.6 more care visits and were more
likely to be fully immunized and consume nutritional supplements called “chispitas.” • No effects of BJA were noted on exclusive breastfeeding practices, height-for-age
measures, or anemia.
3. A recent study confirms the low participation in the program and shows that the BJA is pro-poor—by 2013 about half the transfers were received by families in the bottom 40 percent, while only 10 percent were going to the richest quintile (Apella and Blanco 2015).
4. Initially the World Bank’s social protection project Investing in Children and Youth would help finance the BJA program, but the component was later canceled and funds reallocated to other activities. Issues related to the tracking of benefits, and the difficulties in attributing the reduction of the prevalence of chronic malnutrition in children aged 0–2 living in rural areas to project interventions supported this cancellation. The government continues to finance the BJA with its own resources (World Bank 2015c).
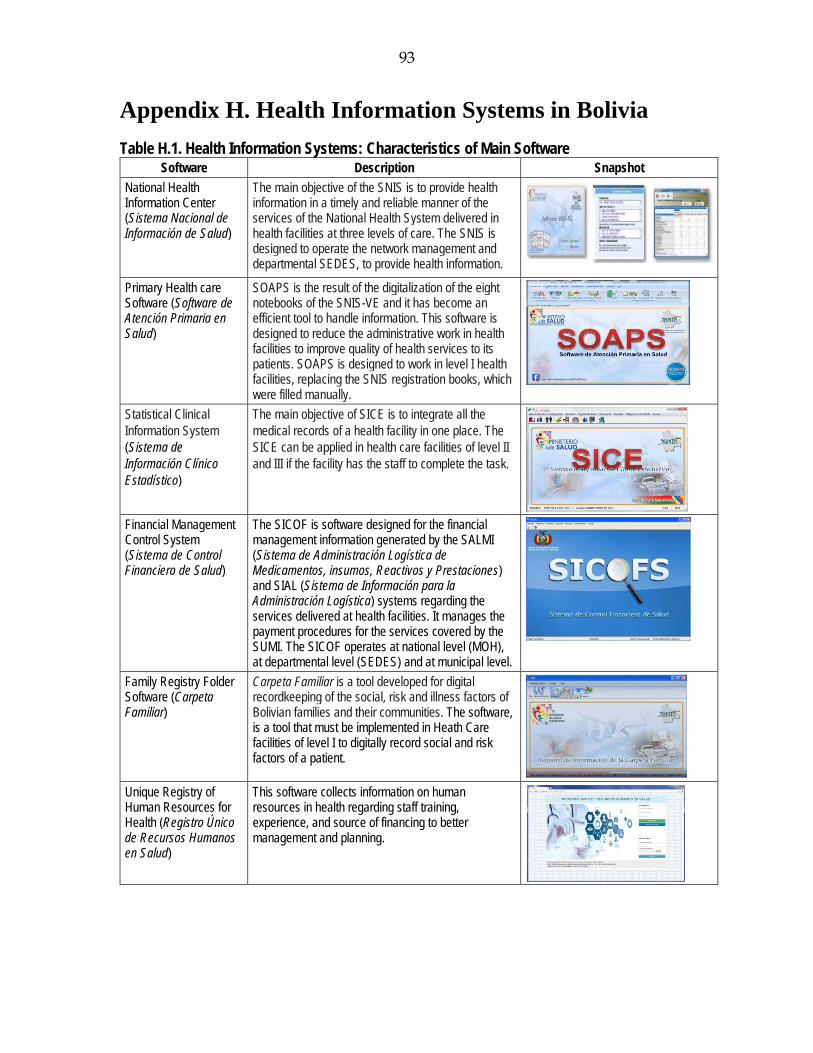
93
Appendix H. Health Information Systems in Bolivia Table H.1. Health Information Systems: Characteristics of Main Software
Software Description Snapshot National Health Information Center (Sistema Nacional de Información de Salud)
The main objective of the SNIS is to provide health information in a timely and reliable manner of the services of the National Health System delivered in health facilities at three levels of care. The SNIS is designed to operate the network management and departmental SEDES, to provide health information.
Primary Health care Software (Software de Atención Primaria en Salud)
SOAPS is the result of the digitalization of the eight notebooks of the SNIS-VE and it has become an efficient tool to handle information. This software is designed to reduce the administrative work in health facilities to improve quality of health services to its patients. SOAPS is designed to work in level I health facilities, replacing the SNIS registration books, which were filled manually.
Statistical Clinical Information System (Sistema de Información Clínico Estadístico)
The main objective of SICE is to integrate all the medical records of a health facility in one place. The SICE can be applied in health care facilities of level II and III if the facility has the staff to complete the task.
Financial Management Control System (Sistema de Control Financiero de Salud)
The SICOF is software designed for the financial management information generated by the SALMI (Sistema de Administración Logística de Medicamentos, insumos, Reactivos y Prestaciones) and SIAL (Sistema de Información para la Administración Logística) systems regarding the services delivered at health facilities. It manages the payment procedures for the services covered by the SUMI. The SICOF operates at national level (MOH), at departmental level (SEDES) and at municipal level.
Family Registry Folder Software (Carpeta Familiar)
Carpeta Familiar is a tool developed for digital recordkeeping of the social, risk and illness factors of Bolivian families and their communities. The software, is a tool that must be implemented in Heath Care facilities of level I to digitally record social and risk factors of a patient.
Unique Registry of Human Resources for Health (Registro Único de Recursos Humanos en Salud)
This software collects information on human resources in health regarding staff training, experience, and source of financing to better management and planning.

94
Human Resources Software (Software de Registro de Recursos Humanos en Salud)
The SOREH software collects information of current availability of human resources in health in the public subsystem by health facility, head of service networks, and SEDES, thus feeding the national database.
Unique Registry of Health Facilities (Registro Único de Establecimientos de Salud)
RUES provides information about the structure of all types of health facilities (public, private, and those of social security) in the whole country according to the national norms for their characterization.
Source: SNIS-VE: http://snis.minsalud.gob.bo/software

95
Appendix I. Project-Specific Analysis: Statistics and Others
I. Health Sector Reform Project and Second Phase of the Health Sector Reform Program
Figure I.1. IEG’s Reconstruction of APL I and II Results Chain

96
Figure I.2. Distribution of Pentavalent Vaccine Coverage for Children under 1, by Municipality
Source: Prepared by IEG based on immunization data extracted from SNIS, and population estimates produced by INE. Definition: The numerator is the number of children under one year old who have who have received the third doses of pentavalent vaccine in that year in the municipality. The denominator is the population estimate for that age group in the municipality.
Figure I.3. Percentage of Children 12–23 Months Who Are Fully Immunized, for Lowest and Highest Quintiles
Source: WDI indicators. Definition: Percentage of children 12–23 months who have received specific vaccines by the time of the survey (according to the vaccination card or the mother's report). Children with all vaccinations refer children who have received tuberculosis (BCG), measles, and three doses each of DPT and polio vaccine (excluding polio 0).
25.421.8
44.047.7
77.9
61.0
30.6
57.0 57.3
80.6
1994 1998 2000 2003 2008
Q1 (lowest) Q5 (highest)

97
Figure I.4. Percentage of Children 12–23 Months Who Are Immunized for DPT, by Wealth Quintile
Source: WDI indicators.
Figure I.5. Pentavalent Immunization Coverage, Actual and Target Values
Source: UDAPE (2016) Dossier of Social and Economic Statistics, World Bank 199b, 2004b, 2001b, 2009 and other monitoring documents.
63.4 63.8
85.4
65.670.7
84.479.0
65.9
86.9
70.8
80.485.9
82.4 84.7 86.1
2000 2003 2008
Q1 (lowest) Q2 Q3 Q4 Q5 (highest)
8591 92
88
8185 84.5 83.1 81.7 83.4 84.5
80.683.1
79.7 81.486.1
88.6 87.4
82
65
75 85
8790 90 90 90 90 90 90 90 90 90 90 90 90
0
10
20
30
40
50
60
70
80
90
100
1999 2000 2001 2002 2003 2004 2005 2006 2007 2008 2009 2010 2011 2012 2013 2014 2015 2016
Actual Target
APL IIAPL I
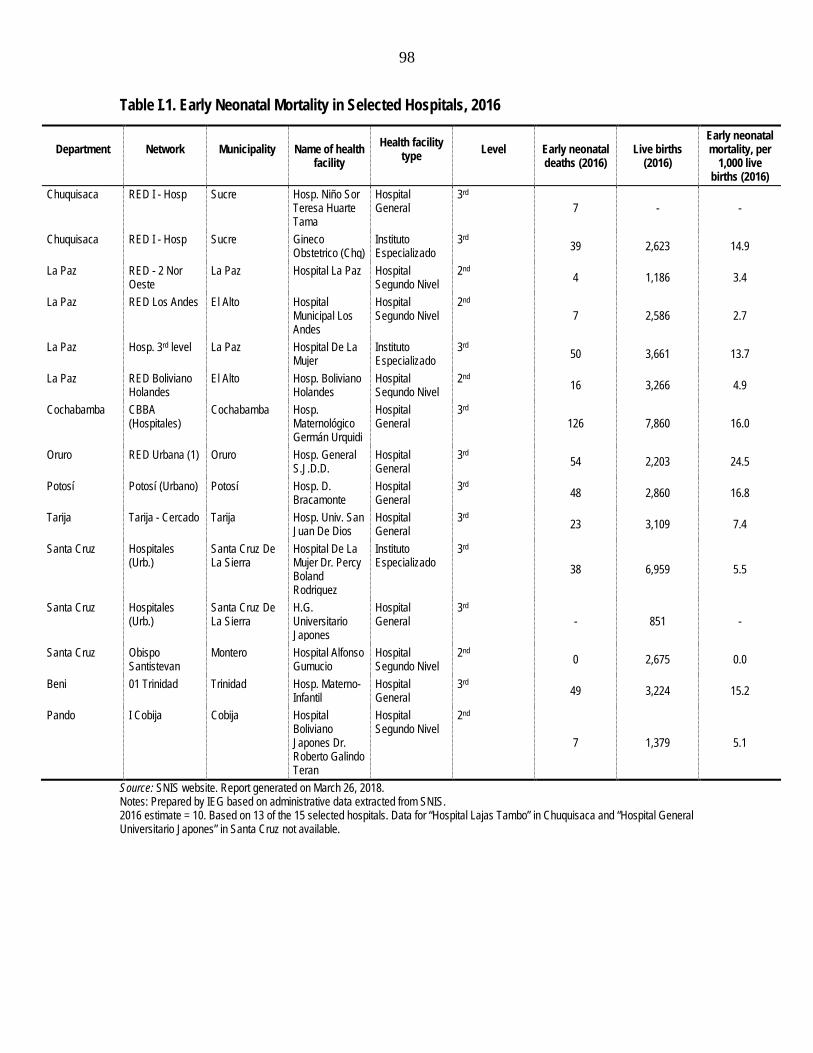
98
Table I.1. Early Neonatal Mortality in Selected Hospitals, 2016
Department
Network
Municipality
Name of health facility
Health facility type
Level
Early neonatal deaths (2016)
Live births (2016)
Early neonatal mortality, per
1,000 live births (2016)
Chuquisaca RED I - Hosp Sucre Hosp. Niño Sor Teresa Huarte Tama
Hospital General
3rd 7 - -
Chuquisaca RED I - Hosp Sucre Gineco Obstetrico (Chq)
Instituto Especializado
3rd 39 2,623 14.9
La Paz RED - 2 Nor Oeste
La Paz Hospital La Paz Hospital Segundo Nivel
2nd 4 1,186 3.4
La Paz RED Los Andes El Alto Hospital Municipal Los Andes
Hospital Segundo Nivel
2nd 7 2,586 2.7
La Paz Hosp. 3rd level La Paz Hospital De La Mujer
Instituto Especializado
3rd 50 3,661 13.7
La Paz RED Boliviano Holandes
El Alto Hosp. Boliviano Holandes
Hospital Segundo Nivel
2nd 16 3,266 4.9
Cochabamba CBBA (Hospitales)
Cochabamba Hosp. Maternológico Germán Urquidi
Hospital General
3rd 126 7,860 16.0
Oruro RED Urbana (1) Oruro Hosp. General S.J.D.D.
Hospital General
3rd 54 2,203 24.5
Potosí Potosí (Urbano) Potosí Hosp. D. Bracamonte
Hospital General
3rd 48 2,860 16.8
Tarija Tarija - Cercado Tarija Hosp. Univ. San Juan De Dios
Hospital General
3rd 23 3,109 7.4
Santa Cruz Hospitales (Urb.)
Santa Cruz De La Sierra
Hospital De La Mujer Dr. Percy Boland Rodriguez
Instituto Especializado
3rd 38 6,959 5.5
Santa Cruz Hospitales (Urb.)
Santa Cruz De La Sierra
H.G. Universitario Japones
Hospital General
3rd - 851 -
Santa Cruz Obispo Santistevan
Montero Hospital Alfonso Gumucio
Hospital Segundo Nivel
2nd 0 2,675 0.0
Beni 01 Trinidad Trinidad Hosp. Materno-Infantil
Hospital General
3rd 49 3,224 15.2
Pando I Cobija Cobija Hospital Boliviano Japones Dr. Roberto Galindo Teran
Hospital Segundo Nivel
2nd
7 1,379 5.1
Source: SNIS website. Report generated on March 26, 2018. Notes: Prepared by IEG based on administrative data extracted from SNIS. 2016 estimate = 10. Based on 13 of the 15 selected hospitals. Data for “Hospital Lajas Tambo” in Chuquisaca and “Hospital General Universitario Japones” in Santa Cruz not available.

99
II. Expanding Access to Reduce Health Inequities (APL III)
Box I.1. Detailed Components of Expanding Access to Reduce Health Inequities Project (APL III)
Component 1. Stewardship Role of Health Authorities – Essential Functions in Public Health (IDA $4 million at appraisal; $1.4 million actual): This component aimed to strengthen capacity of national, regional, and local health authorities to perform Essential Functions in Public Health – which range from surveillance and disease control to social participation, regulation, and M&E. It was divided into three subcomponents: 1.1) Strengthening the National Health Information System (SNIS): this subcomponent was to finance equipment, technical assistance, software tools, training, and communication services to support a structural change in the way data is captured: 1.1.1) Design and adaptation of technical standards and processes of the SNIS in epidemiological surveillance; 1.1.2) Monitoring and evaluation, related to oversight of the government’s Sector Development Plan for 2006-2010 at the national level (eliminated); 1.1.3) Development of a National System for Health Research (eliminated); 1.1.4) Financing for the Demographic and Health National Survey 2011 (Encuesta Nacional de Demografía y Salud) (eliminated). 1.2) Regulation, results-based management (RBM), and culture of accountability: this subcomponent was to support strengthening the capacity of the Ministry of Health and Sports (MOH) and departmental and local health authorities: 1.2.1) Provision of technical assistance to develop standard practices and management tools; preparation and validation of norms, and processes; training for national and departmental level health staff in use of new standards. 1.2.2) Strengthening the coordination of international and multilateral donors (eliminated); 1.2.3) Carrying out of project impact evaluation of APL 3 (eliminated); 1.2.4) Dissemination of health results achieved through community meetings, workshops and publications using reports of the SNIS as a basis; 1.2.5) Strengthening of the MOH Human Resources Policy; update human resource data from SNIS, identify gaps in human resources; updating of regulatory framework for the management of HR. 1.3) Development and implementation of a National Program of Quality: this subcomponent was to support licensing, certification, and monitoring of health facilities, including hospitals, clinical labs, blood banks, and so on; 1.3.1) Capacity development in quality management; incorporation of quality managers into the MOH; SEDES, and referral networks in target area; training and diffusion in the use of quality standards for SEDES health workers 1.3.2) Development of standards and instruments of quality management in provision of health services: preparation and validation of standards, processes, and methodologies; promotion culture of quality; monitoring and evaluation of the application of standards of the National Program of Quality for licensing and certification activities. New activities were added: 1.4) Development of an index to monitor the progress of mothers and children during the first two years of life (the Index of 1,000 days the TOR [terms of reference] for the consultant was prepared by the consultant was never hired) (eliminated); 1.5) Support to the Cumbre de Salud. The Cumbre de Salud is the first participatory consultation process in the health sector promoted by the Ministry of Health in Bolivia. The Cumbre the Salud will be organized in a bottom-up process, where the Departments will organize regional conferences, with broad participation of the municipal health authorities, providers and citizens on the definition of local priorities. These instances will select the delegates to participate in the Cumbre de Salud, which is scheduled to the first semester of 2013. CHANGES 7. Project restructuring follows changes in health policy in Bolivia during the last two years and reflect the need to monitor and evaluate the support provided to mother and child health care, and carry out a social public consultation (Cumbre de Salud2) about SUS, which implementation was delayed due to the lack of an agreement regarding its institutional framework between the Executive and Legislative branches. Component 2. Family, Community and Intercultural Health (IDA $9.9 million at appraisal; $8.2 million actual): This component aimed to improve access to maternal and infant health services in the project’s target areas. Activities were to support the development of Intercultural Maternal and Infant Health Referral Networks, complementing the existing EXTENSA health program. These networks were to promote demand for maternal and infant health care by focusing on the following three goals: 1) increasing the number of safe institutional childbirths; 2) increasing the number of referrals of obstetric emergencies directly from the community; and 3) providing access to a referral system for children with acute respiratory and digestive diseases. It was divided into two subcomponents: 2.1) Development and Strengthening of Intercultural Maternal and Infant Health Referral Network, including support for: 2.1.1) Analysis of current referral networks (diagnosis of the status of resources and existing capacities of health networks in target areas, expected to reduce 51 unconnected networks into a smaller number of more structured networks with increased capacity);

100
2.1.2) Renovation of health facilities, public housing and purchase of medical equipment (renovation of 300 remaining facilities with minor repairs, purchase of new primary care equipment, construction and rehabilitation of housing for health workers, rehabilitation of 10 secondary care hospitals; conversion of seven primary care centers into secondary care hospitals); 2.1.3) Financing expanded human resources (creation of 34 new EXTENSA brigades in rural networks; increase the SAFCI medical residences; strengthening formal training in pediatrics, internal medicine, ob./gyn, and surgery to ensure enough specialist in main hospitals in the network system; incorporation of nutritionist and social worker into networks; support for rotating specialized personnel to work temporarily in rural areas) (eliminated); 2.1.4) Professional training (program that establishes a network training day to link patients and referring doctors from the community health centers with secondary care specialist doctors to train community doctors in higher-level care and reinforce professional relationships among doctors) (eliminated); 2.1.5) Operational research (support for research on outbreaks using existing equipment of SEDES and networks) (eliminated); 2.1.6) Regional Equipment Maintenance Centers (support for the creation of three regional centers for equipment maintenance) (eliminated). 2.2) Strengthening of Local Management and Community Participation, including support for: 2.2.1) Participatory planning (workshops with community participation focusing on local epidemiological profiles and disease surveillance, with emphasis on maternal and child health and nutrition); training for local social organizations and community leaders (eliminated); 2.2.2) Support for Health Information Analysis Committees (Comités de Análisis de Información en Salud, CAIS) including training for health workers and community leaders in methodology to gather and analyze data) (eliminated); 2.2.3) Public awareness (dissemination of community intersectoral health strategies and results in meetings of social organizations) (eliminated); 2.2.4) Development of health promotion materials with community participation, printing and dissemination (eliminated); 2.2.5) Training and support of local/municipal health boards (DILOS) to increase capacity to manage local health issues (eliminated). 2.2.6) Support for local/municipal health boards (DILOS) for monitoring the municipal management commitments and with the health networks (eliminated) Activities under component 2 were designed in coordination with a World Bank Social Protection Program entitled “Enhancing Human Capital of Children and Youth” at stage of preparation (aimed at providing conditional cash transfers to families with infants for health and nutritional care) and the national Zero Malnutrition Program (which encourages consumption of fortified complementary food to meet nutritional needs of children and pregnant women, as well as expanded access to clean drinking water and improved sanitation). Both programs aimed at stimulating demand for health care services in the same areas. All three programs will initially work in up to 10 municipalities as a first stage, to refine the approach and structure the joint activities to be optimally effective. The activities will then scale up to serve an additional 24 of the most vulnerable municipalities. This coordinated set of programs will serve to stimulate the supply of health services in the targeted areas, via the conditional transfers to health networks. Demand for health services will also be stimulated, by the SP’s programs conditional cash transfers and the educational and prevention activities of Malnutrition Zero. With the activities of three robust programs focused on reducing malnutrition in a limited number of areas, a significant impact can be expected. Component 3. Health Insurance Program (IDA $3.2 million at appraisal; $0.56 million actual): This component aimed at supporting the implementation of a new health insurance program SU SALUD (which aimed at expanding coverage from SUMI) through three subcomponents: 3.1) Strengthening the SU SALUD enrollment system: support the rollout of a national SU SALUD record system for the enrollment of families and individuals. This system will permit the classification of members and coverage according to geographical areas, urban/rural areas, levels of poverty and other demographic characteristics. Under APL 11, SU SALUD’s enrollment system was designed, developed and tested in two pilot programs (one in a rural area, and other in an urban area). These pilots allowed a dry-run test of the system, and as a result of issues identified during this process, minor adjustments were made. Currently the software is ready to be implemented in the entire country. 3.1.1) Training on the use of the enrollment system for key personnel (eliminated); 3.1.2) Implementation of a communication and social marketing strategy for health insurance enrollment to promote enrollment (eliminated); 3.1.3) Printing and distribution of enrollment forms nationwide (eliminated). 3.1.4) Implementation of mass enrollment campaign in project target areas (eliminated). 3.2) Development and Strengthening of M&E Management Capacity in the National Unit for Technical and financial Management (Unidades de Gestión Técnica Y Financiera Nacional, UGTFN) and Departmental units (UGTFDs). Strengthen capacity to plan, manage, and carry out monitoring and evaluation of SU SALUD at the national, departmental and municipal levels: 3.2.1) Strengthening professional capability; incorporation of statistician, public health specialist and economist positions into the Departmental Units for Technical and Financial Management (UGTFDs) to be progressively financed with government of Bolivia resources; 3.2.2) Provision of office and computer equipment to the UGTFDs; 3.2.3) Provision of technical assistance for auditing and management of incentives, and financing of supervisory visits of the National Unit for Technical and Financial Management (UGTFN) to UGTFDs and networks. 3.2.4) Preparation and distribution of forms, standards and operational guides and training.

101
3.2.5) Monitoring and supervision; financing so that the members of the UGTFN can regularly carry out supervisory visits to the UGTFDs and the referral networks. 3.2.6) Coordination meetings at the national level with the participation of the prefectures, SEDES, presidents of the municipal associations, representatives of civil societies, UGTFN, UGTFDs, and Ministry of Health. 3.3) Development of a M&E system for SU SALUD. 3.3.1) Determine baseline indicators for better understanding of initial environment into which SU SALUD is launched. 3.3.2) Implementation of the medical-administration-financial software for SU SALUD. This software is being developed by APL I1 and maintains links with the SNIS. The implementation will be carried out in the 88 locations targeted by APL 111, and is planned to finance, computer equipment, to carry out the installation of the software and to train the data-entry personnel, network managers, members of the SEDES, and medical, administrative and financial staff. The computer equipment included in this subcomponent will also be used to extend the utilization of the SNIS. 3.3.3) Expansion of the SU SALUD software for the incorporation of special reports for decisionmakers and for the wider community 3.3.4) Measurement of the quality of care and user satisfaction in the target areas. Audits on achievement of performance indicators and satisfaction surveys regarding SU SALUD’s activities on disease prevention and health promotion. 3.3.5) Support for meetings for evaluation of the health insurance at local level in the target areas. 3.3.6) Implementation of the local mass communication strategy to guarantee transparency in management (accountability). New Activity: Support the rollout of a universal health insurance program record system for the enrollment of families and individuals. 3.1.1 - the carrying out of training in use of the enrollment system for key personnel, operational personnel and community leaders; and 3.1.2 - the design, printing and distribution nationwide of a family health enrollment form (“Carpeta Familiar”). (World Bank 2012). increased population registration in the Family Health Record (Carpeta Familiar) and trained key personnel and community leaders on the use of this enrollment system. In July 2014, a second restructuring added a new activity for renovation (construction and equipment) of the Onco-Hematologic Unit of La Paz Children’s Hospital. Its purpose was to increase child survival by addressing the needs of children with cancer (especially leukemia) and hematological health problems. Component 4. Project Administration (IDA $0.9 million at appraisal; $0.6 million actual): The fourth component was to support project administration with equipment, technical assistance, training, and operating costs to finance the administration of the project, as well as financial and procurement audits. The project would be executed through MOH’s existing staff and structure, eliminating the PIU [Project Implementation Unit] from earlier phases. The objective of this component would be to support the project’s coordination and administration within the MOH. Revised components During the 2012 restructuring, project components were revised, and many activities were canceled. Component 1: Most of the activities under subcomponent 1 and 2 designed to strengthen the SNIS, the MOH, and local health authorities were eliminated. New activities were added: development of an index to monitor the progress of mothers and children during the first two years of life; and support to the Cumbre de Salud (a bottom-up, participatory consultation process in the health sector). Component 2: Activities for expansion and training of human resources, development of regional maintenance centers, and strengthening of local management and community participation (original subcomponent 2.2) were dropped. Component 3: Activities related to the unified health insurance scheme were dropped, and instead the project contributed to increased population registration in the Family Health Record (Carpeta Familiar) and trained key personnel and community leaders on the use of this enrollment system. In July 2014, a second restructuring added a new activity for renovation (construction and equipment) of the Onco-Hematologic Unit of La Paz Children’s Hospital. Its purpose was to increase child survival by addressing the needs of children with cancer (especially leukemia) and hematological health problems. Source: World Bank 1999b.

102
Figure I.6. IEG’s Reconstruction of APL III Results Chain

103
Box I.2. Children’s Hospital: Investing in Children and New Generations
The 2014 project restructuring added an activity to improve the infrastructure of the Onco-Hematologic Unit of the Children’s Hospital in La Paz with the purpose of increasing the survival of children with cancer (especially leukemia) and hematological health problems. The subproject was planned in two phases: in the short run the project cofinanced the renovation and expansion of the oncologic area to improve the services, isolation, and treatment of pediatric-oncologic patients. In a second, medium-term, stage the project cofinanced the construction of a new four-floor building attached to the hospital, with a higher capacity for ambulatory and hospitalized treatments, surgical area, and a unit for bone marrow transplants. Renovation costs were estimated at $4.6 million, of which 47 percent was financed by the World Bank, 33 percent by the Departmental Government of La Paz and 20 percent by the MOH (World Bank 2014).
Physical infrastructure. Today the new Onco-Hematologic building has ambulatory services, pharmacy, administration, playground area, and social services and charity offices; five rooms with three beds for in-patient care, operating area for catheterization; and a full floor to perform bone marrow transplants. Interviews and site visits provided evidence of an adequate physical infrastructure and equipment (the latter financed with Japanese funding). The former oncologic area, renovated in the first stage, currently provides infectiology services given its unique isolation of beds. The hospital is a third-level reference center providing treatment to children with cancer from all Bolivia, mostly from low-income families. Since 2011 it has provided services to about 1,000 children under 16 years old, 58 percent of which are under 5 years old (see table, below). Hospital data shows a slight increase in service provision, accelerating after 2013 when the health insurance expanded, and has remained constant since then. But the ability of children to complete their treatment goes far beyond the availability of adequate infrastructure.
Human resources deficiencies. The improved infrastructure sought to create capacity to perform bone marrow transplants in Bolivia for the first time. But conditions are not in place yet because of lack of specialists: the government financed training in bone marrow transplants for only one onco-pediatric specialist, but other health team members would have to be trained as well (hematologists, nurses, immunologists). In general, the Children’s Hospital suffers from a shortage of specialists, as does the rest of the health system, which also limits the availability of residency programs precisely because of few potential trainers. Today there are only seven onco-hematologic pediatricians in Bolivia.
Financing of treatment. Oncologic treatments are expensive. Oncologic drugs cost about $2,000 every 1–4 months and the cost of radiotherapy is around $3,500. Bone marrow transplants outside Bolivia ranged between $30,000 and $60,000 (this is 10–20 times the annual GDP per capita). Oncologic treatments are not fully covered by insurance in Bolivia. The Law475/SIS insurance only covers drugs for acute lymphoblastic leukemia (ALL) in children under five years old, whereas the hospital provides care to children up to 16 years old. In fact, most children diagnosed with ALL are older than five (around 10 percent of patients under five have ALL, a total of 104 patients since 2011). Older children with ALL and those with other types of cancers (for example, solid tumors) receive chemotherapy drugs free of charge from the NGO Fundación San Luis. Children with cancer from poor families depend on charity for their survival because health insurance policies lagged behind the improvements in infrastructure achieved so far.
Social barriers. Children and their families experience a high emotional and economic costs. For low-income families, social limitations are as important as treatment costs. Children belonging to poor families are not always able to complete their treatment: parents (who must stay with them throughout their hospitalization because of insufficient human resources at the unit) also need to care for their other children and cannot stay for very long periods. Despite efforts of oncologic doctors to adjust chemotherapy to allow for ambulatory care, children living in remote areas are unable to return to the hospital. Hospital data show a treatment dropout rate of 38 percent. The poorest children and their families are unlikely to be able to commit to long chemotherapy treatments.
Leukemia cases have been growing in Bolivia, and the disease has moved from the 30th to the 25th cause of mortality. According to IHME 2010, dietary risks, smoking, high body mass index, and physical inactivity are among the risk factors associated with cancer. The top three causes of premature

104
death in 2010, measured by years of life lost, were lower respiratory infections, diarrheal diseases, and preterm birth complications (IHME 2010).
Onco-Hematologic Unit of the Children’s Hospital 2011 2012 2013 2014 2015 2016 2017 2018 Total # Onco-hematologic services provided 1,268 1,390 1,558 2,325 2,478 1,242 2,181 538 12,980 # Patients/cases with acute lymphoblastic leukemia (SIS-Law 475) 44 50 56 53 53 53 54 39 222 % Patients/cases with acute lymphoblastic leukemia 33% 37% 35% 24% 24% 30% 20% 35% 22% # Patients/cases with acute lymphoblastic leukemia & < 5 years old 20 16 21 20 25 19 19 12 104 % Patients/cases with acute lymphoblastic leukemia & < 5 years old 15% 12% 13% 9% 11% 11% 7% 11% 10% Total # of patients 132 136 158 220 221 174 276 110 1007 Average patient age 6.0 6.9 6.3 6.1 5.8 6.4 5.3 6.4 5.5 % of patients < 5 years old 46% 42% 53% 55% 55% 48% 61% 45% 58% Dropout rate* 26% 41% 47% 33% 41% 39% 38% -
Note: Source SICE 2011-2018. (*) Hospital own estimates, 2017 data based on interviews. Data 2018 until March 1, 2018. Risk factors that account for the most disease burden in Bolivia
Note: The colored portion of each bar represents the specific diseases attributable to that risk factor while bar size represents the percentage of DALYs linked to specific risk factors.
Sources: IHME 2010; Documentary “Corazon de Dragon” (http://www.conacinebolivia.com.bo/index.php/conacine/colors/licencia-de-filmacion-en-bolivia/89-noticias/391-paolo-agazzi-estrena-corazon-de-dragon); Annex 5: Complementary Information about the New Activities related to Rehabilitation of the Oncology-Hematology Center of the Children Hospital in La Paz; IEG mission interviews; Children’s Hospital data; IHME.

105
Figure I.7 Coverage Maternal Health Care Services 2009–2016
Source: SNIS-VE and INE. Table I.2. Coverage Maternal Health Care Services, 2016
Complete prenatal care Skilled birth attendance National 76.4 85.2
46-prioritized municipalities 66.5 63.6
16-prioritized municipalities with subprojects 75.6 71.1 Source: SNIS-VE and INE.
Figure I.8. Maternal Health Coverage 2003, 2008, 2016
Source: Instituto Nacional de Estadística - EDSA 2016.
28.0
44.0
54.049.0
44.0 41.035.0
66.5
52.0 52.059.0
50.0 52.0 51.047.0
76.4
0.0
10.0
20.0
30.0
40.0
50.0
60.0
70.0
80.0
90.0
2009 2010 2011 2012 2013 2014 2015 2016
% P
regn
ant w
omen
with
4 pr
enata
l acre
vis
tis
prioritized municipalities national
25.0
59.064.0
59.052.0
48.0 50.0
63.6
48.0
71.0 70.0 67.061.0 60.0
51.0
85.2
0.0
10.0
20.0
30.0
40.0
50.0
60.0
70.0
80.0
90.0
2009 2010 2011 2012 2013 2014 2015 2016
SBA
prioritized municipalities national
79,1
57,1 60,8
90,0
67,5 71,1
95,687,7 89,8
0%10%20%30%40%50%60%70%80%90%
100%
Prenatal Care by QualifiedPersonnel
Institutional Delivery at HealthFacility
Skilled Birth Attendance
ENDSA 2003 ENDSA 2008 ENDSA 2016

106
Figure I.9. Growth and Monitoring Control in Children under 2 in Target Areas
Source: SNIS-VE (MOH 2016).
Figure I.10. Prevalence of Exclusive Breastfeeding in Infants under 6 Months (2008, 2016)
Source: Instituto Nacional de Estadística - EDSA 2016
18 18 1624
59
86 89
0102030405060708090
100
2009 2010 2011 2012 2013 2014 2015
Cove
rage
(%
)
Urban Rural Total
53,7
69,060,4
52,4
70,9
58,3
ENDSA 2008 EDSA 2016

107
Figure I.11. Number of Services Provided: SUMI (2008–13) and Law 475/SIS (2014–16)
Source: UDAPE (2016) based on MOH and SICOF data.
0
5,000,000
10,000,000
15,000,000
20,000,000
25,000,000
30,000,000
35,000,000
40,000,000
2008 2009 2010 2011 2012 2013 2014 2015 2016
Numb
er of
servi
ces p
rovid
edPrimary level
Secondarylevel
Tertiary Level
TOTAL
0
2,000,000
4,000,000
6,000,000
8,000,000
10,000,000
12,000,000
14,000,000
16,000,000
18,000,000
2014 2015 2016
Numb
er of
servi
ces p
rovid
ed
Children under5
Pregnantwomen
Reproductiveage women
Adults 60+
People withdisabilities

108
Figure I.12. SOAPS/SICE Implementation by Department (2014–2017)
Source: IEG based on SNIS-VE.
1943
2274 2291 2333
0
500
1000
1500
2000
2500
0
10
20
30
40
50
60
70
80
90
100
2014 2015 2016 2017
Numb
er of
Hea
lth F
acliti
es im
pleme
nting
SO
APS/
SICE
Perce
ntage
of Im
pleme
ntatio
n #Health Facilities implementingSOAPS-SICEBENI
CHUQUISACA
COCHABAMBA
LA PAZ
ORURO
PANDO
POTOSI
SANTA CRUZ
TARIJA
National

109
Appendix J. List of Persons Met WORLD BANK
Nicola Pontara Country Manager, World Bank Patricia Alvarez Senior Operations Officer, Bolivia Country Office, World Bank Daniel Cotlear Lead Economist, Health, Nutrition and Population Global
Practice, World Bank Marcelo Bortman Lead Health Specialist, Health, Nutrition, and Population, World
Bank Fernando Lavadenz Senior Health Specialist – Africa, Health, Nutrition and
Population Global Practice, World Bank Andre Medici Senior Economist (Health) (interviewed in 2017 for ICRR) Roberto Iunes Senior Economist (Health) (interviewed in 2017 for ICRR)
GOVERNMENT
Dante Ergueta Director de Seguros de Salud, Ministerio de Salud Gabriela Lima Ultima Coordinadora del Proyecto APL III, Ministerio de Salud Christian Pereira Anterior Gerente de la Unidad de Reforma de Salud (APL1-3),
Ministerio de Salud Arturo Vladimir Sanchez Escobar Director Ejecutivo (y funcionarios del area encargada de
coordinar los sub-proyectos) - Fondo Nacional de Inversión Productiva y Social
Dr. Max Francisco Enriquez Nava Coordinador Nacional, SNIS Unidad de Sistema Nacional de Información de Salud
Dr. Luis Ramiro Asturizaga Rollano Director del Área de Calidad y Auditoría en Salud, Ministerio de Salud
Raul Garron Coordinador del APL III, Fondo Nacional de Inversión Productiva y Social
Dr. Rocco Abruzzese Castellón Responsable Nacional de Información de Producción de Servicios I Nivel – Sistema Nacional de Información en Salud y Vigilancia Epidemiológica (SNIS-VE)
Marcia Ramírez Ex Gerente de la Unidad de Reforma de Salud Álvaro Gutiérrez Jefe de Programas y Proyectos Productivos y Sociales, Fondo
Nacional de Inversión Productiva y Social (FPS) Eyber Antezana Gerente de Programas y Proyectos del Fondo Nacional de
Inversión Productiva y Social (FPS) Dr. Joaquín Monasterio Pinckert Director, Servicio Departamental de Salud, Santa Cruz
(SEDES) Dr. Pablo Peñaranda Gerente, Servicio Departamental de Salud, Santa Cruz
(SEDES) Ronald Condori Responsable del Sistema Nacional de Información en Salud,
Ministerio de Salud Oscar Jaime Solís Responsable de Estadísticas, Servicio Departamental de
Salud, Santa Cruz (SEDES) Layda Montero Gerente de Recursos Humanos, Servicio Departamental de
Salud, Santa Cruz (SEDES) Dr. Franz Hinojosa Gerente de la Unidad de Planificación, Servicio Departamental
de Salud, Santa Cruz (SEDES)
Boris Chang Responsable del Programa de Ampliado de Inmunización, Servicio Departamental de Salud, Santa Cruz (SEDES)

110
Luis Gutiérrez Responsable de la Unidad de Servicios de Salud, Servicio Departamental de Salud, Oruro (SEDES)
David Choque Director de la Unidad de Planificación, Servicio Departamental de Salud, Oruro (SEDES)
Rodolfo Martínez Responsable de Proyectos y Convenios, Servicio Departamental de Salud, Oruro (SEDES)
Dra. Gricel Alarcón de la Vega Jefe del Sistema Nacional de Información en Salud, Servicio Departamental de Salud, Oruro (SEDES)
Mary Troche Quispe Técnico en el área de gestión hospitalaria Salud, Servicio Departamental de Salud, La Paz (SEDES)
Rosario Quiroga Morales Anterior Ministra de Salud y anterior encargada del Programa de Ampliado de Inmunización
Dante Ergueta Director de Seguros de Salud, Ministerio de Salud
Dr. Daniel Cárdenas Director del Hospital de la Mujer Carola Romero Planificadora del Hospital. Hospital de La Mujer Gabriel Lima Jefe de Recursos Humanos, jefe de personal. Hospital de La
Mujer Victor Condori Sub-director administrativo y financiero, Hospital de La Mujer Dra. Sardinas Unidad Onco hematológica del Hospital del Niño Zulma Velasquez Condori Licenciada de enfermería y directora el Centro de Salud de
Sica Sica, Konani
Dra. Maria Elena Macías Cruz Médico, Centro de Salud de Sica Sica, Konani
Maria Elena Callejas Cachi Licenciada de enfermería, Centro de Salud de Sica Sica, Konani
Dr. Felix Calle Quenta Responsable municipal de salud y odontólogo, Centro de Salud de Sica Sica, Konani
Benjamín Huanca Vilca Licenciado de laboratorio, Centro de Salud de Sica Sica, Konani
OTHER ORGANIZATIONS
Luis Buscarons Hospital Management Specialist, Inter-American Development Bank José Ignacio Carreño Director Ejecutivo, PROCOSI Dra. Rosario Quiroga Ex Ministra de Salud, UNICEF Bolivia Susana Bedregal Administradora, Fundación San Luis Marina Cárdenas Former economist, Health Reform Unit and current Coordinator of
Health Systems and Services, PAHO Adhemar Esquivel Former economist, Health Reform Unit and current Economist of the
Social Policy Subdivision, UDAPE