boating trends on lake minnetonka, 1984 …files.dnr.state.mn.us/aboutdnr/reports/boating/...6...
TRANSCRIPT
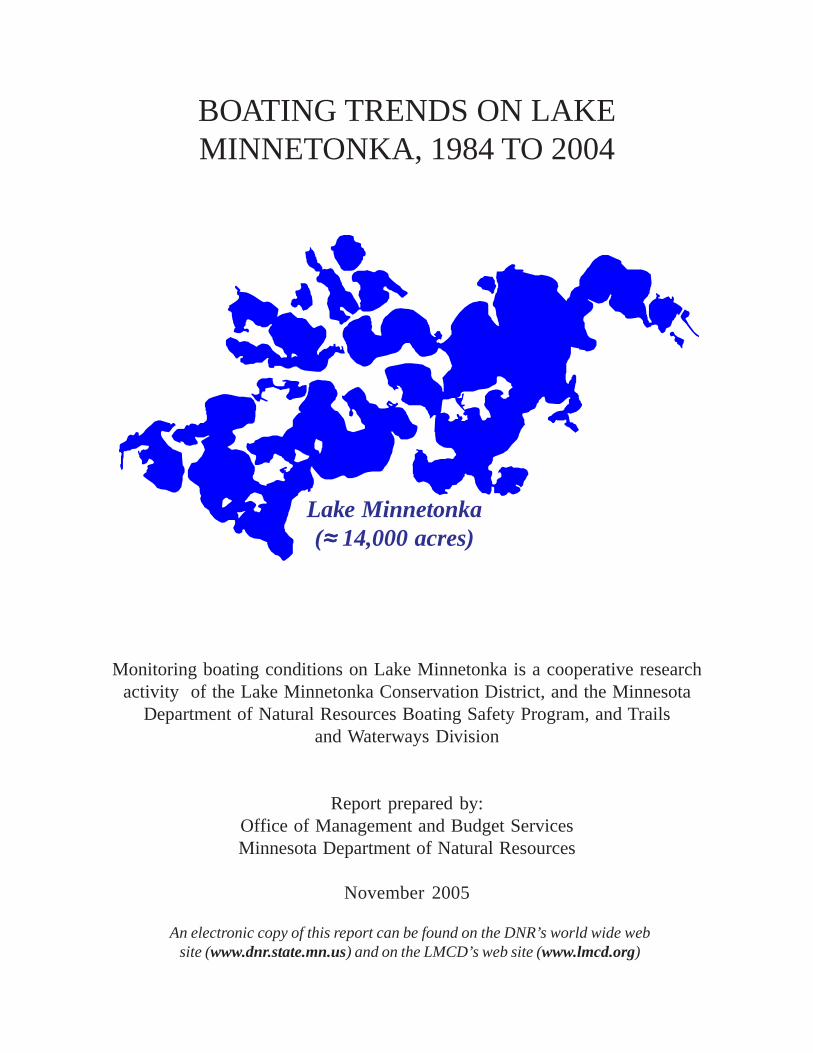
BOATING TRENDS ON LAKEMINNETONKA, 1984 TO 2004
Monitoring boating conditions on Lake Minnetonka is a cooperative researchactivity of the Lake Minnetonka Conservation District, and the Minnesota
Department of Natural Resources Boating Safety Program, and Trailsand Waterways Division
Report prepared by:Office of Management and Budget ServicesMinnesota Department of Natural Resources
November 2005
An electronic copy of this report can be found on the DNR’s world wide website (www.dnr.state.mn.us) and on the LMCD’s web site (www.lmcd.org)
Lake Minnetonka(≈≈≈≈≈ 14,000 acres)

2 Boating Trends on Lake Minnetonka—1984 to 2004
MN Department of Natural Resources 3
CONTENTS
Topic
Summary . . . . . . . . . . . . . . . . . . . . . . . . . . . . . . . . . . . . . . . . . . . . . . . . . . .
Introduction . . . . . . . . . . . . . . . . . . . . . . . . . . . . . . . . . . . . . . . . . . . . . . . . .
Boat Numbers and Sources . . . . . . . . . . . . . . . . . . . . . . . . . . . . . . . . . . . . .
Characteristics of the Boating Trip . . . . . . . . . . . . . . . . . . . . . . . . . . . . . . . .
The Boating Experience . . . . . . . . . . . . . . . . . . . . . . . . . . . . . . . . . . . . . . . .
Boating Safety and Enforcement . . . . . . . . . . . . . . . . . . . . . . . . . . . . . . . . .
Public Access Facilities . . . . . . . . . . . . . . . . . . . . . . . . . . . . . . . . . . . . . . . . .
Preventing the Spread of Exotic Species . . . . . . . . . . . . . . . . . . . . . . . . . . . .
References . . . . . . . . . . . . . . . . . . . . . . . . . . . . . . . . . . . . . . . . . . . . . . . . . .
Appendix A: Methodology . . . . . . . . . . . . . . . . . . . . . . . . . . . . . . . . . . . . .
Appendix B: Statistical Tests of Boat-Number Trends . . . . . . . . . . . . . . . . . .
Page
4
10
12
22
25
30
33
39
41
42
48
4 Boating Trends on Lake Minnetonka—1984 to 2004
SUMMARY
INTRODUCTION
Lake Minnetonka is one of the busiest recreation boating lakes in the State of Minnesota. TheLake is situated at the fringe of the heavily built-up part of the Twin Cities metropolitan area, and islocated where the most rapid metropolitan-wide population growth is occurring. From apopulation perspective, recreation pressure on the Lake can only be expected to continue to growfor the foreseeable future.
Recreational boating on Lake Minnetonka has been studied with a consistent methodology since1984. The methodology includes aerial counts of boat numbers and types; aerial estimations ofsources of the boats on the water (e.g., public accesses, marinas); and surveys of boaters about theiractivities, equipment and experience on the water. All studies cover the summer period fromMemorial Day weekend to Labor Day. The Minnesota Department of Natural Resources (MNDNR) and the Lake Minnetonka Conservation District (LMCD) have designed and funded thesestudies. Within the MN DNR, funding has come from two programs: Water Recreation, and Boatand Water Safety. Private contractors have carried out the data collection for the studies.
This paper is a summary of the major patterns and trends on the Lake during the last two decades.Boating patterns are put into a larger context of boating in the Twin Cities and throughoutMinnesota, so the particular characteristics of Lake Minnetonka boating can be effectivelyportrayed.
BOAT NUMBERS AND SOURCES
Boating in the Twin Cities metropolitan area — where Lake Minnetonka is located — is quitedifferent than boating in the more rural parts of the state. The major difference is the far higherintensity of boating in the metro area. Intensities (boats per acre of water) on typical metro lakesexceed by a factor of four to five those in popular rural lake regions, such as the Brainerd Region.Within the metro area, the largest water bodies are the most popular, as indicated by their intensityof use. Minnetonka (14,034 acres) and the St. Croix River (8,215 acres—Arcola Sandbar tomouth) are the two largest and two most intensively used water bodies in the metro area.
Between 1984 and 2004 average boat numbers at peak times on weekend/holiday afternoons onLake Minnetonka declined, and the decline is statistically significant. Prior to the 2004 study, therewas evidence of a decrease in average weekend/holiday afternoon boat numbers from 1984 to2000, but the decrease was not statistically significant. Stable boat numbers was the indication.Other trend studies from the 1980s to 1990s/early 2000s also pointed to stable boat numbers. TheSt. Croix River, too, had stable boat numbers from the early 1980s to the late 1990s. In short, theLake Minnetonka boating decline is the first such indication from a boating study, and it will needto be followed in the future.
MN Department of Natural Resources 5
On weekdays on Lake Minnetonka, boat counts are fewer in number, and there is no evident trendin average boat numbers, either upward or downward. The 2004 average is lower than either 1996or 2000, but the differences are not statistically significant.
It should be noted that — although the 2004 “average” boat counts are lower than previous years— maximum boat counts are higher. For both weekends/holidays and weekdays, 2004 had thehighest daily boat counts ever recorded since 1984. Large number of boats still go out on theLake, but apparently just not “on average”.
The summer of 2004 was cooler than normal, and this may have diminished boating somewhat,but it does not appear to be a primary factor in accounting for the low number of boats. One otherfactor that could potentially contribute to lower boat numbers from the aerial counts is a temporalshift in boating use (e.g., a shift from weekends to weekdays, or from afternoons to mornings); this,however, does not appear to be a major factor in accounting for the low boat numbers.
The spatial distribution of boating on the Lake has been largely constant from 1984 to 2004. Thesouthwest part of the Lake has the least number of boats relative to lake surface area, while the eastand northwest have substantially higher boat numbers (60% to 80% higher).
The source of boats has changed over time. The long-term trend prior to the 2004 study was:increasing relative contribution from public access, decreasing contribution from commercialaccess (marinas, private ramps, boat rentals, dry stack), and stable contribution from all othersources, which are comprised of riparian residents, municipal dock users, homeowner associationdock users and any others. With the completion of the 2004 study, the relative contribution frompublic access continued to go up as it had prior to 2004. However, the relative contribution fromcommercial access broke with the long-term pattern and increased, while the contribution from allother sources broke with the long-term pattern and decreased. It should be noted that all sourcesproduced fewer boats in 2004 than 2000, but some decreased more than others, which shifted therelative contributions among the sources. For 2004, the sources contributions are approximately asfollows: public access—30%, commercial access—35%, municipal docks—10%, and riparianresidents and homeowner associations—25%.
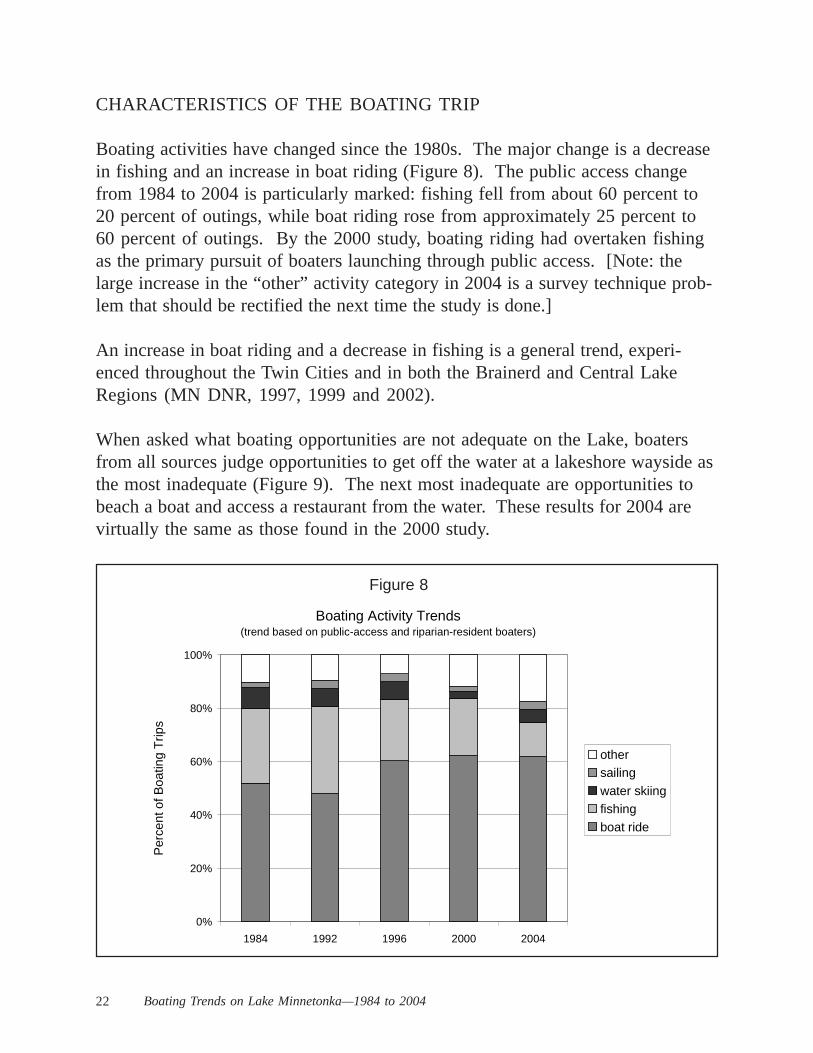
CHARACTERISTICS OF THE BOATING TRIP
Boating activities have changed since the 1980s: boat riding has increased and fishing hasdecreased. An increase in boat riding and a decrease in fishing is a general trend, experiencedthroughout the Twin Cities and in both the Brainerd and Central Lake Regions.
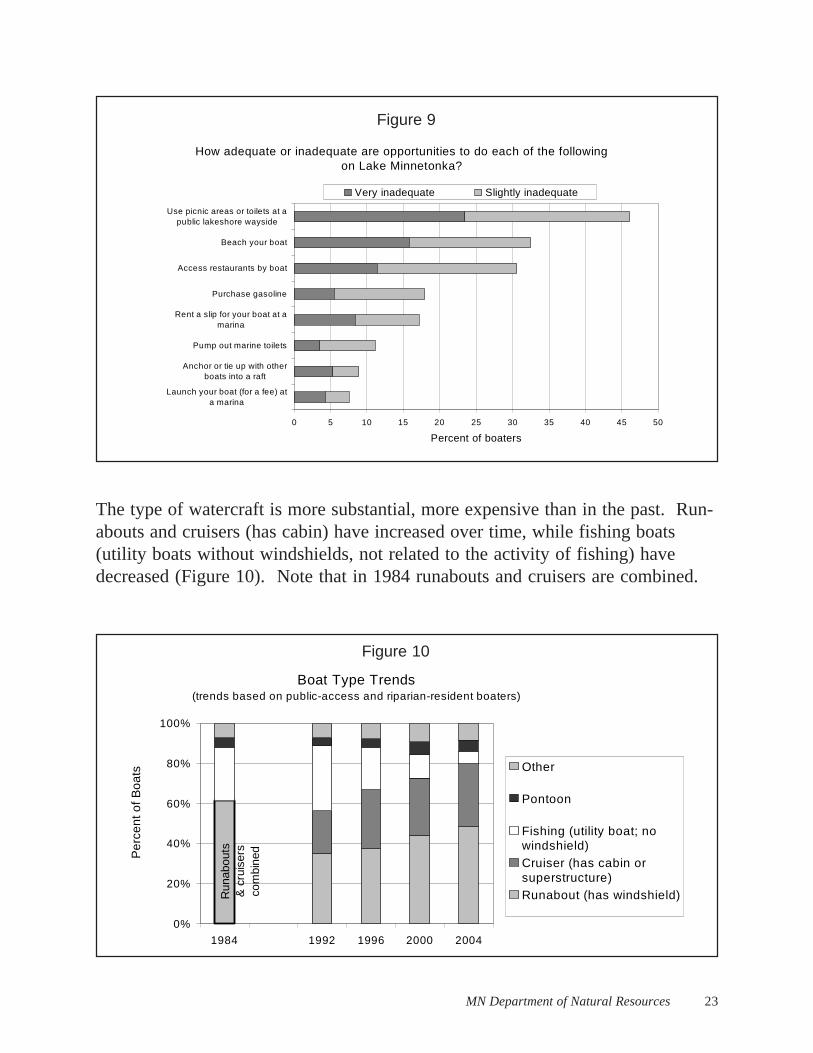
When asked what boating opportunities are not adequate on the Lake, boaters from all sourcesjudge opportunities to get off the water at a lakeshore wayside as the most inadequate. The nextmost inadequate are opportunities to beach a boat and access a restaurant from the water. Theseresults for 2004 are virtually the same as those found in the 2000 study.
6 Boating Trends on Lake Minnetonka—1984 to 2004
The type of watercraft is more substantial, more expensive than in the past. Runabouts andcruisers (has cabin) have increased over time, while fishing boats (utility boats withoutwindshields, not related to the activity of fishing) have decreased.
Consistent with the trend in type of watercraft, boats are longer and more powerful today than theywere in the past. Boat lengths have increased nearly 3 feet since 1992, and engine sizes haveshown an increase of about 90 horsepower since 1984.
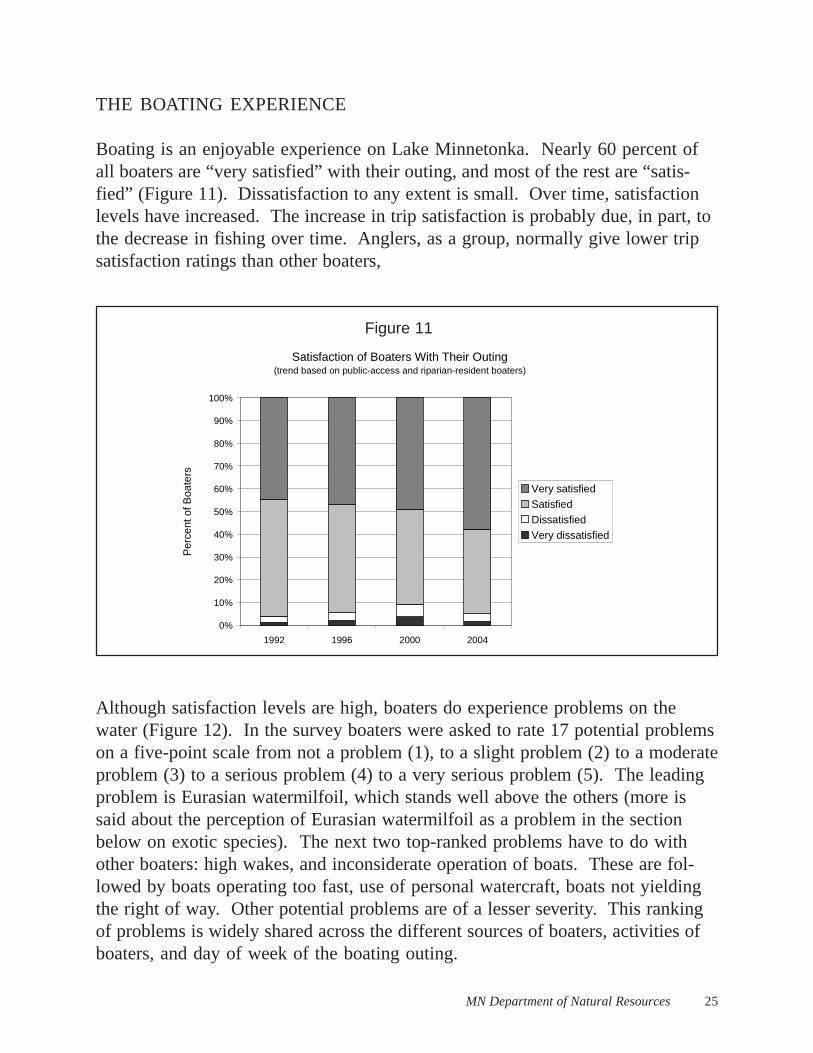
THE BOATING EXPERIENCE
Boating is an enjoyable experience on Lake Minnetonka. Nearly 60 percent of all boaters are“very satisfied” with their outing, and most of the rest are “satisfied”. Dissatisfaction to any extentis small. Over time, satisfaction levels have increased.
Although satisfaction levels are high, boaters do experience problems on the water. The leadingproblem is Eurasian watermilfoil. The next two top-ranked problems have to do with otherboaters: high wakes, and inconsiderate operation of boats.
For most problems, severity ratings changed little over the last few studies. Two problems,however, changed noticeably, and both became less severe since 1996. One of the problems is theuse of personal watercraft and the other is the presence of Eurasian watermilfoil. Riparianresidents led the decline in the severity rating of both watermilfoil and use of personal watercraft.
The intensity of boating (boats per acre of water) on Lake Minnetonka is high, even by boatingstandards in the Twin Cities metropolitan area. Crowding is a persistent problem on the Lake.Crowding, however, is not a growing problem on the Lake. Boaters judged conditions on theLake in 1984 about the same as they do today.
Although Lake Minnetonka is perceived to be more crowded than other metropolitan lakes andrivers, less than 40 percent of boaters judge the number of boats on the Lake as “crowded” or “fartoo crowded.” The majority of boaters describe the number of boats as “about right” or “few boatshere.” Most Lake Minnetonka boaters are experienced with conditions on the Lake, and most arenot surprised by the number of boats they encounter.
BOATING SAFETY AND ENFORCEMENT
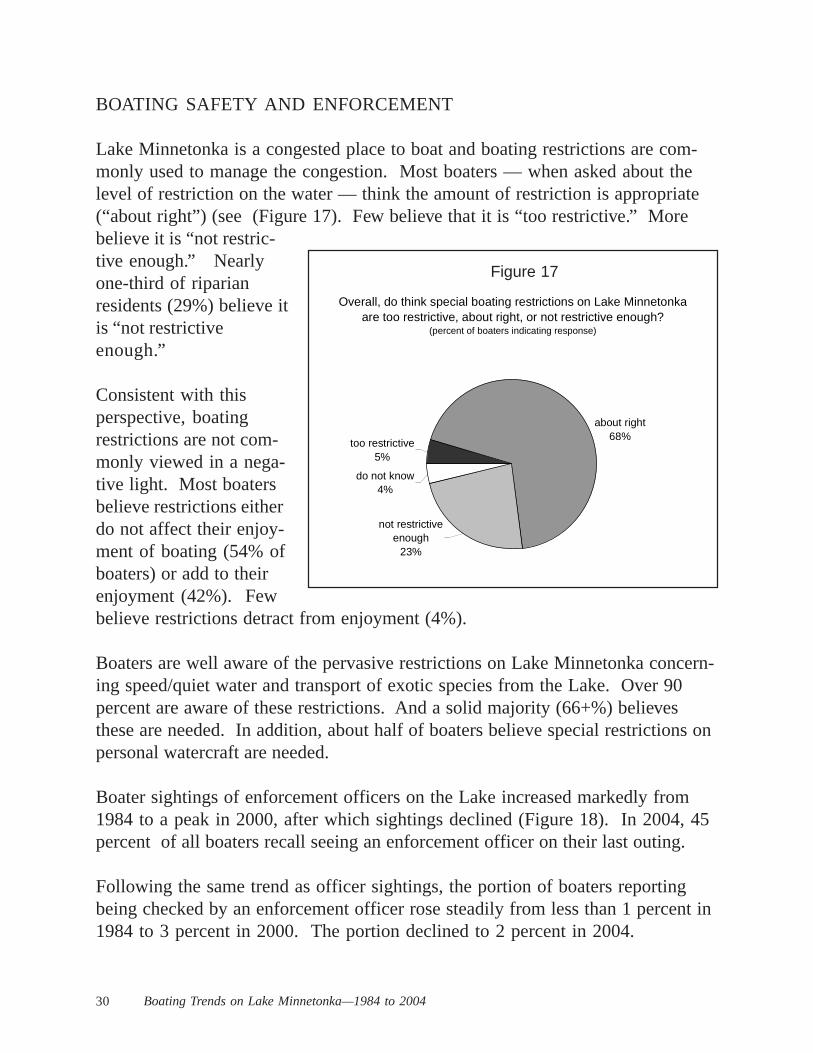
Lake Minnetonka is a congested place to boat and boating restrictions are commonly used tomanage the congestion. Most boaters — when asked about the level of restriction on the water —think the amount of restriction is appropriate (“about right”). Few believe that it is “too restrictive.”More believe it is “not restrictive enough.” Nearly one-third of riparian residents (29%) believe itis “not restrictive enough.”
MN Department of Natural Resources 7
Consistent with this perspective, boating restrictions are not commonly viewed in a negative light.Most boaters believe restrictions either do not affect their enjoyment of boating (54% of boaters) oradd to their enjoyment (42%). Few believe restrictions detract from enjoyment (4%).
Boater sightings of enforcement officers on the Lake increased markedly from 1984 to a peak in2000, after which sightings declined. In 2004, 45 percent of all boaters recall seeing anenforcement officer on their last outing. The level of enforcement effort is judged in 2004 by amajority of boaters as “about right” (52% of boaters). A much smaller portion thinks the effort is“too little” (14%) and even less think it is “too much” (4%). A sizable portion is unsure how torespond (30%), probably indicating that many boaters have little awareness of enforcementactivities on the Lake.
Following the same trend as officer sightings, the portion of boaters reporting being checked by anenforcement officer rose steadily from less than 1 percent in 1984 to 3 percent in 2000, after whichthe portion declined to 2 percent in 2004. Nearly all boaters who were checked by enforcementofficers gave the officers high marks for their professional behavior.
Boaters today are no more likely to have completed a boating safety course than boaters in the past.About one-third of boaters have completed such a course. A higher portion of boaters (49%) thinkthat all boat operators should be required to complete a boating safety course. Some 39 percent ofboaters believe motorboat operators should be required to have an operator’s license. Theseportions are 10 to 20 percent higher than those found in the more rural Brainerd Lakes and CentralLakes Regions, suggesting that licensing and safety courses may be a more pressing concern in themetro area.
The types of beverages boaters have on board has changed little since it was first assessed in 1992.The portion of Minnetonka boaters with alcoholic drinks on board is above that found in theBrainerd Lakes and Central Lakes Region studies, and is similar to that found in the MississippiRiver and Lake Superior studies.
Safety equipment has become more commonplace on boats since 1992. The increasing prevalenceof safety equipment parallels the increasing size of the boats, a trend that was noted above.
PUBLIC ACCESS FACILITIES
As a group, the boaters who are launching through public access facilities are familiar with LakeMinnetonka and with the particular access they are using.
The geographic area from which boaters are drawn to Lake Minnetonka public accesses has notchanged appreciably since 1984.
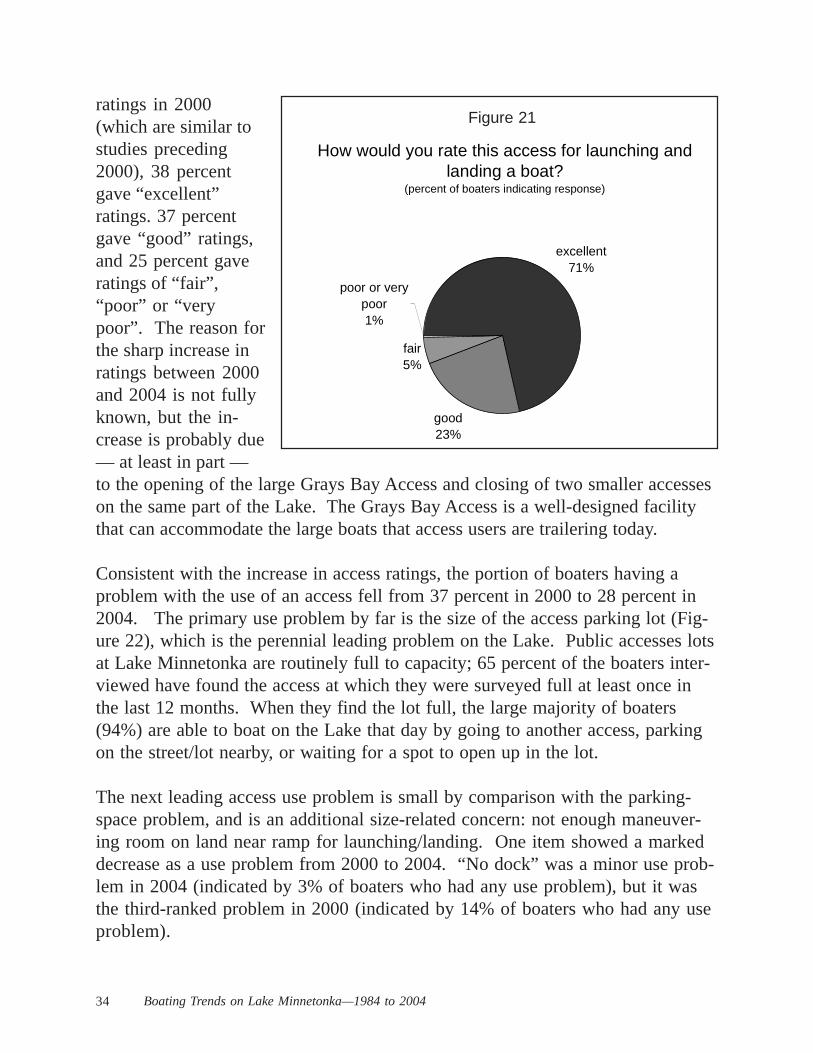
Boaters gave high marks to the public access facilities for landing and launching a boat in 2004,much higher marks than at any time in the past. In 2004, 71 percent gave “excellent” ratings andanother 23 percent gave “good” ratings. The reason for the sharp increase in ratings between 2000
8 Boating Trends on Lake Minnetonka—1984 to 2004
and 2004 is not fully known, but the increase is probably due — at least in part — to the openingof the large Grays Bay Access and closing of two smaller accesses on the same part of the Lake.The Grays Bay Access is a well-designed facility that can accommodate the large boats that accessusers are trailering today
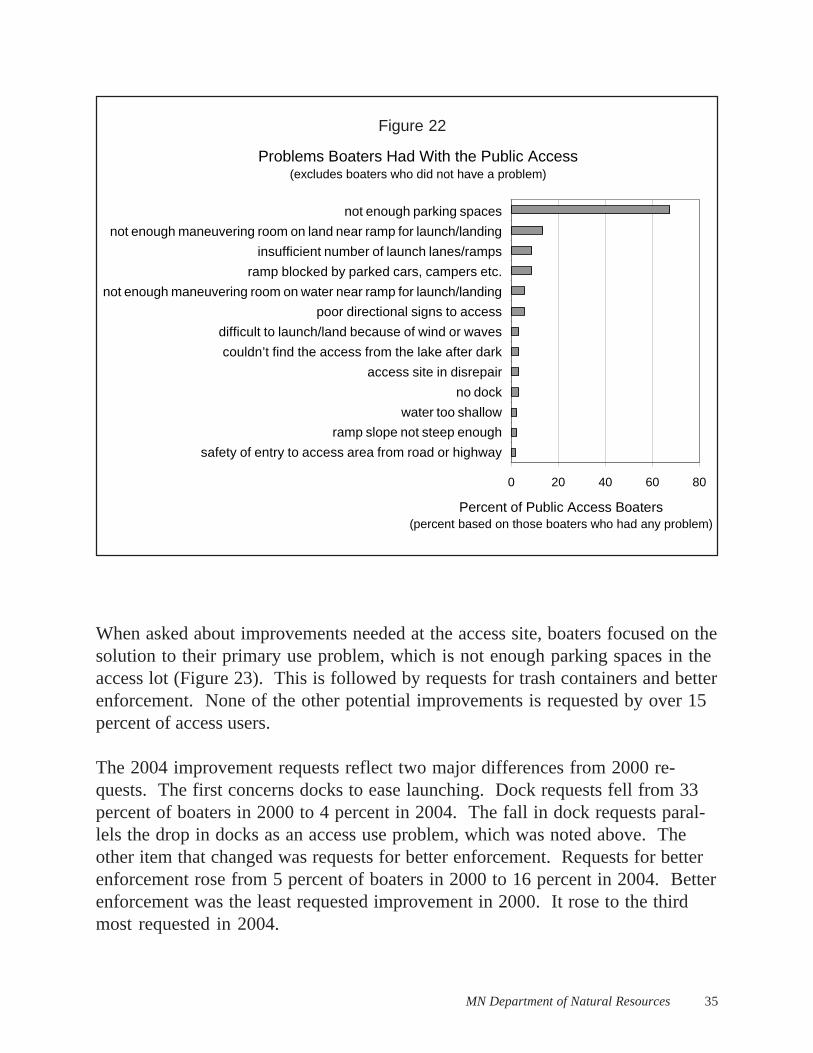
Consistent with the increase in access ratings, the portion of boaters having a problem with the useof an access fell from 37 percent in 2000 to 28 percent in 2004. The primary use problem by far isthe size of the access parking lot, which is the perennial leading problem on the Lake. Publicaccesses lots at Lake Minnetonka are routinely full to capacity. When they find the lot full, thelarge majority of boaters (94%) are able to boat on the Lake that day by going to another access,parking on the street/lot nearby, or waiting for a spot to open up in the lot. The next leading accessuse problem is small by comparison with the parking-space problem, and is an additional size-related concern: not enough maneuvering room on land near ramp for launching/landing. Oneitem showed a marked decrease as a use problem from 2000 to 2004. “No dock” was a minor useproblem in 2004, but it was the third-ranked problem in 2000.
When asked about improvements needed at the access site, boaters focused on the solution to theirprimary use problem, which is not enough parking spaces in the access lot. The 2004improvement requests reflect two major differences from 2000 requests. The first concerns docksto ease launching, which fell from 33 percent of boaters in 2000 to 4 percent in 2004. The fall indock requests parallels the drop in docks as an access use problem. The other item that changedwas requests for better enforcement, which was the least requested improvement in 2000, but thethird most requested in 2004.
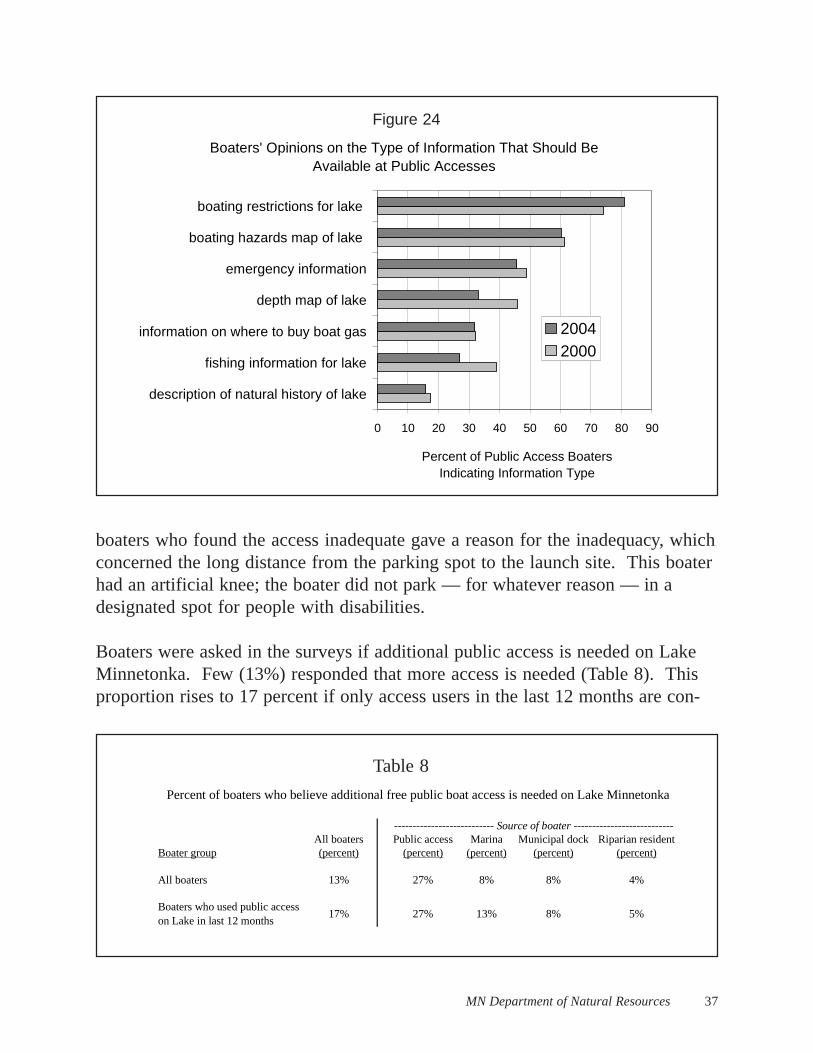
On a similar topic, boaters were asked about the types of information they would want available atpublic access sites. Leading the list of requests — in both 2004 and 2000 — is information onboating restrictions, followed by information on boating hazards, and emergency information.Two items (depth map of lake and fishing information) show decreased requests between 2000 and2004.
The potential use problems of one particular group were queried in the survey: boaters withdisabilities that affect when and where they boat. Some 4 percent of access users (11 surveyrespondents) identified themselves as disabled. Most of these (all but two survey respondents)found the access suitable for their needs. Only one of the two boaters who found the accessinadequate gave a reason for the inadequacy, which concerned the long distance from the parkingspot to the launch site. This boater had an artificial knee; the boater did not park — for whateverreason — in a designated spot for people with disabilities.
Boaters were asked in the surveys if additional public access is needed on Lake Minnetonka. Few(13%) responded that more access is needed. Boaters intercepted at a public access during thestudy saw the highest need for more access (27%), but the large majority of such boaters still sawlittle additional need. Overall, the indication is that most boaters feel well supplied with publicaccess at present.
MN Department of Natural Resources 9
Boaters who saw a need for more public access were asked where on the Lake additional access isneeded. Most boaters specified a location (74%), while some simply responded “anywhere”(26%). Of those who identified a location, nearly two-thirds (63%) indicated the east side of theLake.
PREVENTING THE SPREAD OF EXOTIC SPECIES
Eurasian watermilfoil is considered a leading problem by Lake Minnetonka boaters. In 1992,shortly after the plant’s arrival in the Lake, public access boaters were not convinced that Eurasianwatermilfoil represented a serious problem. At the same time, riparian residents were veryconcerned about the plant, and a sizable perceptual gap existed between the two groups. The gaphas closed considerably since 1992, but has not closed fully. The trend for public access boaters istoward increasing problem severity ratings, while the trend for riparian residents is towarddecreasing problem severity ratings.
Since 1996, boaters have been asked about the actions they take after removing a boat from LakeMinnetonka to help prevent the spread of exotic species such as Eurasian watermilfoil and zebramussels. In 2004, 22 percent of Lake Minnetonka boaters report that they annually transport theirboat between Lake Minnetonka and another body of water. Only 3 percent report transportingtheir boat between Minnetonka and the Mississippi River downstream of St. Paul, where thenearest zebra mussel infestation occurs.
Nearly all boaters who transport their boat between Lake Minnetonka and another body of waterreport doing a few simple things all the time. They conduct a visual inspection of their boat andequipment, clean off vegetation and mussels, and drain water from the boat. Actions that requirespecial equipment or more effort are done less routinely. Such actions include rinsing the boat withhot water of high-pressure water, and allowing the boat to dry for five days. The frequency withwhich actions are taken has not changed a great deal since 1996.
10 Boating Trends on Lake Minnetonka—1984 to 2004
INTRODUCTION
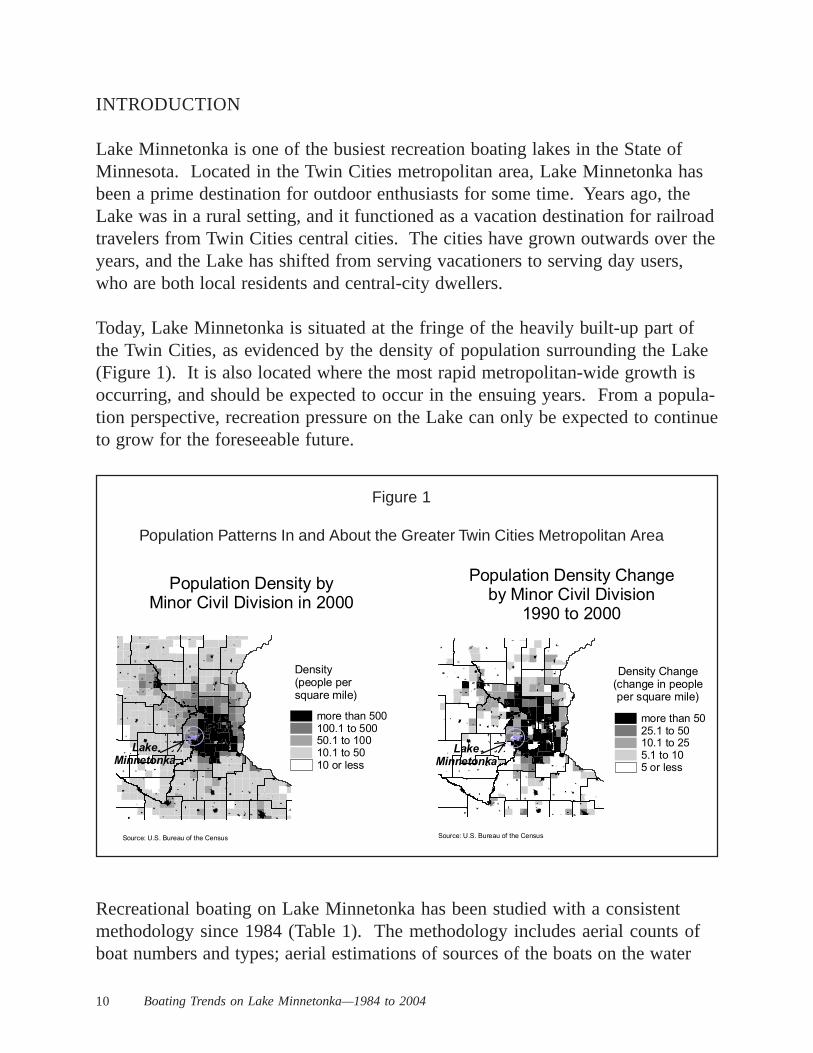
Lake Minnetonka is one of the busiest recreation boating lakes in the State ofMinnesota. Located in the Twin Cities metropolitan area, Lake Minnetonka hasbeen a prime destination for outdoor enthusiasts for some time. Years ago, theLake was in a rural setting, and it functioned as a vacation destination for railroadtravelers from Twin Cities central cities. The cities have grown outwards over theyears, and the Lake has shifted from serving vacationers to serving day users,who are both local residents and central-city dwellers.
Today, Lake Minnetonka is situated at the fringe of the heavily built-up part ofthe Twin Cities, as evidenced by the density of population surrounding the Lake(Figure 1). It is also located where the most rapid metropolitan-wide growth isoccurring, and should be expected to occur in the ensuing years. From a popula-tion perspective, recreation pressure on the Lake can only be expected to continueto grow for the foreseeable future.
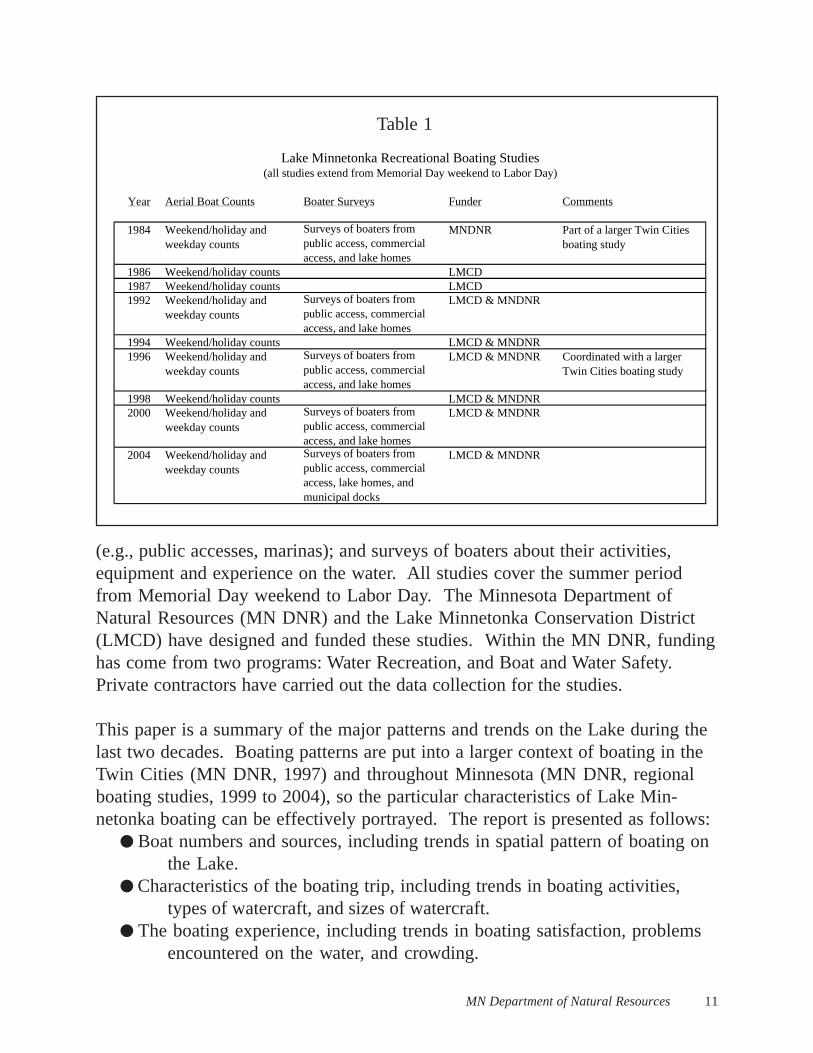
Recreational boating on Lake Minnetonka has been studied with a consistentmethodology since 1984 (Table 1). The methodology includes aerial counts ofboat numbers and types; aerial estimations of sources of the boats on the water
Figure 1
Population Patterns In and About the Greater Twin Cities Metropolitan Area
more than 500100.1 to 50050.1 to 10010.1 to 5010 or less
Density(people persquare mile)
Population Density byMinor Civil Division in 2000
LakeMinnetonka
Source: U.S. Bureau of the Census
Population Density Changeby Minor Civil Division
1990 to 2000
Source: U.S. Bureau of the Census
LakeMinnetonka
more than 5025.1 to 5010.1 to 255.1 to 105 or less
Density Change(change in peopleper square mile)
MN Department of Natural Resources 11
(e.g., public accesses, marinas); and surveys of boaters about their activities,equipment and experience on the water. All studies cover the summer periodfrom Memorial Day weekend to Labor Day. The Minnesota Department ofNatural Resources (MN DNR) and the Lake Minnetonka Conservation District(LMCD) have designed and funded these studies. Within the MN DNR, fundinghas come from two programs: Water Recreation, and Boat and Water Safety.Private contractors have carried out the data collection for the studies.
This paper is a summary of the major patterns and trends on the Lake during thelast two decades. Boating patterns are put into a larger context of boating in theTwin Cities (MN DNR, 1997) and throughout Minnesota (MN DNR, regionalboating studies, 1999 to 2004), so the particular characteristics of Lake Min-netonka boating can be effectively portrayed. The report is presented as follows:
● Boat numbers and sources, including trends in spatial pattern of boating onthe Lake.
● Characteristics of the boating trip, including trends in boating activities,types of watercraft, and sizes of watercraft.
● The boating experience, including trends in boating satisfaction, problemsencountered on the water, and crowding.
Table 1
Year Aerial Boat Counts Boater Surveys Funder Comments
1984 Weekend/holiday and weekday counts
Surveys of boaters from public access, commercial access, and lake homes
MNDNR Part of a larger Twin Cities boating study
1986 Weekend/holiday counts LMCD1987 Weekend/holiday counts LMCD1992 Weekend/holiday and
weekday countsSurveys of boaters from public access, commercial access, and lake homes
LMCD & MNDNR
1994 Weekend/holiday counts LMCD & MNDNR1996 Weekend/holiday and
weekday countsSurveys of boaters from public access, commercial access, and lake homes
LMCD & MNDNR Coordinated with a larger Twin Cities boating study
1998 Weekend/holiday counts LMCD & MNDNR2000 Weekend/holiday and
weekday countsSurveys of boaters from public access, commercial access, and lake homes
LMCD & MNDNR
2004 Weekend/holiday and weekday counts
Surveys of boaters from public access, commercial access, lake homes, and municipal docks
LMCD & MNDNR
Lake Minnetonka Recreational Boating Studies(all studies extend from Memorial Day weekend to Labor Day)
12 Boating Trends on Lake Minnetonka—1984 to 2004
● Boating safety and enforcement, including trends in boater’s awareness ofenforcement officers on the water, and boater’s opinions on the level ofboating restrictions and enforcement presence.
● Public access facilities, including ratings of public access facilities, problemsin the use of facilities, improvements boater’s would like to see at facili-ties, and need for additional facilities.
● Preventing the spread of exotic species, including trends in the perception ofEurasian watermilfoil as a problem on the Lake.
Detailed methodological descriptions are minimized in this summary paper, andonly general descriptions of methods are presented. Appendix A has a fullerdescription of methodology. Each study has a detailed methodological documentavailable for review.
Efforts have been made to keep the studies comparable over time, and this haslargely been accomplished. However, one particular point needs to be madeconcerning trends analysis. Trends results based on boater survey informationonly include surveys with boaters from public accesses and riparian residences,because these are the two sources of boaters that have been done in a consistentfashion over the period from 1984 to 2004. The exclusion of other sources ofboater limits but does not preclude trend analysis. There are many evident trendsexhibited by boaters from public accesses and riparian residences that are clearlyof a general nature. Such trends are presented throughout the paper. Appendix Agives a more detailed description of this particular point.
BOAT NUMBERS AND SOURCES
Boating in the Twin Cities metropolitan area — where Lake Minnetonka is lo-cated — is quite different than boating in the more rural parts of the state. Themajor difference is the far higher intensity of boating in the metro area. Intensi-ties (boats per acre of water) on typical metro lakes exceed by a factor of four tofive those in popular rural lake regions (e.g., Brainerd Lakes Region) (see MNDNR, 1997 and 1999). Compounding this higher boating intensity in the metroarea is the portion of boats that are moving and add to congestion, since a mov-ing boat consumes more space than a stationary one. In the metro area, the por-tion moving is twice that of the Brainerd area (two-thirds moving versus one-third). Recreation boating, like many aspects of urban living, involves having alot of other people around.
MN Department of Natural Resources 13
Within the metro area, the largest water bodies are the most popular, as indicatedby their intensity of use (boats per acre of water). Minnetonka (14,034 acres) andthe St. Croix River (8,215 acres — Arcola Sandbar to mouth) are the two largestand two most intensively used water bodies. Together these two water bodiesaccount for 43 percent of metro-wide boating in 1996 but only 30 percent ofmetro-wide water surface area on boating lakes and rivers (lakes/rivers over 100acres with permanent fish populations). The St. Croix River had a higher inten-sity of boating use than Lake Minnetonka in the 1990s.
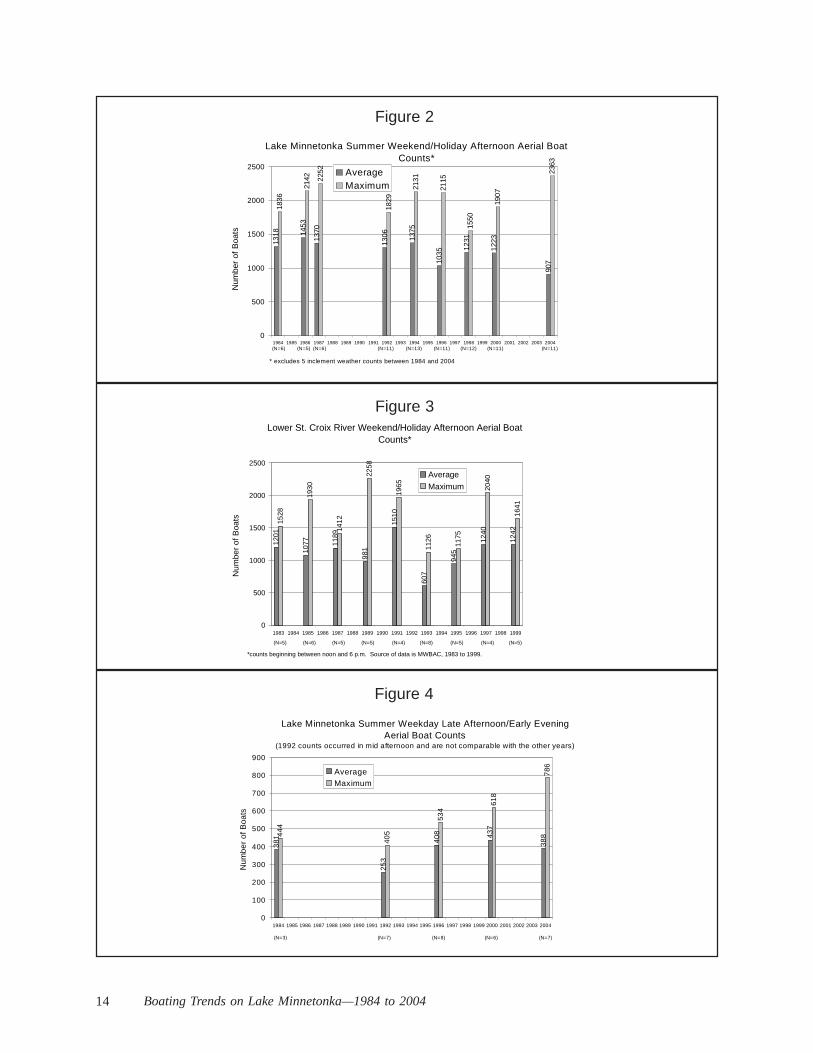
Between 1984 and 2004 average boat numbers at peak times on weekend/holi-day afternoons on Lake Minnetonka declined, and the decline is statisticallysignificant (Figure 2)(see Appendix B for details on statistical tests). Prior to the2004 study, there was evidence of a decrease in average weekend/holiday after-noon boat numbers from 1984 to 2000, but the decrease was not statisticallysignificant. Stable boat numbers was the indication. Other trend studies from the1980s to 1990s/early 2000s also pointed to stable boat numbers (MN DNR,regional boating studies, 1997, 1999 and 2002). The St. Croix River, too, hadstable boat numbers from the early 1980s to the late 1990s (Figure 3). In short,the Lake Minnetonka boating decline is the first such indication from a boatingstudy, and it will need to be followed in the future.
On weekdays on Lake Minnetonka, boat counts are fewer in number, and there isno evident trend in average boat numbers, either upward or downward (Figure4)(see Appendix B for details on statistical tests). The 2004 average is lower thaneither 1996 or 2000, but the differences are not statistically significant. The lowaverage in 1992 is due mainly to earlier flight times in mid afternoon, prior topeak numbers that occur in late afternoon when the boat counts are supposed tobe scheduled. The 1992 weekday flight times were a mistake; flights were con-ducted at the same time as the mid-afternoon weekend/holiday flight times.
It should be noted that — although the 2004 “average” boat counts are lowerthan previous years — maximum boat counts are higher. For both weekends/holidays and weekdays, 2004 had the highest daily boat counts ever recordedsince 1984. Large number of boats still go out on the Lake, but apparently justnot “on average”.
Another good indicator of the low “average” number of boats in 2004 comesfrom the public access boat counts. During the aerial flights, empty boat trailersare counted at the public accesses lots (and at overflow sites) to determine the
14 Boating Trends on Lake Minnetonka—1984 to 2004
Figure 2
Figure 3
Figure 4
Lower St. Croix River Weekend/Holiday Afternoon Aerial Boat Counts*
1201
1077 11
89
981
1510
607
945
1240
1242
1528
1930
1412
2258
1965
1126
1175
2040
1641
0
500
1000
1500
2000
2500
1983 1984 1985 1986 1987 1988 1989 1990 1991 1992 1993 1994 1995 1996 1997 1998 1999
*counts beginning between noon and 6 p.m. Source of data is MWBAC, 1983 to 1999.
Num
ber
of B
oats
Average
Maximum
(N=5) (N=6) (N=5) (N=5) (N=4) (N=8) (N=5) (N=4) (N=5)
Lake Minnetonka Summer Weekend/Holiday Afternoon Aerial Boat Counts*
1453
1370
1306 13
75
1035
1231
1223
907
1836
2142 22
52
1829
2131
2115
1550
1907
2363
1318
0
500
1000
1500
2000
2500
1984 1985 1986 1987 1988 1989 1990 1991 1992 1993 1994 1995 1996 1997 1998 1999 2000 2001 2002 2003 2004
* excludes 5 inclement weather counts between 1984 and 2004
Num
ber
of B
oats
AverageMaximum
(N=6) (N=5) (N=6) (N=11) (N=13) (N=11) (N=12) (N=11) (N=11)
Lake Minnetonka Summer Weekday Late Afternoon/Early Evening Aerial Boat Counts
(1992 counts occurred in mid afternoon and are not comparable with the other years)
381
253
408 43
7
38
8
405
534
618
786
44
4
0
100
200
300
400
500
600
700
800
900
1984 1985 1986 1987 1988 1989 1990 1991 1992 1993 1994 1995 1996 1997 1998 1999 2000 2001 2002 2003 2004
Num
ber
of B
oats
AverageMaximum
(N=3) (N=7) (N=8) (N=6) (N=7)
MN Department of Natural Resources 15
contribution of public access to all boats on the water. The count is relativelystraightforward and, thus, is considered one of the more accurate boating mea-sures in the studies. Public access contributes some 25 to 30 percent of all boatson the Lake.
Between the 2000 and 2004 study, the large Grays Bay public access opened,and increased net public access capacity to launch boats on the Lake (two smallerpublic accesses were closed when Grays Bay was opened). Capacity utilization istraditionally high for Lake Minnetonka public accesses, and the added capacityfrom Grays Bay would be expected to increase boats on the water from the ac-cesses. The additional capacity, however, did not lead to an increase in boatsfrom public access. The number of boats from public access actually fell from2000 to 2004 on both weekend/holidays (7% decrease) and weekdays (5% de-crease), providing further indications that 2004 was a low boating year.
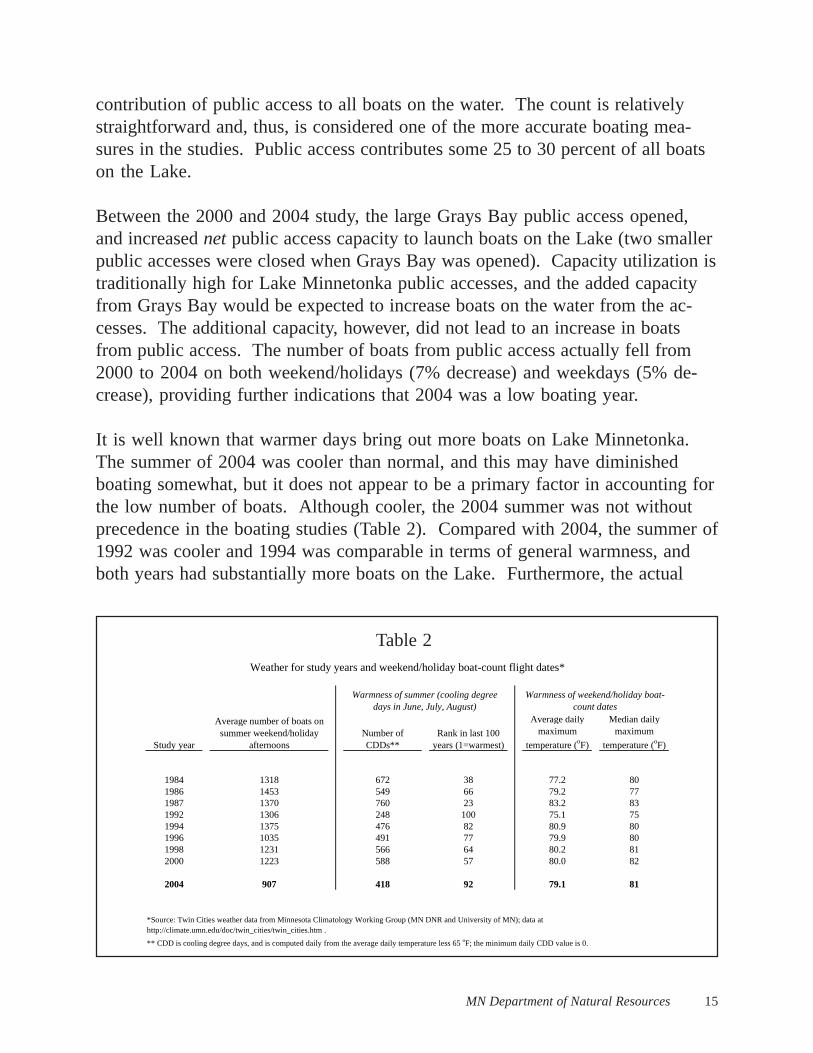
It is well known that warmer days bring out more boats on Lake Minnetonka.The summer of 2004 was cooler than normal, and this may have diminishedboating somewhat, but it does not appear to be a primary factor in accounting forthe low number of boats. Although cooler, the 2004 summer was not withoutprecedence in the boating studies (Table 2). Compared with 2004, the summer of1992 was cooler and 1994 was comparable in terms of general warmness, andboth years had substantially more boats on the Lake. Furthermore, the actual
Table 2
Study year
Average number of boats on summer weekend/holiday
afternoonsNumber of CDDs**
Rank in last 100 years (1=warmest)
Average daily maximum
temperature (oF)
Median daily maximum
temperature (oF)
1984 1318 672 38 77.2 801986 1453 549 66 79.2 771987 1370 760 23 83.2 831992 1306 248 100 75.1 751994 1375 476 82 80.9 801996 1035 491 77 79.9 801998 1231 566 64 80.2 812000 1223 588 57 80.0 82
2004 907 418 92 79.1 81
** CDD is cooling degree days, and is computed daily from the average daily temperature less 65 oF; the minimum daily CDD value is 0.
*Source: Twin Cities weather data from Minnesota Climatology Working Group (MN DNR and University of MN); data at http://climate.umn.edu/doc/twin_cities/twin_cities.htm .
Warmness of summer (cooling degree days in June, July, August)
Warmness of weekend/holiday boat-count dates
Weather for study years and weekend/holiday boat-count flight dates*
16 Boating Trends on Lake Minnetonka—1984 to 2004
afternoon temperature on the dates of the 2004 flights were similar to many otheryears.
One other factor that could potentially contribute to lower boat numbers from theaerial counts is a temporal shift in boating use; this, however, does not appear tobe a major factor in accounting for the low number of boats. The preceding boatcounts occurred at peak times, which are mid afternoons for weekend/holidaysand late afternoon for weekdays. It is possible that the decline at peak times isnot indicative of declining boat numbers at all times. The decline could be, forexample, due to boaters avoiding the peaks and shifting their use to lower useperiods, whether from weekend/holidays to weekdays, or from the mid afternoonto morning or evenings on weekend/holiday.
An indicator of such temporal boating shifts is monitored in the boating studiesthrough the riparian resident boating patterns derived from their boater survey. Ifany source of boaters has the fewest impediments to shifting their boating to less-congested (or any other) times, riparian residents would be a leading candidate.They can boat anytime they are at home, with little time devoted to transportingthemselves and their boat to and from the Lake.
The riparian residents, in all survey years, were asked to indicate the date andtime of their last boating outing. There was no pattern to when residents receivedtheir surveys initially or remails to nonrespondents, so there is no apparent bias inwhen they were asked about their most recent boating outing. Information onthe most recent outing was analyzed for day of week, and time of day changesfrom 1984 to 2004.
Little if any change is evident in riparian resident boating over the years. Theportion of boatingthat occurs on week-days versus week-end/holidays fluctu-ates around the 50-50 level, which iscommon for out-door recreationactivities (Table 3).Within both week-days and weekend/
Table 3
Average1984 1992 1996 2000 2004 1984 to 2004
Day of week (percent) (percent) (percent) (percent) (percent) (percent)
Weekends/holidays 45 58 47 53 54 51Weekdays 55 42 53 47 46 49
Total percent 100 100 100 100 100 100
Number of respondents 131 288 285 297 301
Distribution of Riparian Resident Boating Trips by Day of Week
MN Department of Natural Resources 17
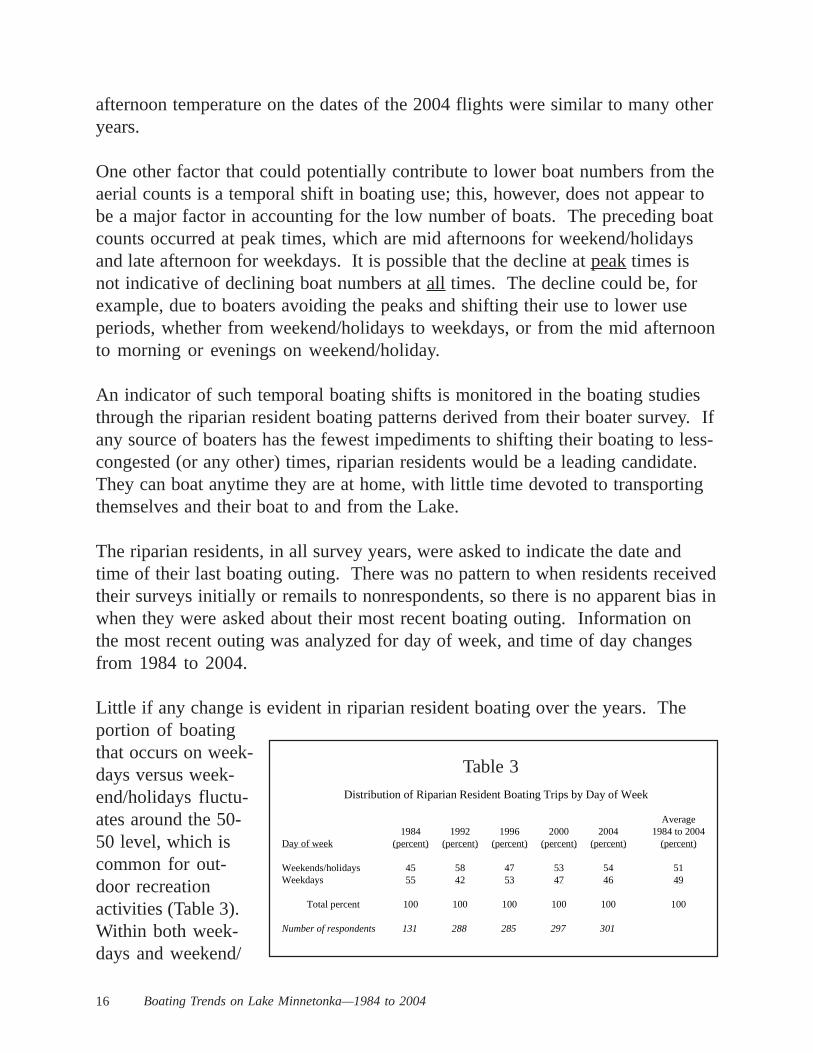
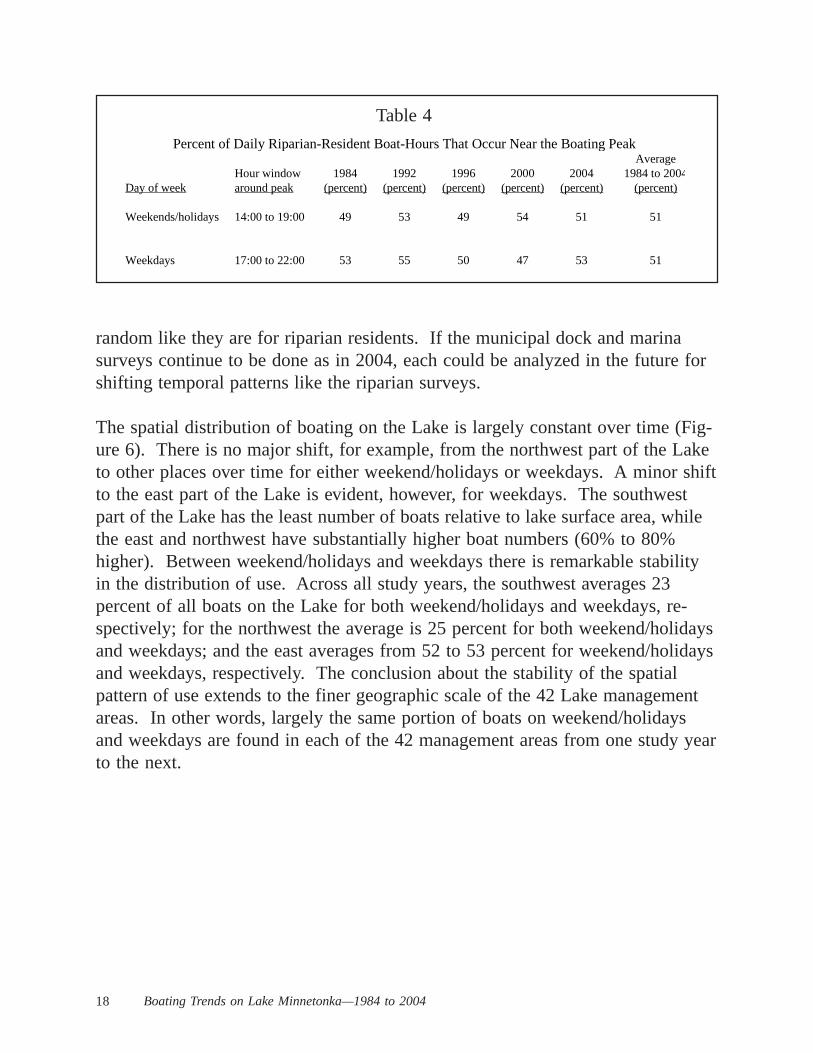
holidays the diurnal profiles of use from one year to the next are similar, andthere is no apparent trend over time (Figure 5). The portion of boating that oc-curs within a window centered on the peak has stayed largely constant over timefor both weekdays and weekend/holidays (Table 4). In short, there is no evi-dence that a shift in boating to lower-use (or higher-use) periods has occurred forriparian residents. This conclusion probably applies to the other sources of boat-ers, too, but the survey data are not adequate for a similar analysis. For publicaccess boating, the study design selects the dates and times to intercept boaters asthey exit or enter the Lake. Thus, the dates and times of boating outings are not
Figure 5
Daily Boating Patterns of Riparian Residents on Lake Minnetonka, 1984 to 2004
Diurnal Distribution of Weekend/Holiday Boating
0
2
4
6
8
10
12
14
16
1 2 3 4 5 6 7 8 9 10 11 12 13 14 15 16 17 18 19 20 21 22 23 24
Hour of Day
Per
cent
of D
aily
Boa
t-H
ours
19841992199620002004
Diurnal Distribution of Weekday Boating
0
2
4
6
8
10
12
14
16
1 2 3 4 5 6 7 8 9 10 11 12 13 14 15 16 17 18 19 20 21 22 23 24
Hour of Day
Per
cent
of D
aily
Boa
t-H
ours
19841992199620002004
18 Boating Trends on Lake Minnetonka—1984 to 2004
Table 4
random like they are for riparian residents. If the municipal dock and marinasurveys continue to be done as in 2004, each could be analyzed in the future forshifting temporal patterns like the riparian surveys.
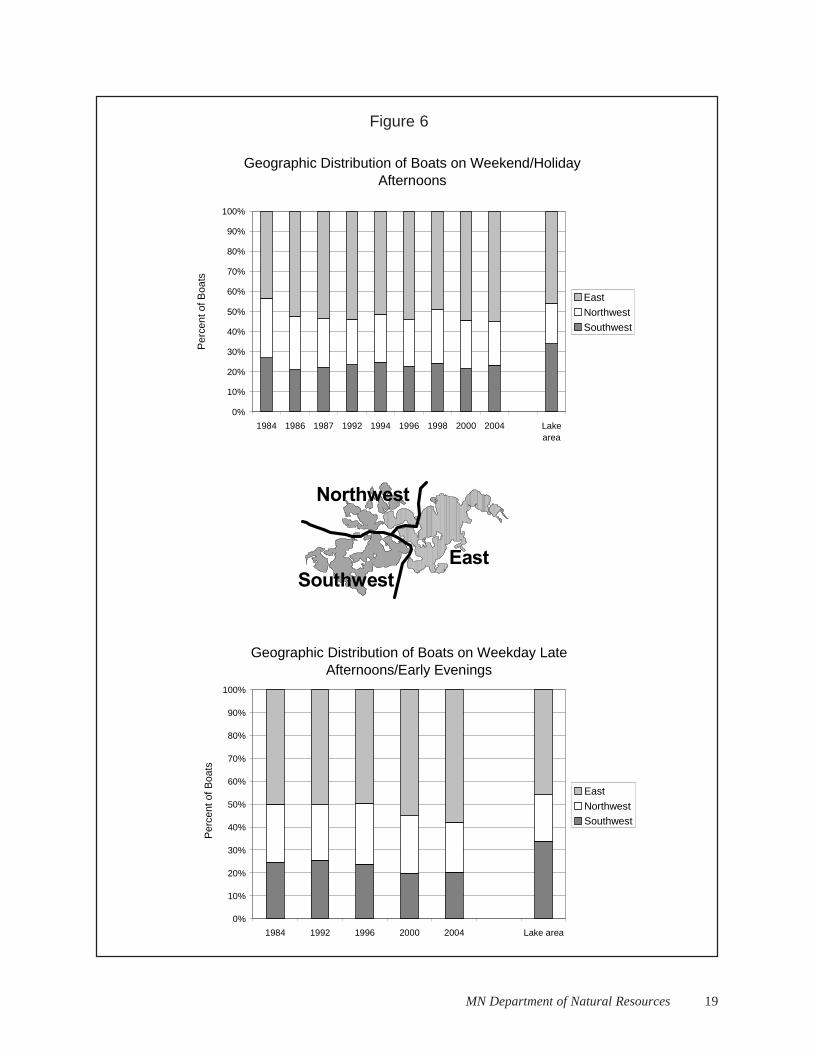
The spatial distribution of boating on the Lake is largely constant over time (Fig-ure 6). There is no major shift, for example, from the northwest part of the Laketo other places over time for either weekend/holidays or weekdays. A minor shiftto the east part of the Lake is evident, however, for weekdays. The southwestpart of the Lake has the least number of boats relative to lake surface area, whilethe east and northwest have substantially higher boat numbers (60% to 80%higher). Between weekend/holidays and weekdays there is remarkable stabilityin the distribution of use. Across all study years, the southwest averages 23percent of all boats on the Lake for both weekend/holidays and weekdays, re-spectively; for the northwest the average is 25 percent for both weekend/holidaysand weekdays; and the east averages from 52 to 53 percent for weekend/holidaysand weekdays, respectively. The conclusion about the stability of the spatialpattern of use extends to the finer geographic scale of the 42 Lake managementareas. In other words, largely the same portion of boats on weekend/holidaysand weekdays are found in each of the 42 management areas from one study yearto the next.
AverageHour window 1984 1992 1996 2000 2004 1984 to 2004
Day of week around peak (percent) (percent) (percent) (percent) (percent) (percent)
Weekends/holidays 14:00 to 19:00 49 53 49 54 51 51
Weekdays 17:00 to 22:00 53 55 50 47 53 51
Percent of Daily Riparian-Resident Boat-Hours That Occur Near the Boating Peak
MN Department of Natural Resources 19
Figure 6
East
Northwest
Southwest
Geographic Distribution of Boats on Weekend/Holiday Afternoons
0%
10%
20%
30%
40%
50%
60%
70%
80%
90%
100%
1984 1986 1987 1992 1994 1996 1998 2000 2004 Lakearea
Per
cent
of B
oats
East
Northwest
Southwest
Geographic Distribution of Boats on Weekday Late Afternoons/Early Evenings
0%
10%
20%
30%
40%
50%
60%
70%
80%
90%
100%
1984 1992 1996 2000 2004 Lake area
Per
cent
of B
oats
East
NorthwestSouthwest
20 Boating Trends on Lake Minnetonka—1984 to 2004
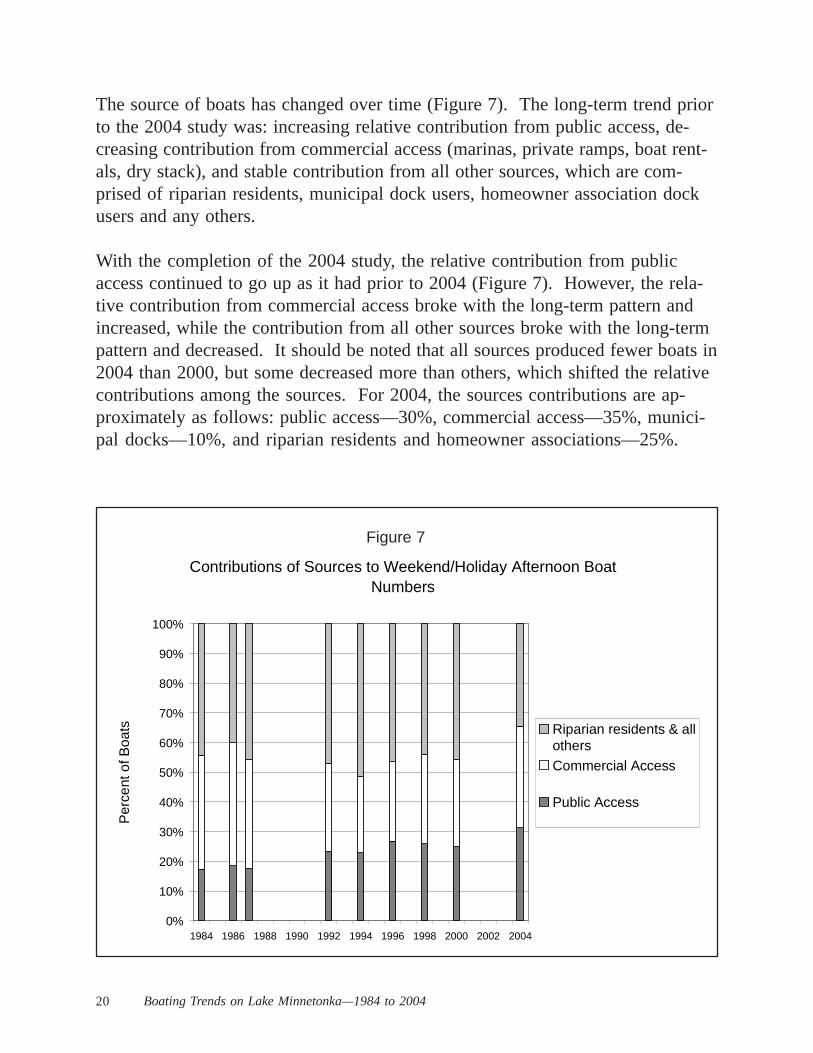
The source of boats has changed over time (Figure 7). The long-term trend priorto the 2004 study was: increasing relative contribution from public access, de-creasing contribution from commercial access (marinas, private ramps, boat rent-als, dry stack), and stable contribution from all other sources, which are com-prised of riparian residents, municipal dock users, homeowner association dockusers and any others.
With the completion of the 2004 study, the relative contribution from publicaccess continued to go up as it had prior to 2004 (Figure 7). However, the rela-tive contribution from commercial access broke with the long-term pattern andincreased, while the contribution from all other sources broke with the long-termpattern and decreased. It should be noted that all sources produced fewer boats in2004 than 2000, but some decreased more than others, which shifted the relativecontributions among the sources. For 2004, the sources contributions are ap-proximately as follows: public access—30%, commercial access—35%, munici-pal docks—10%, and riparian residents and homeowner associations—25%.
Figure 7
Contributions of Sources to Weekend/Holiday Afternoon Boat Numbers
0%
10%
20%
30%
40%
50%
60%
70%
80%
90%
100%
1984 1986 1988 1990 1992 1994 1996 1998 2000 2002 2004
Per
cent
of B
oats Riparian residents & all
othersCommercial Access
Public Access
MN Department of Natural Resources 21
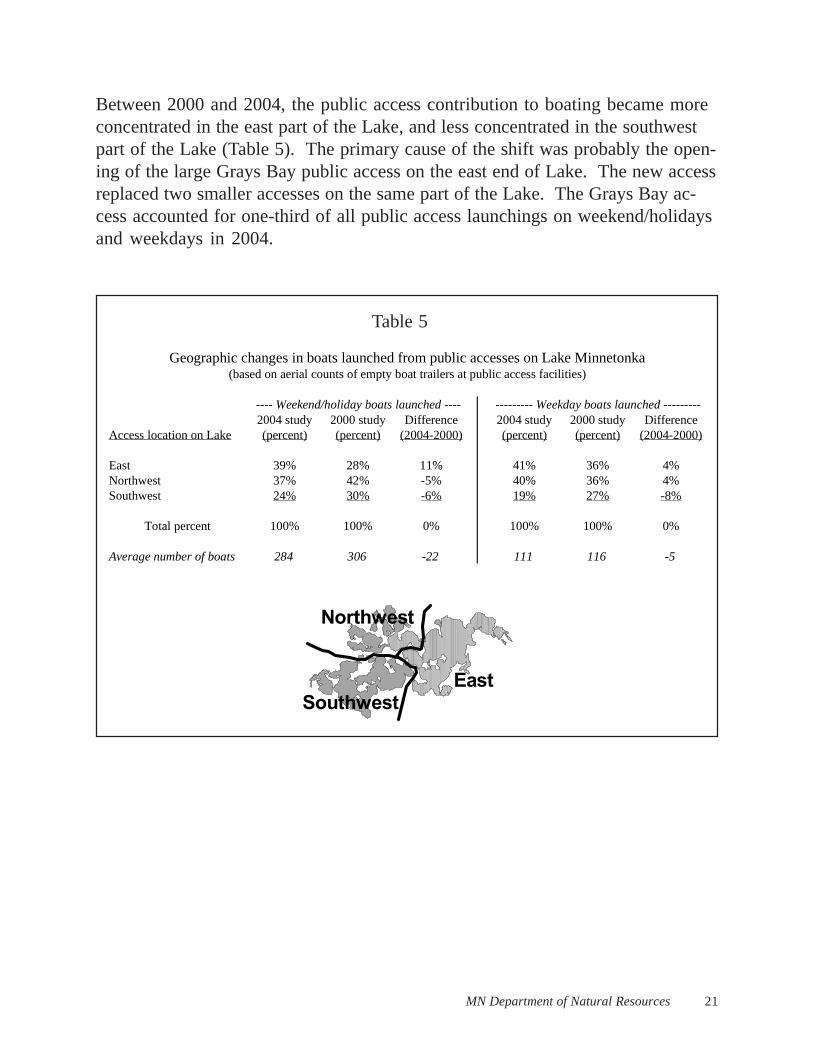
2004 study 2000 study Difference 2004 study 2000 study DifferenceAccess location on Lake (percent) (percent) (2004-2000) (percent) (percent) (2004-2000)
East 39% 28% 11% 41% 36% 4%Northwest 37% 42% -5% 40% 36% 4%Southwest 24% 30% -6% 19% 27% -8%
Total percent 100% 100% 0% 100% 100% 0%
Average number of boats 284 306 -22 111 116 -5
---- Weekend/holiday boats launched ---- --------- Weekday boats launched ---------
Geographic changes in boats launched from public accesses on Lake Minnetonka(based on aerial counts of empty boat trailers at public access facilities)
East
Northwest
Southwest
Between 2000 and 2004, the public access contribution to boating became moreconcentrated in the east part of the Lake, and less concentrated in the southwestpart of the Lake (Table 5). The primary cause of the shift was probably the open-ing of the large Grays Bay public access on the east end of Lake. The new accessreplaced two smaller accesses on the same part of the Lake. The Grays Bay ac-cess accounted for one-third of all public access launchings on weekend/holidaysand weekdays in 2004.
Table 5
22 Boating Trends on Lake Minnetonka—1984 to 2004
CHARACTERISTICS OF THE BOATING TRIP
Boating activities have changed since the 1980s. The major change is a decreasein fishing and an increase in boat riding (Figure 8). The public access changefrom 1984 to 2004 is particularly marked: fishing fell from about 60 percent to20 percent of outings, while boat riding rose from approximately 25 percent to60 percent of outings. By the 2000 study, boating riding had overtaken fishingas the primary pursuit of boaters launching through public access. [Note: thelarge increase in the “other” activity category in 2004 is a survey technique prob-lem that should be rectified the next time the study is done.]
An increase in boat riding and a decrease in fishing is a general trend, experi-enced throughout the Twin Cities and in both the Brainerd and Central LakeRegions (MN DNR, 1997, 1999 and 2002).
When asked what boating opportunities are not adequate on the Lake, boatersfrom all sources judge opportunities to get off the water at a lakeshore wayside asthe most inadequate (Figure 9). The next most inadequate are opportunities tobeach a boat and access a restaurant from the water. These results for 2004 arevirtually the same as those found in the 2000 study.
Figure 8
Boating Activity Trends(trend based on public-access and riparian-resident boaters)
0%
20%
40%
60%
80%
100%
1984 1992 1996 2000 2004
Per
cent
of B
oatin
g T
rips
othersailing
water skiingfishing
boat ride
MN Department of Natural Resources 23
Figure 9
Figure 10
The type of watercraft is more substantial, more expensive than in the past. Run-abouts and cruisers (has cabin) have increased over time, while fishing boats(utility boats without windshields, not related to the activity of fishing) havedecreased (Figure 10). Note that in 1984 runabouts and cruisers are combined.
Boat Type Trends(trends based on public-access and riparian-resident boaters)
0%
20%
40%
60%
80%
100%
1984 1992 1996 2000 2004
Run
abou
ts
& c
ruis
ers
com
bine
dPer
cent
of B
oats Other
Pontoon
Fishing (utility boat; nowindshield)Cruiser (has cabin orsuperstructure)Runabout (has windshield)
How adequate or inadequate are opportunities to do each of the following on Lake Minnetonka?
0 5 10 15 20 25 30 35 40 45 50
Launch your boat (for a fee) ata marina
Anchor or tie up with otherboats into a raft
Pump out marine toilets
Rent a slip for your boat at amarina
Purchase gasoline
Access restaurants by boat
Beach your boat
Use picnic areas or toilets at apublic lakeshore wayside
Percent of boaters
Very inadequate Slightly inadequate
24 Boating Trends on Lake Minnetonka—1984 to 2004
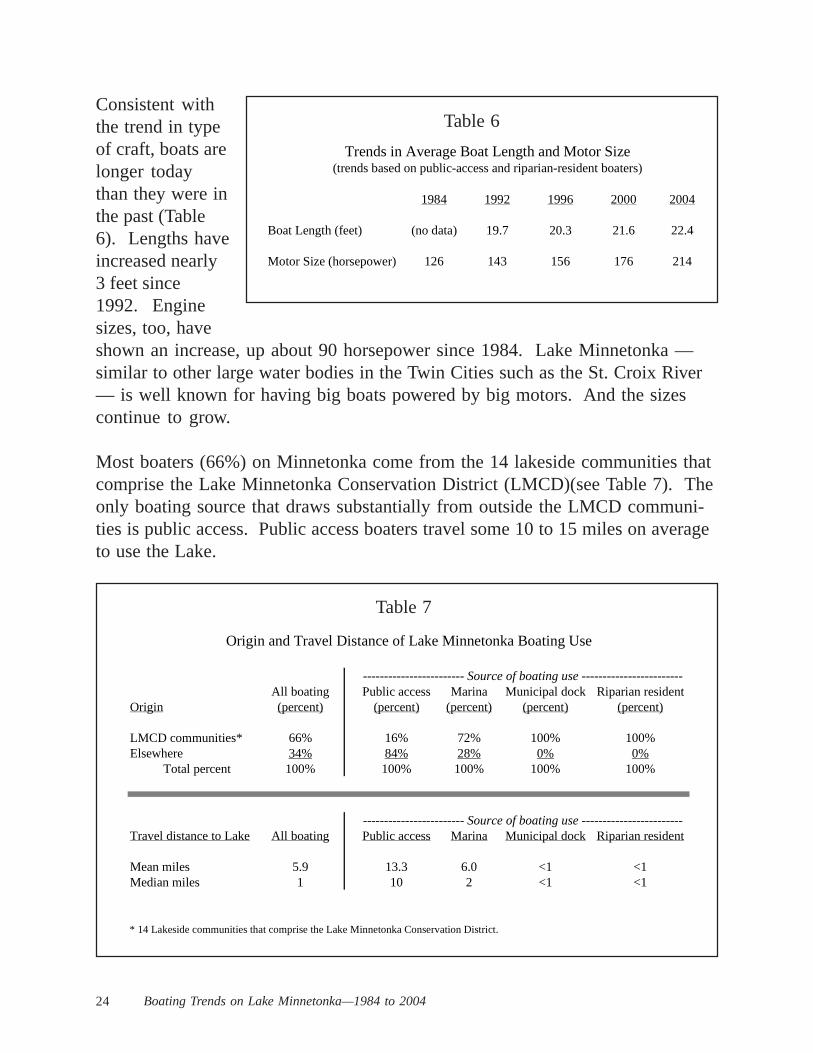
Consistent withthe trend in typeof craft, boats arelonger todaythan they were inthe past (Table6). Lengths haveincreased nearly3 feet since1992. Enginesizes, too, haveshown an increase, up about 90 horsepower since 1984. Lake Minnetonka —similar to other large water bodies in the Twin Cities such as the St. Croix River— is well known for having big boats powered by big motors. And the sizescontinue to grow.
Most boaters (66%) on Minnetonka come from the 14 lakeside communities thatcomprise the Lake Minnetonka Conservation District (LMCD)(see Table 7). Theonly boating source that draws substantially from outside the LMCD communi-ties is public access. Public access boaters travel some 10 to 15 miles on averageto use the Lake.
Table 6
1984 1992 1996 2000 2004
Boat Length (feet) (no data) 19.7 20.3 21.6 22.4
Motor Size (horsepower) 126 143 156 176 214
Trends in Average Boat Length and Motor Size(trends based on public-access and riparian-resident boaters)
All boating Public access Marina Municipal dock Riparian residentOrigin (percent) (percent) (percent) (percent) (percent)
LMCD communities* 66% 16% 72% 100% 100%Elsewhere 34% 84% 28% 0% 0%
Total percent 100% 100% 100% 100% 100%
Travel distance to Lake All boating Public access Marina Municipal dock Riparian resident
Mean miles 5.9 13.3 6.0 <1 <1Median miles 1 10 2 <1 <1
* 14 Lakeside communities that comprise the Lake Minnetonka Conservation District.
Origin and Travel Distance of Lake Minnetonka Boating Use
------------------------ Source of boating use ------------------------
------------------------ Source of boating use ------------------------
Table 7
MN Department of Natural Resources 25
THE BOATING EXPERIENCE
Boating is an enjoyable experience on Lake Minnetonka. Nearly 60 percent ofall boaters are “very satisfied” with their outing, and most of the rest are “satis-fied” (Figure 11). Dissatisfaction to any extent is small. Over time, satisfactionlevels have increased. The increase in trip satisfaction is probably due, in part, tothe decrease in fishing over time. Anglers, as a group, normally give lower tripsatisfaction ratings than other boaters,
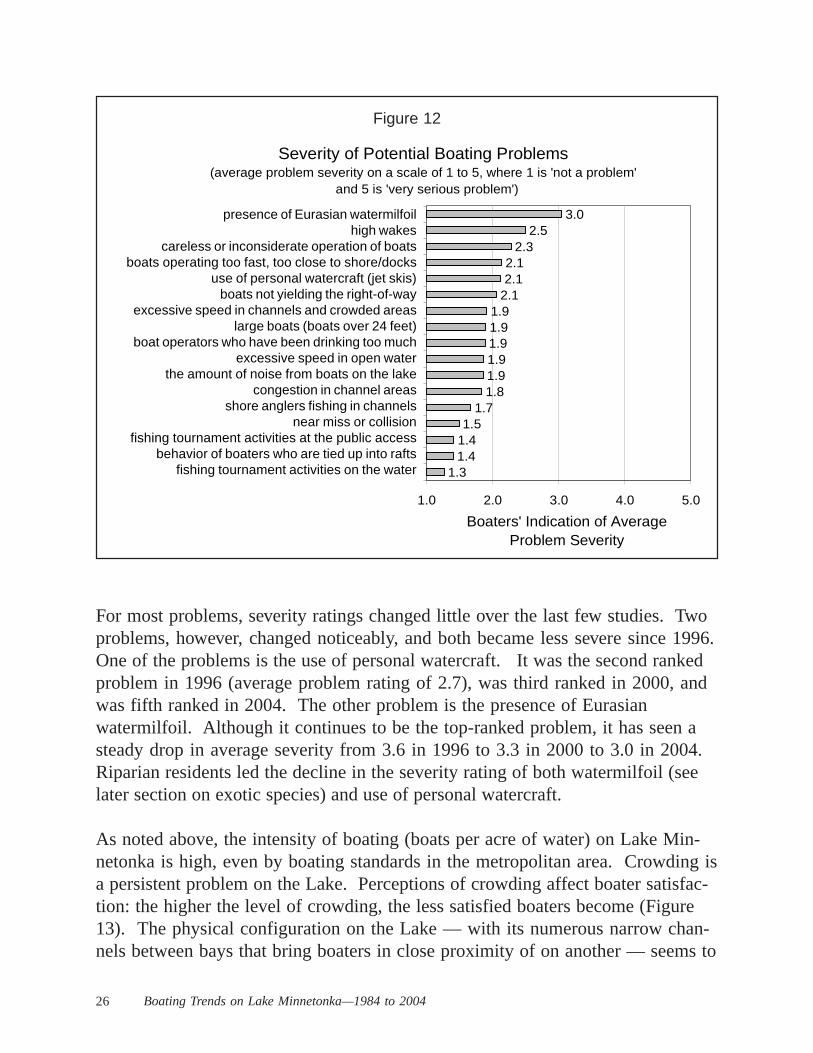
Although satisfaction levels are high, boaters do experience problems on thewater (Figure 12). In the survey boaters were asked to rate 17 potential problemson a five-point scale from not a problem (1), to a slight problem (2) to a moderateproblem (3) to a serious problem (4) to a very serious problem (5). The leadingproblem is Eurasian watermilfoil, which stands well above the others (more issaid about the perception of Eurasian watermilfoil as a problem in the sectionbelow on exotic species). The next two top-ranked problems have to do withother boaters: high wakes, and inconsiderate operation of boats. These are fol-lowed by boats operating too fast, use of personal watercraft, boats not yieldingthe right of way. Other potential problems are of a lesser severity. This rankingof problems is widely shared across the different sources of boaters, activities ofboaters, and day of week of the boating outing.
Figure 11
Satisfaction of Boaters With Their Outing(trend based on public-access and riparian-resident boaters)
0%
10%
20%
30%
40%
50%
60%
70%
80%
90%
100%
1992 1996 2000 2004
Per
cent
of B
oate
rs
Very satisfiedSatisfiedDissatisfiedVery dissatisfied
26 Boating Trends on Lake Minnetonka—1984 to 2004
For most problems, severity ratings changed little over the last few studies. Twoproblems, however, changed noticeably, and both became less severe since 1996.One of the problems is the use of personal watercraft. It was the second rankedproblem in 1996 (average problem rating of 2.7), was third ranked in 2000, andwas fifth ranked in 2004. The other problem is the presence of Eurasianwatermilfoil. Although it continues to be the top-ranked problem, it has seen asteady drop in average severity from 3.6 in 1996 to 3.3 in 2000 to 3.0 in 2004.Riparian residents led the decline in the severity rating of both watermilfoil (seelater section on exotic species) and use of personal watercraft.
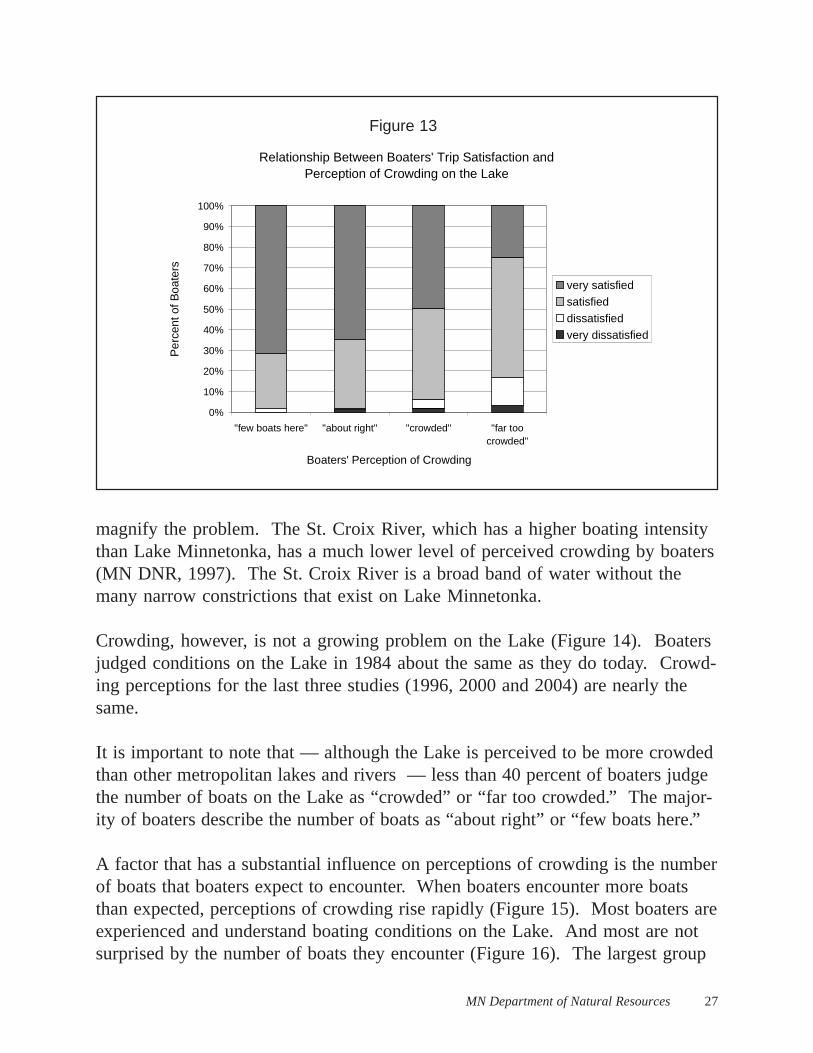
As noted above, the intensity of boating (boats per acre of water) on Lake Min-netonka is high, even by boating standards in the metropolitan area. Crowding isa persistent problem on the Lake. Perceptions of crowding affect boater satisfac-tion: the higher the level of crowding, the less satisfied boaters become (Figure13). The physical configuration on the Lake — with its numerous narrow chan-nels between bays that bring boaters in close proximity of on another — seems to
Figure 12
Severity of Potential Boating Problems(average problem severity on a scale of 1 to 5, where 1 is 'not a problem'
and 5 is 'very serious problem')
1.31.41.41.5
1.71.81.91.91.91.91.9
2.12.12.1
2.32.5
3.0
1.0 2.0 3.0 4.0 5.0
Boaters' Indication of AverageProblem Severity
presence of Eurasian watermilfoilhigh wakes
careless or inconsiderate operation of boatsboats operating too fast, too close to shore/docks
use of personal watercraft (jet skis)boats not yielding the right-of-way
excessive speed in channels and crowded areaslarge boats (boats over 24 feet)
boat operators who have been drinking too muchexcessive speed in open water
the amount of noise from boats on the lakecongestion in channel areas
shore anglers fishing in channelsnear miss or collision
fishing tournament activities at the public accessbehavior of boaters who are tied up into rafts
fishing tournament activities on the water
MN Department of Natural Resources 27
magnify the problem. The St. Croix River, which has a higher boating intensitythan Lake Minnetonka, has a much lower level of perceived crowding by boaters(MN DNR, 1997). The St. Croix River is a broad band of water without themany narrow constrictions that exist on Lake Minnetonka.
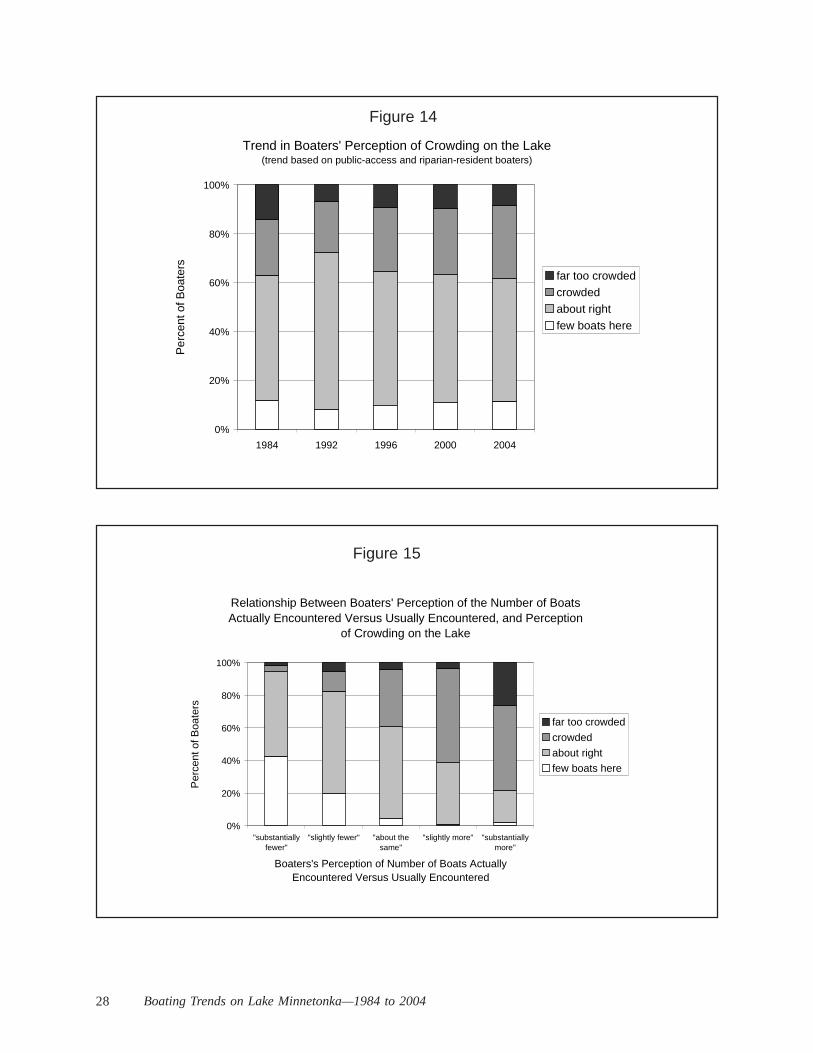
Crowding, however, is not a growing problem on the Lake (Figure 14). Boatersjudged conditions on the Lake in 1984 about the same as they do today. Crowd-ing perceptions for the last three studies (1996, 2000 and 2004) are nearly thesame.
It is important to note that — although the Lake is perceived to be more crowdedthan other metropolitan lakes and rivers — less than 40 percent of boaters judgethe number of boats on the Lake as “crowded” or “far too crowded.” The major-ity of boaters describe the number of boats as “about right” or “few boats here.”
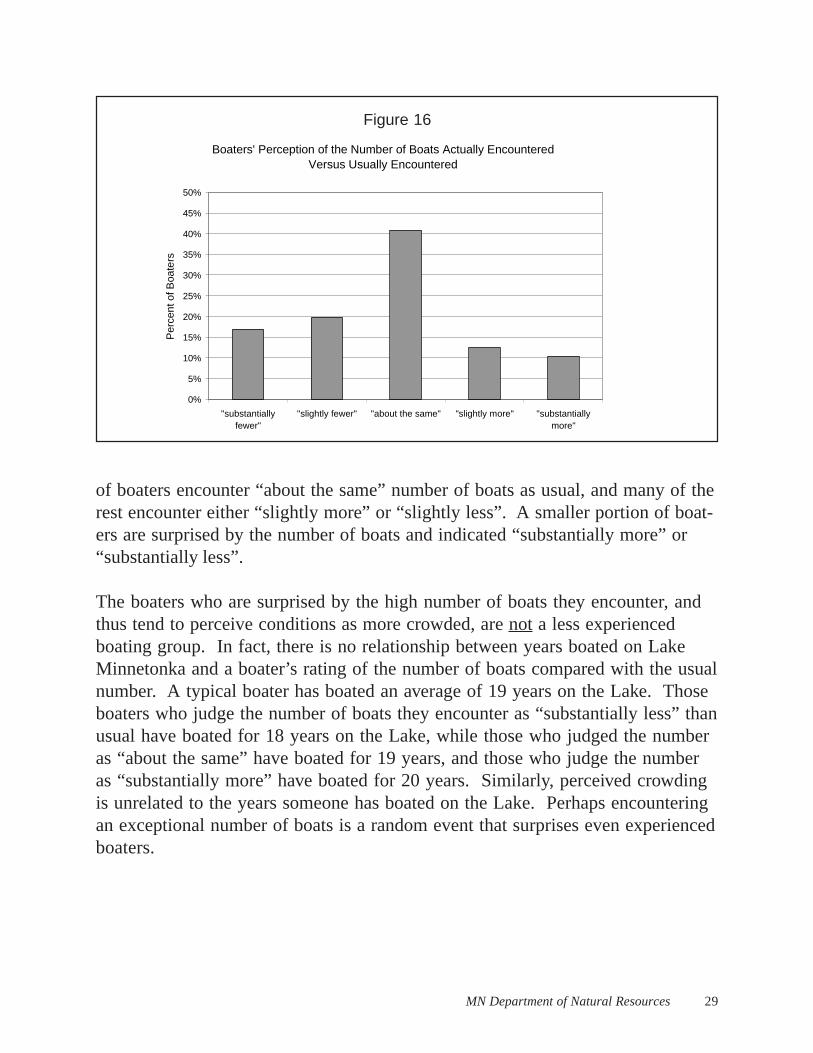
A factor that has a substantial influence on perceptions of crowding is the numberof boats that boaters expect to encounter. When boaters encounter more boatsthan expected, perceptions of crowding rise rapidly (Figure 15). Most boaters areexperienced and understand boating conditions on the Lake. And most are notsurprised by the number of boats they encounter (Figure 16). The largest group
Figure 13
Relationship Between Boaters' Trip Satisfaction andPerception of Crowding on the Lake
0%
10%
20%
30%
40%
50%
60%
70%
80%
90%
100%
"few boats here" "about right" "crowded" "far toocrowded"
Boaters' Perception of Crowding
Per
cent
of B
oate
rs
very satisfiedsatisfieddissatisfiedvery dissatisfied
28 Boating Trends on Lake Minnetonka—1984 to 2004
Figure 14
Trend in Boaters' Perception of Crowding on the Lake(trend based on public-access and riparian-resident boaters)
0%
20%
40%
60%
80%
100%
1984 1992 1996 2000 2004
Per
cent
of B
oate
rs
far too crowdedcrowdedabout rightfew boats here
Figure 15
Relationship Between Boaters' Perception of the Number of Boats Actually Encountered Versus Usually Encountered, and Perception
of Crowding on the Lake
0%
20%
40%
60%
80%
100%
"substantiallyfewer"
"slightly fewer" "about thesame"
"slightly more" "substantiallymore"
Boaters's Perception of Number of Boats Actually Encountered Versus Usually Encountered
Per
cent
of B
oate
rs
far too crowded
crowded
about rightfew boats here
MN Department of Natural Resources 29
Figure 16
Boaters' Perception of the Number of Boats Actually Encountered Versus Usually Encountered
0%
5%
10%
15%
20%
25%
30%
35%
40%
45%
50%
"substantiallyfewer"
"slightly fewer" "about the same" "slightly more" "substantiallymore"
Per
cent
of B
oate
rs
of boaters encounter “about the same” number of boats as usual, and many of therest encounter either “slightly more” or “slightly less”. A smaller portion of boat-ers are surprised by the number of boats and indicated “substantially more” or“substantially less”.
The boaters who are surprised by the high number of boats they encounter, andthus tend to perceive conditions as more crowded, are not a less experiencedboating group. In fact, there is no relationship between years boated on LakeMinnetonka and a boater’s rating of the number of boats compared with the usualnumber. A typical boater has boated an average of 19 years on the Lake. Thoseboaters who judge the number of boats they encounter as “substantially less” thanusual have boated for 18 years on the Lake, while those who judged the numberas “about the same” have boated for 19 years, and those who judge the numberas “substantially more” have boated for 20 years. Similarly, perceived crowdingis unrelated to the years someone has boated on the Lake. Perhaps encounteringan exceptional number of boats is a random event that surprises even experiencedboaters.
30 Boating Trends on Lake Minnetonka—1984 to 2004
BOATING SAFETY AND ENFORCEMENT
Lake Minnetonka is a congested place to boat and boating restrictions are com-monly used to manage the congestion. Most boaters — when asked about thelevel of restriction on the water — think the amount of restriction is appropriate(“about right”) (see (Figure 17). Few believe that it is “too restrictive.” Morebelieve it is “not restric-tive enough.” Nearlyone-third of riparianresidents (29%) believe itis “not restrictiveenough.”
Consistent with thisperspective, boatingrestrictions are not com-monly viewed in a nega-tive light. Most boatersbelieve restrictions eitherdo not affect their enjoy-ment of boating (54% ofboaters) or add to theirenjoyment (42%). Fewbelieve restrictions detract from enjoyment (4%).
Boaters are well aware of the pervasive restrictions on Lake Minnetonka concern-ing speed/quiet water and transport of exotic species from the Lake. Over 90percent are aware of these restrictions. And a solid majority (66+%) believesthese are needed. In addition, about half of boaters believe special restrictions onpersonal watercraft are needed.
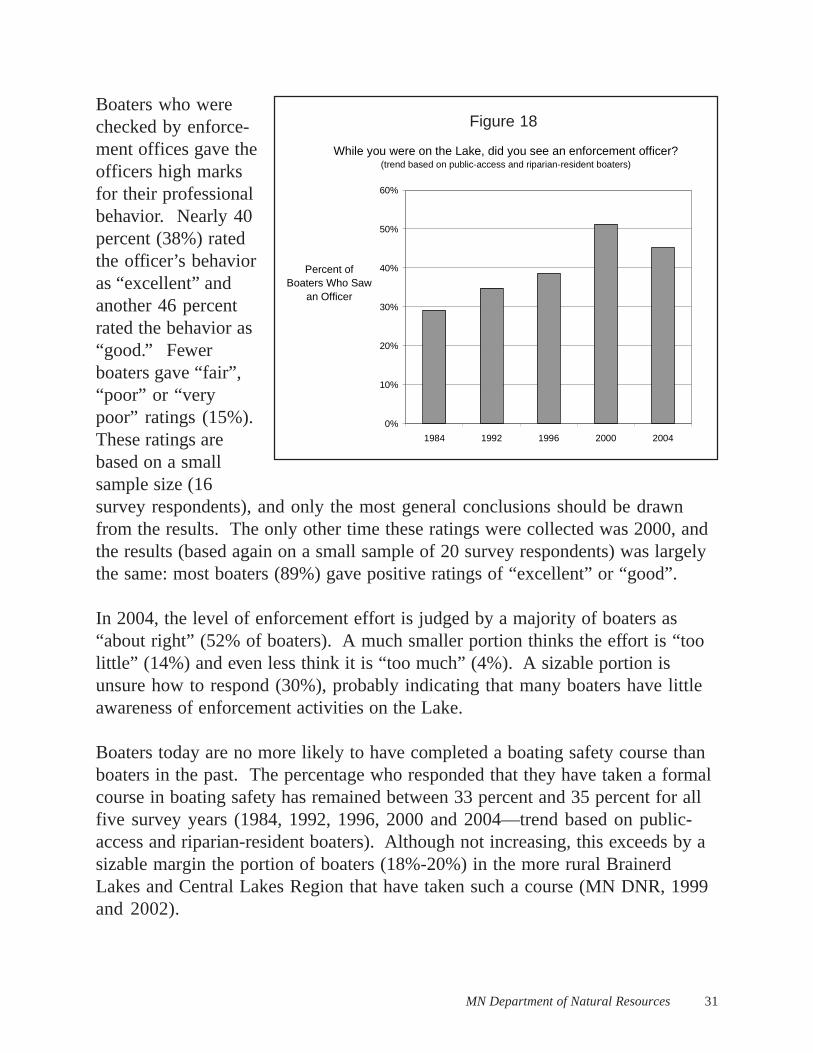
Boater sightings of enforcement officers on the Lake increased markedly from1984 to a peak in 2000, after which sightings declined (Figure 18). In 2004, 45percent of all boaters recall seeing an enforcement officer on their last outing.
Following the same trend as officer sightings, the portion of boaters reportingbeing checked by an enforcement officer rose steadily from less than 1 percent in1984 to 3 percent in 2000. The portion declined to 2 percent in 2004.
Figure 17
Overall, do think special boating restrictions on Lake Minnetonka are too restrictive, about right, or not restrictive enough?
(percent of boaters indicating response)
too restrictive5%
do not know4%
not restrictive enough
23%
about right68%
MN Department of Natural Resources 31
Figure 18
While you were on the Lake, did you see an enforcement officer?(trend based on public-access and riparian-resident boaters)
0%
10%
20%
30%
40%
50%
60%
1984 1992 1996 2000 2004
Percent of Boaters Who Saw
an Officer
Boaters who werechecked by enforce-ment offices gave theofficers high marksfor their professionalbehavior. Nearly 40percent (38%) ratedthe officer’s behavioras “excellent” andanother 46 percentrated the behavior as“good.” Fewerboaters gave “fair”,“poor” or “verypoor” ratings (15%).These ratings arebased on a smallsample size (16survey respondents), and only the most general conclusions should be drawnfrom the results. The only other time these ratings were collected was 2000, andthe results (based again on a small sample of 20 survey respondents) was largelythe same: most boaters (89%) gave positive ratings of “excellent” or “good”.
In 2004, the level of enforcement effort is judged by a majority of boaters as“about right” (52% of boaters). A much smaller portion thinks the effort is “toolittle” (14%) and even less think it is “too much” (4%). A sizable portion isunsure how to respond (30%), probably indicating that many boaters have littleawareness of enforcement activities on the Lake.
Boaters today are no more likely to have completed a boating safety course thanboaters in the past. The percentage who responded that they have taken a formalcourse in boating safety has remained between 33 percent and 35 percent for allfive survey years (1984, 1992, 1996, 2000 and 2004—trend based on public-access and riparian-resident boaters). Although not increasing, this exceeds by asizable margin the portion of boaters (18%-20%) in the more rural BrainerdLakes and Central Lakes Region that have taken such a course (MN DNR, 1999and 2002).
32 Boating Trends on Lake Minnetonka—1984 to 2004
Nearly half (49%) of boaters think that all boat operators should be required tocomplete a boating safety course. A smaller portion (38%) believe motorboatoperators should be required to have an operator’s license. Although neither ofthese is a majority of boaters, the portions are 10 to 20 percent higher than thosefound in the more rural Brainerd Lakes and Central Lakes Regions (MN DNR,1999 and 2002), suggesting that licensing and safety courses may be a morepressing concern in the metro area.
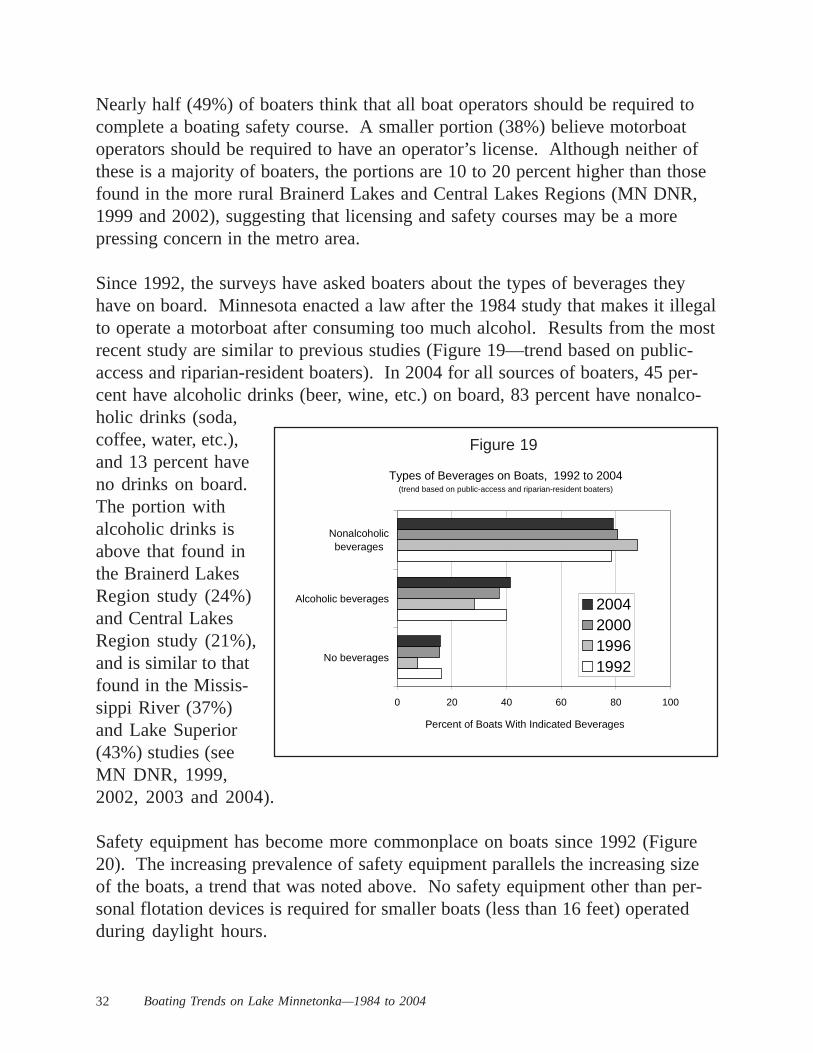
Since 1992, the surveys have asked boaters about the types of beverages theyhave on board. Minnesota enacted a law after the 1984 study that makes it illegalto operate a motorboat after consuming too much alcohol. Results from the mostrecent study are similar to previous studies (Figure 19—trend based on public-access and riparian-resident boaters). In 2004 for all sources of boaters, 45 per-cent have alcoholic drinks (beer, wine, etc.) on board, 83 percent have nonalco-holic drinks (soda,coffee, water, etc.),and 13 percent haveno drinks on board.The portion withalcoholic drinks isabove that found inthe Brainerd LakesRegion study (24%)and Central LakesRegion study (21%),and is similar to thatfound in the Missis-sippi River (37%)and Lake Superior(43%) studies (seeMN DNR, 1999,2002, 2003 and 2004).
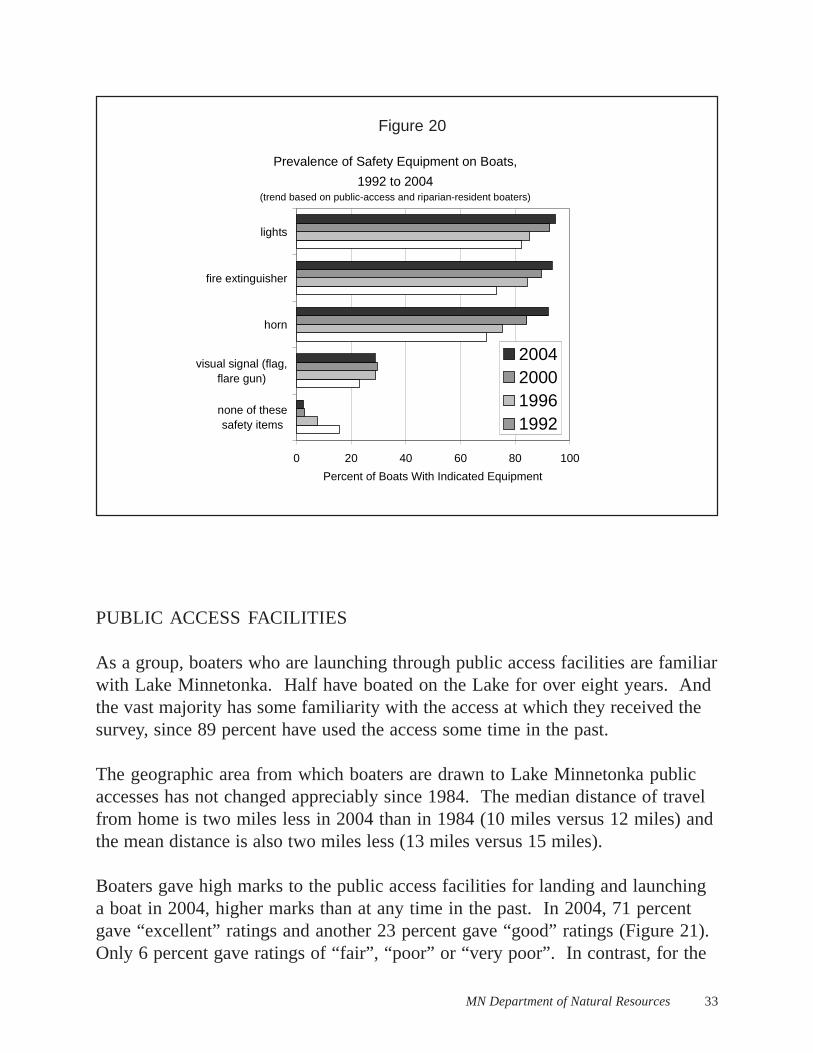
Safety equipment has become more commonplace on boats since 1992 (Figure20). The increasing prevalence of safety equipment parallels the increasing sizeof the boats, a trend that was noted above. No safety equipment other than per-sonal flotation devices is required for smaller boats (less than 16 feet) operatedduring daylight hours.
Types of Beverages on Boats, 1992 to 2004(trend based on public-access and riparian-resident boaters)
0 20 40 60 80 100
No beverages
Alcoholic beverages
Nonalcoholicbeverages
Percent of Boats With Indicated Beverages
2004200019961992
Figure 19
MN Department of Natural Resources 33
Figure 20
Prevalence of Safety Equipment on Boats,
1992 to 2004(trend based on public-access and riparian-resident boaters)
0 20 40 60 80 100
none of thesesafety items
visual signal (flag,flare gun)
horn
fire extinguisher
lights
Percent of Boats With Indicated Equipment
2004200019961992
PUBLIC ACCESS FACILITIES
As a group, boaters who are launching through public access facilities are familiarwith Lake Minnetonka. Half have boated on the Lake for over eight years. Andthe vast majority has some familiarity with the access at which they received thesurvey, since 89 percent have used the access some time in the past.
The geographic area from which boaters are drawn to Lake Minnetonka publicaccesses has not changed appreciably since 1984. The median distance of travelfrom home is two miles less in 2004 than in 1984 (10 miles versus 12 miles) andthe mean distance is also two miles less (13 miles versus 15 miles).
Boaters gave high marks to the public access facilities for landing and launchinga boat in 2004, higher marks than at any time in the past. In 2004, 71 percentgave “excellent” ratings and another 23 percent gave “good” ratings (Figure 21).Only 6 percent gave ratings of “fair”, “poor” or “very poor”. In contrast, for the
34 Boating Trends on Lake Minnetonka—1984 to 2004
ratings in 2000(which are similar tostudies preceding2000), 38 percentgave “excellent”ratings. 37 percentgave “good” ratings,and 25 percent gaveratings of “fair”,“poor” or “verypoor”. The reason forthe sharp increase inratings between 2000and 2004 is not fullyknown, but the in-crease is probably due— at least in part —to the opening of the large Grays Bay Access and closing of two smaller accesseson the same part of the Lake. The Grays Bay Access is a well-designed facilitythat can accommodate the large boats that access users are trailering today.
Consistent with the increase in access ratings, the portion of boaters having aproblem with the use of an access fell from 37 percent in 2000 to 28 percent in2004. The primary use problem by far is the size of the access parking lot (Fig-ure 22), which is the perennial leading problem on the Lake. Public accesses lotsat Lake Minnetonka are routinely full to capacity; 65 percent of the boaters inter-viewed have found the access at which they were surveyed full at least once inthe last 12 months. When they find the lot full, the large majority of boaters(94%) are able to boat on the Lake that day by going to another access, parkingon the street/lot nearby, or waiting for a spot to open up in the lot.
The next leading access use problem is small by comparison with the parking-space problem, and is an additional size-related concern: not enough maneuver-ing room on land near ramp for launching/landing. One item showed a markeddecrease as a use problem from 2000 to 2004. “No dock” was a minor use prob-lem in 2004 (indicated by 3% of boaters who had any use problem), but it wasthe third-ranked problem in 2000 (indicated by 14% of boaters who had any useproblem).
Figure 21
How would you rate this access for launching and landing a boat?
(percent of boaters indicating response)
good23%
fair5%
poor or very poor1%
excellent71%
MN Department of Natural Resources 35
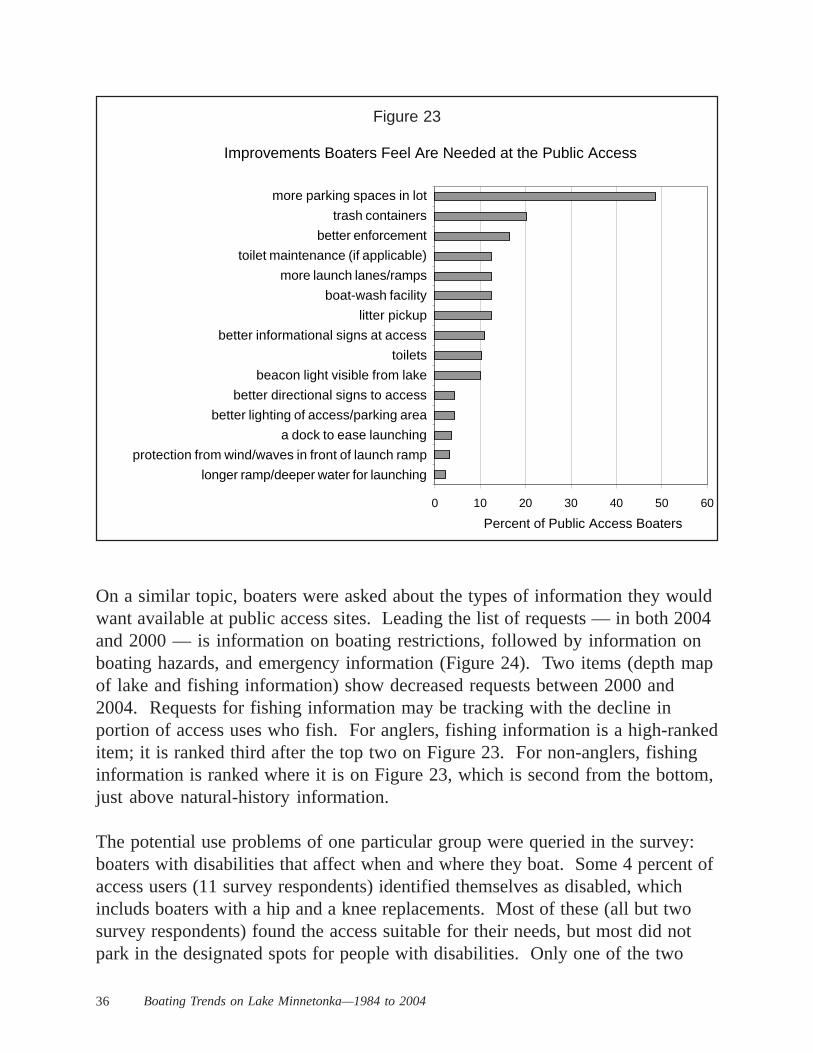
When asked about improvements needed at the access site, boaters focused on thesolution to their primary use problem, which is not enough parking spaces in theaccess lot (Figure 23). This is followed by requests for trash containers and betterenforcement. None of the other potential improvements is requested by over 15percent of access users.
The 2004 improvement requests reflect two major differences from 2000 re-quests. The first concerns docks to ease launching. Dock requests fell from 33percent of boaters in 2000 to 4 percent in 2004. The fall in dock requests paral-lels the drop in docks as an access use problem, which was noted above. Theother item that changed was requests for better enforcement. Requests for betterenforcement rose from 5 percent of boaters in 2000 to 16 percent in 2004. Betterenforcement was the least requested improvement in 2000. It rose to the thirdmost requested in 2004.
Figure 22
Problems Boaters Had With the Public Access(excludes boaters who did not have a problem)
0 20 40 60 80
Percent of Public Access Boaters (percent based on those boaters who had any problem)
not enough parking spaces
not enough maneuvering room on land near ramp for launch/landing
insufficient number of launch lanes/ramps
ramp blocked by parked cars, campers etc.
not enough maneuvering room on water near ramp for launch/landing
poor directional signs to access
difficult to launch/land because of wind or waves
couldn’t find the access from the lake after dark
access site in disrepair
no dock
water too shallow
ramp slope not steep enough
safety of entry to access area from road or highway
36 Boating Trends on Lake Minnetonka—1984 to 2004
On a similar topic, boaters were asked about the types of information they wouldwant available at public access sites. Leading the list of requests — in both 2004and 2000 — is information on boating restrictions, followed by information onboating hazards, and emergency information (Figure 24). Two items (depth mapof lake and fishing information) show decreased requests between 2000 and2004. Requests for fishing information may be tracking with the decline inportion of access uses who fish. For anglers, fishing information is a high-rankeditem; it is ranked third after the top two on Figure 23. For non-anglers, fishinginformation is ranked where it is on Figure 23, which is second from the bottom,just above natural-history information.
The potential use problems of one particular group were queried in the survey:boaters with disabilities that affect when and where they boat. Some 4 percent ofaccess users (11 survey respondents) identified themselves as disabled, whichincluds boaters with a hip and a knee replacements. Most of these (all but twosurvey respondents) found the access suitable for their needs, but most did notpark in the designated spots for people with disabilities. Only one of the two
Figure 23
Improvements Boaters Feel Are Needed at the Public Access
0 10 20 30 40 50 60
Percent of Public Access Boaters
more parking spaces in lot
trash containers
better enforcement
toilet maintenance (if applicable)
more launch lanes/ramps
boat-wash facility
litter pickup
better informational signs at access
toilets
beacon light visible from lake
better directional signs to access
better lighting of access/parking area
a dock to ease launching
protection from wind/waves in front of launch ramp
longer ramp/deeper water for launching
MN Department of Natural Resources 37
All boaters Public access Marina Municipal dock Riparian residentBoater group (percent) (percent) (percent) (percent) (percent)
All boaters 13% 27% 8% 8% 4%
Boaters who used public access on Lake in last 12 months
17% 27% 13% 8% 5%
Percent of boaters who believe additional free public boat access is needed on Lake Minnetonka
--------------------------- Source of boater ---------------------------
Table 8
Figure 24
Boaters' Opinions on the Type of Information That Should Be Available at Public Accesses
0 10 20 30 40 50 60 70 80 90
description of natural history of lake
fishing information for lake
information on where to buy boat gas
depth map of lake
emergency information
boating hazards map of lake
boating restrictions for lake
Percent of Public Access BoatersIndicating Information Type
20042000
boaters who found the access inadequate gave a reason for the inadequacy, whichconcerned the long distance from the parking spot to the launch site. This boaterhad an artificial knee; the boater did not park — for whatever reason — in adesignated spot for people with disabilities.
Boaters were asked in the surveys if additional public access is needed on LakeMinnetonka. Few (13%) responded that more access is needed (Table 8). Thisproportion rises to 17 percent if only access users in the last 12 months are con-
38 Boating Trends on Lake Minnetonka—1984 to 2004
All boaters Public access Marina Municipal dock Riparian residentItem (percent) (percent) (percent) (percent) (percent)
Percent who are users 66% 100% 38% 66% 60%
If used, times used in last 12 months: Mean times 5.3 6.5 6.0 3.6 3.2 Median times 2 2 2 2 2
Users of free public access on Lake Minnetonka in last 12 months
--------------------------- Source of boater ---------------------------
Table 9
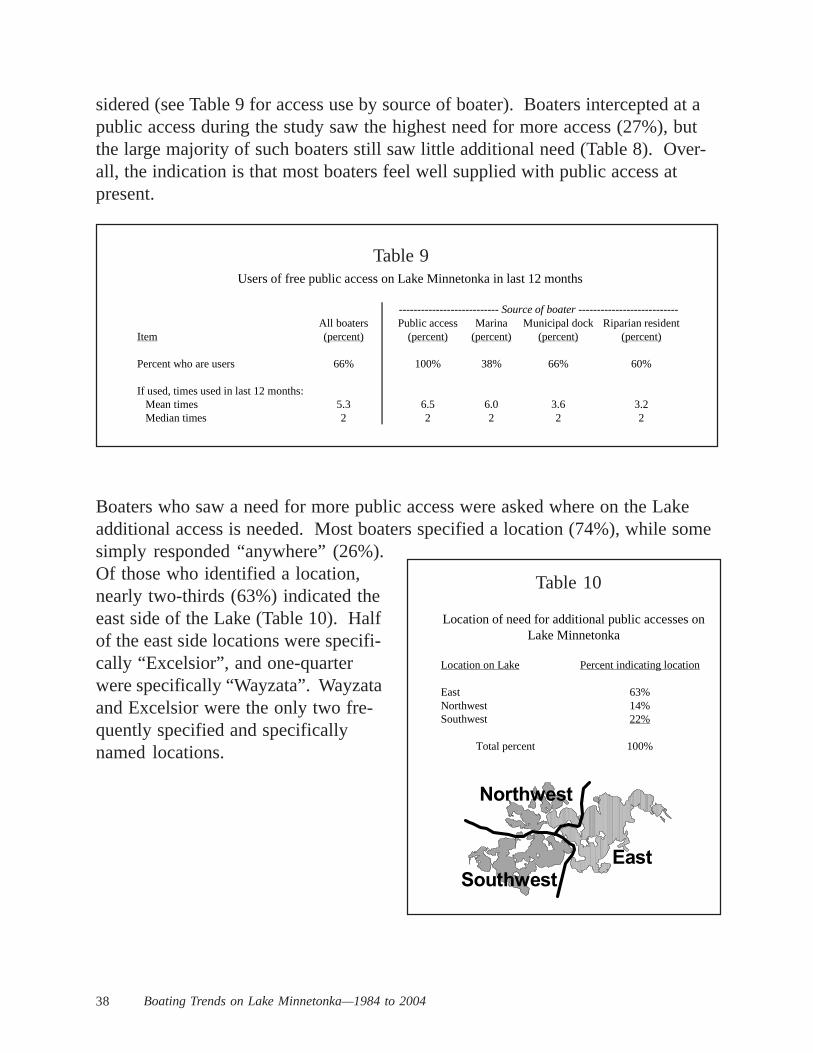
sidered (see Table 9 for access use by source of boater). Boaters intercepted at apublic access during the study saw the highest need for more access (27%), butthe large majority of such boaters still saw little additional need (Table 8). Over-all, the indication is that most boaters feel well supplied with public access atpresent.
Boaters who saw a need for more public access were asked where on the Lakeadditional access is needed. Most boaters specified a location (74%), while somesimply responded “anywhere” (26%).Of those who identified a location,nearly two-thirds (63%) indicated theeast side of the Lake (Table 10). Halfof the east side locations were specifi-cally “Excelsior”, and one-quarterwere specifically “Wayzata”. Wayzataand Excelsior were the only two fre-quently specified and specificallynamed locations.
Location on Lake Percent indicating location
East 63%Northwest 14%Southwest 22%
Total percent 100%
Location of need for additional public accesses on Lake Minnetonka
East
Northwest
Southwest
Table 10
MN Department of Natural Resources 39
Figure 25
Perception of Eurasian Watermilfoil as aBoating Problem Over Time
0%
10%
20%
30%
40%
50%
60%
70%
80%
90%
100%
1992 1996 2000 2004 1992 1996 2000 2004
Public Access Boaters
Per
cent
of B
oate
rs
very serious problemserious problem
moderate problemslight problemnot a problem
Riparian Residents
PREVENTING THE SPREAD OF EXOTIC SPECIES
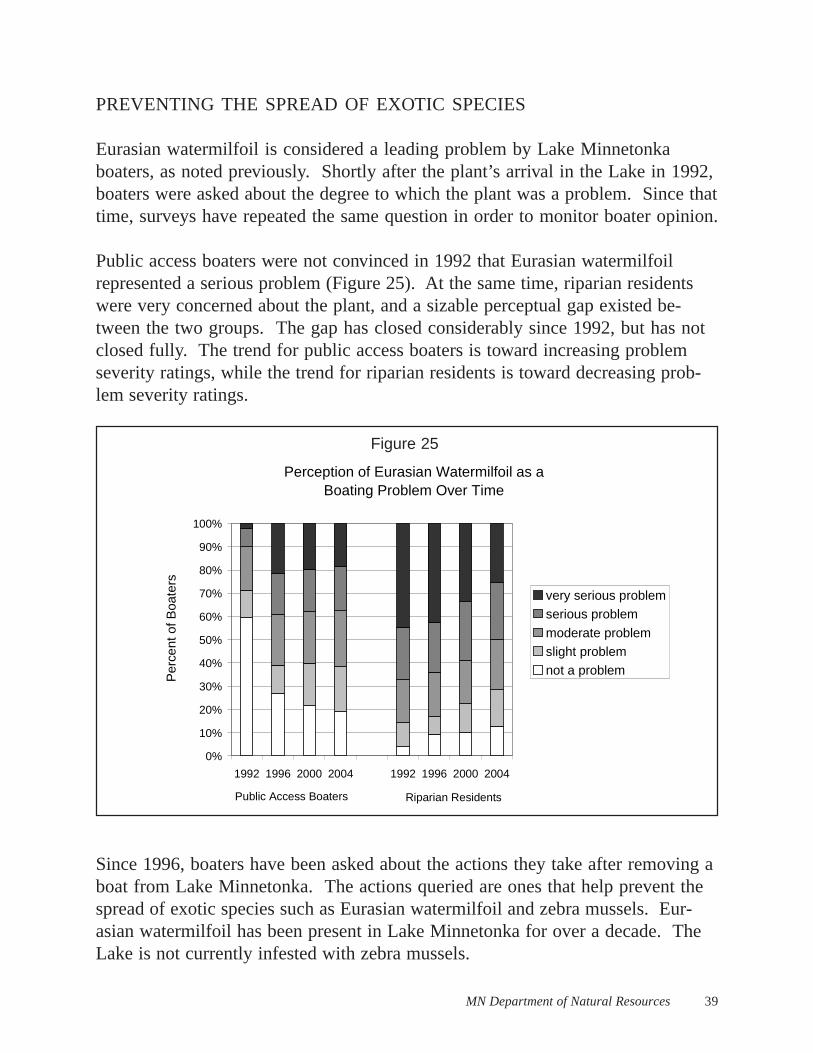
Eurasian watermilfoil is considered a leading problem by Lake Minnetonkaboaters, as noted previously. Shortly after the plant’s arrival in the Lake in 1992,boaters were asked about the degree to which the plant was a problem. Since thattime, surveys have repeated the same question in order to monitor boater opinion.
Public access boaters were not convinced in 1992 that Eurasian watermilfoilrepresented a serious problem (Figure 25). At the same time, riparian residentswere very concerned about the plant, and a sizable perceptual gap existed be-tween the two groups. The gap has closed considerably since 1992, but has notclosed fully. The trend for public access boaters is toward increasing problemseverity ratings, while the trend for riparian residents is toward decreasing prob-lem severity ratings.
Since 1996, boaters have been asked about the actions they take after removing aboat from Lake Minnetonka. The actions queried are ones that help prevent thespread of exotic species such as Eurasian watermilfoil and zebra mussels. Eur-asian watermilfoil has been present in Lake Minnetonka for over a decade. TheLake is not currently infested with zebra mussels.
40 Boating Trends on Lake Minnetonka—1984 to 2004
All boaters Public access Marina Municipal dock Riparian residentIndicated waters (percent) (percent) (percent) (percent) (percent)
Any other body of water 22% 41% 14% 18% 13%
Mississippi River downstream of St. Paul, Minnesota
3% 8% 1% 1% 2%
Percent of boaters who transported their boat between Lake Minnetonka and indicated waters in the last 12 months
--------------------------- Source of boater ---------------------------
Table 11
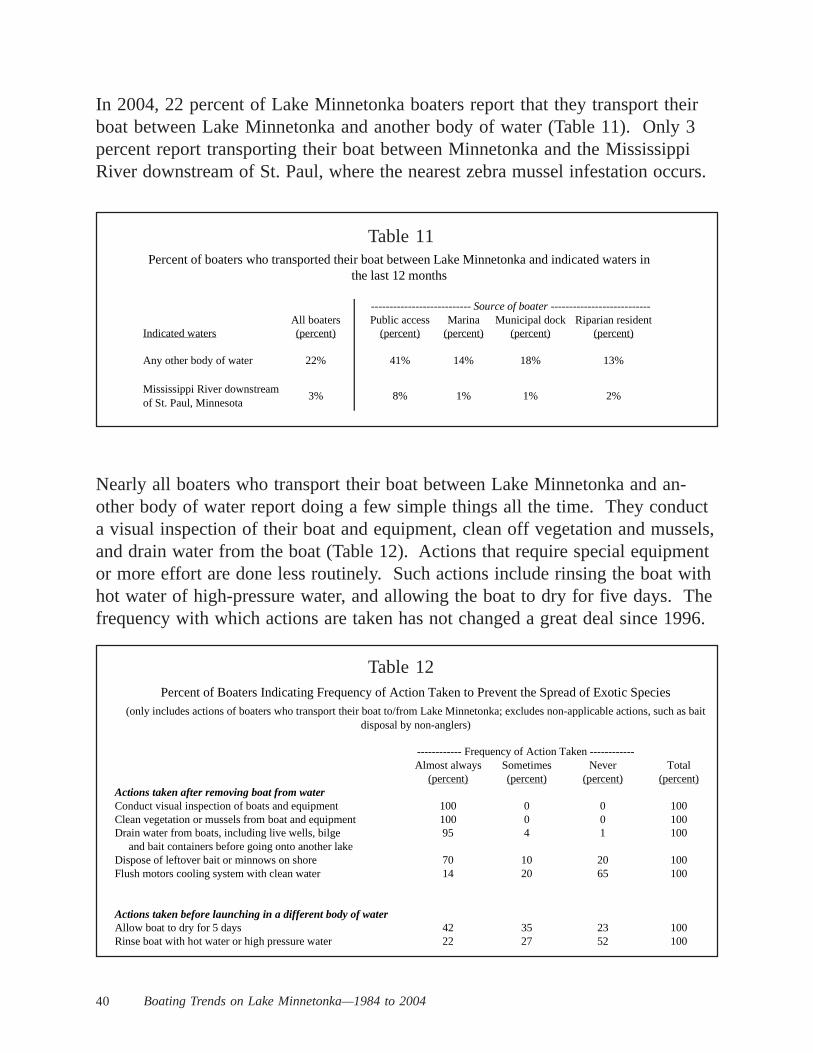
In 2004, 22 percent of Lake Minnetonka boaters report that they transport theirboat between Lake Minnetonka and another body of water (Table 11). Only 3percent report transporting their boat between Minnetonka and the MississippiRiver downstream of St. Paul, where the nearest zebra mussel infestation occurs.
Nearly all boaters who transport their boat between Lake Minnetonka and an-other body of water report doing a few simple things all the time. They conducta visual inspection of their boat and equipment, clean off vegetation and mussels,and drain water from the boat (Table 12). Actions that require special equipmentor more effort are done less routinely. Such actions include rinsing the boat withhot water of high-pressure water, and allowing the boat to dry for five days. Thefrequency with which actions are taken has not changed a great deal since 1996.
Table 12
Almost always Sometimes Never Total(percent) (percent) (percent) (percent)
Actions taken after removing boat from waterConduct visual inspection of boats and equipment 100 0 0 100Clean vegetation or mussels from boat and equipment 100 0 0 100Drain water from boats, including live wells, bilge 95 4 1 100 and bait containers before going onto another lakeDispose of leftover bait or minnows on shore 70 10 20 100Flush motors cooling system with clean water 14 20 65 100
Actions taken before launching in a different body of waterAllow boat to dry for 5 days 42 35 23 100Rinse boat with hot water or high pressure water 22 27 52 100
Percent of Boaters Indicating Frequency of Action Taken to Prevent the Spread of Exotic Species(only includes actions of boaters who transport their boat to/from Lake Minnetonka; excludes non-applicable actions, such as bait
disposal by non-anglers)
------------ Frequency of Action Taken ------------
MN Department of Natural Resources 41
REFERENCES
Lake Minnetonka boating studies, funded by the Lake Minnetonka ConservationDistrict (LMCD) and/or the Minnesota Department of Natural Resources(MN DNR):1984, funded by MN DNR.1986 and 1987, funded by LMCD.1992, 1994, 1996, 1998, 2000 and 2004, funded by LMCD and MN
DNR.
Minnesota Department of Natural Resources (MN DNR), Regional boatingstudies:1997. Boating in the Twin Cities Metropolitan Area: Current Status (1996)
and Trends Since 1984.1999. Boating in North Central Minnesota (Brainerd Lakes Region):
Status in 1998 and Trends Since 1985.2002. Boating in Central Minnesota: Status in 2001 and Trends Since
1987.2003. Boating on the Minnesota Portion of Lake Superior, Summer 2002.2004. Recreational Boating Study of the Mississippi River, Pools 4 to 9,
Summer 2003.
Minnesota-Wisconsin Boundary Area Commission (MWBAC). Recreationalboating studies (ever two years from 1983 to 1999) of the Lower St. CroixNational Scenic Riverway. Later years include recreational boating data forthe Mississippi River from the Twin Cities of Lock and Dam 10. All studiespublished by the Minnesota-Wisconsin Boundary Area Commission.
U. S. Department of Commerce, Bureau of the Census. Population counts forminor civil divisions in Minnesota for 1990 and 2000.
42 Boating Trends on Lake Minnetonka—1984 to 2004
APPENDIX A
METHODOLOGY
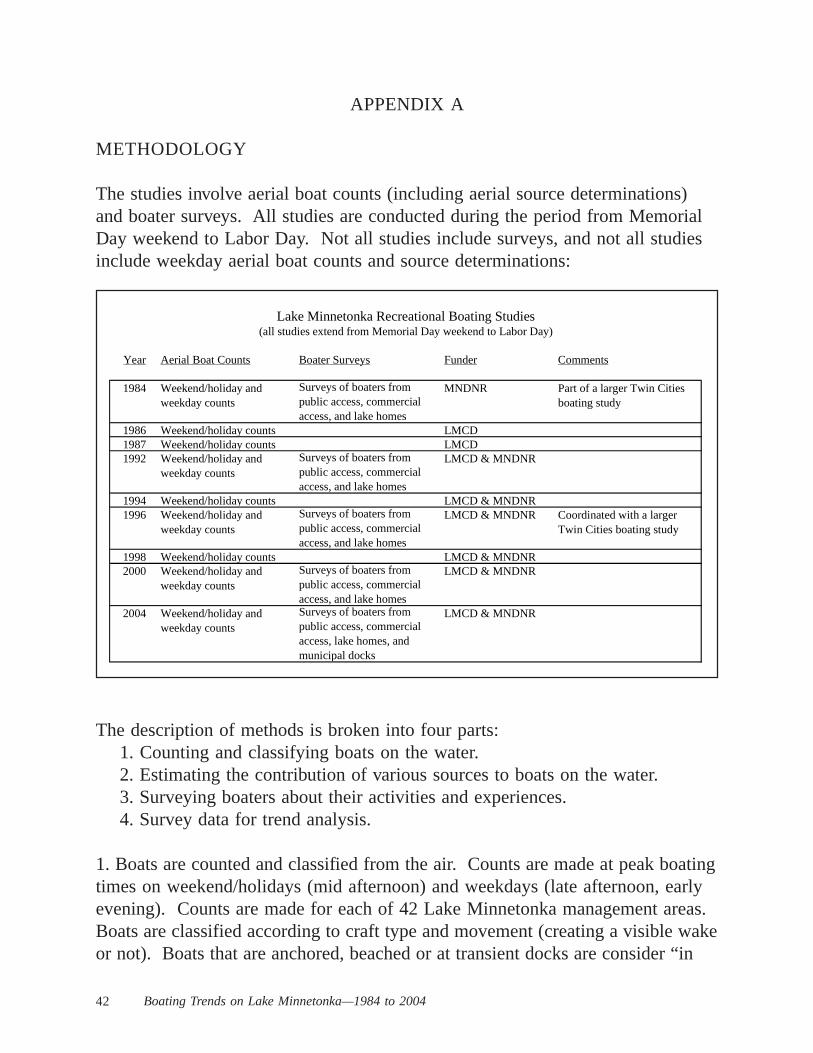
The studies involve aerial boat counts (including aerial source determinations)and boater surveys. All studies are conducted during the period from MemorialDay weekend to Labor Day. Not all studies include surveys, and not all studiesinclude weekday aerial boat counts and source determinations:
The description of methods is broken into four parts:1. Counting and classifying boats on the water.2. Estimating the contribution of various sources to boats on the water.3. Surveying boaters about their activities and experiences.4. Survey data for trend analysis.
1. Boats are counted and classified from the air. Counts are made at peak boatingtimes on weekend/holidays (mid afternoon) and weekdays (late afternoon, earlyevening). Counts are made for each of 42 Lake Minnetonka management areas.Boats are classified according to craft type and movement (creating a visible wakeor not). Boats that are anchored, beached or at transient docks are consider “in
Year Aerial Boat Counts Boater Surveys Funder Comments
1984 Weekend/holiday and weekday counts
Surveys of boaters from public access, commercial access, and lake homes
MNDNR Part of a larger Twin Cities boating study
1986 Weekend/holiday counts LMCD1987 Weekend/holiday counts LMCD1992 Weekend/holiday and
weekday countsSurveys of boaters from public access, commercial access, and lake homes
LMCD & MNDNR
1994 Weekend/holiday counts LMCD & MNDNR1996 Weekend/holiday and
weekday countsSurveys of boaters from public access, commercial access, and lake homes
LMCD & MNDNR Coordinated with a larger Twin Cities boating study
1998 Weekend/holiday counts LMCD & MNDNR2000 Weekend/holiday and
weekday countsSurveys of boaters from public access, commercial access, and lake homes
LMCD & MNDNR
2004 Weekend/holiday and weekday counts
Surveys of boaters from public access, commercial access, lake homes, and municipal docks
LMCD & MNDNR
Lake Minnetonka Recreational Boating Studies(all studies extend from Memorial Day weekend to Labor Day)
MN Department of Natural Resources 43
use” and are counted.
In earlier analyses of weekend/holiday boat numbers on the Lake, it was deter-mined that a better representation of the trend would occur if a few marginalboating days were excluded. The reasoning in 1998 was: in the 1990s, except-ing 1994, average boat numbers have been lower than in the 1980s (Figure A-1a). The reason for these lower averages is a few “marginal” boating days, dayswhen the weather was rainy, windy and raw and when the number of boats onthe water was exceptionally low. Such marginal boating days were not encoun-tered in the boat counts of the 1980s, and are likely to have been excluded byscrubbing flights on marginal weather days, a practice that ended by the 1990s.If these few exceptionally low days (the four days identified on Figure A-2) areeliminated from the averages, the “fair weather” averages in the 1990s look verysimilar to those in the 1980s (Figure A-1b). The “fair weather” trend displayedon Figure A-1b is probably a more accurate depiction of Lake Minnetonka trendsthan the “all counts” trend displayed on Figure A-1a.
This “fair weather” filter (i.e., exclude any boat counts less than 400) was contin-ued in 2000 and 2004. In 2000, no counts were excluded, and in 2004, onecount was excluded (=286 boats). The weekend/holiday boat count data pre-sented in this study are the “fair weather” data as defined here.
2. At the time of the aerial flights, source contributions are determined. For pub-lic accesses, a count is made of the number of empty trailers and trailerless ve-hicles capable of carrying a boat at access parking lots and adjoining overflowparking places on roads and in other lots.
At marinas, empty slips are counted from the air. The number of slips normallyempty is determined by occupancy flights, conducted on weekday mornings.The number of normally empty slips is subtracted from the empty slip countsmade during flight to determine the likely number of boats on the Lake fromslips during the flight. The number of boats on the Lake from private launches,rentals, and dry stacks was derived from operator reports of boats sourced for theday of the flight and diurnal distribution curves that indicate the probability that aboat out during a day is out during the flight time that day.
For municipal docks and homeowner association docks, counts of likely boatsaway from the docks and on the Lake are made during the flights. Dock loca-tions are photographed during the flights and the number of empty dock spaces
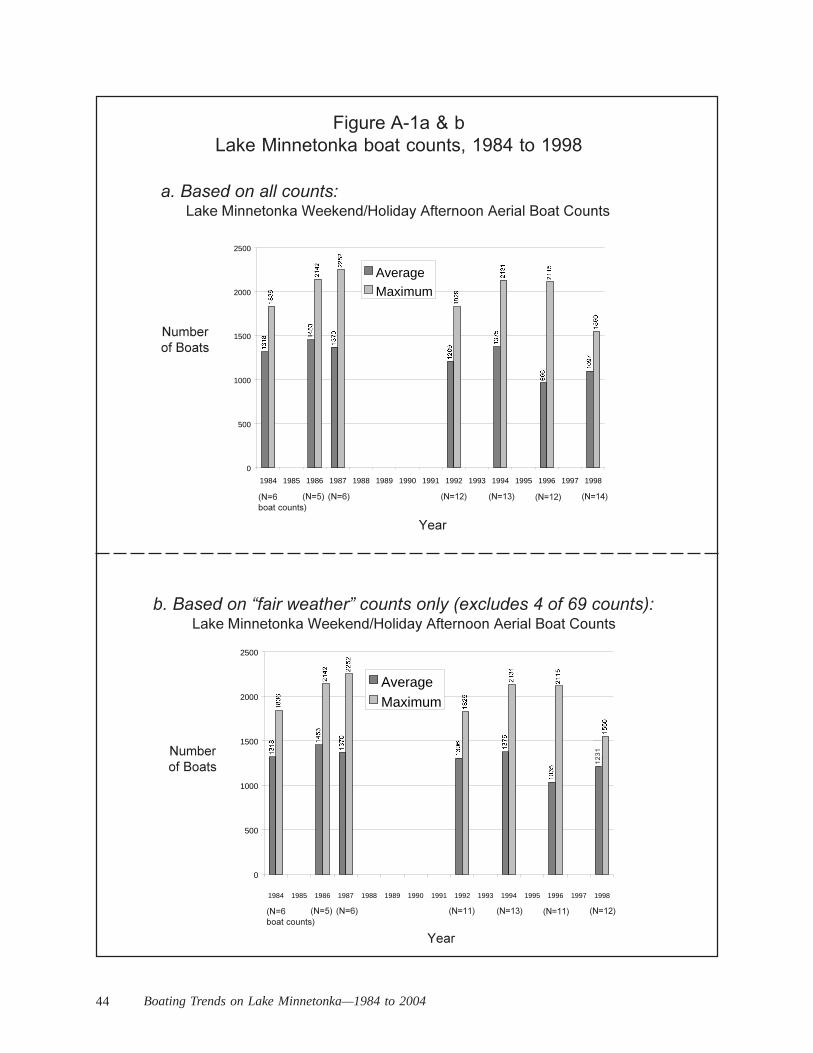
44 Boating Trends on Lake Minnetonka—1984 to 2004
0
500
1000
1500
2000
2500
1984 1985 1986 1987 1988 1989 1990 1991 1992 1993 1994 1995 1996 1997 1998
AverageMaximum
���������������� ����������������������� ����������������������������
�����������
����
������������ �
����� ����� ������ ������ ������ ������
Figure A-1a & bLake Minnetonka boat counts, 1984 to 1998
0
500
1000
1500
2000
2500
1984 1985 1986 1987 1988 1989 1990 1991 1992 1993 1994 1995 1996 1997 1998
AverageMaximum
�������������������� �������� ������������������������� ������������������������ ����������������������������
�����������
����
������������ �
����� ����� ������ ������ ������ ������
1231
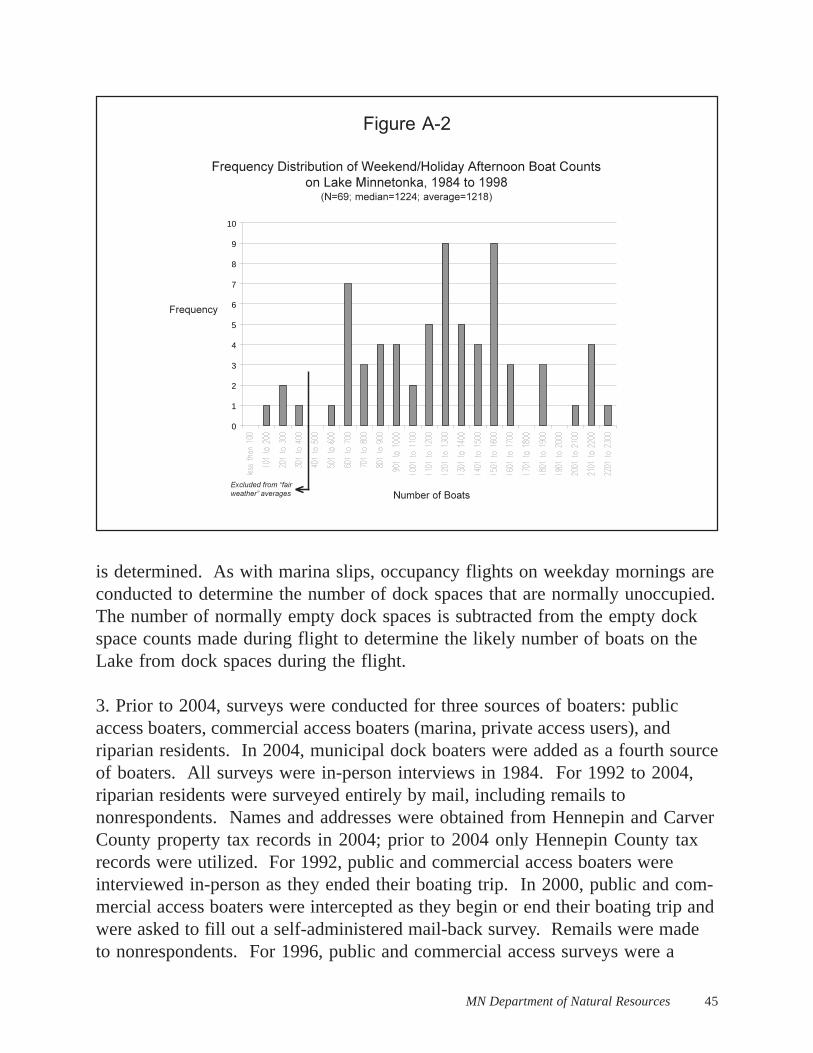
MN Department of Natural Resources 45
0
1
2
3
4
5
6
7
8
9
10
����������� ������������������������������������������� ���������������� !"#$��!""#
���������� ������������������
��������������
���� �
������������ �����������������
Figure A-2
is determined. As with marina slips, occupancy flights on weekday mornings areconducted to determine the number of dock spaces that are normally unoccupied.The number of normally empty dock spaces is subtracted from the empty dockspace counts made during flight to determine the likely number of boats on theLake from dock spaces during the flight.
3. Prior to 2004, surveys were conducted for three sources of boaters: publicaccess boaters, commercial access boaters (marina, private access users), andriparian residents. In 2004, municipal dock boaters were added as a fourth sourceof boaters. All surveys were in-person interviews in 1984. For 1992 to 2004,riparian residents were surveyed entirely by mail, including remails tononrespondents. Names and addresses were obtained from Hennepin and CarverCounty property tax records in 2004; prior to 2004 only Hennepin County taxrecords were utilized. For 1992, public and commercial access boaters wereinterviewed in-person as they ended their boating trip. In 2000, public and com-mercial access boaters were intercepted as they begin or end their boating trip andwere asked to fill out a self-administered mail-back survey. Remails were madeto nonrespondents. For 1996, public and commercial access surveys were a
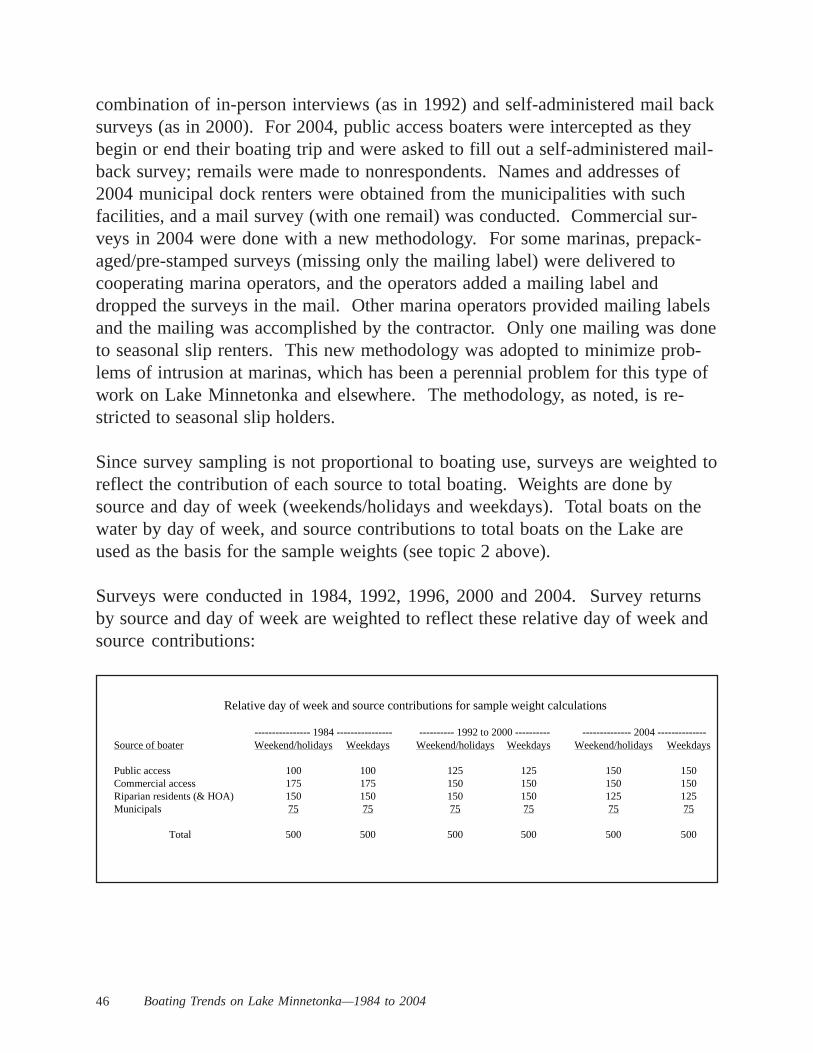
46 Boating Trends on Lake Minnetonka—1984 to 2004
combination of in-person interviews (as in 1992) and self-administered mail backsurveys (as in 2000). For 2004, public access boaters were intercepted as theybegin or end their boating trip and were asked to fill out a self-administered mail-back survey; remails were made to nonrespondents. Names and addresses of2004 municipal dock renters were obtained from the municipalities with suchfacilities, and a mail survey (with one remail) was conducted. Commercial sur-veys in 2004 were done with a new methodology. For some marinas, prepack-aged/pre-stamped surveys (missing only the mailing label) were delivered tocooperating marina operators, and the operators added a mailing label anddropped the surveys in the mail. Other marina operators provided mailing labelsand the mailing was accomplished by the contractor. Only one mailing was doneto seasonal slip renters. This new methodology was adopted to minimize prob-lems of intrusion at marinas, which has been a perennial problem for this type ofwork on Lake Minnetonka and elsewhere. The methodology, as noted, is re-stricted to seasonal slip holders.
Since survey sampling is not proportional to boating use, surveys are weighted toreflect the contribution of each source to total boating. Weights are done bysource and day of week (weekends/holidays and weekdays). Total boats on thewater by day of week, and source contributions to total boats on the Lake areused as the basis for the sample weights (see topic 2 above).
Surveys were conducted in 1984, 1992, 1996, 2000 and 2004. Survey returnsby source and day of week are weighted to reflect these relative day of week andsource contributions:
Source of boater Weekend/holidays Weekdays Weekend/holidays Weekdays Weekend/holidays Weekdays
Public access 100 100 125 125 150 150Commercial access 175 175 150 150 150 150Riparian residents (& HOA) 150 150 150 150 125 125Municipals 75 75 75 75 75 75
Total 500 500 500 500 500 500
---------------- 1984 ---------------- ---------- 1992 to 2000 ---------- -------------- 2004 --------------
Relative day of week and source contributions for sample weight calculations
MN Department of Natural Resources 47
4. Trends results based on boater survey information only include surveys withboaters from public accesses and riparian residences, because these are the twosources of boaters that been done in a consistent fashion over the period from1984 to 2004. The exclusion of other sources of boater limits but does not pre-clude trend analysis. There are many evident trends exhibited by boaters frompublic accesses and riparian residences that are clearly of a general nature.
For commercial access boaters, the 2004 survey data came from seasonal slipholders. Prior to 2004, the survey data came from two types of marina boaters:seasonal slip holders and marina customers who trailer their boats, pay a fee, andlaunch through a ramp facility. Prior to 1996, the two types of marina customerscannot be separated in the survey returns, and the two types of boaters havedifferent kinds and sizes of boats; they participate in different activities, and havedifferent experiences on the water.
Municipal dock boaters were only surveyed in 2004.
48 Boating Trends on Lake Minnetonka—1984 to 2004
APPENDIX B
STATISTICAL TESTS OF BOAT-NUMBER TRENDS
A number of statistical tests were performed to determine if boat numbers hadchanged (at .05 level of statistical significance) on Lake Minnetonka during theperiod of record from 1984 to 2004. Similar tests performed prior to the 2004study found no statistical differences for weekend/holidays or weekdays.
General conclusions from statistical tests:A. For weekend/holidays there is evidence of a statistically significant decline inboat numbers over the years 1984 to 2004.
B. For weekdays, there is no evidence of statistically significant change in boatnumbers over the years 1984 to 2004.
Details of statistical tests:A. For weekend/holiday counts, the following tests were conducted:
1. Linear regression analysis on yearly average number of boats as a function ofyear from 1984 to 2004 (see Figure B-1).Result: The decline in boat numbers from 1984 to 2004 is statistically significant.
2. Linear regression analysis on daily number of boats as a function of year(1984 to 2004) and daily maximum temperature of the boat-count date.Result: In the same regression equation, both daily maximum temperature (posi-tive relationship) and year (negative relationship) are statistically significant pre-dictors of daily boat numbers. This indicates that there is a statistically significantdownward trend in boat numbers between 1984 and 2004 even when possibledaily temperature biases over the years are accounted for.
3. Difference of means test between 2004 daily boat numbers and pooled 1984-87, 1992-94, and 1998-2000 boat numbers. Neighboring years were pooledbased on similar average yearly values.Result: 2004 boat numbers are significantly different from pooled 1992-94 and1984-87 boat numbers, but are not significantly different from pooled 1998-2000 boat numbers.
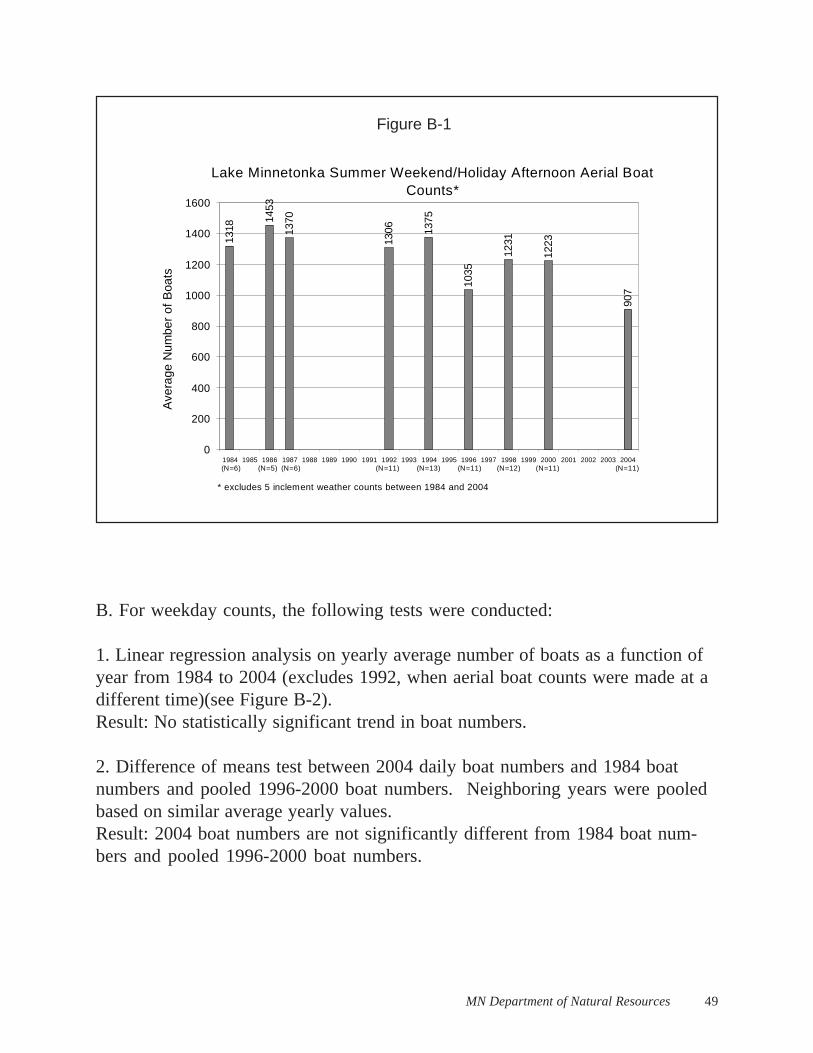
MN Department of Natural Resources 49
B. For weekday counts, the following tests were conducted:
1. Linear regression analysis on yearly average number of boats as a function ofyear from 1984 to 2004 (excludes 1992, when aerial boat counts were made at adifferent time)(see Figure B-2).Result: No statistically significant trend in boat numbers.
2. Difference of means test between 2004 daily boat numbers and 1984 boatnumbers and pooled 1996-2000 boat numbers. Neighboring years were pooledbased on similar average yearly values.Result: 2004 boat numbers are not significantly different from 1984 boat num-bers and pooled 1996-2000 boat numbers.
Lake Minnetonka Summer Weekend/Holiday Afternoon Aerial Boat Counts*
1453
1370
1306 13
75
1035
1231
1223
907
1318
0
200
400
600
800
1000
1200
1400
1600
1984 1985 1986 1987 1988 1989 1990 1991 1992 1993 1994 1995 1996 1997 1998 1999 2000 2001 2002 2003 2004
* excludes 5 inclement weather counts between 1984 and 2004
Ave
rage
Num
ber
of B
oats
(N=6) (N=5) (N=6) (N=11) (N=13) (N=11) (N=12) (N=11) (N=11)
Figure B-1
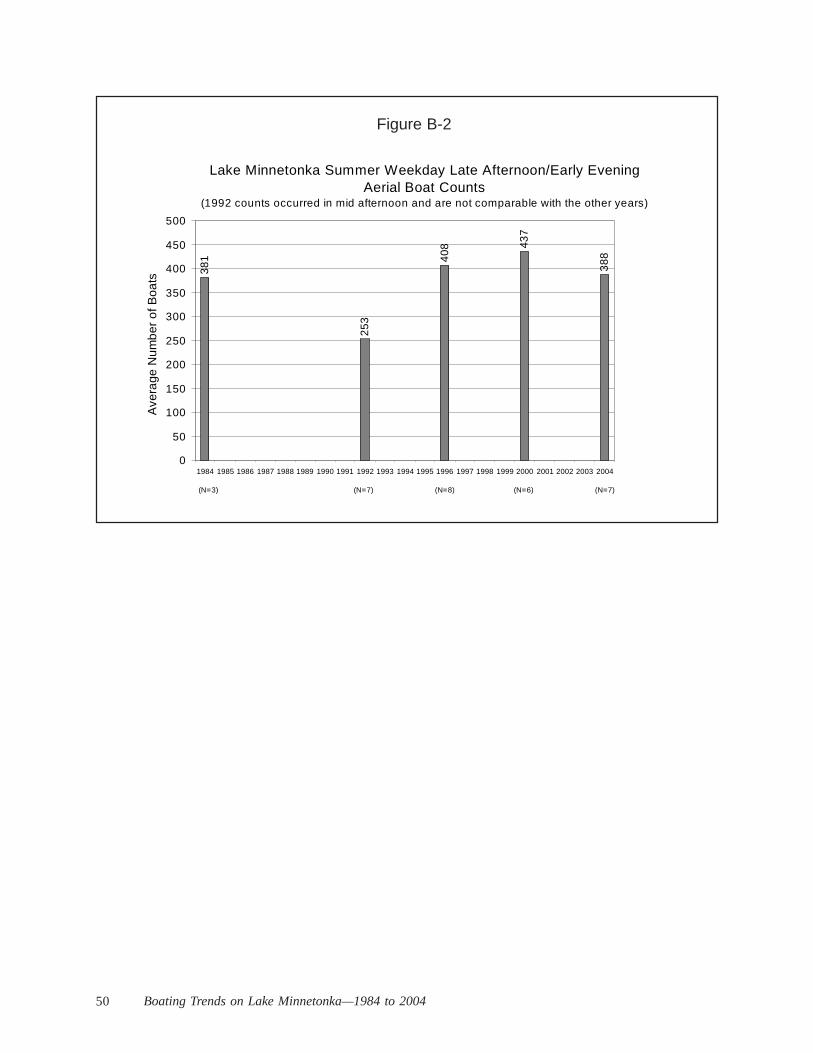
50 Boating Trends on Lake Minnetonka—1984 to 2004
Figure B-2
Lake Minnetonka Summer Weekday Late Afternoon/Early Evening Aerial Boat Counts
(1992 counts occurred in mid afternoon and are not comparable with the other years)3
81
253
408
437
388
0
50
100
150
200
250
300
350
400
450
500
1984 1985 1986 1987 1988 1989 1990 1991 1992 1993 1994 1995 1996 1997 1998 1999 2000 2001 2002 2003 2004
Ave
rage
Num
ber
of B
oats
(N=3) (N=7) (N=8) (N=6) (N=7)