board of directors meeting - ncdot mainline traffic statistics 3 fy15 q4 awt = 39,430 fy16 q4 awt =...
TRANSCRIPT
Board of Directors Meeting
North Carolina Turnpike Authority
August 4, 2016
Transportation
Triangle Expressway Operations
2
Andy Lelewski, PEDirector of Toll Road Operations
Transportation
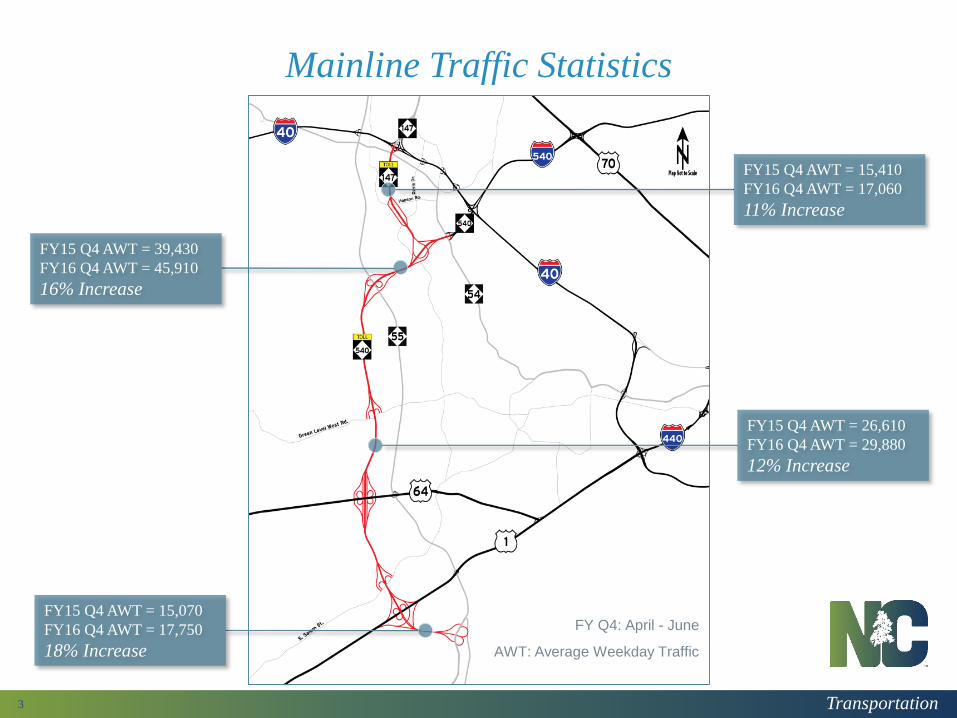
Mainline Traffic Statistics
3
FY15 Q4 AWT = 39,430
FY16 Q4 AWT = 45,910
16% Increase
FY15 Q4 AWT = 15,070
FY16 Q4 AWT = 17,750
18% Increase
FY15 Q4 AWT = 15,410
FY16 Q4 AWT = 17,060
11% Increase
FY15 Q4 AWT = 26,610
FY16 Q4 AWT = 29,880
12% Increase
FY Q4: April - June
AWT: Average Weekday Traffic
Transportation
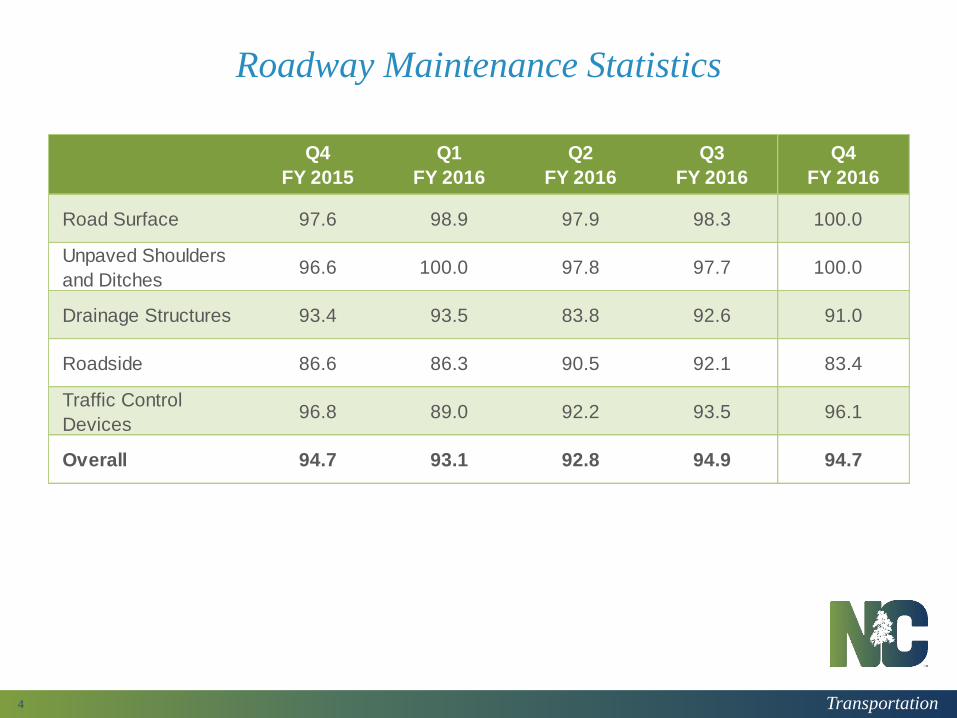
Roadway Maintenance Statistics
4
Q4
FY 2015
Q1
FY 2016
Q2
FY 2016
Q3
FY 2016
Q4
FY 2016
Road Surface 97.6 98.9 97.9 98.3 100.0
Unpaved Shoulders
and Ditches96.6 100.0 97.8 97.7 100.0
Drainage Structures 93.4 93.5 83.8 92.6 91.0
Roadside 86.6 86.3 90.5 92.1 83.4
Traffic Control
Devices96.8 89.0 92.2 93.5 96.1
Overall 94.7 93.1 92.8 94.9 94.7
Transportation
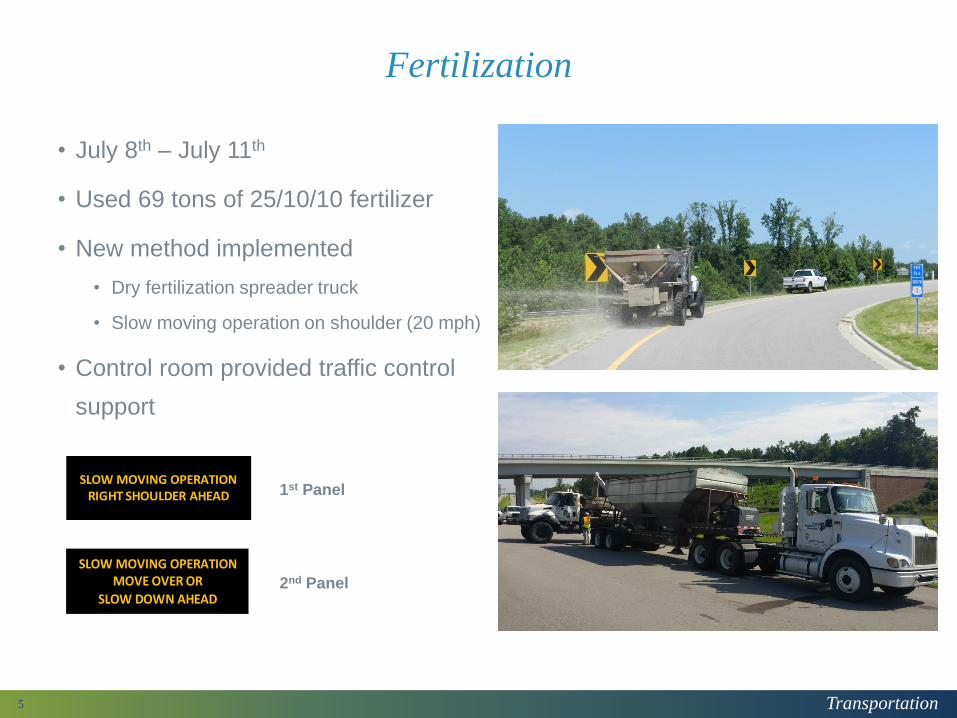
Fertilization
5
• July 8th – July 11th
• Used 69 tons of 25/10/10 fertilizer
• New method implemented
• Dry fertilization spreader truck
• Slow moving operation on shoulder (20 mph)
• Control room provided traffic control
support
SLOW MOVING OPERATION
RIGHT SHOULDER AHEAD
SLOW MOVING OPERATION
MOVE OVER OR
SLOW DOWN AHEAD
1st Panel
2nd Panel
Transportation
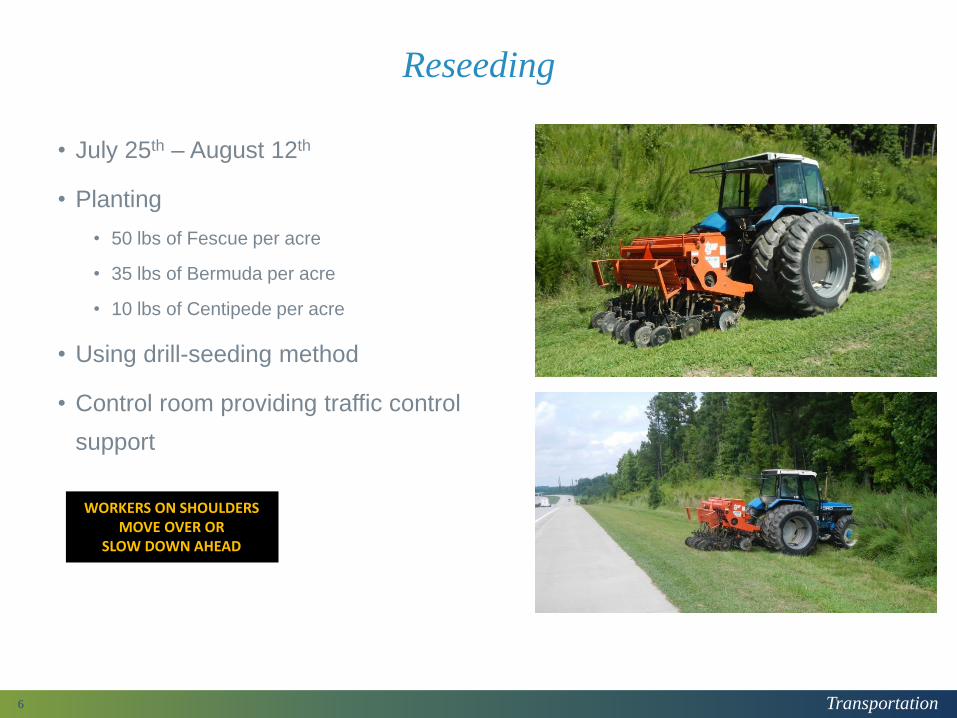
Reseeding
6
• July 25th – August 12th
• Planting
• 50 lbs of Fescue per acre
• 35 lbs of Bermuda per acre
• 10 lbs of Centipede per acre
• Using drill-seeding method
• Control room providing traffic control
support
WORKERS ON SHOULDERSMOVE OVER OR
SLOW DOWN AHEAD
Transportation
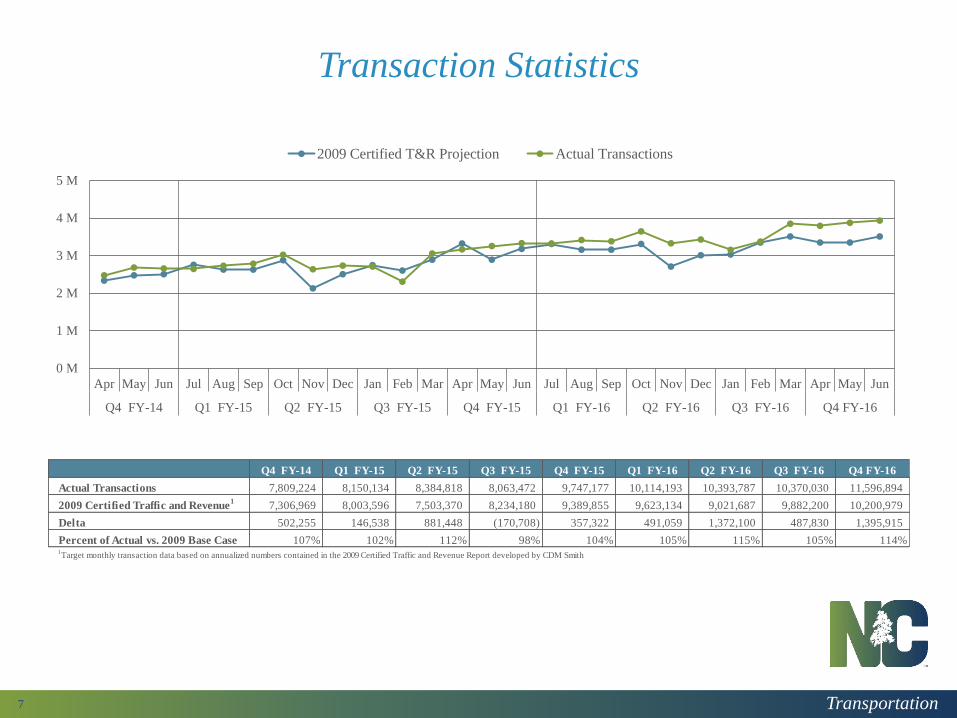
Transaction Statistics
7
Q4 FY-14 Q1 FY-15 Q2 FY-15 Q3 FY-15 Q4 FY-15 Q1 FY-16 Q2 FY-16 Q3 FY-16 Q4 FY-16
Actual Transactions 7,809,224 8,150,134 8,384,818 8,063,472 9,747,177 10,114,193 10,393,787 10,370,030 11,596,894
2009 Certified Traffic and Revenue1
7,306,969 8,003,596 7,503,370 8,234,180 9,389,855 9,623,134 9,021,687 9,882,200 10,200,979
Delta 502,255 146,538 881,448 (170,708) 357,322 491,059 1,372,100 487,830 1,395,915
Percent of Actual vs. 2009 Base Case 107% 102% 112% 98% 104% 105% 115% 105% 114%1Target monthly transaction data based on annualized numbers contained in the 2009 Certified Traffic and Revenue Report developed by CDM Smith
0 M
1 M
2 M
3 M
4 M
5 M
Apr May Jun Jul Aug Sep Oct Nov Dec Jan Feb Mar Apr May Jun Jul Aug Sep Oct Nov Dec Jan Feb Mar Apr May Jun
Q4 FY-14 Q1 FY-15 Q2 FY-15 Q3 FY-15 Q4 FY-15 Q1 FY-16 Q2 FY-16 Q3 FY-16 Q4 FY-16
2009 Certified T&R Projection Actual Transactions
Transportation
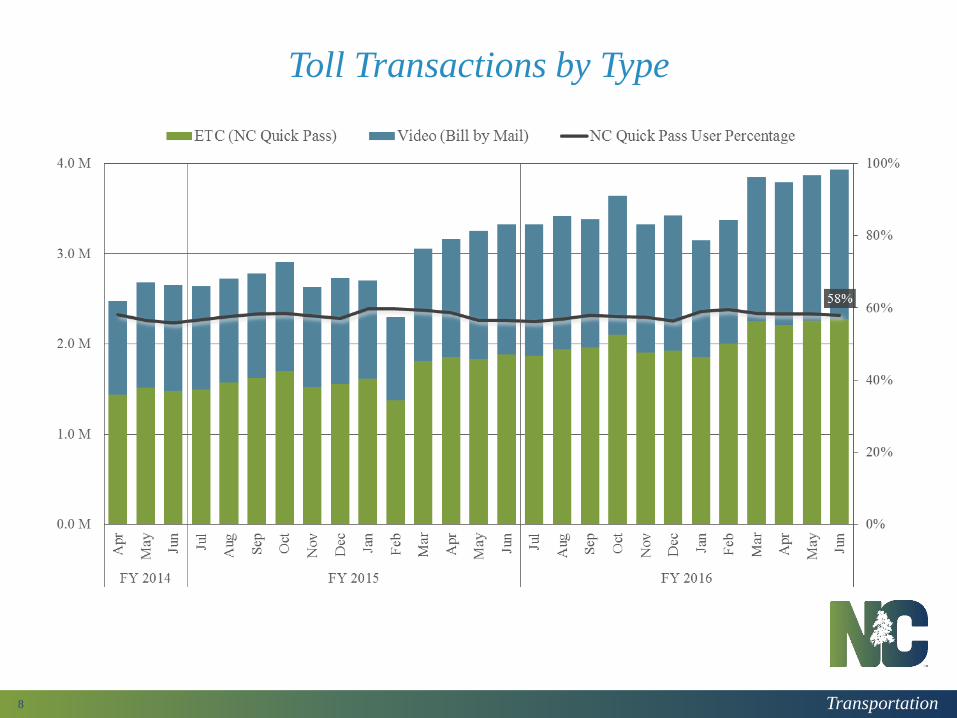
Toll Transactions by Type
8
Transportation
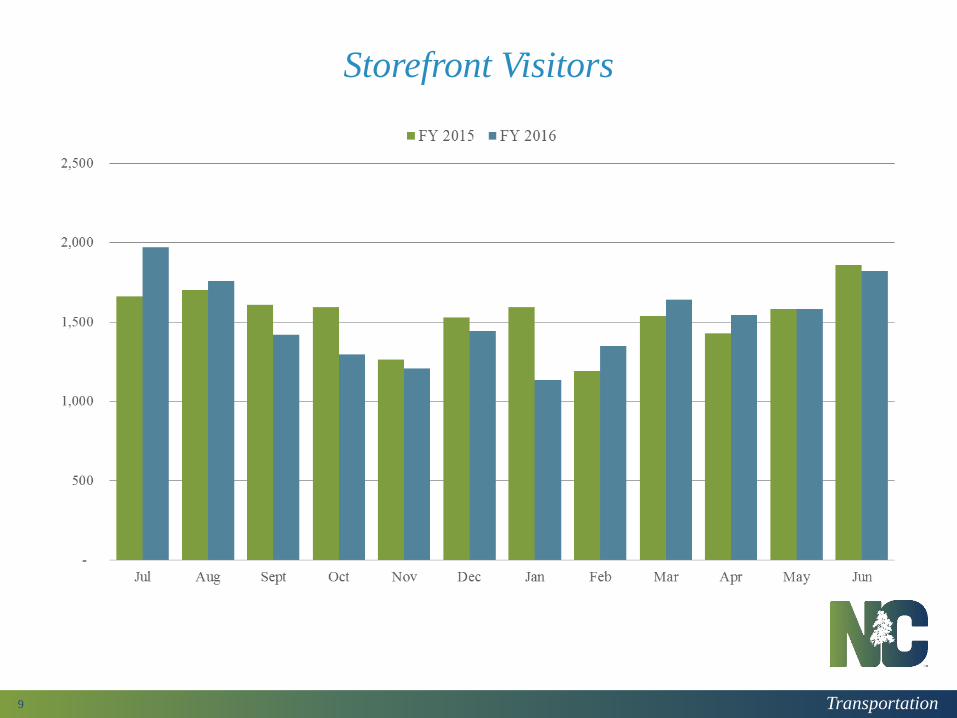
Storefront Visitors
9
Transportation
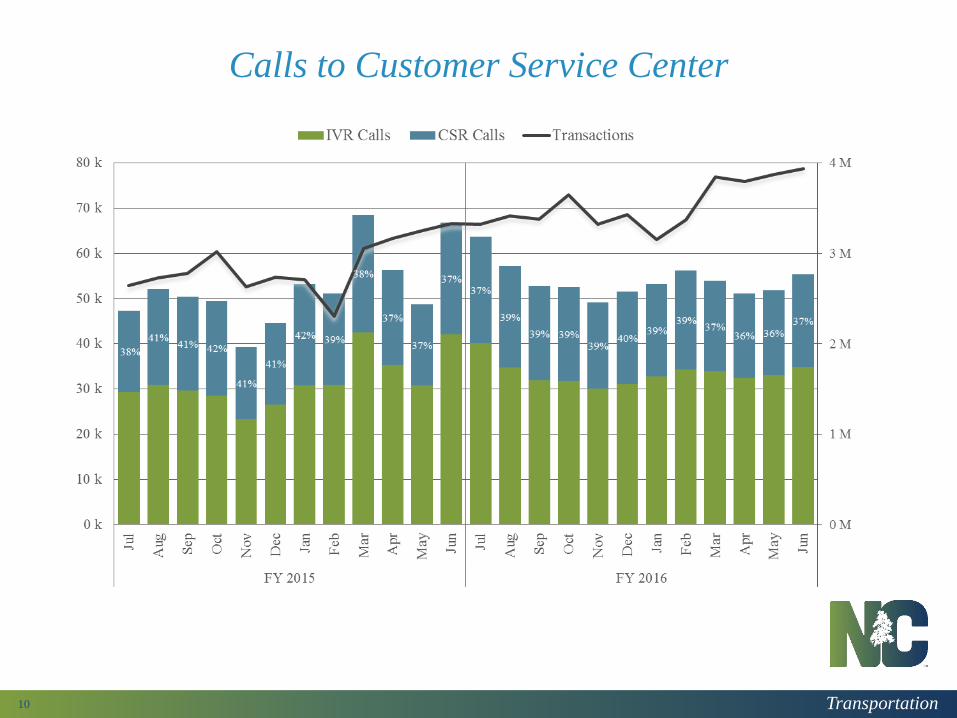
Calls to Customer Service Center
10
Transportation
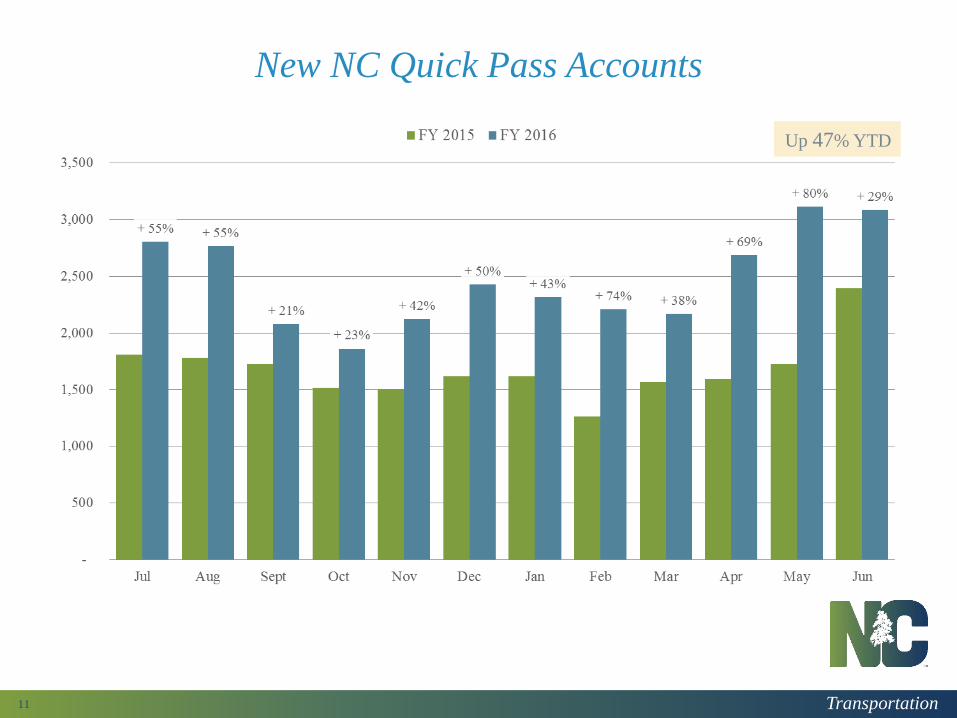
New NC Quick Pass Accounts
11
Up 47% YTD
Transportation
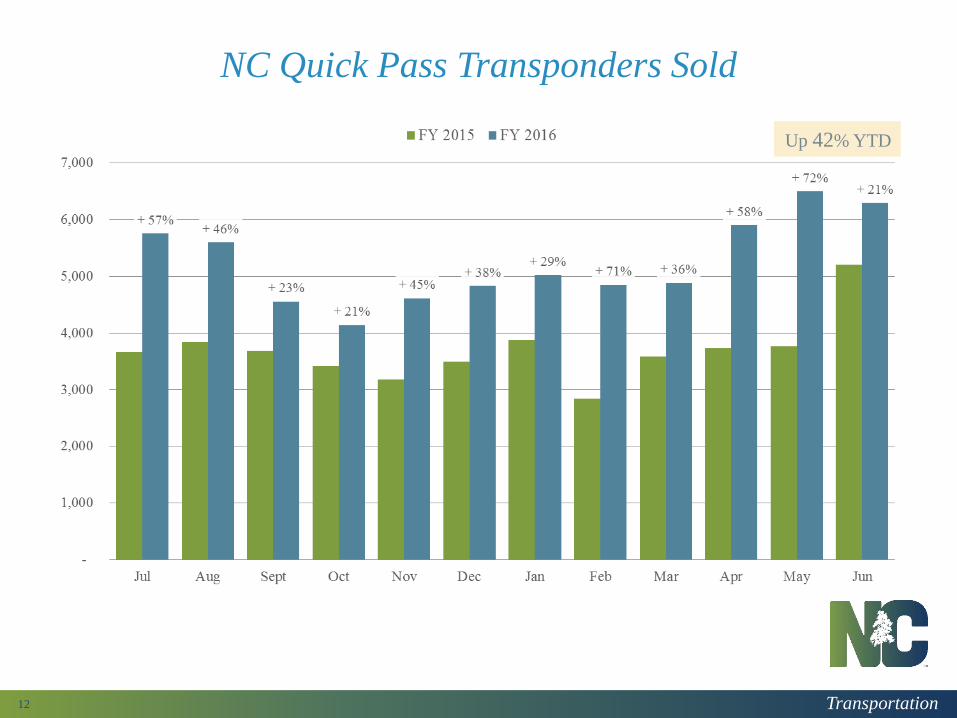
NC Quick Pass Transponders Sold
12
Up 42% YTD

Transportation
Triangle Expressway Financials
13
David RoyDirector of Finance and Budget
Transportation
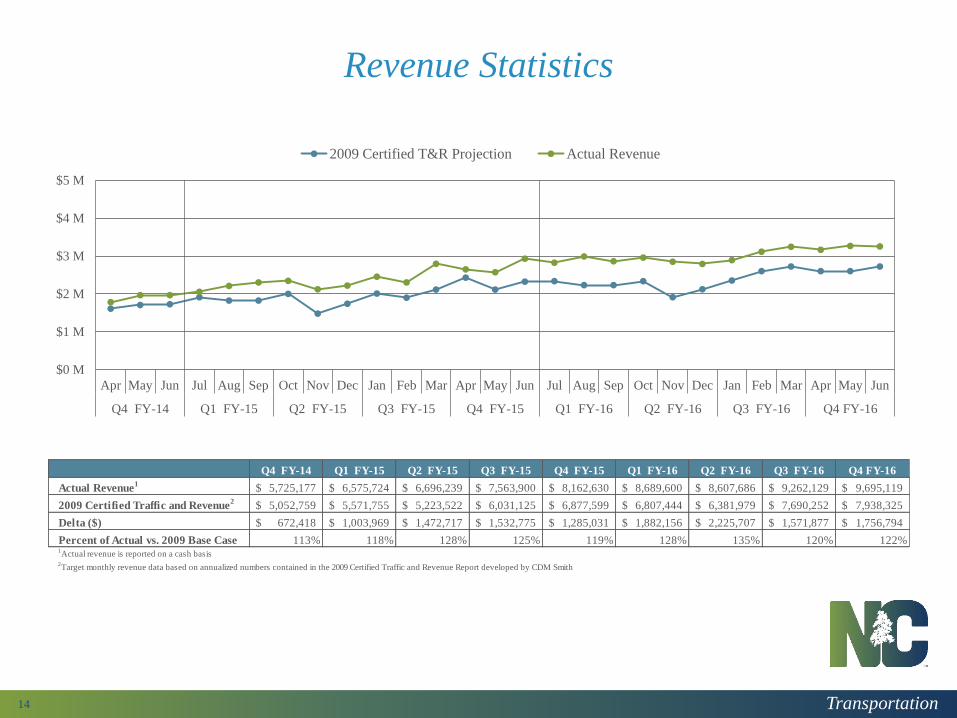
Revenue Statistics
14
Q4 FY-14 Q1 FY-15 Q2 FY-15 Q3 FY-15 Q4 FY-15 Q1 FY-16 Q2 FY-16 Q3 FY-16 Q4 FY-16
Actual Revenue1
5,725,177$ 6,575,724$ 6,696,239$ 7,563,900$ 8,162,630$ 8,689,600$ 8,607,686$ 9,262,129$ 9,695,119$
2009 Certified Traffic and Revenue2
5,052,759$ 5,571,755$ 5,223,522$ 6,031,125$ 6,877,599$ 6,807,444$ 6,381,979$ 7,690,252$ 7,938,325$
Delta ($) 672,418$ 1,003,969$ 1,472,717$ 1,532,775$ 1,285,031$ 1,882,156$ 2,225,707$ 1,571,877$ 1,756,794$
Percent of Actual vs. 2009 Base Case 113% 118% 128% 125% 119% 128% 135% 120% 122%1Actual revenue is reported on a cash basis
2Target monthly revenue data based on annualized numbers contained in the 2009 Certified Traffic and Revenue Report developed by CDM Smith
$0 M
$1 M
$2 M
$3 M
$4 M
$5 M
Apr May Jun Jul Aug Sep Oct Nov Dec Jan Feb Mar Apr May Jun Jul Aug Sep Oct Nov Dec Jan Feb Mar Apr May Jun
Q4 FY-14 Q1 FY-15 Q2 FY-15 Q3 FY-15 Q4 FY-15 Q1 FY-16 Q2 FY-16 Q3 FY-16 Q4 FY-16
2009 Certified T&R Projection Actual Revenue
Transportation
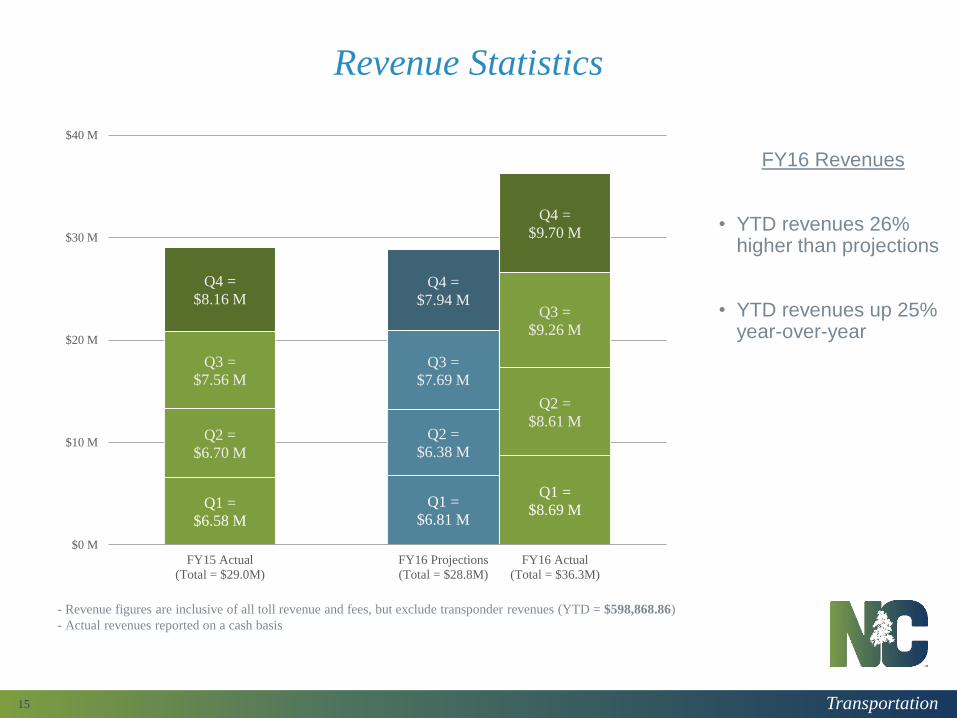
Revenue Statistics
15
- Revenue figures are inclusive of all toll revenue and fees, but exclude transponder revenues (YTD = $598,868.86)
- Actual revenues reported on a cash basis
FY16 Revenues
• YTD revenues 26% higher than projections
• YTD revenues up 25% year-over-year
Q1 =
$6.81 M
Q2 =
$6.38 M
Q3 =
$7.69 M
Q4 =
$7.94 M
Q1 =
$6.58 M
Q1 =
$8.69 M
Q2 =
$6.70 M
Q2 =
$8.61 M
Q3 =
$7.56 M
Q3 =
$9.26 M
Q4 =
$8.16 M
Q4 =
$9.70 M
$0 M
$10 M
$20 M
$30 M
$40 M
FY15 Actual
(Total = $29.0M)
FY16 Projections
(Total = $28.8M)
FY16 Actual
(Total = $36.3M)
Transportation
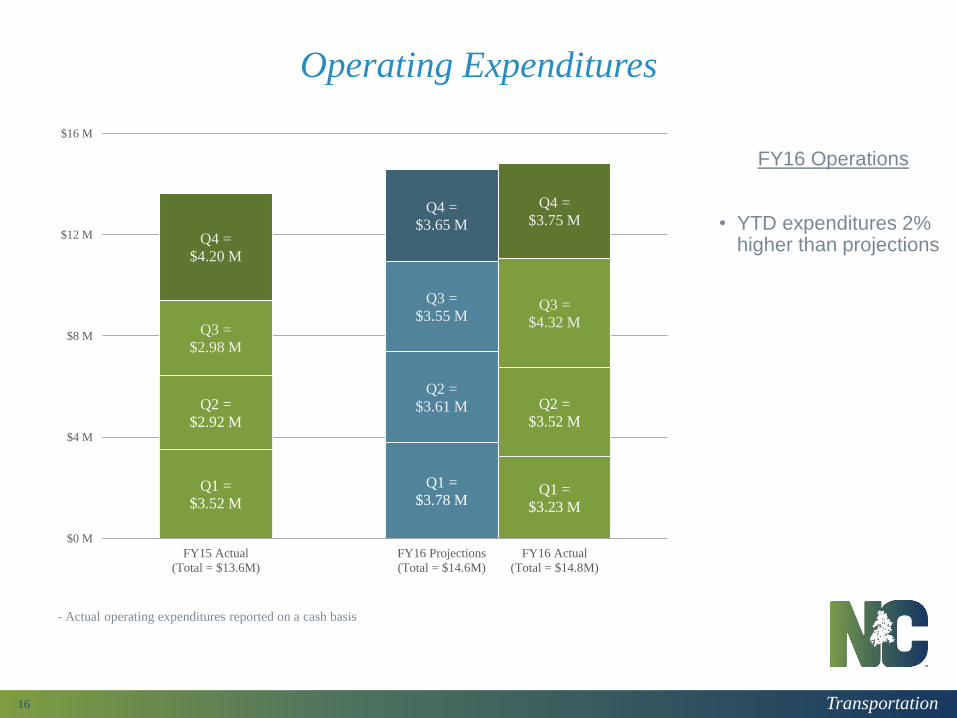
Operating Expenditures
16
FY16 Operations
• YTD expenditures 2% higher than projections
- Actual operating expenditures reported on a cash basis
Q1 =
$3.78 M
Q2 =
$3.61 M
Q3 =
$3.55 M
Q4 =
$3.65 M
Q1 =
$3.52 MQ1 =
$3.23 M
Q2 =
$2.92 M
Q2 =
$3.52 M
Q3 =
$2.98 M
Q3 =
$4.32 M
Q4 =
$4.20 M
Q4 =
$3.75 M
$0 M
$4 M
$8 M
$12 M
$16 M
FY15 Actual
(Total = $13.6M)
FY16 Projections
(Total = $14.6M)
FY16 Actual
(Total = $14.8M)
Transportation17
Access 540 – Project Update
Dennis Jernigan, PEDivision 5 Construction Engineer
Transportation
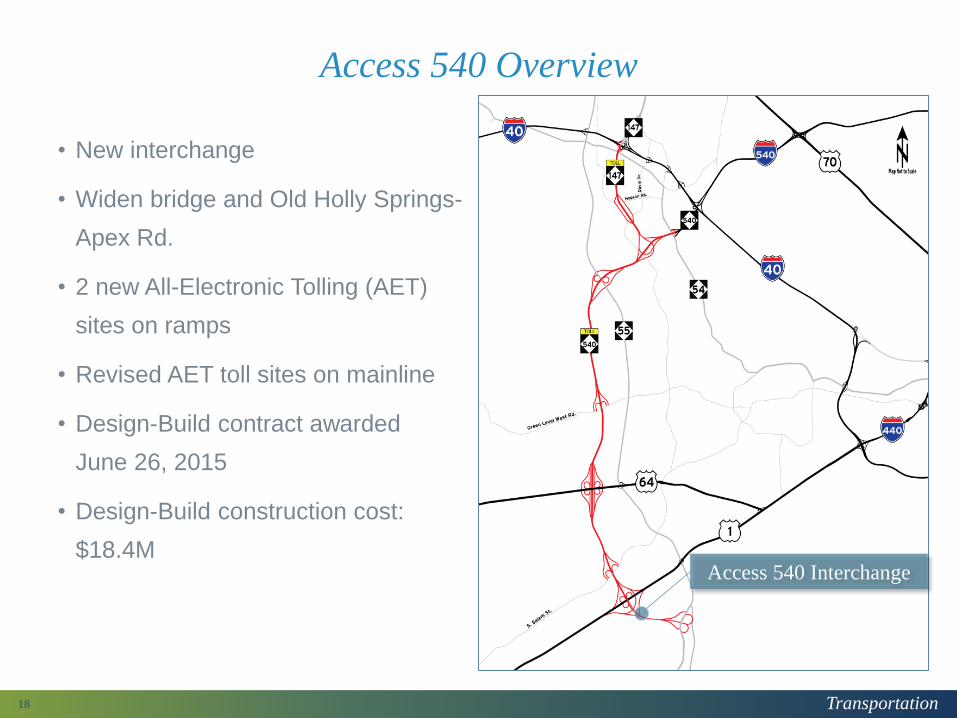
Access 540 Overview
18
• New interchange
• Widen bridge and Old Holly Springs-
Apex Rd.
• 2 new All-Electronic Tolling (AET)
sites on ramps
• Revised AET toll sites on mainline
• Design-Build contract awarded
June 26, 2015
• Design-Build construction cost:
$18.4MAccess 540 Interchange
Transportation
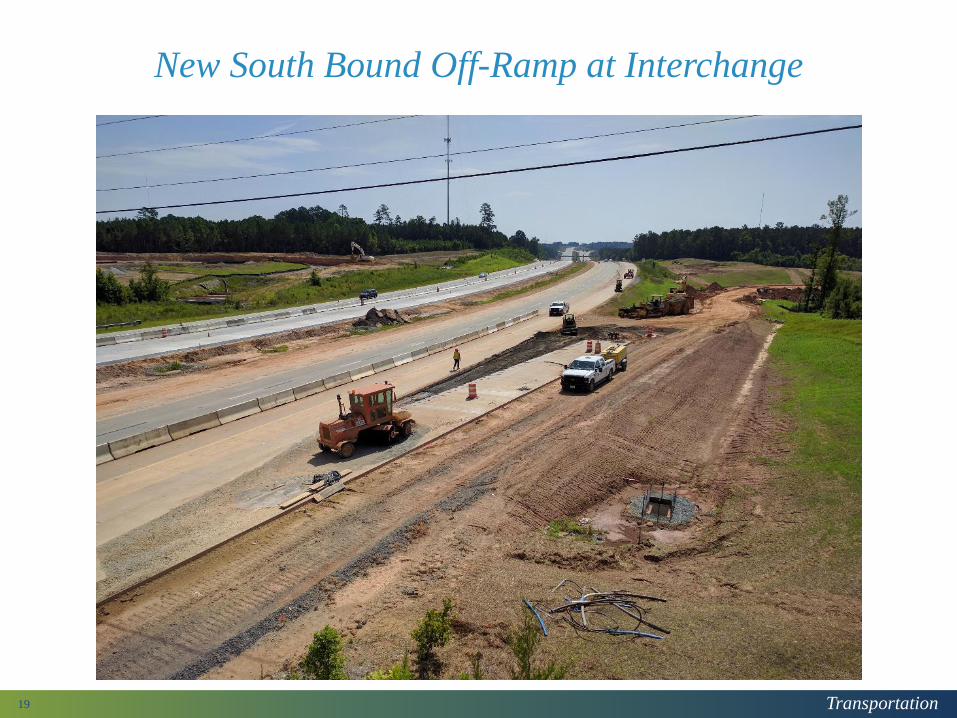
New South Bound Off-Ramp at Interchange
19
Transportation
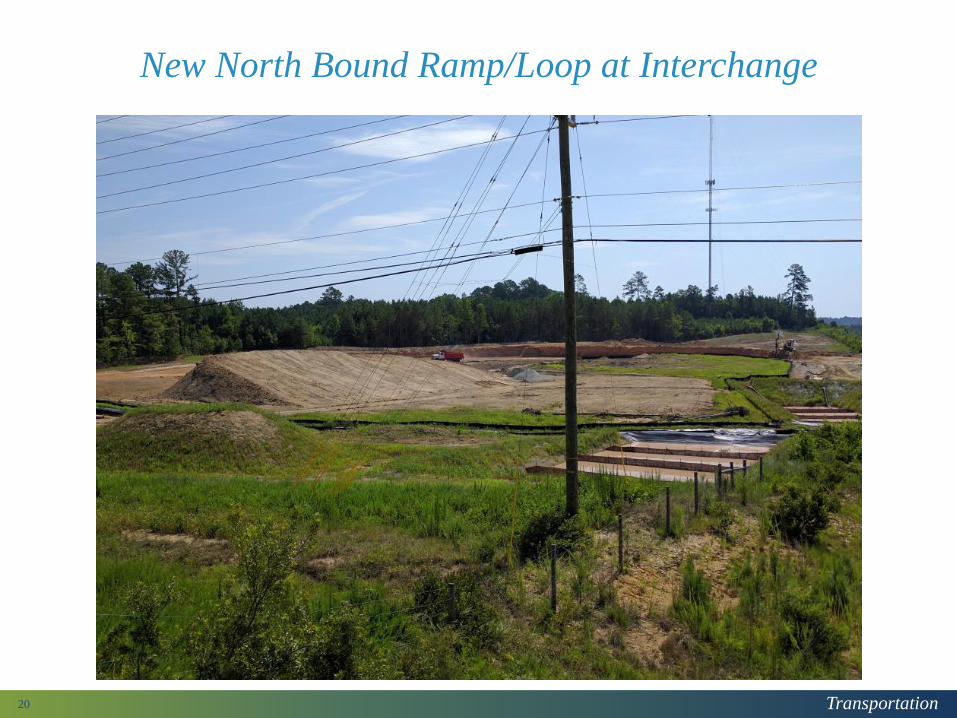
New North Bound Ramp/Loop at Interchange
20
Transportation
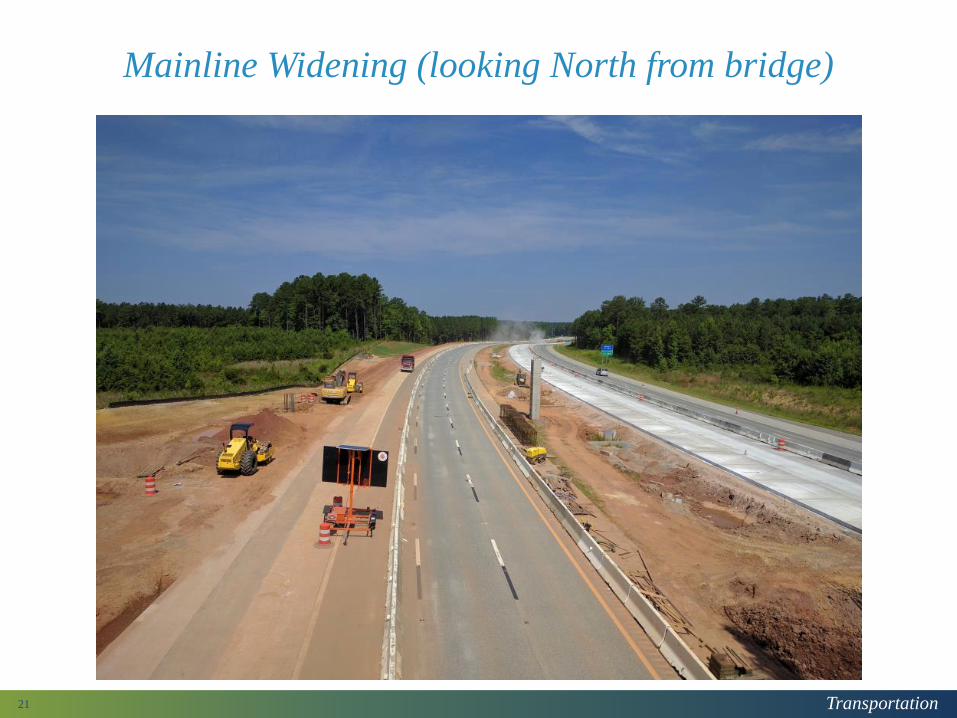
Mainline Widening (looking North from bridge)
21
Transportation
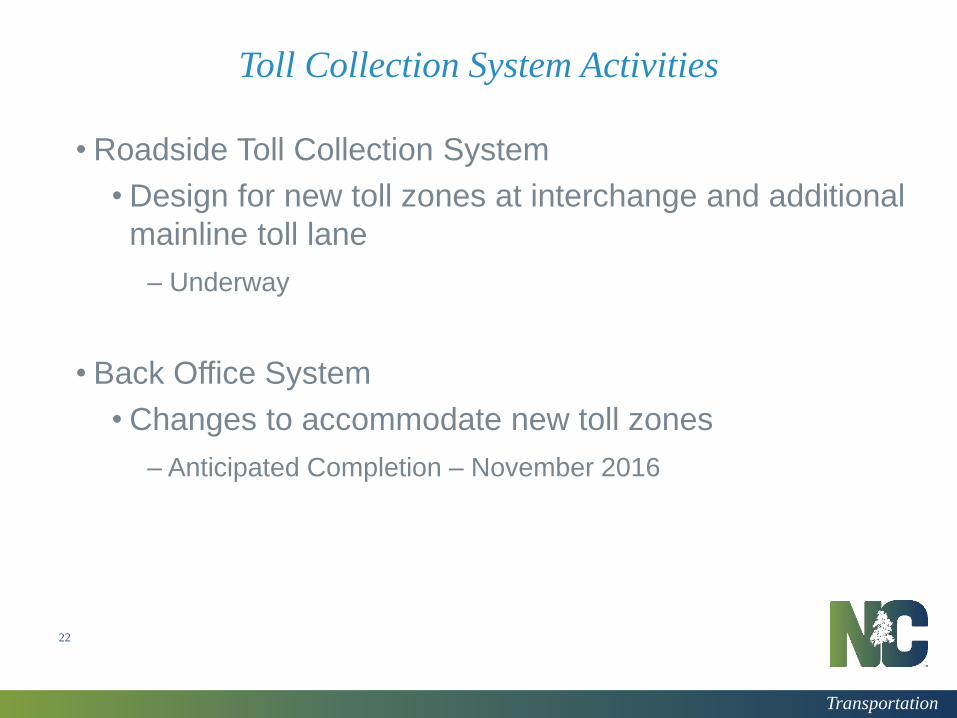
Toll Collection System Activities
22
• Roadside Toll Collection System
• Design for new toll zones at interchange and additional
mainline toll lane
– Underway
• Back Office System
• Changes to accommodate new toll zones
– Anticipated Completion – November 2016
Transportation
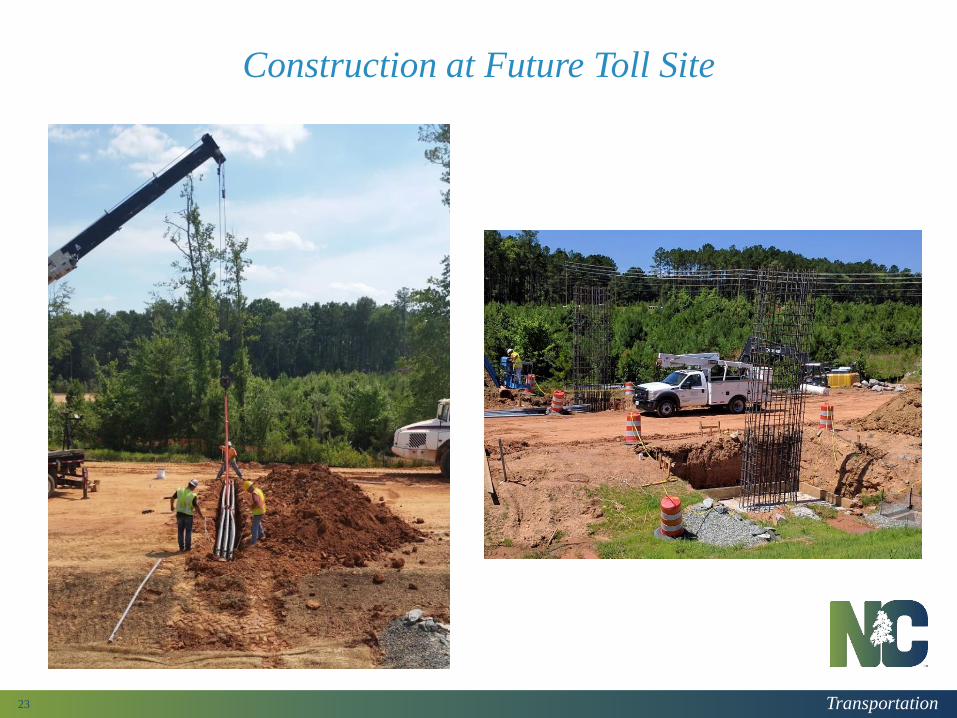
Construction at Future Toll Site
23
Transportation
Schedule Update
24
• Site turned over to NCTA for toll testing: Fall 2016
• Substantial Completion / Open to Traffic: Late 2016
• Final Completion: Spring 2017
Transportation25
Access 540 – Toll Rate Schedule
David RoyDirector of Finance and Budget
Transportation
Class 1 Class 2 Class 3
(2-axles) (3-axles) (4 or more axles)
Calender
Year ETC
Bill by
Mail ETC
Bill by
Mail ETC
Bill by
2016 0.26$ 0.40$ 0.52$ 0.80$ 1.04$ 1.60$
2017 0.27 0.41 0.54 0.82 1.08 1.64
2018 0.28 0.43 0.56 0.86 1.12 1.72
2019 0.29 0.44 0.58 0.88 1.16 1.76
2020 0.30 0.46 0.60 0.92 1.20 1.84
2021 0.31 0.47 0.62 0.94 1.24 1.88
2022 0.32 0.49 0.64 0.98 1.28 1.96
2023 0.33 0.50 0.66 1.00 1.32 2.00
2024 0.34 0.52 0.68 1.04 1.36 2.08
2025 0.35 0.53 0.70 1.06 1.40 2.12
2026 0.36 0.55 0.72 1.10 1.44 2.20
2027 0.37 0.57 0.74 1.14 1.48 2.28
2028 0.38 0.58 0.76 1.16 1.52 2.32
2029 0.39 0.60 0.78 1.20 1.56 2.40
2030 0.40 0.62 0.80 1.24 1.60 2.48
2031 0.42 0.64 0.84 1.28 1.68 2.56
2032 0.43 0.66 0.86 1.32 1.72 2.64
2033 0.44 0.68 0.88 1.36 1.76 2.72
2034 0.45 0.70 0.90 1.40 1.80 2.80
2035 0.47 0.72 0.94 1.44 1.88 2.88
2036 0.48 0.73 0.96 1.46 1.92 2.92
2037 0.49 0.75 0.98 1.50 1.96 3.00
2038 0.49 0.76 0.98 1.52 1.96 3.04
2039 0.50 0.77 1.00 1.54 2.00 3.08
2040 0.51 0.79 1.02 1.58 2.04 3.16
2041 0.52 0.80 1.04 1.60 2.08 3.20
2042 0.52 0.81 1.04 1.62 2.08 3.24
2043 0.53 0.81 1.06 1.62 2.12 3.24
2044 0.53 0.82 1.06 1.64 2.12 3.28
2045 0.54 0.83 1.08 1.66 2.16 3.32
2046 0.54 0.83 1.08 1.66 2.16 3.32
2047 0.55 0.84 1.10 1.68 2.20 3.36
2048 0.55 0.85 1.10 1.70 2.20 3.40
2049 0.55 0.85 1.10 1.70 2.20 3.40
2050 0.56 0.86 1.12 1.72 2.24 3.44
2051 0.56 0.87 1.12 1.74 2.24 3.48
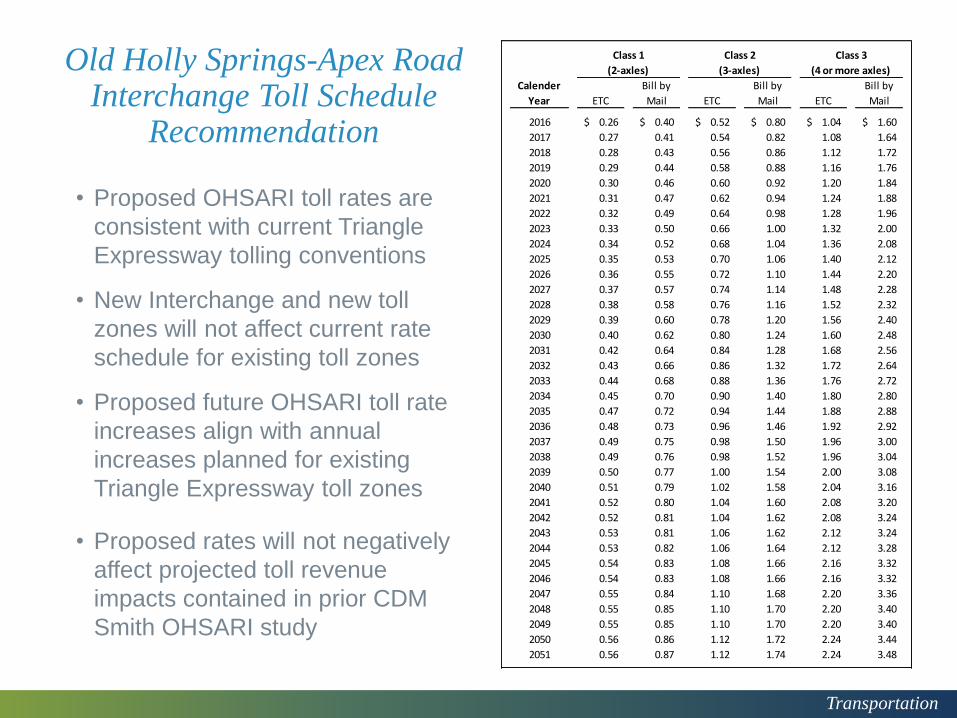
Old Holly Springs-Apex RoadInterchange Toll Schedule
Recommendation
• Proposed OHSARI toll rates are
consistent with current Triangle
Expressway tolling conventions
• New Interchange and new toll
zones will not affect current rate
schedule for existing toll zones
• Proposed future OHSARI toll rate
increases align with annual
increases planned for existing
Triangle Expressway toll zones
• Proposed rates will not negatively
affect projected toll revenue
impacts contained in prior CDM
Smith OHSARI study
Transportation
Monroe Expressway – Project Update
27
Rick Baucom, PEConstruction Project Manager
Transportation
Monroe Expressway Overview
• 20-mile long expressway
• 4 to 6 lanes wide (expandable to median)
• 37 bridges
• 21 box culverts
• 8 interchanges
• All-Electronic Tolling
28
Transportation
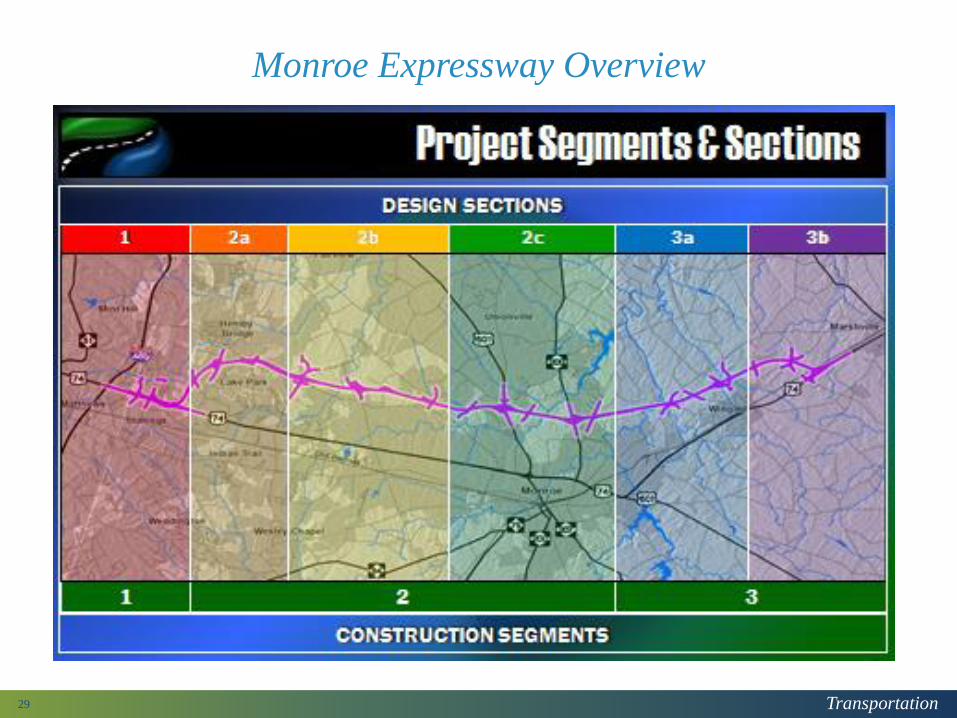
Monroe Expressway Overview
29
Transportation
Litigation Update
• On June 9, 2016 the 4th Circuit Court of Appeals issued its ruling affirming the District Court opinion in favor of NCDOT and FHWA
• The District Court found the following:
1) Plaintiff did not establish that the NCDOT & FHWA failed to take a sufficient ‘hard look’ at the reasonable alternatives.
2) NCDOT & FHWA adequately analyzed project environmental impacts –including any growth induced by the project itself and the cumulative project impacts.
3) NCDOT & FHWA had complied with NEPA’s requirements for public comment and transparency.
4) NCDOT & FHWA did not abuse their discretion in issuing the Final EIS and the Record of Decision together.
30

Transportation
Monroe Bypass Constructors
31
Monroe Bypass Constructors is a Joint
Venture comprised of three companies:
United Infrastructure Group, Inc.
Anderson Columbia Company, Inc.
Boggs Paving, Inc.
Transportation
Construction Activities
32
• Clearing & Grubbing and Erosion Control – 1, 2 & 3• Cleared Approx. 95% of the 20 mile corridor• EC installation & maintenance is a major operation• Over 400 skimmer basins and 60 miles of silt fence installed
• Box Culverts and Pipe – 1, 2 & 3• 17 culverts complete & 3 under construction• 4.2 miles of reinforced concrete pipe installed
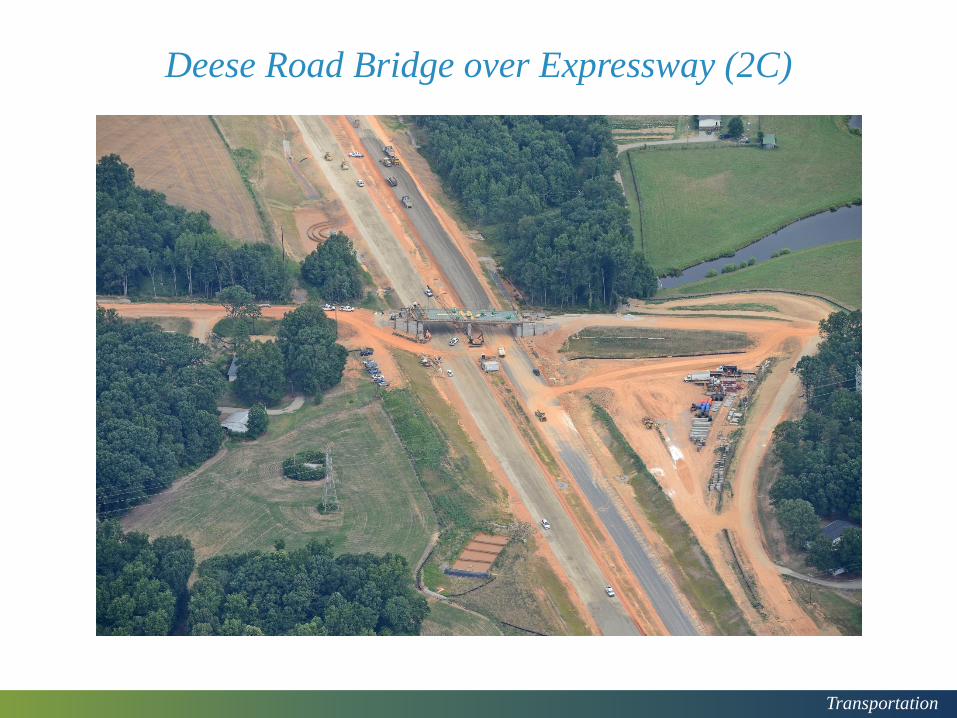
• Bridges and MSE Walls – 2B, 2C & 3• 4 bridges complete – 2 carrying traffic• 23 bridges under construction• 1.8 Million pounds of rebar installed
• Grading and Utilities – 1, 2B, 2C & 3• 44% of Earthwork complete• Grading focus has moved to areas between bridge sites• Fine grading has started in Segments 2C & 3• 9.4 miles of water line & 3.2 miles sewer line installed

Transportation
Bridges and MSE Walls
33
Transportation
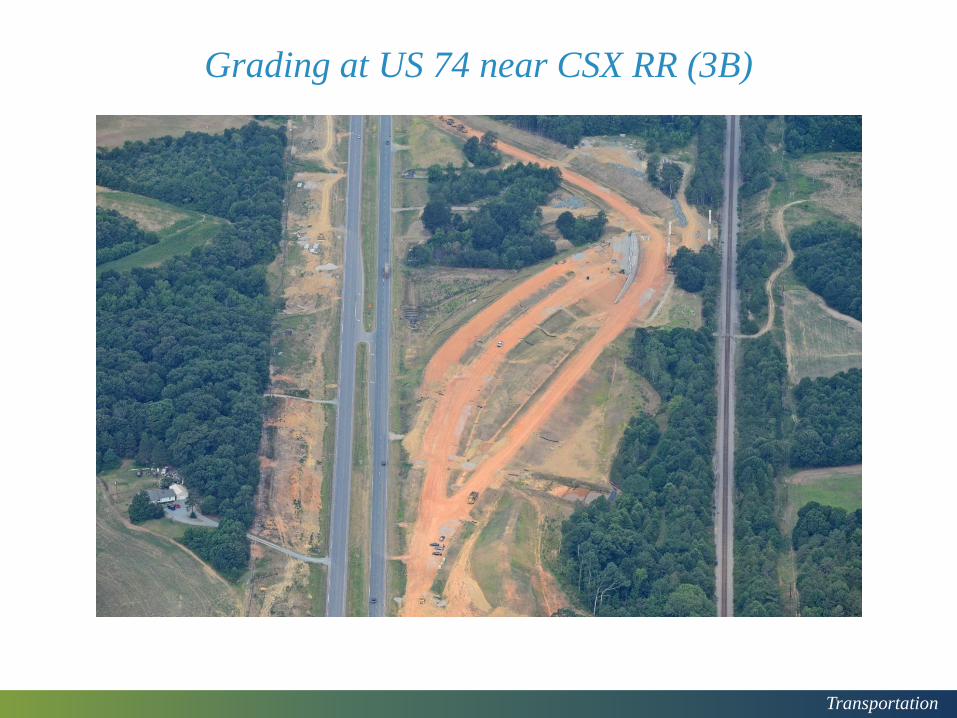
Grading at US 74 near CSX RR (3B)

Transportation
Ansonville Road to Austin-Chaney Road (3A)
Transportation
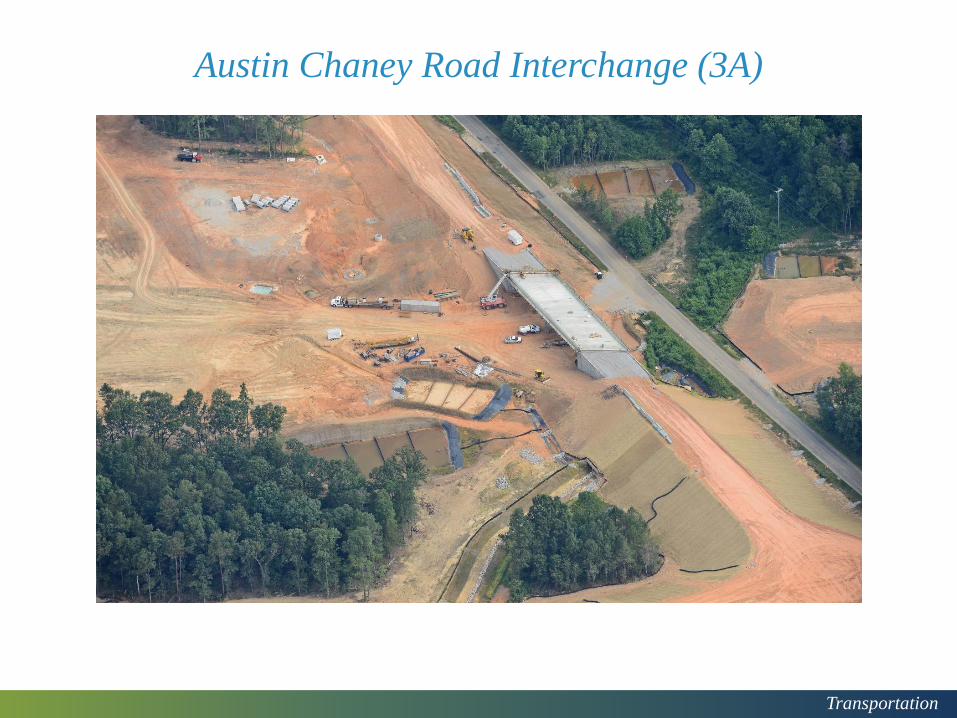
Austin Chaney Road Interchange (3A)
Transportation
Deese Road Bridge over Expressway (2C)
Transportation
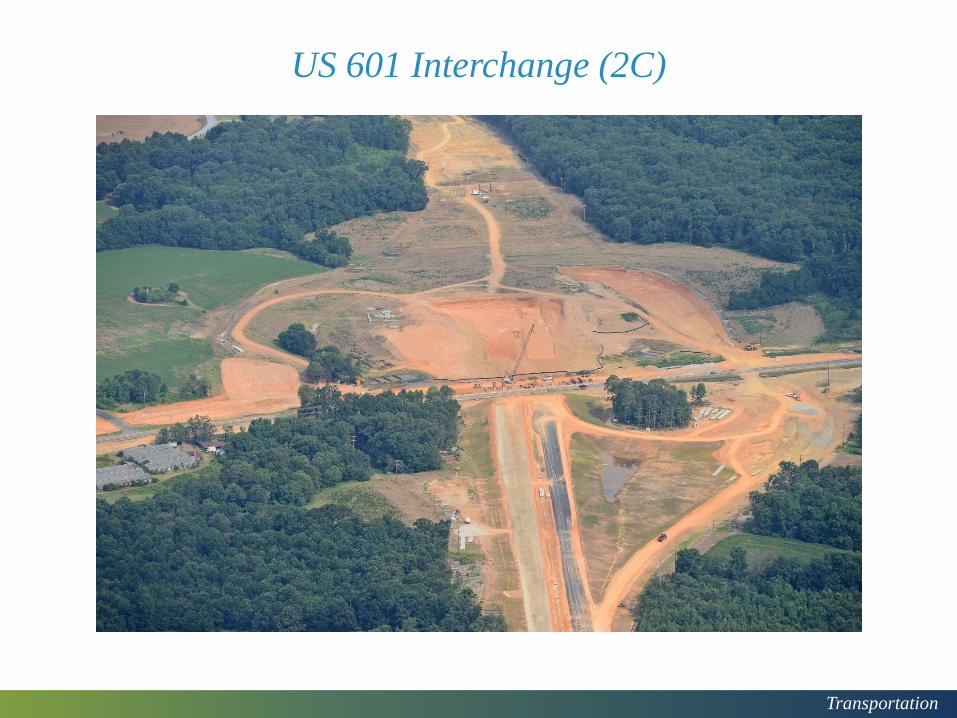
US 601 Interchange (2C)
Transportation
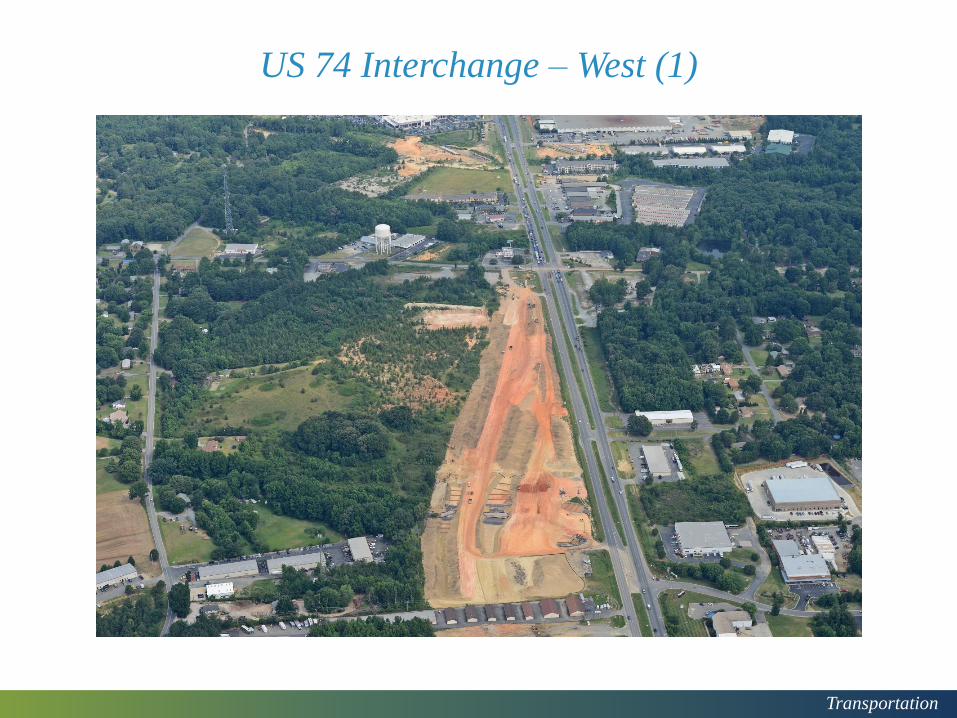
US 74 Interchange – West (1)
Transportation
Right-of-Way Acquisition and Landscaping Update
• As of June 30, 2016, 99.4% of parcels have been acquired or condemned
• Only 3 parcels remain to be purchased or condemned
• NCDOT Roadside Environmental group developing Conceptual Plan for Landscaping
40
Transportation
Toll Collection System Update
41
• Roadside Toll Collection System – Request for Proposals (RFP) advertised April 14, 2016; award in Fall 2016
• Back Office System – Planning for changes to accommodate project and new toll zones
• Automatic Vehicle Identification – Request for Proposals (RFP) to be advertised Late Summer 2016; award in Fall 2016
Transportation
Two-Month Look Ahead Schedule
• Section 1 – Utility Relocation, Culvert 200, Grading, Bridge 300
• Section 2A – Clearing & Grubbing, Erosion Control, Utility Relocation
• Section 2B – Clearing & Grubbing, Erosion Control, Utility Relocation, Bridge 1300
• Section 2C – US 601 Bridge, Grading, Chemical Subgrade Stabilization, Paving
• Section 3 – Grading, Chemical Subgrade Stabilization, Paving, Phifer Road/Forest Hills School Road Relocation, US 74 Widening
42
Transportation
Milestone Schedule
• ITS Integration – July 31, 2018
•Substantial Completion – November 27, 2018
•Final Completion – May 28, 2019
43
Transportation
Monroe Expressway – Plan of Finance Discussion
44
David MillerPFM
Transportation
2016 Plan of Financing
45
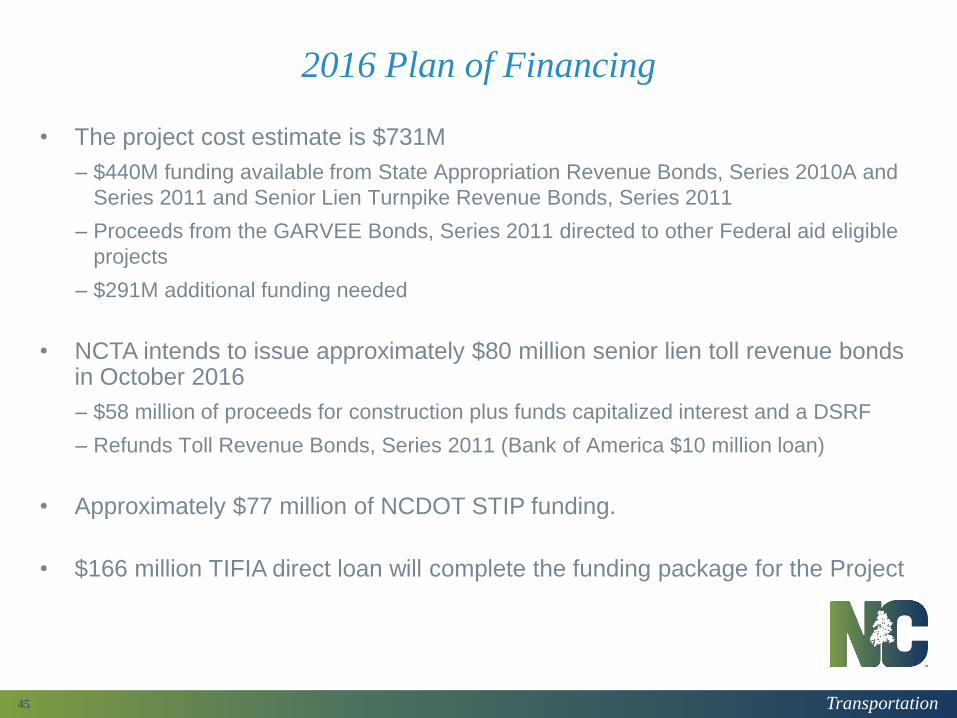
• The project cost estimate is $731M
– $440M funding available from State Appropriation Revenue Bonds, Series 2010A and
Series 2011 and Senior Lien Turnpike Revenue Bonds, Series 2011
– Proceeds from the GARVEE Bonds, Series 2011 directed to other Federal aid eligible
projects
– $291M additional funding needed
• NCTA intends to issue approximately $80 million senior lien toll revenue bonds in October 2016
– $58 million of proceeds for construction plus funds capitalized interest and a DSRF
– Refunds Toll Revenue Bonds, Series 2011 (Bank of America $10 million loan)
• Approximately $77 million of NCDOT STIP funding.
• $166 million TIFIA direct loan will complete the funding package for the Project
Transportation
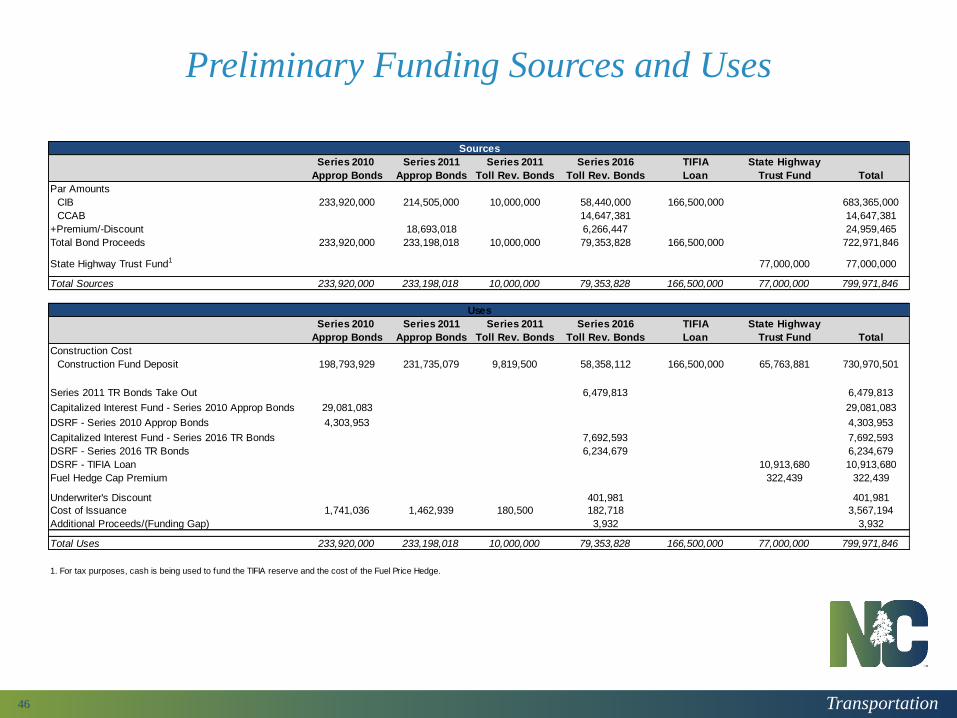
Preliminary Funding Sources and Uses
46
Series 2010 Series 2011 Series 2011 Series 2016 TIFIA State Highway
Approp Bonds Approp Bonds Toll Rev. Bonds Toll Rev. Bonds Loan Trust Fund Total
Par Amounts
CIB 233,920,000 214,505,000 10,000,000 58,440,000 166,500,000 683,365,000
CCAB 14,647,381 14,647,381
+Premium/-Discount 18,693,018 6,266,447 24,959,465
Total Bond Proceeds 233,920,000 233,198,018 10,000,000 79,353,828 166,500,000 722,971,846
State Highway Trust Fund1 77,000,000 77,000,000
Total Sources 233,920,000 233,198,018 10,000,000 79,353,828 166,500,000 77,000,000 799,971,846
Series 2010 Series 2011 Series 2011 Series 2016 TIFIA State Highway
Approp Bonds Approp Bonds Toll Rev. Bonds Toll Rev. Bonds Loan Trust Fund Total
Construction Cost
Construction Fund Deposit 198,793,929 231,735,079 9,819,500 58,358,112 166,500,000 65,763,881 730,970,501
Series 2011 TR Bonds Take Out 6,479,813 6,479,813
Capitalized Interest Fund - Series 2010 Approp Bonds 29,081,083 29,081,083
DSRF - Series 2010 Approp Bonds 4,303,953 4,303,953
Capitalized Interest Fund - Series 2016 TR Bonds 7,692,593 7,692,593
DSRF - Series 2016 TR Bonds 6,234,679 6,234,679
DSRF - TIFIA Loan 10,913,680 10,913,680
Fuel Hedge Cap Premium 322,439 322,439
Underwriter's Discount 401,981 401,981
Cost of Issuance 1,741,036 1,462,939 180,500 182,718 3,567,194
Additional Proceeds/(Funding Gap) 3,932 3,932
Total Uses 233,920,000 233,198,018 10,000,000 79,353,828 166,500,000 77,000,000 799,971,846
1. For tax purposes, cash is being used to fund the TIFIA reserve and the cost of the Fuel Price Hedge.
Sources
Uses
Transportation
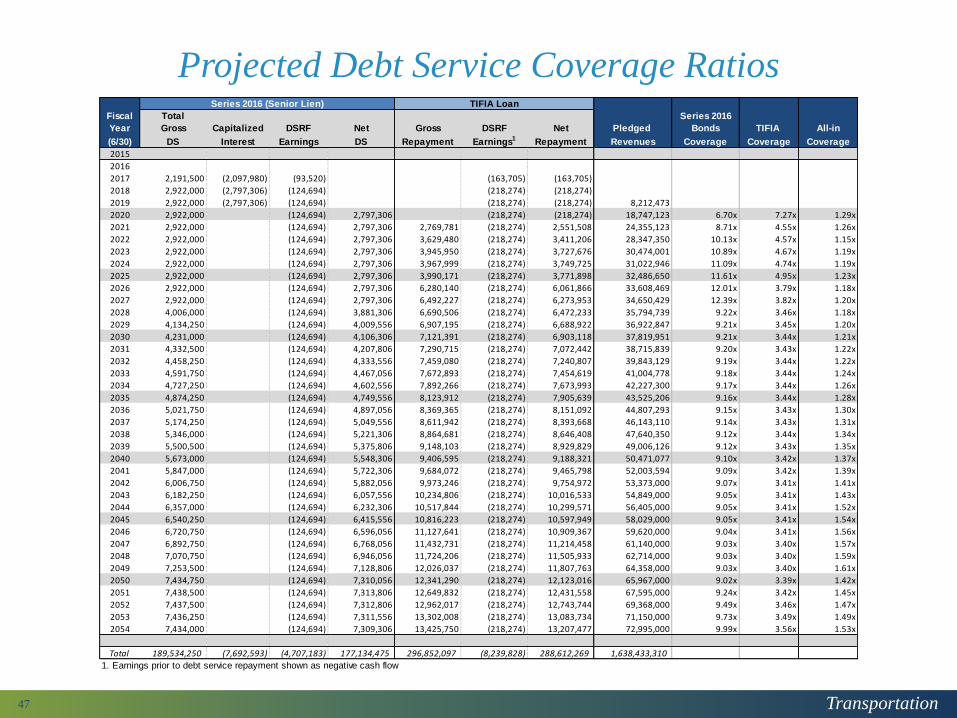
Projected Debt Service Coverage Ratios
47
Fiscal Total Series 2016
Year Gross Capitalized DSRF Net Gross DSRF Net Pledged Bonds TIFIA All-in
(6/30) DS Interest Earnings DS Repayment Earnings1 Repayment Revenues Coverage Coverage Coverage
2015
2016
2017 2,191,500 (2,097,980) (93,520) (163,705) (163,705)
2018 2,922,000 (2,797,306) (124,694) (218,274) (218,274)
2019 2,922,000 (2,797,306) (124,694) (218,274) (218,274) 8,212,473
2020 2,922,000 (124,694) 2,797,306 (218,274) (218,274) 18,747,123 6.70x 7.27x 1.29x
2021 2,922,000 (124,694) 2,797,306 2,769,781 (218,274) 2,551,508 24,355,123 8.71x 4.55x 1.26x
2022 2,922,000 (124,694) 2,797,306 3,629,480 (218,274) 3,411,206 28,347,350 10.13x 4.57x 1.15x
2023 2,922,000 (124,694) 2,797,306 3,945,950 (218,274) 3,727,676 30,474,001 10.89x 4.67x 1.19x
2024 2,922,000 (124,694) 2,797,306 3,967,999 (218,274) 3,749,725 31,022,946 11.09x 4.74x 1.19x
2025 2,922,000 (124,694) 2,797,306 3,990,171 (218,274) 3,771,898 32,486,650 11.61x 4.95x 1.23x
2026 2,922,000 (124,694) 2,797,306 6,280,140 (218,274) 6,061,866 33,608,469 12.01x 3.79x 1.18x
2027 2,922,000 (124,694) 2,797,306 6,492,227 (218,274) 6,273,953 34,650,429 12.39x 3.82x 1.20x
2028 4,006,000 (124,694) 3,881,306 6,690,506 (218,274) 6,472,233 35,794,739 9.22x 3.46x 1.18x
2029 4,134,250 (124,694) 4,009,556 6,907,195 (218,274) 6,688,922 36,922,847 9.21x 3.45x 1.20x
2030 4,231,000 (124,694) 4,106,306 7,121,391 (218,274) 6,903,118 37,819,951 9.21x 3.44x 1.21x
2031 4,332,500 (124,694) 4,207,806 7,290,715 (218,274) 7,072,442 38,715,839 9.20x 3.43x 1.22x
2032 4,458,250 (124,694) 4,333,556 7,459,080 (218,274) 7,240,807 39,843,129 9.19x 3.44x 1.22x
2033 4,591,750 (124,694) 4,467,056 7,672,893 (218,274) 7,454,619 41,004,778 9.18x 3.44x 1.24x
2034 4,727,250 (124,694) 4,602,556 7,892,266 (218,274) 7,673,993 42,227,300 9.17x 3.44x 1.26x
2035 4,874,250 (124,694) 4,749,556 8,123,912 (218,274) 7,905,639 43,525,206 9.16x 3.44x 1.28x
2036 5,021,750 (124,694) 4,897,056 8,369,365 (218,274) 8,151,092 44,807,293 9.15x 3.43x 1.30x
2037 5,174,250 (124,694) 5,049,556 8,611,942 (218,274) 8,393,668 46,143,110 9.14x 3.43x 1.31x
2038 5,346,000 (124,694) 5,221,306 8,864,681 (218,274) 8,646,408 47,640,350 9.12x 3.44x 1.34x
2039 5,500,500 (124,694) 5,375,806 9,148,103 (218,274) 8,929,829 49,006,126 9.12x 3.43x 1.35x
2040 5,673,000 (124,694) 5,548,306 9,406,595 (218,274) 9,188,321 50,471,077 9.10x 3.42x 1.37x
2041 5,847,000 (124,694) 5,722,306 9,684,072 (218,274) 9,465,798 52,003,594 9.09x 3.42x 1.39x
2042 6,006,750 (124,694) 5,882,056 9,973,246 (218,274) 9,754,972 53,373,000 9.07x 3.41x 1.41x
2043 6,182,250 (124,694) 6,057,556 10,234,806 (218,274) 10,016,533 54,849,000 9.05x 3.41x 1.43x
2044 6,357,000 (124,694) 6,232,306 10,517,844 (218,274) 10,299,571 56,405,000 9.05x 3.41x 1.52x
2045 6,540,250 (124,694) 6,415,556 10,816,223 (218,274) 10,597,949 58,029,000 9.05x 3.41x 1.54x
2046 6,720,750 (124,694) 6,596,056 11,127,641 (218,274) 10,909,367 59,620,000 9.04x 3.41x 1.56x
2047 6,892,750 (124,694) 6,768,056 11,432,731 (218,274) 11,214,458 61,140,000 9.03x 3.40x 1.57x
2048 7,070,750 (124,694) 6,946,056 11,724,206 (218,274) 11,505,933 62,714,000 9.03x 3.40x 1.59x
2049 7,253,500 (124,694) 7,128,806 12,026,037 (218,274) 11,807,763 64,358,000 9.03x 3.40x 1.61x
2050 7,434,750 (124,694) 7,310,056 12,341,290 (218,274) 12,123,016 65,967,000 9.02x 3.39x 1.42x
2051 7,438,500 (124,694) 7,313,806 12,649,832 (218,274) 12,431,558 67,595,000 9.24x 3.42x 1.45x
2052 7,437,500 (124,694) 7,312,806 12,962,017 (218,274) 12,743,744 69,368,000 9.49x 3.46x 1.47x
2053 7,436,250 (124,694) 7,311,556 13,302,008 (218,274) 13,083,734 71,150,000 9.73x 3.49x 1.49x
2054 7,434,000 (124,694) 7,309,306 13,425,750 (218,274) 13,207,477 72,995,000 9.99x 3.56x 1.53x
Total 189,534,250 (7,692,593) (4,707,183) 177,134,475 296,852,097 (8,239,828) 288,612,269 1,638,433,310
1. Earnings prior to debt service repayment shown as negative cash flow
TIFIA LoanSeries 2016 (Senior Lien)
Transportation
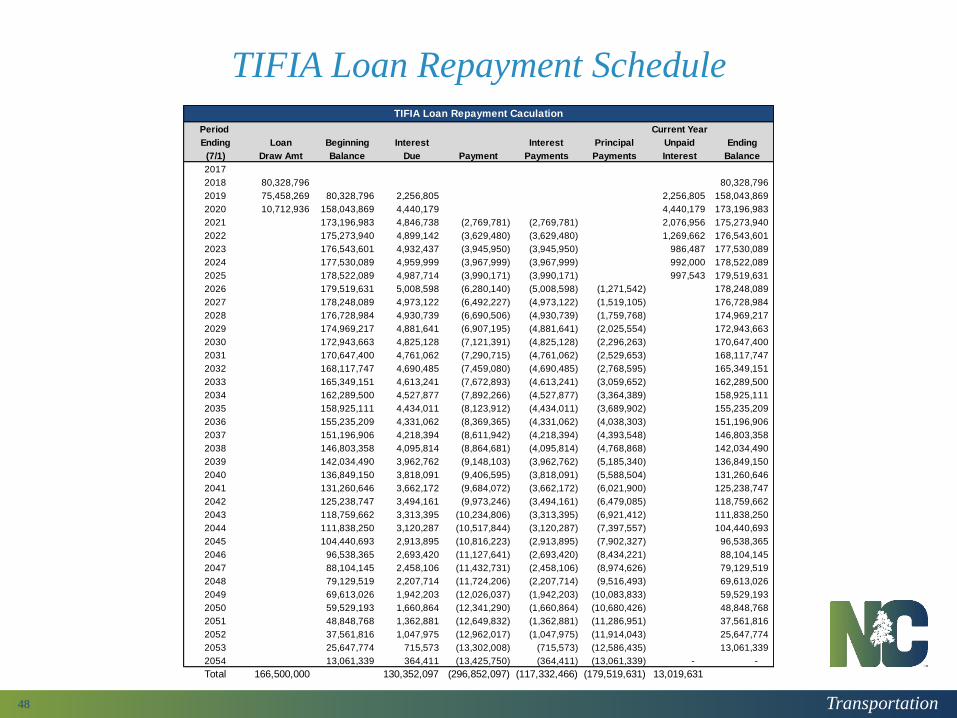
TIFIA Loan Repayment Schedule
48
Period Current Year
Ending Loan Beginning Interest Interest Principal Unpaid Ending
(7/1) Draw Amt Balance Due Payment Payments Payments Interest Balance
2017
2018 80,328,796 80,328,796
2019 75,458,269 80,328,796 2,256,805 2,256,805 158,043,869
2020 10,712,936 158,043,869 4,440,179 4,440,179 173,196,983
2021 173,196,983 4,846,738 (2,769,781) (2,769,781) 2,076,956 175,273,940
2022 175,273,940 4,899,142 (3,629,480) (3,629,480) 1,269,662 176,543,601
2023 176,543,601 4,932,437 (3,945,950) (3,945,950) 986,487 177,530,089
2024 177,530,089 4,959,999 (3,967,999) (3,967,999) 992,000 178,522,089
2025 178,522,089 4,987,714 (3,990,171) (3,990,171) 997,543 179,519,631
2026 179,519,631 5,008,598 (6,280,140) (5,008,598) (1,271,542) 178,248,089
2027 178,248,089 4,973,122 (6,492,227) (4,973,122) (1,519,105) 176,728,984
2028 176,728,984 4,930,739 (6,690,506) (4,930,739) (1,759,768) 174,969,217
2029 174,969,217 4,881,641 (6,907,195) (4,881,641) (2,025,554) 172,943,663
2030 172,943,663 4,825,128 (7,121,391) (4,825,128) (2,296,263) 170,647,400
2031 170,647,400 4,761,062 (7,290,715) (4,761,062) (2,529,653) 168,117,747
2032 168,117,747 4,690,485 (7,459,080) (4,690,485) (2,768,595) 165,349,151
2033 165,349,151 4,613,241 (7,672,893) (4,613,241) (3,059,652) 162,289,500
2034 162,289,500 4,527,877 (7,892,266) (4,527,877) (3,364,389) 158,925,111
2035 158,925,111 4,434,011 (8,123,912) (4,434,011) (3,689,902) 155,235,209
2036 155,235,209 4,331,062 (8,369,365) (4,331,062) (4,038,303) 151,196,906
2037 151,196,906 4,218,394 (8,611,942) (4,218,394) (4,393,548) 146,803,358
2038 146,803,358 4,095,814 (8,864,681) (4,095,814) (4,768,868) 142,034,490
2039 142,034,490 3,962,762 (9,148,103) (3,962,762) (5,185,340) 136,849,150
2040 136,849,150 3,818,091 (9,406,595) (3,818,091) (5,588,504) 131,260,646
2041 131,260,646 3,662,172 (9,684,072) (3,662,172) (6,021,900) 125,238,747
2042 125,238,747 3,494,161 (9,973,246) (3,494,161) (6,479,085) 118,759,662
2043 118,759,662 3,313,395 (10,234,806) (3,313,395) (6,921,412) 111,838,250
2044 111,838,250 3,120,287 (10,517,844) (3,120,287) (7,397,557) 104,440,693
2045 104,440,693 2,913,895 (10,816,223) (2,913,895) (7,902,327) 96,538,365
2046 96,538,365 2,693,420 (11,127,641) (2,693,420) (8,434,221) 88,104,145
2047 88,104,145 2,458,106 (11,432,731) (2,458,106) (8,974,626) 79,129,519
2048 79,129,519 2,207,714 (11,724,206) (2,207,714) (9,516,493) 69,613,026
2049 69,613,026 1,942,203 (12,026,037) (1,942,203) (10,083,833) 59,529,193
2050 59,529,193 1,660,864 (12,341,290) (1,660,864) (10,680,426) 48,848,768
2051 48,848,768 1,362,881 (12,649,832) (1,362,881) (11,286,951) 37,561,816
2052 37,561,816 1,047,975 (12,962,017) (1,047,975) (11,914,043) 25,647,774
2053 25,647,774 715,573 (13,302,008) (715,573) (12,586,435) 13,061,339
2054 13,061,339 364,411 (13,425,750) (364,411) (13,061,339) - -
Total 166,500,000 130,352,097 (296,852,097) (117,332,466) (179,519,631) 13,019,631
TIFIA Loan Repayment Caculation
Transportation
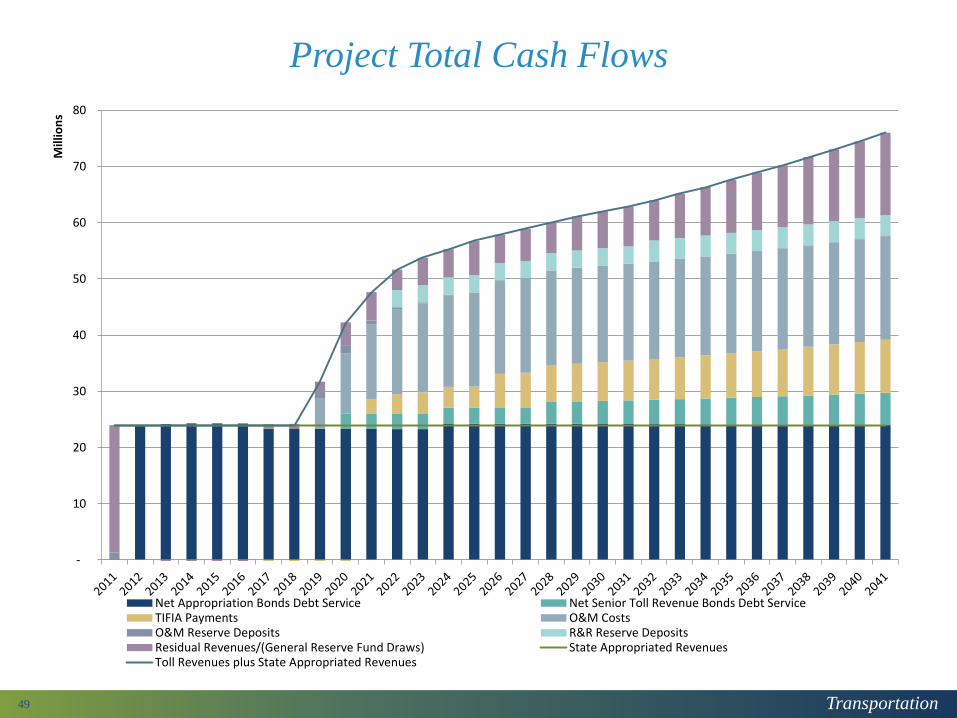
Project Total Cash Flows
49
-
10
20
30
40
50
60
70
80
Mill
ion
s
Net Appropriation Bonds Debt Service Net Senior Toll Revenue Bonds Debt ServiceTIFIA Payments O&M CostsO&M Reserve Deposits R&R Reserve DepositsResidual Revenues/(General Reserve Fund Draws) State Appropriated RevenuesToll Revenues plus State Appropriated Revenues
Transportation
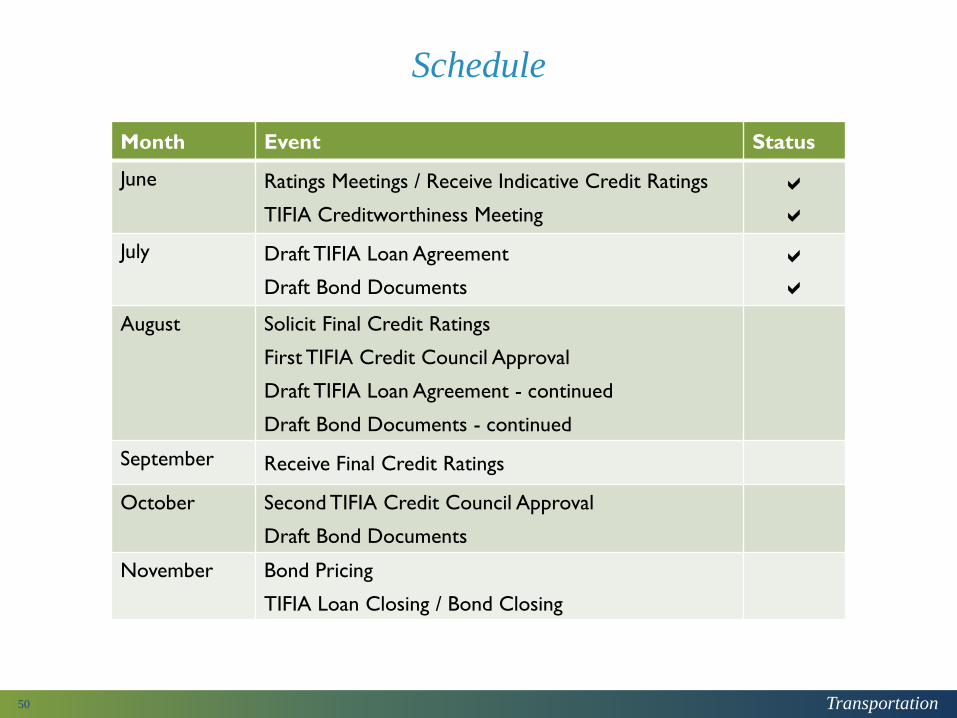
Schedule
50
Month Event Status
June Ratings Meetings / Receive Indicative Credit Ratings
TIFIA Creditworthiness Meeting
aa
July Draft TIFIA Loan Agreement
Draft Bond Documents
aa
August Solicit Final Credit Ratings
First TIFIA Credit Council Approval
Draft TIFIA Loan Agreement - continued
Draft Bond Documents - continued
September Receive Final Credit Ratings
October Second TIFIA Credit Council Approval
Draft Bond Documents
November Bond Pricing
TIFIA Loan Closing / Bond Closing

Transportation
Monroe Expressway – Financing & Bond Document Overview
51
Wally McBrideHunton & Williams
Transportation
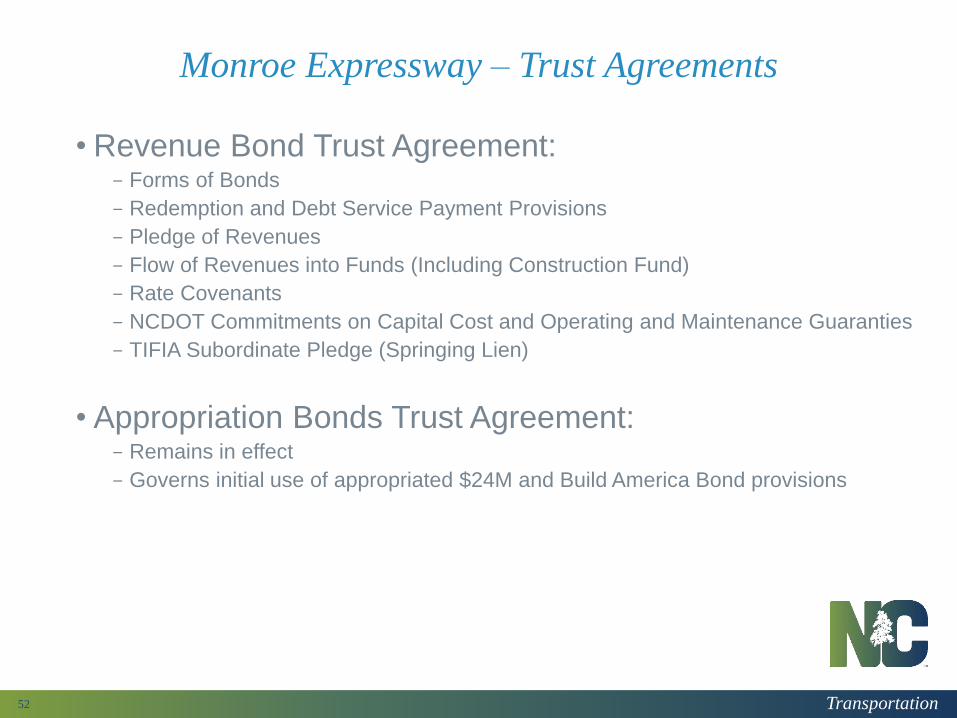
Monroe Expressway – Trust Agreements
52
• Revenue Bond Trust Agreement:- Forms of Bonds
- Redemption and Debt Service Payment Provisions
- Pledge of Revenues
- Flow of Revenues into Funds (Including Construction Fund)
- Rate Covenants
- NCDOT Commitments on Capital Cost and Operating and Maintenance Guaranties
- TIFIA Subordinate Pledge (Springing Lien)
• Appropriation Bonds Trust Agreement:- Remains in effect
- Governs initial use of appropriated $24M and Build America Bond provisions
Transportation
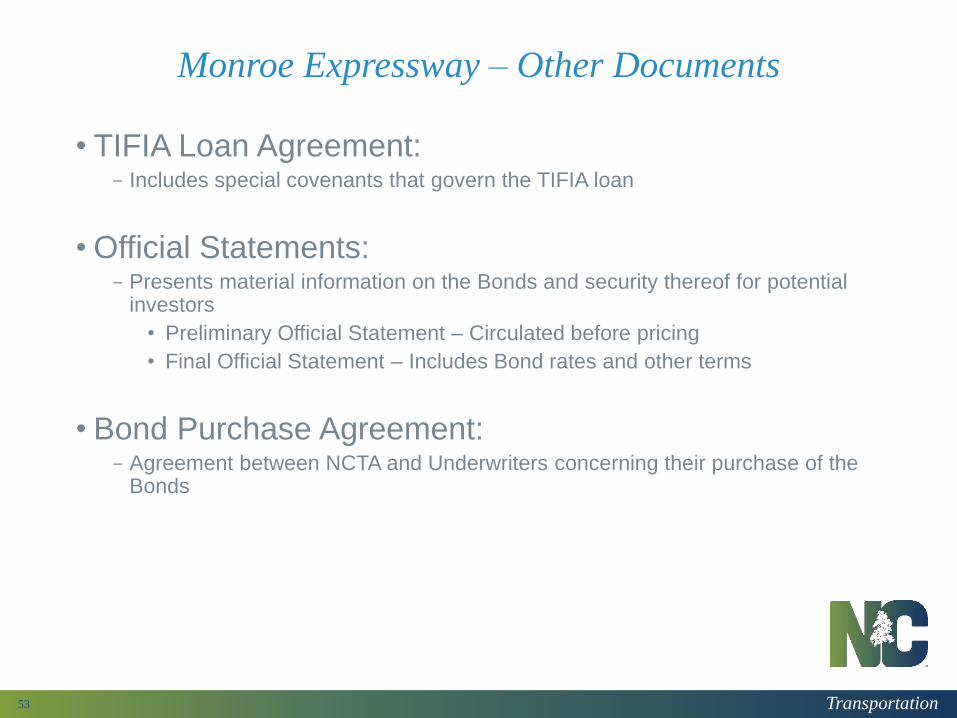
Monroe Expressway – Other Documents
53
• TIFIA Loan Agreement:- Includes special covenants that govern the TIFIA loan
• Official Statements:- Presents material information on the Bonds and security thereof for potential
investors
• Preliminary Official Statement – Circulated before pricing
• Final Official Statement – Includes Bond rates and other terms
• Bond Purchase Agreement:- Agreement between NCTA and Underwriters concerning their purchase of the
Bonds
Transportation
Monroe Expressway – Review of LGC Application Resolution
54
Wally McBrideHunton & Williams
Transportation
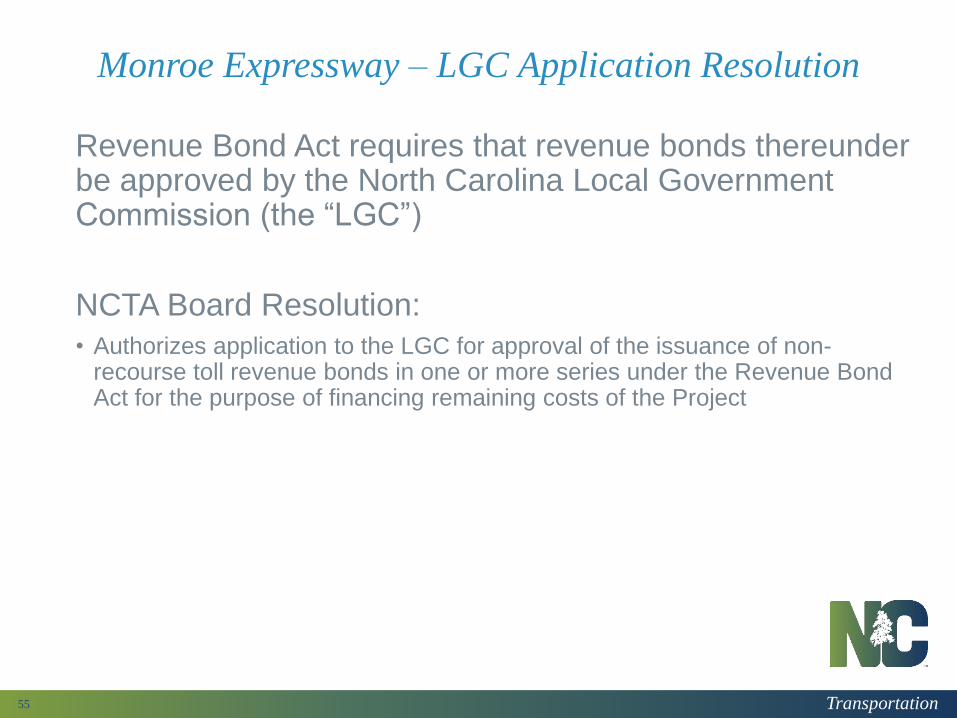
Monroe Expressway – LGC Application Resolution
55
Revenue Bond Act requires that revenue bonds thereunder be approved by the North Carolina Local Government Commission (the “LGC”)
NCTA Board Resolution:
• Authorizes application to the LGC for approval of the issuance of non-recourse toll revenue bonds in one or more series under the Revenue Bond Act for the purpose of financing remaining costs of the Project
Transportation
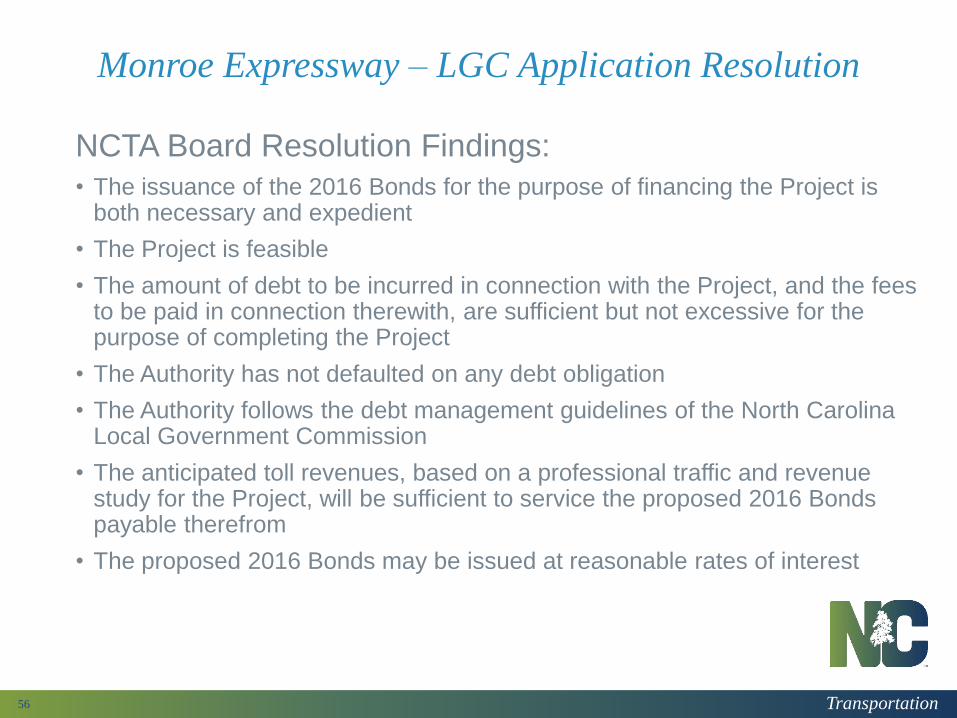
Monroe Expressway – LGC Application Resolution
56
NCTA Board Resolution Findings:
• The issuance of the 2016 Bonds for the purpose of financing the Project is both necessary and expedient
• The Project is feasible
• The amount of debt to be incurred in connection with the Project, and the fees to be paid in connection therewith, are sufficient but not excessive for the purpose of completing the Project
• The Authority has not defaulted on any debt obligation
• The Authority follows the debt management guidelines of the North Carolina Local Government Commission
• The anticipated toll revenues, based on a professional traffic and revenue study for the Project, will be sufficient to service the proposed 2016 Bonds payable therefrom
• The proposed 2016 Bonds may be issued at reasonable rates of interest