Åbo akademi university
TRANSCRIPT

Determination of benzoate in cranberry and
lingonberry using solid-contact ion-selective
electrode; comparison with ion chromatography
Åbo Akademi University Faculty of Science and Engineering
Sajana Manandhar
Master’s programme in Excellence in Analytical Chemistry
Degree project in Analytical chemistry, 30 credits
Supervisor: Ville Yrjänä (Åbo Akademi University)
Co-supervisors: Prof. Johan Bobacka (Åbo Akademi University)
Prof. Ivo Leito (University of Tartu)
June 2021

i
Abstract
The purpose of this thesis was to develop the solid-contact ion-selective electrodes and to
characterize them as benzoate-selective electrodes. The developed electrodes were then applied
for the determination of benzoate content in cranberry and lingonberry. The monomer 3,4-
ethylenedioxythiophene (EDOT) was polymerized galvanostatically in the presence of chloride
(Cl-) to form a solid contact made of poly(3,4-ethylenedioxythiophene) (PEDOT) doped with
chloride over the glassy carbon (GC) electrodes. An acyclic derivative of 1,3-
bis(carbazolyl)urea was used as an ionophore. The PEDOT:Cl- films on the GC electrodes were
coated with either a control membrane or a benzoate-selective membrane by drop-casting a
membrane cocktail. The electrodes were calibrated in sodium benzoate solution with and
without 0.01 M phosphate buffer. The performance of the fresh electrodes was compared with
that of the two-month-old electrodes. The slope of the electrodes changed from Nernstian to
near-Nernstian as they aged by two months. The linearity range remained the same with
minimal degradation in the limit of detection (LOD). The influence of phosphate on the
electrode performance was also studied, which showed significant degradation of the LOD of
the benzoate-selective electrodes. The selectivity of the electrodes over different anions was
evaluated. The benzoate content in berries was determined potentiometrically by using the
standard addition method for quantification. Similarly, the ion chromatography (IC) method
was also used for the determination of benzoate. The amount of benzoate found
potentiometrically was slightly higher than that determined by IC. The selectivity of the
electrodes towards other anions besides benzoate might have resulted in higher quantification
by the electrodes. However, the amount determined by both methods was comparable,
suggesting the practical applicability of the developed electrodes for benzoate determination.
Keywords: solid-state ion-selective electrode; benzoate; an acyclic ionophore; ion
chromatography

ii
Acknowledgments
This master thesis was carried out in the Laboratory of Analytical Chemistry at Åbo Akademi
University as a requirement of Erasmus Mundus Joint Master’s Degree programme, Excellence
in Analytical Chemistry.
I would first like to thank my supervisor Ville Yrjänä for his immense support, guidance, and
patience throughout my thesis. You had been an excellent mentor and advisor to me. Thank
you for the support with your scientific and technical advices. I owe my thanks to Professor
Johan for suggesting this work and for valuable suggestions when required. I am grateful to
Luis for helping me with technicalities in ion chromatography. Also, many thanks to Narender,
for helping me with ion chromatography and providing suggestions in my work.
I would like to thank Professor Ivo for your encouragement, motivation, and valuable
feedbacks in my study. I would like to thank Anu. I appreciate every help you have provided
me whenever I seek for. I acknowledge all my teachers from University of Tartu and Åbo
Akademi University for broadening my knowledge in Analytical Chemistry.
I am thankful to my friends in the EACH and the AMS group (2019/2021) batch. You all have
been amazing people. I owe my thanks to my friends in Turku without whom my stay in Finland
would not have been so interesting, fun, and worth it. I am also thankful to my friends from
Nepal who had always help and support me.
Last, but not least, my special thanks to my ever-loving parents and my siblings who always
support, care, understand, and motivate me to work hard and achieve my goal.
Åbo, June 2021
Sajana Manandhar

iii
Table of contents
Abstract .............................................................................................................................................. i
Acknowledgements ........................................................................................................................... ii
Table of Contents ............................................................................................................................. iii
Abbreviations .................................................................................................................................... v
1 Introduction .................................................................................................................................... 1
2 Chemical sensors ............................................................................................................................ 2
3 Ion-selective electrodes................................................................................................................... 3
4 Solid-contact ion-selective electrodes ............................................................................................. 3
5 Composition of ion-selective membranes ........................................................................................ 5
6 Electrically conducting polymers .................................................................................................... 6
7 Working principle........................................................................................................................... 8
7.1 Potentiometry .......................................................................................................................... 8
7.1.1 Standard addition methods for potentiometric measurements ............................................. 9
7.2 Ion chromatography .............................................................................................................. 11
7.2.1 Standard addition method for ion chromatography .......................................................... 12
8 Characterization ........................................................................................................................... 14
8.1 Electrochemical impedance spectroscopy............................................................................... 14
9 Experimental section .................................................................................................................... 16
9.1 Reagents ................................................................................................................................ 16
9.2 Equipment ............................................................................................................................. 16
9.3 Preparation of ion-selective membranes................................................................................. 17
9.4 Preparation of the sensors ..................................................................................................... 17
9.5 Electrochemical impedance spectroscopy............................................................................... 18
9.6 Potentiometry ........................................................................................................................ 18
9.7 Ion chromatography .............................................................................................................. 20
9.7.1 Sample preparation ......................................................................................................... 20
9.6.1 Sample preparation and measurement .............................................................................. 19
10 Results and discussions ............................................................................................................... 21
10.1 Galvanostatic electropolymerization .................................................................................... 21
10.2 Electrochemical impedance spectroscopy measurements ...................................................... 21
10.3 Potentiometric measurement ................................................................................................ 22
10.3.1 Potentiometric calibration in pure benzoate solution ...................................................... 22
10.3.2 Potentiometric calibration in 0.01 M phosphate buffer ................................................... 24
10.3.3 Potentiometric selectivity .............................................................................................. 25
10.3.4 Sample measurement ..................................................................................................... 26

iv
10.4 Ion chromatography method ................................................................................................ 26
10.4.1 Linearity ....................................................................................................................... 27
10.4.2 Repeatability ................................................................................................................. 28
10.4.3 Standard addition method .............................................................................................. 29
10.5 Comparison of the result between two techniques ................................................................. 32
11 Conclusion ................................................................................................................................. 34
References....................................................................................................................................... 34
Appendix A ..................................................................................................................................... 42
Appendix A.1 Technical specifications of the analytical column ................................................... 42
AppendixA.2 Galvanostatic electropolymerization ....................................................................... 43
AppendixA.3 Potentiometric calibrations ..................................................................................... 43
AppendixA.3.1 Potentiometric calibration in aqueous benzoate solution .................................. 43
AppendixA.3.2 Potentiometric calibration in 0.01 M phosphate buffer ..................................... 44
AppendixA.4 Potentiometric selectivity after exposure to berry samples ....................................... 45

v
Abbreviations
The following abbreviations are used in this thesis.
CWE Coated-wire electrode
DOS Dioctyl sebacate
EIS Electrochemical impedance spectroscopy
GC Glassy carbon
IC Ion chromatography
ISEs Ion-selective electrodes
LOD Limit of detection
OCP Open circuit potential
o-NPOE 2-nitrophenyl octyl ether
PEDOT Poly(3,4-ethylenedioxythiophene)
PVC Poly(vinyl chloride)
RMS Root mean square
SC-ISEs Solid-contact ion-selective electrodes
TDMACl Tridodecylmethylammonium chloride
THF Tetrahydrofuran

1
1 Introduction
Preservatives are additives that extend the shelf life of products by preventing or inhibiting
spoilage caused by chemical reactions or microbiological activities. Benzoic acid and its salts
are commonly used as preservatives and have a broad spectrum of antimicrobial activity against
many bacteria, fungi, and yeasts1. Benzoate salts are more soluble in water than benzoic acid.
However, the undissociated benzoic acid is more effective as a preservative and benzoates
exert their preservative action in acidic conditions. They are used as preservatives in food,
beverages, cosmetics, and pharmaceuticals and the amount is regulated2. The European Union
(EU) has permitted benzoic acid (C6H5COOH) and its salts (E210-E213) as food additives
with maximum permitted levels (MPLs) ranging from 150 to 6000 mg/kg 3. The United States
Food and Drug Administration (FDA) lists benzoic acid and sodium benzoate (C6H5COONa)
as generally recognized as safe (GRAS) substances and the current maximum allowed level in
food is 0.1% 4. Benzoic acid can be obtained synthetically or naturally from some fruits,
vegetables, nuts, spices, and dairy products. In plants, the concentration of benzoic acid
depends upon species, climate, and geographical location5.
Berries are one of the natural sources of benzoic acid6. They have high amounts of organic
acids, antioxidants, fibers, and minerals7. Berry juices are acidic due to the high amounts of
organic acids. These are mainly malic acid, citric acid, and small amounts of benzoic acid. It
is claimed that berries like lingonberries and cranberries contain enough benzoic acid for
preservative action. A study by Viljakainen et al.8, showed that the amount of benzoic acid in
the juices of some selected Nordic berries ranges from 0.1 to 0.7 g/l. The amount present is
enough to inhibit both bacterial activity and yeast fermentation9, which makes the production
of wine from berries challenging. Thus, it is useful to know the amount of benzoic acid present
in berries. Since it is also used as an additive in various products, it is important to monitor the
amount in them.
The most common analytical methods of choice for the determination of benzoic acid and
sodium benzoate have been chromatographic methods such as reversed-phase high-
performance liquid chromatography10–13, ion chromatography (IC)14, gas chromatography15–17,
thin layer chromatography 18. Other methods such as spectrophotometry19 and capillary
electrophoresis20 have also been reported. Most of these methods involve an extensive
extraction procedure, which is time-consuming and labor-intensive or requires expensive
equipment. Thus, it would be advantageous to develop a rapid, simple, and cheaper alternative

2
method for benzoate determination. Potentiometric ion sensors are well-known analytical
devices for the determination of ions. They are easier and cheaper to fabricate and yet provide
reasonable selectivity, sensitivity, and quick response21. Ion-selective electrodes (ISEs) are an
important subgroup of potentiometric sensors21.
The main objective of this thesis is to develop a solid-contact benzoate-selective electrode for
the determination of naturally occurring benzoate in berries. We also have compared its
performance with ion chromatography. We have selected cranberry (Vaccinium oxycoccus)
and lingonberry (Vaccinium vitis-idaea), which are commonly grown in Finland, as our sample.
Along with the ISEs, we have also used an IC method as a standard method for the
determination of benzoate in our samples. IC is a popular method used for the qualitative and
quantitative determination of cations and anions. IC has been used in many analytical chemistry
setups and has become a powerful and versatile technique. It has a broad range of applications
with good accuracy, precision, and selectivity22. Further, we have compared two IC methods
for better separation of benzoate from other anions, mainly malate and citrate that are present
in higher amounts in berries. Moreover, we have also tried to show the possibility to apply the
developed ISEs on real samples.
O OH
O O–Na+
Figure 1. Benzoic acid Figure 2. Sodium benzoate
2 Chemical sensors
Sensors are devices that provide a measurable signal by responding to a particular property of
the substance. Sensors are of two major types: physical and chemical sensors. The former
respond to a physical property like temperature, pressure, force, and magnetic field. The latter
respond to a specific chemical species and produce a response that can be used for the
qualitative or the quantitative determination of the species. All chemical sensors consist of (i)
a chemical recognition layer that responds to a chemical species and produces a response and

3
(ii) a transducer that converts the response into a measurable signal. This response can be for
example a change in color, mass, potential, or current. The response is proportional to the
amount of analyte present in the sample. There are mainly four types of chemical sensors based
on their mode of transduction namely electrochemical, optical, mass, and thermal sensors23.
3 Ion-selective electrodes
ISEs are electrochemical sensors that allow the potentiometric determination of the activity of
particular ions in the presence of other ions. The measured potential is proportional to the
logarithm of the activity of the analyte ion in the sample solution. ISEs are very attractive for
routine analytical applications as they are portable, small in size, economical, easy to use, and
robust24. With ISEs, it is possible to analyze samples with little to no sample pre-treatment and
the measurement does not destroy the sample. The advancement of ISEs has made it possible
to monitor the analyte with a wide dynamic range (typically 10-1M to 10-6 M)25–28 and a lower
detection limit as low as 10-11 M has been reported29.
The development of ISEs began with the discovery of glass membrane sensitivity to hydrogen
ions by Cremer30. Haber and Klemensienwicz developed the first pH electrode based on glass30.
The pH electrode has been adopted as a routine analytical tool from 193631. The progress made
both in measuring techniques and the development of the special glasses resulted in the
development of glass electrodes sensitive towards other cations (Na+, K+, Ag+, etc)30. The next
useful development in ISEs was a fluoride electrode based on europium-doped single-crystal
lanthanum fluoride by Frant and Ross32. This electrode had a very high selectivity towards
fluoride. The innovation by Simon et al. of a potassium-selective electrode using neutral
ionophore in a plasticized membrane led to the development of ionophore-based ISEs33. The
pioneering work by Shirakawa et al. on polyacetylene attracted more interest towards
conducting polymers34. This essentially led to the path of innovative discovery of solid-contact
ISEs based on conducting polymers35.
4 Solid-contact ion-selective electrodes
Conventional ISEs are based on liquid contacts (Figure 3a). These electrodes consist of an inner
liquid filling solution that functions as an ion-to-electron transducer between the ion-selective
membrane (ISM) and the inner reference electrode. Besides them being highly reproducible
and common in the market, they possess some problems, such as difficulty in controlling and

4
maintaining the level of internal filling solution and the electrode must always be in the upright
position or at a slight angle so that the ISM is in contact with the filling solution. The use of
conventional ISEs is inconvenient when the sample volume is small (e.g. clinical analysis) and
the miniaturization of the liquid-contact ISEs is problematic36. Eventually, the total elimination
of inner filling solutions initiated the discovery of solid-contact ion-selective electrodes (SC-
ISEs). The first SC-ISE, a coated-wire electrode (CWE) (Figure 3b), was developed by Cattrall
and Freiser37. CWEs are simple in design, cheaper, and are better suited to miniaturization. It
was, however, difficult to achieve long-term potential stability with CWEs due to high charge-
transfer resistance between the ISM and the electronic conductor38. The need for well-defined
ion-to-electron transduction between the ISM and the electronic substrate spurred on the
development of SC-ISEs over the years. The introduction of the conducting polymers as solid
contacts in the SC-ISEs (Figure 3c) was an undeniable breakthrough in the field of ion-selective
electrodes. Conducting polymers significantly improved the potential stability and
reproducibility which also enabled flexible structures and further miniaturization35,39.
Conducting polymers exhibit both ionic and electronic conductivity and serve as an
intermediate contact or transducer between an ISM and an electronically conducting substrate.
Electrical lead
Electronic
conductor
Internal reference
electrode
Inner filling Solid contact
solution
a b c
Ion-selective membrane
Figure 3. Schematic structure of a) a conventional ion-selective electrode, b) a coated wire electrode, and c) a
solid-contact ion-selective electrode.

5
5 Composition of ion-selective membranes
Selectivity for the target analyte is achieved with the ISM. Several types of ISMs have been
developed so far, for example, glass40, crystal41, liquid membrane42, and polymeric
membrane25,43,44. Polymeric membrane-based ISMs are the most popular as they are versatile.
ISMs have been developed for about 60 different analytes including inorganic cations and
anions, neutral analytes, and organic ionic analytes45. Normally high-molecular-weight
poly(vinylchloride) (PVC) is used as a polymeric matrix. The polymer-based ISM is typically
composed of a plasticizer, PVC, an ion-selective molecule (ionophore), and a lipophilic ion
exchanger. A common ISM composition is approximately 66% plasticizer, 33% PVC, 1%
ionophore, and a lipophilic ion exchanger.
An ionophore is a charged or neutral receptor that selectively binds to the analyte. It is expected
that the lipophilicity of the ionophore retains the ionophore in the membrane. However,
ionophores can also be covalently immobilized in the plasticized ISM45. The ions might
specifically fit into the cavity of the ionophore or form a bond with a functional group of the
ionophore. A carbazole-derived acyclic receptor (Figure 4) has been used as an ionophore for
benzoate anions in this work. The same ionophore had also been used for developing solid-
contact acetate sensors previously. The electrodes showed modest selectivity to acetate and
good selectivity to benzoate46. Thus, in this study, we were interested in using this ionophore
for developing benzoate sensors for real samples.
Figure 4. The ionophore, which is an acyclic derivative of 1,3-bis(carbazolyl)urea, that was used in this study.

6
PVC provides hydrophobicity to the membrane. Many plasticizers are highly viscous liquids
at ambient temperature and are added to the PVC matrix to improve the flexibility of the
membrane. They also serve as solvents for the ionophore. The dielectric constant of the
plasticizers influences the selectivity coefficients (Ki,j) of the polymeric membrane47. Leaching
of plasticizers from the membrane is a common problem that limits the lifetime of membrane-
based sensors. A highly lipophilic plasticizer has low leaching potential. Commonly used
plasticizers include dioctyl sebacate (DOS) and 2-nitrophenyl octyl ether (o-NPOE).
Lipophilic cation or anion exchangers are added to the ionophore-based ISMs for the
prevention of interferences from counterions and to create permselectivity. The addition of the
ionic exchangers also reduces the response time and lowers the membrane resistance. However,
the amount of exchanger added must be strictly limited by optimizing the molar ratio of
lipophilic ion exchanger to ionophore; otherwise, the selectivity of the membrane can be
changed drastically48–50. Potassium tetrakis(4-chlorophenyl)borate and potassium tetrakis[3,5-
bis(trifluoromethyl)phenyl)]borate are commonly used as lipophilic cationic exchangers and
tridodecylmethylammonium chloride is commonly used as lipophilic anionic exchanger.
6 Electrically conducting polymers
Electrically conducting polymers are the subject of interest and research owing to the advances
in various applications such as sensors, solar cells, and organic light-emitting diodes.
Conducting polymers in SC-ISEs are carbon-based polyene polymers. They have conjugated
double bonds, i.e. alternating double bonds or π-conjugated systems. Conducting polymers are
not capable of conduction in their pristine form, so for conduction, an electron/hole deficiency
needs to be created. This can be done by a process called doping. Doping results in the
delocalization of an electron or hole that serves as a charge carrier and induces conductivity in
the conducting polymers. Doping can be done chemically or electrochemically. Doping with
electron-deficient dopants or by oxidation is p-type doping. Reduction or electron-donating
dopants induce n-type doping. Doping of an electrically conducting polymer increases the
conductivity by tens to hundreds of siemens per cm51. Polyaniline, polythiophene, and
polypyrrole are the most common conducting polymers employed in ISEs.
Conducting polymers can be synthesized by chemical or electrochemical polymerization.
Chemical polymerization is usually preferred when a large quantity of polymer is required.
Polymers are formed by loss of chemical species from the reaction of the end group of

7
monomer chains in the presence of a chemical oxidant such as I2, Br2, FeCl3, etc., and usually
require a catalyst52. Electrochemical polymerization can be oxidative or reductive. It is a cost-
effective and easy-to-use method. It is based on the deposition of the polymer on the surface
of a solid electrode material like glassy carbon or metal. Oxidative electrochemical
polymerization is the most suitable and commonly used method for polymerization. Generally,
electrochemical polymerization can be achieved galvanostatically, potentiostatically, or
potentiodynamically. In the galvanostatic mode of polymerization, a constant current is applied
between the working electrode and the counter electrode that are dipped into the polymerization
solution. The thickness of the deposited layer depends on the time of polymerization and the
magnitude of current used. The potentiostatic technique can also be employed alternatively,
which involves the application of a constant potential. The potential should be applied so that
it will oxidize the monomer but avoid overoxidation or secondary reactions. The
potentiodynamic technique can also be employed in which a varying potential is applied (e.g.
cyclic voltammetry). The polymer is deposited on the electrode surface with the increasing
number of cyclic scans. The thickness of the film also depends on the number of scans53.
Poly(3,4-ethylenedioxythiophene), commonly known as PEDOT (Figure 5), has relatively high
conductivity and remarkable environmental stability in its oxidized form. PEDOT has been
extensively studied and employed in various applications such as ISEs, capacitors, solar cells,
organic light-emitting diodes, and many more24. We have used PEDOT as a solid contact in
our ISE. Galvanostatic electrochemical synthesis was used for the polymerization of the
ethylenedioxythiophene (EDOT) monomer over the GC electrode.
Figure 5. The chemical structure of poly(3,4-ethylenedioxythiophene) (PEDOT) in its undoped form.

8
7 Working principle
7.1 Potentiometry
The working mechanism of ISEs is based on the principle of potentiometry. The potential
difference (electromotive force, EMF) between two electrodes, i.e., reference electrode and
indicator electrode, is measured under zero current conditions using a high-impedance
potentiometer. The ISE is the indicator electrode and the reference electrode has a constant
potential. The EMF across the electrochemical cell is given by Equation 1:
EMF= 𝐸𝑖𝑛𝑑 − 𝐸𝑟𝑒𝑓 + 𝐸𝑗 Equation 1
where EMF is the potential difference measured, Eind is the potential of the indicator electrode,
Eref is the potential of the reference electrode, and Ej is the liquid junction potential.
Ideally, all the potentials except the indicator potential should be sample-independent. The
indicator potential depends on the target ion interaction with the ISM of the indicator electrode.
A liquid junction potential is a potential that develops across the interface between two
dissimilar solutions. The liquid junction potential depends on the charge, concentration, and
mobility of ions. In the reference electrode, a junction potential develops between the inner
reference solution and sample solution. Liquid junction potentials can be estimated using the
Henderson equation54:
Equation 2
where zi is the charge of ion i, Ui is its mobility, and Ci is its concentration in phase α (inner
reference solution) and β (sample solution). The junction potential can be maintained at a low
or constant potential, by using a high concentration of an electrolyte with cations and anions
of fairly equal mobility, e.g. 3 M KCl.
In potentiometry, the electric potential developed between an ISE and a reference electrode
immersed in the sample solution is linearly proportional to the logarithmic activity of the target
ion. This relationship is described by the Nernst equation55:
𝐸j =
∑ |𝑧𝑖|𝑈𝑖𝑖
𝑧𝑖[𝐶𝑖(β) − 𝐶𝑖(α) ]
∑ |𝑧𝑖|𝑈𝑖𝑖 [𝐶𝑖(β) − 𝐶𝑖(α) ] RT
Fln
∑ |𝑧𝑖|𝑈𝑖𝐶𝑖(α)𝑖
∑ |𝑧𝑖|𝑈𝑖𝐶𝑖(β𝑖
)

9
𝐸 = 𝐸° +𝑅𝑇
𝑧𝑖𝐹𝑙𝑛𝑎𝑖 Equation 3
where E is observed potential, E° is the standard potential which depends on the characteristics
of both indicator and reference electrode, R is the universal gas constant, T is the absolute
temperature in Kelvin, F is the Faraday constant, zi is the charge of the target ion i and ai is its
activity in the sample. The plot of observed potential against the logarithm of the activity of
ion i should result in a calibration curve with a slope of 59.2/zi mV/decade at 25 , which is
positive for cations and negative for anions.
The selectivity of an ISE to a primary ion in presence of interfering ions in a solution can be
determined by using the Nikolskii-Eisenman equation56:
𝐸 = 𝐸° +𝑅𝑇
𝑧𝑖𝐹𝑙𝑛 (𝑎𝑖 + ∑ 𝐾𝑖,𝑗𝑎𝑗
𝑧𝑖𝑧𝑗 𝑗 ) Equation 4
where zi and zj are the charges of the primary ion i and the interfering ion j, respectively, ai and
the aj are the activities of the primary ion and the interfering ion, respectively. Ki,j is the
potentiometric selectivity coefficient of the ISE in presence of the interfering ion j. Ki,j is an
experimentally determined constant. The selectivity coefficient value of an ISE provides
information on the numerical basis about its preference for the primary ion in presence of an
interfering ion. A lower numerical value of Ki,j of an ISE denotes higher discrimination of the
interfering ion and preference for the primary ion. An ISE responds equally to the primary ion
and the interfering ion if the selectivity coefficient is unity. The separate solution method and
the fixed interference method are the recommended methods for the determination of the
selectivity coefficient.
7.1.1 Standard addition methods for potentiometric measurements
Direct measurements are particularly useful for a sample with a simple matrix and for a
specifically designed electrode for a specific ion. The standard addition method is useful in
potentiometry when the sample matrix is complex, and the activity coefficients are difficult to
predict. This method also overcomes the problem due to the partial complexation of the
analyte31. This method is related to measuring the potential in a relatively large volume of
sample and adding a smaller volume of the standard followed by the measurement of the
resultant analyte signal. Single-addition and double-addition methods can be applied as
standard addition methods in potentiometry.
10
It can be assumed that in a sample with an unknown activity coefficient, 𝛾, only a fraction β of
target analyte exists as free ions. The free target ion activity, α, in a sample is given by Equation
5:
𝛼 = 𝐶𝑖𝑜𝑛𝑖𝑧𝑒𝑑𝛾 = 𝐶𝑡𝑜𝑡𝑎𝑙𝛾𝛽 Equation 5
The respective EMF value is
𝐸1 = 𝐸0 + 𝑆𝑙𝑜𝑔 𝛼𝑖𝑛𝑖𝑡𝑖𝑎𝑙 = 𝐸0 + 𝑆𝑙𝑜𝑔𝐶𝑡𝑜𝑡𝑎𝑙 + 𝑆𝑙𝑜𝑔 𝛾 + 𝑆𝑙𝑜𝑔 𝛽 Equation 6
where S is the slope calculated from the calibration curve.
After the addition of a known amount of target analyte, ∆Ctotal, to the unknown sample, the
EMF value is as follows.
𝐸2 = 𝐸0 + 𝑆𝑙𝑜𝑔 𝛼𝑝𝑟𝑜𝑐𝑒𝑠𝑠𝑒𝑑 = 𝐸0 + 𝑆𝑙𝑜𝑔(𝐶𝑡𝑜𝑡𝑎𝑙 + ∆𝐶𝑡𝑜𝑡𝑎𝑙) + 𝑆𝑙𝑜𝑔 𝛾 + 𝑆𝑙𝑜𝑔 𝛽 Equation 7
The total concentration of the analyte in the native sample can be obtained by equation 8:
Equation 8
The added quantity of the target analyte must be such that the 𝛾 and β values remain constant.
Therefore, a small quantity must be added. However, a small addition causes a small effect in
the EMF and the accuracy of the result is low. So, the amount of target analyte added must be
optimum and a few trials must be done to find the appropriate value of ∆𝐶𝑡𝑜𝑡𝑎𝑙. This method
is a single-addition method31.
The double-standard addition method can be used, when the response parameters in a complex
sample may differ from those determined in single-electrolyte solutions. This method assumes
that Cionized = Ctotal = C. The EMF value is given by Equation 9:
𝐸1 = 𝐸0 + 𝑆𝑙𝑜𝑔 𝛾 + 𝑆𝑙𝑜𝑔 𝐶 Equation 9
After the addition of ∆C of the analyte, the EMF is
𝐸2 = 𝐸0 + 𝑆𝑙𝑜𝑔 𝛾 + 𝑆𝑙𝑜𝑔 (𝐶 + ∆𝐶) Equation 10
Then the same amount of analyte ∆C is added in the second addition and the EMF is
𝐸3 = 𝐸0 + 𝑆𝑙𝑜𝑔 𝛾 + 𝑆𝑙𝑜𝑔 (𝐶 + 2∆𝐶) Equation 11
Upon rearranging equations the final relation derived does not contain 𝐸0and S values.
Equation 12
Equation 12 can be solved by iteration procedure 31.
𝐶𝑡𝑜𝑡𝑎𝑙 =∆𝐶𝑡𝑜𝑡𝑎𝑙
10𝐸2−𝐸1
𝑆 − 1
𝐸3 − 𝐸1
𝐸2 − 𝐸1=
𝑙𝑜𝑔
𝑙𝑜𝑔
𝐶 + 2∆𝐶𝐶
𝐶 + ∆𝐶𝐶

11
7.2 Ion chromatography
Ion chromatography is a subtype of high-performance liquid chromatography in which the
separation of the ions is based upon their interaction with ion-exchange resins and mobile
phase. IC is an effective, reliable, and robust analytical tool for the analysis of inorganic ions
and ionogenic organic species. It is a widely adopted analytical method for ionic analytes, since
its discovery57. The suppression-based ion chromatographic method, introduced by Small et al.
in 1975, was a breakthrough in IC58. The suppressor column was used to reduce the background
conductivity of the eluent. Later, in 1979, Gjerde et al. developed a non-suppressed ion
chromatographic technique, using low-capacity ion-exchange columns and low-conductive
eluents59,60. However, IC with the suppressed conductivity detection is most widely used.
Conductivity detection is the common detection technique in IC, but the use of other detection
systems like amperometric, spectrophotometric, refractive, chemiluminescence, and
fluorescence in IC has enlarged the scope of application from inorganic ions to organic species
like amino acids, nucleosides, proteins, carbohydrates, and glycols61. IC is routinely used in
environmental analysis, clinical analysis, and in industries like pharmaceuticals, food,
beverages, paper and pulps, metal processing and many more62.
Ion exchange is the mainstay separation mechanism in IC. Nonetheless, ionic analytes can be
separated using other separation modes, such as ion exclucion63 and ion pairing64. Cations are
separated using cation-exchange columns and anions are separated on anion-exchange
columns. The stationary phase is made up of polymeric ion-exchange resins, such as
polymethacrylate and polystyrene. Polar functional groups are attached to polymeric ion-
exchange resins: e.g., sulfonate groups for a cation-exchange and quaternary ammonium
groups for an anion-exchange resin. The counter ions are electrostatically attracted to the polar
functional groups. Ion exchange occurs by replacing the counter ions from the ions in the
sample solution, preserving electroneutrality. Acidic eluents are used for the separation of
cations, while hydroxides or carbonates are used for the separation of anions. The separation
occurs due to the competition of eluent ions and analyte ions for the electrostatic binding to the
ionic functional group fixed to the column matrix. Separation is achieved as analytes migrate
through the column at different rates depending on their degree of interaction to ion-exchange
resins. The elution capacity of the eluent depends on its concentration, pH, ionic strength,
temperature, and presence of organic solvents65. In a suppression-based IC, the anion-exchange
column is followed by a cation-exchange suppressor unit and vice versa. The suppression

12
mechanism removes the conductive ions from the eluent, thus reducing the background current.
It also removes the counter ions in the sample and converts the analyte ion into a more
conductive form, hence increasing the sensitivity. A schematic diagram of the suppression-
based IC for the separation of cations and anions is shown in Figure 6. The ions are detected
by the detector after passing through the suppression chamber.
7.2.1 Standard addition method for ion chromatography
The standard addition method is also the preferred method for quantification in
chromatography for a sample with a complex matrix that interferes with analyte measurement
signals66. The sample solution is spiked with a known quantity of the substance to be
determined. Experimentally, the standard addition can be performed by spiking varying known
amounts of analyte to an equal amount of sample and diluting to the same volume. One sample
is left unspiked. Concentration in the sample is calculated by extrapolating the regression line
on the x-axis at which the y-intercept equals zero. The resulting negative x-intercept
corresponds to the amount of analyte in the sample. However, this method is more labor-
intensive than the calibration graph method.

13
Cations determination Anions determination
𝐴+=𝑁𝑎+ , 𝐾+, 𝐶𝑎2+ 𝐵− = 𝐹−, 𝐶𝑙−, 𝑆𝑂42−
cation-exchanger-𝑆𝑂3− 𝐻+ + 𝐴+𝐶𝑙− anion-exchanger-𝑁+𝐻𝐶𝑂3
− + 𝑁𝑎+𝐵−
cation-exchanger-𝑆𝑂3− 𝐴+ + 𝐻+𝐶𝑙− anion-exchanger-𝑁+𝐵− + 𝑁𝑎+𝐻𝐶𝑂3
−
anion-exchanger-𝑁+𝑂𝐻− + 𝐻+𝐶𝑙− cation-exchanger-𝑆𝑂3− 𝐻+ + 𝑁𝑎+𝐻𝐶𝑂3
−
anion-exchanger-𝑁+𝐶𝑙− + H2O cation-exchanger-𝑆𝑂3− 𝑁𝑎+ + H2CO3
anion-exchanger-𝑁+𝑂𝐻− + 𝐴+𝐶𝑙− cation-exchanger-𝑆𝑂3− 𝐻+ + 𝑁𝑎+𝐵−
anion-exchanger-𝑁+𝐶𝑙− + 𝐴+𝑂𝐻− cation-exchanger-𝑆𝑂3− 𝑁𝑎+ + 𝐻+𝐵−
Degassing
unit Eluent
Injection
valve Pump
Guard
column
Sep
arat
ion c
olu
mn
Suppre
ssor
Conductivity
Detector Data
Waste
Figure 6. Schematic diagram of ion chromatography for separation of cations and anions with suppressed
conductivity detection.

14
8 Characterization
8.1 Electrochemical impedance spectroscopy
Electrical circuits resist the flow of electrical current, which is termed electrical resistance for
direct current (DC) circuits and impedance for alternating current (AC) circuits. The impedance
is the ratio of potential and current for the AC system. An electrochemical impedance
spectroscopy (EIS) measurement is performed by applying a small-amplitude sinusoidal
excitation signal of a particular frequency to an electrochemical cell and the magnitude of the
impedance and the phase shift are obtained from the measured response.
Et = E0 sin(ωt) Equation 13
It = I0 sin (ωt + ϕ) Equation 14
ω = 2πf Equation 15
where Et and It are the potential and the current, respectively, at time t; E0 and I0 are the
amplitudes of the applied potential and the measured current, respectively; ϕ is the phase angle
or phase shift between the applied potential and measured current.; ω is the angular frequency.
A phase shift of 0°, 45°, and 90° is for an ideal resistor, a Warburg impedance, and an ideal
capacitor, respectively.
The impedance, Z, of a system can be calculated using Ohm’s law, Equation 16:
𝑍 =𝐸(𝑡)
𝐼(𝑡) Equation 16
The magnitude of an impedance and a phase shift of a system depends on the frequency of the
signal and the system being measured.
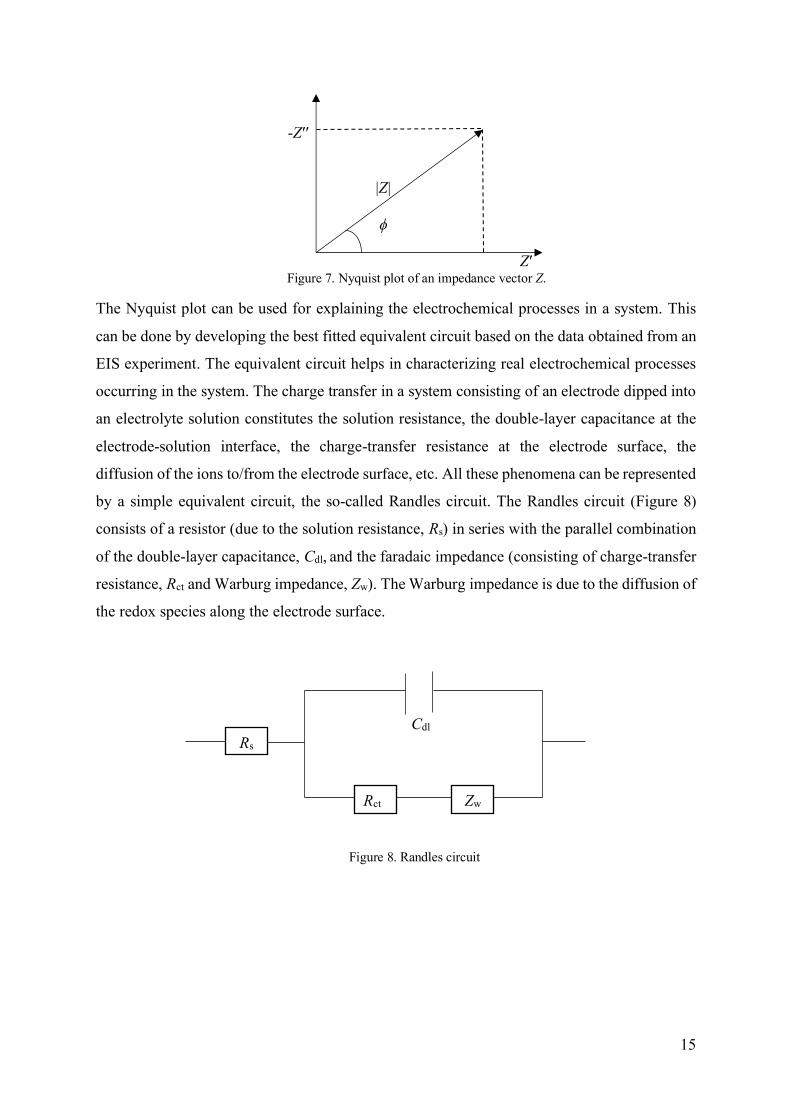
The impedance, Z, of a system is a vector quantity that consists of a real part (Z′) and an
imaginary part (Z′′). The impedance, Z, can be calculated using Equation 17. A plot consisting
of the real part along the x-axis and the imaginary part along the y-axis is a Nyquist plot (Figure
7). The Nyquist plot was used for analyzing the recorded impedance spectra in this study.
𝑍(𝜔) = (𝑍′) − 𝑗(𝑍′′) Equation 17
where j = √−1, is the imaginary number.
15
-Z′′
|Z|
ϕ
Z′ Figure 7. Nyquist plot of an impedance vector Z.
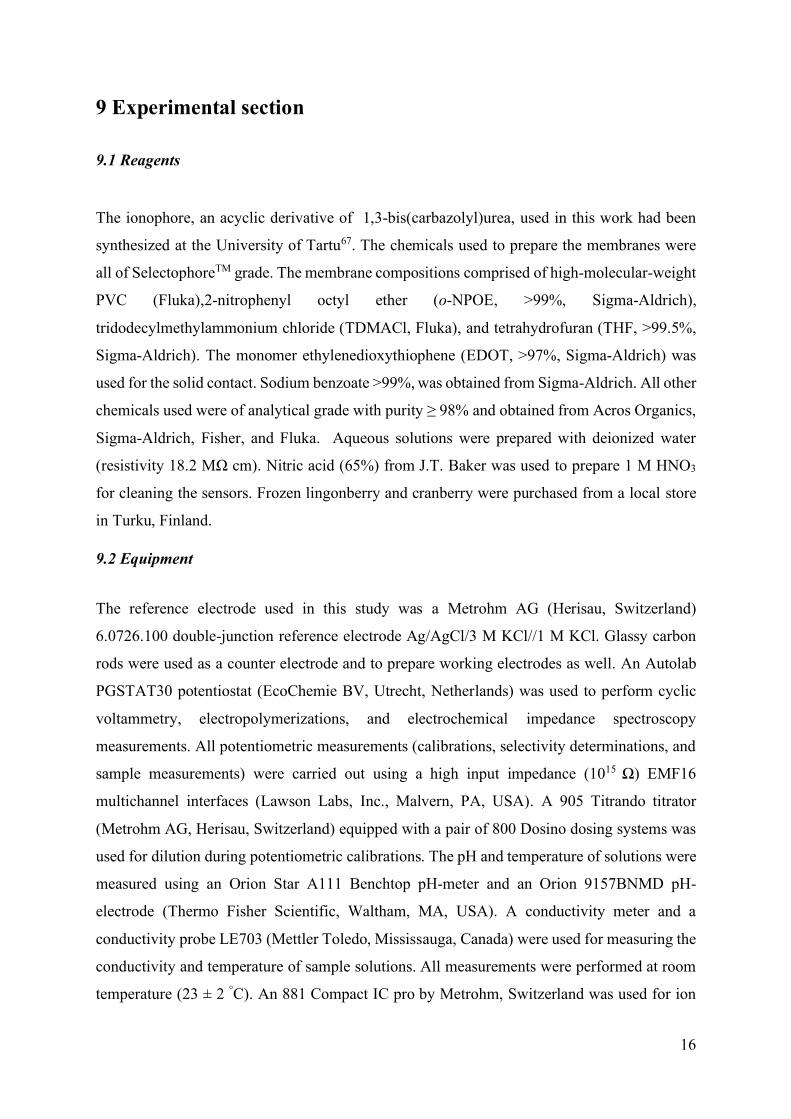
The Nyquist plot can be used for explaining the electrochemical processes in a system. This
can be done by developing the best fitted equivalent circuit based on the data obtained from an
EIS experiment. The equivalent circuit helps in characterizing real electrochemical processes
occurring in the system. The charge transfer in a system consisting of an electrode dipped into
an electrolyte solution constitutes the solution resistance, the double-layer capacitance at the
electrode-solution interface, the charge-transfer resistance at the electrode surface, the
diffusion of the ions to/from the electrode surface, etc. All these phenomena can be represented
by a simple equivalent circuit, the so-called Randles circuit. The Randles circuit (Figure 8)
consists of a resistor (due to the solution resistance, Rs) in series with the parallel combination
of the double-layer capacitance, Cdl, and the faradaic impedance (consisting of charge-transfer
resistance, Rct and Warburg impedance, Zw). The Warburg impedance is due to the diffusion of
the redox species along the electrode surface.
Cdl
Rs
Rct Zw
Figure 8. Randles circuit
16
9 Experimental section
9.1 Reagents
The ionophore, an acyclic derivative of 1,3-bis(carbazolyl)urea, used in this work had been
synthesized at the University of Tartu67. The chemicals used to prepare the membranes were
all of SelectophoreTM grade. The membrane compositions comprised of high-molecular-weight
PVC (Fluka),2-nitrophenyl octyl ether (o-NPOE, >99%, Sigma-Aldrich),
tridodecylmethylammonium chloride (TDMACl, Fluka), and tetrahydrofuran (THF, >99.5%,
Sigma-Aldrich). The monomer ethylenedioxythiophene (EDOT, >97%, Sigma-Aldrich) was
used for the solid contact. Sodium benzoate >99%, was obtained from Sigma-Aldrich. All other
chemicals used were of analytical grade with purity ≥ 98% and obtained from Acros Organics,
Sigma-Aldrich, Fisher, and Fluka. Aqueous solutions were prepared with deionized water
(resistivity 18.2 MΩ cm). Nitric acid (65%) from J.T. Baker was used to prepare 1 M HNO3
for cleaning the sensors. Frozen lingonberry and cranberry were purchased from a local store
in Turku, Finland.
9.2 Equipment
The reference electrode used in this study was a Metrohm AG (Herisau, Switzerland)
6.0726.100 double-junction reference electrode Ag/AgCl/3 M KCl//1 M KCl. Glassy carbon
rods were used as a counter electrode and to prepare working electrodes as well. An Autolab
PGSTAT30 potentiostat (EcoChemie BV, Utrecht, Netherlands) was used to perform cyclic
voltammetry, electropolymerizations, and electrochemical impedance spectroscopy
measurements. All potentiometric measurements (calibrations, selectivity determinations, and
sample measurements) were carried out using a high input impedance (1015 Ω) EMF16
multichannel interfaces (Lawson Labs, Inc., Malvern, PA, USA). A 905 Titrando titrator
(Metrohm AG, Herisau, Switzerland) equipped with a pair of 800 Dosino dosing systems was
used for dilution during potentiometric calibrations. The pH and temperature of solutions were
measured using an Orion Star A111 Benchtop pH-meter and an Orion 9157BNMD pH-
electrode (Thermo Fisher Scientific, Waltham, MA, USA). A conductivity meter and a
conductivity probe LE703 (Mettler Toledo, Mississauga, Canada) were used for measuring the
conductivity and temperature of sample solutions. All measurements were performed at room
temperature (23 ± 2 °C). An 881 Compact IC pro by Metrohm, Switzerland was used for ion

17
chromatography. The stationary phase used for the separation was a Metrosep anion dual 2 IC
column (6.1006.100) and a Metrosep RP 2 Guard/3.5 was used as a guard column. See Table
A1 for the technical specifications of the analytical column68.
9.3 Preparation of ion-selective membranes
The membrane consisted of PVC, o-NPOE, ionophore, and TDMACl for the benzoate-
selective electrode. THF was used as the solvent. The composition was 1.0% (dry mass) of the
ionophore, 50 mol% (relative to the ionophore) of TDMACl, and a 2:1 ratio of plasticizer to
PVC. The dry mass accounted for 17 wt.% of the total mass. All the dry masses were dissolved
in THF. A similar membrane was also prepared without the ionophore to make the control
electrodes. The membrane compositions are shown in Table 1.
Table 1. Membrane cocktail compositions of the control and the benzoate-selective membranes.
9.4 Preparation of the sensors
Twelve electrodes with PVC shells consisting of six control and six benzoate-selective
electrodes were prepared. The diameter of the glassy carbon (GC) disk was 3 mm
corresponding to an electrode with a surface area of 0.07 cm2. At first, the electrodes were
polished with sandpaper (P100-P2000), diamond paste (15-1 µm), and alumina slurry (0.3 µm).
Cyclic voltammetry was used to confirm that there were no traces of contamination from
previous solid contacts. The electrodes were cleaned by ultrasonication in deionized water and
ethanol baths, by immersion in 1 M HNO3, and followed by ultrasonication in deionized water.
For electropolymerization onto the GC electrode, a monomer solution of 0.01 M EDOT in 0.1
M KCl was prepared and mixed overnight with a stirrer for the proper dissolution of the
monomer. The KCl in the monomer solution functioned both as an electrolyte and a source of
the dopant, which in this case was chloride. Deaeration of the monomer solution was done by
bubbling N2 gas for at least 15 min before electropolymerization. N2 gas was allowed to flow
over the solution surface to maintain a thin layer of N2 gas that would prevent the dissolution
of oxygen into the solution throughout the electropolymerization. The galvanostatic
Wt% (total mass)
Membrane Ionophore TDMACl o-NPOE PVC THF
Control - 0.05 11.30 5.59 83
Benzoate-selective 0.17 0.05 11.19 5.65 83

18
polymerization with a three-electrode system was performed by applying 14 µA current for
714 seconds to obtain a film with a 10 mC deposition charge with reference to the previous
work of Yrjänä et al.46. After electropolymerization, the electrodes were rinsed and conditioned
overnight in a 10-2 M sodium benzoate solution. After conditioning overnight, the electrodes
were rinsed and left to air-dry before drop-casting the membrane cocktails. A total of 100 µl of
membrane cocktail was drop-cast in two portions of 50 µl with a waiting time of about 30 min
between the two additions. The electrodes were covered with a beaker and left overnight to let
the THF evaporate slowly. The dried electrodes were then conditioned in 10-3 M sodium
benzoate solution for at least two days.
9.5 Electrochemical impedance spectroscopy
Electrochemical impedance spectroscopy measurements for all sensors were performed
potentiostatically in a three-electrode system containing 0.1 M sodium benzoate solution.
Before each EIS measurement, the open-circuit potential (OCP) was measured. A constant
potential of 0 V vs OCP was used. A sinusoidal AC excitation signal with an amplitude of 100
mV (root mean square, RMS) was used in the frequency range of f=100 mHz to 100 kHz for
the EIS measurement.
9.6 Potentiometry
Potentiometric measurements were performed with six electrodes simultaneously in the same
solution at a time. The set of electrodes were chosen such that each set consisted of three control
and three benzoate-selective electrodes. The electrodes belonging to every set of measurements
were selected randomly and the set changed from day to day. Potentiometric calibrations were
performed with automated serial dilution from 10-1 to 10-7 M in half-decade steps with 5 min
intervals. It was practically unfeasible to deaerate the sample solution and deionized water
continuously, but fresh deionized water was used before every calibration to minimize the
amount of dissolved CO2.
Potentiometric selectivity coefficients, 𝐾𝑏𝑒𝑛𝑧𝑜𝑎𝑡𝑒,𝑗p𝑜𝑡
were determined for some possible
interfering ions using the separate solution method69. For interfering ions, the potentiometric
measurement was done with serial dilution from 10-2 M to 10-5 M in half-decade steps with 6

19
min intervals. The liquid junction potentials for the primary ion i (benzoate) and the interfering
ion j were calculated using the Henderson equation54. The activity coefficients of the primary
ion i and interfering ion j were calculated using the extended Debye-Hückel theory70.The
standard electrode potential, E°, for both primary ion (IZI) and interfering ion (JZJ) was
determined by extrapolating the response for the ions IZI and JZJ to 1 M activities. The selectivity
coefficient is determined by using Equation 18 69. The experimental slope obtained from the
potentiometric calibration was used for calculations. The anions selected as possible
interferents were malate, citrate, chloride, salicylate, tartrate, and fumarate. The interferents
were selected based on the study conducted by Viljakainen et al.8 Sodium salts were used to
prepare the solutions except in the case of malate. It was prepared by adding NaOH solution to
a malic acid solution until the pH was near neutral.
log𝐾benzoate,𝑗pot
= 𝐸°J−𝐸°I
𝑆𝑙𝑜𝑝𝑒 Equation 18
where E°J is the standard electrode potential for interfering ions, E°I is the standard electrode
potential for the primary ion (benzoate), and the slope is the experimental slope from the
potentiometric calibration.
9.6.1 Sample preparation and measurement
About 100 g of frozen berries were thawed in a refrigerator for two days. The thawed berries
were then mashed with a mortar and pestle. About 40 g of mashed berries were weighed in a
200 ml volumetric flask. Then 2 ml of 1 M phosphate buffer was added for ionic strength
adjustment. About 50 ml of deionized water was added and the pH of the solution was adjusted
to above 6.20 with 0.5 M NaOH. The volumetric flask was then filled with water. The pKa
value of benzoic acid is 4.20. The pH value was set to be above 6.20 so that the majority (ca
99%) of benzoic acid could be converted to benzoate.
The sample solution was then filtered and 50 ml of the solution was used for the measurement.
The quantification of benzoate was done by following the single and double standard addition
methods. Here, the single-addition method refers to the addition of 1 ml of 0.1 M sodium
benzoate to 50 ml pretreated sample, whereas double-addition refers to the second addition of
1 ml of 0.1 M sodium benzoate to the sample. The potential was measured for 5 min before
and after the addition of the benzoate standard solution. The conductivity of the sample was

20
also measured before and after the addition of the benzoate standard solution. It is most likely
that the ionic strengths and the activity coefficients vary in samples with and without the
addition of standard solutions. In potentiometric measurements, all the samples must have
similar ionic strengths. Thus, the conductivity was measured to track the change in conductivity
with the addition of standard solution and the added quantity should not result in a significant
change in the conductivity.
9.7 Ion chromatography
The mobile phase used in IC was 2.0 mM NaHCO3, 1.3 mM Na2CO3, and 5% acetone. The
flow rate was set to 0.8 ml/min and the injection volume was set to 20 µl. Separation was done
in chemical suppression mode using 0.1 M H2SO4 as a suppressor regenerant. The conductivity
detector was used for detection. The separation was carried out at ambient temperature.
9.7.1 Sample preparation
The sample preparation was done according to the method proposed by Busra et al71. Some
amount of thawed berries were mashed with a mortar and pestle. About 5 g of mashed berries
were then weighed in a 100 ml volumetric flask. The flask was then filled with 100 ml of a
solution containing methanol and water (70:30). The sample was then sonicated for 15 min.
After sonication, the sample was filtered and 5 ml of the filtrate was transferred to each of five
50 ml volumetric flasks. Benzoate standard solution was added to four of the five flasks so
that the concentration of added benzoate was 0.05 mM, 0.10 mM, 0.15 mM, and 0.20 mM. One
sample was left without the addition of benzoate standard solution. The volume was then filled
up with deionized water. The sample was then transferred to autosampler vials after filtration
with a 0.45 µm pore size membrane filter.
21
10 Results and discussions
10.1 Galvanostatic electropolymerization
The galvanostatic polymerization was done in a three-electrode system with 0.01 M EDOT in
0.1 M KCl solution. Chronopotentiograms showed an initial fast increase in the potential to
about 1.1 V that stabilized between 0.9 to 1 V. The prompt initial increase in potential can be
related to the initiation of polymerization of PEDOT/Cl- over the electrodes surface and the
stabilization of the potential at a lower value can be related to polymerization over already
formed polymer72. See Figure A1 for chronopotentiograms recorded during
electropolymerization of control electrodes and benzoate-selective electrodes.
10.2 Electrochemical impedance spectroscopy measurements
Electrochemical impedance spectroscopy measurements were performed on control and
benzoate ISEs immersed in 0.1 M sodium benzoate solution. The impedance spectra were
similar to the findings presented in the study by Bobacka et al.73. The impedance spectra
(Figure 9), were typical of the impedance spectra of the solid-state ion-selective electrode. The
spectra showed a semicircle in the high-frequency region followed by a diffusion line in the
low-frequency region. The high-frequency semicircles correspond to the bulk resistance of the
ISM in parallel with its geometric capacitance. The low-frequency line is associated with the
diffusion of ions through the PEDOT and ISM layers. The geometric capacitance was
calculated using Equation 19. The bulk resistance and geometric capacitances of each electrode
are shown in Table 2. The developed electrodes had bulk resistances in the range of 1.8 to 3.2
MΩ and geometric capacitances in the range of 8.9 to 11.9 pF. The variation in the bulk
resistance and capacitance can be due to the difference in thickness of each electrode’s
membrane. The absence of a large semicircle or capacitive line in the lowest frequency region
shows that the PEDOT layer effectively functioned as an ion-to-electron transducer with high
redox capacitance.
𝐶𝑔 =1
2𝜋𝑓𝑚𝑎𝑥𝑅𝑏 Equation19
where Cg is the geometric capacitance, Rb is the bulk resistance, and fmax is the frequency
value that corresponds to the top of the semicircle.

22
0 0.5 1 1.5 2 2.5 3 3.5
0
0.5
1
1.5
2
2.5
3
3.5
C1
C2
C3
C4
C5
C6
-Z''
(M
Ω)
Z' (MΩ)
0 0.7 1.4 2.1 2.8
0
0.7
1.4
2.1
2.8
-Z''
(M
Ω)
Z' (MΩ)
A1
A2
A3
A4
A5
A6
Figure 9. Nyquist plot of (a) control electrodes C1-C6, and (b) benzoate-selective electrodes A1-A6.
Measurements were performed in 0.1 M sodium benzoate with the parameters f = 100 mHz-100 kHz, Edc = 0 V
vs. OCP, and ∆Eac = 100 mV (RMS).
Table 2. Bulk resistance (Rb) and the geometric capacitance (Cg) of the membranes on control electrodes (C1-
C6) and benzoate-selective electrodes (A1-A6) with their average values and corresponding standard deviations.
Control electrodes Benzoate-selective electrodes
10.3 Potentiometric measurement
10.3.1 Potentiometric calibration in pure benzoate solution
Calibrations of the electrodes were done when the electrodes were fresh and when they were
two months old. The calibrations were repeated on three different days over a one-week period,
in both fresh and old groups. The calibrations of the fresh and old electrodes are shown in
Figure 10. The performance of the electrodes in terms of slope, linear range, and limit of
detection (LOD) was comparable to some of the ion-selective sensors reported previously46,74–
76. From Table A2, the variation in standard electrode potential is higher in the control group.
Rb, MΩ Cg, pF Rb, MΩ Cg, pF
C1 3.2 10.0 A1 1.8 10.8
C2 2.1 11.9 A2 2.7 9.4
C3 2.9 10.9 A3 2.3 11.2
C4 2.7 11.9 A4 2.4 10.5
C5 2.4 10.6 A5 2.3 10.9
C6 2.8 8.9 A6 2.3 9.4
Average 2.7 10.7 2.3 10.4
SD 0.4 1.2 0.3 0.7

23
This could be due to some variation during drop-casting of the control membrane onto the
electrode. The slopes of the fresh electrodes were Nernstian whereas the slopes of the old
electrodes were near-Nernstian. The reduced slope might be due to the formation of a water
layer between the solid contact and membrane or can be attributed to the leakage of ionophore
from the benzoate-selective membrane to the conditioning solution upon storage. The water
layer test can be performed in a non-destructive fashion but this test was not performed in this
study77. The linearity range of all electrodes remained the same. The LOD of the benzoate-
selective electrodes was better than control electrodes and the LOD of the individual electrodes
did not change much with time. The average response characteristics and pooled standard
deviations of the electrodes, both when they were fresh and old, along with the average
response characteristics and standard deviations of the electrodes obtained from the calibration
in 0.01 M phosphate buffer are shown in Table 3. See Table A3 for the average response
characteristics of individual electrodes, both fresh and old electrodes.
Figure 10. Potentiometric calibrations of fresh and old electrodes. The dashed lines represent two-month-old
electrodes. Potentials have been adjusted by shifting the average potentials by different constant values in each
group, to separate each group. The calibrations were repeated on three different days over one week period, in
both fresh and old groups. The measurements from the control electrode C1 are treated as outliers in the control
group. Error bars express pooled standard deviations.
-7 -6 -5 -4 -3 -2 -1
-50
0
50
100
150
200
250
300
350
EM
F (
mV
)
logabenzoate
Control
Benzoate-
selective

24
10.3.2 Potentiometric calibration in 0.01 M phosphate buffer
A calibration was also performed using 0.01 M phosphate buffer as the background electrolyte
to see the effect of phosphate on the response characteristics of the sensors. The calibration
was carried out with automated dilution from 10-3 to 10-7 M in half-decade steps with 6 min
intervals. The average response characteristics are shown in Table 3. The slope of the control
electrode deteriorated in the presence of phosphate whereas the slope of the benzoate-selective
electrodes remained near-Nernstian. The lower limit of linearity (LLL) was the same as in the
calibrations done in a phosphate-free environment. The LOD of the benzoate-selective
electrode was degraded by about 1 logarithmic unit, whereas the LOD of the control electrode
did not suffer much. Consequently, careful consideration is required when choosing the
phosphate buffer concentration during sample preparation. We limited the addition of the
phosphate buffer to 0.01 M as the changes in the response were endurable. See Figure A2 for
the calibration of electrodes in the phosphate background.
Table 3. Average response characteristics and pooled standard deviations or standard deviations of control and
benzoate-selective electrodes determined from potentiometric calibrations in aqueous benzoate solution with and
without 0.01 M phosphate buffer. All electrodes had the same lower limit of linearity (LLL). All linear regressions
had an R2 ≥ 0.999. The calibrations in pure benzoate solutions were repeated on three different days over a one
week period, in both fresh and old groups. The calibration in 0.01 M phosphate buffer was done one time. LOD-
Limit of detection
Electrodes Slope (mV/decade)
(Avg. ± SD)
loga(LLL) loga(LOD )
(Avg. ± SD)
Calibration in 0.01 M phosphate buffer
Calibration in
pure benzoate
solution
Fresh Old Fresh Old
Control -59.17 ± 0.21 -57.71 ± 0.72
-4.00 -5.26 ± 0.02 -5.14 ± 0.03
Benzoate-
selective
-58.27 ± 0.11
-55.43 ± 0.64 -4.00 -5.89 ± 0.02
-5.71 ± 0.03
Control -49.11 ± 0.82 -4.00 -5.21 ± 0.06
Benzoate- selective
-56.73 ± 0.63
-4.00 -4.88 ± 0.03

25
10.3.3 Potentiometric selectivity
The electrodes showed good discrimination of most of the interferents. The electrodes were
selective to salicylate, which was expected as it is also an aromatic monocarboxylate with a
structure similar to that of benzoate. Further, salicylic acid is also more lipophilic than benzoic
acid, log P = 2.20 vs. log P = 1.88 in an octanol-water system78. The other anions besides
chloride are non-aromatic di- and tricarboxylates, which are less lipophilic than benzoate and
salicylate, and their structure might result in the formation of less stable complexes with the
ionophore, resulting in less interference. In addition, the Hofmeister series for anions shows
that chloride is more lipophilic than carboxylates such as acetate. This could be the reason for
the electrodes' selectivity to chloride after salicylate. The selectivity measurements were
performed two times, before and after the electrodes were exposed to sample measurements.
The logarithmic value of the selectivity coefficients for control electrodes and benzoate-
selective electrodes before exposure to the berry samples are shown in Table 4. See Table A4
for the logarithmic value of selectivity coefficients for control electrodes and benzoate-
selective electrodes after exposure to sample.
Table 4. Average potentiometric selectivity coefficients and their corresponding standard deviation determined
with the separate solution method for control electrodes (C1-C6) and benzoate-selective electrodes (A1-A6)
before exposure to the berry samples. The number of measurements per interfering ions was n = 6, all within a
day, for both control and benzoate-selective electrodes.
Ion,j Control electrodes Benzoate-selective electrodes
logKbenzoate,𝑗
pot SD logKbenzoate,𝑗
pot SD
Salicylate 2.27 0.13 0.34 0.12
Chloride -0.46 0.08 -1.47 0.16
Citrate -2.02 0.19 -2.44 0.11
Malate -2.60 0.03 -2.62 0.13
Fumarate -3.25 0.04 -3.53 0.05
Tartrate -3.21 0.10 -3.73 0.09

26
10.3.4 Sample measurement
The concentration of benzoate was determined following the single-addition and double-
addition methods. The number of measurements per electrode was five. The concentration
determined with control electrodes was higher than with benzoate-selective electrodes, which
is explained by the poorer selectivity of the control electrodes. The content of benzoate was
higher in lingonberries than cranberries, which is also evident from the previous publication8.
The average concentration and standard deviation determined with control electrodes and
benzoate-selective electrodes are presented in Table 8 alongside results obtained with IC.
10.4 Ion chromatography method
Metrohm’s ion chromatography method for the determination of benzoate was used for
chromatographic separation79. An isocratic mixture of 2.0 mM NaHCO3, 1.3 mM Na2CO3, and
5% acetone was used as the eluent. The method could separate benzoate distinctly from other
anions. However, a method without adding acetone was also attempted to see if acetone
addition could be avoided. With this method, the separation of benzoate was not efficient in
comparison with a method in which the eluent contains acetone. Without acetone, the benzoate
peak was not ideally separated from malate, citrate, and tartrate. Also, with 5% acetone, the
separation was completed in 45 min instead of the 60 min that were required when acetone was
not used. With these outcomes, the method described by Metrohm was used for the work.
Figure 11 shows the peak separation resulting from the two different methods. A mixture of
standard solutions of 0.1 mM benzoate and interfering anions was prepared for the separation.
The retention times of the different anions were 4.61 min for chloride, 10.13 min for benzoate,
16.82 min for malate, citrate, and tartrate, 27.31 min for fumarate, and 40.30 min for salicylate.

27
Retention Time (min)
Benzoate Malate, Citrate, and Tartrate
without acetone
with 5% acetone
Salicylate
Chloride Fumarate
Figure 11. Comparison of peak separation of anions with and without 5% acetone in the eluent (2.0 mM NaHCO3
and 1.3 mM Na2CO3). Flow rate: 0.8 ml/min.
10.4.1 Linearity
The calibration curve was plotted with peak area (µS/cm) against the concentration range of
(2.5 – 100 µM). The calibration curve parameters were calculated by regression analysis.
Experiments performed at five concentration levels, using six replicate injections of benzoate
standard for each concentration level, gave a linear calibration curve with respect to the peak
area. The calibration curve (Figure 12) was characterized by a slope of 0.0224 with a standard
deviation of 0.0003, and by an intercept of -0.03 with a standard deviation of 0.02. The standard
error of the regression (S) was 0.03. The correlation coefficient (R2) value was 0.9993, which
demonstrates the excellent linearity of the method.

28
0 50 100
0
1
2
Co
nd
ucti
vit
y (
µS
/cm
)
Concentration of benzoate standard solution (µM)
Figure 12. The calibration curve for benzoate standard concentration (2.5-100 µM). Eluent : 2.0 mM NaHCO3,
1.3 mM NaCO3 and 5% acetone, flow rate: 0.8 ml/min.
10.4.2 Repeatability
The repeatability test for the retention time and peak area was performed at five different
concentration levels (2.5-100 µM) of benzoate standard with six replicate injections. The
relative standard deviation (RSD) ranged from 0.1% to 0.5% for retention time and from 1%
to 3% for peak area. The RSD was below 5% which signifies good repeatability of
measurements. The repeatability test for retention time and peak area along with their average
value and RSD value at each concentration are shown in Table 5.
Table 5. Repeatability test for retention time and peak area at five different concentrations of benzoate standard
solution. The test was performed with six replicate injections. Eluent : 2.0 mM NaHCO3, 1.3 mM NaCO3 and 5%
acetone, flow rate: 0.8 ml/min
Concentration
µM
Retention Time
(min)
RSD (%) Peak Area
µS/cm
RSD (%)
2.5 10.12 0.1 0.040 3
5 10.14 0.2 0.089 1
10 10.16 0.2 0.181 1
50 10.12 0.2 1.046 1
100 10.14 0.5 2.226 1

29
Sample
0.05 mM
0.10 mM
0.15 mM
0.20 mM
10.4.3 Standard addition method
Five samples each of cranberry and lingonberry were prepared and analyzed with IC. Analyte
concentration was determined by the standard addition method. It was performed by addition
of 0.05 mM, 0.10 mM, 0.15 mM, and 0.20 mM of benzoate standard to an equal amount of
sample. The chromatograms of conductivity response after the addition of benzoate standard
to cranberry and lingonberry samples are shown in Figure 13 and Figure 14, respectively.
Figure 13. Chromatogram of cranberry sample showing conductivity response after standard addition of 0, 0.05,
0.10, 0.15, and 0.20 mM benzoate standard added to cranberry samples. Eluent: 2.0 mM NaHCO3, 1.3 mM NaCO3
and 5% acetone, flow rate: 0.8 ml/min. The inset figure represents the magnified chromatogram of benzoate.
Retention time (min)

30
Sample
0.05 mM
0.10 mM
0.15 mM
0.20 mM
Figure 14. Chromatogram of lingonberry sample showing conductivity response after standard addition of 0, 0.05,
0.10, 0.15, and 0.20 mM benzoate. Eluent: 2.0 mM NaHCO3, 1.3 mM NaCO3 and 5% acetone, flow rate: 0.8
ml/min. The inset figure represents the magnified chromatogram of benzoate.
The linear fits of the benzoate standard added to cranberry and lingonberry samples are shown
in Figure 15 and Figure 16, respectively. The parameters of the calibration curve were
calculated by linear regression and are presented in Table 6 and Table 7, respectively. The
benzoate content was determined by taking dilution into account. The average benzoate content
in cranberry and lingonberry from five replicates in each is given in Table 8 along with the
result obtained with potentiometry.
Retention time (min)

31
S1
S2
S3
S4
S5
0 0.1 0.2
0
1
2
3
4C
on
du
ctiv
ity
(µ
S/c
m)
Concentration of benzoate standard added (mM)
Figure 15. Calibration curves of standard addition method in IC. Addition of 0.05, 0.10, 0.15, and 0.2 mM
benzoate standard solution to five cranberry samples. Eluent: 2.0 mM NaHCO3, 1.3 mM NaCO3 and 5% acetone,
flow rate: 0.8 ml/min
Table 6. Linear fit parameters of calibration curves of five samples of cranberry. S is the standard error of the
regression.
Parameter S1 S2 S3 S4 S5
Intercept ± SD 0.24 ± 0.10 0.32 ± 0.08 0.30 ± 0.05 0.30 ± 0.06 0.17 ± 0.07
Slope ± SD 17.11 ± 0.82 17.35 ± 0.72 16.55 ± 0.42 13.71 ± 0.47 13.81 ± 0.57
S 0.13 0.11 0.07 0.07 0.09
R2 0.9965 0.9974 0.9990 0.9983 0.9983

32
0 0.1 0.2
0
2
4
6
S1
S2
S3
S4
S5
Concentration of benzoate standard added (mM)
Co
nd
uct
ivit
y (
µS
/cm
)
Figure 16. Calibration curves of standard addition method in IC. Addition of 0.05, 0.1, 0.15, and 0.2 mM benzoate
standard solution to five lingonberry samples. Eluent : 2.0 mM NaHCO3, 1.3 mM NaCO3 and 5% acetone, flow
rate: 0.8 ml/min.
Table 7. Linear fit parameters of calibration curve of five samples of lingonberry. S is the standard error of the
regression.
Parameter S1 S2 S3 S4 S5
Intercept ± SD 1.47 ± 0.06 1.66 ± 0.10 1.52 ± 0.03 1.23 ± 0.11 1.57 ± 0.15
Slope ± SD 19.26 ± 0.46 19.46 ± 0.85 19.54 ± 0.27 16.38 ± 0.87 22.32 ± 1.31
S 0.07 0.13 0.04 0.14 0.16
R2 0.9983 0.9943 0.9994 0.9916 0.9934
10.5 Comparison of the result between two techniques
The benzoate content in cranberries and lingonberries was determined using potentiometry and
ion chromatography. The concentration was determined potentiometrically by employing both
control electrodes and benzoate-selective electrodes. Single and double standard addition
methods were used. The content was determined in IC also by using the standard addition
method. The amount found by potentiometry was higher than by IC. The higher concentration

33
resulting from the potentiometric measurement can be attributed to interference from other
anions like salicylate and chloride, especially for the control electrodes. The zeta-scores were
calculated with respect to the reference value determined from IC and the within-lab
reproducibility standard deviations were used as standard uncertainty estimates. It is expected
that these within-lab reproducibility standard deviations are relatively smaller than the
combined standard uncertainties. Therefore, the use of within-lab reproducibility standard
deviations as the estimate for standard uncertainty would artificially increase our zeta-score
values making our test more stringent. The zeta-scores of benzoate-selective electrodes were
|𝑧𝑒𝑡𝑎| ≤ 2, that shows the performance of the benzoate-selective electrodes to be satisfactory,
which further implies that the benzoate content determined by the benzoate-selective electrodes
was comparable to IC. Hence, the fabricated benzoate-selective electrodes were usable for
benzoate determination in berries. Average concentration and standard deviation determined
by potentiometry and IC have been summed up in Table 8.
Table 8. Average concentration with corresponding standard deviation of benzoate in cranberry and lingonberry
samples, determined by potentiometry and IC. The standard deviations were pooled standard deviations in the
case of potentiometric measurements. The zeta-scores were calculated with respect to the reference value
determined from IC. The number of sample replicates was n = 5, measured over five different days, one sample
per day, in both potentiometric and IC measurements.
Berry Control electrode Benzoate-selective
electrode
IC
Single-
addition
Double-
addition
Single-
addition
Double-
addition
Cranberry
Average (g/kg)
0.49
0.92
0.28
0.23
0.17
SD
0.05 0.07 0.05 0.04 0.03
Zeta-scores
5.5 9.8 1.9 1.2
Lingonberry
Average (g/kg)
1.32
1.50
1.12
1.08
0.88
SD 0.18
0.13
0.10
0.20
0.07
Zeta-scores 2.3 4.2 2.0 0.9

34
11 Conclusion
PVC membrane-based benzoate-selective solid-contact electrodes were fabricated. Control
electrodes, which had a similar membrane but no ionophore, were also prepared. The electrodes
were characterized with EIS. The impedance spectra of electrodes were characteristic of that
of PVC membrane-based solid-contact ion-selective electrodes. The PEDOT used as a solid
contact could effectively function as an ion-to-electron transducer between the ISM and the
electronically conducting substrate. The calibration of the electrodes showed that the slopes
were Nernstian when they were fresh and near-Nernstian when they were two months older.
However, the overall electrodes' performance in terms of linearity, slope, and limit of detection
had not deteriorated much over the course of two months, which shows the electrodes to be
fairly robust and stable. The electrodes discriminated most of the other interfering anions
tested, whereas moderate selectivity towards a more lipophilic structural analogue, salicylate
was also observed. The electrodes could be conveniently used for the determination of benzoate
in the berry samples. Ion chromatography was also used as a method of analysis for the
determination of benzoate concentration. In both analytical methods, the standard addition
method was employed for the determination of benzoate in the sample to minimize the matrix
effect. Comparison of both methods showed that the concentration determined by
potentiometry was slightly higher but roughly similar to IC. Hence, the developed electrodes
could be reliably used for benzoate determination in the berry samples. The scope of
application could be broadened to encompass the determination of benzoate concentration in
other food products, beverages, pharmaceuticals, and cosmetics. This could be a faster, easier,
simpler, and more economical alternative to other analytical methods for the routine
quantification of benzoate.
References
1. García-García R, Searle SS. Preservatives: Food Use. Encycl Food Heal. Published
online 2016:505-509. doi:10.1016/B978-0-12-384947-2.00568-7
2. Stephen EC, Inetianbor JE, Yakubu JM. Effects of Food Additives and Preservatives
on Man-a Review Research Article. Asian J Sci Technol. 2015;6(2):1118-1135.

35
3. EFSA ANS panel (EFSA panel on Food Additives and Nutrient Sources Added to
Food). Scientific Opinion on the re‐evaluation of benzoic acid (E 210), sodium
benzoate (E 211), potassium benzoate (E 212) and calcium benzoate (E 213) as food
additives. EFSA J. 2016;14(3):110. doi:10.2903/j.efsa.2016.4433
4. European Commission. SCIENTIFIC COMMITTEE ON CONSUMER PRODUCTS
(SCCP) Opinion on Benzoic Acid and Sodium Benzoate. In: ; 2005:1-39. Retrieved,
2021-03-25, from
https://ec.europa.eu/health/ph_risk/committees/04_sccp/docs/sccp_o_015.pdf
5. Sieber R, Bütikofer U, Bosset JO. Benzoic acid as a natural compound in cultured
dairy products and cheese. Int Dairy J. 1995;5(3):227-246. doi:10.1016/0958-
6946(94)00005-A
6. Chipley J. Sodium Benzoate and Benzoic Acid. In: Davidson;P.M, Sofos;J.N,
Branen;A.L, eds. Antimicrobials in Food. Third. Taylor & Francis; 2005:11-48.
7. Beattie J, Crozier A, Duthie G. Potential Health Benefits of Berries. Curr Nutr Food
Sci. 2005;1(1):71-86. doi:10.2174/1573401052953294
8. Viljakainen S, Visti A, Laakso S. Concentrations of organic acids and soluble sugars in
juices from nordic berries. Acta Agric Scand Sect B Soil Plant Sci. 2002;52(2):101-
109. doi:10.1080/090647102321089846
9. Visti A, Viljakainen S, Laakso S. Preparation of fermentable lingonberry juice through
removal of benzoic acid by Saccharomyces cerevisiae yeast. Food Res Int.
2003;36(6):597-602. doi:10.1016/S0963-9969(03)00007-3
10. Bayizit AA, Ozcan T, Barlak N, Hoca G. Quantitation of benzoic and sorbic acid
levels from green olives by high-performance liquid chromatography. 2019;7(1):4-9.
doi:10.15406/mojfpt.2019.07.00211
11. Antakli S, Alahmad A, Badinjki H. Simultaneous determination of sodium benzoate
and potassium sorbate preservatives in foodstuffs using high performance liquid
chromatography. Asian J Chem. 2010;22(4):3275-3282.
12. Islam MS, Zahan N, Hossain MS, Rouf ASS. Determination of Preservatives in Fruit
Juice Products Available in Bangladesh by a Validated RP HPLC Method. Dhaka
Univ J Pharm Sci. 2019;18(2):195-208. doi:10.3329/dujps.v18i2.43262

36
13. Saad B, Bari MF, Saleh MI, Ahmad K, Talib MKM. Simultaneous determination of
preservatives (benzoic acid, sorbic acid, methylparaben and propylparaben) in
foodstuffs using high-performance liquid chromatography. J Chromatogr A.
2005;1073(1-2):393-397. doi:10.1016/j.chroma.2004.10.105
14. De Borba B, Rohrer J. Determination of Benzoate in Liquid Food Products by
Reagent-FreeTM Ion Chromatography. Lc Gc North Am. 2004;22:39-39.
15. Lin HJ, Choong YM. A Simple Method for the Simultaneous Determination of
Various Preservatives in Liquid Foods. J Food Drug Anal. 1999;7(4):291-304.
doi:10.38212/2224-6614.2861
16. Zuo Y, Wang C, Zhan J. Separation, characterization, and quantitation of benzoic and
phenolic antioxidants in American cranberry fruit by GC-MS. J Agric Food Chem.
2002;50(13):3789-3794. doi:10.1021/jf020055f
17. Wang L, Zhang X, Wang Y, Wang W. Simultaneous determination of preservatives in
soft drinks, yogurts and sauces by a novel solid-phase extraction element and thermal
desorption-gas chromatography. Anal Chim Acta. 2006;577(1):62-67.
doi:10.1016/j.aca.2006.06.030
18. Thomassin M, Cavalli E, Guillaume Y, Guinchard C. Comparison of quantitative high
performance thin layer chromatography and the high performance liquid
chromatography of parabens. J Pharm Biomed Anal. 1997;15(6):831-838.
doi:10.1016/S0731-7085(96)01914-0
19. Wang M, Zhang J, Zhang Z, et al. Simultaneous ultraviolet spectrophotometric
determination of sodium benzoate and potassium sorbate by BP-neural network
algorithm and partial least squares. Optik (Stuttg). Published online 2019.
doi:10.1016/j.ijleo.2019.163529
20. Labat L, Kummer E, Dallet P, Dubost JP. Comparison of high-performance liquid
chromatography and capillary zone electrophoresis for the determination of parabens
in a cosmetic product. J Pharm Biomed Anal. 2000;23(4):763-769.
doi:10.1016/S0731-7085(00)00358-7
21. Sharma N, Mutreja V, Kaur H. Electrochemical sensors. Eur J Mol Clin Med.
2020;7(7):4519-4528. doi:10.5796/kogyobutsurikagaku.58.1087

37
22. Bahadir O. Ion-Exchange Chromatography and Its Applications. Column Chromatogr.
Published online 2013. doi:10.5772/55744
23. Cattrall RW. Chemical Sensors. 1st ed. Oxford University Press; 1997.
24. Bobacka J, Ivaska A, Lewenstam A. Potentiometric ion sensors. Chem Rev.
2008;108(2):329-351. doi:10.1021/cr068100w
25. Bieg C, Fuchsberger K, Stelzle M. Introduction to polymer-based solid-contact ion-
selective electrodes—basic concepts, practical considerations, and current research
topics. Anal Bioanal Chem. 2017;409(1):45-61. doi:10.1007/s00216-016-9945-6
26. Ibupoto ZH, Khun K, Willander M. A Selective Iodide Ion Sensor Electrode Based on
Functionalized ZnO Nanotubes. Sensors. 2013;13(2):1984-1997.
doi:10.3390/s130201984
27. Radic J, Bralic M, Kolar M, Mitar I, Genorio B, Prkic A. Development of the New
Fluoride Ion-Selective Electrode Modified with Fe x O y Nanoparticles. Molecules.
2020;25(21):5213. doi:10.3390/molecules25215213
28. Ansari R, Delavar AF, Mohammad-khah A. A solid state Cr ( VI ) ion-selective
electrode based on polypyrrole. Microchim Acta. 2012;178:71-79.
doi:10.1007/s00604-012-0802-9
29. Lai C, Joyer MM, Fierke MA, Petkovich ND, Stein A. Subnanomolar detection limit
application of ion-selective electrodes with three-dimensionally ordered macroporous (
3DOM ) carbon solid contacts. J Solid State Electrochem. 2008;13:123-128.
doi:10.1007/s10008-008-0579-2
30. Belyustin AA. The centenary of glass electrode: From Max Cremer to F. G. K.
Baucke. J Solid State Electrochem. 20111;15:47-65. doi:10.1007/s10008-010-1105-x
31. Mikhelson K. Ion-Selective Electrodes. Vol 81.; 2013. doi:10.1007/978-3-642-36886-8
32. Frant, M. S., & Ross JW. Electrode for Sensing Fluoride Ion Activity in solution. Sci
154(3756), 1553–1555 doi101126/science15437561553. 1966;(September).
33. Ammann D, Morf WE, Anker P, Meier PC, Pretsch E, Simon W. Neutral Carrier
Based Ion-Selective Electrodes. Vol 5. Pergamon Press Ltd; 1983. doi:10.1016/b978-
0-08-031492-1.50005-x

38
34. Shirakawa H, Louis EJ, MacDiarmid AG, Chiang CK, Heeger AJ. Synthesis of
electrically conducting organic polymers: Halogen derivatives of polyacetylene,
(CH)x. J Chem Soc Chem Commun. 1977;(16):578-580. doi:10.1039/C39770000578
35. Bobacka J, Ivaska A, Lewenstam A. Potentiometric ion sensors based on conducting
polymers. Electroanalysis. 2003;15(5-6):366-374. doi:10.1002/elan.200390042
36. Urbanowicz M, Pijanowska DG, Jasiński A, Ekman M, Bocheńska MK. A
miniaturized solid-contact potentiometric multisensor platform for determination of
ionic profiles in human saliva. J Solid State Electrochem. 2019;23(12):3299-3308.
doi:10.1007/s10008-019-04429-9
37. Cattrall RW, Freiser H, Cattrall RW. Coated Wire Ion Selective Electrodes. Anal
Chem. 1971;43(13):1905-1906. doi:10.1021/ac60307a032
38. Momma T, Yamamoto M, Komaba S, Osaka T. Analysis of the long-term potential
stability of an all-solid-state potassium-selective electrode with electroactive
polypyrrole film. J Electroanal Chem. 1996;407(1-2):91-96. doi:10.1016/0022-
0728(95)04459-0
39. Migdalski J, Blaz T, Lewenstam A. Conducting polymer-based ion-selective
electrodes. 1996;322(95):141-149.
40. Li L, Yin H, Wang Y, Zheng J, Zeng H, Chen G. A chalcohalide glass/alloy based
Ag+ ion - Selective electrode with nanomolar detection limit. Sci Rep. 2017;7(1):1-9.
doi:10.1038/s41598-017-17032-7
41. Uosaki K, Shigematsu Y, Kita H, Umezawa Y, Souda R. Crystal-Face-Specific
Response of a Single-Crystal Cadmium Sulfide Based Ion-Selective Electrode. Anal
Chem. 1989;61(17):1980-1983. doi:10.1021/ac00192a041
42. Pleniceany M, Isvoranu M, Spinu C. Liquid membrane ion-selective electrodes for
potentiometric dosage of coper and nickel. J Serbian Chem Soc. 2005;70(2):269-276.
doi:10.2298/JSC0502269P
43. Yim HS, Kibbey CE, Ma SC, et al. Polymer membrane-based ion-, gas- and bio-
selective potentiometric sensors. Biosens Bioelectron. 1993;8(1):1-38.
doi:10.1016/0956-5663(93)80041-M

39
44. Mousavi Z, Bobacka J, Lewenstam A, Ivaska A. Poly(3,4-ethylenedioxythiophene)
(PEDOT) doped with carbon nanotubes as ion-to-electron transducer in polymer
membrane-based potassium ion-selective electrodes. J Electroanal Chem.
2009;633(1):246-252. doi:10.1016/j.jelechem.2009.06.005
45. Bühlmann P, Pretsch E, Bakker E. Carrier-based ion-selective electrodes and bulk
optodes. 2. Ionophores for potentiometric and optical sensors. Chem Rev.
1998;98(4):1593-1687. doi:10.1021/cr970113+
46. Yrjänä V, Saar I, Ilisson M, Kadam SA, Leito I, Bobacka J. Potentiometric carboxylate
sensors based on carbazole-derived acyclic and macrocyclic ionophores.
Chemosensors. 2021;9(1):1-26. doi:10.3390/chemosensors9010004
47. Mihali C, Vaum N. Use of Plasticizers for Electrochemical Sensors. Published online
2012. doi:10.5772/37006
48. Ammann D, Pretsch E, Simon W, Lindner E, Bezegh A, Pungor E. Lipophilic salts as
membrane additives and their influence on the properties of macro- and micro-
electrodes based on neutral carriers. Anal Chim Acta. 1985;171(C):119-129.
doi:10.1016/S0003-2670(00)84189-6
49. Schaller U, Bakker E, Pretsch E. Carrier Mechanism of Acidic Ionophores in Solvent
Polymeric Membrane Ion-Selective Electrodes. Anal Chem. 1995;67(18):3123-3132.
doi:10.1021/ac00114a005
50. Schaller U, Bakker E, Spichiger UE, Pretsch E. Ionic Additives for Ion-Selective
Electrodes Based on Electrically Charged Carriers. Anal Chem. 1994;66(3):391-398.
doi:10.1021/ac00075a013
51. Baleg AA, Masikini M, John SV, et al. Conducting Polymers and Composites.; 2019.
doi:10.1007/978-3-319-95987-0_17
52. Malinauskas A. Chemical deposition of conducting polymers. Polymers (Basel).
2001;42(9):3957-3972. doi:10.1016/S0032-3861(00)00800-4
53. Fomo G, Waryo T, Feleni U, Baker P. Electrochemical Polymerization. In: Functional
Polymers. Polymers and Polymeric Composites. Springer, Cham; 2019:105-131.
doi:10.1007/978-3-319-95987-0_3

40
54. Bard AJ , Faulkner LR. Electrochemical Methods: Fundamentals and Applications.
2nd ed. (Harris David, ed.). Wiley; 2001.
55. Ciobanu M, Wilburn JP, Krim ML, Cliffel DE. Fundamentals. In: Handbook of
Electrochemistry. ; 2007:3-29.
56. Umezawa Y. Handbook of Ion-Selective Electrodes.; 1990.
57. Small H. Twenty years of ion chromatography. J Chromatogr A. 1991;546:3-15.
doi:10.1016/S0021-9673(01)93002-X
58. Small H, Stevens TS, Bauman WC. Novel Ion Exchange Chromatographic Method
Using Conductimetric Detection. 1975;47(11):1801-1809.
59. Gjerde D, Fritz S, Schmuckler G. Anion chromatography with low-conductivity
eleuents. J Chromatogr. 1979;186:509-519. doi:10.1016/S0021-9673(00)95271-3
60. Gjerde D, Fritz S, Schmuckler G. Anion chromatography with low-conductivity
eleuents. II. J Chromatogr A. 1980;187(1):35-45. doi:10.1016/S0021-9673(00)87871-
1
61. Hanko VP, Rohrer JS, Heckenberg A. Determination of Amino Acids in Cell Culture
and. J Biomol Tech. 2004;15(4):317-324.
62. Michalski R. Applications of Ion Chromatography for the Determination of Inorganic
Cations Applications of Ion Chromatography. Crit Rev Anal Chem. 2009;39:230-250.
doi:10.1080/10408340903032453
63. Fritz J. Review Principles and applications of ion-exclusion chromatography. J
Chromatogr A. 1991;546:111-118. doi:10.1016/s0021-9673(01)93010-9
64. Cecchi T. Ion Pairing Chromatography. Crit Rev Anal Chem. 2008;38:161-213.
doi:10.1080/10408340802038882
65. Haddad PR. Eluents for Ion-Exchange Separations. J Chromatogr Libr. 1990;46:79-
132. doi:10.1016/S0301-4770(08)61136-7
66. Zenkevich IG, Klimova IO. Use of the standard addition method in quantitative
chromatographic analysis. J Anal Chem. 2006;61(10):967-972.
doi:10.1134/S1061934806100042

41
67. Martin AK, Nõges J, Haav K, et al. Exploring selectivity of 22 acyclic urea- ,
carbazole- and indolocarbazole-based receptors towards 11 monocarboxylates.
doi:10.1002/ejoc.201700931
68. Metrohm. The column program. Published online 2018:255. Retrieved, 2021-03-15,
from https://www.metrohm.com/en/documents/80005245
69. Bakker E, Bu P. Selectivity of Potentiometric Ion Sensors. 2000;72(6):1127-1133.
doi:10.1021/ac991146n
70. Koryta J, Dvorak J, Kavan L. Principles of Electrochemistry. second. (Sons JW and,
ed.).; 1993.
71. Öztürk B, Ayaz Seyhan S, Bilğiç Alkaya D. Determination of Benzoic Acid in
Cranberry (Vaccinium Macrocarpon Ait) by Hplc with Using Different Extraction
Methods. Biol Chem Res. 2019;6:8-13.
72. Gvozdenović MM, Jugović BZ, Stevanović JS, Grgur BN. Elektrohemijska sinteza
elektroprovodnih polimera. Hem Ind. 2014;68(6):673-684.
doi:10.2298/HEMIND131122008G
73. Bobacka J. Potential stability of all-solid-state ion-selective electrodes using
conducting polymers as ion-to-electron transducers. Anal Chem. 1999;71(21):4932-
4937. doi:10.1021/ac990497z
74. Lima JLFC, Montenegro MCBSM, Sales MGF. Benzoate Ion-Selective Electrode with
Improved Selectivity and Reproducibility for Benzoate Determination in Medicinal
Syrups. Mikrochim Acta. 1996;124(1-2):35-41. doi:10.1007/BF01244954
75. AguilarLira GY, ÁlvarezRomero GA, De et al. Potentiometric quantification of the
benzoate ion in nonalcoholic beverages using a solid electrode modified with a
polypyrrole-based selective membrane. Electroanalysis. 2013;25(6):1519-1527.
doi:10.1002/elan.201300010
76. Alizadeh N, Saburi N, Hosseini SE. Rapid determination of benzoate in soft drinks by
solid-state benzoate ion selective sensor based on conducting polypyrrole film. Food
Control. 2012;28(2):315-320. doi:10.1016/j.foodcont.2012.05.010

42
77. Hambly B, Guzinski M, Pendley B, Lindner E. Evaluation, Pitfalls and
Recommendations for the “Water Layer Test” for Solid Contact Ion-selective
Electrodes. Electroanalysis. 2020;32(4):781-791. doi:10.1002/elan.201900637
78. Haynes W., ed. CRC Handbook of Chemistry and Physics. 91st ed. Taylor & Francis;
2010.
79. Metrohm. Acetate and benzoate in presence of standard anions. Retrieved, 2021-03-15,
from https://www.metrohm.com/fi-fi/applications/AN-S-057
Appendix A
Appendix A.1 Technical specifications of the analytical column
Table A1. Technical specifications of the analytical column
Substrate Polymethacrylate with quaternary ammonium groups
Column dimensions
Column body
75 * 4.6 mm
Stainless steel
Standard flow 0.8 ml/min
Maximum flow 1.2 ml/min
Maximum pressure 7 MPa
Particle size 6 µm
Organic modifier 5%
pH range 1-12
Capacity 17 µmol(Cl-)

43
-100 0 100 200 300 400 500 600 700 800
0.4
0.5
0.6
0.7
0.8
0.9
1
1.1
Pote
nti
al
(V)
Time (s)
A1
A2
A3
A4
A5
A6
C1
C2
C3
C4
C5
C6
AppendixA.2 Galvanostatic electropolymerization
Figure A1. Chronopotentigrams of control electrodes (C1-C6) and benzoate-selective electrodes (A1-A6),
recorded during galvanostatic electropolymerization in a three-electrode system containing 0.01 M PEDOT in
0.1 M KCl.
AppendixA.3 Potentiometric calibrations
AppendixA.3.1 Potentiometric calibration in aqueous benzoate solution
Table A2. Average standard electrode potential (𝐸°) and pooled standard deviation of electrodes in the fresh
and old groups. The number of calibrations done was three over a one week period, in both fresh and old groups.
Electrodes Fresh Old
Average (mV) SD Average(mV) SD
Control -9 36 -20 18
Benzoate-
selective
-50 11 -35 6

44
-7 -6 -5 -4 -3
100
120
140
160
180
200
220
240
260
280
EM
F (
mV
)
logabenzoate
Control
Benzoate-
selective
Table A3. Average response characteristics of individual control (C1-C6) and benzoate-selective electrodes
(A1-A6), fresh and old, determined from potentiometric calibrations. All electrodes had the same lower limit of
linearity (LLL). All linear regressions had an R2 ≥ 0.999. The number of calibrations done was three, over a one
week period, in both fresh and old groups. LOD- Limit of detection
Electrodes Slope (mV/decade) loga(LLL) loga(LOD)
AppendixA.3.2 Potentiometric calibration in 0.01 M phosphate buffer
Figure A2. The potentiometric calibration of control electrodes and benzoate-selective electrodes in 0.01 M phosphate buffer. Error bars express the standard deviations. The measurements from control electrode C1 have
been treated as the outliers.
Fresh Old Fresh Old
C1 -59.07 -58.00 -4.00 -5.27 -5.08
C2 -59.10 -58.50 -5.24 -5.14
C3 -59.38 -57.57 -5.25 -5.18
C4 -59.48 -57.20 -5.28 -5.16
C5 -59.08 -57.59 -5.29 -5.15
C6 -58.90 -57.35 -5.24 -5.12
A1 -57.93 -55.13 -5.87 -5.68
A2 -58.71 -55.66 -5.87 -5.67
A3 -58.09 -55.15 -5.91 -5.72
A4 -57.89 -55.91 -5.92 -5.75
A5 -58.25 -55.24 -5.86 -5.66
A6 -58.80 -55.08 -5.88 -5.75

45
AppendixA.4 Potentiometric selectivity after exposure to berry samples
Table A4. Average potentiometric selectivity coefficients and their corresponding standard deviation determined
with the separate solution method for control electrodes (C1-C6) and benzoate-selective electrodes (A1-A6)
after exposure to the berry samples. The number of measurements per interfering ions was n = 6, all within a
day, for both control and benzoate-selective electrodes.
Ion,j Control electrodes Benzoate-selective electrodes
logKbenzoate, 𝑗
pot SD logKbenzoate, 𝑗
pot SD
Salicylate 3.33 0.10 0.57 0.02
Chloride -0.43 0.03 -1.84 0.04
Malate -2.43 0.10 -2.57 0.07
Citrate -2.87 0.09 -2.50 0.04
Fumarate -3.25 0.04 -3.53 0.05
Tartrate -3.28 0.08 -3.79 0.03