bmc bioinformatics biomed central - tauacgt.cs.tau.ac.il/papers/spike.pdf · medicine, tel aviv...
TRANSCRIPT

BioMed CentralBMC Bioinformatics
ss
Open AcceSoftwareSPIKE – a database, visualization and analysis tool of cellular signaling pathwaysRan Elkon1, Rita Vesterman1, Nira Amit1, Igor Ulitsky2, Idan Zohar2, Mali Weisz1, Gilad Mass1, Nir Orlev1, Giora Sternberg1, Ran Blekhman1,3, Jackie Assa2, Yosef Shiloh1 and Ron Shamir*2Address: 1The David and Inez Myers Laboratory for Genetic Research, Department of Molecular Genetics and Biochemistry, Sackler School of Medicine, Tel Aviv University, Tel Aviv 69978, Israel, 2School of Computer Science, Tel Aviv University, Tel Aviv 69978, Israel and 3Department of Human Genetics, University of Chicago, Chicago, IL 60637, USA
Email: Ran Elkon - [email protected]; Rita Vesterman - [email protected]; Nira Amit - [email protected]; Igor Ulitsky - [email protected]; Idan Zohar - [email protected]; Mali Weisz - [email protected]; Gilad Mass - [email protected]; Nir Orlev - [email protected]; Giora Sternberg - [email protected]; Ran Blekhman - [email protected]; Jackie Assa - [email protected]; Yosef Shiloh - [email protected]; Ron Shamir* - [email protected]
* Corresponding author
AbstractBackground: Biological signaling pathways that govern cellular physiology form an intricate webof tightly regulated interlocking processes. Data on these regulatory networks are accumulating atan unprecedented pace. The assimilation, visualization and interpretation of these data havebecome a major challenge in biological research, and once met, will greatly boost our ability tounderstand cell functioning on a systems level.
Results: To cope with this challenge, we are developing the SPIKE knowledge-base of signalingpathways. SPIKE contains three main software components: 1) A database (DB) of biologicalsignaling pathways. Carefully curated information from the literature and data from large publicsources constitute distinct tiers of the DB. 2) A visualization package that allows interactive graphicrepresentations of regulatory interactions stored in the DB and superposition of functionalgenomic and proteomic data on the maps. 3) An algorithmic inference engine that analyzes thenetworks for novel functional interplays between network components.
SPIKE is designed and implemented as a community tool and therefore provides a user-friendlyinterface that allows registered users to upload data to SPIKE DB. Our vision is that the DB will bepopulated by a distributed and highly collaborative effort undertaken by multiple groups in theresearch community, where each group contributes data in its field of expertise.
Conclusion: The integrated capabilities of SPIKE make it a powerful platform for the analysis ofsignaling networks and the integration of knowledge on such networks with omics data.
BackgroundOur realization of the complexity of signaling networks
that regulate cellular physiology is growing commensu-rate with the rapid growth in biological knowledge. It is
Published: 20 February 2008
BMC Bioinformatics 2008, 9:110 doi:10.1186/1471-2105-9-110
Received: 31 August 2007Accepted: 20 February 2008
This article is available from: http://www.biomedcentral.com/1471-2105/9/110
© 2008 Elkon et al; licensee BioMed Central Ltd. This is an Open Access article distributed under the terms of the Creative Commons Attribution License (http://creativecommons.org/licenses/by/2.0), which permits unrestricted use, distribution, and reproduction in any medium, provided the original work is properly cited.
Page 1 of 15(page number not for citation purposes)

BMC Bioinformatics 2008, 9:110 http://www.biomedcentral.com/1471-2105/9/110
now clear that biological pathways that govern cellulardevelopment and responses to environmental challengesare not linear, parallel and independent, but rather forman intricate web of interlocking processes tightly control-led by various logics of positive and negative feedbackloops [1,2]. Given this high degree of complexity, it isessential to develop computational means for processing,presenting and analyzing cellular signaling networks.However, at the present time most biological knowledgeresides as free text in archives of scientific journals. Beforethis knowledge can be processed by computers, it has tobe transformed into symbolic form using highly struc-tured languages. The need to represent biological knowl-edge in a formal language within electronic knowledge-bases (KBs) is well recognized and several ontologies havebeen defined and electronic repositories have been estab-lished in recent years. Many of them (e.g., EcoCyc [3], WIT[4]) focus on metabolic pathways in lower organisms,which at present are the most characterized pathways. KBsare also being developed for signal transduction pathwaysin higher eukaryotes together with supporting networkvisualization packages (e.g., KEGG [5], Reactome [6],aMAZE [7,8], BIND [9], PATIKA [10] and CellDesigner[11]).
Biological KBs are also becoming essential to the analysisof data obtained by high-throughput functional genomicand proteomic technologies. For example, when the effectof a certain perturbation on the cellular transcriptome isexamined, hundreds of genes typically respond. One wayto understand the biological meaning of the observedresponse is to systematically integrate these results withcurrent biological knowledge and then search for path-ways that are significantly enriched for responding genes.GenMapp [12], KEGG [5], and Cytoscape [13] are exam-ples of tools that provide such capabilities in variousforms.
We are developing SPIKE (Signaling Pathway IntegratedKnowledge Engine) as a tool to help researchers integrate,visualize, interpret and share existing and novel informa-tion on cellular signaling networks, and to boost the bio-logical interpretation of wide-scale 'omic' datasets. SPIKE'sDB already contains extensive and highly curated data onsignaling pathways in human cells related to DNA dam-age and other stress responses, cell cycle checkpoints,apoptosis, and innate immunity signaling, in addition todata from massive screenings for human protein-proteininteraction. The main feature that distinguishes SPIKEfrom other extant signaling KBs is its design and imple-mentation as a community tool. Our vision is that themanually curated tier of the DB will be populated by a dis-tributed and highly collaborative effort undertaken bymultiple groups in the research community, where eachgroup contributes data in its field of expertise. To meet
this goal, both the modeling scheme used in SPIKE for therepresentation of signaling pathways and the process ofdata upload by end users are kept very simple, makingSPIKE a highly flexible and agile platform for storing,sharing and analyzing data on cellular networks.
ImplementationOverall architectureSPIKE is composed of three main software components:1) A database (DB) of biological signaling pathways withan interface that supports data uploading and querying bymultiple end-users. Carefully curated information fromthe literature as well as data from large public sources con-stitute distinct tiers of the DB. SPIKE DB is implementedusing MySQL as the DB management system (DBMS). 2)A Java-based visualization package that allows interactive
An overview of SPIKEFigure 1An overview of SPIKE. This scheme describes the key components of the system and information flow. SPIKE's three main software components are: 1) A DB of signaling pathways, containing, in distinct tiers, carefully ascertained information uploaded by SPIKE users and supervised by the curators, data from external signaling DBs (e.g., KEGG, Reac-tome, IntAct), and wide-scale human protein-protein interac-tion datasets [21–24]. In SPIKE's decentralized architecture, a copy of the DB is installed along with the software in each participating research lab, and these remote site DBs are periodically synchronized with the central DB. The informa-tion stored in the SPIKE DB can be readily used by other KBs. 2) A visualization package that allows interactive repre-sentation of selected regulatory interactions from the DB, dynamic layout and navigation through the displayed net-works, and superposition of high-throughput genomic and proteomic data. Information displayed in the maps is linked to external DBs (e.g., Entrez Genes, PubMed). Prearranged maps for key signaling networks (e.g., p53, apoptosis, cell cycle, ATM, MAPK) were built and are posted at SPIKE web-site. 3) An algorithmic engine that performs various network analyses, aimed at discovering novel functional interplays between network components.
Pre-built
pathway maps
Protein-protein
interaction datasets
External signaling
databases
SPIKE’s remote
sites
SPIKE’s curators
SPIKE’s centraldatabase
Visualization Superposition
of omics data
Analysisalgorithms
External DBs
PubMed
literature
Page 2 of 15(page number not for citation purposes)

BMC Bioinformatics 2008, 9:110 http://www.biomedcentral.com/1471-2105/9/110
graphic representations of regulatory interactions storedin the DB, dynamic layout and navigation through thenetworks, and superposition of high-throughput genomicand proteomic data on the displayed maps. 3) An algo-rithmic inference engine that analyzes the networks fornovel functional interplays between network compo-nents, and enhances the analysis of omic datasets (Figure1).
Modeling schemeSPIKE uses a formal modeling scheme in which informa-tion on signaling pathways is summarized in a structuredlanguage amenable to computerized manipulation andanalysis. The scheme is based upon three fundamentalrequirements: First, it should be of sufficient expressivepower to capture information on most aspects of regula-tory pathways. Second, it should focus on signaling ratherthan metabolic pathways, and on the regulatory inter-plays maintained between network components (the bio-chemical mechanisms by which the regulatory effects areelicited are of secondary importance in our model). Third,the scheme should be kept simple in order to ease datainput by the SPIKE user community. Such input is crucialas our long-term goal is to have the manually curated tierof the DB populated primarily by the users' community.
With these considerations in mind, we adopted (using theterminology of Kitano et al. [11]) an 'entity-relationship'scheme over a 'state transition' one. The 'state transition'scheme regards different post-translational modified ver-sions of a protein as separate entities (or as different'states' of a protein), visually represents them as distinctnodes in the map, and seeks to trace the transitionbetween these states. The 'entity-relationship', on theother hand, does not distinguish between different modi-fied states of a protein and does not look for such statetransitions; it focuses, rather, on the regulatory effectsmaintained between different proteins within a signalingnetwork (Figure 2A–B). In a state transition scheme(adopted, for example, by Reactome [6], PATIKA [10],CellDesigner [11]), representation of signaling pathwayscould become extremely complex due to combinatorialgrowth of possible states (for example, a protein that canbe modified on only 5 residues has 25 = 32 differentstates). An entity-relationship scheme (adopted, for exam-ple, by KEGG [5] and Kohn's maps [14,15]) is much sim-pler, having all these states represented by only oneprotein entity, but at the price of not accounting for pos-sible temporal order constraints on the state transitions(e.g., activation of a protein by its phosphorylation on res-idue B can occur only after it is first phosphorylated onresidue A).
The entity-relationship scheme we designed for SPIKE isbased on two basic types of objects: "biological entities" and"relations".
Biological entitiesSPIKE's modeling scheme comprises four types of biolog-ical entities:
a. Gene/RNA/ProteinGenes (and their respective RNA and protein products)are the primary atomic elements of the scheme. To avoidambiguities, only characterized human genes that areassigned a formal designation by the Human GenomeNomenclature Committee (HGNC) are included inSPIKE's gene space. These objects are uniquely identifiedby their Entrez Gene IDs [16]. For simplicity, we decidednot to define distinct objects for genes, their transcribedRNAs and translated proteins, and their modifications.See below a discussion of scheme limitations. Non-pro-tein coding genes (e.g., genes encoding for rRNAs, tRNAsand microRNAs) are also included in this entity type.
b. FamilyA family is a group of isoform genes (encoded by distinctgenomic loci) with high sequence homology and whoseencoded proteins share most of their biological activities.Well known examples are the JNK family, which includesthe JNK1, JNK2 and JNK3 proteins (whose official namesare MAPK8, MAPK9 and MAPK10), and the p38 family,which is comprised of four p38 isoforms (officially desig-nated as MAPK11–14).
c. ComplexA complex is a group of proteins (or protein families) thatcarry out a specific function only when associated withtheir complex mates. An example is the DNA-damage sen-sor MRN complex, which is composed of the proteinsMRE11, RAD50 and NBS1 [17]. The complex entity sup-ports a nested structure, namely, a complex can be builtfrom sub-complexes.
d. Small moleculeThis entity enables the modeling scheme to includedescriptions of regulations involving small signaling mol-ecules such as GTP, cAMP, Ca++, etc. Signaling moleculesin SPIKE are identified using their ID in the ChEBI DB[18].
In contrast to genes/proteins and small molecules, nocontrolled nomenclature is available for designating fam-ilies and complexes. For these entities we use the mostcommon name in the literature.
Page 3 of 15(page number not for citation purposes)

BMC Bioinformatics 2008, 9:110 http://www.biomedcentral.com/1471-2105/9/110
RelationsThe second type of object in our modeling scheme is rela-tions. The scheme defines three types of relations:
a. RegulationEvery regulation in SPIKE is defined by a triplet of the fol-lowing simple form: Source, Regulatory effect, and Target.For example, "ATM activates TP53", and "CDKN1A inhib-its the CDK2-CCNE complex". A regulatory interactioncan be defined between any two biological entities, orbetween a biological entity and another regulation. A reg-ulation can have one of three regulatory effects: "pro-mote/activate", "inhibit/repress", or "unknown". Eachregulation (defined by its source, target and effect) is asso-ciated with several attributes: the biochemical mechanismby which it is driven (e.g., phosphorylation, transcrip-tional regulation, ubiquitination), one or more support-
ing references, quality level and status flag for qualitycontrol (see below), and the submitter/data source.
The fact that our scheme allows one regulation as the tar-get of another enhances its expressivity. First, it enables usto describe regulations that affect only a subset of down-stream regulations emanating from an entity, as illus-trated in Figure 3A. Second, it improves the specificity ofthe description, as demonstrated by the comparisonbetween Figure 3B and Figure 3C. For regulations that acton other regulations, an additional attribute is added: thephysical target, which specifies the physical entity on whichthe biochemical interaction is exerted (see Figure 3C).
b. InteractionMuch data exist on pairs of proteins that are known tophysically interact, but whose regulatory effect is not yetunderstood. Interaction relations represent such physical
SPIKE modeling schemeFigure 2SPIKE modeling scheme. State transition scheme vs. entity-relationship scheme. (A). The 'state transition' scheme regards different post-translational modified versions of a protein as separate entities (or as different 'states' of a protein), visually rep-resents them as distinct nodes in the map, and aims at tracing the transition between these states. (B). In contrast, the 'entity-relationship' scheme views all these entities as one protein, and focuses on the regulatory effects between different proteins within a signaling network. In a state transition scheme, representation of signaling pathways could become extremely complex due to combinatorial growth of possible states. An entity-relationship scheme is much simpler, having all these states repre-sented by only one entity, but at the price of not taking into account temporal order constraints on the state transition reac-tions in cases where such constraints exist.
p53:S15
CHK2:
T68
p53:S15+S20
p53
ATM
CHK2 p53
CHK2
ATM
State transition model Entity-relationship model
State transition
Activation/catalysis of transition
Post-translational
modification
A B
Activation
Page 4 of 15(page number not for citation purposes)

BMC Bioinformatics 2008, 9:110 http://www.biomedcentral.com/1471-2105/9/110
interactions, which, unlike regulations, are symmetricalrather than directional. Each interaction is defined by thetwo participating proteins, and has the followingattributes: the experimental method used to identify it(e.g., Y2H, co-immunoprecipitation), supporting refer-ence(s), quality and status flags, and the submitter/datasource.
c. ContainmentThis type of relation is used to define the relationshipbetween families/complexes and the members they con-tain.
LimitationsSPIKE's modeling scheme is intentionally simple, facilitat-ing easy input to the DB by many end-users. Despite itssimplicity, the scheme can describe most key aspects ofsignal transduction pathways. However, at this stage itdeliberately does not account for metabolic reactions,splice variants, cell types and cellular compartments, orfor any quantitative aspects of regulations. It also deliber-ately avoids distinction between a gene and its RNA andprotein. SPIKE focuses on regulatory effects maintainedbetween components within signaling networks. Wefound that for our goals it is not essential to explicitlymodel the layer in which the regulatory effect is exercised(i.e., transcriptional regulation, post-translational modifi-cation, etc.). However, information on the specific bio-chemical mechanism is stored in the DB, being one of theattributes attached to each regulation. While SPIKE's mod-eling scheme can accommodate data on any signalingpathway from any organism, at present the implementedDB supports data obtained only in human cells (as genesare associated with the human Entrez-Gene ID and aredesignated using their HGNC official symbol).
Despite these limitations, SPIKE's design is flexibleenough to allow its adjustment to support many of theabove features in the future, as biological knowledgeexpands and standard ontologies and nomenclaturesbecome widely accepted.
ResultsThe DatabaseSPIKE DB contains data from three sources: 1) relationsuploaded manually by SPIKE curators and users; 2) rela-tions imported en masse from external signaling pathwayDBs (we have already imported data from KEGG [19],Reactome [6] and IntAct [20]). 3) Wide-scale protein-pro-tein interaction datasets that resulted from high-through-put screens in human cells. Currently, the datasetsreported by Stelzl et al. [21], Rual et al. [22], Lim et al [23]and Ewing et al. [24] are incorporated. Table 1 summa-rizes the current status of the DB.
SPIKE defines a user hierarchy of four levels: guest, user,curator and admin. Users at the second level and above
Regulation as target of another regulationFigure 3Regulation as target of another regulation. (A). The ability to define a regulation as a target of another regulation is helpful in cases where the effect of regulator A on target B is transmitted to some but not all targets of B. In this sche-matic example, A specifically inhibits the B-mediated activa-tion of C. (B). A schematic representation of p53 activation by CHK2 [31]. (C). A more specific representation: here, the information that the activation of p53 is achieved by CHK2 interfering with the inhibition of p53 by MDM2 is explicitly represented. This interference is achieved by CHK2 phos-phorylation of p53 [31], and therefore the 'physical target' attribute of this regulation is p53.
A
B
EDC
CHK2 p53
3A. 3B.
3C.
MDM2 p53
CHK2
A B
C
Table 1: Current status of SPIKE DB (as of November 2007).
Quality Level No. of Regulations No. of Interactions No. of Containments
1 652 7 3632 17 0 03 421 0 5214 41 21832 906
Total 1,131 21,839 1,790
Page 5 of 15(page number not for citation purposes)

BMC Bioinformatics 2008, 9:110 http://www.biomedcentral.com/1471-2105/9/110
are privileged to upload new relations to the DB (Figure4). A privacy mechanism was implemented that allowsusers to mark as 'private' entries submitted to the DB.Such entries can be accessed only by the laboratory thatsubmitted them. This feature is used for including data inthe pre-publication phase. Curated data uploaded manu-ally to date have focused mainly on pathways related toDNA damage responses, cell cycle regulation, apoptosis,innate immunity and stress responses. Data loaded enmasse from external KBs and high-throughput datasetscover all aspects of cellular physiology.
The issue of data quality is addressed by several means.First, only privileged users are allowed to upload data toSPIKE DB. Such a privilege is granted only to labs withestablished expertise in their research field. Second, eachsubmission is assigned a quality level and a status flag.The quality level is set by the user who uploads the regu-lation and reflects the reliability he/she ascribes to it; in
general, relations derived from highly focused biochemi-cal studies are assigned high quality, while those derivedfrom high-throughput experiments are assigned low qual-ity. The status flag is set to 'Draft' at the time of submis-sion. SPIKE designated curators review all newsubmissions, decide whether to accept, edit or reject them,and set the status flag accordingly.
The current version of SPIKE employs a decentralized DBarchitecture that supports automatic database synchroni-zation. A local copy of the DB is installed along with thesoftware in each research lab, and these DBs are periodi-cally synchronized with the central DB. A detailed descrip-tion of SPIKE DB synchronization mechanism is providedin Appendix A. Having local installation of SPIKE DBensures a genuine and full support for private data. Dataare exchanged between the local and central DBs using theSPIKE XML schema that we defined for this purpose(Appendix C). Additionally, the SPIKE XML serves as theprimary import/export format in which all the informa-tion stored in the SPIKE DB is available. Consequently,this information can be electronically manipulated by anyinterested party and may be readily incorporated intoother external KBs. To facilitate data exchange, we imple-mented a program that converts SPIKE data to the stand-ard BioPAX format (BioPAX level 2 [25]). The content ofSPIKE DB is available in this format from our website.However, due to differences in the representation, BioPaXcannot fully convey all the information stored in SPIKEXML.
The visualization moduleThe pathway visualization module allows dynamic net-work representation of selected biological data stored inthe DB and gradual navigation through it. Researchers canmanipulate the network map interactively, control its lay-out, expand or collapse selected segments, and retrievefurther information on both biological entities and regu-lations. SPIKE's four types of biological entities are dis-played in the maps using nodes of different colors (Figure5). Although the modeling scheme does not distinguishbetween a gene and its RNA and protein products, giventhe growing data on regulatory roles played by microR-NAs in various signaling pathways, protein-coding andnon-coding genes are displayed using different colors. Thethree types of relations (regulations, interactions and con-tainments) are denoted by distinct types of edges (Figure5).
Salient features implemented in SPIKE's visualizationmodule include:
• Dynamic navigation and expansion of maps. Doubleclicking on a node leads to the addition to the map of all
Adding new information to SPIKE DBFigure 4Adding new information to SPIKE DB. Submission forms allow privileged users to upload data to the DB. Here, the form for submission of a new regulation is shown. The user specifies the source, target and effect of the regulation. Additional regulation attributes include the biochemical mechanism, one or more supporting references, the submit-ter, and the quality level ascribed to the data. Submitted data can be flagged as private, in which case the data will be visible only to the user who uploaded it.
Page 6 of 15(page number not for citation purposes)

BMC Bioinformatics 2008, 9:110 http://www.biomedcentral.com/1471-2105/9/110
its direct neighbors meeting the quality-level threshold setby the user.
• Retrieving further information on genes and regulations.Clicking on a gene's pop-up menu opens its Entrez-Geneweb page. Clicking on an edge's pop-up menu allowsopening abstracts of the supporting citations fromPubMed. In addition, a properties description panel dis-plays more details about each object, in addition to theinformation supplied in the map itself (e.g., status, qualityand submitter data for regulations; full official designa-tion and description for nodes).
• Data filtering. A filtering mechanism allows users to dis-play only data filtered according to different parameters,
such as status flag, quality level, data source, and dataowner.
• Graph layout. Automatic and manual layout mecha-nisms can be used to facilitate organization of the maps.Edges can also be moved and manipulated by the user toimprove the layout of the map.
• A 'recycling bin' enables users to temporarily hide spe-cific nodes and edges in order to improve clarity of the dis-played maps.
• Superposition of omics data on the maps. This utilityfacilitates the biological interpretation of microarray andother high-throughput measurements. For example,
SPIKE visualization of signaling networksFigure 5SPIKE visualization of signaling networks. The different types of biological entities are represented in SPIKE maps by nodes of different colors: violet nodes correspond to protein-coding genes, turquoise nodes to non protein-coding genes (e.g., micro-RNAs, rRNAs, tRNAs), green nodes to protein complexes, and yellow nodes to protein families. Small molecules are displayed in orange (not included in this map). Blue directed edges represent regulations: arrows correspond to activation, T shape edges to inhibition, and open circles denote regulations whose effect is still not clear (e.g., ATM was reported to phos-phorylate MCM2, but the effect of this modification is not known yet). Blue undirected edges represent protein-protein inter-actions (not included in this map). Green edges represent containment relations between nodes (e.g., a complex and its components). Red and green dots within a node indicate that not all regulation and containment relations stored in the DB for the node are displayed in the map. This map represents the ATM-regulated network which is set off by the cell in response to double-strand breaks in the DNA.
Page 7 of 15(page number not for citation purposes)
BMC Bioinformatics 2008, 9:110 http://www.biomedcentral.com/1471-2105/9/110
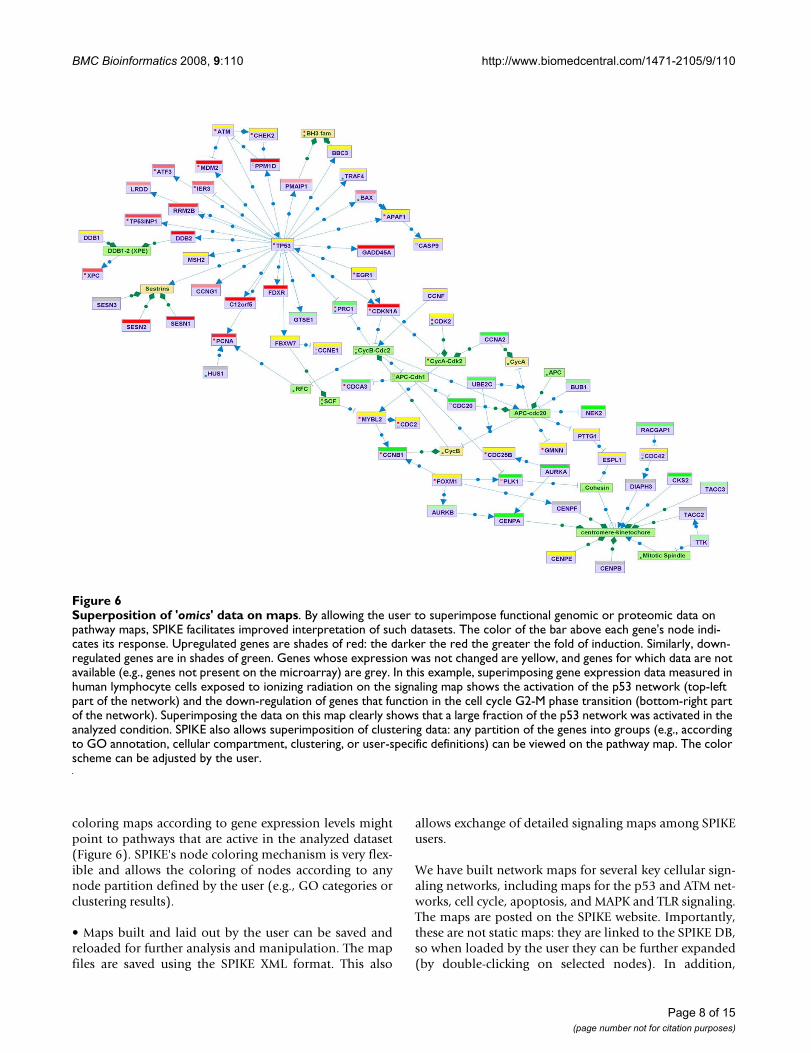
coloring maps according to gene expression levels mightpoint to pathways that are active in the analyzed dataset(Figure 6). SPIKE's node coloring mechanism is very flex-ible and allows the coloring of nodes according to anynode partition defined by the user (e.g., GO categories orclustering results).
• Maps built and laid out by the user can be saved andreloaded for further analysis and manipulation. The mapfiles are saved using the SPIKE XML format. This also
allows exchange of detailed signaling maps among SPIKEusers.
We have built network maps for several key cellular sign-aling networks, including maps for the p53 and ATM net-works, cell cycle, apoptosis, and MAPK and TLR signaling.The maps are posted on the SPIKE website. Importantly,these are not static maps: they are linked to the SPIKE DB,so when loaded by the user they can be further expanded(by double-clicking on selected nodes). In addition,
Superposition of 'omics' data on mapsFigure 6Superposition of 'omics' data on maps. By allowing the user to superimpose functional genomic or proteomic data on pathway maps, SPIKE facilitates improved interpretation of such datasets. The color of the bar above each gene's node indi-cates its response. Upregulated genes are shades of red: the darker the red the greater the fold of induction. Similarly, down-regulated genes are in shades of green. Genes whose expression was not changed are yellow, and genes for which data are not available (e.g., genes not present on the microarray) are grey. In this example, superimposing gene expression data measured in human lymphocyte cells exposed to ionizing radiation on the signaling map shows the activation of the p53 network (top-left part of the network) and the down-regulation of genes that function in the cell cycle G2-M phase transition (bottom-right part of the network). Superimposing the data on this map clearly shows that a large fraction of the p53 network was activated in the analyzed condition. SPIKE also allows superimposition of clustering data: any partition of the genes into groups (e.g., according to GO annotation, cellular compartment, clustering, or user-specific definitions) can be viewed on the pathway map. The color scheme can be adjusted by the user.
Page 8 of 15(page number not for citation purposes)

BMC Bioinformatics 2008, 9:110 http://www.biomedcentral.com/1471-2105/9/110
updates to the DB are automatically reflected in the map(the existence of new regulations that involve any node inthe map and that are not displayed in it will be indicatedby a red dot within the node). This ensures that the mapsposted on the site are continuously synchronized with theDB. SPIKE users can join the collaborative effort, buildingsignaling maps for pathways that are in the focus of theirresearch, and contributing these maps to the communityby posting them on the SPIKE web site.
The algorithmic engineSPIKE's algorithmic engine is designed to include variousgraph-theory algorithms that analyze the network, charac-terize its topological properties, integrate omics data toidentify functional modules in the network, and suggestnovel regulatory interplays between components. Atpresent, we have implemented three basic utilities:
• Path findingThis utility finds and displays all direct paths, up to a pre-defined maximal length, that connect source and targetnodes specified by the user (Figure 7). This utility sup-
ports also undirected edges (interactions). However, bydefault, undirected edges are excluded from this analysisas such links are much less informative than directedones. The user can choose whether to include or excludeinteractions (which are usually of lower quality level thanthe regulations in SPIKE DB).
• Interconnections within a set of genes/proteinsGiven target sets of genes/proteins provided by the user(e.g., gene clusters identified by analysis of gene expres-sion data), this utility displays all the direct connectionsamong nodes within each set (with an option to allowconnection via a single intermediate node not included inthe input set) (Figure 8).
• Enriched mapsGiven target sets of genes/proteins uploaded by the user,the utility searches for signaling maps enriched for nodesincluded in one of the target sets. Enrichment scores arecalculated using the hypergeometric distribution and arecomputed with respect to a given background set (e.g., allthe genes present on a microarray platform). Maps thatare significantly enriched (beyond a specified p-valuethreshold) are listed in the results table. Clicking on amap's link in this table opens the enriched map, in whichtarget set nodes are highlighted (Figure 9).
InstallationSPIKE can be downloaded from [26]. It has two modes ofinstallation: a stand-alone tool (evaluation mode) and acommunity tool (standard mode). Installing the evalua-tion mode (which is based on the Java Web-Start technol-ogy) is straightforward: It requires the execution of asingle file, and installation is completed by a few clicks. Italso provides a mechanism for automatic softwareupgrades and maintenance. This installation is currentlylimited to Microsoft Windows 2000/XP OS and requiresad-hoc procedures for synchronization of data with thecentral SPIKE DB.
A research group that wishes to join the SPIKE communityshould fill-in an online form available at SPIKE websiteand have the tool locally installed in its "standard instal-lation" mode. The standard mode of installation grantsthe user full functionality of the tool. Mainly, it supportssynchronization between the site and the central DB andcan serve several users on different machines within oneinternal network site (typically, several users within aresearch lab and several research labs in the same insti-tute). It requires installation of the MySQL DB server onone machine on the site. Detailed installation instructionsare provided on the website. This installation modeallows data submitted at the site to be shared with theentire SPIKE community (while retaining the option tohide some private data), and enables that site to benefit
Path findingFigure 7Path finding. The user specifies the source, the target and the maximal number of edges in a path connecting them. By default, un-directed edges (that is, protein-protein interac-tions) are excluded from the analysis. In this example, path-ways linking ATM to CASP3, a major effector of apoptosis, are sought. All paths that meet the length constraint are dis-played with the shortest paths highlighted.
Page 9 of 15(page number not for citation purposes)

BMC Bioinformatics 2008, 9:110 http://www.biomedcentral.com/1471-2105/9/110
from the data submitted by other sites. The standardinstallation supports Windows, UNIX and Mac OS.
ConclusionSPIKE provides the research community with a powerfulintegrated KB of signaling pathways in human cells. Thetool helps researchers integrate, visualize and interpretexisting and novel information on cellular networks. Itcan be of great utility both for labs whose research isfocused on specific processes and networks (e.g., p53 net-work), and for 'omics' labs that strive for comprehensive,systems-level delineation of cell functioning.
Gene/protein-centric labs can utilize SPIKE as a centralrepository for regulations and interactions involvinggenes, proteins and processes that are in the focus of theirresearch, and greatly benefit from data uploaded by other
labs in the same research field. As a pilot case, at presentwe are focusing our curation effort on signaling pathwaysthat are induced by DNA damage (including DNA repair,cell cycle checkpoints, cell death and general stressresponses), and are building a community of SPIKE usersin the DNA damage research field. Any biologist in thiscommunity can find SPIKE very useful in addressing sim-ple queries such as 'which proteins are directly regulatedby p53?', 'is there a pathway that connects two geneswhose knockdown results in a similar hyper-sensitivity toDNA damage?'. In parallel, we encourage and support theestablishment of additional sub-communities that coverother aspects of cellular physiology.
Labs that carry out wide-scale 'omics' experiments can uti-lize SPIKE's analytic and visualization features to minemeaningful biological hypotheses out of the data (e.g., by
Interconnections within a set of genes/proteinsFigure 8Interconnections within a set of genes/proteins. Interconnections among nodes within a specified target set of genes or proteins (e.g., sets obtained by cluster analysis applied to gene expression microarray data) are displayed. This figure shows the interconnections within a cluster of genes that were induced by LPS treatment, including single intermediate nodes not con-tained in the original cluster. Nodes corresponding to genes contained in the input cluster are highlighted in pink.
Page 10 of 15(page number not for citation purposes)

BMC Bioinformatics 2008, 9:110 http://www.biomedcentral.com/1471-2105/9/110
using map enrichment tests or the interconnection util-ity), and present them in lucid, aesthetic network graphs.The flexible coloring schemes implemented in SPIKEmake it very powerful for this task. For example, usingSPIKE we built network maps in which gene nodes werecolored according to the kinetics in which they wereinduced in the dataset that we analyzed and according toregulatory-elements that we identified in their promoterregions [27,28].
SPIKE is under continuous development and we plan toenhance several functionalities in future versions. It willbe upgraded to a web-based system that will enable its useover the web without local installation. It will be devel-oped into a multiple-species KB. Visualization capabilitieswill be enhanced by adding hierarchical and other graphlayout mechanisms. We are currently implementing aninterface between SPIKE and our EXPANDER package for
analysis of microarray data [29] aimed at creating onestreamlined process for handling such data, beginning inthe very early preprocessing stage of data-normalizationand ending with integrating the results with knowledgeon signaling networks. We are also using high-throughputresults to develop algorithms for the identification of'connected modules' and 'hot-spots' in the network (forexample, identification of sub-regions that are signifi-cantly dense in genes/proteins that show some property ofinterest, see for example our recent work [30]). In parallel,we will continue to populate the SPIKE DB, supervise itsquality, and build additional maps for pivotal signalingpathways.
Availability and requirementsProject name: SPIKE
• Project home page: http://www.cs.tau.ac.il/~spike
Enriched mapsFigure 9Enriched maps. Signaling maps enriched for nodes included in target sets of genes/proteins are sought. Maps that are signifi-cantly enriched (beyond a specified p-value threshold) are listed on the results table. Clicking on a map's link in this table opens the enriched map, in which nodes contained in the original input set are highlighted.
Page 11 of 15(page number not for citation purposes)

BMC Bioinformatics 2008, 9:110 http://www.biomedcentral.com/1471-2105/9/110
• Operating system(s): Windows, UNIX or Mac.
• Programming language: Java
• Other requirements: Java 1.4 or higher, MySQL DBserver
• License: free for non-commercial users
• Any restrictions to use by non-academics: licenseneeded
Authors' contributionsRE, YS and RS designed the functionality of tool and coor-dinated its development. RV, NA, IU, IZ and JA developedthe system architecture, wrote the code and tested it. NO,GS and RB implemented an earlier version of the system.RE also populated the database and performed beta test-ing. GM and MW are the principal curators of SPIKE. Allthe authors have read and approved the final version ofthe manuscript.
Appendix A – DB synchronizationSPIKE's DB synchronization module makes it possible forremote sites to receive and send updates from/to the cen-tral DB. Below we describe the logic of DB synchroniza-tion as implemented for remote sites and for the centralsite.
A snapshot of the central DB saved in XML format on theSPIKE web site, and is updated periodically. Upon initia-tion of the synchronization process at the remote site,SPIKE downloads the latest version of the central DB fromthe web site and compares it with the local DB. All entitiesin the SPIKE DB are tagged with an internal accession ID.This ID is unique, yet it is possible that the same objectwill temporarily have different accession IDs in differentDBs (e.g., the same regulation was defined by several usersat different sites). Therefore, objects in the central snap-shot that match those present in the remote DB are firstsought using SPIKE accession ID, and then by searchingfor objects with identical defining components. For exam-ple: families and complexes are defined by the set of theirgenes/proteins members; a regulation is defined by itssource, target and effect.
The synchronization process first handles entities andrelations that are present in both the local and centralDBs, starting with matching biological entities and proceed-ing to matching relations. The tool identifies differencesbetween matching objects (such as: the quality level of aregulation was changed at the central site; a supportingreference for a regulation was added at the remote site; amember of a family was deleted at the central site) andhandles these differences by the following logic: Each DB
change that is applied by a remote site is attached with achange-id, and for each remote site there is a record (last-review-change-id) for the last change that was alreadyreviewed by a curator at the central site. Then, if an objectthat is present in both DBs is attached with a change-id thatis smaller than the last-review-change-id (meaning thateither the object was changed by the central or otherremote sites, or that a change done by the remote site wasrejected by the central site), then the object's version of thecentral DB prevails and overwrites the local version. Oth-erwise (change-id is higher than the last-review-change-id),the local version of the object prevails and remains as is.
Following the handling of objects that are present in bothDBs, the procedure handles objects that exist in only oneof them: objects that exist only in the local DB remain asthey are and objects that exist only in the central snapshotare added to the local DB. At the end of the synchroniza-tion process, the application provides the user with a sum-mery of the updates made to the local database andcreates an XML snapshot of it, which is sent to SPIKE cen-tral site. Importantly, data uploaded at the remote site andflagged as private are excluded from the snapshot, ensur-ing the confidentiality of such data. A curator at the cen-tral site will review the snapshot sent by a remote site andintegrate it into the central DB.
The logic of DB synchronization carried out at the centralsite is similar to the one of the remote sites with the majordifference that while at remote sites local DB changes dueto synchronization are exerted automatically, at the cen-tral site all DB changes are presented to and manuallyreviewed by a curator (Additional file 1). These changesinclude differences between objects that are present inboth DBs and whose remote change-id is higher than thelast-review-change-id of that remote site, or objects foundonly in the remote DB. The curator examines these differ-ences and decides which to approve (possibly after someediting) and which to reject. A decision to reject mayinvolve a discussion with the author of the change inorder to understand the cause of disagreement. The statusflag of changes approved by the curator is set from draft toapproved. The central database is updated by the applica-tion according to the curator's decisions. When the updateis completed, the last-review-change-id parameter of thecorresponding remote site is updated, and a new snapshotof the central database is posted on the web site in XMLformat.
We have thoroughly tested the synchronization moduleand implemented an automatic benchmarking suit thatexamines proper functionality of the module both atremote and the central sites under different DB changescenarios (See Appendix B). A typical DB synchronization
Page 12 of 15(page number not for citation purposes)

BMC Bioinformatics 2008, 9:110 http://www.biomedcentral.com/1471-2105/9/110
takes approximately 5 minutes on a PC with at least 0.5GB RAM.
Appendix B – Benchmarking of DB synchronizationWe have implemented an automatic benchmarking suitthat examines proper functionality of the DB synchroniza-tion module both at remote and the central sites underdifferent DB change scenarios as listed below.
Remote sideThe tested scenarios for the remote site are:
1. Addition of a group by the remote-site – should not beaffected by synchronization
2. Deletion of a group by Central – should be removedfrom the remote site after synchronization
3. Addition of a group by central – should be added to theremote site after synchronization
4. Editing of an existing group locally – should not beaffected by synchronization
5. Editing of an existing group by Central – should beupdated at the remote site after synchronization
6. Editing of an existing group both locally and by Central– should not be affected by synchronization
7. Same tests for regulations and interactions.
Central sideThe tested scenarios for the central site are (the testsassume that the curator approved the change exerted bythe remote site):
1. A group deleted at the central site still exists in theremote site – the group should not be restored by synchro-nization
2. Addition of a group by Central – should not be affectedby synchronization
3. Addition of a group by the remote site – should beadded to the central site after synchronization
4. Editing of an existing group by the remote site – shouldbe updated at the central site after synchronization
5. Editing of an existing group by Central – should not beaffected by synchronization
6. Editing of an existing group both by a remote site andby Central – should accept remote changes
7. same tests for regulations and interactions
Appendix C – SPIKE XMLAs the information stored in the SPIKE database is funda-mentally different from that stored in reaction-based data-base, the widely accepted BioPax and SBML formats werenot found to be suitable for conveying SPIKE pathways.We thus developed a specialized XML schema for describ-ing a SPIKE pathway. Importantly, the same XML formatis used for all communications between SPIKE sites andfor storing pathway maps. Also, the format is extremelysimple and can be easily used for converting informationto and from other formats. Examples of XML files can befound on the SPIKE website (see Availability and require-ments section for url, follow the Maps link therein).
On the top level of the XML, <SpikeDatabase> conveysgeneral information on the version of the database fromwhich the pathways were extracted. On the next level thefollowing information is encapsulated into three blocks:
• <SiteBlock> contains information about SPIKE sites,intended for internal use of SPIKE. Each site is representedby a single <Site> tag
• <BuildingBlock> contains information about the basicentities in SPIKE.
• <RegulationBlock> contains information about the reg-ulations contained in the pathway.
• <InteractionBlock> contains information about theinteractions contained in the pathway.
The <BuildingBlock> contains entities referring to singlegenes/proteins or gene/protein groups:
• A <Gene> entity refers to a gene/protein and is linked toan EntrezGene identifier through an <XRef> tag. Informa-tion about the graphical properties of an entity, itsdescription and aliases are given in the <Display>,<Description> and <Alias> tags, respectively.
• A <Group> entity contains information about the twogroupings supported by SPIKE: complexes and families.These two groupings are distinguished by the typeattribute of the entity. The members of the group aredescribed in <Member> entities, each referring to an iden-tifier of another entity from the <BuildingBlock>.
The <RegulationBlock> contains <Regulation> entitiesdescribing regulations within the pathway. Recall that reg-
Page 13 of 15(page number not for citation purposes)

BMC Bioinformatics 2008, 9:110 http://www.biomedcentral.com/1471-2105/9/110
ulations in SPIKE are directed events (e.g., A activates/inhibits B) as opposed to mere interactions (which arefound in the <InteractionBlock>). The constituents of theregulation are referred to by the <Source>, <Target> and<PhysicalTarget> entities. Note that while the target of aregulation can be any entity from the <BuildingBlock> orfrom the <RegulationBlock>, the physical target and thesource are always entities from the <BuildingBlock>. Lit-erature support for each regulation entity is given in a<Reference> entity.
The <InteractionBlock> is generally similar to the <Regu-lationBlock>. It consists of <Interaction> entities,describing an undirected connection between a pair ofentities from the <BuildingBlock>, which are referred toby the <ProteinA> and <ProteinB> entities.
As an example, below we give SPIKE XML statements forthe three cartoon cases shown in Figures 3A–3C. For clar-ity, we include only the core parts of SPIKE XML formatand leave out additional attributes, such as links to otherdatabases, visual settings and information on the sourceand quality level of the regulations.
Figure 3A:
<Regulation id="B→C">
<Source ref="B"/>
<Target ref=" C"/>
<PhysicalTarget ref="C"/>
</Regulation>
<Regulation id="B→D">
<Source ref="B"/>
<Target ref=" D"/>
<PhysicalTarget ref="D"/>
</Regulation>
<Regulation id="B→E">
<Source ref="B"/>
<Target ref="E"/>
<PhysicalTarget ref="E"/>
</Regulation>
<Regulation id="A--| (B→C)">
<Source ref="A"/>
<Target ref="B→C"/>
<PhysicalTarget ref="B"/>
</Regulation>
Figure 3B:
<Regulation id="CHK2--| p53">
<Source ref="CHK2"/>
<Target ref=" p53"/>
<PhysicalTarget ref=" p53"/>
</Regulation>
Figure 3C:
<Regulation id="MDM2--| p53">
<Source ref=" MDM2"/>
<Target ref=" p53"/>
<PhysicalTarget ref=" p53"/>
</Regulation>
<Regulation id="CHK2--| (MDM2--| p53)">
<Source ref="CHK2"/>
<Target ref="MDM2--| p53"/>
<PhysicalTarget ref="p53"/>
</Regulation>
Additional material
Additional file 1Curator's report for DB synchronization. When synchronizing the cen-tral DB with a snapshot of a remote site DB, all DB differences are reported to the curator at the central site in such a report table. The curator manually reviews it and decides which changes to accept and which to reject.Click here for file[http://www.biomedcentral.com/content/supplementary/1471-2105-9-110-S1.ppt]
Page 14 of 15(page number not for citation purposes)

BMC Bioinformatics 2008, 9:110 http://www.biomedcentral.com/1471-2105/9/110
Publish with BioMed Central and every scientist can read your work free of charge
"BioMed Central will be the most significant development for disseminating the results of biomedical research in our lifetime."
Sir Paul Nurse, Cancer Research UK
Your research papers will be:
available free of charge to the entire biomedical community
peer reviewed and published immediately upon acceptance
cited in PubMed and archived on PubMed Central
yours — you keep the copyright
Submit your manuscript here:http://www.biomedcentral.com/info/publishing_adv.asp
BioMedcentral
AcknowledgementsThe development of SPIKE, formerly called SHARP, was supported by grants from the A-T Children's Project, by a Converging Technologies grant from the Israeli Science Foundation, and by ESBIC-D: European Systems Biology Initiative for combating Complex Diseases, a Coordinated Action under the EU Sixth Framework call for Life Sciences, Genomics and Bio-technology for Health. R. Elkon was supported by an Eshkol Fellowship from the Ministry of Science, Israel. I. Ulitsky and I. Zohar were supported by fellowships from the Edmond J. Safra Bioinformatics Program of Tel Aviv University. We thank Anna Pavtulov for her contribution to the develop-ment of the system.
References1. Milo R, Shen-Orr S, Itzkovitz S, Kashtan N, Chklovskii D, Alon U:
Network motifs: simple building blocks of complex net-works. Science 2002, 298:824-827.
2. Shen-Orr SS, Milo R, Mangan S, Alon U: Network motifs in thetranscriptional regulation network of Escherichia coli. NatGenet 2002, 31:64-68.
3. Karp PD: Pathway databases: a case study in computationalsymbolic theories. Science 2001, 293:2040-2044.
4. Overbeek R, Larsen N, Pusch GD, D'Souza M, Selkov E Jr, KyrpidesN, Fonstein M, Maltsev N, Selkov E: WIT: integrated system forhigh-throughput genome sequence analysis and metabolicreconstruction. Nucleic Acids Res 2000, 28:123-125.
5. Kanehisa M, Goto S, Kawashima S, Okuno Y, Hattori M: The KEGGresource for deciphering the genome. Nucleic Acids Res 2004,32:D277-280.
6. Joshi-Tope G, Gillespie M, Vastrik I, D'Eustachio P, Schmidt E, deBono B, Jassal B, Gopinath GR, Wu GR, Matthews L, Lewis S, BirneyE, Stein L: Reactome: a knowledgebase of biological pathways.Nucleic Acids Res 2005, 33:D428-432.
7. van Helden J, Naim A, Lemer C, Mancuso R, Eldridge M, Wodak SJ:From molecular activities and processes to biological func-tion. Brief Bioinform 2001, 2:81-93.
8. van Helden J, Naim A, Mancuso R, Eldridge M, Wernisch L, Gilbert D,Wodak SJ: Representing and analysing molecular and cellularfunction using the computer. Biol Chem 2000, 381:921-935.
9. Bader GD, Betel D, Hogue CW: BIND: the Biomolecular Inter-action Network Database. Nucleic Acids Res 2003, 31:248-250.
10. Demir E, Babur O, Dogrusoz U, Gursoy A, Nisanci G, Cetin-AtalayR, Ozturk M: PATIKA: an integrated visual environment forcollaborative construction and analysis of cellular pathways.Bioinformatics 2002, 18:996-1003.
11. Kitano H, Funahashi A, Matsuoka Y, Oda K: Using process dia-grams for the graphical representation of biological net-works. Nat Biotechnol 2005, 23:961-966.
12. Dahlquist KD, Salomonis N, Vranizan K, Lawlor SC, Conklin BR:GenMAPP, a new tool for viewing and analyzing microarraydata on biological pathways. Nat Genet 2002, 31:19-20.
13. Shannon P, Markiel A, Ozier O, Baliga NS, Wang JT, Ramage D, AminN, Schwikowski B, Ideker T: Cytoscape: a software environmentfor integrated models of biomolecular interaction networks.Genome Res 2003, 13:2498-2504.
14. Aladjem MI, Pasa S, Parodi S, Weinstein JN, Pommier Y, Kohn KW:Molecular interaction maps–a diagrammatic graphical lan-guage for bioregulatory networks. Sci STKE 2004, 2004:pe8.
15. Kohn KW: Molecular interaction maps as information organ-izers and simulation guides. Chaos 2001, 11:84-97.
16. Maglott D, Ostell J, Pruitt KD, Tatusova T: Entrez Gene: gene-centered information at NCBI. Nucleic Acids Res 2005,33:D54-58.
17. van den Bosch M, Bree RT, Lowndes NF: The MRN complex:coordinating and mediating the response to broken chromo-somes. EMBO Rep 2003, 4:844-849.
18. ChEBI [http://www.ebi.ac.uk/chebi/]19. Kanehisa M, Goto S: KEGG: kyoto encyclopedia of genes and
genomes. Nucleic Acids Res 2000, 28:27-30.20. Kerrien S, Alam-Faruque Y, Aranda B, Bancarz I, Bridge A, Derow C,
Dimmer E, Feuermann M, Friedrichsen A, Huntley R, Kohler C,Khadake J, Leroy C, Liban A, Lieftink C, Montecchi-Palazzi L, OrchardS, Risse J, Robbe K, Roechert B, Thorneycroft D, Zhang Y, Apweiler
R, Hermjakob H: IntAct–open source resource for molecularinteraction data. Nucleic Acids Res 2007, 35:D561-565.
21. Stelzl U, Worm U, Lalowski M, Haenig C, Brembeck FH, Goehler H,Stroedicke M, Zenkner M, Schoenherr A, Koeppen S, Timm J, Mint-zlaff S, Abraham C, Bock N, Kietzmann S, Goedde A, Toksoz E,Droege A, Krobitsch S, Korn B, Birchmeier W, Lehrach H, WankerEE: A human protein-protein interaction network: a resourcefor annotating the proteome. Cell 2005, 122:957-968.
22. Rual JF, Venkatesan K, Hao T, Hirozane-Kishikawa T, Dricot A, Li N,Berriz GF, Gibbons FD, Dreze M, Ayivi-Guedehoussou N, Klitgord N,Simon C, Boxem M, Milstein S, Rosenberg J, Goldberg DS, Zhang LV,Wong SL, Franklin G, Li S, Albala JS, Lim J, Fraughton C, Llamosas E,Cevik S, Bex C, Lamesch P, Sikorski RS, Vandenhaute J, Zoghbi HY, etal.: Towards a proteome-scale map of the human protein-protein interaction network. Nature 2005, 437:1173-1178.
23. Lim J, Hao T, Shaw C, Patel AJ, Szabo G, Rual JF, Fisk CJ, Li N, SmolyarA, Hill DE, Barabasi AL, Vidal M, Zoghbi HY: A protein-proteininteraction network for human inherited ataxias and disor-ders of Purkinje cell degeneration. Cell 2006, 125:801-814.
24. Ewing RM, Chu P, Elisma F, Li H, Taylor P, Climie S, McBroom-Cera-jewski L, Robinson MD, O'Connor L, Li M, Taylor R, Dharsee M, HoY, Heilbut A, Moore L, Zhang S, Ornatsky O, Bukhman YV, Ethier M,Sheng Y, Vasilescu J, Abu-Farha M, Lambert JP, Duewel HS, StewartII, Kuehl B, Hogue K, Colwill K, Gladwish K, Muskat B, et al.: Large-scale mapping of human protein-protein interactions bymass spectrometry. Mol Syst Biol 2007, 3:89.
25. BioPAX [http://www.biopax.org/]26. SPIKE [http://www.cs.tau.ac.il/~spike]27. Linhart C, Elkon R, Shiloh Y, Shamir R: Deciphering transcrip-
tional regulatory elements that encode specific cell cyclephasing by comparative genomics analysis. Cell Cycle 2005,4:1788-1797.
28. Elkon R, Linhart C, Halperin Y, Shiloh Y, Shamir R: Functionalgenomic delineation of TLR-induced transcriptional net-works. BMC Genomics 2007, 8:394.
29. Shamir R, Maron-Katz A, Tanay A, Linhart C, Steinfeld I, Sharan R, Shi-loh Y, Elkon R: EXPANDER–an integrative program suite formicroarray data analysis. BMC Bioinformatics 2005, 6:232.
30. Ulitsky I, Shamir R: Identification of functional modules usingnetwork topology and high-throughput data. BMC Syst Biol2007, 1:8.
31. Hirao A, Kong YY, Matsuoka S, Wakeham A, Ruland J, Yoshida H, LiuD, Elledge SJ, Mak TW: DNA damage-induced activation of p53by the checkpoint kinase Chk2. Science 2000, 287:1824-1827.
Page 15 of 15(page number not for citation purposes)