blue label telecomsblue label telecoms · blue label telecomsblue label telecoms ... • bangladesh...
TRANSCRIPT

Blue Label TelecomsBlue Label TelecomsFinal Results Presentation
for the year ended 31 May 2009y y

AGENDA
• Strategic Overview
• International Distribution
• Technologygy
• Value Added Services
• Financial OverviewFinancial Overview
• South African Distribution
Way Forward• Way Forward

Strategic Overview
Mark LevyMark LevyJoint CEO
3

Group Structure
South African Distribution International Distribution Technology Value Added Services
The Prepaid Company Gold Label Activi Technology Services Datacel
Crown Cellular Oxigen Services India - Transaction Junction - CellfindCrown Cellular 37.22% 60% Cellfind
Ventury Ukash – 16.9% Activi Deployment Services Content Connect Africa
Blue Label OneMatragon APS - 72% Blue Label Onet/a Mobile Services Company
(MSC)Kwikpay APS DRC - 90%
Virtual Voucher APS MOZAMBIQUE - 80%
APS NIGERIA - 51%
Blue Label Mexico - 70%
Sharedphone 50.1%
• 100% unless otherwise stated
4
Blue Label Australasia 50.5%

The Telecoms Landscape
• Emerging markets have continued to grow, g g g ,posting growth figures in the single digits instead of double-digit expansion
• In South Africa Prepaid ARPU is stableIn South Africa, Prepaid ARPU is stable• In the less evolved markets consumer
expenditure is also largely stable or dropping only slightlydropping only slightly
• Total mobile subscribers or SIMs in the local market are expected to reach 56 million by the end of 2009
• Mobile penetration expected to increase from 122% to over 150% by 2013y
• South African cellular market surpassed the 50-million connections milestone at the end of 2008 although only 68% of theseof 2008, although only 68% of these represented individual users
Source: (1) Creamer Media’s Engineering News Online; 31 July 2009; “SA cellular market exceeds 50 million connections mark (2) IDC EMCA Telecoms Services Dababase, Q1 2009 5

Global footprint
Bricks & mortarTechnology offerings
Af h i t
United Kingdom
• Afghanistan• Bangladesh• Benin• Botswana• Cyprus• Czech Republic• France• Germany• Ghana• Guinea BissauKingdom
I di
• Greece• Haiti• Indonesia• Ireland• Israel• Italy• Ivory Coast• Lesotho• Liberia• Middle East Region
Mexico
DRC
India
Nigeria
• Middle East Region• Netherlands• Pakistan• Poland• Russia• Rwanda• Sierra Leone• Spain• Sudan• Swaziland
S d
South AfricaMozambique Australia
• Sweden• Syria• Tanzania• Togo• Uganda• USA• Yemen• Zimbabwe
Two strategies for international expansion:- Bricks and Mortar
- Technology Offerings
6
BLT is focused on servicing the unbanked and badly banked market by providing access to cost effective transactional services

International Distribution
Mark LevyMark LevyJoint CEO
7

International Operations
overview• Enhance all technology offerings
• Continue to focus on growth of footprint• Continue to focus on growth of footprint
• Introduce to existing markets all Blue Label Telecoms’ products and services
• Providing additional tokens of value• Providing additional tokens of value, enhancing each country’s service offering and revenue streams
• Improved melded margin
8

I diIndia
Total connections 430,290,998
% Growth in total connections p.a. 48.48%
Prepaid as % of total connections 85.14%
Market penetration 30.34%
Prepaid ARPU (USD/month) 4.50
9

Consolidation of Oxigen India
• Proactive reduction in operating costs and cost management
• Revision of sales and revenue-generation strategies through:
- Rejuvenation, recovery and re-deployment of POS devices
- Higher rate of integration into retail
- Additional POS devices due to improved technical competence
- Direct Top-Up comprising 70% of prepaid recharge market
- Further expansion of product offering – in addition to airtime, rail, and toll
• Consolidation of technology solution and competencies including:
- Backend management and maintenance
- Hardware enhancements with increased capacity and capabilities
- Improved communications connectivity and reliability
10

Oxigen India
• Consolidation of the retail base• Consolidation of the retail base- Selling base increased during the period
Average sale per store increased- Average sale per store increased
- Selling Web vending sites and average sales per site doubled during the period
• Airtime sales growth- Sales Revenues grew consistently
• Oxicash
- Steady growth with a total in excess of 1.1 million wallets by the end of May 2009
11

Oxigen India – Breakthrough Initiatives
state bank of india• PINless top-up of airtime and Oxicash on mobile to consumer• Integration complete and live beta testing commenced
nokia ovi store• Oxicash is the exclusive mobile transactional partner for all Nokia products• Fulfill Nokia Extended Warranty
nokia – ovi store
• Oxigen for airtime sales through all Nokia branches
bank switch• mCheck – integrated and deployed for Oxigen and subsequent Oxicash
integration• Obopay – integration has commenced
• Improve connectivity, contain communications costs and reduce barrier to new cdma pos terminal roll-out
entry for new POS sites
12

M iMexico
Total connections 87,079,422
% Growth in total connections p.a. 13.47%p
Prepaid as % of total connections 88.62%
Market penetration 70.46%
Prepaid ARPU (USD/month) 8.31Prepaid ARPU (USD/month) 8.31
13

Blue Label Mexico
• Localisation, customisation and ,enhancements to the Blue Label AEON platform saw launch and commencement of trading in May 2009trading in May 2009
• Enhanced technology provides PINless h l ti b irecharge on a real-time basis
• Public Telephony launch in conjunction with p y jTelefonica, utilising our Sharedphone product and service, commenced in 2009 with a pilot of 2,000 units through towith a pilot of 2,000 units through to September
14
Blue Label Mexico
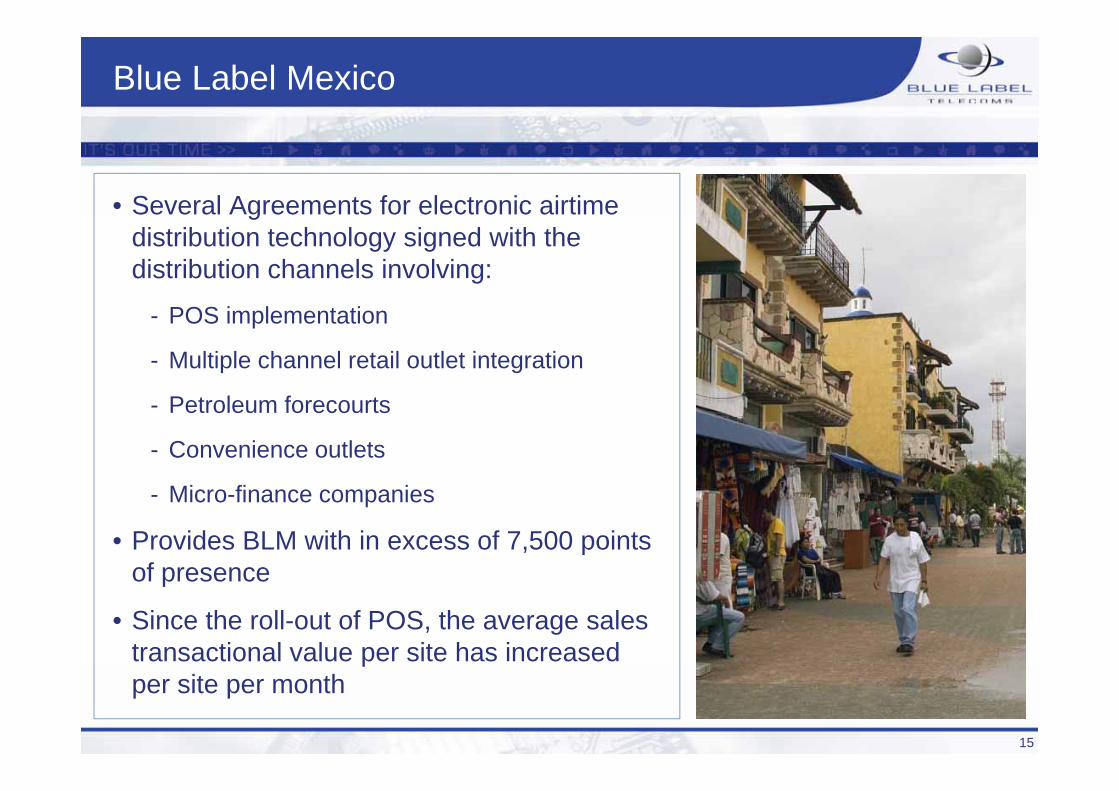
• Several Agreements for electronic airtime gdistribution technology signed with the distribution channels involving:
- POS implementation
- Multiple channel retail outlet integration
f- Petroleum forecourts
- Convenience outlets
Mi fi i- Micro-finance companies
• Provides BLM with in excess of 7,500 points of presenceof presence
• Since the roll-out of POS, the average sales transactional value per site has increased pper site per month
15

United Ki dKingdom
16

Ukash
• Consumer ability to Cash In, elect to y ,transact online or in a mobile environment, and to Cash Out at their convenience
• The business model of Ukash and its easeThe business model of Ukash and its ease of integration to third party devices and technology provides for rapid deployment and broad coverage based on the existingand broad coverage based on the existing retail presence of the third party
• Points of presence have grown – giving Uk h i i l t t i EUkash more issuing real estate in Europe and abroad as follows:
- Continued growth in EuropeR i d i t t i th USA- Remained consistent in the USA
- Launched in South Africa through BLT channels, Pick ‘n PayR tl l h d i A t li- Recently launched in Australia
17

Ukash
status• Points of Sale network continues to increase
through 7 new marketsP t S i id idi• Payment Service providers are now providing expansion of Merchant acceptance
• Physical outlets expanded in Portugal, ItalyPhysical outlets expanded in Portugal, Italy Germany, France, Belgium, Slovenia, Poland and Australia
• Growth continues per annum• MasterCard selected Ukash for Europe for re-
PowerPower• AUTP selected Ukash for cash payment for
airline industry• Spain – issuance of Ukash through ATM
18

Ukash – Successes over last 6 months
• Live in
- Portugal, Italy, Slovenia and Australia
• On-line issueOn line issue
- Buying Ukash online through bank account
• SkypeSkype
- Extended Ukash offering in Russia and Ukraine
• Key payment
• Service provider in South Africa
19

African Prepaid Services
20

Africa Prepaid Services
Nigeria
Democratic Republic of CCongo
Mozambique
21

Africa Prepaid Services (“APS”)
group• APS SA is responsible for implementation
of our African expansion initiative
• APS concluded an agreement with Multilinks-Telkom for Nigeria
• Set up in Nigeria necessitated employment of skilled and experienced staff subsequently transferred across to q yNigeria
22
Africa Prepaid Services
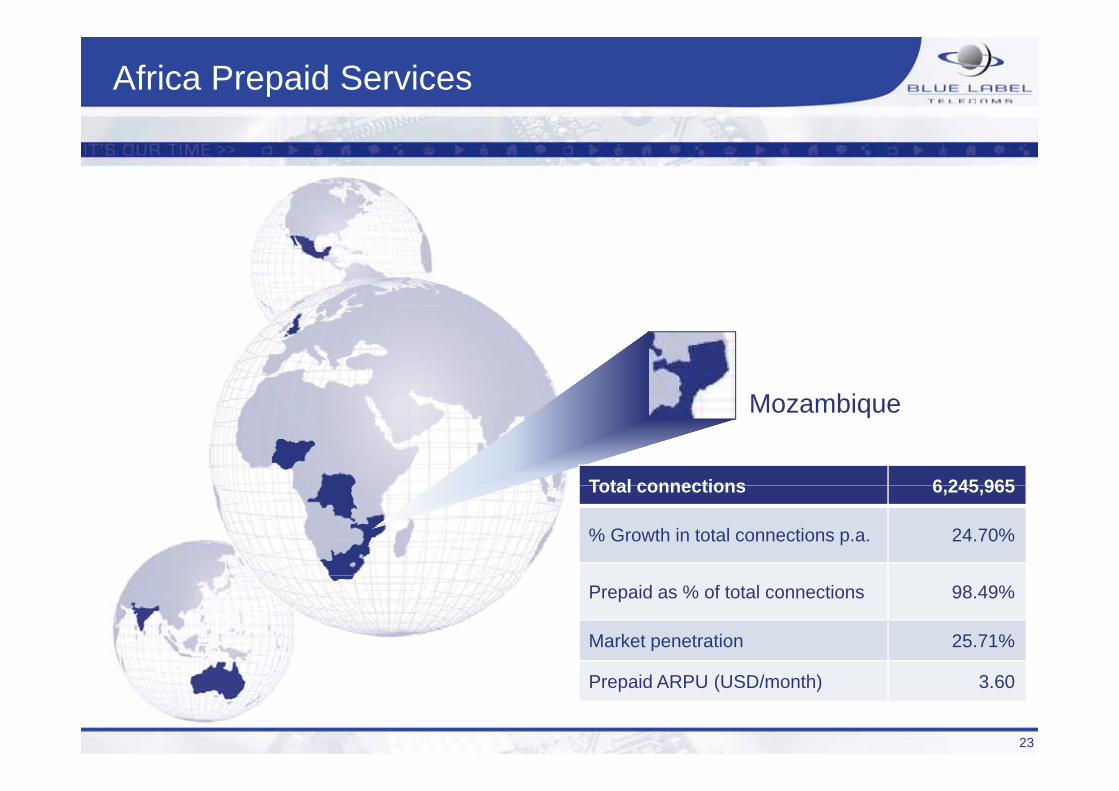
M biMozambique
Total connections 6 245 965Total connections 6,245,965
% Growth in total connections p.a. 24.70%
Prepaid as % of total connections 98.49%
Market penetration 25.71%
23
Prepaid ARPU (USD/month) 3.60

Africa Prepaid Services
mozambique• Expansion programme launched and
commencing through:
- Increase in cash generating assets
- Additional 5 new branches became fully ti l i loperational in more rural areas as per
Vodacom
• Started showing monthly improvement with• Started showing monthly improvement with the upward trend expected to continue in growth and profitability
• Awarded “Best Distributor of the Year” by Vodacom for the third consecutive year
24

Africa Prepaid Services
Democratic Republic of C
Total connections 10 990 451
Congo
Total connections 10,990,451
% Growth in total connections p.a. 37.22%
Prepaid as % of total connections 98.09%
Market penetration 14.78%
25
Prepaid ARPU (USD/month) 4.85

Africa Prepaid Services
democratic republic of congo• Operational changes over the past year:
- Extended Contractual arrangements with V d DRCVodacom DRC
• Focus on only:
V d i b lk i ti- Vodoxi – bulk printing
- Public telephony
SIM t t k ith i t d- SIM starter packs with no associated distribution costs and on-going airtime revenues
- Airtime sales – subject to discount provided and market conditions
26

Africa Prepaid Services
Ni iNigeria
Total connections 82 525 542Total connections 82,525,542
% Growth in total connections p.a. 55.93%
Prepaid as % of total connections 98.48%
Market penetration 45.11%
27
Prepaid ARPU (USD/month) 10.00

Africa Prepaid Services
nigeria• Signed a contract with Multilinks Telkom to
exclusively provide all mobile distribution and value-added services on behalf of thisand value added services on behalf of this CDMA operator in Nigeria
• APS Nigeria commenced trading in MayAPS Nigeria commenced trading in May 2009
• May sales met expectations and y psubsequent months have continued to yield similar results
28

Africa Prepaid Services
nigeria• May sales were on track with budget and
Multilink-Telkom’s prior periods:
M 2009 th i i ti l A il- May 2009 growth in airtime sales up on April 2009
- In excess of 50,000 new handset connectedIn excess of 50,000 new handset connected in May
• Increased subscriber base with more thl timonthly connections
• Increased value-added services offered by Multilinks Telkom to increase usageMultilinks-Telkom to increase usage patterns
29

Technology
Mark LevyMark LevyJoint CEO
30

Activi
switching overview
POSTILION SwitchElectricity Cellular
NetworksVouchers(Ukash)
Banking(TJ)3rd Party Suppliers
AEON Switch3rd
PartyHost to Host
3rd Party Hosts
STD Accounting
Interface D t b
Accounting Package
AEONMerchant Terminal
Management
Database
Terminals Vending/ Touch WEB Bulk Integrated
Management System & EVD
Terminals gSelf Service Screen Browser Printing
g3rd Party
Retail devices31

Services
EFT Switching Platform
Core IT Infrastructure & Operational Platform
GroupMIS Pl tf
& Operational Support
EVD/VAS Platform
MIS Platform (and Accounting
/ Financial Management)
Card Management Platform (Gift
Cards/
Factory
Cards/ Loyalty)
Device Deployment & Support
32

The Mobile Services Company
• MSC launched mibli™ in June ’08 – rapid growth millions
• On-device portal to services, products & mobi-wallet• Supported by MSC and Activi AEON back-end systems• Launched MSC services for 3rd parties• Launched key new products and services:• Launched key new products and services:
- callink – low cost international calling- moova – music and content subscription service- mobi wallet – full-featured mobile wallet- msc media – groupwide advertising sales
• Key drivers:- Highly mobile-centric customers- Demographics centered on young adultsg p y g- Ownership of verticals & horizontals- Integration of transactionality- Economics of consumer spending patterns
Future:• Future:- International expansion of mibli™ user base- Growth in MSC services to 3rd parties- Expansion of subscription services- Extension of mobi wallet services to 3rd parties- Rapid enhancement of products & services on mibli™
33
Value Added Services
Mark LevyJoint CEO
34
Datacel
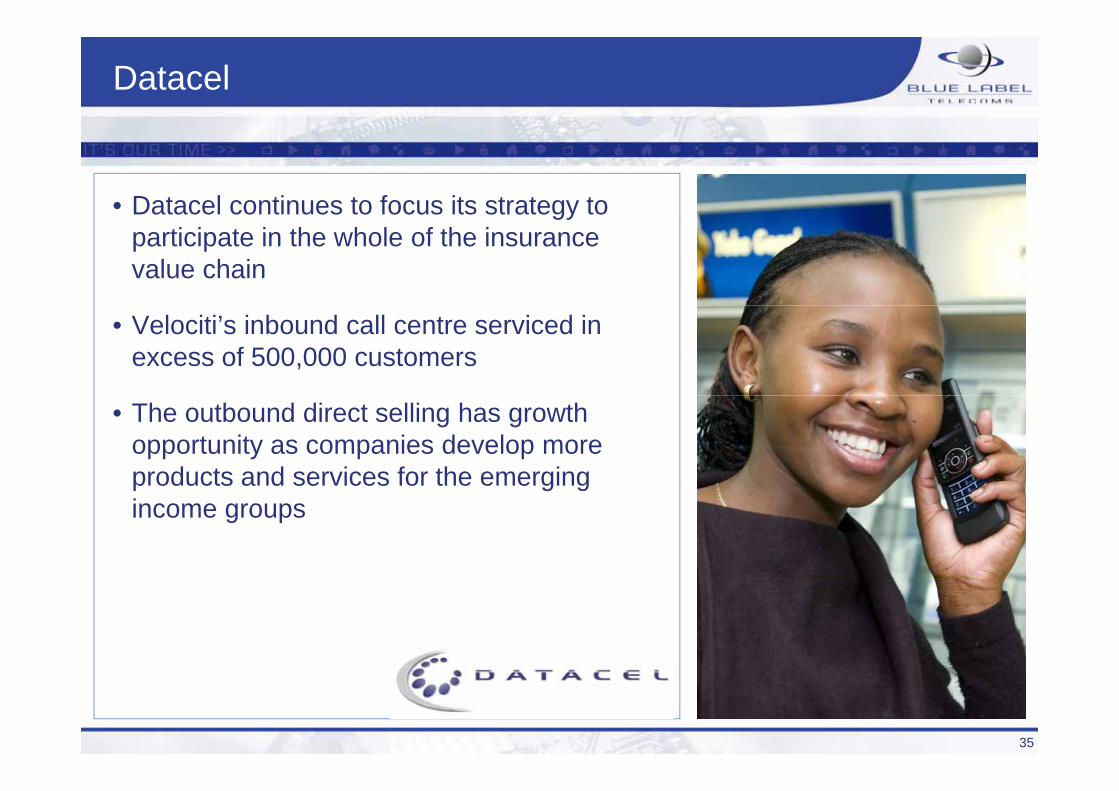
• Datacel continues to focus its strategy to gyparticipate in the whole of the insurance value chain
• Velociti’s inbound call centre serviced in excess of 500,000 customers
• The outbound direct selling has growth opportunity as companies develop more products and services for the emergingproducts and services for the emerging income groups
35

Cellfind
• Location-Based Services (LBS)( )- Vodacom
- MTN
• WASP Services- SMS, MMS, USSD
- Network billing etc.g
• Key drivers:- Network Operator performance & co-
marketingmarketing
- Uptake of new MTN and Traffic services
- New Value-added LBS products
- Extended WASP service offerings
- Extended White label offerings
- Changes in Network Billing Rulesg g
- Changes in WASPA Code of Conduct
36

Cellfind
future• Significant growth prospects for newly
launched MTN 2MyAid, MTN WhereRU and miTRAFFIC over the next 12 months
• White-Label offerings to be extended to:- Music/Content- Panic Buttons to Corporates- Panic Buttons to Corporates
• Corporate offerings with lower churn (Capitated Schemes)E i f B2C ff i l ti t• Expansion of B2C offerings relating to:
- Traffic- Weather- Content- LBS
• Look4info –corporate and consumer LBS-based information service to be launched 2009
37

Content Connect Africa
• Digital and Mobile Content Distribution
• Dominant player for South African & African independent music content
K t t t f• Key content aggregators for:
- MTN
- Vodacom- Vodacom
• Future:- Further integrated offerings with group subsidiaries.- Expanded on-deck distribution into multiple African
territories- Increased consumption of mobile content through p g
expanded group and 3rd party channels, e.g. mibli™ and the Mobile Services Company platform
38

Microsoft
• Past 18 months, working with Microsoft on the next generation of mobile services for the mass market.
• August 2009 – worldwide launch by Blue Label and Microsoft of mibli™ v7 based on the Microsoft OneApp mobile software
• Integrated eco-system consisting of Blue Label’s TRANSACTIONAL layer (Activi), Blue Label’s MOBILE SERVICES layer (MSC) and Microsoft’s OneApp on-phone software (owning the vertical), creating significant convergence
• Brings app-store functionality to the world’s phonesBrings app store functionality to the world s phones• Ease of creating and deploying new applications (owning the
horizontal)• Leverages massive Microsoft development community• Allows cross-network transactionality• Integrates entertainment & fun with utility, cost savings and
features never previously available in developing world markets• Creates massive entrepreneurial and social upliftment
opportunities• Provides cost savings and features previously unavailable to
usersusers• Plans to expand range and scope of services as well as into
new territories and existing user bases39

Financial Overview
David RivkindCFO
40

Financial highlights
Actual growth
Revenue R15.3bn 22%
EBITDA R568m
Operating profit R475m
73%
76%
NPAT R391m 116%
Core earnings R427m
Headline earnings per share 51.63 cents
58%
71%
Core earnings per share 55.93 cents 22%
Cash generated from operations R667m Xx%
41

Financial overview
Income statement31 May 2009 31 May 2008
Actual Core pro formaaudited unaudited Growthaudited unaudited GrowthR’000 R’000
Revenue 15 281 449 12 930 609 18%Cost of inventories sold (14 215 840) (12 211 507)Gross profit 1 065 609 719 102 48%Gross profit % 6.97% 5.56%Other income 22 368 68 142Overheads (519 910) (351 315)EBITDA 568 067 435 929 30%EBITDA % 3 72% 3 37%EBITDA % 3.72% 3.37%Depreciation, amortisation and impairment charges (93 220) (73 675)Operating profit 474 847 362 254 31%Net finance income 92 347 132 866Finance income 205 046 239 470Finance expense (112 699) (106 604)Net profit before taxation 567 194 495 120Taxation (174 784) (138 929)Net profit after taxation 392 410 356 191Share of loss of associates and joint ventures (27 445) (19 661)Share of loss of associates and joint ventures (27 445) (19 661)Minorities interest 25 582 (507)Net profit after taxation and minority interest 390 547 336 023 16%Amortisation on intangibles raised through business combinations net of tax 36 653 34 919Core net profit after taxation 427 200 370 942 15%Earnings per share for profit attributable to equity holders (cents)- Basic 51.13 43.85 17%- Headline 51.63 43.55 19%
42

Financial Overview
segmental profile• South African distribution
• International distribution
• Value added services
• TechnologyTechnology

Financial overview
Income statement31 May 2009 31 May 2008
Actual Core pro formaaudited unaudited Growth
Revenue 15 281 449 12 930 609 18%Cost of inventories sold (14 215 840) (12 211 507)Gross profit 1 065 609 719 102 48%
audited unaudited GrowthR’000 R’000
Segmental revenueGross profit % 6.97% 5.56%Other income 22 368 68 142Overheads (519 910) (351 315)EBITDA 568 067 435 929 30%EBITDA % 3 72% 3 37%
South African distribution 14 199 031 12 194 815 16.4%International distribution 724 163 500 268 44.8%Value added services 335 743 207 676 61.7%EBITDA % 3.72% 3.37%Depreciation, amortisation and impairment charges (93 220) (73 675)Operating profit 474 847 362 254 31%Net finance income 92 347 132 866Finance income 205 046 239 470
Technology 22 512 27 850 (19.2%)Total 15 281 449 12 930 609 18.2%
% Contribution% ContributionFinance expense (112 699) (106 604)Net profit before taxation 567 194 495 120Taxation (174 784) (138 929)Net profit after taxation 392 410 356 191Share of loss of associates and joint ventures (27 445) (19 661)
% Contribution% Contribution
South African distribution 92.9% 94.3%International distribution 4.8% 3.9%Value added services 2 2% 1 6%Share of loss of associates and joint ventures (27 445) (19 661)Minorities interest 25 582 (507)Net profit after taxation and minority interest 390 547 336 023 16%Amortisation on intangibles raised through business combinations net of tax 36 653 34 919Core net profit after taxation 427 200 370 942 15%
Value added services 2.2% 1.6%Technology 0.1% 0.2%Total 100% 100%
Earnings per share for profit attributable to equity holders (cents)- Basic 51.13 43.85 17%- Headline 51.63 43.55 19%
44

Financial overview
Income statement31 May 2009 31 May 2008
Actual Core pro formaaudited unaudited Growth
Revenue 15 281 449 12 930 609 18%Cost of inventories sold (14 215 840) (12 211 507)Gross profit 1 065 609 719 102 48%
audited unaudited GrowthR’000 R’000
Gross profit % 6.97% 5.56%Other income 22 368 68 142Overheads (519 910) (351 315)EBITDA 568 067 435 929 30%EBITDA % 3 72% 3 37%
Segmental gross profit
EBITDA % 3.72% 3.37%Depreciation, amortisation and impairment charges (93 220) (73 675)Operating profit 474 847 362 254 31%Net finance income 92 347 132 866Finance income 205 046 239 470
South African distribution 813 590 545 771International distribution 75 488 63 441Value added services 160 903 92 108Technology 15 628 17 782
Finance expense (112 699) (106 604)Net profit before taxation 567 194 495 120Taxation (174 784) (138 929)Net profit after taxation 392 410 356 191 11%Share of loss of associates and joint ventures (27 445) (19 661)
Total 1 065 609 719 102
Gross profit %Gross profit %
Share of loss of associates and joint ventures (27 445) (19 661)Minorities interest 25 582 (507)Net profit after taxation and minority interest 390 547 336 023 16%Amortisation on intangibles raised through business combinations net of tax 36 653 34 919Core net profit after taxation 427 200 370 942 15%
South African distribution 5.73% 4.48%International distribution 10.41% 12.68%Value added services 47.92% 44.35%Technology 69.43% 63.85%Earnings per share for profit attributable to equity holders (cents)- Basic 51.13 43.85 17%- Headline 51.63 43.55 19%
Total 6.97% 5.56%
45

Financial overview
Income statement31 May 2009 31 May 2008
Actual Core pro formaaudited unaudited Growth
Revenue 15 281 449 12 930 609 18%Cost of inventories sold (14 215 840) (12 211 507)Gross profit 1 065 609 719 102 48%
Segmental EBITDA margins EBITDA margin %South African distribution 4.40% 3.50%International distribution 0.85% 4.37%
audited unaudited GrowthR’000 R’000
Gross profit % 6.97% 5.56%Other income 22 368 68 142Overheads (519 910) (351 315)EBITDA 568 067 435 929 30%EBITDA % 3 72% 3 37%
Value added services 22.41% 22.70%Total trading operations 4.63% 3.84%
EBITDA % 3.72% 3.37%Depreciation, amortisation and impairment charges (93 220) (73 675)Operating profit 474 847 362 254 31%Net finance income 92 347 132 866Finance income 205 046 239 470
Segmental EBITDA
South African distribution 624 346 426 245 47%Finance expense (112 699) (106 604)Net profit before taxation 567 194 495 120Taxation (174 784) (138 929)Net profit after taxation 392 410 356 191Share of loss of associates and joint ventures (27 445) (19 661)
South African distribution 624 346 426 245 47%International distribution 6 144 21 873 (72%)Value added services 75 239 46 866 61%Total trading operations 705 729 494 984 43%Technology (48 502) (9 929)Share of loss of associates and joint ventures (27 445) (19 661)Minorities interest 25 582 (507)Net profit after taxation and minority interest 390 547 336 023 16%Amortisation on intangibles raised through business combinations net of tax 36 653 34 919Core net profit after taxation 427 200 370 942 15%
Technology (48 502) (9 929)Corporate (89 160) (49 126)Total support (137 662) (59 055)Total 568 067 435 929 30%
Earnings per share for profit attributable to equity holders (cents)- Basic 51.13 43.85 17%- Headline 51.63 43.55 19%
46

Financial overview
Income statement31 May 2009 31 May 2008
Actual Core pro formaaudited unaudited Growth
Revenue 15 281 449 12 930 609 18%Cost of inventories sold (14 215 840) (12 211 507)Gross profit 1 065 609 719 102 48%
audited unaudited GrowthR’000 R’000
Gross profit % 6.97% 5.56%Other income 22 368 68 142Overheads (519 910) (351 315)EBITDA 568 067 435 929 30%EBITDA % 3 72% 3 37%EBITDA % 3.72% 3.37%Depreciation, amortisation and impairment charges (93 220) (73 675)Operating profit 474 847 362 254 31%Net finance income 92 347 132 866Finance income 205 046 239 470Finance expense (112 699) (106 604)Net profit before taxation 567 194 495 120Taxation (174 784) (138 929)Net profit after taxation 392 410 356 191Share of loss of associates and joint ventures (27 445) (19 661)• The group earned finance income of R205m
I t d i t t i bl d bt b l R47 (R16 i i i d)Share of loss of associates and joint ventures (27 445) (19 661)Minorities interest 25 582 (507)Net profit after taxation and minority interest 390 547 336 023 16%Amortisation on intangibles raised through business combinations net of tax 36 653 34 919Core net profit after taxation 427 200 370 942 15%
• Imputed interest receivable on debtors balances – R47m (R16m in prior period)• Interest on liquid working capital – R158m• Decline in finance income of R65m net of this IFRS adjustment due to:
• Cash resources utilised to gain early settlement discounts
Earnings per share for profit attributable to equity holders (cents)- Basic 51.13 43.85 17%- Headline 51.63 43.55 19%
• Interest forfeiture due to acquisitions • Gradual decline in interest rates.
47

Financial overview
Income statement31 May 2009 31 May 2008
Actual Core pro formaaudited unaudited Growth
Revenue 15 281 449 12 930 609 18%Cost of inventories sold (14 215 840) (12 211 507)Gross profit 1 065 609 719 102 48%
audited unaudited GrowthR’000 R’000
Gross profit % 6.97% 5.56%Other income 22 368 68 142Overheads (519 910) (351 315)EBITDA 568 067 435 929 30%EBITDA % 3 72% 3 37%EBITDA % 3.72% 3.37%Depreciation, amortisation and impairment charges (93 220) (73 675)Operating profit 474 847 362 254 31%Net finance income 92 347 132 866Finance income 205 046 239 470Finance expense (112 699) (106 604)Net profit before taxation 567 194 495 120Taxation (174 784) (138 929)Net profit after taxation 392 410 356 191Share of loss of associates and joint ventures (27 445) (19 661)• R108m relates to imputed interest payable on creditors’ balances in terms of IFRS (R101m in prior period)Share of loss of associates and joint ventures (27 445) (19 661)Minorities interest 25 582 (507)Net profit after taxation and minority interest 390 547 336 023 16%Amortisation on intangibles raised through business combinations net of tax 36 653 34 919Core net profit after taxation 427 200 370 942 15%Earnings per share for profit attributable to equity holders (cents)- Basic 51.13 43.85 17%- Headline 51.63 43.55 19%
48

Financial overview
Income statement31 May 2009 31 May 2008
Actual Core pro formaaudited unaudited Growth
Revenue 15 281 449 12 930 609 18%Cost of inventories sold (14 215 840) (12 211 507)Gross profit 1 065 609 719 102 48%
audited unaudited GrowthR’000 R’000
Gross profit % 6.97% 5.56%Other income 22 368 68 142Overheads (519 910) (351 315)EBITDA 568 067 435 929 30%EBITDA % 3 72% 3 37%
• Oxigen Services India• Revenue increased by 31% from R1.02bn to R1.34bn.EBITDA % 3.72% 3.37%Depreciation, amortisation and impairment charges (93 220) (73 675)Operating profit 474 847 362 254 31%Net finance income 92 347 132 866Finance income 205 046 239 470
Revenue increased by 31% from R1.02bn to R1.34bn.• Improvement in company’s performance in the last quarter
• Ukash• Purchased for strategic reasons – technology offering in line with group’s objective to increase value added servicesFinance expense (112 699) (106 604)Net profit before taxation 567 194 495 120Taxation (174 784) (138 929)Net profit after taxation 392 410 356 191Share of loss of associates and joint ventures (27 445) (19 661)
• Purchased for strategic reasons technology offering in line with group s objective to increase value added services
Share of loss of associates and joint ventures (27 445) (19 661)Minorities interest 25 582 (507)Net profit after taxation and minority interest 390 547 336 023 16%Amortisation on intangibles raised through business combinations net of tax 36 653 34 919Core net profit after taxation 427 200 370 942 15%
Oxigen Services India Pvt Ltd (25 940) (19 661) (32%)Smart Voucher Limited (Ukash) (2 286) - -Other 781 - -Earnings per share for profit attributable to equity holders (cents)- Basic 51.13 43.85 17%- Headline 51.63 43.55 19%
Total (27 445) (19 661) (40%)
49

Financial overview
Income statement31 May 2009 31 May 2008
Actual Core pro formaaudited unaudited Growth
Revenue 15 281 449 12 930 609 18%Cost of inventories sold (14 215 840) (12 211 507)Gross profit 1 065 609 719 102 48%
audited unaudited GrowthR’000 R’000
Core net profit
Gross profit % 6.97% 5.56% 25%Other income 22 368 68 142Overheads (519 910) (351 315)EBITDA 568 067 435 929 30%EBITDA % 3 72% 3 37% 10%
South African distribution 537 815 407 320 130 495International distribution 17 279 10 601 6 678International distribution associates (28 226) (19 661) (8 565)EBITDA % 3.72% 3.37% 10%Depreciation, amortisation and impairment charges (93 220) (73 675)Operating profit 474 847 362 254 31%Net finance income 92 347 132 866Finance income 205 046 239 470
Value added services 49 497 33 450 16 047Total operations 576 365 431 710 144 655
Technology (55 250) (11 339) (43 911)
Finance expense (112 699) (106 604)Net profit before taxation 567 194 495 120Taxation (174 784) (138 929)Net profit after taxation 392 410 356 191 11%Share of loss of associates and joint ventures (27 445) (19 661)
Corporate (93 915) (49 429) (44 486)Total support (149 165) (60 768) (88 397)
Total 427 200 370 942 56 258C i h 55 93 48 40 7 53Share of loss of associates and joint ventures (27 445) (19 661)Minorities interest 25 582 (507)Net profit after taxation and minority interest 390 547 336 023 16%Amortisation on intangibles raised through business combinations net of tax 36 653 34 919Core net profit after taxation 427 200 370 942 15%
Core earnings per share 55.93c 48.40c 7.53c
Earnings per share for profit attributable to equity holders (cents)- Basic 51.13 43.85 17%- Headline 51.63 43.55 19%
50

Financial overview
Balance sheet31 May 2009 31 May 2008
audited auditedR’000 R’000
ASSETS
Non-current assets (2) 736 634 712 759
R’000 R’000
1. Total assets
• Increased by R658m (20.4%) to Property, plant and equipment 105 011 69 484
Intangible assets and goodwill 460 325 489 786
Investments in associates and joint ventures 109 837 81 356
R3.9bn.
2. Non-current assets
• Increased by R24m
• PPE - Capex mainly on POS Financial assets at amortised cost 54 096 72 133
Deferred taxation assets 7 365 -
Current assets (3) 3 143 109 2 509 470
p ydevices
• Amortisation of intangibles assets
• Net increase in investment in associates - Ukash and Oxigen
Financial assets at fair value 10 5 672
Financial assets at amortised cost 67 449 53 163
Inventories 384 361 484 501
L i bl 29 920 7 103
India.
• Net decrease in unactivated starter packs (Financial assets at amortised cost)
3 C t tLoans receivable 29 920 7 103
Trade and other receivables 898 571 630 687
Current tax assets 2 101 -
C h d h i l t 1 760 697 1 328 344
3. Current assets
• Increased by R633m
• Increase in cash resources
• Stock turn averaged 3 timesCash and cash equivalents 1 760 697 1 328 344
Total assets (1) 3 879 743 3 222 229• Debtors collection – 21 days
51

Financial overview
Balance sheet31 May 2009 31 May 2008
audited auditedR’000 R’000
EQUITY AND LIABILITIES
Capital and reserves 2 244 120 1 917 944
Sh it l h i d t h (1) 4 379 175 4 404 737
1. Share capital, share premium and treasury shares
T h h d f
R’000 R’000
Share capital, share premium and treasury shares (1) 4 379 175 4 404 737
Restructuring reserve (1 843 912) (1 843 912)
FCTR (13 399) 2 552
Transaction with minority reserve (2) (914 399) (898 564)
• Treasury shares purchased for share plan.
2. Transaction with minority reserve
G d ill i i t tiy ( ) ( )
Share-based payment reserve (3) 10 602 -
Minority interest (9 252) 8 373
Retained earnings 635 305 244 758
• Goodwill arising on transactions with minorities in terms of the economic entity method
3. Share based payment reserve
Non-current liabilities 69 664 58 056
Current liabilities 1 565 959 1 246 229
Trade and other payables 1 518 853 1 152 969
Non interest bearing borro ings 9 041
• Cost to date of the group’s share plan awards
4. Total liabilities
Non-interest bearing borrowings - 9 041
Current tax liabilities 28 039 71 146
Bank overdraft 3 891 50
Interest bearing borrowings 15 176 13 023
• Increased by R331m• Creditor payment terms – 40 days
g g
Total liabilities (4) 1 635 623 1 304 285
Total equity and liabilities 3 879 743 3 222 229
52
Financial overview
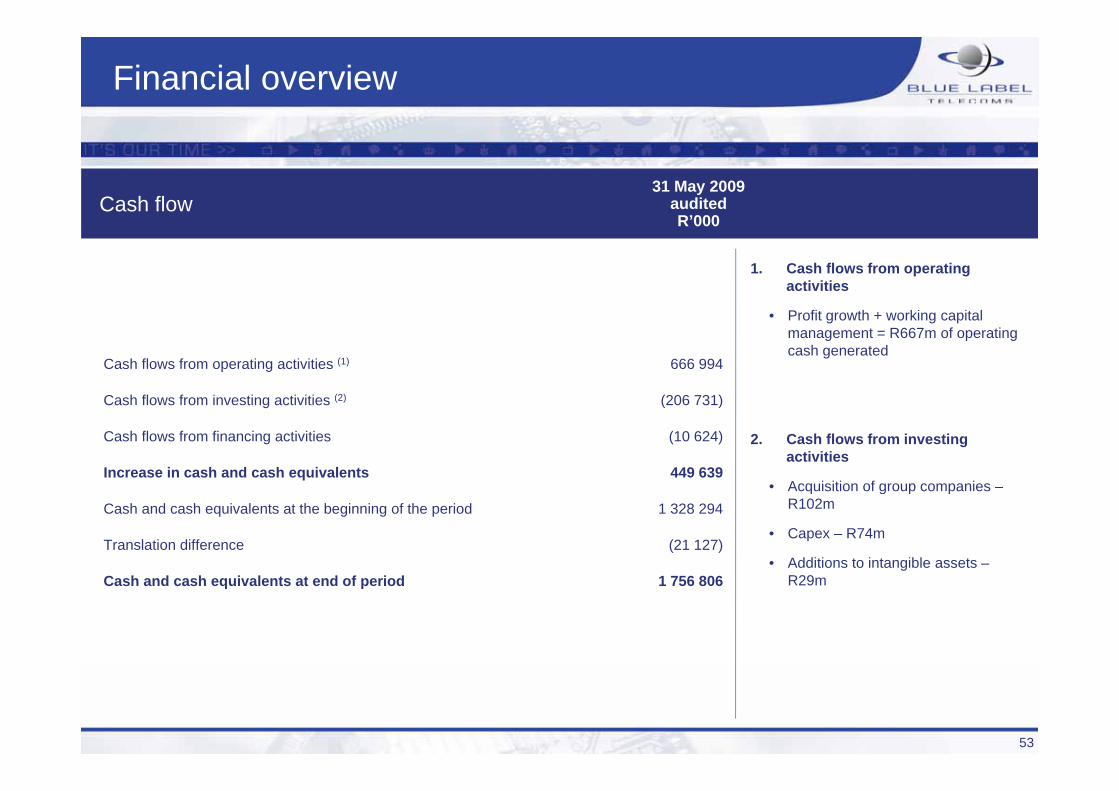
Cash flow31 May 2009
auditedR’000
1. Cash flows from operating activities
R’000
Cash flows from operating activities (1) 666 994
C h fl f i ti ti iti (2) (206 731)
• Profit growth + working capital management = R667m of operating cash generated
Cash flows from investing activities (2) (206 731)
Cash flows from financing activities (10 624)
Increase in cash and cash equivalents 449 639
2. Cash flows from investing activities
• Acquisition of group companiesCash and cash equivalents at the beginning of the period 1 328 294
Translation difference (21 127)
• Acquisition of group companies –R102m
• Capex – R74m
• Additions to intangible assets –R29Cash and cash equivalents at end of period 1 756 806 R29m
53
Financial overview
Dividends
No dividend has been declared in line with group’s present stated policyThe group intends to declare dividends in the financial year commencing 1 June 2010
54

South African Distribution
Brett LevyJoint CEO
55

South African Distribution
South Af iAfrica
Total connections 50,019,000
% Growth in total connections 14.06%
Prepaid as % of total connections 86.37%
Market penetration 97.66%p
Prepaid ARPU (USD/month) 8.50
56

RICA
• Onus on all South Africa’s telecommunications operators and retailers to gather and register personal details of all South African existing and new mobileSouth African, existing and new, mobile phone subscribers
• BLT has formulated to RICA registration t t th t i bl t i t idstrategy that is able to register prepaid
mobile phone subscribers in support of our retail customers, nationally
• In conjunction with the South African Mobile operators, we have a number of RICA data collection solutions that will seamlesslycollection solutions that will seamlessly integrate into the current store setups, with minimal impact on hardware, software and IT tIT systems
57

Algoa Bus Ticketing
• A new cashless bus ticket system was introduced in Nelson Mandela Bay at the beginning of August 2009beginning of August 2009
• Allows consumers to travel a set route as many times as they like in a day, week ormany times as they like in a day, week or month using the same pass
• Bus vouchers are available at 600 outlets
58

Remittances
• Currently 2 million (60%) migrant workers, sending R6.1 billion across continent
• 5.7 million South Africans live away from 5.7 million South Africans live away from immediate family
• Total domestic market is R12 billion annuallyannually
• 60% of remittances reach their beneficiaries in informal ways due to high transactional feesfees
• Remittances are recognised as one of the world’s largest poverty reduction effortsW ld id 150 illi i t t• Worldwide 150 million migrants sent US$300 billion in 2006
• Remittance pathways increase education d d d hild l bspend and reduce child labour
59
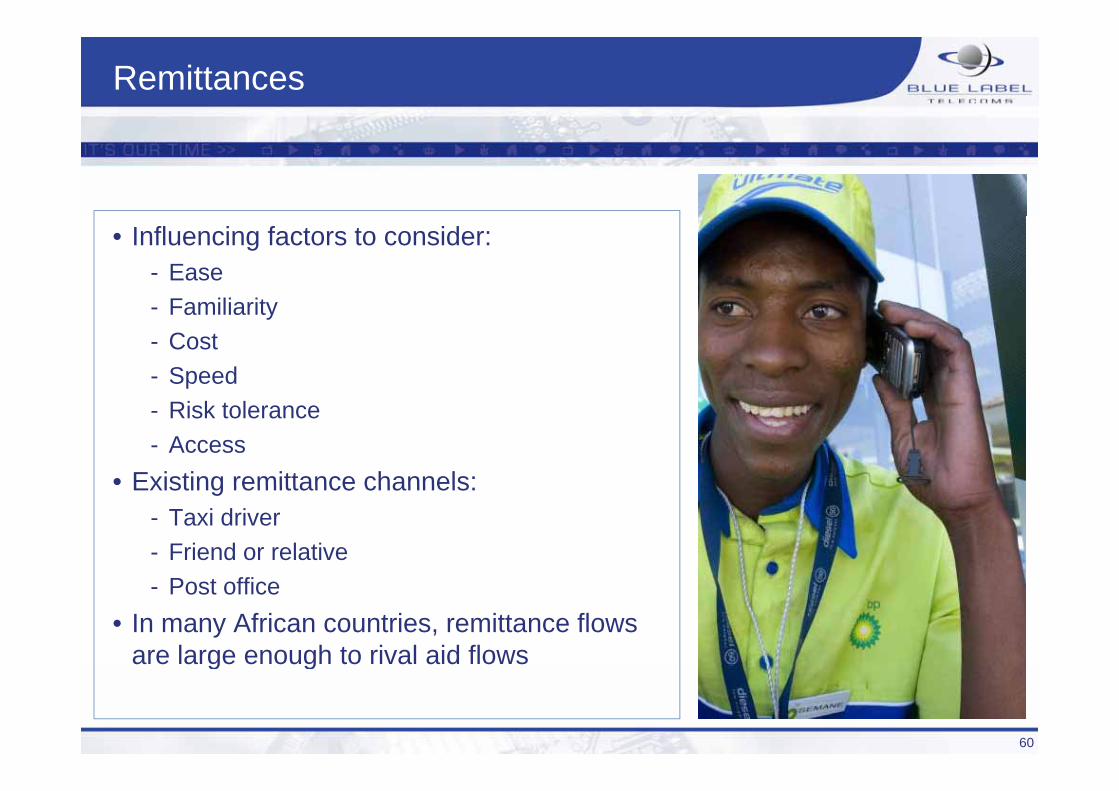
Remittances
• Influencing factors to consider:- Ease
Familiarity- Familiarity- Cost- Speed- Risk tolerance- Access
• Existing remittance channels:Existing remittance channels:- Taxi driver- Friend or relative- Post office
• In many African countries, remittance flows are large enough to rival aid flowsg g
60

Gidani
• In 2006, the National Lottery Board awarded Gidani a tender to manage the running of South Africa’sa tender to manage the running of South Africa s National Lottery
• In December 2006, Gidani appointed Activi to assist it with the rollout and maintenance of new Lotto
hi S th Af imachines across South Africa• In July 2009, Gidani announced that lottery players
will be able to play Lotto through a cell phone, bank ATM and online bankingg
• The first time in Africa – made possible by Activi’s technology platform
• The new method of playing Lotto was launched th h FNBthrough FNB
• Other banks have indicated that they will come on board later in the year
• Access to nearly one million FNB mobile bankingAccess to nearly one million FNB mobile banking customers, as well as registered users and 3 400 FNB ATM’s
• Shoprite pilot brings Lotto to till points, also off Activi’s technology platform (mid August)Activi s technology platform (mid-August)
• The first time in Africa
61

Blue Label Telecoms : SA DistributionPeriod : 1 June 2008 31 May 2009
Total Prepaid Product Revenue & Voucher Counts
Period : 1 June 2008 - 31 May 2009
122,500,000
140,000,000
R 1,400,000,000
R 1,600,000,000
87,500,000
105,000,000
R 1,000,000,000
R 1,200,000,000
ntVAT
52 500 000
70,000,000
R 600 000 000
R 800,000,000
Vouc
her C
oun
Rev
enue
Exc
l. V
35,000,000
52,500,000
R 400,000,000
R 600,000,000R
0
17,500,000
R 0
R 200,000,000
200806 200807 200808 200809 200810 200811 200812 200901 200902 200903 200904 200905
Sales Excl. VAT Voucher Count
(Crown Cellular, Kwikpay, Matragon, The Prepaid Company, Ventury, Virtual Voucher)

Blue Label Telecoms : SA DistributionPeriod : 1 June 2008 31 May 2009
Device Split May 2009 Devices GIS Regional Spread May 2009
Period : 1 June 2008 - 31 May 2009
Terminals68.93% Free State
7.14%
2009
Eastern Cape12.97%
Gauteng35.09%
Kwazulu Natal12.39%
Bulk Printing UnitsGateway Units Integrated
Kiosk Units2.87%
Touch Screen Units
Vending Machine6.58%
Limpopo3.62%
Mpumalanga4 47%
North West
Northern Cape1.75%
Western Cape18 11%0.48%
y1.42%
gPoint Sale Devices11.46%
Units8.26%
4.47%4.47%18.11%
(Kwikpay, Matragon, Ventury, Virtual Voucher)

Blue Label Telecoms : SA Electronic DistributionPeriod : 1 June 2008 31 May 2009
Revenue by Market Segment
Period : 1 June 2008 - 31 May 2009
R 32,000,000
R 36,000,000
R 230,000,000
R 260,000,000
R 24,000,000
R 28,000,000
R 170,000,000
R 200,000,000
e -M
6
2, M
3, M
4
R 16,000,000
R 20,000,000
R 110,000,000
R 140,000,000
Rev
enue
Rev
enue
-M
2
R 12,000,000
R 16,000,000
R 80,000,000
R 110,000,000
R 8,000,000R 50,000,000
M2 - Petrolum Industry M3 - Independent Multi Lane Retailer M4 - Independent Single Lane Retailer M6 - 2nd Tier Wholesalers
(Kwikpay, Matragon, Ventury, Virtual Voucher)

Blue Label Telecoms : SA DistributionPeriod : 1 June 2008 31 May 2009
250.00%
Period : 1 June 2008 - 31 May 2009
201.73%206.96%
200.00%
150.00%
100.00%
24.21% 21.82% 22.28% 22.31%26.62%
0 40%6.26% 7.75%
50.00%
37 20% 36 97%
0.40%0.00%
Telkom Electricity Cell C MTN Vodacom Overall Growth
-37.20%-36.97%-50.00%
Voucher Count Growth % PT Sales Excl. VAT Growth % PT
(Crown Cellular, Kwikpay, Matragon, The Prepaid Company, Ventury, Virtual Voucher)

Blue Label Telecoms : SA Electronic DistributionPeriod : 1 June 2008 31 May 2009
Growth % per Region: June 2008 vs May 2009
Period : 1 June 2008 - 31 May 2009
167.61%
160.00%
180.00%
124.01%
120.00%
140.00%
61.19%
85.09% 82.30%91.39%
78.95%80.00%
100.00%
52.69% 51.85% 50.71%
27.38%
51.69%
28.93% 27.94%36.05% 34.96%
22.82% 19.48%
39.50%40.00%
60.00%
15.45%19.48%
0.00%
20.00%
Eastern Cape
Free State Gauteng Kwa Zulu Natal
Limpopo Mpumalanga North West Northern Cape
Western Cape
Overall GrowthCape Natal Cape Cape Growth
Voucher Count Growth % Sales Excl. VAT Growth %
(Kwikpay, Matragon, Ventury, Virtual Voucher)

Blue Label Telecoms : SA Distribution
Monthly Sales by Region
R 160 000 000
R 180,000,000
R 200,000,000
R 80 000 000
R 90,000,000
R 100,000,000
al, L
impo
po,
ern
Cap
e
R 120,000,000
R 140,000,000
R 160,000,000
R 60,000,000
R 70,000,000
R 80,000,000
aute
ng
Kw
a-Zu
lu N
ata
Cap
e an
d W
este
R 80,000,000
R 100,000,000
R 40,000,000
R 50,000,000
onth
ly S
ales
Ga
pe,F
ree
Stat
e,
est,
Nor
ther
n C
R 40,000,000
R 60,000,000
R 20,000,000
R 30,000,000
Mo
es E
aste
rn C
apan
ga, N
orth
We
R 0
R 20,000,000
R 0
R 10,000,000
200806 200807 200808 200809 200810 200811 200812 200901 200902 200903 200904 200905Mon
thly
Sal
Mpu
mal
a
Eastern Cape Free State Kwa Zulu Natal Limpopo Mpumalanga
North West Northern Cape Western Cape Gauteng

Blue Label TelecomsBlue Label TelecomsFinal Results Presentation
Thank youyQ&A