blubber thickness variation in grey, harbour & ringed seals_korrigerade...
TRANSCRIPT
Andre Hermansson
Degree project for Master of Science in Biology
Animal Ecology, 30 hec, vt 2015
Department of Biological and Environmental Sciences
University of Gothenburg
Supervisor: Karin Hårding
Examiner: Lotta Kvarnemo
Blubber thickness variation in grey, harbour and
ringed seals A proxy for seal health and an indicator of energetic
constraints
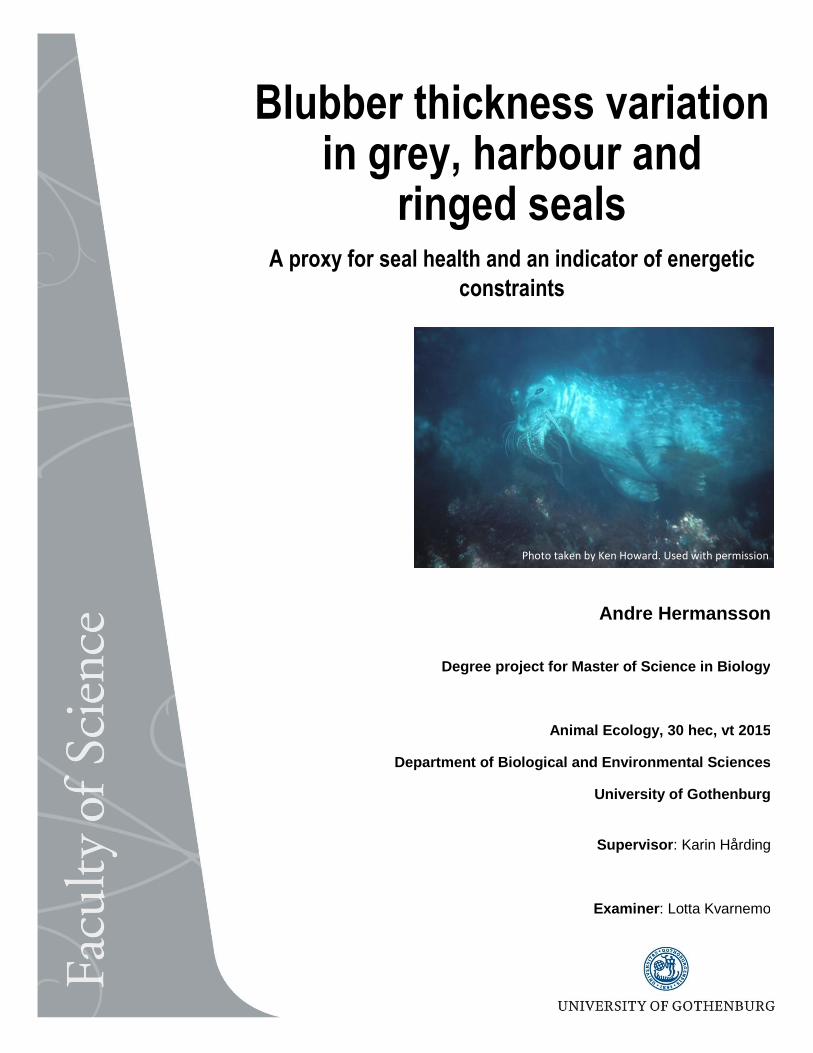
Photo taken by Ken Howard. Used with permission
Abstract
HELCOM has chosen seals’ nutritional status as one of several so called ‘core indicators’ that
shall be monitored in all Baltic countries to document changes in the environment. The parameter
measured to describe seal nutritional status is blubber thickness. The seals included in this study
were grey, harbour and ringed seals either shot, caught in fishing gear or found dead along the
Swedish coast of the Baltic Sea and the Swedish West coast 2002-2012. The blubber content as
percentage of body mass (%fat), the so called LMD-index, was calculated. This was correlated
with several other body condition indices taken from the literature, with the aim of finding out
how well they could describe blubber content and thus, indirectly nutritional status. The seasonal
and interannual variation in blubber thickness were also investigated. The sternum blubber
thickness, the most widely used measuring site of blubber thickness in pinnipeds, was found to
correlate well with %fat in all three species. Thus, suggesting that it is a good indicator of total
blubber content/nutritional status. Dorsal and sternum blubber thicknesses were also found to
correlate well with each other, suggesting that sternum blubber thickness can substitute the dorsal
measure, by multiplication with a factor 1.114, for calculating the %fat. In agreement with
previous studies, a seasonal variation in blubber thickness, with a decrease in spring and increase
in fall/winter was found. Interestingly, a significant decrease in the autumn-winter %fat was
found over the time period 2002-2012 for sexually mature grey seal females. This trend could
pose a future problem for both individual survival and reproduction. The underlying cause is as
yet unknown, but may be related to decreasing fish stocks, dietary changes and population
density related factors. Total blubber content in kilograms of juvenile grey seals in autumn varied
widely among individuals. Simple energetic modelling suggested that these differences
corresponded to substantial differences in the amount of ingested food between fatter and leaner
seals of the same cohort and these differences may prove to be insurmountable given the limited
time available for feeding before their first winter. This may reflect differences in lactation and
early foraging success. Thus, a good early start in the life of the juveniles, with proper lactation
and good foraging success seems to be crucial.
Introduction
Study species
The Atlantic grey seal (Halichoerus grypus) is a large, fish-eating phocid seal that inhabits
temperate coastal waters of the North Atlantic and the Baltic Sea (Abt et al. 2002). In the Atlantic
it is a land-based colonial breeder, with large sexual dimorphism and a polygynous mating
system (Worthington Wilmer et al. 1999). Female grey seals come ashore once a year to give
birth to and rear a single cub (Sparling et al. 2006). The Baltic grey seal population is different
from the Atlantic population in several ways, the most obvious being the ability to shift breeding
habitat depending on sea ice availability, thus it is a facultative land/ice breeder. It has been
shown that pup survival, weaning weight and health are significantly increased on ice as
compared to land, most likely because of lower exposure to crowding and pathogens on ice (Jüssi
et al. 2008). The Baltic grey seal breeds in early spring, with pupping peaking in late February to
early March (Thompson and Härkönen 2008a). The lactation period is around 17 days long and
during this period the female does not go to sea to feed but instead relies on stored energy
reserves in the form of blubber. Thus, maternal energy reserves is a major factor determining cub
survival rates and female fitness. Females forage at sea for 7 months between the moulting and
breeding seasons in order to accumulate enough fat reserves for the next breeding season
(Sparling et al. 2006).
After a century of bounty hunting and decades of low fertility due to environmental pollutants
(Harding et al. 2007), the Baltic grey seal population has now been on the rise since 1990, with
an annual rate of 5.8-8.5 %. This recent increase in population size has caused problems with
local fisheries (Harding et al. 2007; Kauhala et al. 2015) which has led to the reintroduction of
hunting in Sweden since 2001, with an annual quota of around 200 seals (Kauhala et al. 2015).
The harbour seal (Phoca vitulina) is a smaller phocid seal (Bowen et al. 1992). Its diet is very
diverse, ranging from various fish species to cephalopods and crustaceans. It is one of the most
widespread pinniped species, inhabiting coastal waters, bays, rivers, estuaries and intertidal areas
of the Northern Hemisphere, ranging from temperate to polar climate. The harbour seal is
considered a promiscuous or weakly polygynous species (Thompson and Härkönen 2008b). Like
the grey seal and other phocids, the females give birth on land, lactation is brief and weaning
abrupt. However, unlike most phocids, the new-born cubs are large relative to the mother’s size
and follow their mother to sea only hours after birth, and the females often feed during lactation
(Bowen et al. 1992).
The Swedish harbour seal has several distinct populations, around the island of Öland, on the
Swedish West Coast and the southern Baltic (Bäcklin et al. 2013). Along the Swedish West Coast
regional genetically distinct stocks can be identified (Olsen et al. 2014). The populations in the
Baltic and Kattegatt have suffered several disease related crashes in the past but are now on the
rise, increasing at an approximate rate of 12 % per year, however the rate has been declining in
recent years (Härkönen et al. 2013).
The ringed seal (Pusa hispida or Phoca hispida) is a small phocid seal, possessing a very thick
blubber layer. Its diet consists mainly of small schooling fish species, e.g. herring and sprat,
although some variation exists, depending primarily on prey availability and energy content. It
has a chiefly circumpolar distribution throughout the Arctic Basin and adjacent seas, but some
subspecies are also found in lakes further south (e.g. the Saima seal and the Ladoga seals). The
Arctic ringed seal is a typical ice-seal, breeding, moulting and resting on sea ice. The Baltic
population however, use ice for breeding and moulting, but is forced to haul out on land during
the summer due to a lack of sea ice. In the spring females give birth to a single pup in lairs made
in the ice and snow. Lactation lasts a bit over a month on average and mating occurs towards the
end of this period, similar to other phocids (Kovacs 2008).
Due to over-harvesting the Baltic ringed seal population declined drastically during the past
century (Kokko et al. 1997; Kovacs 2008). With the exception of the Bothnian Bay, the
populations in the rest of the Baltic have shown either no increase or even a decline since the
1990s. In addition to the past hunting, other major threats include bycatches in fishing gear,
pouching, infectious diseases and the predicted future reductions in sea ice availability due to
climate change (Kovacs 2008; Sundqvist et al. 2012) and various anthropogenic pollutants such
as organochlorines and heavy metals (Nyman et al. 2002; Kovacs 2008).
Study area
The data used in this study is from seals shot, caught in fishing gear or found dead along the
Swedish coast of the Baltic Sea and the Swedish West coast between the years 2002 and 2012.
The grey seal data is considered applicable for the whole Baltic Sea population, as grey seals are
very mobile across the Baltic Sea basin. The ringed seal data on the other hand may apply only to
the Bothnian Bay, where most of the samples are from. The harbour seal data is applicable to the
Swedish West coast.
Blubber
Blubber, a layer of lipid-rich tissue between the epidermis and the underlying muscles is a
fundamental part of the mammalian adaptation to the aquatic lifestyle. It can constitute 15–55 %
of total body mass in marine mammals. Its functions include not only thermoregulation but also
storage of metabolic energy (Noren et al. 2014), buoyancy regulation (Webb et al. 1998) and
hydrodynamic drag reduction (by modifying the streamlined shape of the body)(Fish 2000). The
thickness of the blubber layer is important not only for individual survival but also for
reproduction, being very important for lactation and cub survival (Harding et al. 2005; Stephens
et al. 2014; Bowen et al. 2015).
Blubber thickness in adult seals has been shown to vary seasonally, with a decrease during
reproduction, lactation and moulting in spring followed by a subsequent increase when autumn
arrives (Nilssen et al. 1997; Hauksson 2013). Lactation in phocid seals is brief and often involves
maternal fasting with concomitant drastic reductions in the mother’s energy reserves, the energy
being transferred to the rapidly growing pup, and is ended with abrupt weaning when the mother
departs to feed at sea. Maternal fat reserves may decline by as much as 79 % (e.g. harbour seal,
P. vitulina) during the lactation period (Bowen et al. 1992).
The amount of fat stored by each animal is influenced by external conditions such as abundance
of prey items, parasite load, environmental toxins and other stressors and thus could serve as an
indicator of body condition that correlates with habitat quality and reproductive rate (Noren et al.
2014). HELCOM has chosen seals’ nutritional status as one of several so called ‘core indicators’
that shall be monitored in all Baltic countries to document changes in the environment. The
parameter measured to describe seal nutritional status is blubber thickness (Bäcklin et al. 2013).
Blubber thickness can be measured in many ways, including destructive techniques such as
chemical analysis (Reilly and Fedak 1990; Arnould et al. 1996; Oftedal et al. 1996) and non-
destructive ones such as ultrasound imaging (Webb et al. 1998; Mellish et al. 2004; Noren et al.
2008). Due to recent technological advancements increasing its accuracy (up to 99.8 % when
compared to blubber biopsies), ultrasound has become increasingly popular among scientists as a
rapid and non-invasive alternative to measure blubber thickness in marine mammals (Mellish et
al. 2004). Furthermore, specific areas of the body may be preferentially targeted for the
mobilization of blubber stores (Mellish et al. 2007; Noren et al. 2014). The standard measuring
site for blubber thickness in pinnipeds has historically been over the xiphoid process (sternum),
although several studies have suggested that this may not be the best site for monitoring body
condition in all species (Noren et al. 2014).
Study objectives
My objectives with this study were:
1) To describe the seasonal and interannual variation in blubber thickness in grey, harbour
and ringed seals in the Baltic Sea.
2) Compare different indices of nutritional status and make recommendations for best
practices to estimate nutritional status.
3) Discuss underlying processes that may affect the nutritional status of the populations by
elaboration of a bioenergetic model.
Method
Data source
The study is based on a literature review on common body condition measurements on pinnipeds
and statistical analysis of a large data set to compare the performance of the different indices. In
addition a small bioenergetic model was developed.
Data on biometric measurements from grey, harbour and ringed seals shot, caught or found
between 2002 and 2012 were acquired by the courtesy of the Swedish Museum of Natural
History (NRM) (Bäcklin et al. 2013).
Estimates of total blubber content/condition indices
The blubber content as percentage of body mass (%fat), was calculated according to the
expression developed by Ryg et al (1990):
(1)
In this so called LMD-index L = the standard body length in cm, M = the body weight in
kilograms and d = the blubber thickness in meters at 60 % of the standard body length (starting at
the nose). LMD-index has previously been shown to be a reliable estimate of true blubber content
in phocid seals (r2=0.88, standard deviation=3.02, for harp, grey and ringed seals pooled together)
when compared to dissection data (Ryg et al. 1990). It has even proved to work relatively well
with Steller sea lion, Eumetopias jubatus (Pitcher et al. 2000) and extremely well with Baltic
seals (Bäcklin et al. in prep.). The original LMD-index (Ryg et al. 1990) used dorsal blubber
thickness (henceforth denoted as BL (dorsal)), however the sternum blubber thickness (BL
(sternum)) is the one that has been most widely used historically, and also the one used for the
majority of the seals in the data set available for this study. A smaller portion of the seals in the
data set used here had both the dorsal and sternum measurements, thus allowing for a comparison
between them. The LMD-index was then correlated with several other indices of body condition
traditionally used (taken from the literature), as well as with standard body length (SL). The goal
was to see how well they could describe blubber content (as estimated through the LMD-index).
Of particular interest in this regard were the BL (sternum) and the 100 x axillary girth/standard
body length (100 x AG/SL, AG=axillary girth, i.e. the greatest circumference of the chest, just
behind the front flippers), as these have been the two most common condition indices used for
seals (Ryg et al. 1990). The traditionally used indices along with their respective sources and
abbreviations are shown in Table 1.
Table 1 The different measures used as condition indices taken from the literature are listed with their respective sources and the abbreviations used herein.
Body measurements used as condition indices in the
literature
Abbreviation Source
Standard body length (cm) SL (Kjellqwist et al. 1995)
Body weight (kg) BW (Pitcher et al. 2000)
Body weight (kg)/standard body length (cm) BW/SL (Arnould 1995; Noren et al.
2014)
Sternum blubber thickness (mm) BL (sternum) (Pitcher et al. 2000)
Dorsal blubber thickness (mm) BL (dorsal) (Ryg et al. 1990)
Sternum blubber thickness (mm)/standard body length (cm) BL (sternum)/SL (Pitcher et al. 2000)
Sternum blubber thickness (mm)/body weight (kg) BL
(sternum)/BW (Pitcher et al. 2000)
100 x axillary girth (cm)/standard body length (cm) 100 x AG/SL (Ryg et al. 1990; Nilssen et al.
1997)
When looking at the seasonal variation within years, and the long term variation among years, in
BL (sternum) and %fat, only healthy individuals caught by hunting (excluding bycatch) were
included in the analysis so as to exclude any changes in blubber thickness due to disease,
malnutrition, injuries etc. The seals were then divided into three classes, 1-3 year-olds (not
sexually mature) and 4+ year-old females and 5+ year-old males (the latter two classes being
sexually mature). For the variation among years, a further selection was made, only seals caught
during the months September to January (non-mating and non-lactating season), when the seals
are at their fattest, were included. This is because, like previously mentioned, sexually mature
individuals’ blubber thickness diminishes significantly during the mating season. Thus,
individuals caught during this period will have low blubber thickness regardless of any other
existing trend in the population over the years caused by other factors, such as changes in hunting
pressure, food stock, population density etc. This selection was also applied to non-sexually
mature (1-3 year-old) individuals, as their blubber has also been shown to vary somewhat
throughout the year, probably due to prey availability (Bäcklin et al. 2013). Due to the selection
of only healthy individuals caught by hunting for the analysis of the variation within and among
years, the sample sizes for ringed seals and most of the harbour seals became too small for
statistical analysis of the trends. For this reason, only the grey seals and the 4+ year-old female
harbour seals were used for the description of the seasonal variation in blubber thickness and the
blubber thickness variation over time.
For the statistical analysis of the relations between the condition indices, correlation analysis
(Pearson's r) was used, and for the interannual variation in BL (sternum) and %fat, linear
regression was used.
Energetic comparison
With the aim to understand the potential fitness effects imposed by different body fat contents, an
energetic comparison was made. The weight difference (m) between the fattest (mmax) and
thinnest (mmin) healthy juvenile (1 year-old) grey seals caught by hunting September-November
2002-2012 was calculated to get a notion of how much energy reserves differ among individuals

in the first critical winter. Body fat content as percentage of body mass (henceforth referred to as
%fat) for each of the two seals was multiplied with the body weights in kg to transform
percentage fat into absolute blubber mass in kg. Thereafter, the difference between the seal with
the highest and lowest absolute blubber mass was calculated:
To find out how much the thinnest seal would need to eat to compensate for this difference
several steps were taken.
The expressions for calculating the maintenance energy requirement, foraging and transport costs
and growth energy requirement of body tissue, as well as the values for mean daily energy intake
and metabolic efficiency that now follow, were all based on numbers used for juveniles of
another closely related phocid seal species, the harbour seal (Markussen et al. 1990; Härkönen
and Heide-Jørgensen 1991).
Steps to calculate how much and during how long a period the lean seal
needs to eat to compensate for the low energy reserve:
The average amount of fat the thinnest juvenile seal would gain per day was calculated in the
following way:
First the metabolic efficiency rate was accounted for, i.e. the process of converting food into
blubber tissue was not 100 % efficient. Here it was assumed that 80 % of the energy in the
ingested food was metabolized (Härkönen and Heide-Jørgensen 1991). In addition to this
metabolic cost, the costs of maintenance energy (i.e. basal metabolism, thermoregulation and
voluntary actions) and foraging and transport between haul-out and feeding sites were also taken
into account.
The maintenance energy requirement was calculated according to the expression:
(Markussen et al. 1990) and the cost of foraging and transport
between haul-out and feeding sites according to the expression:
(Härkönen and Heide-Jørgensen 1991). The body mass of the thinnest seal was the one
inserted into both these equations.
The average amount of fat in kg the seal gained per day was calculated in the following steps:
1. The mean daily energy intake, here assumed to be 2 798 kcal based on the lowest mean daily
intake for juvenile harbour seals taken from a previous experimental study (Markussen et al.
1990), was multiplied with the metabolic efficiency rate (0.80).
2. Thereafter, the costs of maintenance energy and foraging and transport between haul-out and
feeding sites were subtracted from the result, the remainder being the energy left for growing
blubber tissue.
3. This remainder energy was then divided by the gross energy requirement for growing one kg
of body tissue: (Markussen et al. 1990), thus giving the average amount of
blubber tissue in kg the seal gained per day.
Then, in order to calculate the amount of days the seal would have to feed, the ∆fat was divided
by the average amount of fat the seal gained per day as calculated above.
The total amount of fish eaten during the feeding period would depend on the fish species being
consumed, as each species has a different energy content. Since the main prey species of the
Baltic grey seal is herring, Clupea harengus (Andersen et al. 2007; Lundström et al. 2010), and in
order to simplify the calculations, the seal was assumed to eat only herring. The average energy
content of herring is 2.30 kcal/g wet mass (Härkönen and Heide-Jørgensen 1991). The mean
daily energy intake was divided with the energy content of herring in order to get the amount of
fish eaten per day, and this was then multiplied with the length of the feeding period in days to
get the total amount of fish eaten during the period.
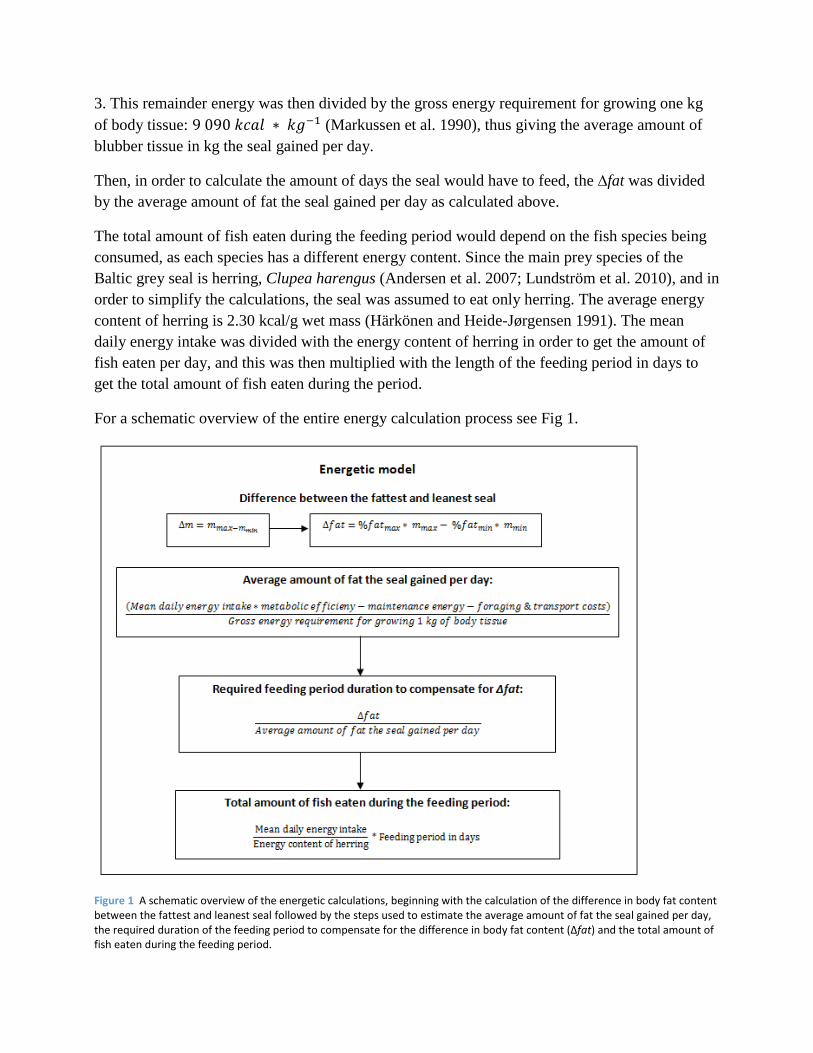
For a schematic overview of the entire energy calculation process see Fig 1.
Figure 1 A schematic overview of the energetic calculations, beginning with the calculation of the difference in body fat content between the fattest and leanest seal followed by the steps used to estimate the average amount of fat the seal gained per day, the required duration of the feeding period to compensate for the difference in body fat content (∆fat) and the total amount of fish eaten during the feeding period.
Results
Condition indices
Grey seal:
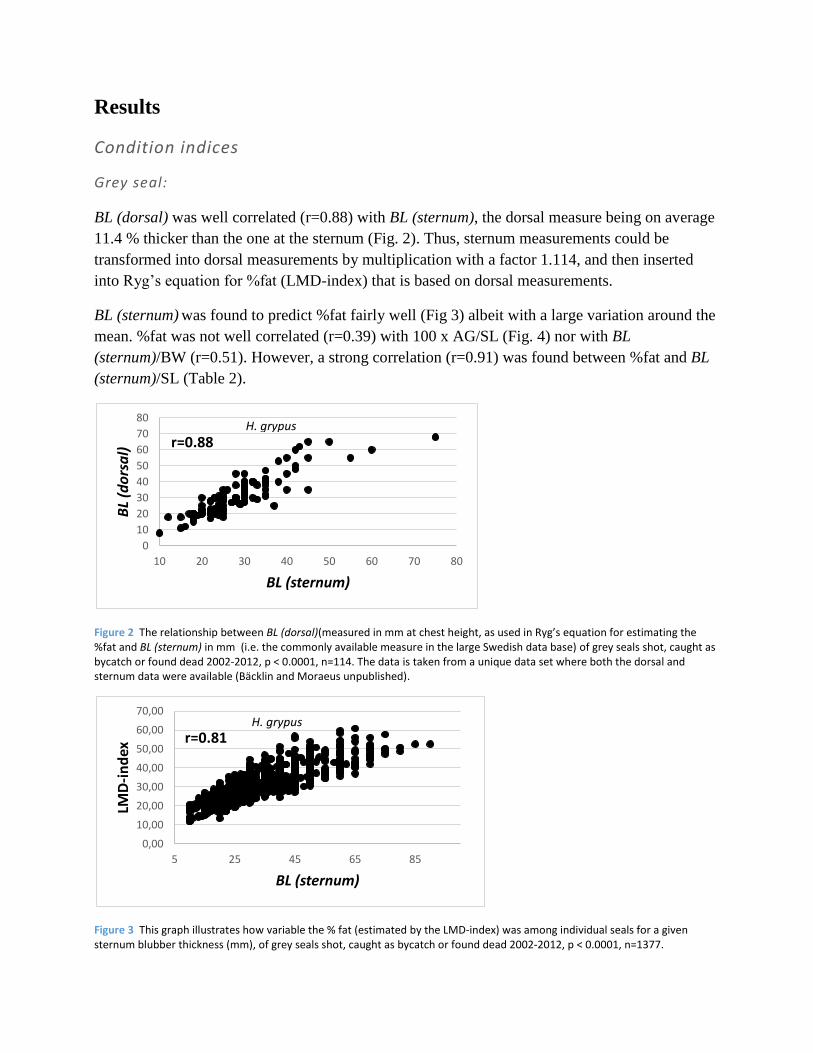
BL (dorsal) was well correlated (r=0.88) with BL (sternum), the dorsal measure being on average
11.4 % thicker than the one at the sternum (Fig. 2). Thus, sternum measurements could be
transformed into dorsal measurements by multiplication with a factor 1.114, and then inserted
into Ryg’s equation for %fat (LMD-index) that is based on dorsal measurements.
BL (sternum) was found to predict %fat fairly well (Fig 3) albeit with a large variation around the
mean. %fat was not well correlated (r=0.39) with 100 x AG/SL (Fig. 4) nor with BL
(sternum)/BW (r=0.51). However, a strong correlation (r=0.91) was found between %fat and BL
(sternum)/SL (Table 2).
Figure 2 The relationship between BL (dorsal)(measured in mm at chest height, as used in Ryg’s equation for estimating the %fat and BL (sternum) in mm (i.e. the commonly available measure in the large Swedish data base) of grey seals shot, caught as bycatch or found dead 2002-2012, p < 0.0001, n=114. The data is taken from a unique data set where both the dorsal and sternum data were available (Bäcklin and Moraeus unpublished).
Figure 3 This graph illustrates how variable the % fat (estimated by the LMD-index) was among individual seals for a given sternum blubber thickness (mm), of grey seals shot, caught as bycatch or found dead 2002-2012, p < 0.0001, n=1377.
0
10
20
30
40
50
60
70
80
10 20 30 40 50 60 70 80
BL
(do
rsa
l)
BL (sternum)
H. grypus
r=0.88
0,00
10,00
20,00
30,00
40,00
50,00
60,00
70,00
5 25 45 65 85
LMD
-in
dex
BL (sternum)
H. grypus
r=0.81
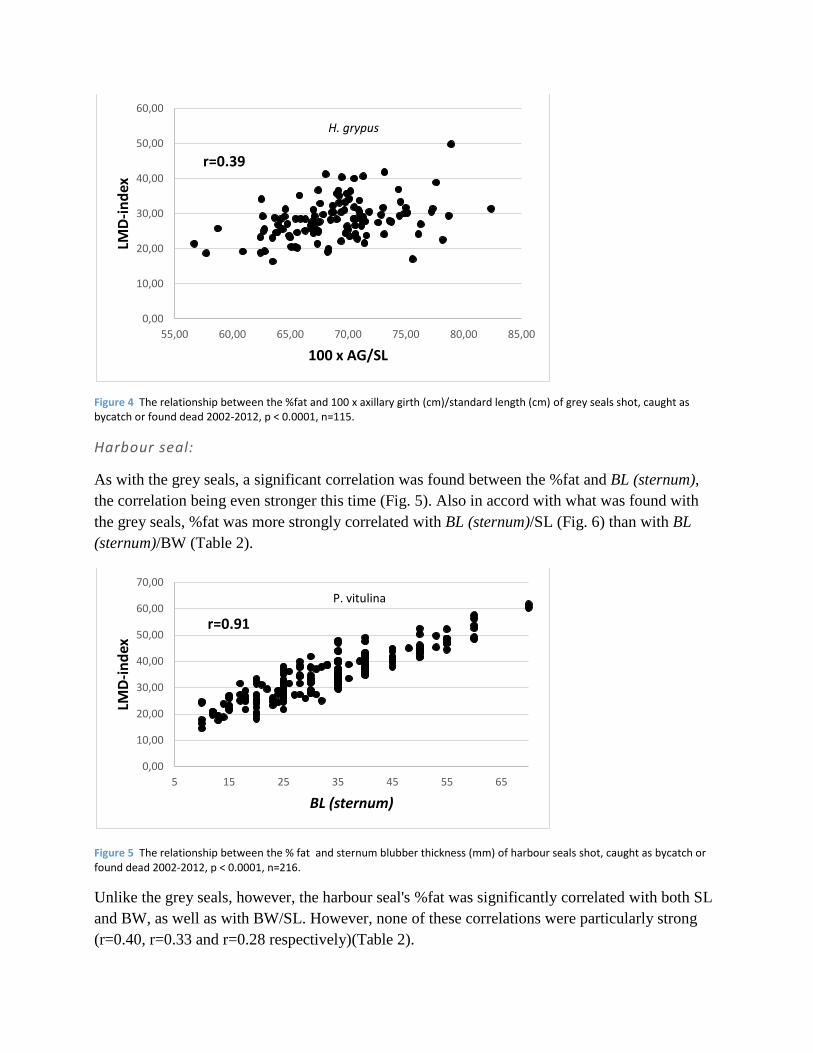
Figure 4 The relationship between the %fat and 100 x axillary girth (cm)/standard length (cm) of grey seals shot, caught as bycatch or found dead 2002-2012, p < 0.0001, n=115.
Harbour seal:
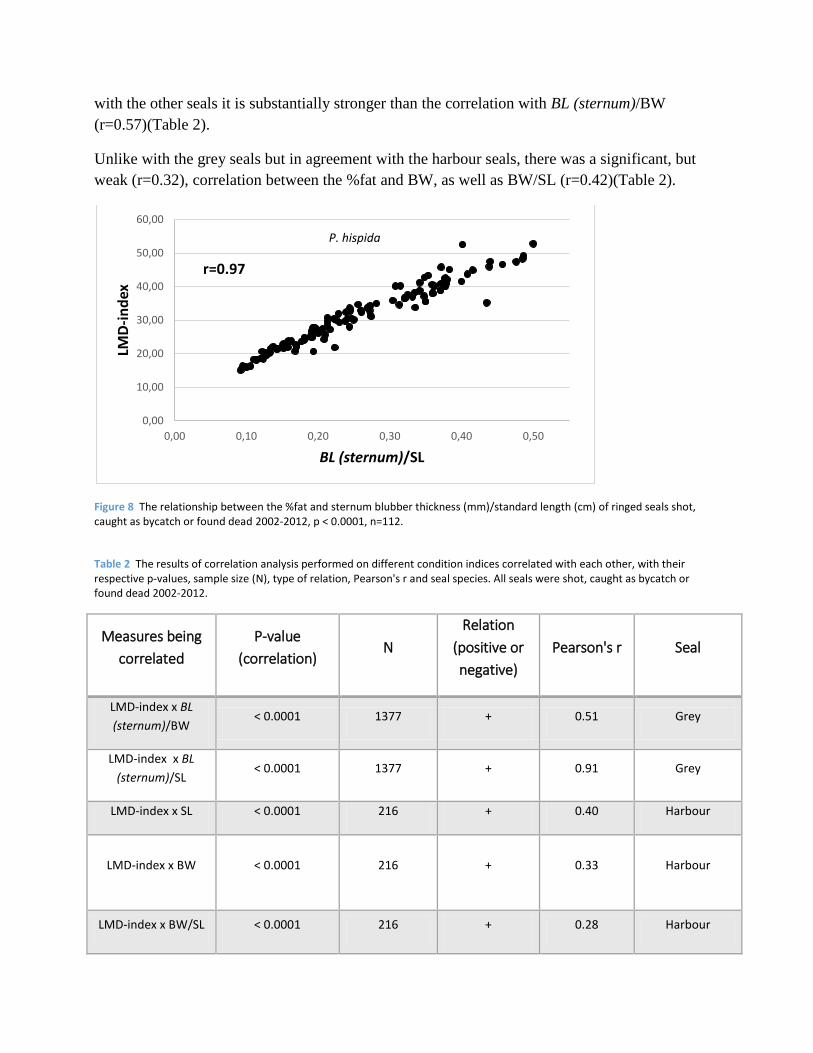
As with the grey seals, a significant correlation was found between the %fat and BL (sternum),
the correlation being even stronger this time (Fig. 5). Also in accord with what was found with
the grey seals, %fat was more strongly correlated with BL (sternum)/SL (Fig. 6) than with BL
(sternum)/BW (Table 2).
Figure 5 The relationship between the % fat and sternum blubber thickness (mm) of harbour seals shot, caught as bycatch or found dead 2002-2012, p < 0.0001, n=216.
Unlike the grey seals, however, the harbour seal's %fat was significantly correlated with both SL
and BW, as well as with BW/SL. However, none of these correlations were particularly strong
(r=0.40, r=0.33 and r=0.28 respectively)(Table 2).
0,00
10,00
20,00
30,00
40,00
50,00
60,00
55,00 60,00 65,00 70,00 75,00 80,00 85,00
LMD
-in
dex
100 x AG/SL
H. grypus
r=0.39
0,00
10,00
20,00
30,00
40,00
50,00
60,00
70,00
5 15 25 35 45 55 65
LMD
-in
dex
BL (sternum)
P. vitulina
r=0.91
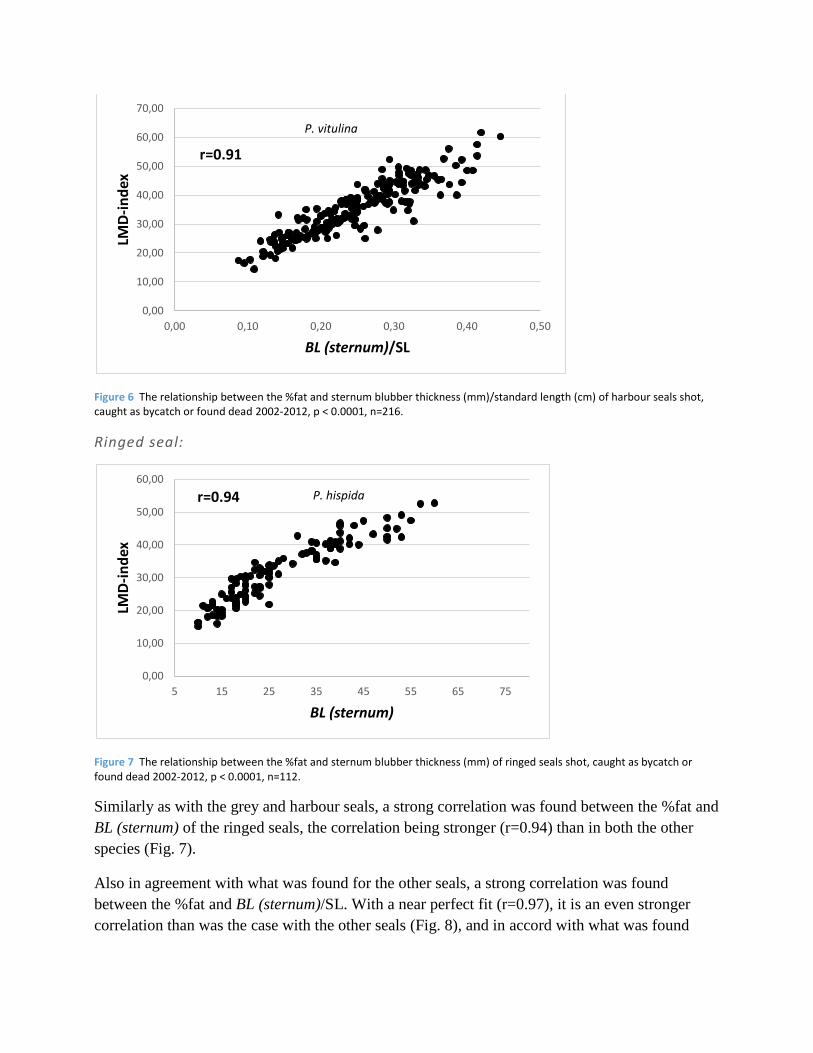
Figure 6 The relationship between the %fat and sternum blubber thickness (mm)/standard length (cm) of harbour seals shot, caught as bycatch or found dead 2002-2012, p < 0.0001, n=216.
Ringed seal:
Figure 7 The relationship between the %fat and sternum blubber thickness (mm) of ringed seals shot, caught as bycatch or found dead 2002-2012, p < 0.0001, n=112.
Similarly as with the grey and harbour seals, a strong correlation was found between the %fat and
BL (sternum) of the ringed seals, the correlation being stronger (r=0.94) than in both the other
species (Fig. 7).
Also in agreement with what was found for the other seals, a strong correlation was found
between the %fat and BL (sternum)/SL. With a near perfect fit (r=0.97), it is an even stronger
correlation than was the case with the other seals (Fig. 8), and in accord with what was found
0,00
10,00
20,00
30,00
40,00
50,00
60,00
70,00
0,00 0,10 0,20 0,30 0,40 0,50
LMD
-in
dex
BL (sternum)/SL
P. vitulina
r=0.91
0,00
10,00
20,00
30,00
40,00
50,00
60,00
5 15 25 35 45 55 65 75
LMD
-in
dex
BL (sternum)
P. hispida r=0.94
with the other seals it is substantially stronger than the correlation with BL (sternum)/BW
(r=0.57)(Table 2).
Unlike with the grey seals but in agreement with the harbour seals, there was a significant, but
weak (r=0.32), correlation between the %fat and BW, as well as BW/SL (r=0.42)(Table 2).
Figure 8 The relationship between the %fat and sternum blubber thickness (mm)/standard length (cm) of ringed seals shot, caught as bycatch or found dead 2002-2012, p < 0.0001, n=112.
Table 2 The results of correlation analysis performed on different condition indices correlated with each other, with their respective p-values, sample size (N), type of relation, Pearson's r and seal species. All seals were shot, caught as bycatch or found dead 2002-2012.
Measures being
correlated
P-value
(correlation) N
Relation
(positive or
negative)
Pearson's r Seal
LMD-index x BL
(sternum)/BW < 0.0001 1377 + 0.51 Grey
LMD-index x BL
(sternum)/SL < 0.0001 1377 + 0.91 Grey
LMD-index x SL < 0.0001 216 + 0.40 Harbour
LMD-index x BW < 0.0001 216 + 0.33 Harbour
LMD-index x BW/SL < 0.0001 216 + 0.28 Harbour
0,00
10,00
20,00
30,00
40,00
50,00
60,00
0,00 0,10 0,20 0,30 0,40 0,50
LMD
-in
dex
BL (sternum)/SL
P. hispida
r=0.97
LMD-index x BL
(sternum)/SL < 0.0001 216 + 0.91 Harbour
LMD-index x BL
(sternum)/BW < 0.0001 216 + 0.34 Harbour
LMD-index x BW 0.001 112 + 0.32 Ringed
LMD-index x BW/SL < 0.0001 112 + 0.42 Ringed
LMD-index x BL
(sternum)/BW < 0.0001 112 + 0.57 Ringed
Seasonal variation in blubber thickness
Grey seal:
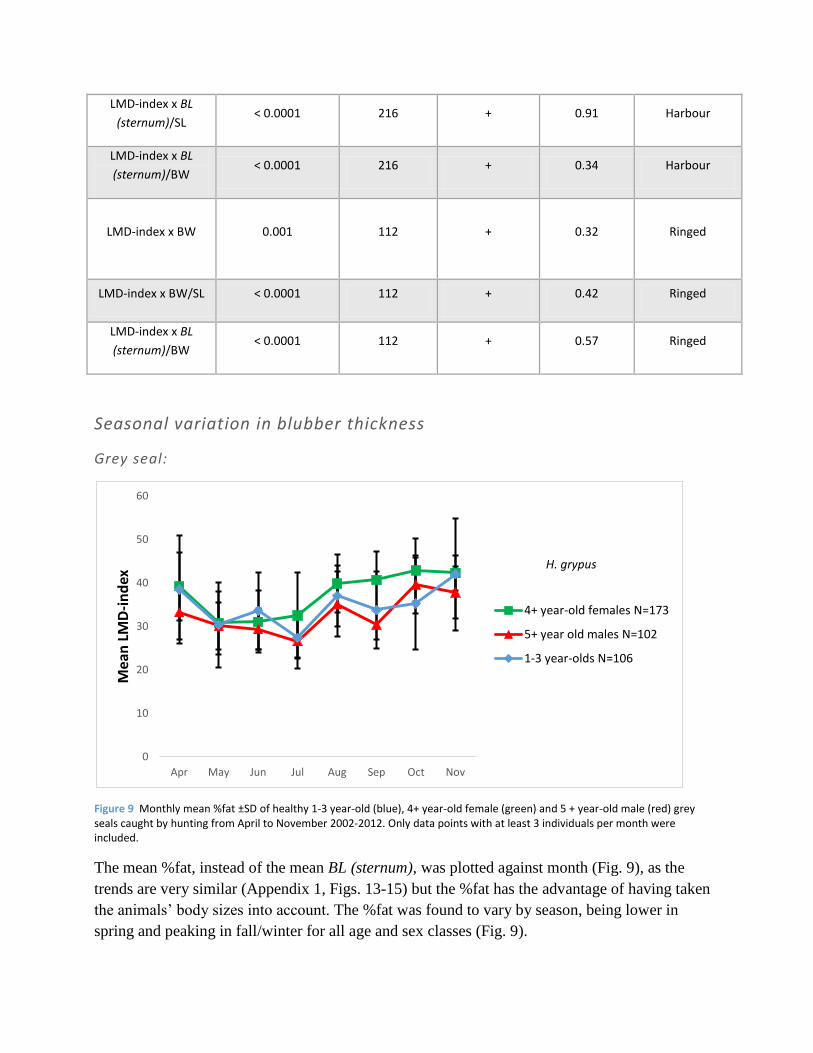
Figure 9 Monthly mean %fat ±SD of healthy 1-3 year-old (blue), 4+ year-old female (green) and 5 + year-old male (red) grey seals caught by hunting from April to November 2002-2012. Only data points with at least 3 individuals per month were included.
The mean %fat, instead of the mean BL (sternum), was plotted against month (Fig. 9), as the
trends are very similar (Appendix 1, Figs. 13-15) but the %fat has the advantage of having taken
the animals’ body sizes into account. The %fat was found to vary by season, being lower in
spring and peaking in fall/winter for all age and sex classes (Fig. 9).
0
10
20
30
40
50
60
Apr May Jun Jul Aug Sep Oct Nov
Mea
n L
MD
-in
dex
4+ year-old females N=173
5+ year old males N=102
1-3 year-olds N=106
H. grypus
Harbour seal:
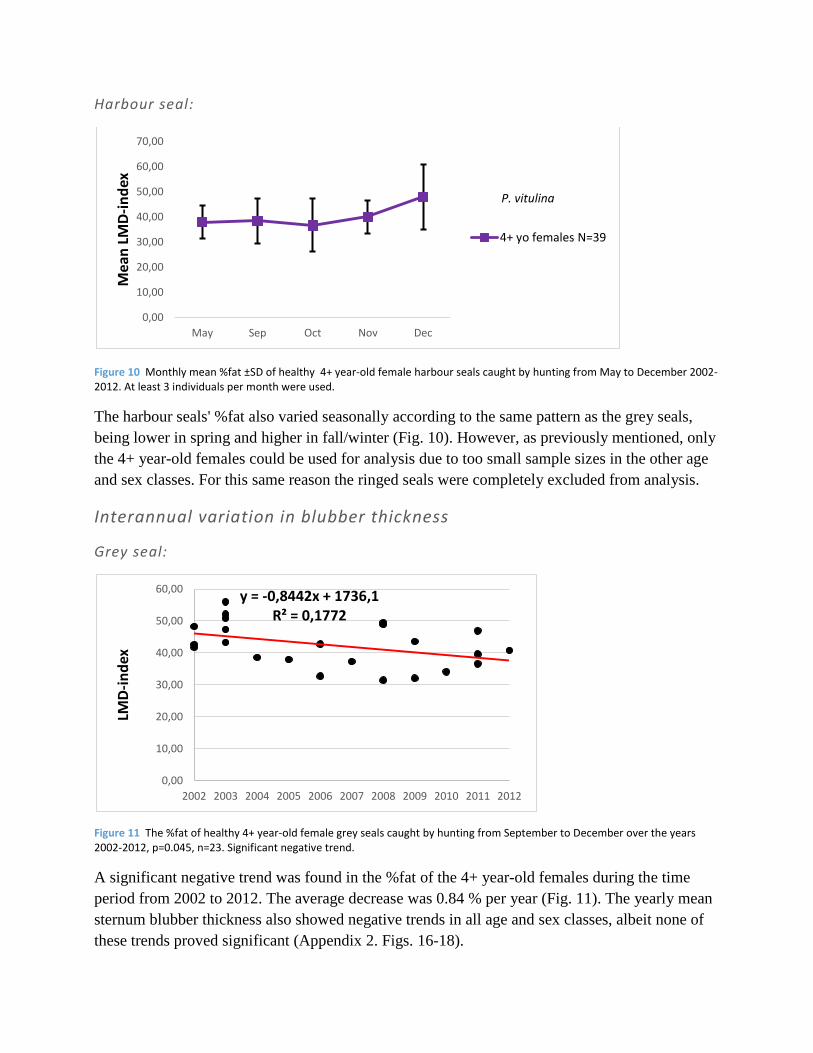
Figure 10 Monthly mean %fat ±SD of healthy 4+ year-old female harbour seals caught by hunting from May to December 2002-2012. At least 3 individuals per month were used.
The harbour seals' %fat also varied seasonally according to the same pattern as the grey seals,
being lower in spring and higher in fall/winter (Fig. 10). However, as previously mentioned, only
the 4+ year-old females could be used for analysis due to too small sample sizes in the other age
and sex classes. For this same reason the ringed seals were completely excluded from analysis.
Interannual variation in blubber thickness
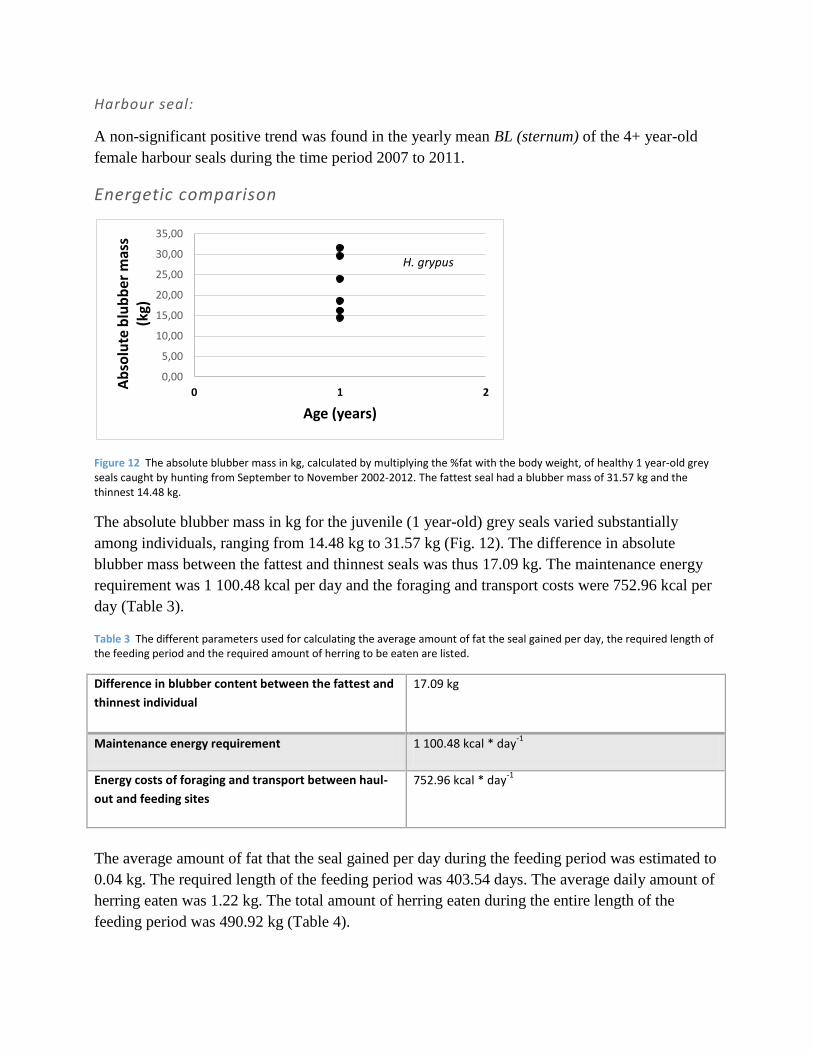
Grey seal:
Figure 11 The %fat of healthy 4+ year-old female grey seals caught by hunting from September to December over the years 2002-2012, p=0.045, n=23. Significant negative trend.
A significant negative trend was found in the %fat of the 4+ year-old females during the time
period from 2002 to 2012. The average decrease was 0.84 % per year (Fig. 11). The yearly mean
sternum blubber thickness also showed negative trends in all age and sex classes, albeit none of
these trends proved significant (Appendix 2. Figs. 16-18).
0,00
10,00
20,00
30,00
40,00
50,00
60,00
70,00
May Sep Oct Nov Dec
Mea
n L
MD
-in
dex
4+ yo females N=39
P. vitulina
y = -0,8442x + 1736,1 R² = 0,1772
0,00
10,00
20,00
30,00
40,00
50,00
60,00
2002 2003 2004 2005 2006 2007 2008 2009 2010 2011 2012
LMD
-in
dex
Harbour seal:
A non-significant positive trend was found in the yearly mean BL (sternum) of the 4+ year-old
female harbour seals during the time period 2007 to 2011.
Energetic comparison
Figure 12 The absolute blubber mass in kg, calculated by multiplying the %fat with the body weight, of healthy 1 year-old grey seals caught by hunting from September to November 2002-2012. The fattest seal had a blubber mass of 31.57 kg and the thinnest 14.48 kg.
The absolute blubber mass in kg for the juvenile (1 year-old) grey seals varied substantially
among individuals, ranging from 14.48 kg to 31.57 kg (Fig. 12). The difference in absolute
blubber mass between the fattest and thinnest seals was thus 17.09 kg. The maintenance energy
requirement was 1 100.48 kcal per day and the foraging and transport costs were 752.96 kcal per
day (Table 3).
Table 3 The different parameters used for calculating the average amount of fat the seal gained per day, the required length of the feeding period and the required amount of herring to be eaten are listed.
Difference in blubber content between the fattest and
thinnest individual
17.09 kg
Maintenance energy requirement 1 100.48 kcal * day-1
Energy costs of foraging and transport between haul-
out and feeding sites
752.96 kcal * day-1
The average amount of fat that the seal gained per day during the feeding period was estimated to
0.04 kg. The required length of the feeding period was 403.54 days. The average daily amount of
herring eaten was 1.22 kg. The total amount of herring eaten during the entire length of the
feeding period was 490.92 kg (Table 4).
0,00
5,00
10,00
15,00
20,00
25,00
30,00
35,00
0 1 2
Ab
solu
te b
lub
ber
mas
s (k
g)
Age (years)
H. grypus
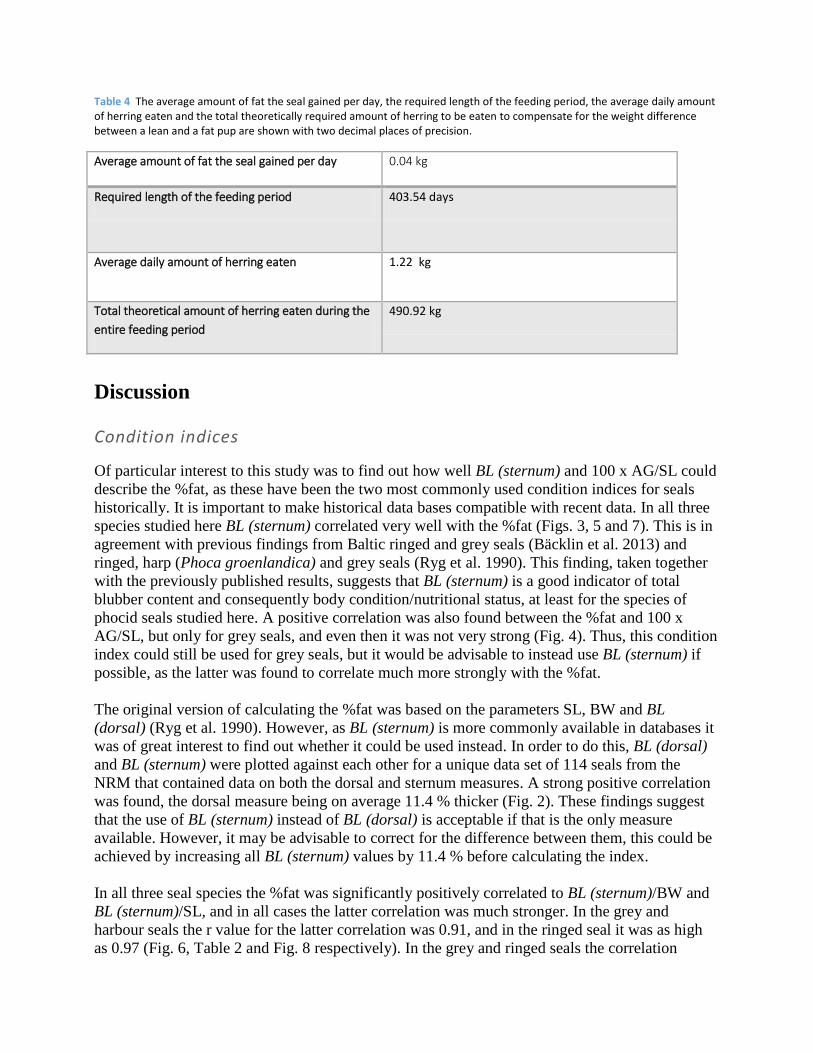
Table 4 The average amount of fat the seal gained per day, the required length of the feeding period, the average daily amount of herring eaten and the total theoretically required amount of herring to be eaten to compensate for the weight difference between a lean and a fat pup are shown with two decimal places of precision.
Average amount of fat the seal gained per day 0.04 kg
Required length of the feeding period 403.54 days
Average daily amount of herring eaten 1.22 kg
Total theoretical amount of herring eaten during the
entire feeding period
490.92 kg
Discussion
Condition indices
Of particular interest to this study was to find out how well BL (sternum) and 100 x AG/SL could
describe the %fat, as these have been the two most commonly used condition indices for seals
historically. It is important to make historical data bases compatible with recent data. In all three
species studied here BL (sternum) correlated very well with the %fat (Figs. 3, 5 and 7). This is in
agreement with previous findings from Baltic ringed and grey seals (Bäcklin et al. 2013) and
ringed, harp (Phoca groenlandica) and grey seals (Ryg et al. 1990). This finding, taken together
with the previously published results, suggests that BL (sternum) is a good indicator of total
blubber content and consequently body condition/nutritional status, at least for the species of
phocid seals studied here. A positive correlation was also found between the %fat and 100 x
AG/SL, but only for grey seals, and even then it was not very strong (Fig. 4). Thus, this condition
index could still be used for grey seals, but it would be advisable to instead use BL (sternum) if
possible, as the latter was found to correlate much more strongly with the %fat.
The original version of calculating the %fat was based on the parameters SL, BW and BL
(dorsal) (Ryg et al. 1990). However, as BL (sternum) is more commonly available in databases it
was of great interest to find out whether it could be used instead. In order to do this, BL (dorsal)
and BL (sternum) were plotted against each other for a unique data set of 114 seals from the
NRM that contained data on both the dorsal and sternum measures. A strong positive correlation
was found, the dorsal measure being on average 11.4 % thicker (Fig. 2). These findings suggest
that the use of BL (sternum) instead of BL (dorsal) is acceptable if that is the only measure
available. However, it may be advisable to correct for the difference between them, this could be
achieved by increasing all BL (sternum) values by 11.4 % before calculating the index.
In all three seal species the %fat was significantly positively correlated to BL (sternum)/BW and
BL (sternum)/SL, and in all cases the latter correlation was much stronger. In the grey and
harbour seals the r value for the latter correlation was 0.91, and in the ringed seal it was as high
as 0.97 (Fig. 6, Table 2 and Fig. 8 respectively). In the grey and ringed seals the correlation
between the %fat and BL (sternum)/SL (Table 2 and Fig. 8) was even stronger than the one
between the %fat and BL (sternum)(Figs. 3 and 7), in the harbour seal it was also stronger but
only negligibly so (Figs. 5 and 6). Thus, in the grey and in the ringed seals, using BL
(sternum)/SL instead of just BL (sternum) alone as an indicator of body condition, might be a
good option if data on body weight is missing, thus preventing the calculation of %fat.
In both the harbour and ringed seals but not the grey seal, a significant positive relationship was
found between the %fat and BW, as well as between the %fat and BW/SL. In the harbour seal but
not the other seals, a significant positive relationship was also found between the %fat and SL,
this correlation being slightly stronger than the one between the %fat and BW (Table 2).
However, since none of these correlations were particularly strong, it would be advisable not to
use these indices if any of the previously mentioned, better indices are available.
It must be added here, that the aforementioned correlations between %fat (LMD-index) and the
different body condition indices must be interpreted with caution since BL (sternum), BW and SL
are all included in the calculation of the LMD-index, and one might thus expect a correlation for
this reason alone. On the other hand, since the LMD-index has been previously shown to be a
very accurate estimate of the true fat content of the body when compared to dissection data, one
might argue that if the condition indices correlate well with the LMD-index, then it is not
unreasonable to think that they would also correlate well with the true fat content of the body as
verified by dissection. Nevertheless, this data dependency must still be considered as a possible
source of error in this study.
Intra- and interannual variation
Both grey and harbour seals’ %fat was found to vary seasonally, being lower in spring and higher
in fall/winter (Figs. 9 and 10 respectively). This pattern is in agreement with previous studies on
seasonal variation in blubber thickness (Nilssen et al. 1997; Bäcklin et al. 2013; Hauksson 2013).
A significant decline was found in the fall/winter %fat of the healthy sexually mature female grey
seals caught by hunting over the time period 2002-2012, the average decrease rate being 0.84 %
per year (Fig. 11). There were also negative trends in mean BL (sternum) in all age and sex
classes among the grey seals, however none of these proved significant (Appendix 2, Figs. 16-
18). Perhaps with larger sample sizes these trends would also have proved significant, as was the
case in a previous study examining the variation in blubber thickness of Baltic seals (Bäcklin et
al. 2013). By contrast the mean BL (sternum) in harbour seals displayed a positive trend, this was
however also non-significant. A possible source of error is the choice of simple regression
analysis for testing the significance of the interannual trends, more sophisticated (and perhaps
more appropriate) statistical modelling was not used due to the limited time span of this study.
If there really is a declining trend in %fat, as the present study suggests for the healthy sexually
mature grey seal females, this could prove to be a serious problem for both adult survival and
reproductive success. This is because, like previously mentioned, blubber is important both for
individual survival and reproduction, being of utmost importance for lactation and cub survival.
The latter is especially true for a species like the grey seal which has maternal fasting during the
whole lactation period, depending exclusively on stored fat for survival and cub rearing. Such
reductions in fecundity due to thinning of the seals is not unheard of, and even increases in the
ages of maturity for both sexes has been documented for Barents Sea harp seals, Phoca
groenlandica (Kjellqwist et al. 1995). The fact that only healthy females were used makes this
finding even more interesting since this has not been previously shown for this source material
(Karin Hårding, personal communication, January 18, 2016). The underlying cause for the
declining trend in %fat of the seals is unknown. It could be due to several factors, including
disease, decreasing fish stocks, changes in diet or changes in the quality of diet. However, no link
to disease has been found so far in the Baltic seals (Bäcklin et al. 2013). Another reason could be
that the populations are reaching carrying capacity and the observed decrease is due to increased
population densities with concomitant increases in food competition. This is unlikely though, as
the Baltic grey seal populations are well below historical levels (Harding et al. 2013). It could be
however, that due to competition with the modern fishing industry, pollutants and other factors
introduced to the environment in modern times, the carrying capacity of the environment has
changed compared to its historical state.
Energetic comparison
In order to get a better sense of the variability in blubber content/nutritional status of the juvenile
seals and its implications, a relatively simplistic energetic comparison was done between the
fattest and thinnest healthy juvenile (1 year-old) grey seal caught during fall/winter (when they
are at their fattest). The absolute blubber mass in kg was found to vary substantially, with the
fattest individual having as much as 31.57 kg of blubber while the thinnest one only had 14.48 kg
(fig. 12).
To be able to level out this gap in absolute blubber mass, the thinnest seal would therefore have
to gain 17.09 kg in additional blubber (Table 3). How much it would need to eat and over how
long a time period to accomplish this was calculated by taking into account the fact that
metabolism is not 100 % efficient, the costs of maintenance and foraging and transport between
haul-out and foraging sites.
In order to simplify the calculations, the seal was assumed to have a diet consisting solely of
herring. The daily average amount of herring eaten was 1.22 kg, as it was calculated from the
average daily energy intake which was assumed to be constant since the seal reasonably would
not be able to eat much more than a certain amount per day (Härkönen and Heide-Jørgensen
1991). It was found that the seal would need to eat a total amount of 490.92 kg of herring over a
time period of 403.54 additional days (Table 4). These results suggest that the difference in
absolute blubber mass/nutritional status between the fattest and thinnest seals corresponds to a
substantial amount of ingested food. It points to the conclusion that it will be impossible for the
thinnest seals to reach the same blubber content as the fattest in a cohort, thus a good early start
with lactation and early foraging success during the first month is pivotal.
A caveat must be mention here, namely that these results must be interpreted with caution, since
all of the calculations relied on numbers previously applied only to juvenile harbour and not grey
seals, and a series of rather simplistic assumptions were made, due primarily to the limited
timescale available for this study. Examples of possible sources of error include that the value for
mean daily energy intake was based on a low end estimate from a previous study and that the fact
that the seal’s energy intake, maintenance energy requirement as well as foraging and transport
costs would likely be altered as the seal grew each consecutive day was not accounted for. Thus,
the current results are likely to be an underestimate of the seal’s true feeding capacity and growth
rate. However, they still illustrate the order of magnitude of energy requirements and that there
exists substantial differences among healthy juvenile grey seals with regard to blubber
content/nutritional status, and that these differences may reflect differences in factors such as
lactation and foraging success. Furthermore, it should be noted that since only healthy seals were
selected for the calculations, disease related differences in blubber content/nutritional status can
be excluded.
Conclusions
The sternum blubber thickness, the most widely used measuring site of blubber thickness in
pinnipeds, was found to correlate well with the %fat in all three species studied here. Thus,
suggesting that it is a good indicator of total blubber content/nutritional status. Dorsal and
sternum blubber thicknesses were also found to correlate well with each other, suggesting that
sternum blubber thickness can substitute the dorsal measure for calculating %fat if the latter is
missing. A correction to compensate for the difference between the two can be done by
increasing all sternum values by 11.4 % before calculating the %fat. In agreement with previous
studies, a seasonal variation in %fat, with a decrease in spring and increase in fall/winter was
found. A significant decrease in the %fat was found over the years 2002-2012 for sexually
mature grey seal females. This trend could pose a future problem for both individual survival and
reproduction. The underlying cause is as yet unknown, but may be related to factors such as
decreasing fish stocks, dietary changes and population density related factors. Absolute blubber
mass of juvenile grey seals varied widely among individuals. Simple energetic modelling
suggested that these differences in blubber content corresponded to substantial differences in
amounts of ingested food between fatter and leaner seals of the same cohort. This may reflect
differences in lactation and foraging success. Thus, a good early start in the life of the juveniles,
with proper lactation and good early foraging success seems to be crucial.
Acknowledgements
I would like to thank my supervisor at the Department of Biological and Environmental Sciences
(BioEnv) at the University of Gothenburg, Karin Hårding, who introduced me to the study
subject, and helped me throughout the entire project. I would also like to thank Britt Marie
Bäcklin, Tero Härkönen and Charlotta Moraeus at the NRM for providing me with the data, as
well as Kamran Chabokdavan at BioEnv for helping me with manual input of data, interpretation
of the results and general advice.
References
Abt, K. F., N. Hoyer, L. Koch and D. Adelung (2002). "The dynamics of grey seals (Halichoerus grypus) off Amrum in the south-eastern North Sea — evidence of an open population." Journal of Sea Research 47(1): 55-67.
Andersen, S. M., J. Teilmann, P. B. Harders, E. H. Hansen and D. Hjøllund (2007). "Diet of harbour seals and great cormorants in Limfjord, Denmark: interspecific competition and interaction with fishery." ICES Journal of Marine Science: Journal du Conseil 64(6): 1235-1245.
Arnould, J. P. (1995). "Indices of body condition and body composition in female Antarctic fur seals (Arctocephalus gazella)." Marine Mammal Science 11(3): 301-313.
Arnould, J. P., I. L. Boyd and J. R. Speakman (1996). "Measuring the body composition of Antarctic fur seals (Arctocephalus gazella): validation of hydrogen isotope dilution." Physiological Zoology: 93-116.
Bowen, W., C. E. Heyer, J. I. McMillan and S. J. Iverson (2015). "Offspring size at weaning affects survival to recruitment and reproductive performance of primiparous gray seals." Ecology and evolution 5(7): 1412-1424.
Bowen, W. D., O. T. Oftedal and D. J. Boness (1992). "Mass and energy transfer during lactation in a small phocid, the harbor seal (Phoca vitulina)." Physiological Zoology: 844-866.
Bäcklin, B.-M., C. Moraeus, K. Kauhala and M. Isomursu (2013). "Nutritional status of seals." HELCOM Core Indicator Report.
Fish, F. E. (2000). "Biomechanics and Energetics in Aquatic and Semiaquatic Mammals: Platypus to Whale*." Physiological and Biochemical Zoology 73(6): 683-698.
Harding, K. C., M. Fujiwara, Y. Axberg and T. Härkönen (2005). "Mass‐dependent energetics and survival in Harbour Seal pups." Functional Ecology 19(1): 129-135.
Harding, K. C., T. Härkönen, B. Helander and O. Karlsson (2007). "Status of Baltic grey seals: Population assessment and extinction risk." NAMMCO Scientific Publications 6: 33-56.
Hauksson, E. (2013). "Growth and reproduction in the Icelandic grey seal." NAMMCO Scientific Publications 6: 153-162.
Härkönen, T., A. Galatius, S. Bräeger, O. Karlsson and M. Ahola (2013). Population growth rate, abundance and distribution of marine mammals, Helsinki Commission-HELCOM.
Härkönen, T. and M.-P. Heide-Jørgensen (1991). "The harbour seal Phoca vitulina as a predator in the Skagerrak." Ophelia 34(3): 191-207.
Jüssi, M., T. Härkönen, E. Helle and I. Jüssi (2008). "Decreasing ice coverage will reduce the breeding success of Baltic grey seal (Halichoerus grypus) females." AMBIO 37(2): 80-85.
Kauhala, K., M. Kurkilahti, M. P. Ahola, A. Herrero, O. Karlsson, M. Kunnasranta, R. Tiilikainen and M. Vetemaa (2015). "Age, sex and body condition of Baltic grey seals: Are problem seals a random sample of the population?" Annales Zoologici Fennici, BioOne 52(1-2):103-114
Kjellqwist, S. A., T. Haug and T. Øritsland (1995). "Trends in age-composition, growth and reproductive parameters of Barents Sea harp seals, Phoca groenlandica." ICES Journal of Marine Science: Journal du Conseil 52(2): 197-208.
Kokko, H., J. Lindström and E. Ranta (1997). "Risk analysis of hunting of seal populations in the Baltic." Conservation Biology 11(4): 917-927.
Kovacs, K., Lowry, L. & Härkönen, T. (2008). " Pusa hispida. The IUCN Red List of Threatened Species." Retrieved 2015-05-21, from http://www.iucnredlist.org/details/41672/0.
Lundström, K., O. Hjerne, S.-G. Lunneryd and O. Karlsson (2010). "Understanding the diet composition of marine mammals: grey seals (Halichoerus grypus) in the Baltic Sea." ICES Journal of Marine Science: Journal du Conseil 67(6): 1230-1239.
Markussen, N. H., M. Ryg and N. A. Øritsland (1990). "Energy requirements for maintenance and growth of captive harbour seals, Phoca vitulina." Canadian Journal of Zoology 68(3): 423-426.
Mellish, J.-A. E., M. Horning and A. E. York (2007). "Seasonal and spatial blubber depth changes in captive harbor seals (Phoca vitulina) and Steller's sea lions (Eumetopias jubatus)." Journal of Mammalogy 88(2): 408-414.
Mellish, J.-A. E., P. A. Tuomi and M. Horning (2004). "Assessment of ultrasound imaging as a noninvasive measure of blubber thickness in pinnipeds." Journal of Zoo and Wildlife Medicine 35(1): 116-118.
Nilssen, K., T. Haug, P. Grotnes and V. Potelov (1997). "Seasonal variation in body condition of adult Barents Sea harp seals (Phoca groenlandica)." Journal of Northwest Atlantic Fishery Science 22: 17-25.
Noren, S. R., L. E. Pearson, J. Davis, S. J. Trumble and S. B. Kanatous (2008). "Different thermoregulatory strategies in nearly weaned pup, yearling, and adult Weddell seals (Leptonychotes weddelli)." Physiological and Biochemical Zoology 81(6): 868-879.
Noren, S. R., M. S. Udevitz, L. Triggs, J. Paschke, L. Oland and C. V. Jay (2014). "Identifying a reliable blubber measurement site to assess body condition in a marine mammal with topographically variable blubber, the Pacific walrus." Marine Mammal Science 31(2): 658-676.
Nyman, M., J. Koistinen, M. L. Fant, T. Vartiainen and E. Helle (2002). "Current levels of DDT, PCB and trace elements in the Baltic ringed seals (Phoca hispida baltica) and grey seals (Halichoerus grypus)." Environmental Pollution 119(3): 399-412.
Oftedal, O. T., W. D. Bowen and D. J. Boness (1996). "Lactation performance and nutrient deposition in pups of the harp seal, Phoca groenlandica, on ice floes off southeast Labrador." Physiological Zoology: 635-657.
Olsen, M. T., L. W. Andersen, R. Dietz, J. Teilmann, T. Härkönen and H. R. Siegismund (2014). "Integrating genetic data and population viability analyses for the identification of harbour seal (Phoca vitulina) populations and management units." Molecular Ecology 23(4): 815-831.
Pitcher, K., D. Calkins and G. Pendleton (2000). "Steller sea lion body condition indices." Marine Mammal Science 16(2): 427-436.
Reilly, J. J. and M. A. Fedak (1990). "Measurement of the body composition of living gray seals by hydrogen isotope dilution." Journal of Applied Physiology 69(3): 885-891.
Ryg, M., C. Lydersen, N. H. Markussen, T. G. Smith and N. A. Øritsland (1990). "Estimating the blubber content of phocid seals." Canadian Journal of Fisheries and Aquatic Sciences 47(6): 1223-1227.
Sparling, C. E., J. R. Speakman and M. A. Fedak (2006). "Seasonal variation in the metabolic rate and body composition of female grey seals: fat conservation prior to high-cost reproduction in a capital breeder?" Journal of Comparative Physiology B 176(6): 505-512.
Stephens, P. A., A. I. Houston, K. C. Harding, I. L. Boyd and J. M. McNamara (2014). "Capital and income breeding: the role of food supply." Ecology 95(4): 882-896.
Sundqvist, L., T. Harkonen, C. J. Svensson and K. C. Harding (2012). "Linking climate trends to population dynamics in the Baltic ringed seal: Impacts of historical and future winter temperatures." Ambio 41(8): 865-872.
Thompson, D. and T. Härkönen. (2008a). "Halichoerus grypus. The IUCN Red List of Threatened Species. ." Retrieved 2015-09-02, from http://www.iucnredlist.org/details/9660/0.
Thompson, D. and T. Härkönen. (2008b). "Phoca vitulina. The IUCN Red List of Threatened Species. ." Retrieved 2015-05-19, from http://www.iucnredlist.org/details/17013/0.
Webb, P., D. Crocker, S. Blackwell, D. Costa and B. Boeuf (1998). "Effects of buoyancy on the diving behavior of northern elephant seals." The Journal of experimental biology 201(16): 2349-2358.
Worthington Wilmer, J., P. Allen, P. Pomeroy, S. Twiss and W. Amos (1999). "Where have all the fathers gone? An extensive microsatellite analysis of paternity in the grey seal (Halichoerus grypus)." Molecular Ecology 8(9): 1417-1429.
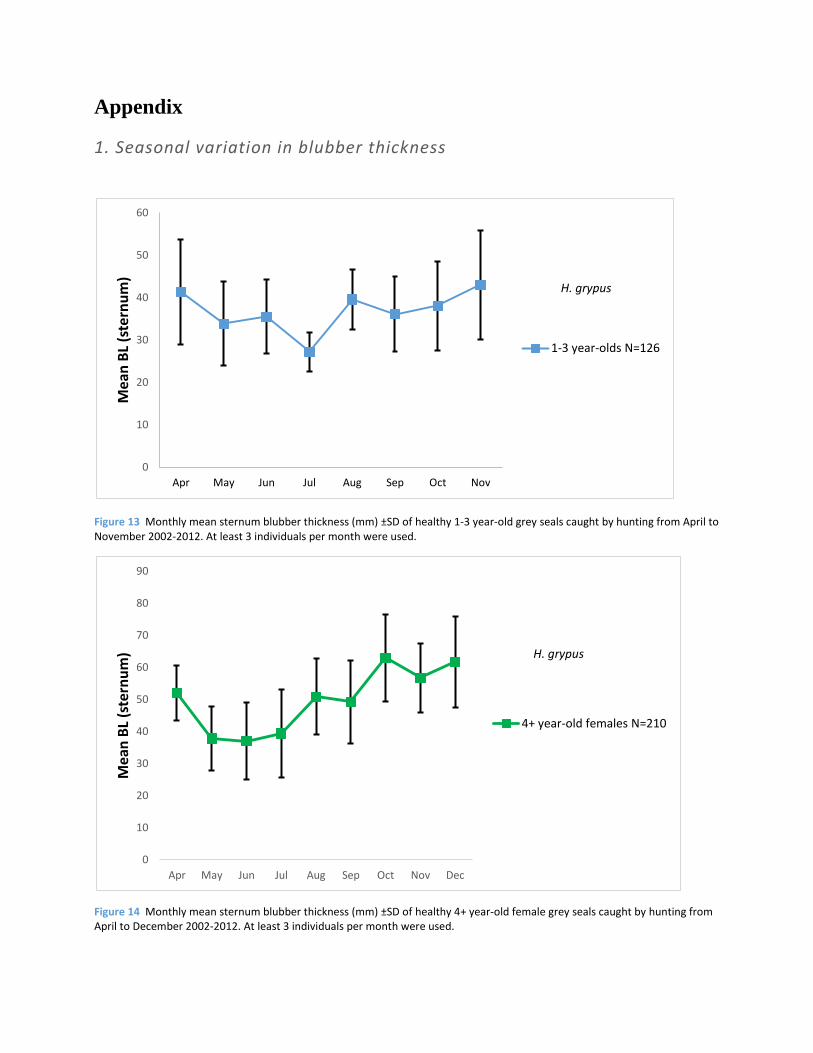
Appendix
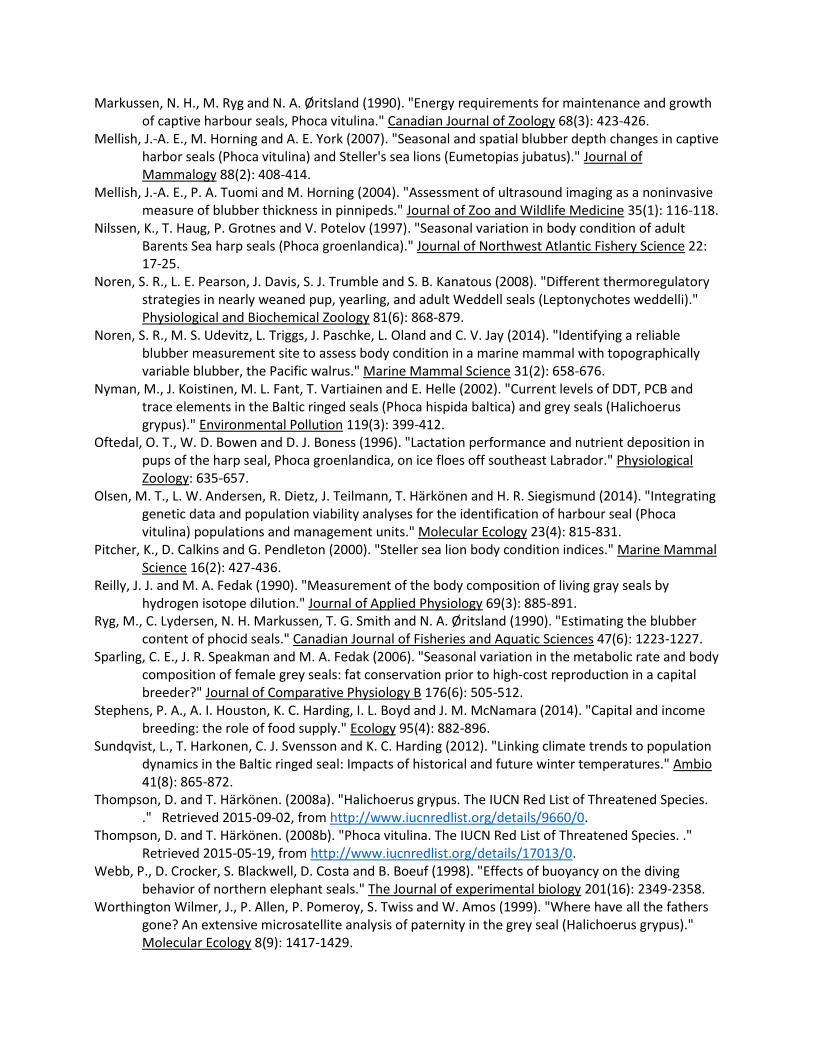
1. Seasonal variation in blubber thickness
Figure 13 Monthly mean sternum blubber thickness (mm) ±SD of healthy 1-3 year-old grey seals caught by hunting from April to November 2002-2012. At least 3 individuals per month were used.
Figure 14 Monthly mean sternum blubber thickness (mm) ±SD of healthy 4+ year-old female grey seals caught by hunting from April to December 2002-2012. At least 3 individuals per month were used.
0
10
20
30
40
50
60
Apr May Jun Jul Aug Sep Oct Nov
Mea
n B
L (s
tern
um
)
1-3 year-olds N=126
H. grypus
0
10
20
30
40
50
60
70
80
90
Apr May Jun Jul Aug Sep Oct Nov Dec
Mea
n B
L (s
tern
um
)
4+ year-old females N=210
H. grypus
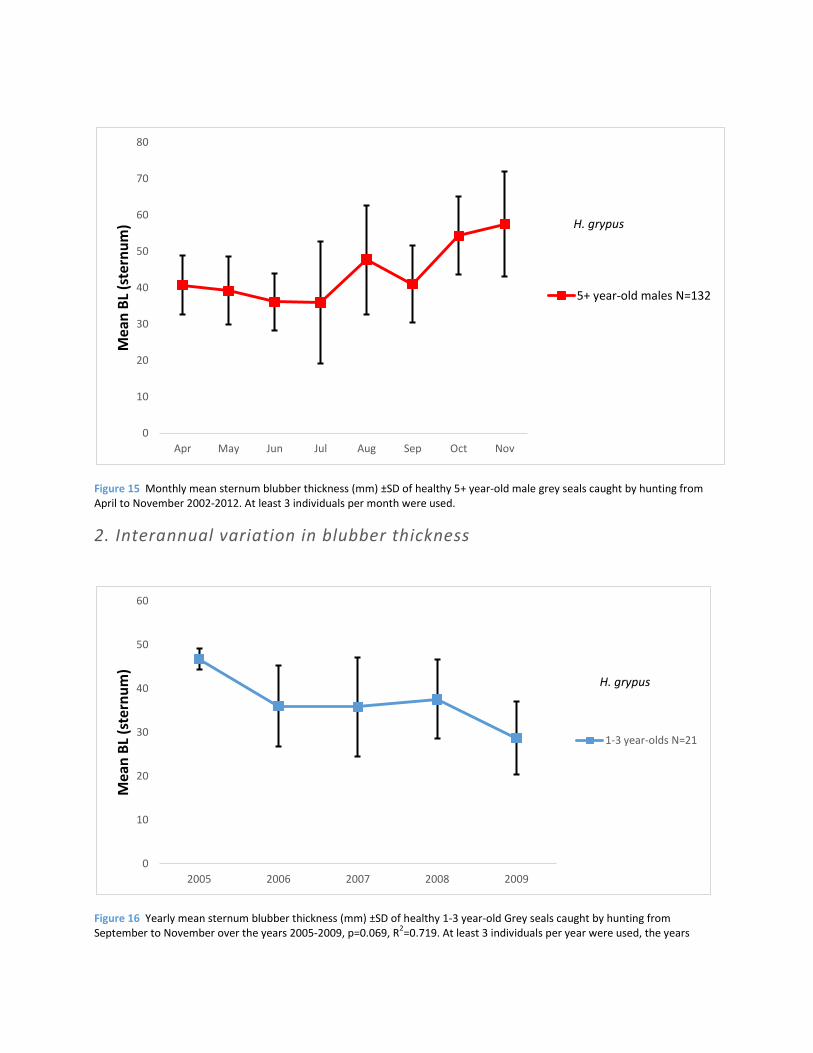
Figure 15 Monthly mean sternum blubber thickness (mm) ±SD of healthy 5+ year-old male grey seals caught by hunting from April to November 2002-2012. At least 3 individuals per month were used.
2. Interannual variation in blubber thickness
Figure 16 Yearly mean sternum blubber thickness (mm) ±SD of healthy 1-3 year-old Grey seals caught by hunting from September to November over the years 2005-2009, p=0.069, R
2=0.719. At least 3 individuals per year were used, the years
0
10
20
30
40
50
60
70
80
Apr May Jun Jul Aug Sep Oct Nov
Mea
n B
L (s
tern
um
)
5+ year-old males N=132
H. grypus
0
10
20
30
40
50
60
2005 2006 2007 2008 2009
Mea
n B
L (s
tern
um
)
1-3 year-olds N=21
H. grypus
excluded did not meet this minimal sample size. Non-significant negative trend.
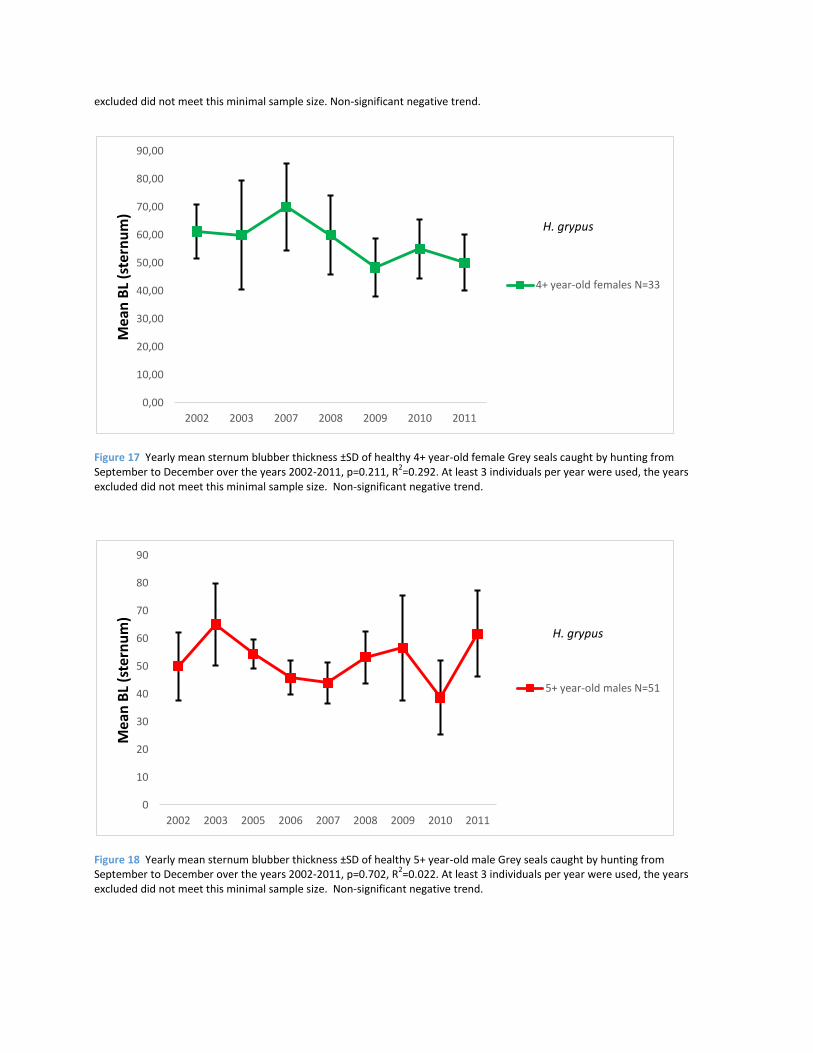
Figure 17 Yearly mean sternum blubber thickness ±SD of healthy 4+ year-old female Grey seals caught by hunting from September to December over the years 2002-2011, p=0.211, R
2=0.292. At least 3 individuals per year were used, the years
excluded did not meet this minimal sample size. Non-significant negative trend.
Figure 18 Yearly mean sternum blubber thickness ±SD of healthy 5+ year-old male Grey seals caught by hunting from September to December over the years 2002-2011, p=0.702, R
2=0.022. At least 3 individuals per year were used, the years
excluded did not meet this minimal sample size. Non-significant negative trend.
0,00
10,00
20,00
30,00
40,00
50,00
60,00
70,00
80,00
90,00
2002 2003 2007 2008 2009 2010 2011
Mea
n B
L (s
tern
um
)
4+ year-old females N=33
H. grypus
0
10
20
30
40
50
60
70
80
90
2002 2003 2005 2006 2007 2008 2009 2010 2011
Mea
n B
L (s
tern
um
)
5+ year-old males N=51
H. grypus