biospace co., ltd. biospace, inc. biospace japan, inc ... such, certain precautionary steps should...
TRANSCRIPT

Certifications and patents obtained by Biospace
U.S. patent U.S. 5720296 Canada patent C.N. 2225184 German patent France patent England patent Italy patent Japan patent
????
O2@@@6K?g
?
O20Me
?I46K?f
?
W20Mg
?I46X?e
?
7<h
e
?B1?e
?
?J5?e
?O2@@@6Xe
3Le
?
?7H??W2(M??I'1e
N1e
?
J5e
W&(Yf
V'L??3L??
7He
7@H?f
?V/??N1??
?J5?e
@5h
f
3L?
?7H??J@Hh
f
N1?
?@e
?7@?h
f
?@?
?@e
?@@?h
f
?@?
?@e
?@@?h
f
?@?
?3L??3@Lh
f
J5?
?N1??N@1h
f
7H?
3Le
3@L?f
?W.??J5??
N1e
V')Kf
O.Y??7H??
?3L??V4@6KO20Ye
J5e
?
?N1?e
?I4@0Mf
7He
?
3=h
e
?C5?e
?
V46Kg
?O20Y?e
?
I46Ke
?O20M?f
?
I4@@@0M?g
? 2004 Biospace Co., Ltd. All rights reserved. BSPR-PB27-04E-00-041102
Biospace Co., Ltd.
TEL : +82-2-501-3939
FAX : +82-2-501-3978
Homepage : http://www.biospace.co.kr
E-mail : [email protected]
Biospace, Inc.
TEL : +1-310-358-0360
FAX : +1-310-358-0370
Homepage : http://www.biospaceamerica.com
E-mail : [email protected]
Biospace Japan, Inc.
TEL : +81-3-5298-7667
FAX : +81-3-5298-7668
Homepage : http://www.biospace.co.jp
E-mail : [email protected]
DanilSMC Co., Ltd. [Asia]
TEL : +82-2-3462-5400
FAX : +82-2-3462-5105
E-mail : [email protected]
Results Interpretation & Application

INTRODUCTION
This manual provides a detailed explanation of InBody720 Body Composition Analyzer and its functions. This manual makes use of
actual examinees??
?W-X ??7@1 ??3@@ ??N@5 ??J(Y ??.Y? ?
???????????????????
results to explain the following: the meaning of various analyses; what constitutes the standard range for a particular
test; what kind of health management measures are required; and how to properly use this piece of equipment. Please read this manual
carefully before using our InBody720 Body Composition Analyzer in your everyday life.
www.biospace.co.kr
1 Body Composition Analysis
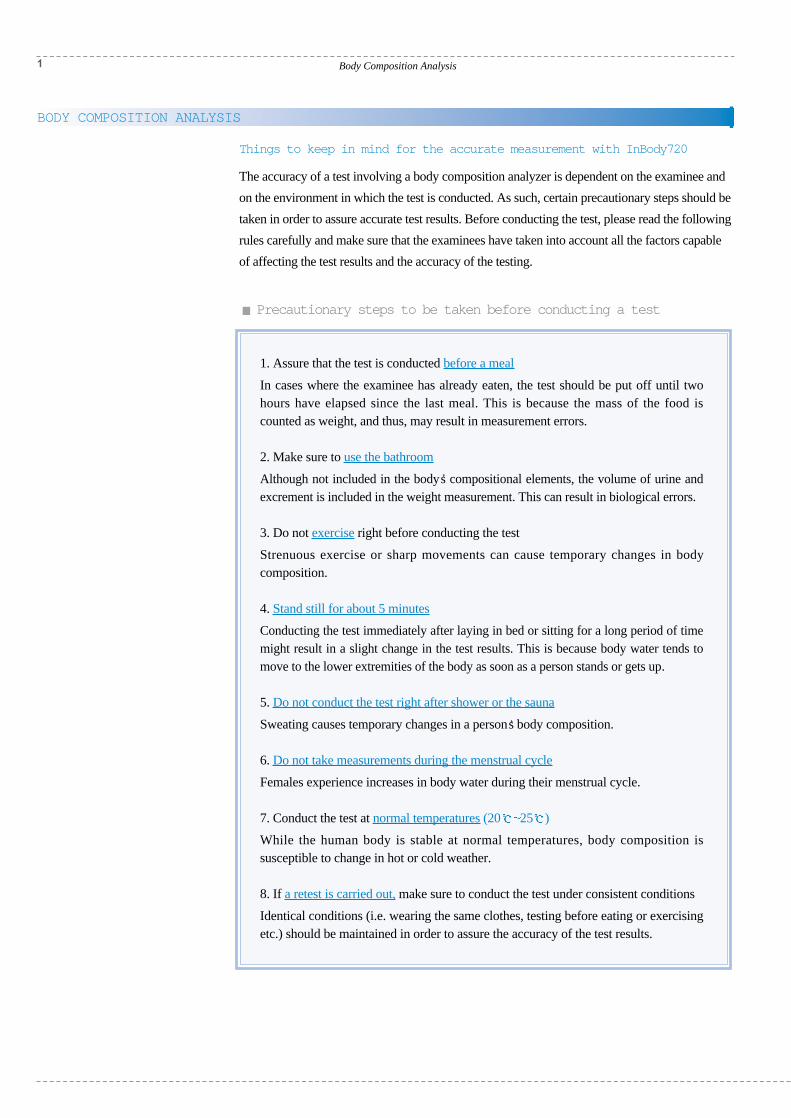
Things to keep in mind for the accurate measurement with InBody720
The accuracy of a test involving a body composition analyzer is dependent on the examinee and
on the environment in which the test is conducted. As such, certain precautionary steps should be
taken in order to assure accurate test results. Before conducting the test, please read the following
rules carefully and make sure that the examinees have taken into account all the factors capable
of affecting the test results and the accuracy of the testing.
@@@@@@@@@@@@@?g@@@@@@@@@@@@@?g@@@@@@@@@@@@@?g@@@@@@@@@@@@@?g@@@@@@@@@@@@@?g@@@@@@@@@@@@@?g@@@@@@@@@@@@@?g@@@@@@@@@@@@@?g@@@@@@@@@@@@@?g@@@@@@@@@@@@@?g@@@@@@@@@@@@@?g@@@@@@@@@@@@@?g@@@@@@@@@@@@@?gPrecautionary steps to be taken before conducting a test
BODY COMPOSITION ANALYSIS
1. Assure that the test is conducted before a meal
In cases where the examinee has already eaten, the test should be put off until twohours have elapsed since the last meal. This is because the mass of the food iscounted as weight, and thus, may result in measurement errors.
2. Make sure to use the bathroom
Although not included in the body??
?W-X ??7@1 ??3@@ ??N@5 ??J(Y ??.Y? ?
???????????????????
s compositional elements, the volume of urine andexcrement is included in the weight measurement. This can result in biological errors.
3. Do not exercise right before conducting the test
Strenuous exercise or sharp movements can cause temporary changes in bodycomposition.
4. Stand still for about 5 minutes
Conducting the test immediately after laying in bed or sitting for a long period of timemight result in a slight change in the test results. This is because body water tends tomove to the lower extremities of the body as soon as a person stands or gets up.
5. Do not conduct the test right after shower or the sauna
Sweating causes temporary changes in a person??
?W-X ??7@1 ??3@@ ??N@5 ??J(Y ??.Y? ?
???????????????????
s body composition.
6. Do not take measurements during the menstrual cycle
Females experience increases in body water during their menstrual cycle.
7. Conduct the test at normal temperatures (20 25 )
While the human body is stable at normal temperatures, body composition issusceptible to change in hot or cold weather.
8. If a retest is carried out, make sure to conduct the test under consistent conditions
Identical conditions (i.e. wearing the same clothes, testing before eating or exercisingetc.) should be maintained in order to assure the accuracy of the test results.
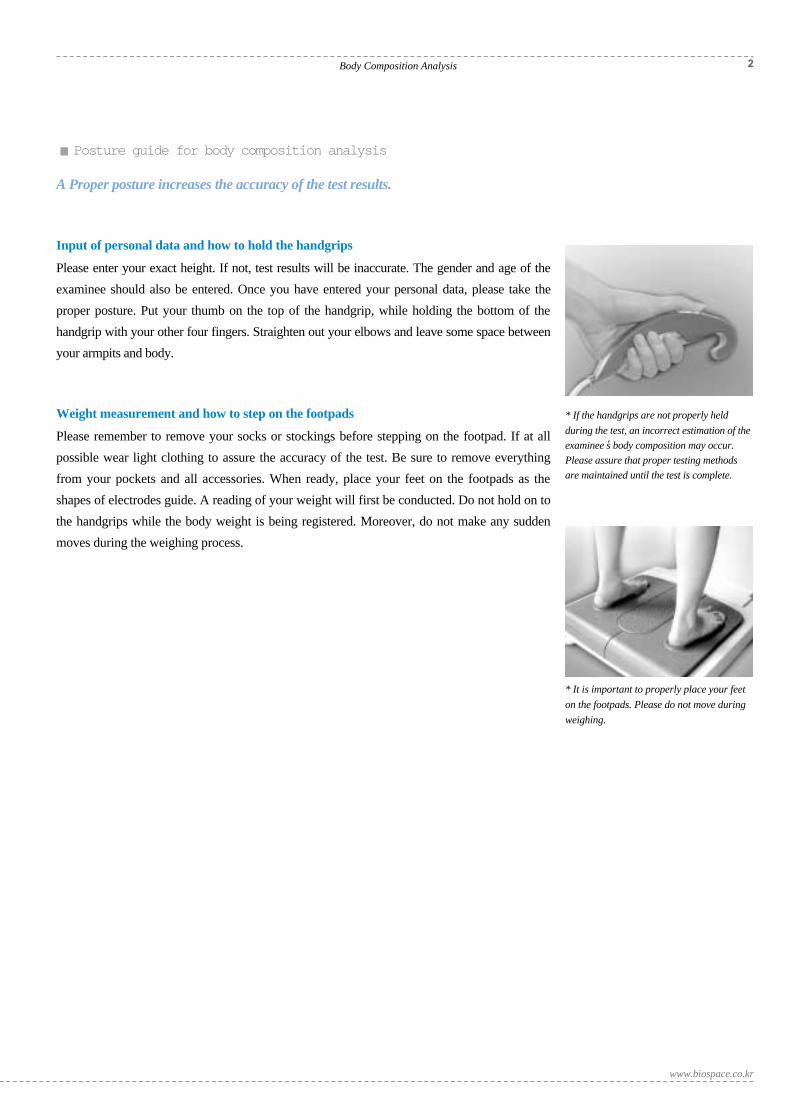
@@@@@@@@@@@@@?g@@@@@@@@@@@@@?g@@@@@@@@@@@@@?g@@@@@@@@@@@@@?g@@@@@@@@@@@@@?g@@@@@@@@@@@@@?g@@@@@@@@@@@@@?g@@@@@@@@@@@@@?g@@@@@@@@@@@@@?g@@@@@@@@@@@@@?g@@@@@@@@@@@@@?g@@@@@@@@@@@@@?g@@@@@@@@@@@@@?gPosture guide for body composition analysis
A Proper posture increases the accuracy of the test results.
Input of personal data and how to hold the handgrips
Please enter your exact height. If not, test results will be inaccurate. The gender and age of the
examinee should also be entered. Once you have entered your personal data, please take the
proper posture. Put your thumb on the top of the handgrip, while holding the bottom of the
handgrip with your other four fingers. Straighten out your elbows and leave some space between
your armpits and body.
Weight measurement and how to step on the footpads
Please remember to remove your socks or stockings before stepping on the footpad. If at all
possible wear light clothing to assure the accuracy of the test. Be sure to remove everything
from your pockets and all accessories. When ready, place your feet on the footpads as the
shapes of electrodes guide. A reading of your weight will first be conducted. Do not hold on to
the handgrips while the body weight is being registered. Moreover, do not make any sudden
moves during the weighing process.
* If the handgrips are not properly held
during the test, an incorrect estimation of the
examinee?
?W-X ?W&@) ?*@@H ?N@5? ?J(Y? ?.Y ?
?????????????????????
s body composition may occur.
Please assure that proper testing methods
are maintained until the test is complete.
* It is important to properly place your feet
on the footpads. Please do not move during
weighing.
2Body Composition Analysis
www.biospace.co.kr
3 Example
EXAMPLE
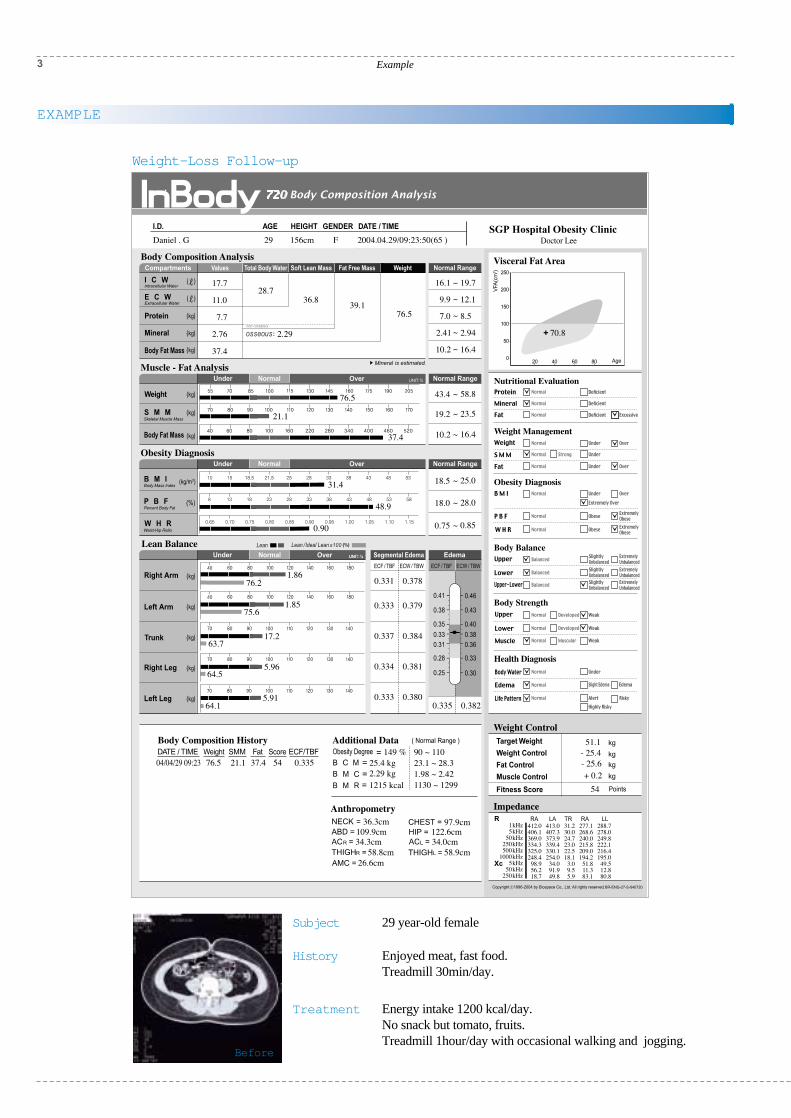
Subject 29 year-old female
History Enjoyed meat, fast food.Treadmill 30min/day.
Treatment Energy intake 1200 kcal/day.No snack but tomato, fruits.Treadmill 1hour/day with occasional walking and jogging.
Before
Weight-Loss Follow-up
4Example
www.biospace.co.kr
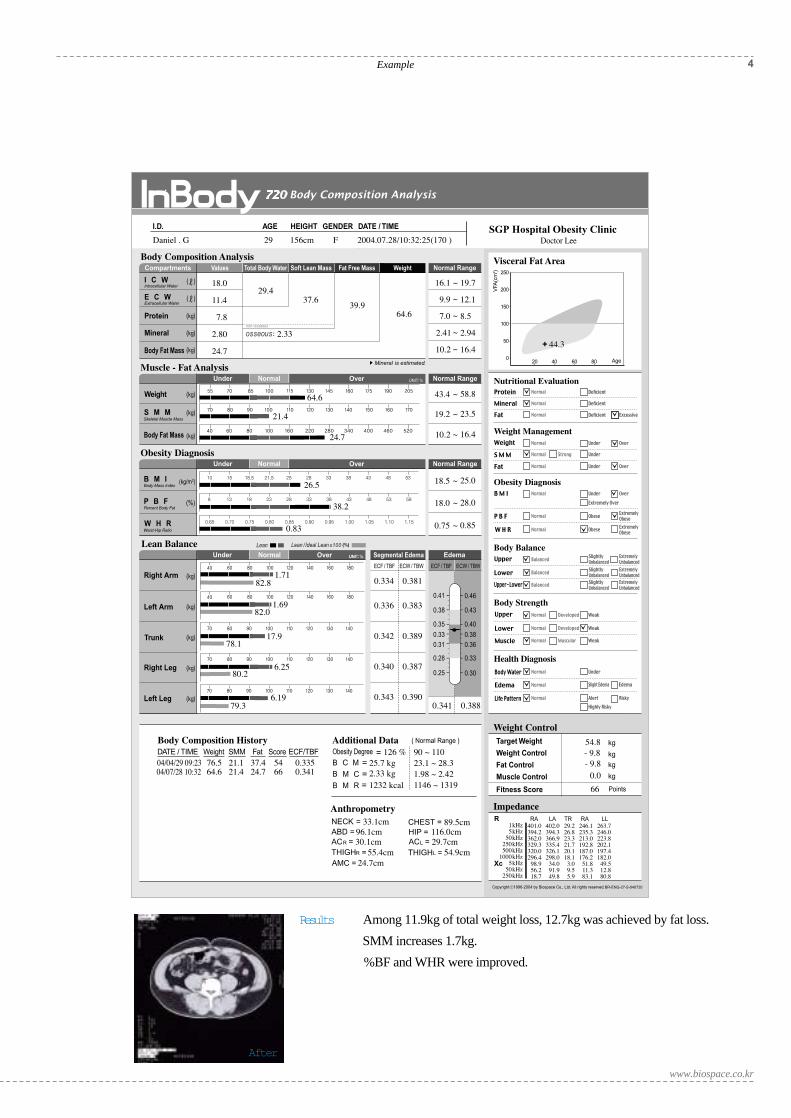
After
Results Among 11.9kg of total weight loss, 12.7kg was achieved by fat loss.
SMM increases 1.7kg.
%BF and WHR were improved.
5 Results interpretation & application
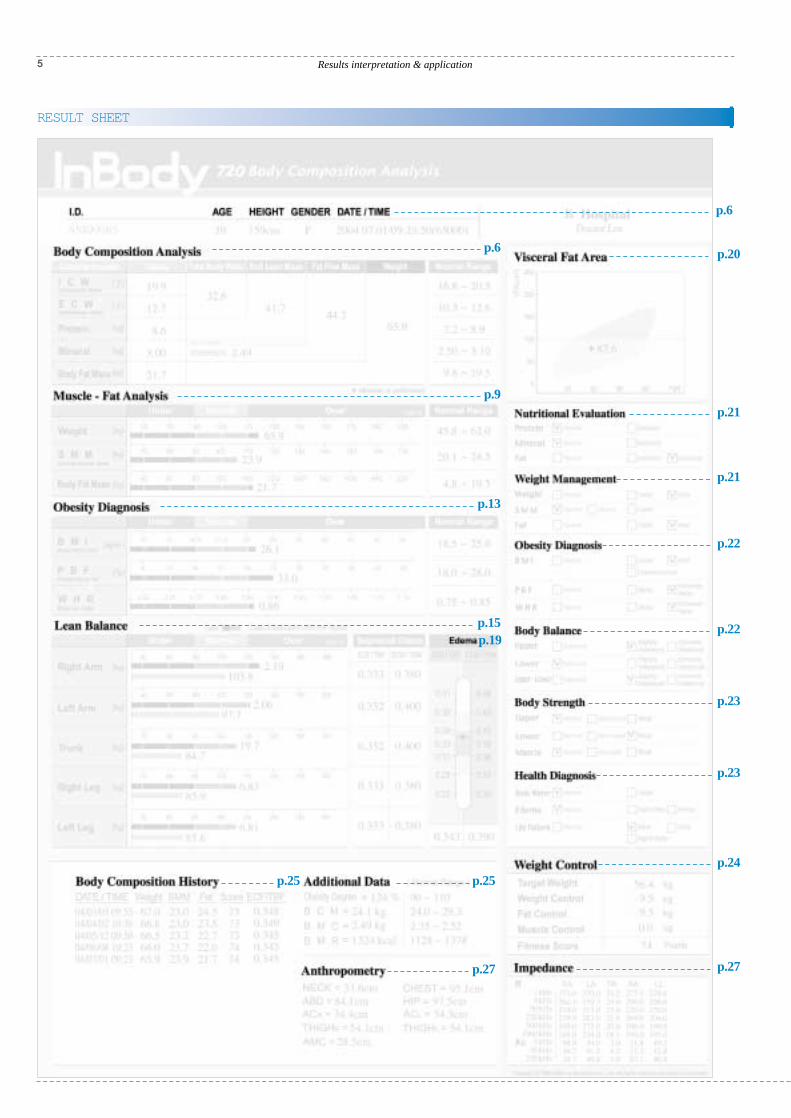
RESULT SHEET
p.20p.6
p.9
p.13
p.15p.19
p.25p.25
p.27
p.6
p.21
p.21
p.22
p.22
p.23
p.23
p.24
p.27
I.D., AGE, HEIGHT, GENDER, DATE/TIME
Once the body composition analysis of the examinee is complete, the results are automatically printed.
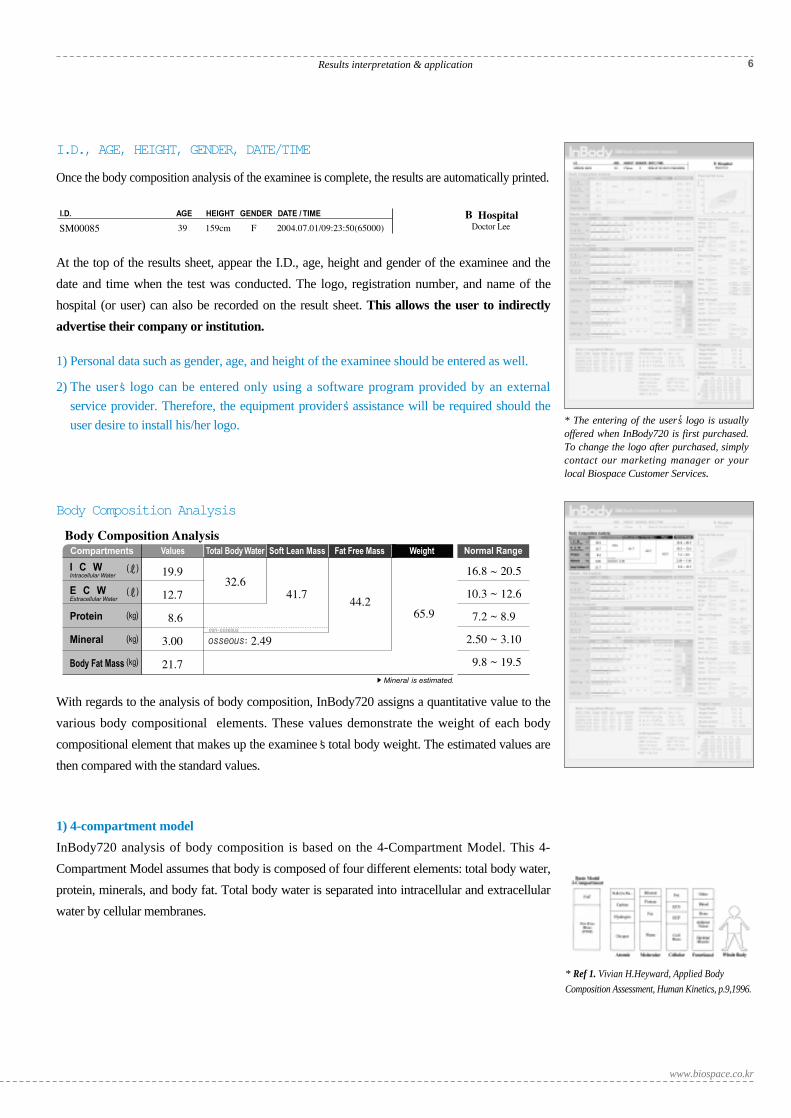
At the top of the results sheet, appear the I.D., age, height and gender of the examinee and the
date and time when the test was conducted. The logo, registration number, and name of the
hospital (or user) can also be recorded on the result sheet. This allows the user to indirectly
advertise their company or institution.
1) Personal data such as gender, age, and height of the examinee should be entered as well.
2) The user??
?W-X ??7@1 ??3@@ ??N@5 ??J(Y ??.Y? ?
???????????????????
s logo can be entered only using a software program provided by an external
service provider. Therefore, the equipment provider??
?W-X ??7@1 ??3@@ ??N@5 ??J(Y ??.Y? ?
???????????????????
s assistance will be required should the
user desire to install his/her logo.
Body Composition Analysis
With regards to the analysis of body composition, InBody720 assigns a quantitative value to the
various body compositional elements. These values demonstrate the weight of each body
compositional element that makes up the examinee??
?W-X ??7@1 ??3@@ ??N@5 ??J(Y ??.Y? ?
???????????????????
s total body weight. The estimated values are
then compared with the standard values.
1) 4-compartment model
InBody720 analysis of body composition is based on the 4-Compartment Model. This 4-
Compartment Model assumes that body is composed of four different elements: total body water,
protein, minerals, and body fat. Total body water is separated into intracellular and extracellular
water by cellular membranes.
6Results interpretation & application
www.biospace.co.kr
* Ref 1. Vivian H.Heyward, Applied Body
Composition Assessment, Human Kinetics, p.9,1996.
* The entering of the user?
?W-X ?W&@) ?*@@H ?N@5? ?J(Y? ?.Y ?
?????????????????????
s logo is usuallyoffered when InBody720 is first purchased.To change the logo after purchased, simplycontact our marketing manager or yourlocal Biospace Customer Services.
/Xe@??W.?eV/X?@?W.Y?e?V/[email protected]@@@H?fJ@@@L?f
?W.Y@V/XfW.Y?@?V/X?e.Ye@??V/?e
7 Results interpretation & application
2) Intracellular water(ICW), Extracellular water(ECW), Total Body Water(TBW)
InBody720 measures TBW by using a multi-frequency technique that separates TBW into ICW
and ECW. Intracellular water (ICW) indicates the quantity of water within cellular membrane.
Extracellular water (ECW) indicates the total quantity of water in the interstitial fluid and blood. In
the case of a healthy body, the proportion of ICW and ECW should be maintained at about 3:2.
Total Body Water (TBW) = Intracellular Water (ICW) + Extracellular Water (ECW)
3) Protein
Protein is a solid organic compound that consists of nitrogen and can be found in body cells.
Protein is also the main component, along with body water, of Soft Lean Mass. Protein is directly
related to intracellular water. Therefore, a lack of protein indicates a lack of intracellular water,
which in turn implies poor cell nutrition.
4) Mineral
Minerals help the body preserve tand play a core role in the human body. InBody720 analyzes
two large groups of minerals: osseous minerals and non-osseous minerals. Osseous minerals are
the minerals found in the bones while non-osseous minerals are those which are found in all other
parts of the body. Osseous minerals account for about 80% of the body??
?W-X ??7@1 ??3@@ ??N@5 ??J(Y ??.Y? ?
???????????????????
s total minerals. The
quantity of minerals found in the body is closely related to the muscle mass. As muscle mass
increases, the weight of bones also increases.
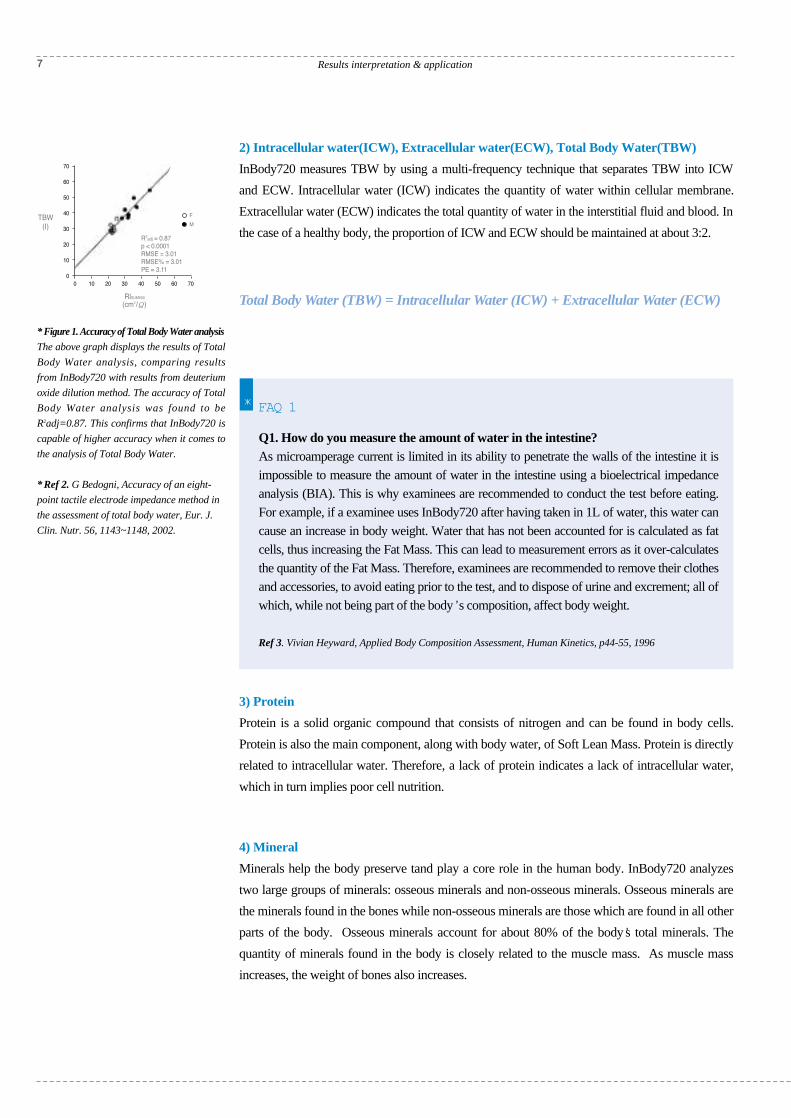
* Figure 1. Accuracy of Total Body Water analysis
The above graph displays the results of Total
Body Water analysis, comparing results
from InBody720 with results from deuterium
oxide dilution method. The accuracy of Total
Body Water analysis was found to be
R2adj=0.87. This confirms that InBody720 is
capable of higher accuracy when it comes to
the analysis of Total Body Water.
* Ref 2. G Bedogni, Accuracy of an eight-
point tactile electrode impedance method in
the assessment of total body water, Eur. J.
Clin. Nutr. 56, 1143~1148, 2002.
FAQ 1
Q1. How do you measure the amount of water in the intestine?As microamperage current is limited in its ability to penetrate the walls of the intestine it is
impossible to measure the amount of water in the intestine using a bioelectrical impedance
analysis (BIA). This is why examinees are recommended to conduct the test before eating.
For example, if a examinee uses InBody720 after having taken in 1L of water, this water can
cause an increase in body weight. Water that has not been accounted for is calculated as fat
cells, thus increasing the Fat Mass. This can lead to measurement errors as it over-calculates
the quantity of the Fat Mass. Therefore, examinees are recommended to remove their clothes
and accessories, to avoid eating prior to the test, and to dispose of urine and excrement; all of
which, while not being part of the body??
?W-X ??7@1 ??3@@ ??N@5 ??J(Y ??.Y? ?
???????????????????
s composition, affect body weight.
Ref 3. Vivian Heyward, Applied Body Composition Assessment, Human Kinetics, p44-55, 1996

5) Body Fat Mass
Body Fat Mass refers to the total quantity of Lipids that can be extracted from fat and other cells.
Body Fat Mass cannot be directly estimated using the BIA method, but rather is calculated by
excluding Fat Free Mass from body weight.
Body Fat Mass = Body Weight - Fat Free Mass(FFM)
Body Fat Mass is stored under the skin, as well as between the abdomen and muscles. When an
examinee??
?W-X ??7@1 ??3@@ ??N@5 ??J(Y ??.Y? ?
???????????????????
s body fat mass is outside of the standard range, he/she is diagnosed as being obese.
6) Soft Lean Mass
Soft Lean Mass can be calculated by excluding the mineral found in the bones from Fat Free Mass.
7) Fat Free Mass
Fat Free Mass consists of the weight of the remaining components once Body Fat Mass has been
excluded from body weight.
8) Weight
Weight consists of Body Water, Protein, Mineral and Body Fat Mass. Thus, body weight is the
sum total of these four body components.
Weight = Total Body Water + Protein Mass + Mineral Mass + Body Fat Mass
8Results interpretation & application
www.biospace.co.kr
9 Results interpretation & application
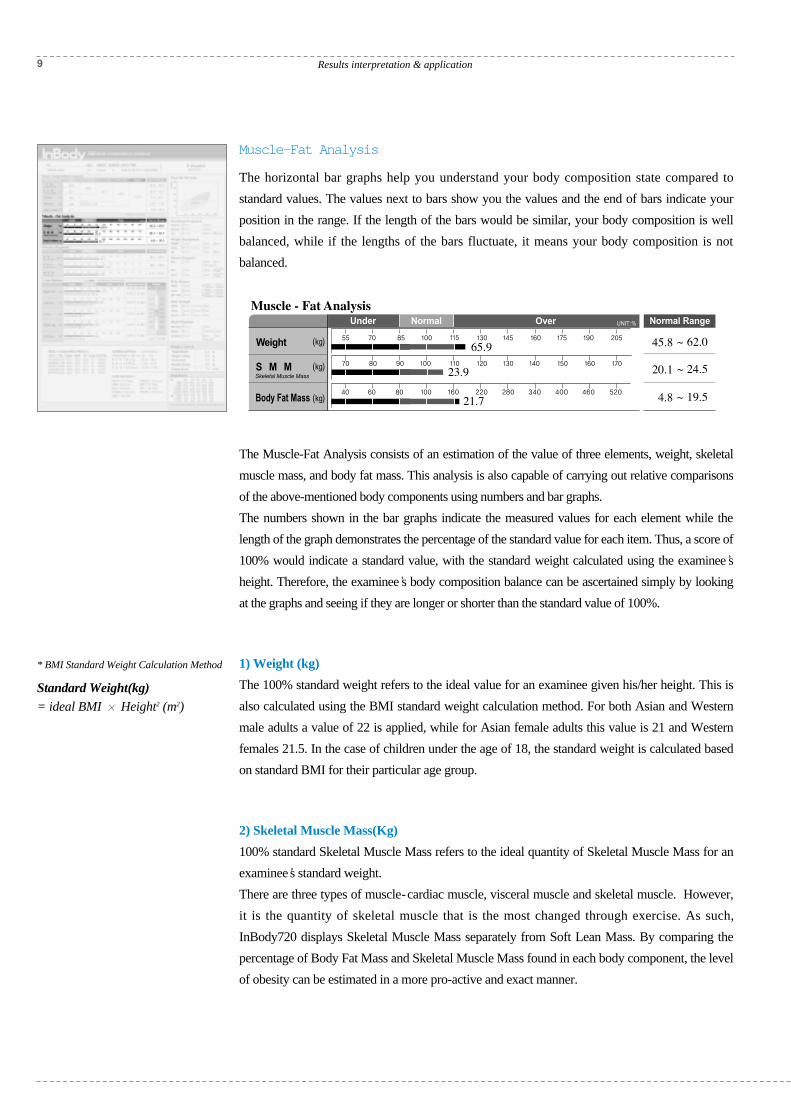
Muscle-Fat Analysis
The horizontal bar graphs help you understand your body composition state compared to
standard values. The values next to bars show you the values and the end of bars indicate your
position in the range. If the length of the bars would be similar, your body composition is well
balanced, while if the lengths of the bars fluctuate, it means your body composition is not
balanced.
The Muscle-Fat Analysis consists of an estimation of the value of three elements, weight, skeletal
muscle mass, and body fat mass. This analysis is also capable of carrying out relative comparisons
of the above-mentioned body components using numbers and bar graphs.
The numbers shown in the bar graphs indicate the measured values for each element while the
length of the graph demonstrates the percentage of the standard value for each item. Thus, a score of
100% would indicate a standard value, with the standard weight calculated using the examinee??
?W-X ??7@1 ??3@@ ??N@5 ??J(Y ??.Y? ?
???????????????????
s
height. Therefore, the examinee??
?W-X ??7@1 ??3@@ ??N@5 ??J(Y ??.Y? ?
???????????????????
s body composition balance can be ascertained simply by looking
at the graphs and seeing if they are longer or shorter than the standard value of 100%.
1) Weight (kg)
The 100% standard weight refers to the ideal value for an examinee given his/her height. This is
also calculated using the BMI standard weight calculation method. For both Asian and Western
male adults a value of 22 is applied, while for Asian female adults this value is 21 and Western
females 21.5. In the case of children under the age of 18, the standard weight is calculated based
on standard BMI for their particular age group.
2) Skeletal Muscle Mass(Kg)
100% standard Skeletal Muscle Mass refers to the ideal quantity of Skeletal Muscle Mass for an
examinee??
?W-X ??7@1 ??3@@ ??N@5 ??J(Y ??.Y? ?
???????????????????
s standard weight.
There are three types of muscle-cardiac muscle, visceral muscle and skeletal muscle. However,
it is the quantity of skeletal muscle that is the most changed through exercise. As such,
InBody720 displays Skeletal Muscle Mass separately from Soft Lean Mass. By comparing the
percentage of Body Fat Mass and Skeletal Muscle Mass found in each body component, the level
of obesity can be estimated in a more pro-active and exact manner.
* BMI Standard Weight Calculation Method
Standard Weight(kg) = ideal BMI
????????
?@h?@hg??3L?fW. ??V/Xe?W.Y ?V/X?W.Y? ??N)T.Y ??J@@H? ?W.R'L? ?
?W.Y?V/X ?W.Y?eV/X? ?.Yf?N1? ?
@?h@? ?????????
Height2 (m2)
3) Body Fat Mass(Kg)
100% standard Body Fat Mass refers to the Body Fat Mass that an examinee should maintain for
his/her standard weight. In general, the ideal Body Fat Mass is 15% for males and 23% for females.
The bar graph, which exhibits the current Body Fat Mass divided by standard Body Fat Mass in
percent form, displays reasonable levels of body fat mass.
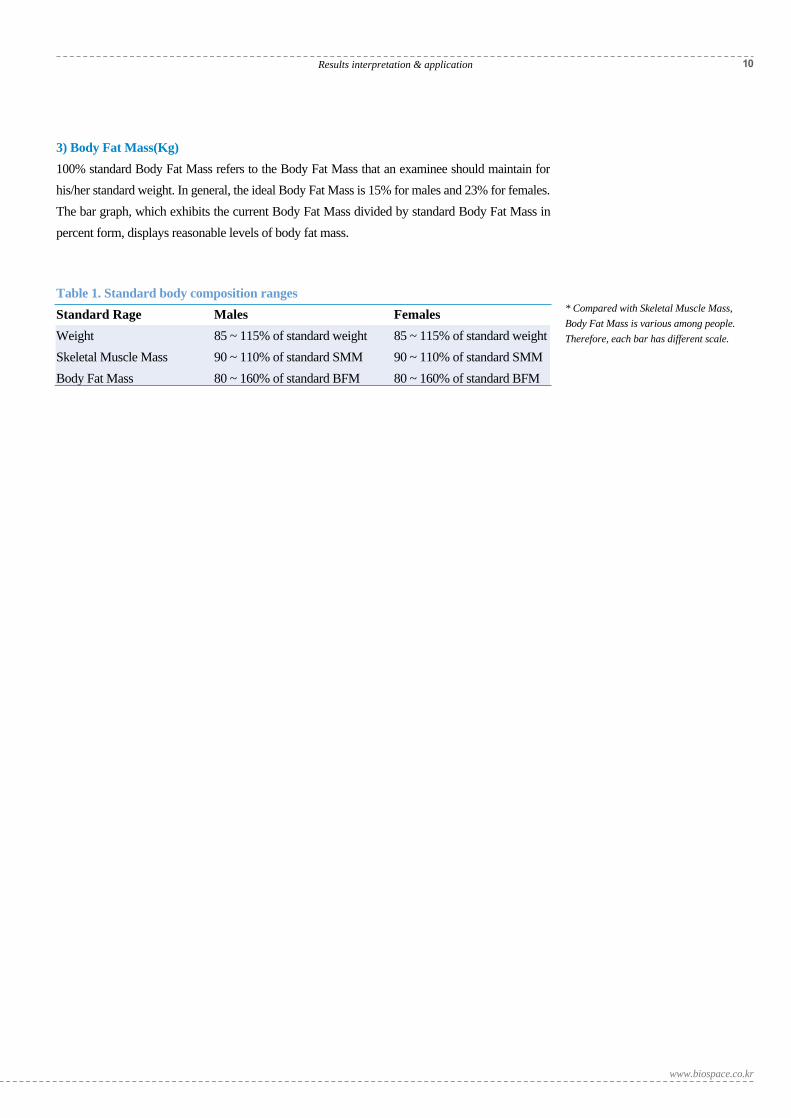
Table 1. Standard body composition ranges
Standard Rage Males Females
Weight 85 ~ 115% of standard weight 85 ~ 115% of standard weight
Skeletal Muscle Mass 90 ~ 110% of standard SMM 90 ~ 110% of standard SMM
Body Fat Mass 80 ~ 160% of standard BFM 80 ~ 160% of standard BFM
* Compared with Skeletal Muscle Mass,
Body Fat Mass is various among people.
Therefore, each bar has different scale.
10Results interpretation & application
www.biospace.co.kr
11 Results interpretation & application
8 different body types, based on a balanced body composition
In the case of this body type, the body composition graphs form a slightly curved ??
?W.?e?W&H?e?7@L?e?@@1?e?3@5?e?V+Y?e?
???????????????????
D??
?W-X ??7@1 ??3@@ ??N@5 ??J(Y ??.Y? ?
???????????????????
. This is the
ideal body composition state. Of course, it goes without saying that this healthy state should be
continuously maintained. As such, the person conducting the test should mention to the examinee
that the rate of increase of abdomen fat often increases as a person gets older, and emphasize the
necessity for continuous monitoring to assure that this healthy state is maintained.
At the opposite end of the health spectrum, we find the following graph shape, a??
?W.?e?W&H?e?7@L?e?@@1?e?3@5?e?V+Y?e?
???????????????????
C??
?W-X ??7@1 ??3@@ ??N@5 ??J(Y ??.Y? ?
???????????????????
shape. In this
case, the examinee??
?W-X ??7@1 ??3@@ ??N@5 ??J(Y ??.Y? ?
???????????????????
s weight is within the normal range. Although the examinee??
?W-X ??7@1 ??3@@ ??N@5 ??J(Y ??.Y? ?
???????????????????
s body weight
may not be classified as obese, he/she is dissatisfied with the shape of his/her body. As they are
experiencing difficulties managing the shape of their bodies through simple weight control
measures, people who are in this category usually visit an obesity clinic. If a person who is
diagnosed as this type, changes his/her body composition through exercise, he/she can maintain a
satisfactory body shape without actually losing any weight. The conductor of the test can
recommend that the examinee attempt to achieve a??
?W.?e?W&H?e?7@L?e?@@1?e?3@5?e?V+Y?e?
???????????????????
D??
?W-X ??7@1 ??3@@ ??N@5 ??J(Y ??.Y? ?
???????????????????
shape on his/her body composition
graphs, by losing Body Fat Mass while gaining SMM. Many adults who are found to have a high
level of Body Fat Mass are included in this type. Abdominal obesity can become a factor in the
development of cardiovascular diseases for those within the standard weight range just as well as
it can for those in the overweight range.
HOW TO APPLY THIS RESULT TO YOUR CLIENTS
The test results have been designed in a manner that the examinee can easily understand and that facilitates his/her ability to follow
the conductor of the test??
?W-X ??7@1 ??3@@ ??N@5 ??J(Y ??.Y? ?
???????????????????
s instructions. The test conductor can use alphabetical shapes that are based on the length of the graphs to
provide explanations to the examinees regarding their overall health.
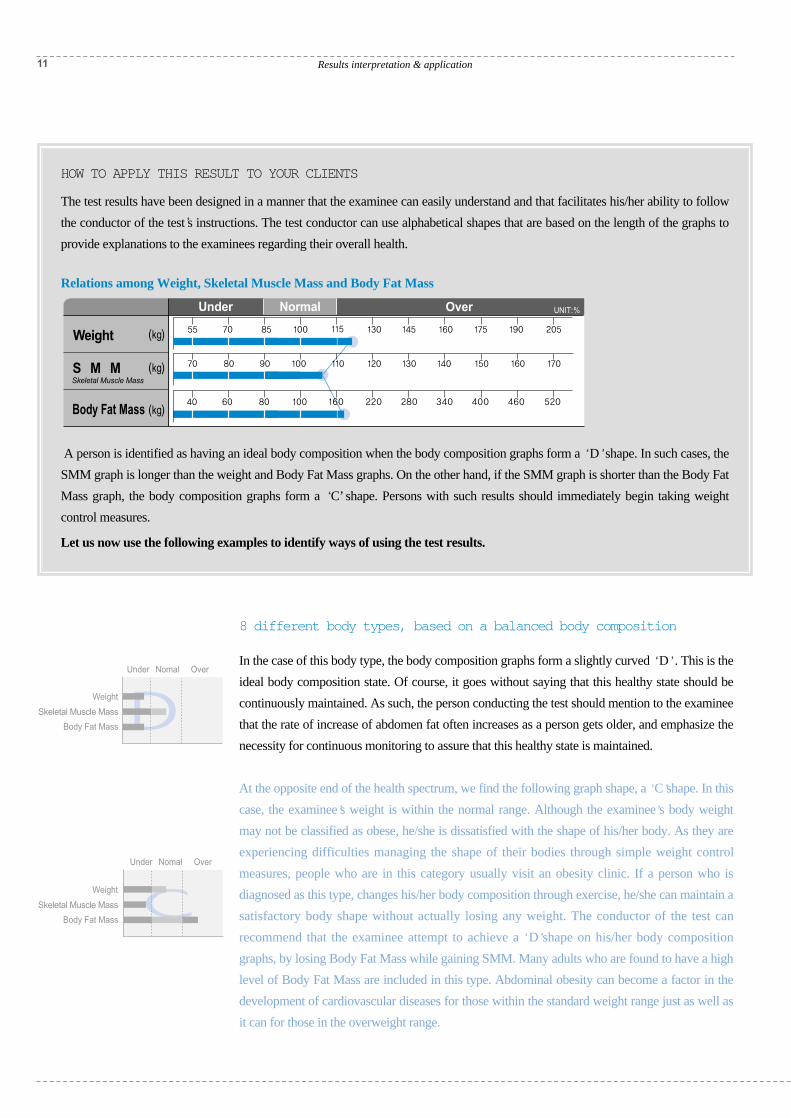
Relations among Weight, Skeletal Muscle Mass and Body Fat Mass
A person is identified as having an ideal body composition when the body composition graphs form a ??
?W.?e?W&H?e?7@L?e?@@1?e?3@5?e?V+Y?e?
???????????????????
D??
?W-X ??7@1 ??3@@ ??N@5 ??J(Y ??.Y? ?
???????????????????
shape. In such cases, the
SMM graph is longer than the weight and Body Fat Mass graphs. On the other hand, if the SMM graph is shorter than the Body Fat
Mass graph, the body composition graphs form a ??
?W.?e?W&H?e?7@L?e?@@1?e?3@5?e?V+Y?e?
???????????????????
C’ shape. Persons with such results should immediately begin taking weight
control measures.
Let us now use the following examples to identify ways of using the test results.
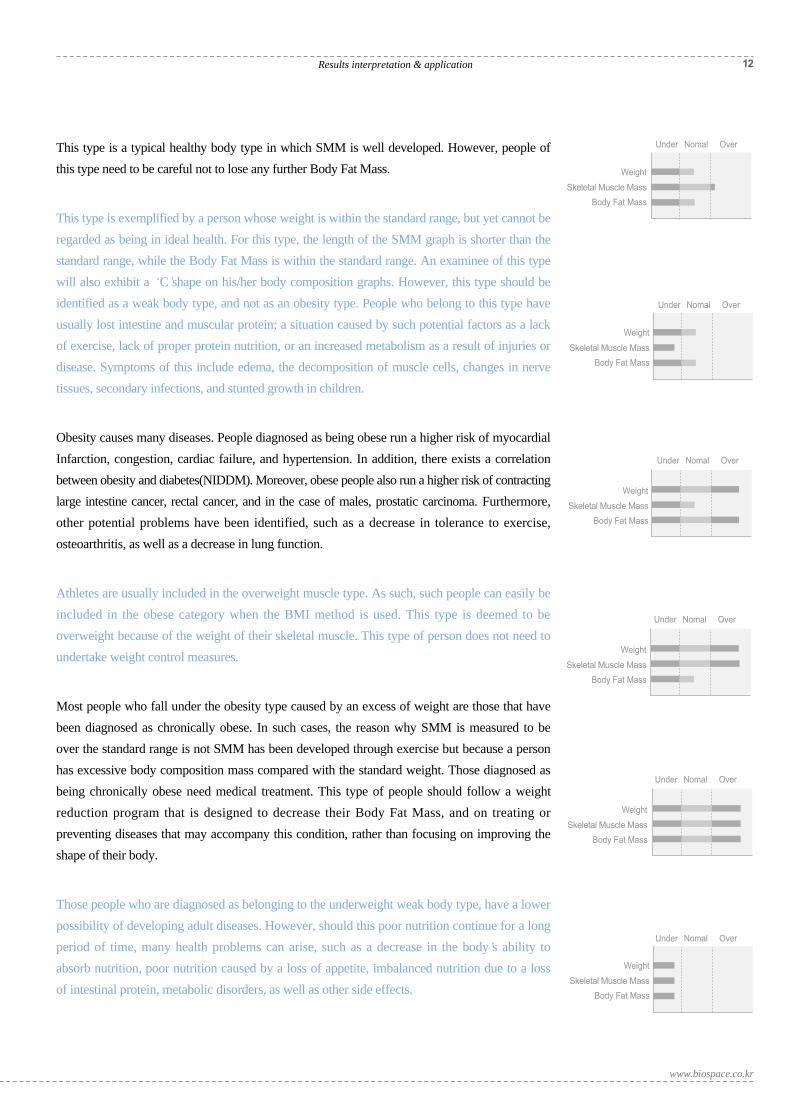
This type is a typical healthy body type in which SMM is well developed. However, people of
this type need to be careful not to lose any further Body Fat Mass.
This type is exemplified by a person whose weight is within the standard range, but yet cannot be
regarded as being in ideal health. For this type, the length of the SMM graph is shorter than the
standard range, while the Body Fat Mass is within the standard range. An examinee of this type
will also exhibit a ??
?W.?e?W&H?e?7@L?e?@@1?e?3@5?e?V+Y?e?
???????????????????
C??
?W-X ??7@1 ??3@@ ??N@5 ??J(Y ??.Y? ?
???????????????????
shape on his/her body composition graphs. However, this type should be
identified as a weak body type, and not as an obesity type. People who belong to this type have
usually lost intestine and muscular protein; a situation caused by such potential factors as a lack
of exercise, lack of proper protein nutrition, or an increased metabolism as a result of injuries or
disease. Symptoms of this include edema, the decomposition of muscle cells, changes in nerve
tissues, secondary infections, and stunted growth in children.
Obesity causes many diseases. People diagnosed as being obese run a higher risk of myocardial
Infarction, congestion, cardiac failure, and hypertension. In addition, there exists a correlation
between obesity and diabetes(NIDDM). Moreover, obese people also run a higher risk of contracting
large intestine cancer, rectal cancer, and in the case of males, prostatic carcinoma. Furthermore,
other potential problems have been identified, such as a decrease in tolerance to exercise,
osteoarthritis, as well as a decrease in lung function.
Athletes are usually included in the overweight muscle type. As such, such people can easily be
included in the obese category when the BMI method is used. This type is deemed to be
overweight because of the weight of their skeletal muscle. This type of person does not need to
undertake weight control measures.
Most people who fall under the obesity type caused by an excess of weight are those that have
been diagnosed as chronically obese. In such cases, the reason why SMM is measured to be
over the standard range is not SMM has been developed through exercise but because a person
has excessive body composition mass compared with the standard weight. Those diagnosed as
being chronically obese need medical treatment. This type of people should follow a weight
reduction program that is designed to decrease their Body Fat Mass, and on treating or
preventing diseases that may accompany this condition, rather than focusing on improving the
shape of their body.
Those people who are diagnosed as belonging to the underweight weak body type, have a lower
possibility of developing adult diseases. However, should this poor nutrition continue for a long
period of time, many health problems can arise, such as a decrease in the body??
?W-X ??7@1 ??3@@ ??N@5 ??J(Y ??.Y? ?
???????????????????
s ability to
absorb nutrition, poor nutrition caused by a loss of appetite, imbalanced nutrition due to a loss
of intestinal protein, metabolic disorders, as well as other side effects.
12Results interpretation & application
www.biospace.co.kr
13 Results interpretation & application
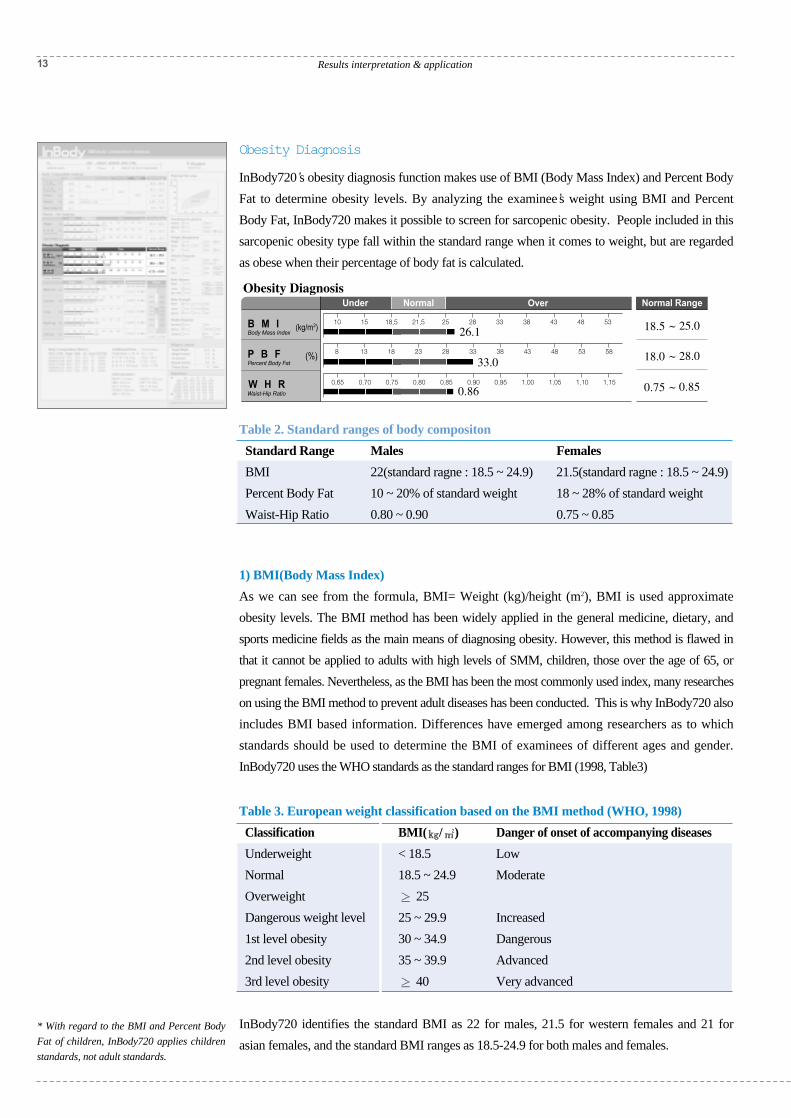
Obesity Diagnosis
InBody720??
?W-X ??7@1 ??3@@ ??N@5 ??J(Y ??.Y? ?
???????????????????
s obesity diagnosis function makes use of BMI (Body Mass Index) and Percent Body
Fat to determine obesity levels. By analyzing the examinee??
?W-X ??7@1 ??3@@ ??N@5 ??J(Y ??.Y? ?
???????????????????
s weight using BMI and Percent
Body Fat, InBody720 makes it possible to screen for sarcopenic obesity. People included in this
sarcopenic obesity type fall within the standard range when it comes to weight, but are regarded
as obese when their percentage of body fat is calculated.
Table 2. Standard ranges of body compositon
Standard Range Males Females
BMI 22(standard ragne : 18.5 ~ 24.9) 21.5(standard ragne : 18.5 ~ 24.9)
Percent Body Fat 10 ~ 20% of standard weight 18 ~ 28% of standard weight
Waist-Hip Ratio 0.80 ~ 0.90 0.75 ~ 0.85
1) BMI(Body Mass Index)
As we can see from the formula, BMI= Weight (kg)/height (m2), BMI is used approximate
obesity levels. The BMI method has been widely applied in the general medicine, dietary, and
sports medicine fields as the main means of diagnosing obesity. However, this method is flawed in
that it cannot be applied to adults with high levels of SMM, children, those over the age of 65, or
pregnant females. Nevertheless, as the BMI has been the most commonly used index, many researches
on using the BMI method to prevent adult diseases has been conducted. This is why InBody720 also
includes BMI based information. Differences have emerged among researchers as to which
standards should be used to determine the BMI of examinees of different ages and gender.
InBody720 uses the WHO standards as the standard ranges for BMI (1998, Table3)
Table 3. European weight classification based on the BMI method (WHO, 1998)
Classification BMI( ?@@@?N@@@@@@@@@@?@@@@@hf@@e@(M??W&?'@@@@?e@@W&(Ye?*@?V'@@H?e@@@@f?N@L?N@5f@@@@1?f@)KC(Yf@@@@@Le?J@@@0Y?f@@e@1e?@@?h@@e3@L??N@@@@6Xf
?J@@L??@)X?J@V4@@)X?e?@@@@?@@@)?7@?e?@1?e
?3@LeJ@5?e?V')KO&(Y?eV4@@0Yf
/?@6Xf?(R1fJ5f
?W.Yf?7H?f?@g?@@@f
@@6KN@@@@@@@@@@@@@g?@@?e@@f@@g?@@?e@@f@@g?@@?e@@f@@g?@@?e@@f@@g?@@?e@@f@@gJ@@??J@@L??J@@g@@@??@@@@??@@@g
) Danger of onset of accompanying diseases
Underweight < 18.5 Low
Normal 18.5 ~ 24.9 Moderate
Overweight????
?@6K ?I46Khg?I46Khf?I'6Xhe??V4)K?h??I46K?g??I46K?f??S@@f?
?O20M?f??W2@@0M?g?O&0Mhe?
O20Mhf?O20Mhg?
?@0M ???
?@@@@@@@@@@@@@@@f???????
25
Dangerous weight level 25 ~ 29.9 Increased
1st level obesity 30 ~ 34.9 Dangerous
2nd level obesity 35 ~ 39.9 Advanced
3rd level obesity????
?@6K ?I46Khg?I46Khf?I'6Xhe??V4)K?h??I46K?g??I46K?f??S@@f?
?O20M?f??W2@@0M?g?O&0Mhe?
O20Mhf?O20Mhg?
?@0M ???
?@@@@@@@@@@@@@@@f???????
40 Very advanced
InBody720 identifies the standard BMI as 22 for males, 21.5 for western females and 21 for
asian females, and the standard BMI ranges as 18.5-24.9 for both males and females.
* With regard to the BMI and Percent Body
Fat of children, InBody720 applies children
standards, not adult standards.
* Ref 4. Robert D.Lee, David C. Niteman,
Nutritional Assessment 2nd, McGraw-Hill, 1998
* Ref 5. George A. Bray, MD. Contemporary
Diagnosis and Management of Obesity,
Handbooks in Health Care co., 1998
* Ref 6. VivianH. Heyword, Ph D, Lisa M.
Stolarczyk, Ph D, Applied Body Composition
Assessment, p. 21-43, Human Kinetics, 1996
* Ref 7. Rosalind S. Gibson, Principles of
Nutritional Assessment, Oxford University
Press, 1990
* In the case of children, abdominal obesityrefers to an subcutaneous fat type with littleincrease in visceral fat. However, WHR canincrease as a result of the onset of morbidobesity, which in turn can lead to thedevelopment of clinical diseases amongchildren, and thus should be closelymonitored.
14Results interpretation & application
www.biospace.co.kr
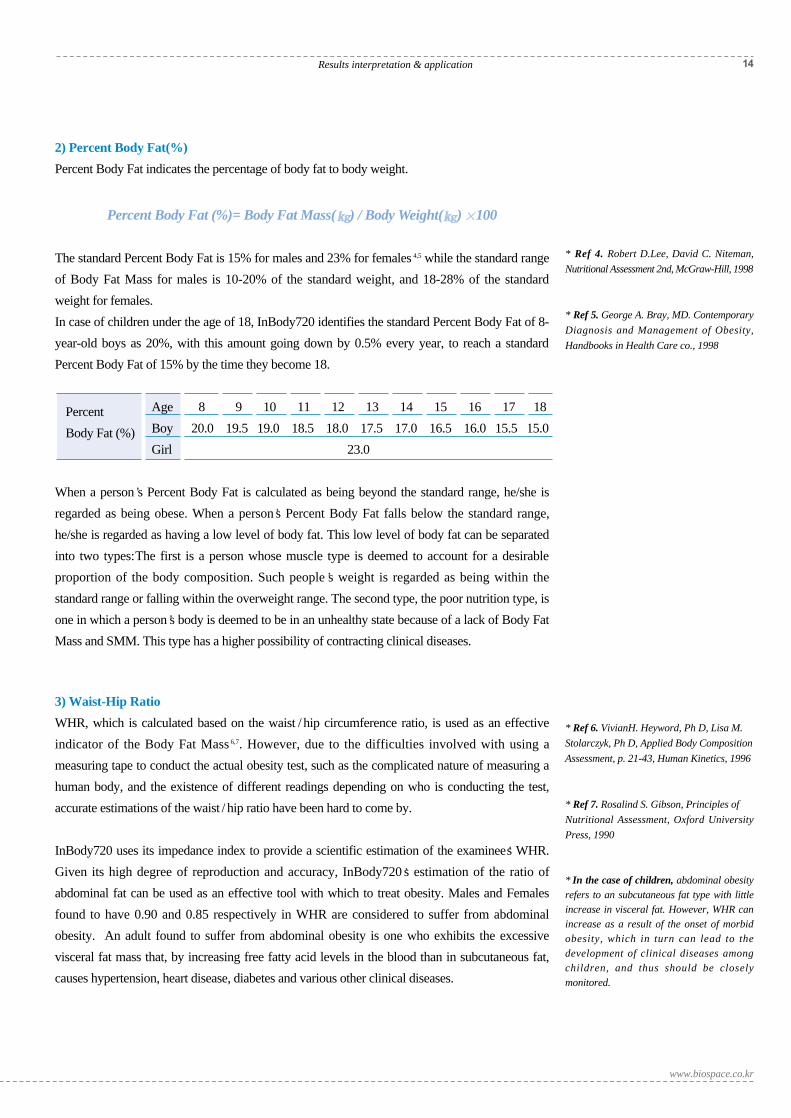
2) Percent Body Fat(%)
Percent Body Fat indicates the percentage of body fat to body weight.
Percent Body Fat (%)= Body Fat Mass(?@@@@??N@@@??J@@5??7@@H??@@@?@@@?@@@@@@??@@@?N@@(M?W2@@@@@@@(?hgJ@@@=C@0Y?W&@(M?@@@(Y?hg7@@V@@<?e*@@He@@@H@@@@@@L?eN@@Le@@5?@@@@@@1?e?@@)K?@(Y?@@@@@@@LeJ@@@@@0Y
?J@@(MW@@@e7@@??7@@H?@@@?e@@@@@@6XJ@@@L??@@)K?@@@@@@@)X?@@@@@?@@@@@@@@f@@1?
I'@@L??J@@5??N@@)KO&@0Y?@@@@@0M?
) / Body Weight(?@@@@??N@@@??J@@5??7@@H??@@@?@@@?@@@@@@??@@@?N@@(M?W2@@@@@@@(?hgJ@@@=C@0Y?W&@(M?@@@(Y?hg7@@V@@<?e*@@He@@@H@@@@@@L?eN@@Le@@5?@@@@@@1?e?@@)K?@(Y?@@@@@@@LeJ@@@@@0Y
?J@@(MW@@@e7@@??7@@H?@@@?e@@@@@@6XJ@@@L??@@)K?@@@@@@@)X?@@@@@?@@@@@@@@f@@1?
I'@@L??J@@5??N@@)KO&@0Y?@@@@@0M?
) ?@@?g?O2@?3@Lf?W2(M??V')X?eW&(YV')X?W&(Y??V')?&(Y?@@(Y?
?W&@@?W&(?')X?
?W&(Y?V')XW&(Ye?V')X?
?O&0Y?fN@1?@0M?g?@@? 100
The standard Percent Body Fat is 15% for males and 23% for females 4,5 while the standard range
of Body Fat Mass for males is 10-20% of the standard weight, and 18-28% of the standard
weight for females.
In case of children under the age of 18, InBody720 identifies the standard Percent Body Fat of 8-
year-old boys as 20%, with this amount going down by 0.5% every year, to reach a standard
Percent Body Fat of 15% by the time they become 18.
Age 8 9 10 11 12 13 14 15 16 17 18
Boy 20.0 19.5 19.0 18.5 18.0 17.5 17.0 16.5 16.0 15.5 15.0
Girl 23.0
When a person??
?W-X ??7@1 ??3@@ ??N@5 ??J(Y ??.Y? ?
???????????????????
s Percent Body Fat is calculated as being beyond the standard range, he/she is
regarded as being obese. When a person??
?W-X ??7@1 ??3@@ ??N@5 ??J(Y ??.Y? ?
???????????????????
s Percent Body Fat falls below the standard range,
he/she is regarded as having a low level of body fat. This low level of body fat can be separated
into two types:The first is a person whose muscle type is deemed to account for a desirable
proportion of the body composition. Such people??
?W-X ??7@1 ??3@@ ??N@5 ??J(Y ??.Y? ?
???????????????????
s weight is regarded as being within the
standard range or falling within the overweight range. The second type, the poor nutrition type, is
one in which a person??
?W-X ??7@1 ??3@@ ??N@5 ??J(Y ??.Y? ?
???????????????????
s body is deemed to be in an unhealthy state because of a lack of Body Fat
Mass and SMM. This type has a higher possibility of contracting clinical diseases.
3) Waist-Hip Ratio
WHR, which is calculated based on the waist / hip circumference ratio, is used as an effective
indicator of the Body Fat Mass 6,7. However, due to the difficulties involved with using a
measuring tape to conduct the actual obesity test, such as the complicated nature of measuring a
human body, and the existence of different readings depending on who is conducting the test,
accurate estimations of the waist / hip ratio have been hard to come by.
InBody720 uses its impedance index to provide a scientific estimation of the examinee??
?W-X ??7@1 ??3@@ ??N@5 ??J(Y ??.Y? ?
???????????????????
s WHR.
Given its high degree of reproduction and accuracy, InBody720??
?W-X ??7@1 ??3@@ ??N@5 ??J(Y ??.Y? ?
???????????????????
s estimation of the ratio of
abdominal fat can be used as an effective tool with which to treat obesity. Males and Females
found to have 0.90 and 0.85 respectively in WHR are considered to suffer from abdominal
obesity. An adult found to suffer from abdominal obesity is one who exhibits the excessive
visceral fat mass that, by increasing free fatty acid levels in the blood than in subcutaneous fat,
causes hypertension, heart disease, diabetes and various other clinical diseases.
Percent
Body Fat (%)
15 Results interpretation & application
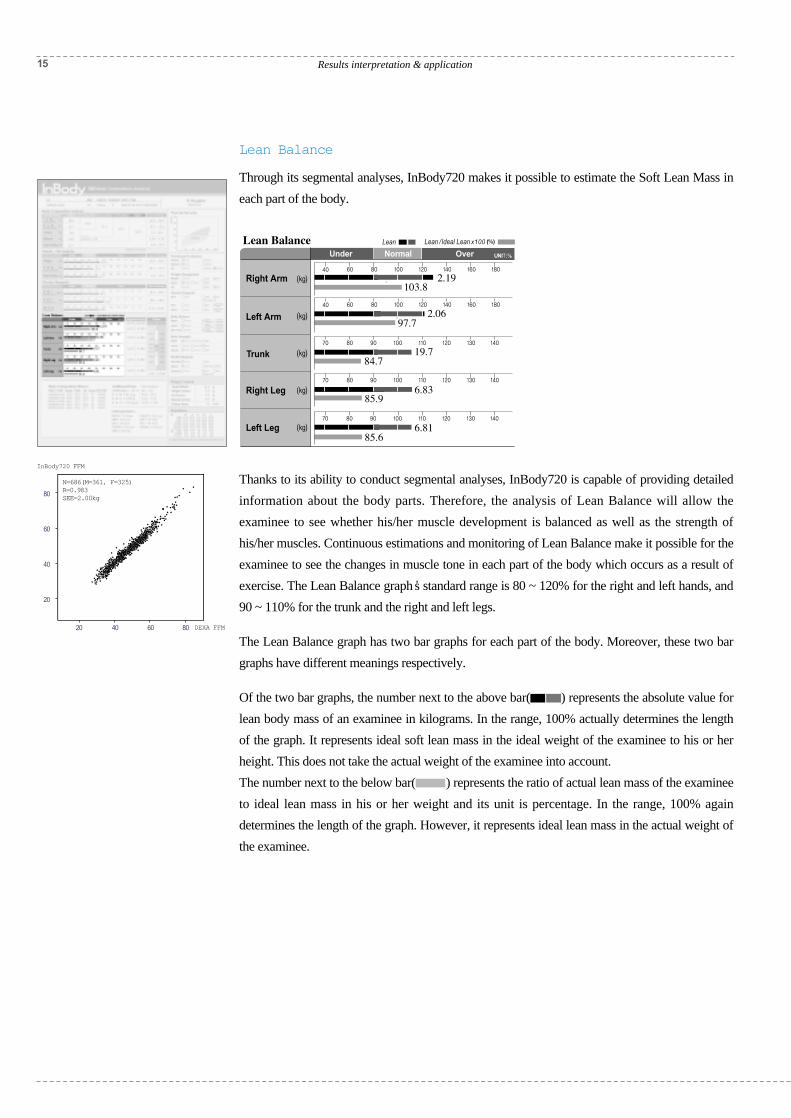
Lean Balance
Through its segmental analyses, InBody720 makes it possible to estimate the Soft Lean Mass in
each part of the body.
Thanks to its ability to conduct segmental analyses, InBody720 is capable of providing detailed
information about the body parts. Therefore, the analysis of Lean Balance will allow the
examinee to see whether his/her muscle development is balanced as well as the strength of
his/her muscles. Continuous estimations and monitoring of Lean Balance make it possible for the
examinee to see the changes in muscle tone in each part of the body which occurs as a result of
exercise. The Lean Balance graph??
?W-X ??7@1 ??3@@ ??N@5 ??J(Y ??.Y? ?
???????????????????
s standard range is 80 ~ 120% for the right and left hands, and
90 ~ 110% for the trunk and the right and left legs.
The Lean Balance graph has two bar graphs for each part of the body. Moreover, these two bar
graphs have different meanings respectively.
Of the two bar graphs, the number next to the above bar( ) represents the absolute value for
lean body mass of an examinee in kilograms. In the range, 100% actually determines the length
of the graph. It represents ideal soft lean mass in the ideal weight of the examinee to his or her
height. This does not take the actual weight of the examinee into account.
The number next to the below bar( ) represents the ratio of actual lean mass of the examinee
to ideal lean mass in his or her weight and its unit is percentage. In the range, 100% again
determines the length of the graph. However, it represents ideal lean mass in the actual weight of
the examinee.
80
60
40
20
20 40 60 80
N=686(M=361, F=325)R=0.983SEE=2.00kg
InBody720 FFM
DEXA FFM
/Xe@??W.?eV/X?@?W.Y?e?V/[email protected]@@@H?fJ@@@L?f
?W.Y@V/XfW.Y?@?V/X?e.Ye@??V/?e
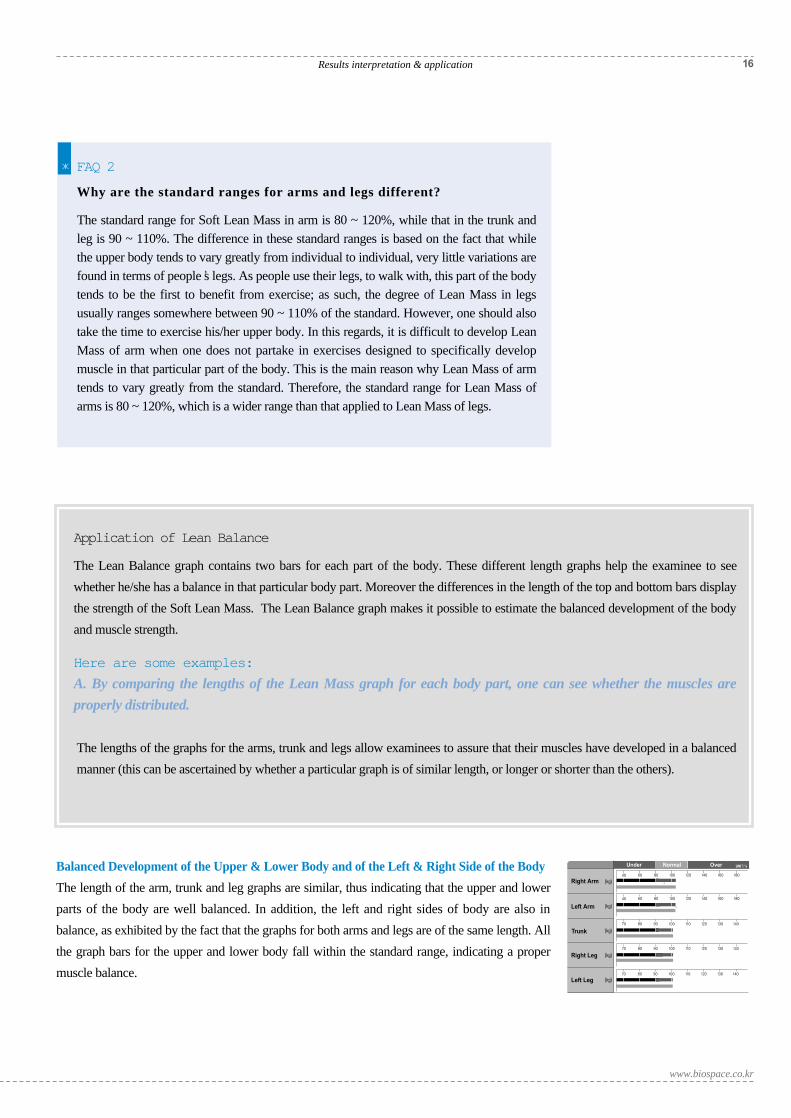
Balanced Development of the Upper & Lower Body and of the Left & Right Side of the Body
The length of the arm, trunk and leg graphs are similar, thus indicating that the upper and lower
parts of the body are well balanced. In addition, the left and right sides of body are also in
balance, as exhibited by the fact that the graphs for both arms and legs are of the same length. All
the graph bars for the upper and lower body fall within the standard range, indicating a proper
muscle balance.
16Results interpretation & application
www.biospace.co.kr
FAQ 2
Why are the standard ranges for arms and legs different?
The standard range for Soft Lean Mass in arm is 80 ~ 120%, while that in the trunk and
leg is 90 ~ 110%. The difference in these standard ranges is based on the fact that while
the upper body tends to vary greatly from individual to individual, very little variations are
found in terms of people??
?W-X ??7@1 ??3@@ ??N@5 ??J(Y ??.Y? ?
???????????????????
s legs. As people use their legs, to walk with, this part of the body
tends to be the first to benefit from exercise; as such, the degree of Lean Mass in legs
usually ranges somewhere between 90 ~ 110% of the standard. However, one should also
take the time to exercise his/her upper body. In this regards, it is difficult to develop Lean
Mass of arm when one does not partake in exercises designed to specifically develop
muscle in that particular part of the body. This is the main reason why Lean Mass of arm
tends to vary greatly from the standard. Therefore, the standard range for Lean Mass of
arms is 80 ~ 120%, which is a wider range than that applied to Lean Mass of legs.
Application of Lean Balance
The Lean Balance graph contains two bars for each part of the body. These different length graphs help the examinee to see
whether he/she has a balance in that particular body part. Moreover the differences in the length of the top and bottom bars display
the strength of the Soft Lean Mass. The Lean Balance graph makes it possible to estimate the balanced development of the body
and muscle strength.
Here are some examples:
A. By comparing the lengths of the Lean Mass graph for each body part, one can see whether the muscles are
properly distributed.
The lengths of the graphs for the arms, trunk and legs allow examinees to assure that their muscles have developed in a balanced
manner (this can be ascertained by whether a particular graph is of similar length, or longer or shorter than the others).
17 Results interpretation & application
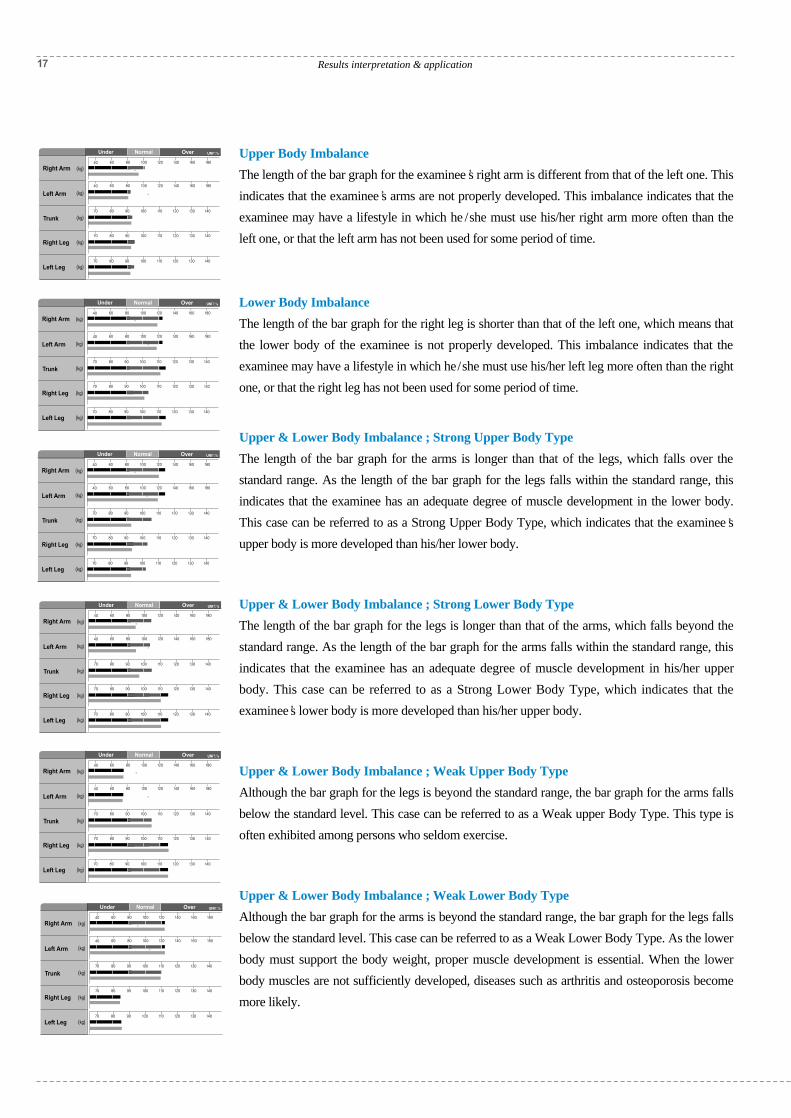
Upper Body Imbalance
The length of the bar graph for the examinee??
?W-X ??7@1 ??3@@ ??N@5 ??J(Y ??.Y? ?
???????????????????
s right arm is different from that of the left one. This
indicates that the examinee??
?W-X ??7@1 ??3@@ ??N@5 ??J(Y ??.Y? ?
???????????????????
s arms are not properly developed. This imbalance indicates that the
examinee may have a lifestyle in which he /she must use his/her right arm more often than the
left one, or that the left arm has not been used for some period of time.
Lower Body Imbalance
The length of the bar graph for the right leg is shorter than that of the left one, which means that
the lower body of the examinee is not properly developed. This imbalance indicates that the
examinee may have a lifestyle in which he/she must use his/her left leg more often than the right
one, or that the right leg has not been used for some period of time.
Upper & Lower Body Imbalance ; Strong Upper Body Type
The length of the bar graph for the arms is longer than that of the legs, which falls over the
standard range. As the length of the bar graph for the legs falls within the standard range, this
indicates that the examinee has an adequate degree of muscle development in the lower body.
This case can be referred to as a Strong Upper Body Type, which indicates that the examinee??
?W-X ??7@1 ??3@@ ??N@5 ??J(Y ??.Y? ?
???????????????????
s
upper body is more developed than his/her lower body.
Upper & Lower Body Imbalance ; Strong Lower Body Type
The length of the bar graph for the legs is longer than that of the arms, which falls beyond the
standard range. As the length of the bar graph for the arms falls within the standard range, this
indicates that the examinee has an adequate degree of muscle development in his/her upper
body. This case can be referred to as a Strong Lower Body Type, which indicates that the
examinee??
?W-X ??7@1 ??3@@ ??N@5 ??J(Y ??.Y? ?
???????????????????
s lower body is more developed than his/her upper body.
Upper & Lower Body Imbalance ; Weak Upper Body Type
Although the bar graph for the legs is beyond the standard range, the bar graph for the arms falls
below the standard level. This case can be referred to as a Weak upper Body Type. This type is
often exhibited among persons who seldom exercise.
Upper & Lower Body Imbalance ; Weak Lower Body Type
Although the bar graph for the arms is beyond the standard range, the bar graph for the legs falls
below the standard level. This case can be referred to as a Weak Lower Body Type. As the lower
body must support the body weight, proper muscle development is essential. When the lower
body muscles are not sufficiently developed, diseases such as arthritis and osteoporosis become
more likely.
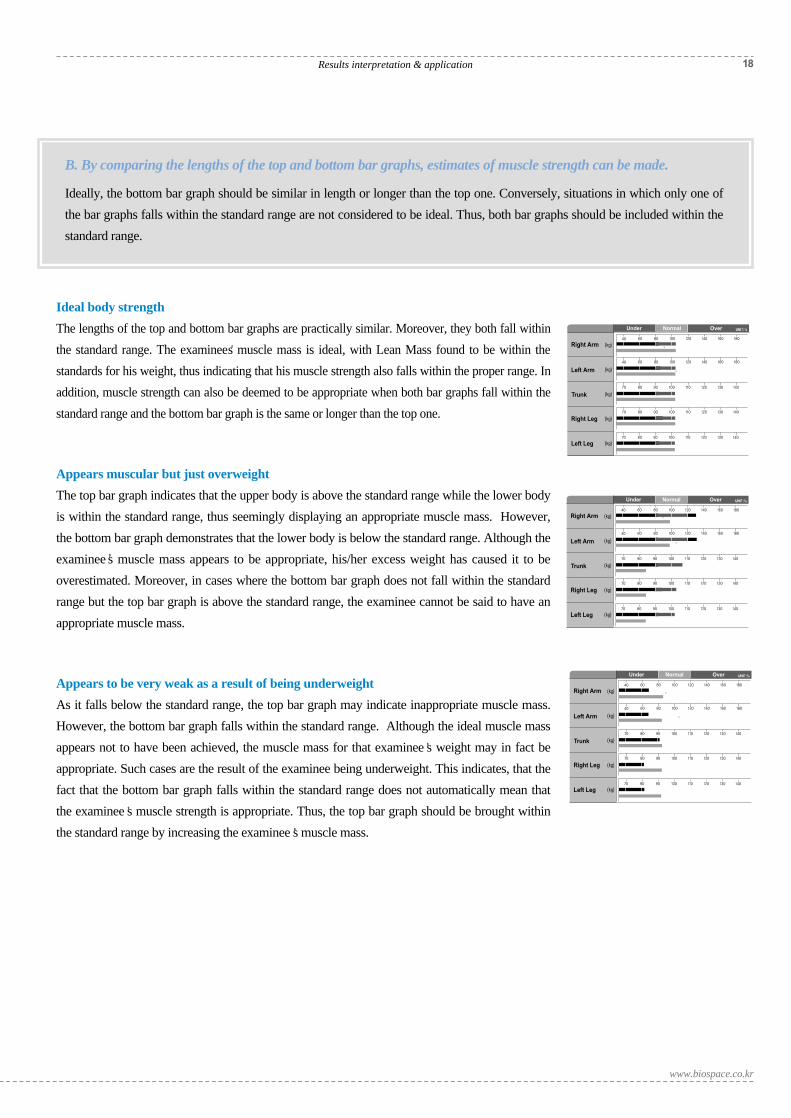
Ideal body strength
The lengths of the top and bottom bar graphs are practically similar. Moreover, they both fall within
the standard range. The examinee??
?W&? ??7@? ??3@? ??N@? ??J5? ??.Y? ?
???????????????????
s muscle mass is ideal, with Lean Mass found to be within the
standards for his weight, thus indicating that his muscle strength also falls within the proper range. In
addition, muscle strength can also be deemed to be appropriate when both bar graphs fall within the
standard range and the bottom bar graph is the same or longer than the top one.
Appears muscular but just overweight
The top bar graph indicates that the upper body is above the standard range while the lower body
is within the standard range, thus seemingly displaying an appropriate muscle mass. However,
the bottom bar graph demonstrates that the lower body is below the standard range. Although the
examinee??
?W-X ??7@1 ??3@@ ??N@5 ??J(Y ??.Y? ?
???????????????????
s muscle mass appears to be appropriate, his/her excess weight has caused it to be
overestimated. Moreover, in cases where the bottom bar graph does not fall within the standard
range but the top bar graph is above the standard range, the examinee cannot be said to have an
appropriate muscle mass.
Appears to be very weak as a result of being underweight
As it falls below the standard range, the top bar graph may indicate inappropriate muscle mass.
However, the bottom bar graph falls within the standard range. Although the ideal muscle mass
appears not to have been achieved, the muscle mass for that examinee??
?W-X ??7@1 ??3@@ ??N@5 ??J(Y ??.Y? ?
???????????????????
s weight may in fact be
appropriate. Such cases are the result of the examinee being underweight. This indicates, that the
fact that the bottom bar graph falls within the standard range does not automatically mean that
the examinee??
?W-X ??7@1 ??3@@ ??N@5 ??J(Y ??.Y? ?
???????????????????
s muscle strength is appropriate. Thus, the top bar graph should be brought within
the standard range by increasing the examinee??
?W-X ??7@1 ??3@@ ??N@5 ??J(Y ??.Y? ?
???????????????????
s muscle mass.
18Results interpretation & application
www.biospace.co.kr
B. By comparing the lengths of the top and bottom bar graphs, estimates of muscle strength can be made.
Ideally, the bottom bar graph should be similar in length or longer than the top one. Conversely, situations in which only one of
the bar graphs falls within the standard range are not considered to be ideal. Thus, both bar graphs should be included within the
standard range.
/Xe@??W.?eV/X?@?W.Y?e?V/[email protected]@@@H?fJ@@@L?f
?W.Y@V/XfW.Y?@?V/X?e.Ye@??V/?e
19 Results interpretation & application
FAQ 3
Under what circumstances can the results of the edema index be higher or lower
than the ideal range?
Dialysis or Ascites patients tend to high score on the edema index. However, body
composition examination conducted using InBody720 has revealed that lean females, the
elderly and morbidly obese patients, although they do not suffer from any specific
diseases, also tend to score high on the edema index. When doctors are unable to diagnose
a specific disease, the following cases may be possible.
Cases where a high edema index is uncovered using the InBody720
1. Cases where a marked increase in ECW occurs (80%), and cases where ECW and ICW
both increase (20%)
2. Elderly, Malnourished Patients : Malnutrition causes muscle cells to contract. As the
cells become smaller, the blank spaces between the cells begin to fill with water, which
leads to the relative increase in ECW causing the edema index to be higher.
3. Sarcopenic Obesity : People suffering from obesity tend to have relatively higher levels
of ECW. Their fat cells contain much less intracellular water that their muscle cells. As
such, people suffering from this type of obesity in which there are more fat cells than
muscle cells run an increased likelihood of having higher scores on their edema index.
Cases where a low edema index is uncovered using the InBody720.
Unlike those suffering from Sarcopenic Obesity, athletes, who possess many muscle cells,
have relatively little extracellular water. Accordingly, their edema index may be lower.
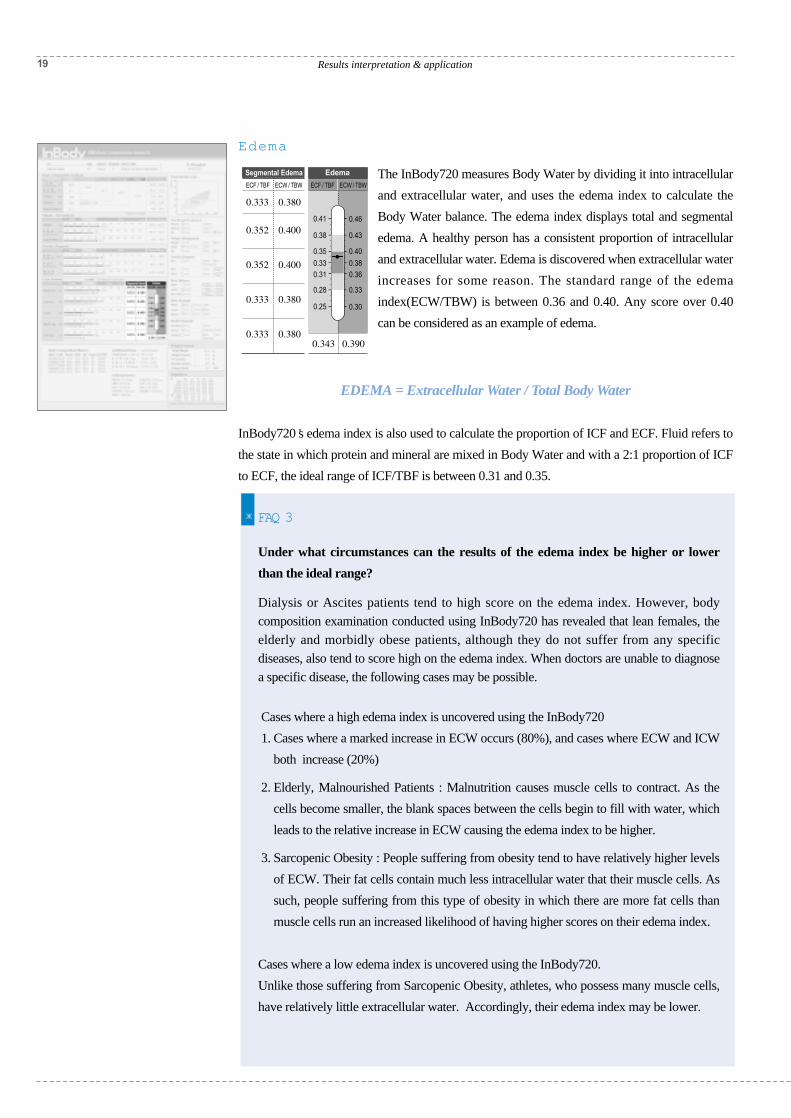
Edema
The InBody720 measures Body Water by dividing it into intracellular
and extracellular water, and uses the edema index to calculate the
Body Water balance. The edema index displays total and segmental
edema. A healthy person has a consistent proportion of intracellular
and extracellular water. Edema is discovered when extracellular water
increases for some reason. The standard range of the edema
index(ECW/TBW) is between 0.36 and 0.40. Any score over 0.40
can be considered as an example of edema.
EDEMA = Extracellular Water / Total Body Water
InBody720??
?W-X ??7@1 ??3@@ ??N@5 ??J(Y ??.Y? ?
???????????????????
s edema index is also used to calculate the proportion of ICF and ECF. Fluid refers to
the state in which protein and mineral are mixed in Body Water and with a 2:1 proportion of ICF
to ECF, the ideal range of ICF/TBF is between 0.31 and 0.35.
/Xe@??W.?eV/X?@?W.Y?e?V/[email protected]@@@H?fJ@@@L?f
?W.Y@V/XfW.Y?@?V/X?e.Ye@??V/?e
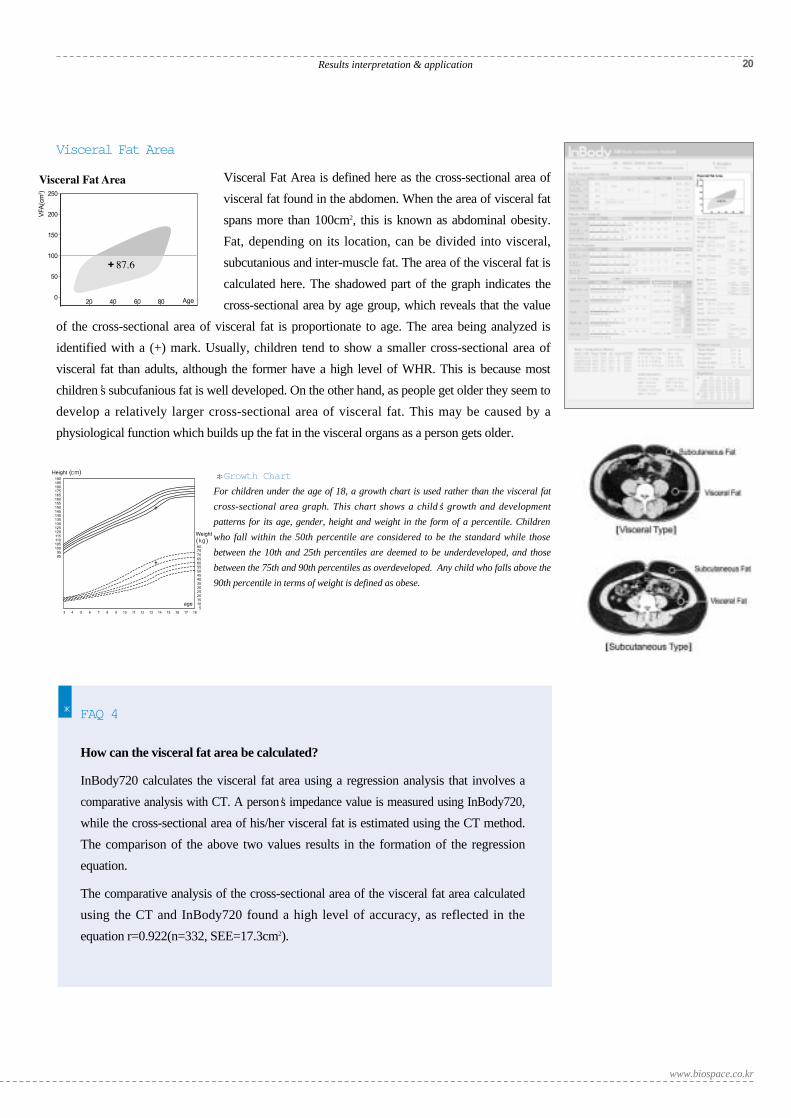
Visceral Fat Area
Visceral Fat Area is defined here as the cross-sectional area of
visceral fat found in the abdomen. When the area of visceral fat
spans more than 100cm2, this is known as abdominal obesity.
Fat, depending on its location, can be divided into visceral,
subcutanious and inter-muscle fat. The area of the visceral fat is
calculated here. The shadowed part of the graph indicates the
cross-sectional area by age group, which reveals that the value
of the cross-sectional area of visceral fat is proportionate to age. The area being analyzed is
identified with a (+) mark. Usually, children tend to show a smaller cross-sectional area of
visceral fat than adults, although the former have a high level of WHR. This is because most
children??
?W-X ??7@1 ??3@@ ??N@5 ??J(Y ??.Y? ?
???????????????????
s subcufanious fat is well developed. On the other hand, as people get older they seem to
develop a relatively larger cross-sectional area of visceral fat. This may be caused by a
physiological function which builds up the fat in the visceral organs as a person gets older.
Growth Chart
For children under the age of 18, a growth chart is used rather than the visceral fat
cross-sectional area graph. This chart shows a child?W-XW&@)*@@HN@5?J(Y?.Ys growth and development
patterns for its age, gender, height and weight in the form of a percentile. Children
who fall within the 50th percentile are considered to be the standard while those
between the 10th and 25th percentiles are deemed to be underdeveloped, and those
between the 75th and 90th percentiles as overdeveloped. Any child who falls above the
90th percentile in terms of weight is defined as obese.
20Results interpretation & application
www.biospace.co.kr
FAQ 4
How can the visceral fat area be calculated?
InBody720 calculates the visceral fat area using a regression analysis that involves a
comparative analysis with CT. A person?W&??7@??3@??N@??J5??.Y?s impedance value is measured using InBody720,
while the cross-sectional area of his/her visceral fat is estimated using the CT method.
The comparison of the above two values results in the formation of the regression
equation.
The comparative analysis of the cross-sectional area of the visceral fat area calculated
using the CT and InBody720 found a high level of accuracy, as reflected in the
equation r=0.922(n=332, SEE=17.3cm2).
21 Results interpretation & application
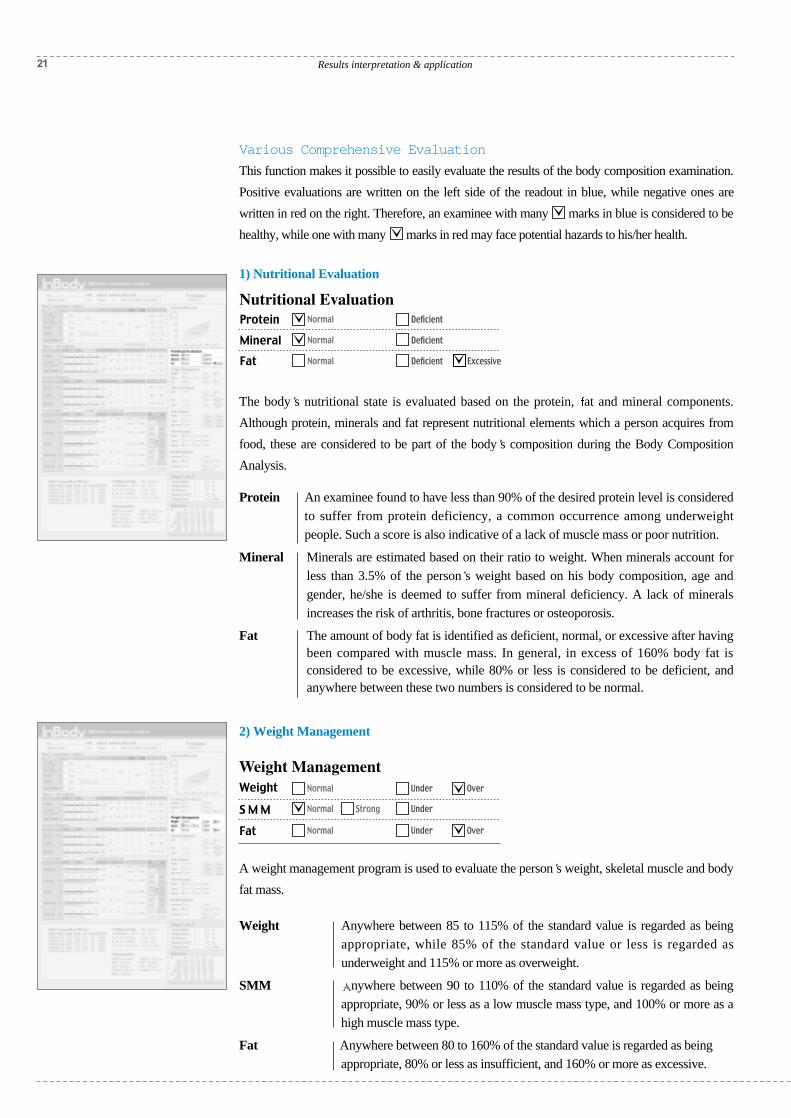
Various Comprehensive Evaluation
This function makes it possible to easily evaluate the results of the body composition examination.
Positive evaluations are written on the left side of the readout in blue, while negative ones are
written in red on the right. Therefore, an examinee with many marks in blue is considered to be
healthy, while one with many marks in red may face potential hazards to his/her health.
1) Nutritional Evaluation
The body??
?W-X ??7@1 ??3@@ ??N@5 ??J(Y ??.Y? ?
???????????????????
s nutritional state is evaluated based on the protein, at and mineral components.
Although protein, minerals and fat represent nutritional elements which a person acquires from
food, these are considered to be part of the body??
?W-X ??7@1 ??3@@ ??N@5 ??J(Y ??.Y? ?
???????????????????
s composition during the Body Composition
Analysis.
Protein An examinee found to have less than 90% of the desired protein level is considered
to suffer from protein deficiency, a common occurrence among underweight
people. Such a score is also indicative of a lack of muscle mass or poor nutrition.
Mineral Minerals are estimated based on their ratio to weight. When minerals account for
less than 3.5% of the person??
?W-X ??7@1 ??3@@ ??N@5 ??J(Y ??.Y? ?
???????????????????
s weight based on his body composition, age and
gender, he/she is deemed to suffer from mineral deficiency. A lack of minerals
increases the risk of arthritis, bone fractures or osteoporosis.
Fat The amount of body fat is identified as deficient, normal, or excessive after havingbeen compared with muscle mass. In general, in excess of 160% body fat isconsidered to be excessive, while 80% or less is considered to be deficient, andanywhere between these two numbers is considered to be normal.
2) Weight Management
A weight management program is used to evaluate the person??
?W-X ??7@1 ??3@@ ??N@5 ??J(Y ??.Y? ?
???????????????????
s weight, skeletal muscle and body
fat mass.
Weight Anywhere between 85 to 115% of the standard value is regarded as being
appropriate, while 85% of the standard value or less is regarded as
underweight and 115% or more as overweight.
SMM @?he@Lhe@1he@@L?h@@1?h
?J@@@LhW&<?@)X?g75e3@1?g
?J@YeV@@Lg?7@@@@@@@1g?@f?I'@L?fJ5gN@1?f7Hg?3@Lf@Lh@)X?e
@@@@g?@@@)?e
nywhere between 90 to 110% of the standard value is regarded as being
appropriate, 90% or less as a low muscle mass type, and 100% or more as a
high muscle mass type.
Fat Anywhere between 80 to 160% of the standard value is regarded as being
appropriate, 80% or less as insufficient, and 160% or more as excessive.
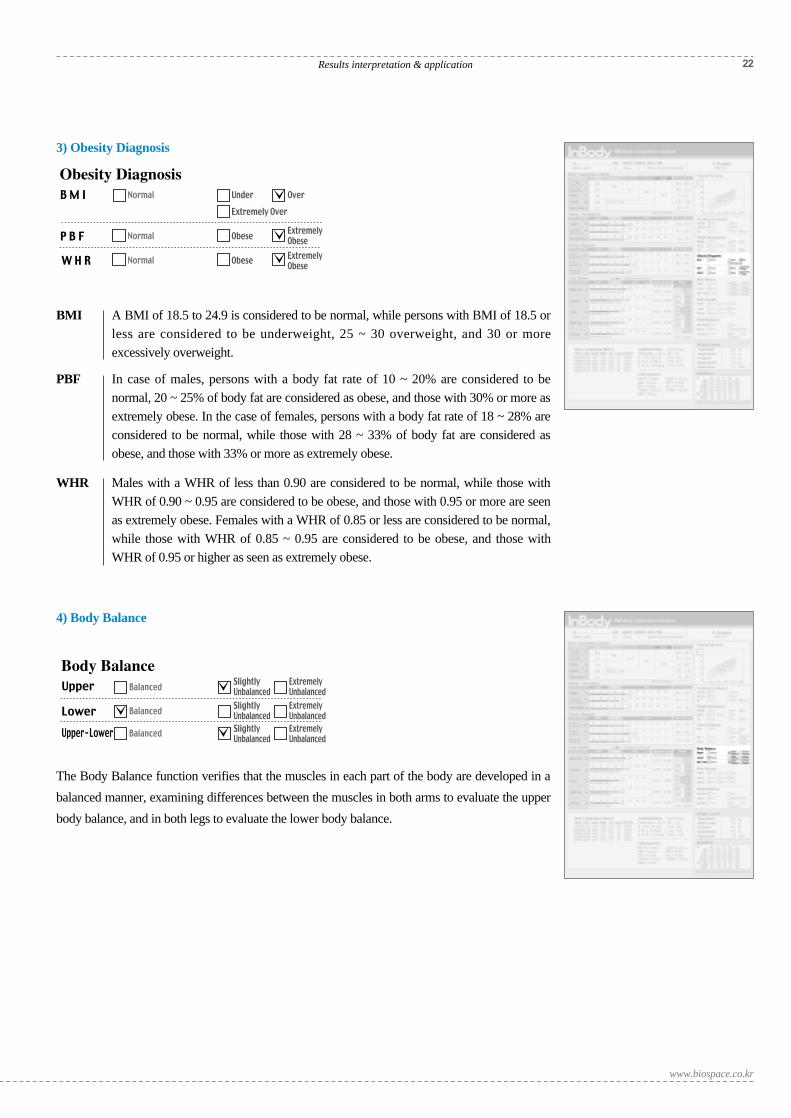
3) Obesity Diagnosis
BMI A BMI of 18.5 to 24.9 is considered to be normal, while persons with BMI of 18.5 or
less are considered to be underweight, 25 ~ 30 overweight, and 30 or more
excessively overweight.
PBF In case of males, persons with a body fat rate of 10 ~ 20% are considered to be
normal, 20 ~ 25% of body fat are considered as obese, and those with 30% or more as
extremely obese. In the case of females, persons with a body fat rate of 18 ~ 28% are
considered to be normal, while those with 28 ~ 33% of body fat are considered as
obese, and those with 33% or more as extremely obese.
WHR Males with a WHR of less than 0.90 are considered to be normal, while those with
WHR of 0.90 ~ 0.95 are considered to be obese, and those with 0.95 or more are seen
as extremely obese. Females with a WHR of 0.85 or less are considered to be normal,
while those with WHR of 0.85 ~ 0.95 are considered to be obese, and those with
WHR of 0.95 or higher as seen as extremely obese.
4) Body Balance
The Body Balance function verifies that the muscles in each part of the body are developed in a
balanced manner, examining differences between the muscles in both arms to evaluate the upper
body balance, and in both legs to evaluate the lower body balance.
22Results interpretation & application
www.biospace.co.kr
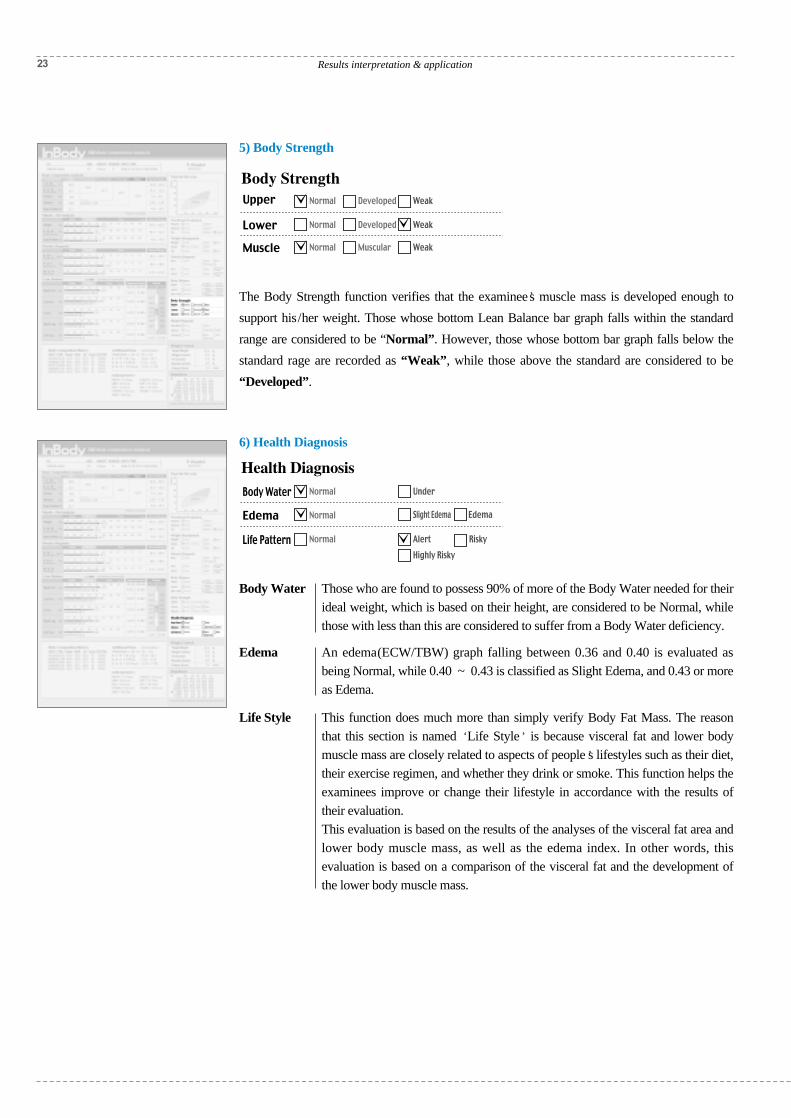
23 Results interpretation & application
5) Body Strength
The Body Strength function verifies that the examinee??
?W-X ??7@1 ??3@@ ??N@5 ??J(Y ??.Y? ?
???????????????????
s muscle mass is developed enough to
support his/her weight. Those whose bottom Lean Balance bar graph falls within the standard
range are considered to be “Normal”. However, those whose bottom bar graph falls below the
standard rage are recorded as “Weak”, while those above the standard are considered to be
“Developed”.
6) Health Diagnosis
Body Water Those who are found to possess 90% of more of the Body Water needed for their
ideal weight, which is based on their height, are considered to be Normal, while
those with less than this are considered to suffer from a Body Water deficiency.
Edema An edema(ECW/TBW) graph falling between 0.36 and 0.40 is evaluated as
being Normal, while 0.40 ~ 0.43 is classified as Slight Edema, and 0.43 or more
as Edema.
Life Style This function does much more than simply verify Body Fat Mass. The reason
that this section is named ??
?W.?e?W&H?e?7@L?e?@@1?e?3@5?e?V+Y?e?
???????????????????
Life Style??
?W-X ??7@1 ??3@@ ??N@5 ??J(Y ??.Y? ?
???????????????????
is because visceral fat and lower body
muscle mass are closely related to aspects of people??
?W-X ??7@1 ??3@@ ??N@5 ??J(Y ??.Y? ?
???????????????????
s lifestyles such as their diet,
their exercise regimen, and whether they drink or smoke. This function helps the
examinees improve or change their lifestyle in accordance with the results of
their evaluation.
This evaluation is based on the results of the analyses of the visceral fat area and
lower body muscle mass, as well as the edema index. In other words, this
evaluation is based on a comparison of the visceral fat and the development of
the lower body muscle mass.
Weight Control
This weight control function is offered as a means of
optimizing the examinee??
?W-X ??7@1 ??3@@ ??N@5 ??J(Y ??.Y? ?
???????????????????
s body composition rather than
simply increasing or decreasing his/her weight. The
target weight set by the InBody720 is different from the
standard weight calculated according to one??
?W-X ??7@1 ??3@@ ??N@5 ??J(Y ??.Y? ?
???????????????????
s height.
‘+’ refers to the amount of mass that must be increased, while ‘-’ refers to the mass which should
be decreased. These unique indexes offered by InBody720, show how for example an examinee??
?W.??W.?e??7H??7H?e??@L??@L?e??@1??@1?e??@@??@@?e?
????????????????????
should lose 00kg body fat mass and gain 00kg of muscle mass through exercise.??
@@e@@hg?3@e3@hg?N@eN@hg?J5eJ5hg?.Ye.Yhg?
????????????????????
The reality is
that two people of the same height and weight who have different body compositions will
have different target weight.
For example, although two people may be of the same height and weight, the person with a
larger muscle mass will have a higher target weight than someone who has more Body Fat Mass.
This is because a person with a larger muscle mass does not have to lose any muscle, even when
it is beyond the 100% level.
Some people who undergo treatment for their obesity simply give up halfway when they see that
they have not lost any weight. This is because muscle increases in inverse proportion to the fat that
is decreased during the treatment of obesity, thus making it difficult to see any change in weight.
The InBody720 allows examinees to clearly see how their treatment brings about changes
in their fat and muscle mass and helps them to monitor their obesity diagnosis and
treatment process, which serves to increase the patient??
?W-X ??7@1 ??3@@ ??N@5 ??J(Y ??.Y? ?
???????????????????
s faith in the treatment.
@@hg@@L?hf@@1?hf
?@6Kf@@@?hf?N@@6Xe@@@?eO2@(g3@@)X?@@@=O2@@(YgV'@@)X@@V@@@@(Y?g?V'@@@@@@@@@0YhV'@@@@@@(Mhe@@@@@@Y?he
W&@@@@@@@6X?h?W&@@@@@V'@@)XhW&@@(Y@@LV'@@)X?g
?W&@@0Y?@@1?V4@@)Xg?&@0M?e@@@?eI4@)g
@@@?hf@@5?hf@@H?hf@@hg
Fitness ScoreThe Fitness Score is an index used to help the examinee easily understand the state ofhis/her body composition.
70 or less Weak Type, Obese Type
70 ~ 90 Normal, Healthy Type
90 or more Strong Type
As an examinee??
?W-X ??7@1 ??3@@ ??N@5 ??J(Y ??.Y? ?
???????????????????
s body composition begins to improve, he/she can see his/her score
improving as their body fat mass get closer to the standard range, and their muscle mass
increases.
24Results interpretation & application
www.biospace.co.kr
25 Results interpretation & application
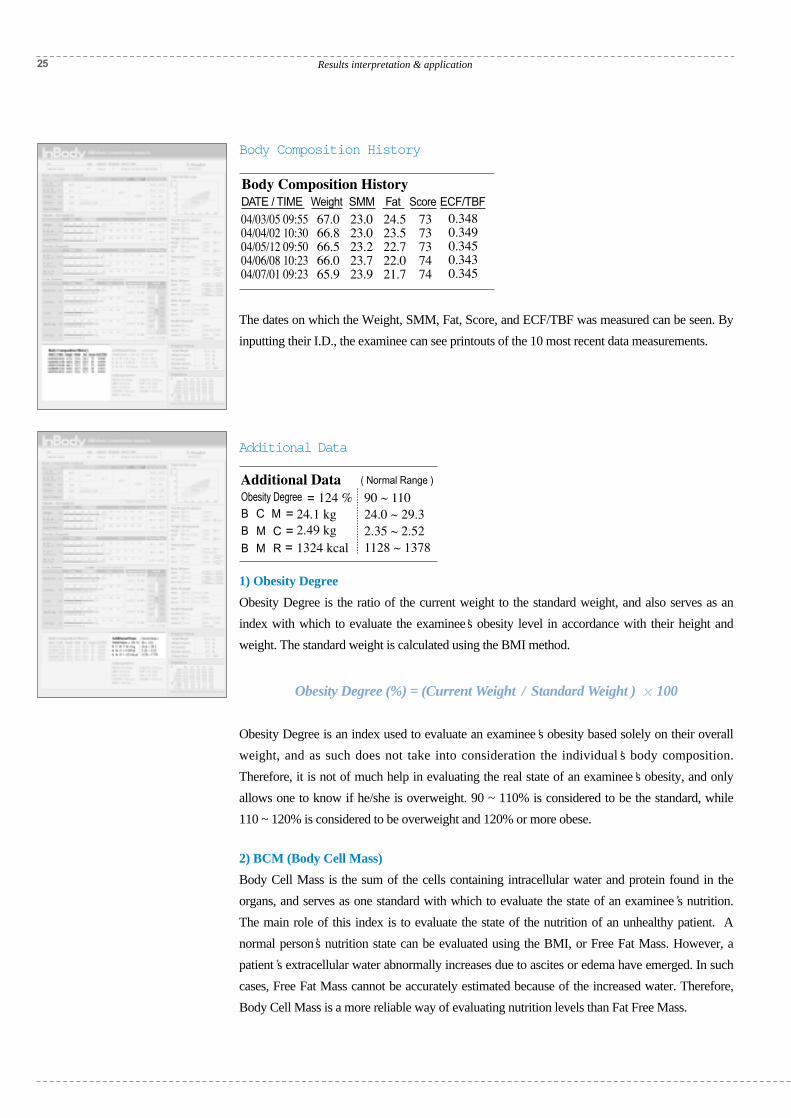
Body Composition History
The dates on which the Weight, SMM, Fat, Score, and ECF/TBF was measured can be seen. By
inputting their I.D., the examinee can see printouts of the 10 most recent data measurements.
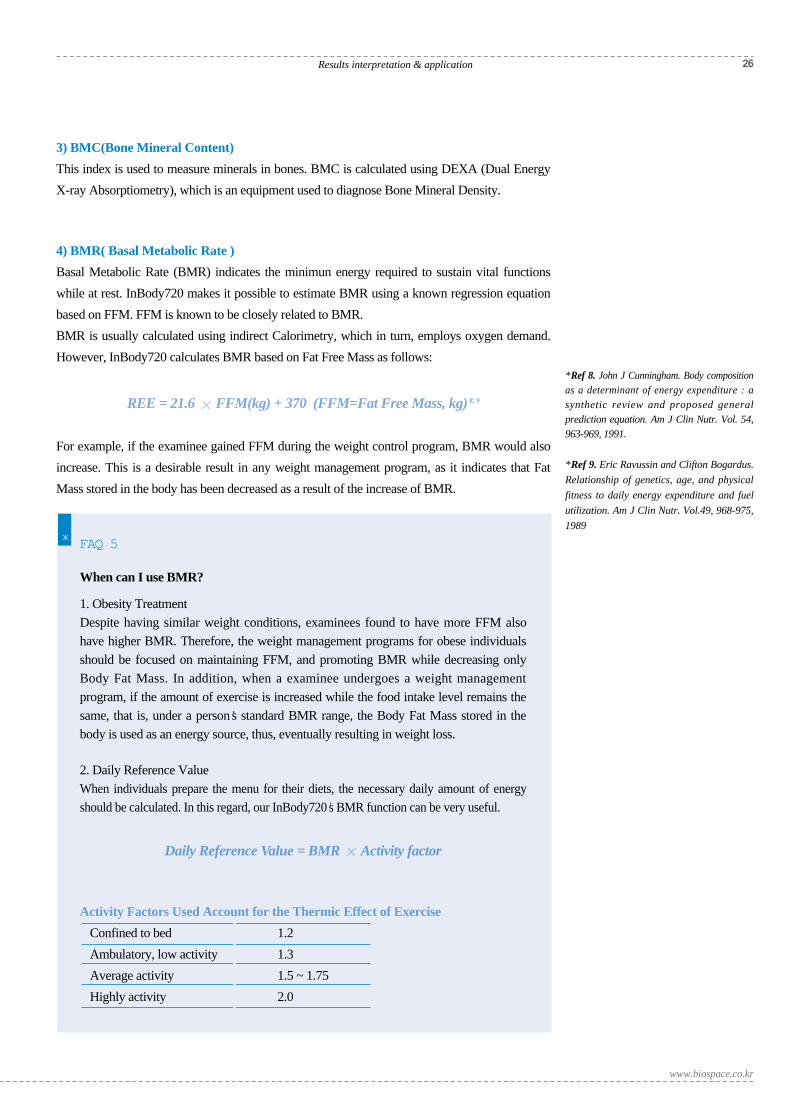
Additional Data
1) Obesity Degree
Obesity Degree is the ratio of the current weight to the standard weight, and also serves as an
index with which to evaluate the examinee??
?W-X ??7@1 ??3@@ ??N@5 ??J(Y ??.Y? ?
???????????????????
s obesity level in accordance with their height and
weight. The standard weight is calculated using the BMI method.
Obesity Degree (%) = (Current Weight / Standard Weight ) ?@@?g?O2@?3@Lf?W2(M??V')X?eW&(YV')X?W&(Y??V')?&(Y?@@(Y?
?W&@@?W&(?')X?
?W&(Y?V')XW&(Ye?V')X?
?O&0Y?fN@1?@0M?g?@@? 100
Obesity Degree is an index used to evaluate an examinee??
?W-X ??7@1 ??3@@ ??N@5 ??J(Y ??.Y? ?
???????????????????
s obesity based solely on their overall
weight, and as such does not take into consideration the individual??
?W-X ??7@1 ??3@@ ??N@5 ??J(Y ??.Y? ?
???????????????????
s body composition.
Therefore, it is not of much help in evaluating the real state of an examinee??
?W-X ??7@1 ??3@@ ??N@5 ??J(Y ??.Y? ?
???????????????????
s obesity, and only
allows one to know if he/she is overweight. 90 ~ 110% is considered to be the standard, while
110 ~ 120% is considered to be overweight and 120% or more obese.
2) BCM (Body Cell Mass)
Body Cell Mass is the sum of the cells containing intracellular water and protein found in the
organs, and serves as one standard with which to evaluate the state of an examinee??
?W-X ??7@1 ??3@@ ??N@5 ??J(Y ??.Y? ?
???????????????????
s nutrition.
The main role of this index is to evaluate the state of the nutrition of an unhealthy patient. A
normal person??
?W-X ??7@1 ??3@@ ??N@5 ??J(Y ??.Y? ?
???????????????????
s nutrition state can be evaluated using the BMI, or Free Fat Mass. However, a
patient??
?W-X ??7@1 ??3@@ ??N@5 ??J(Y ??.Y? ?
???????????????????
s extracellular water abnormally increases due to ascites or edema have emerged. In such
cases, Free Fat Mass cannot be accurately estimated because of the increased water. Therefore,
Body Cell Mass is a more reliable way of evaluating nutrition levels than Fat Free Mass.
/Xe@??W.?eV/X?@?W.Y?e?V/[email protected]@@@H?fJ@@@L?f
?W.Y@V/XfW.Y?@?V/X?e.Ye@??V/?e
3) BMC(Bone Mineral Content)
This index is used to measure minerals in bones. BMC is calculated using DEXA (Dual Energy
X-ray Absorptiometry), which is an equipment used to diagnose Bone Mineral Density.
4) BMR( Basal Metabolic Rate )
Basal Metabolic Rate (BMR) indicates the minimun energy required to sustain vital functions
while at rest. InBody720 makes it possible to estimate BMR using a known regression equation
based on FFM. FFM is known to be closely related to BMR.
BMR is usually calculated using indirect Calorimetry, which in turn, employs oxygen demand.
However, InBody720 calculates BMR based on Fat Free Mass as follows:
REE = 21.6 ?@@?g?O2@?3@Lf?W2(M??V')X?eW&(YV')X?W&(Y??V')?&(Y?@@(Y?
?W&@@?W&(?')X?
?W&(Y?V')XW&(Ye?V')X?
?O&0Y?fN@1?@0M?g?@@?
FFM(kg) + 370 (FFM=Fat Free Mass, kg) 8, 9
For example, if the examinee gained FFM during the weight control program, BMR would also
increase. This is a desirable result in any weight management program, as it indicates that Fat
Mass stored in the body has been decreased as a result of the increase of BMR.
*Ref 8. John J Cunningham. Body compositionas a determinant of energy expenditure : asynthetic review and proposed generalprediction equation. Am J Clin Nutr. Vol. 54,963-969, 1991.
*Ref 9. Eric Ravussin and Clifton Bogardus.
Relationship of genetics, age, and physical
fitness to daily energy expenditure and fuel
utilization. Am J Clin Nutr. Vol.49, 968-975,
1989
26Results interpretation & application
www.biospace.co.kr
FAQ 5
When can I use BMR?
1. Obesity Treatment
Despite having similar weight conditions, examinees found to have more FFM also
have higher BMR. Therefore, the weight management programs for obese individuals
should be focused on maintaining FFM, and promoting BMR while decreasing only
Body Fat Mass. In addition, when a examinee undergoes a weight management
program, if the amount of exercise is increased while the food intake level remains the
same, that is, under a person??
?W-X ??7@1 ??3@@ ??N@5 ??J(Y ??.Y? ?
???????????????????
s standard BMR range, the Body Fat Mass stored in the
body is used as an energy source, thus, eventually resulting in weight loss.
2. Daily Reference Value
When individuals prepare the menu for their diets, the necessary daily amount of energy
should be calculated. In this regard, our InBody720?W&??7@??3@??N@??J5??.Y?s BMR function can be very useful.
Daily Reference Value = BMR ?@@?g?O2@?3@Lf?W2(M??V')X?eW&(YV')X?W&(Y??V')?&(Y?@@(Y?
?W&@@?W&(?')X?
?W&(Y?V')XW&(Ye?V')X?
?O&0Y?fN@1?@0M?g?@@? Activity factor
Activity Factors Used Account for the Thermic Effect of Exercise
Confined to bed 1.2
Ambulatory, low activity 1.3
Average activity 1.5 ~ 1.75
Highly activity 2.0
27 Results interpretation & application
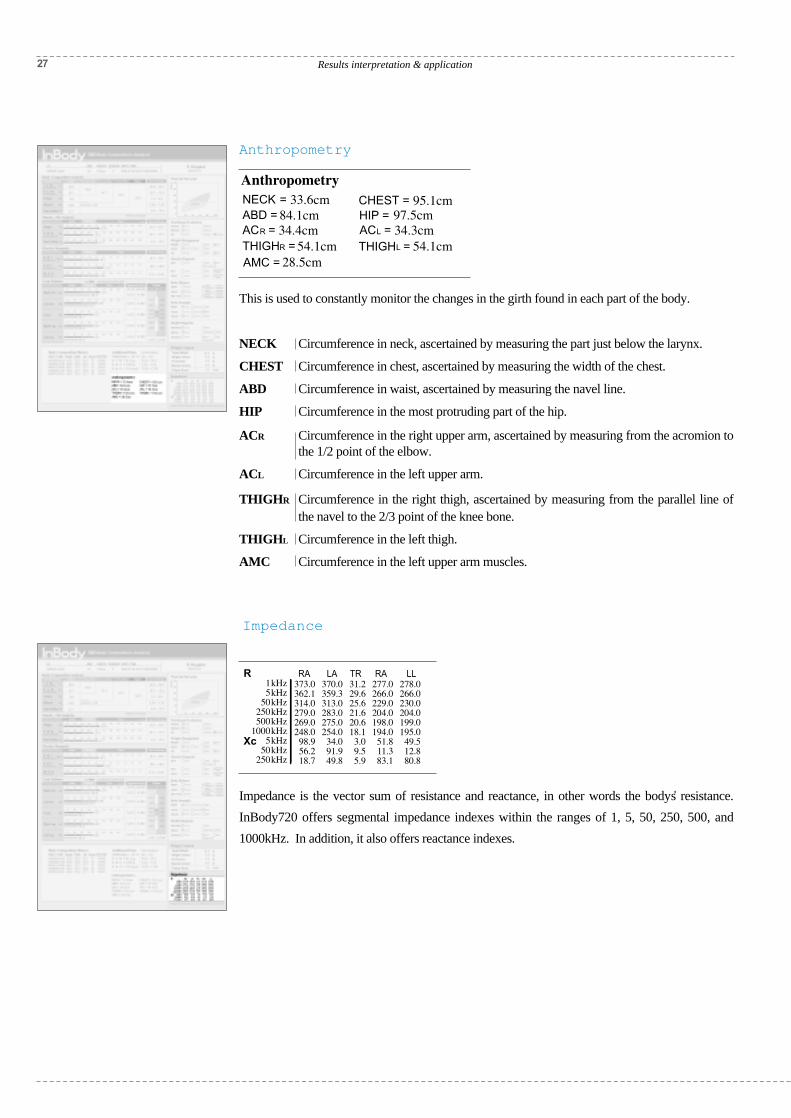
Anthropometry
This is used to constantly monitor the changes in the girth found in each part of the body.
NECK Circumference in neck, ascertained by measuring the part just below the larynx.
CHEST Circumference in chest, ascertained by measuring the width of the chest.
ABD Circumference in waist, ascertained by measuring the navel line.
HIP Circumference in the most protruding part of the hip.
ACR Circumference in the right upper arm, ascertained by measuring from the acromion tothe 1/2 point of the elbow.
ACL Circumference in the left upper arm.
THIGHR Circumference in the right thigh, ascertained by measuring from the parallel line ofthe navel to the 2/3 point of the knee bone.
THIGHL Circumference in the left thigh.
AMC Circumference in the left upper arm muscles.
Impedance
Impedance is the vector sum of resistance and reactance, in other words the body??
?W-X ??7@1 ??3@@ ??N@5 ??J(Y ??.Y? ?
???????????????????
s resistance.
InBody720 offers segmental impedance indexes within the ranges of 1, 5, 50, 250, 500, and
1000kHz. In addition, it also offers reactance indexes.

www.biospace.co.kr