biology i - enrichment plusenrichmentplus.com/media/msbiocomplete.pdf · kelly d. berg project...
TRANSCRIPT
Biology I
Resource Guide
UBJECT
REA
ESTING
ROGRAM
S
A
T
P
All rights reservedCopyright 2005, Jerald D. DuncanPublishing rights to Enrichment Plus, LLC
The text and graphics of this publication, or any part thereof, may not be reproduced or transmitted in any form or by any means, electronic or mechanical, including photocopying, recording, storage in an information retrieval system, or otherwise, without the prior written permission of the copyright holder.
This publication includes some images from CorelDRAW 9 which are protected by the copyright laws of the United States, Canada, and elsewhere. Used under license. Some images also acquired from © 2005 www.clipart.com.
Mississippi SATP Biology I Student Review Guide
byCecilia L. Boles
Kelly D. BergProject Coordinator and Executive Editor
Enrichment Plus, LLCPublisher
013105/013105AK
3 IntroductionTable of Contents
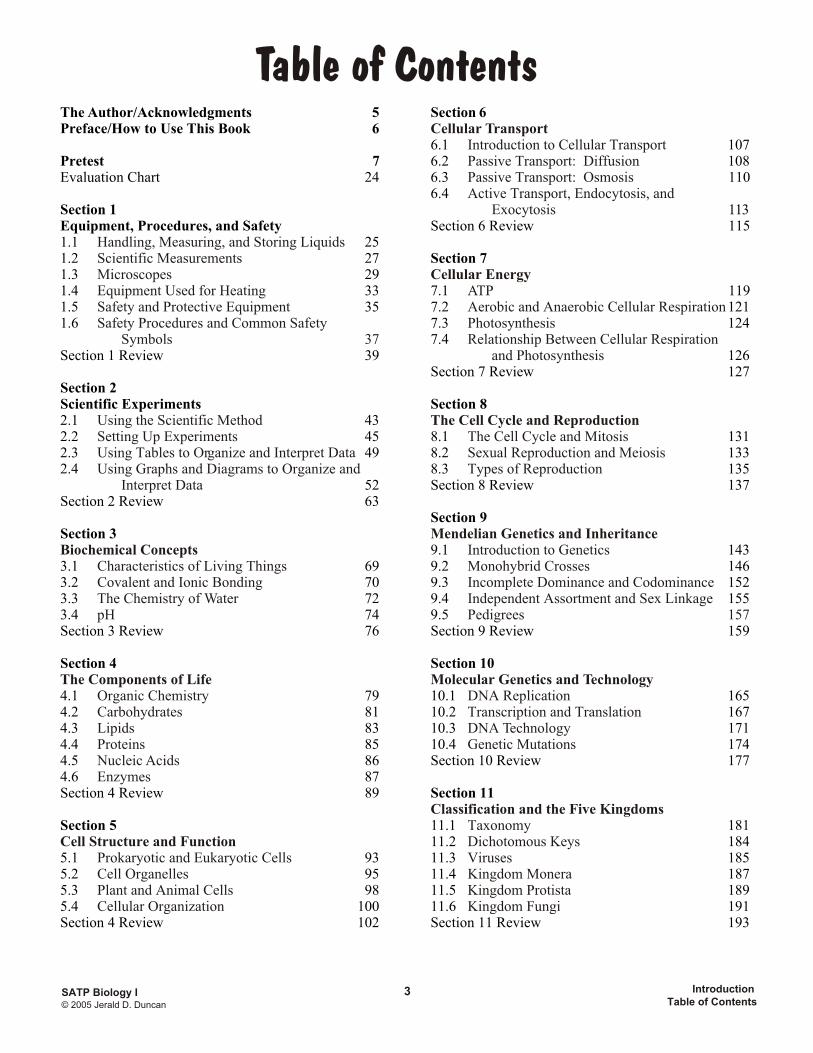
Table of ContentsThe Author/Acknowledgments 5 Section 6Preface/How to Use This Book 6
6.1 107Pretest 7 6.2 108Evaluation Chart 24 6.3 110
6.4Section 1 113Equipment, Procedures, and Safety Section 6 Review 1151.1 251.2 27 Section 7 1.3 291.4 33 7.1 1191.5 35 7.2 1211.6 7.3 124
7.4Section 1 Review 39 126
Section 7 Review 127Section 2Scientific Experiments Section 82.1 432.2 45 8.1 1312.3 49 8.2 1332.4 8.3 135
52 Section 8 Review 137Section 2 Review 63
Section 9 Section 3
9.1 1433.1 69 9.2 1463.2 70 9.3 1523.3 72 9.4 1553.4 74 9.5Section 3 Review 76 Section 9 Review 159
Section 4 Section 10
4.1 79 10.1 1654.2 81 10.2 1674.3 83 10.3 1714.4 85 10.4 1744.5 86 Section 10 Review 1774.6 87Section 4 Review 89 Section 11
Section 5 11.1 18111.2 184
5.1 93 11.3 1855.2 95 11.4 1875.3 98 11.5 1895.4 100 11.6 191Section 4 Review 102 Section 11 Review 193
Cellular TransportIntroduction to Cellular TransportPassive Transport: DiffusionPassive Transport: OsmosisActive Transport, Endocytosis, and
Exocytosis
Handling, Measuring, and Storing LiquidsScientific MeasurementsMicroscopes Cellular EnergyEquipment Used for Heating ATPSafety and Protective Equipment Aerobic and Anaerobic Cellular RespirationSafety Procedures and Common Safety Photosynthesis
Symbols 37 Relationship Between Cellular Respiration and Photosynthesis
Using the Scientific Method The Cell Cycle and ReproductionSetting Up Experiments The Cell Cycle and MitosisUsing Tables to Organize and Interpret Data Sexual Reproduction and MeiosisUsing Graphs and Diagrams to Organize and Types of Reproduction
Interpret Data
Mendelian Genetics and InheritanceBiochemical Concepts Introduction to Genetics
Characteristics of Living Things Monohybrid CrossesCovalent and Ionic Bonding Incomplete Dominance and CodominanceThe Chemistry of Water Independent Assortment and Sex LinkagepH Pedigrees 157
The Components of Life Molecular Genetics and TechnologyOrganic Chemistry DNA ReplicationCarbohydrates Transcription and TranslationLipids DNA TechnologyProteins Genetic MutationsNucleic AcidsEnzymes
Classification and the Five KingdomsTaxonomy
Cell Structure and Function Dichotomous KeysProkaryotic and Eukaryotic Cells VirusesCell Organelles Kingdom MoneraPlant and Animal Cells Kingdom ProtistaCellular Organization Kingdom Fungi
© 2005 Jerald D. Duncan
SATP Biology I

4 IntroductionTable of Contents
Section 12 Section 16
12.1 199 16.1 25312.2 201 16.2 25912.3 203 16.3Section 12 Review 206 262
16.4 266Section 13 16.5 268Kingdom Animalia Section 16 Review 27113.1 20913.2 211 Practice Test 1 (separate booklet)13.3 216 Practice Test 1 Evaluation Chart PT1-18Section 13 Review 220
Practice Test 2 (separate booklet)Section 14 Practice Test 1 Evaluation Chart PT2-18Evidence of Change in Species14.1 Evidence of Change 223 Index A-114.2 Introduction to Natural Selection 22614.3 Results of Natural Selection 229Section 14 Review 232
Section 15
15.1 23515.2 23915.3 24115.4 24315.5 24515.6 246Section 15 Review 248
Kingdom Plantae EcosystemsOverview of Plants BiomesNon-Vascular Plants (Bryophytes) Ecological RelationshipsVascular Plants (Tracheophytes) Population Growth and Interdependence
in EcosystemsEcological SuccessionHuman Impact on Ecosystems
Overview of AnimalsInvertebratesChordates and Vertebrates
The Flow of Energy and MatterThe Flow of Energy in EcosystemsPyramids of Biomass and NumbersThe Water CycleThe Carbon CycleThe Oxygen CycleThe Nitrogen Cycle
© 2005 Jerald D. Duncan
SATP Biology I
The Mississippi SATP Biology I Student Review Guide is written to help students review the skills needed to pass the Biology I end-of-course test in Mississippi. This comprehensive guide is based on the Mississippi Biology I Framework Competencies as correlated by the Mississippi State Department of Education.
How To Use This BookStudents:The Biology I end-of-course test is required for graduation. You must pass the state end-of-course test, which contains multiple-choice and open-ended questions. This book is a review for the Biology I end-of-course test.
j Take the pre-test at the front of this book. The pre-test gauges your knowledge of Biology I content that will be tested on the end-of-course test. The pre-test is designed to identify areas that you need to review.
k Score the pre-test. Using the pre-test evaluation chart, circle the questions that you answered incorrectly.
l For each question that you missed on the pre-test, review the corresponding sections in the book. Read the instructional material, do the practice exercises, and take the section review tests at the end of each section.
m After reviewing the material, take the two practice tests (provided as separate booklets). These practice tests are written to look similar to the actual Biology I end-of-course test, so they will give you practice in taking the test.
n After taking Practice Test 1 and/or Practice Test 2, use the practice test evaluation charts, which are found directly after each practice test, to identify areas for further review and practice. The practice test evaluation charts can be used in the same way as the pre-test evaluation chart.
Teachers:This review guide is also intended to save you, the teacher, time in the classroom. It can be used
or . Since this student guide offers review for ALL of the Mississippi Curriculum Framework for the Biology I course, you, the teacher, have one consolidated resource of materials to help your students prepare for the end-of-course test.
for classroom instruction for individual student review
j When teaching or tutoring individual students, use the strategy outlined above for students. By taking the pre-test, students can identify areas that need improvement. The pre-test evaluation chart directs the student to the sections they need to review for instruction and additional practice.
k For classroom study, use this guide to supplement lesson plans and to give additional review for skills required by the Biology I Framework Competencies. Purchase a class set of guides for use in the classroom or assign guides to students for out-of-classroom work.
l Assign the practice tests (provided in separate booklets) as comprehensive review tests. Score the tests according to the scoring directions given on pages PT1-1 and PT2-1 of the testing booklets to approximate the scoring potential for the actual SATP test.
m Use the practice test evaluation charts found after each practice test to identify areas needing further review.
n To establish benchmarks, you, the teacher, may want to use one of the practice tests (provided in separate booklets) as a pre-test. Score the practice test according to the practice test scoring directions given on pages PT1-1 and PT2-1 of the testing booklets. Then after the students have completed all the exercises in this review guide, use the second practice test to gauge progress. You should see marked improvement between the initial and final benchmarks. (You may also want to use the pre-test in this book to get an initial score, but the pre-test does not include open-ended response questions.)
o Please DO NOT photocopy materials from this guide or the practice test booklets. These materials are intended to be used as student workbooks, and individual pages should not be duplicated by any means without permission from the copyright holder. To purchase additional or specialized copies of sections in this book, please contact the publisher at 1-800-745-4706.
Preface
6 IntroductionPreface© 2005 Jerald D. Duncan
SATP Biology I

7Pre-Test
Biology IPre-TestIntroduction
IntroductionThe pre-test that follows is designed to identify areas where you, the student, can improve your skills before or after taking the Biology I end-of-course test. This pre-test will be similar in format to the multiple-choice section of the Mississippi end-of-course SATP test for Biology I. However, this pre-test does not include open-ended written response questions. It contains more multiple-choice questions than the actual Biology I SATP end-of-course test (100 instead of 85).
DirectionsRead the directions on the following page. These directions should be similar to what you will see on the actual SATP end-of-course test for Biology I. Once you have completed this pre-test, circle the questions you answered incorrectly on the pre-test evaluation chart on page 24.
Purpose of the Pre-TestThe following pre-test can be used as practice for the multiple-choice part of the actual SATP Biology I test, but it is primarily a diagnostic tool to help you, the student, identify which content areas you can improve in order to prepare better for the actual test. Any pre-test question answered incorrectly may identify content you need to review. Review the corresponding content(s) indicated in the Pre-Test Evaluation Chart by reading the instructional material on the given pages and completing the practice exercises and reviews. By reviewing the content material, you will improve mastery of the material to be tested on the SATP Biology I test and potentially increase the score you receive on that test. (The practice tests, which are given in separate booklets, are provided to give you, the student, additional practice taking tests similar to the actual SATP Biology I test.)
Scoring on the Actual SATP for Biology I The actual test that you will take to pass the Biology I course will consist of 85 multiple-choice questions and 2 open-ended response questions. Out of these 85 multiple-choice questions, only 70 questions will be scored. Only one of the constructed response questions will be scored. The scorable questions are pre-determined. The other 15 multiple-choice questions embedded throughout the test are field-test questions that will not be scored. You will not know which questions will be scored and which ones will not, so you should answer each and every question as if it will be scored. The same is true for the two constructed response questions. One is pre-determined as scorable, and the other is an experimental question. You will not know which one is which, so answer them both as though they will be scored. (There are no constructed response questions on the pre-test in this review guide.)
You must obtain a scale score of 300 or higher on the actual SATP Biology I test. This scale score is determined by taking the questions you answered correctly (your raw score) and statistically converting them by taking into account the difficulty of the test questions. This statistical conversion will vary from test to test, so there is no set formula for converting a raw score into a scale score. Your raw score is determined by one point for each multiple-choice question you answer correctly and a maximum score of four on the scorable constructed response question. You may score 0 to 4 points on the constructed response depending you how completely and accurately you answered the question.
Scoring the Pre-TestSince there is no set formula for converting a raw score into a scale score, this pre-test cannot be scored on a scale score. However, on this pre-test, you can approximate your score. On this pre-test, there are no open-ended constructed response questions, but there are 15 additional multiple-choice questions. Count each multiple-choice question as one point for a total of 100 possible points. A raw score of 50 out of 100 on this pre-test would approximate a scale score of 300 on the actual test and may indicate that you have the minimum knowledge necessary to pass the end-of-course test. However, by identifying areas needing improvement in this pre-test, you have the opportunity to review and master the content before taking or re-taking the test. Reviewing the content now may improve your score on the actual test.
For each question that you missed on the pre-test, review the corresponding sections in the book as given in the evaluation chart. Read the instructional material, do the practice exercises, and take the section review tests at the end of each section.
© 2005 Jerald D. Duncan
SATP Biology I

© 2005 Jerald D. Duncan
SATP Biology I 10Pre-Test
9. Carson tested reaction times for 10 classmates and 2 teachers. He had each test subject separate his or her index finger and thumb exactly one inch apart. He then dropped a ruler between the index finger and thumb and measured the distance on the ruler. The quicker the reaction time, the smaller the measurement on the ruler. From his data, he concluded that it takes the average person 24 millimeters to react.
All of the following would be effective added controls for his experiment EXCEPT —
A limiting the experiment to one age group.
B increasing the number of subjects tested.
C increasing the width between the finger and thumb to two inches.
D testing all of the subjects at the same time of the day such as right when they wake up in the morning.
A B C D
12. A national study was conducted to compare the results of tenth grade males and tenth grade females on standardized science tests in the years 2002, 2003, and 2004. What type of graph would BEST show the results of this study?
A bar graph
B line graph
C pie graph
D diagram
13. Look at the graph below:
A B C D
Which of the following is correct based on the information in the graph?
A At point X, the population is decreasing.
B At point X, the population is increasing.
C At point X, the population is stable.
D At point X, the species has become extinct.
Time
Pop
ulat
ion
Siz
e
X
A B C D
Species Population Growth
11. Dr. Kildare has studied the increase of asthma among children ages 6-12 and ages 13-18 over the past 25 years. What type of graph would BEST show the results of his study?
A bar graph
B line graph
C pie graph
D pictographA B C D
10. Dionna and Tiffany were conducting an experiment to determine the effects of exercise on heart rate and blood pressure. After discussing different methods of exercising, they decided to have each test subject climb up and down the steps outside the classroom. Dionna wrote down that they would have each person go up and down exactly three steps as quickly as possible for three minutes. Why did Dionna need to be this specific when she wrote out the procedure for the experiment?
A Dionna wanted to have everything her way.
B Dionna didn’t want the subjects going too far from the testing station.
C Dionna wanted to make sure that the subjects could follow directions.
D Dionna wanted to control all of the possible variables.
A B C D

1
2
3
4
5
6
7
8
9
10
11
12
13
14
15
16
17
18
19
20
21
22
23
24
25
26
27
28
29
30
31
32
33
34
If you missedquestion #:
Go to section(s):
24Pre-Test
Biology IPre-Test
Evaluation Chart
© 2005 Jerald D. Duncan
SATP Biology I
35
36
37
38
39
40
41
42
43
44
45
46
47
48
49
50
51
52
53
54
55
56
57
58
59
60
61
62
63
64
65
66
67
68
If you missedquestion #:
69
70
71
72
73
74
75
76
77
78
79
80
81
82
83
84
85
86
87
88
89
90
91
92
93
94
95
96
97
98
99
100
If you missedquestion #:
1.3
1.4
1.2
1.5
1.6
2.2
2.2
1.5
2.2
2.2
2.4
2.4
2.4
2.4
3.1
3.2
3.2
3.3
3.3
3.3
3.4
3.4
4.2
4.3
4.5
4.4
3.6, 4.6
4.6
5.1
5.1
5.3
5.3
5.3
5.2
Go to section(s):
5.2
5.2
5.2
5.4
5.4
6.1
6.4
6.2
6.3
8.1
8.1
8.1
8.1, 8.2
8.1
8.2
8.3
8.3
7.1
7.1
7.1
7.2
7.3
7.4
7.2
7.2
10.1
10.2
10.4
10.3
10.3
9.1, 9.2
9.4
9.2
9.1, 9.2
Go to section(s):
9.4
9.4, 9.5
11.1
11.1
11.4
11.6, 16.2
12.1
12.2
12.3
12.2
13.3
11.3, 11.4
11.4
14.1
14.1
14.3
14.3
15.5
15.6
16.2
16.2
16.1
16.1
16.1
16.1
16.1
15.1
15.1
16.4
16.5
16.3
16.5
Circle the questions you answered incorrectly on the chart below, and review the corresponding sections in the book. Read the instructional material, do the practice exercises, and take the section review tests at the end of each section.

Section 1.1Handling, Measuring, and Storing Liquids
© 2005 Jerald D. Duncan
Student Guide: Mississippi SATP Biology I 25Equipment, Procedures, and Safety
Section 1.1
Equipment, Procedures,and Safety
To understand how biologists work, you first need to know the names of some basic equipment and glassware, and when and how they are used.
Measuring and Dispensing LiquidsVarious kinds of glassware are used for the storing, measurement, and handling of liquids, but only a few are used for measurement.
A graduated cylinder (figure 1-1) is used to accurately measure the volume of liquids. The most common measurement for volume is milliliters, which is abbreviated mL. To get the most precise and accurate measurement, you would use a graduated cylinder with the smallest marks, or graduations. Accuracy and precision are not the same thing. An accurate measurement is a correct measurement. Precision, on the other hand, is defined by how many decimal places are in a measurement. For example, 15.2 mL is a more precise measurement than 15 mL. Usually a smaller graduated cylinder is more precise than a larger one. Look at this example:
Example: You are given two graduated cylinders. The first graduated cylinder holds 15 mL. Between each long mL mark are 4 shorter marks representing 0.2 mL each. The second graduated cylinder holds 25 mL. Each large mark represents 5 mL, and each smaller mark represents 1 mL. Which could be used to accurately measure 10 mL of liquid? Which graduated cylinder is more precise?
Either one could be used to accurately measure 10 mL of liquid, but the 15 mL graduated cylinder is more precise. It is marked in smaller increments of 0.2 mL instead of the 1 mL marks on the 25 mL graduated cylinder.
Fig. 1-1
5
10
15
20
8
9
10
11
15 mLgraduatedcylinder
25 mLgraduatedcylinder
preciseto 0.2 mL
preciseto 1 mL
When measuring liquid in a graduated cylinder, you read the amount of liquid from the center of the meniscus. The meniscus is the curve at the surface of the liquid. The meniscus of most liquids curve down, but the meniscus of mercury curves up.1
2
3
4
meniscus
Graduated cylinders are not the only pieces of glassware used for measurements. For very small liquid measurements, you can use a pipette (figure 1-2), burette (figure 1-3), or syringe (figure 1-4). These pieces of equipment are also used for dispensing liquids in measured amounts.
Fig. 1-2 Fig. 1-3 Fig. 1-4
0
10
20
30
40
50
60

© 2005 Jerald D. Duncan
Student Guide: Mississippi SATP Biology I 52Scientific Experiments
Section 2.4
Section 2.4Using Graphs and Diagrams
to Organize and Interpret Data
ScientificExperiments
After data has been gathered, you must interpret the information and present it in such as way that it makes sense to others. One way you saw in Section 2.3 was to summarize the information in a table. Another way to do this is to use one or more graphs or diagrams. Graphs and diagrams present information in a way that makes data easier to interpret visually.
As when reading a table, make sure you understand what kind of data is being given in the graph or diagram. Look at the title of the graph or diagram and all the labeled parts.
First, let’s look at graphs. There are different types of graphs that can be used to display data. Each type of graph has a specific use. Remember, you always want to choose the best way to display your data that makes it easiest to interpret.
Line GraphsLine graphs are frequently used to show how something changes over time. The horizontal, or x-axis, is used to show the time frame. The vertical, or y-axis, is used to show the dependent variable. All graphs should have a title, and both the x and y axes should be labeled.
Since one of the most important features of line graphs is to be able to see trends, you can often take a trend and match it to the graph that represents the data. Before we look at reading graphs, let’s look at four types of trends: an upward trend, a downward trend, a peaking trend, and an unstable trend with ups and downs. The general type of line for each trend is given below. Make sure you read each example, which shows the type of data that would give that type of trend. (Note: An additional trend not shown here is one that shows no change. No change in data results in a horizontal line.)
Upward Trend Peaking Trend
Independent Element
De
pe
nd
en
t E
lem
en
t
Downward Trend
Independent Element
De
pe
nd
en
t E
lem
en
t
Independent Element
De
pe
nd
en
t E
lem
en
t
The dependent element increases as the independent element increases.
The dependent element decreases as the independent element increases.
The dependent element increases to a point and then begins to decrease as the independent element increases.
Unstable Trend
Independent Element
De
pe
nd
en
t E
lem
en
t
The dependent element increases and decreases several times as the independent element increases.
Example: A simple example of an upward trend would be the height of plants over time. As the time increases, the height of the plants also increase. This type of data would fit the pattern of an upward trend graph.
Example: A downward trend in data would be like the decrease in a bacteria population as an antibiotic increases. The line would go down as the bacteria population decreases over time.
Example: A peaking trend would fit data like pain medication effectiveness. The effectiveness increases for awhile and then begins to decrease as the time increases.
Example: An unstable trend might be seen in a deer population during a year. The population may go up and down each season based on the births of offspring, populations of predators that eat deer, and deer season for hunters.
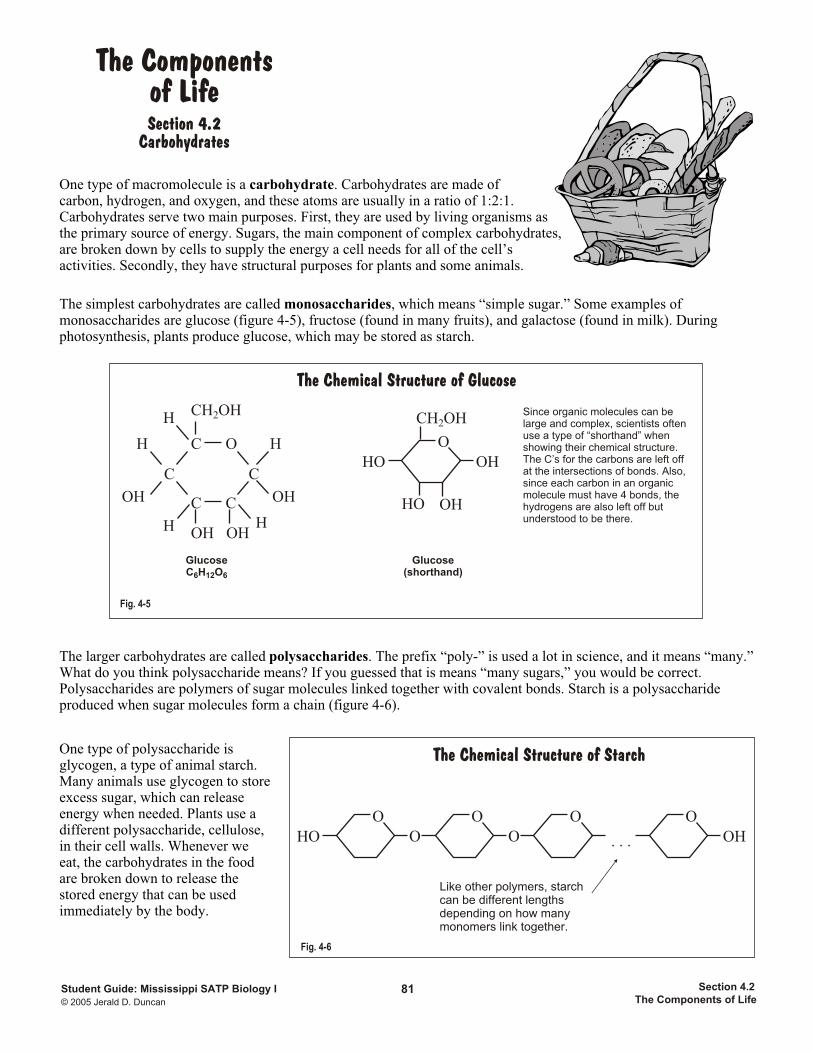
One type of macromolecule is a carbohydrate. Carbohydrates are made of carbon, hydrogen, and oxygen, and these atoms are usually in a ratio of 1:2:1. Carbohydrates serve two main purposes. First, they are used by living organisms as the primary source of energy. Sugars, the main component of complex carbohydrates, are broken down by cells to supply the energy a cell needs for all of the cell’s activities. Secondly, they have structural purposes for plants and some animals.
Section 4.2Carbohydrates
© 2005 Jerald D. Duncan
Student Guide: Mississippi SATP Biology I 81The Components of Life
Section 4.2
The simplest carbohydrates are called monosaccharides, which means “simple sugar.” Some examples of monosaccharides are glucose (figure 4-5), fructose (found in many fruits), and galactose (found in milk). During photosynthesis, plants produce glucose, which may be stored as starch.
The larger carbohydrates are called polysaccharides. The prefix “poly-” is used a lot in science, and it means “many.” What do you think polysaccharide means? If you guessed that is means “many sugars,” you would be correct. Polysaccharides are polymers of sugar molecules linked together with covalent bonds. Starch is a polysaccharide produced when sugar molecules form a chain (figure 4-6).
C
C
C
O
C
C
H
OH
CH OH2
OH
OHOH
H
H
H H
GlucoseC H O26 1 6
O
CH OH2
OH
HO OH
HO
Glucose(shorthand)
Since organic molecules can be large and complex, scientists often use a type of “shorthand” when showing their chemical structure. The C’s for the carbons are left off at the intersections of bonds. Also, since each carbon in an organic molecule must have 4 bonds, the hydrogens are also left off but understood to be there.
The Chemical Structure of Glucose
Fig. 4-5
O
HO
The Chemical Structure of Starch
Fig. 4-6
OO
OO
OH
O
. . .
Like other polymers, starch can be different lengths depending on how many monomers link together.
One type of polysaccharide is glycogen, a type of animal starch. Many animals use glycogen to store excess sugar, which can release energy when needed. Plants use a different polysaccharide, cellulose, in their cell walls. Whenever we eat, the carbohydrates in the food are broken down to release the stored energy that can be used immediately by the body.
The Componentsof Life
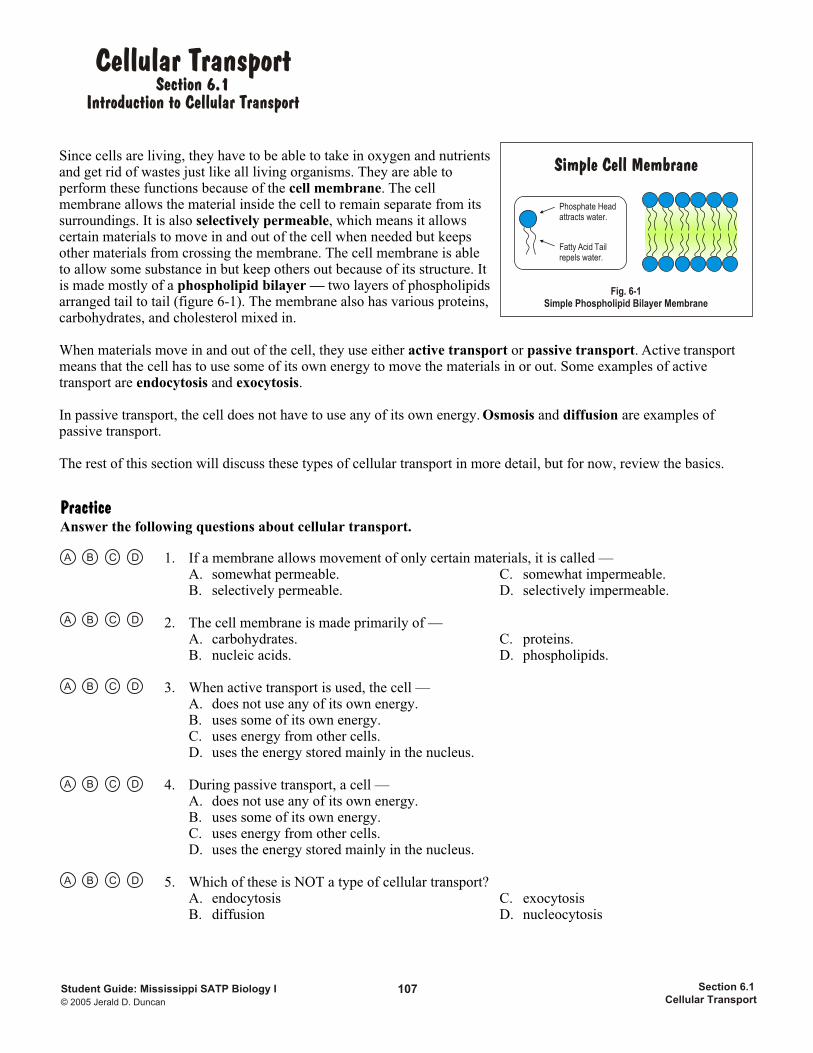
Since cells are living, they have to be able to take in oxygen and nutrients and get rid of wastes just like all living organisms. They are able to perform these functions because of the cell membrane. The cell membrane allows the material inside the cell to remain separate from its surroundings. It is also selectively permeable, which means it allows certain materials to move in and out of the cell when needed but keeps other materials from crossing the membrane. The cell membrane is able to allow some substance in but keep others out because of its structure. It is made mostly of a phospholipid bilayer — two layers of phospholipids arranged tail to tail (figure 6-1). The membrane also has various proteins, carbohydrates, and cholesterol mixed in.
When materials move in and out of the cell, they use either active transport or passive transport. Active transport means that the cell has to use some of its own energy to move the materials in or out. Some examples of active transport are endocytosis and exocytosis.
In passive transport, the cell does not have to use any of its own energy. Osmosis and diffusion are examples of passive transport.
The rest of this section will discuss these types of cellular transport in more detail, but for now, review the basics.
Section 6.1Introduction to Cellular Transport
© 2005 Jerald D. Duncan
Student Guide: Mississippi SATP Biology I 107Cellular Transport
Section 6.1
Cellular Transport
Fig. 6-1Simple Phospholipid Bilayer Membrane
Phosphate Head attracts water.
Fatty Acid Tailrepels water.
Simple Cell Membrane
PracticeAnswer the following questions about cellular transport.
1. If a membrane allows movement of only certain materials, it is called —A. somewhat permeable. C. somewhat impermeable.B. selectively permeable. D. selectively impermeable.
2. The cell membrane is made primarily of —A. carbohydrates. C. proteins.B. nucleic acids. D. phospholipids.
3. When active transport is used, the cell —A. does not use any of its own energy.B. uses some of its own energy.C. uses energy from other cells.D. uses the energy stored mainly in the nucleus.
4. During passive transport, a cell —A. does not use any of its own energy.B. uses some of its own energy.C. uses energy from other cells.D. uses the energy stored mainly in the nucleus.
5. Which of these is NOT a type of cellular transport?A. endocytosis C. exocytosisB. diffusion D. nucleocytosis
A B C D
A B C D
A B C D
A B C D
A B C D
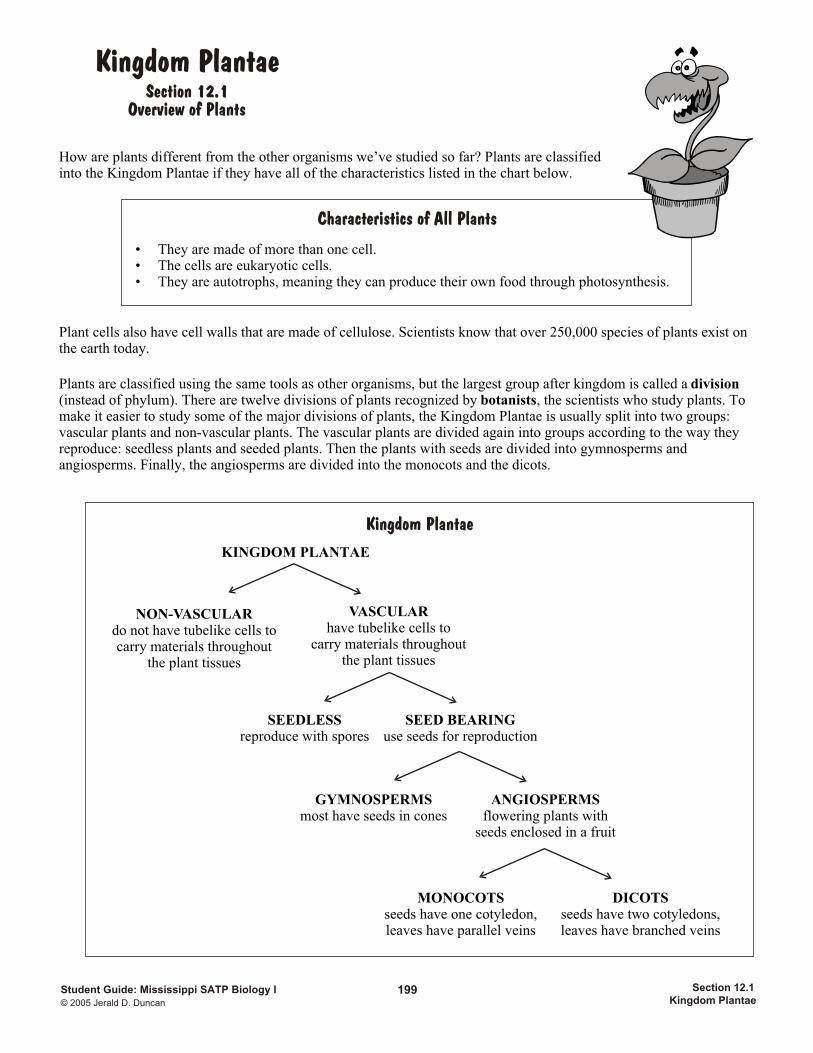
How are plants different from the other organisms we’ve studied so far? Plants are classified into the Kingdom Plantae if they have all of the characteristics listed in the chart below.
Section 12.1Overview of Plants
© 2005 Jerald D. Duncan
Student Guide: Mississippi SATP Biology I 199Kingdom Plantae
Section 12.1
Kingdom Plantae
Plant cells also have cell walls that are made of cellulose. Scientists know that over 250,000 species of plants exist on the earth today.
• They are made of more than one cell.• The cells are eukaryotic cells.• They are autotrophs, meaning they can produce their own food through photosynthesis.
Characteristics of All Plants
Plants are classified using the same tools as other organisms, but the largest group after kingdom is called a division (instead of phylum). There are twelve divisions of plants recognized by botanists, the scientists who study plants. To make it easier to study some of the major divisions of plants, the Kingdom Plantae is usually split into two groups: vascular plants and non-vascular plants. The vascular plants are divided again into groups according to the way they reproduce: seedless plants and seeded plants. Then the plants with seeds are divided into gymnosperms and angiosperms. Finally, the angiosperms are divided into the monocots and the dicots.
Kingdom Plantae
KINGDOM PLANTAE
NON-VASCULARdo not have tubelike cells tocarry materials throughout
the plant tissues
VASCULARhave tubelike cells to
carry materials throughoutthe plant tissues
SEEDLESSreproduce with spores
SEED BEARINGuse seeds for reproduction
GYMNOSPERMSmost have seeds in cones
ANGIOSPERMSflowering plants with
seeds enclosed in a fruit
MONOCOTSseeds have one cotyledon,leaves have parallel veins
DICOTSseeds have two cotyledons,leaves have branched veins
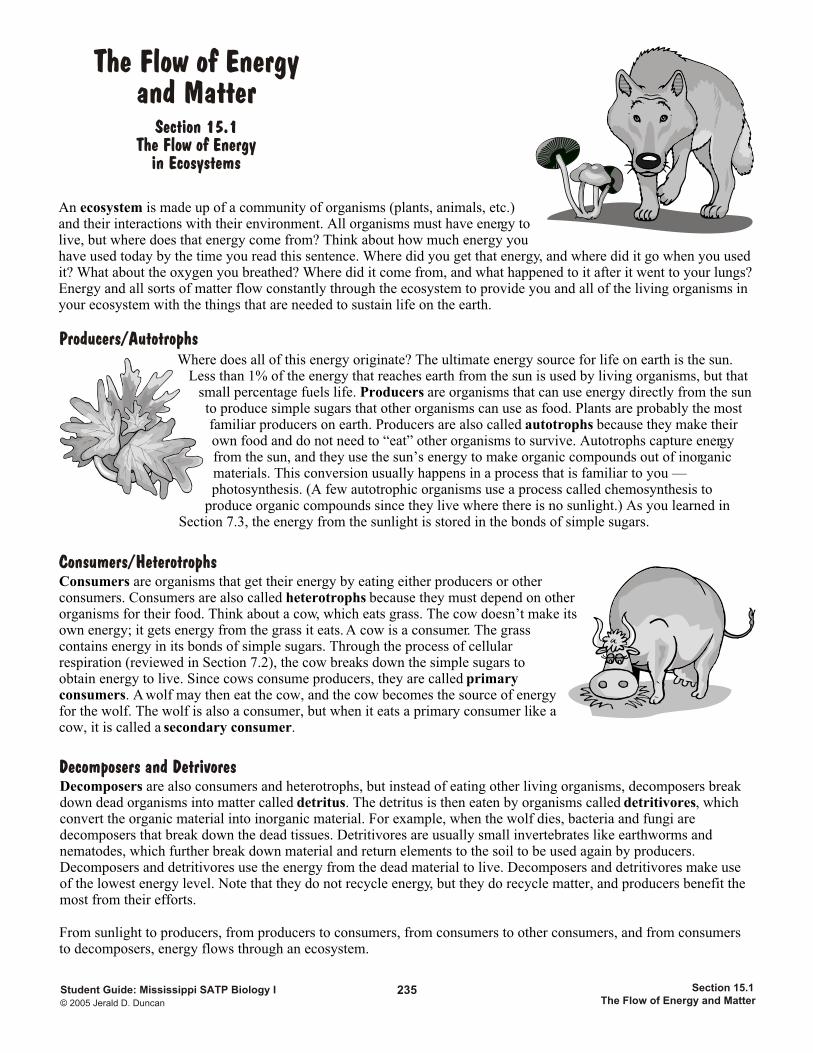
An ecosystem is made up of a community of organisms (plants, animals, etc.) and their interactions with their environment. All organisms must have energy to live, but where does that energy come from? Think about how much energy you have used today by the time you read this sentence. Where did you get that energy, and where did it go when you used it? What about the oxygen you breathed? Where did it come from, and what happened to it after it went to your lungs? Energy and all sorts of matter flow constantly through the ecosystem to provide you and all of the living organisms in your ecosystem with the things that are needed to sustain life on the earth.
Section 15.1The Flow of Energy
in Ecosystems
© 2005 Jerald D. Duncan
Student Guide: Mississippi SATP Biology I 235The Flow of Energy and Matter
Section 15.1
The Flow of Energyand Matter
Where does all of this energy originate? The ultimate energy source for life on earth is the sun. Less than 1% of the energy that reaches earth from the sun is used by living organisms, but that
small percentage fuels life. Producers are organisms that can use energy directly from the sun to produce simple sugars that other organisms can use as food. Plants are probably the most familiar producers on earth. Producers are also called autotrophs because they make their own food and do not need to “eat” other organisms to survive. Autotrophs capture energy from the sun, and they use the sun’s energy to make organic compounds out of inorganic materials. This conversion usually happens in a process that is familiar to you — photosynthesis. (A few autotrophic organisms use a process called chemosynthesis to
produce organic compounds since they live where there is no sunlight.) As you learned in Section 7.3, the energy from the sunlight is stored in the bonds of simple sugars.
Producers/Autotrophs
Consumers are organisms that get their energy by eating either producers or other consumers. Consumers are also called heterotrophs because they must depend on other organisms for their food. Think about a cow, which eats grass. The cow doesn’t make its own energy; it gets energy from the grass it eats. A cow is a consumer. The grass contains energy in its bonds of simple sugars. Through the process of cellular respiration (reviewed in Section 7.2), the cow breaks down the simple sugars to obtain energy to live. Since cows consume producers, they are called primary consumers. A wolf may then eat the cow, and the cow becomes the source of energy for the wolf. The wolf is also a consumer, but when it eats a primary consumer like a cow, it is called a secondary consumer.
Consumers/Heterotrophs
Decomposers are also consumers and heterotrophs, but instead of eating other living organisms, decomposers break down dead organisms into matter called detritus. The detritus is then eaten by organisms called detritivores, which convert the organic material into inorganic material. For example, when the wolf dies, bacteria and fungi are decomposers that break down the dead tissues. Detritivores are usually small invertebrates like earthworms and nematodes, which further break down material and return elements to the soil to be used again by producers. Decomposers and detritivores use the energy from the dead material to live. Decomposers and detritivores make use of the lowest energy level. Note that they do not recycle energy, but they do recycle matter, and producers benefit the most from their efforts.
Decomposers and Detrivores
From sunlight to producers, from producers to consumers, from consumers to other consumers, and from consumers to decomposers, energy flows through an ecosystem.
Section 16.3, continuedPopulation Growth andInterdependence in Ecosystems
very large area of land with a huge food supply. They began to multiply quickly. Soon the rabbits were eating all of the grass that was intended for sheep and cattle. Even though “gentlemen hunters” could shoot as many as 1200 a day for sport, the rabbit population kept increasing. In about ten years, 2 million rabbits could be shot or trapped yearly with little effect on the rabbit population size. The rabbits destroyed vegetation and wiped out entire species of native plants. The extinction of certain plants led to the extinction of one-eighth (1/8th) of Australia’s mammal species. Meanwhile, the rabbits continued to multiply. Eventually, Australians built miles of fences in an attempt to keep the rabbits from spreading into other parts of Australia. The rabbits are still a significant problem for Australian landowners today.
© 2005 Jerald D. Duncan
Student Guide: Mississippi SATP Biology I 263EcosystemsSection 16.3
As you can see with the Australian rabbit example, even a small change in the natural relationships can have a big impact on an ecosystem. Not all changes in an ecosystem are the result of introducing a new species. Small changes can occur naturally from year to year or from season to season.
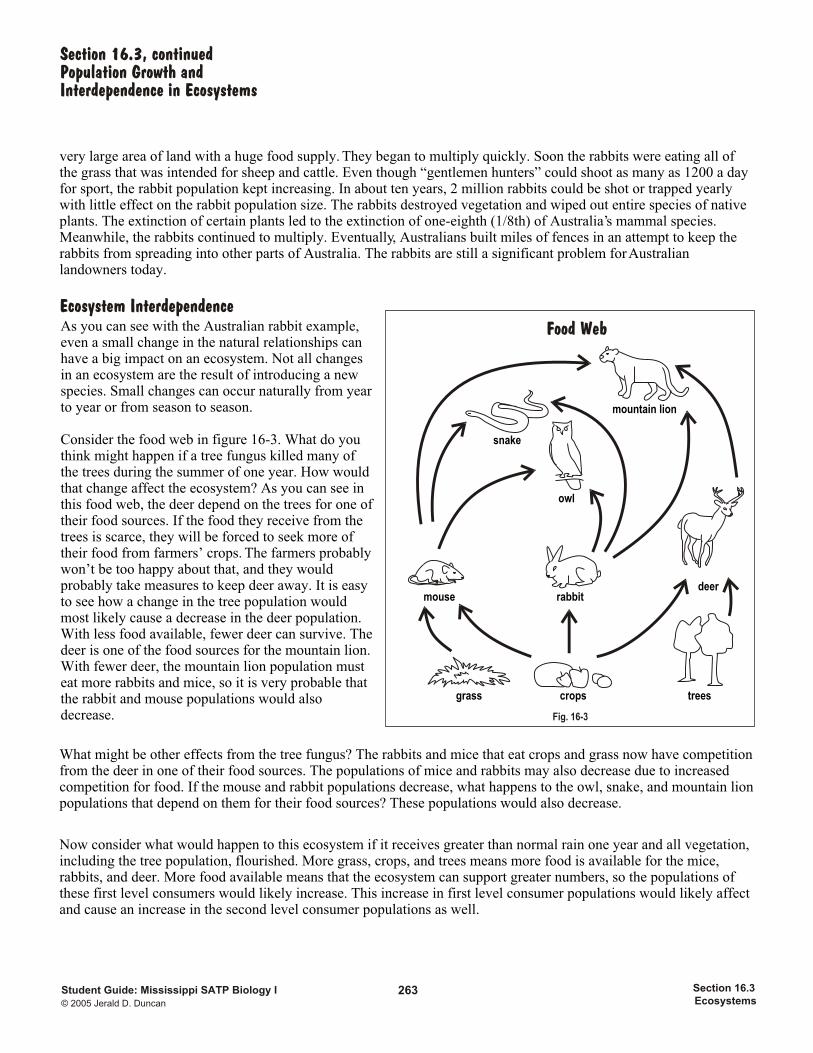
Consider the food web in figure 16-3. What do you think might happen if a tree fungus killed many of the trees during the summer of one year. How would that change affect the ecosystem? As you can see in this food web, the deer depend on the trees for one of their food sources. If the food they receive from the trees is scarce, they will be forced to seek more of their food from farmers’ crops. The farmers probably won’t be too happy about that, and they would probably take measures to keep deer away. It is easy to see how a change in the tree population would most likely cause a decrease in the deer population. With less food available, fewer deer can survive. The deer is one of the food sources for the mountain lion. With fewer deer, the mountain lion population must eat more rabbits and mice, so it is very probable that the rabbit and mouse populations would also decrease.
Ecosystem InterdependenceFood Web
grass trees
mouse rabbitdeer
owl
snake
mountain lion
crops
Fig. 16-3
What might be other effects from the tree fungus? The rabbits and mice that eat crops and grass now have competition from the deer in one of their food sources. The populations of mice and rabbits may also decrease due to increased competition for food. If the mouse and rabbit populations decrease, what happens to the owl, snake, and mountain lion populations that depend on them for their food sources? These populations would also decrease.
Now consider what would happen to this ecosystem if it receives greater than normal rain one year and all vegetation, including the tree population, flourished. More grass, crops, and trees means more food is available for the mice, rabbits, and deer. More food available means that the ecosystem can support greater numbers, so the populations of these first level consumers would likely increase. This increase in first level consumer populations would likely affect and cause an increase in the second level consumer populations as well.
A B C D
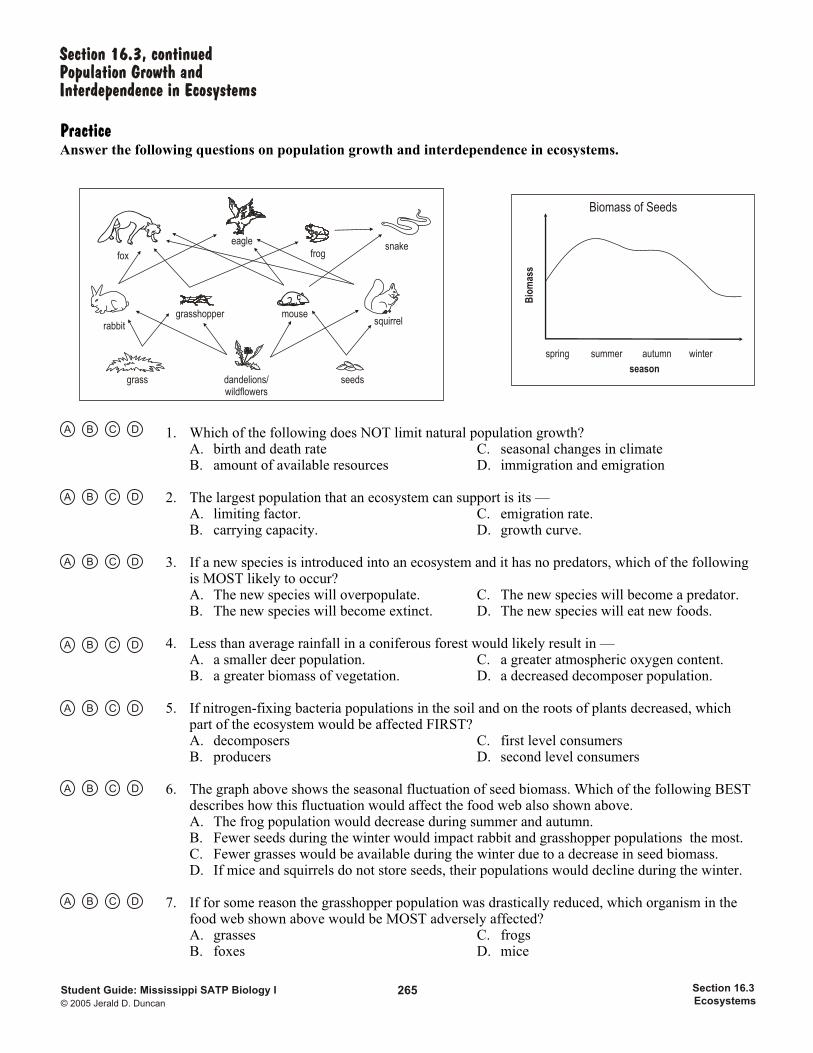
PracticeAnswer the following questions on population growth and interdependence in ecosystems.
1. Which of the following does NOT limit natural population growth?A. birth and death rate C. seasonal changes in climateB. amount of available resources D. immigration and emigration
2. The largest population that an ecosystem can support is its —A. limiting factor. C. emigration rate.B. carrying capacity. D. growth curve.
3. If a new species is introduced into an ecosystem and it has no predators, which of the following is MOST likely to occur?A. The new species will overpopulate. C. The new species will become a predator.B. The new species will become extinct. D. The new species will eat new foods.
4. Less than average rainfall in a coniferous forest would likely result in —A. a smaller deer population. C. a greater atmospheric oxygen content.B. a greater biomass of vegetation. D. a decreased decomposer population.
5. If nitrogen-fixing bacteria populations in the soil and on the roots of plants decreased, which part of the ecosystem would be affected FIRST?A. decomposers C. first level consumersB. producers D. second level consumers
6. The graph above shows the seasonal fluctuation of seed biomass. Which of the following BEST describes how this fluctuation would affect the food web also shown above.A. The frog population would decrease during summer and autumn.B. Fewer seeds during the winter would impact rabbit and grasshopper populations the most.C. Fewer grasses would be available during the winter due to a decrease in seed biomass.D. If mice and squirrels do not store seeds, their populations would decline during the winter.
7. If for some reason the grasshopper population was drastically reduced, which organism in the food web shown above would be MOST adversely affected?A. grasses C. frogsB. foxes D. mice
Section 16.3, continuedPopulation Growth andInterdependence in Ecosystems
© 2005 Jerald D. Duncan
Student Guide: Mississippi SATP Biology I 265EcosystemsSection 16.3
grass seedsdandelions/wildflowers
rabbit squirrelmousegrasshopper
snakeeagle
fox frog
season
Bio
mas
s
Biomass of Seeds
winterspring summer autumn
A B C D
A B C D
A B C D
A B C D
A B C D
A B C D