bioinformatic studies on structural elements...
TRANSCRIPT
UNIVERSIDADE DE LISBOA Faculdade de Ciências Departamento de Informática
BIOINFORMATIC STUDIES ON STRUCTURAL
ELEMENTS FOR THE REGULATION OF
ALTERNATIVE OXIDASE (AOX) GENE
ACTIVITIES
Moisés Geraldes Xavier
Confidential
Mestrado em Engenharia Informática
2007


UNIVERSIDADE DE LISBOA Faculdade de Ciências Departamento de Informática
BIOINFORMATIC STUDIES ON STRUCTURAL
ELEMENTS FOR THE REGULATION OF
ALTERNATIVE OXIDASE (AOX) GENE
ACTIVITIES
Moisés Geraldes Xavier
Projecto orientado pelo Prof. Dr. Francisco José Moreira Couto
e supervisionado pela Prof. Dra. Birgit Arnholdt-Schmitt
Mestrado em Engenharia Informática
2007


Declaração
Moisés Geraldes Xavier, aluno nº 25533 da Faculdade de Ciências da Universidade de
Lisboa, declara ceder os seus direitos de cópia sobre o seu Relatório de Projecto em
Engenharia Informática, intitulado "Bionformatic studies on structural elements for the
regulation of Alternative Oxidase (AOX) gene Activities", realizado no ano lectivo de
2007 à Faculdade de Ciências da Universidade de Lisboa para o efeito de arquivo e
consulta nas suas bibliotecas e publicação do mesmo em formato electrónico na Internet.
FCUL, de de 2007
_____________________________________________
Birgit Arnholdt-Schmitt, supervisor do projecto de Moisés Geraldes Xavier, aluno da
Faculdade de Ciências da Universidade de Lisboa, declara concordar com a divulgação do
Relatório do Projecto em Engenharia Informática, intitulado "Bionformatic studies on
structural elements for the regulation of Alternative Oxidase (AOX) gene Activities".
Évora, de de 2007
_____________________________________________


Abstract
Alternative Oxidase genes encode a small family of isoenzymes (enzymes with some
differences but act in the same chemical reaction). AOX is present in plants, fungi, algae,
some yeast, and was also found in some classes of the animal kingdom. The enzymes are
responsible for an alternative pathway of respiration that is responsive to stress conditions
but also to pathogen attack, as well as growth and stage development.
Scaffold Matrix Attachment Regions (S/MARs) are DNA sequences from 300 to
3000 nucleotides that bound with nuclear proteins serving as anchors for DNA, influencing
in this way the DNA organization inside the cell. Several studies have failed to reveal a
pattern of organization in the sequences, however some rules have been found that help
computer based analysis. Experimental identification of these sequences is hard and time
consuming, computer methods could provide a first step selection, and cover larger
sequences.
In order to highlight possible links between S/MARs and differential regulation of
AOX genes, the first part of this project consists in identifying structurally relevant S/MAR
regions in the neighborhood of AOX genes in Arabidopsis thaliana and in rice using a
selected computer program.
Single Nucleotide Polymorphisms (SNPs) are variations in one nucleotide base
among DNA sequences from the same location, from different individuals. These
differences could serve as markers to classify a specific set of individuals.
The second part of this project consists in the development of a bioinformatic
application that will help in the identification of specific polymorphisms (SNPs) in
sequences that are experimentally obtained at the EU Marie Curie Chair in ICAM
University of Évora, where this project is performed.
Keywords
Bioinformatic, Scaffold Matrix Attachment Regions, Single Nucleotide
Polymorphisms, Alternative Oxidase


Resumo
Os genes da oxidase alternativa (ou AOX) codificam uma pequena família de
isoenzimas (enzimas com algumas diferenças mas que actuam nas mesmas reacções
químicas), que se encontram nas plantas, fungos, algas, algumas leveduras bem como em
algumas classes do reino animal. A AOX é responsável por uma via alternativa de
respiração, activada principalmente em condições de stress mas também como reacção a
ataques patogénicos, bem como em estádios específicos do desenvolvimento da planta.
As “Scaffold Matrix Attachment Regions” (S/MARs) são sequências de DNA entre
300 e 3000 nucleótidos que se ligam a proteínas do núcleo da célula, servindo como
âncoras para o DNA, conferindo-lhe assim uma forma própria no interior da célula.
Estudos realizados para determinar uma organização específica destas regiões não
produziram muitos resultados, no entanto foram definidas algumas regras que permitem
ajudar na detecção computacional destas sequências, uma vez que a detecção experimental
é difícil e morosa.
Com vista a estabelecer possíveis relações entre uma regulação diferenciada dos
genes da AOX através dos S/MARs, a primeira parte deste projecto consiste em determinar
as regiões do DNA com a estrutura de potenciais “S/MARs” na vizinhança dos genes da
Oxidase Alternativa na Arabidopsis thaliana e no arroz.
“Single Nucleotide Polymorphisms” (SNPs) são diferenças de um nucleótido entre
as mesmas regiões de DNA de diferentes indivíduos da mesma espécie. Estas diferenças
podem servir para marcar um determinado conjunto de indivíduos.
A segunda parte deste projecto consiste em desenvolver uma aplicação para ajudar
na identificação de tipos específicos de polimorfismos, (SNPs) em sequências identificadas
na EU Marie Curie Chair, ICAM, Universidade de Évora, onde este projecto foi
desenvolvido.

Resumo Alargado
A aplicação da Informática no campo de estudo de outras ciências, revela-se
fundamental na concretização de projectos de dimensões consideráveis, que envolvem a
gestão e análise de grandes quantidades de dados. A utilização de técnicas informáticas
para extrair informação dos dados obtidos, simplifica consideravelmente a dimensão e
consequente resolução dos problemas. No contexto dos problemas de Biologia Molecular,
a Bioinformática assume um papel preponderante, fornecendo ferramentas e metodologias
extremamente úteis.
A Bioinformática estuda informação biológica recorrendo a conceitos de Biologia,
Genética, Informática, Estatística, Bioquímica, entre outras, sendo frequentemente dividida
em duas áreas, gestão de informação biológica e biologia computacional. A sua aplicação
prática estende-se por áreas tais como análise de sequências de DNA, descoberta e
anotação de genes, análise evolutiva entre várias espécies, análise das semelhanças e
diferenças entre os genomas das várias espécies, regulação de genes, interacções entre
proteínas, análise da estrutura das proteínas, etc.
Este projecto integra-se na Cátedra Marie Curie do Instituto de Ciências Agrárias
Mediterrânicas (ICAM) da Universidade de Évora inserindo-se no contexto de um projecto
mais amplo; “Stress adaptation in plants – A molecular approach of social-economic
interest”, relacionado com a procura de um marcador molecular que espera fornecer novas
perspectivas para o melhoramento de plantas.
Neste projecto pretende-se estudar as possíveis implicações de certas sequências na
regulação dos genes da Oxidase Alternativa (AOX), bem como desenvolver um aplicação
que ajude na identificação de diferenças entre os genes da Oxidase Alternativa de modo a
esta ser aceite como um marcador funcional para uma reprogramação eficiente das células
em condições de stress [5] [6].
A oxidase alternativa (AOX) existe nas plantas, fungos, algas, algumas leveduras,
bem como em algumas classes do reino animal, nomeadamente nos mollusca e nematoda
[5]. Esta enzima localiza-se na membrana interna da mitocôndria, sendo responsável por
uma via alternativa da cadeia respiratória. Esta via quando activa reduz a quantidade de
energia biológica (ATP) e a quantidade de espécies reactivas de oxigénio, ao contrário do
que se verifica na via da cadeia respiratória. As espécies reactivas de oxigénio quando
presentes em grandes quantidades são tóxicas para as células. A AOX está associada à

produção de calor, à resposta a infecções virais bem como na prevenção da morte celular
programada [40] [5] [43].
A AOX é codificada por uma família de genes dividida em duas subfamílias de
genes, a AOX1 e a AOX2. Alguns genes da subfamília AOX1 são expressos
preferencialmente sob condições de stress (p.e. ausência de água, excesso de calor, etc.)
enquanto que, a expressão dos genes da subfamília da AOX2 está associada com os
estádios específicos de desenvolvimento da planta [27]. Na Aradidopsis thaliana (Thale
cress) foram identificados quatro genes da subfamília AOX1 (AOX1a, AOX1b, AOX1c e
AOX1d) e um gene da subfamília AOX2 (AOX2) e no arroz (Oryza sativa) apenas quatro
genes da subfamília AOX1 (AOX1a, AOX1b, AOX1c e AOX1d) [3] [4].
O DNA de um determinado organismo contém toda a sua informação genética, que
determina as suas características fenotípicas. É constituído por uma dupla cadeia de
nucleótidos enrolados em dupla hélice. Os nucleótidos são as unidades estruturais do DNA,
e são caracterizados por quatro “bases” Adenina (A), Guanina (G), Citosina (C) e Timina
(T). Esta dupla cadeia é complementar ou seja sempre que existe uma Adenina numa
cadeia existe uma Timina na outra e vice-versa, sendo o mesmo verdade para a Guanina e
Citosina.
Para o DNA dar origem a uma proteína, primeiro uma molécula de RNA,
complementar ao DNA é sintetizada, sendo depois produzida a proteína a partir da
molécula de RNA sintetizada.
Neste projecto pretende-se estudar a localização de certas regiões denominadas
Scaffold Matrix Attachment Regions (S/MARS) na vizinhança dos genes da AOX na
Arabidopsis thaliana e no arroz, bem como desenvolver um programa para ajuda na
identificação de diferenças, por exemplo Single Nucleotide Polymorphisms (SNPs) nos
genes da AOX em diferentes espécies.
As Scaffold Matrix Attachment Regions (S/MARs) são regiões do DNA que têm
entre 300 e 3000 pares de bases aproximadamente, ligando-se a proteínas do núcleo da
célula, funcionando como pontos de ancoragem para o DNA, conferindo-lhe uma estrutura
própria e compartimentalizando o DNA em regiões funcionais.
A identificação destas regiões experimentalmente é feita através de processos de
associação e desassociação dos S/MARs com as proteínas do núcleo recorrendo a
procedimentos não triviais e morosos. O recurso a uma identificação destas regiões através
de ferramentas informáticas proporciona um primeiro passo no sentido da redução do
número de candidatos, bem como a pesquisa em sequências de grandes dimensões.
Estas regiões não possuem uma estrutura padrão característica, o que dificulta a sua
identificação. São no entanto conhecidas pela sua elevada quantidade de Adeninas (A) e
Timinas (T), bem como duas subsequências específicas com aproximadamente 200 bases
pares de distância. Alguns estudos tentaram caracterizar estas sequências usando modelos
probabilísticos, no entanto devido ao pequeno número de sequências existentes nas bases
de dados genómicas, muito continua ainda por descobrir em relação aos S/MARs.
A primeira parte deste projecto consiste na identificação destas sequências na
vizinhança dos genes da AOX na Arabidopsis thaliana e no arroz. Estas duas plantas têm o
genoma completamente sequenciado e disponível em bases de dados genómicas. A
abordagem adoptada passou em primeiro por seleccionar um programa para a identificação
de S/MARs, os vários programas existentes usam diferentes critérios de análise e
consequentemente os resultados são diferentes. Seguidamente determinou-se as sequências
de DNA para análise na Arabidopsis e no arroz, em primeiro localizaram-se os genes da
AOX nas duas espécies, e posteriormente determinou-se o comprimento das sequências
para análise em cada uma das espécies. Finalmente as sequências foram analisadas e foi
desenvolvido um programa para gerar imagens esquemáticas com os resultados obtidos.
Diferentes bases de dados armazenam e apresentam a informação de diferentes
maneiras. Para utilizar esta informação de uma forma estandardizada e útil foi necessário
criar algumas pequenas aplicações para converter os dados entre os diferentes formatos. A
linguagem de programação usada foi C++, visto possibilitar uma fácil integração com
bibliotecas para geração rápida de imagens bem como possuir um variado leque de funções
para manipulação de texto e Input/Output, além disso outro aspecto tido em conta foi a
portabilidade de código entre Linux e Windows.
No decorrer do projecto foi também considerado importante obter dados sobre a
expressão dos genes da AOX na Arabidopsis e no arroz, recorrendo para isso a publicações
e a bases de dados acessíveis publicamente, com informações sobre a expressão dos genes
(a uma escala genómica), em diversos tecidos da planta, bem como em diversas condições.
Se um gene é transcrito, e posteriormente codificado numa proteína diz-se que o
gene é expresso. Com o avanço dos métodos para medição da expressão dos genes, tornou-
se possível efectuar esta medição a uma escala genómica, armazenar os dados numa base
de dados para posterior consulta.
A segunda parte deste projecto consiste no desenvolvimento de uma aplicação para
a ajuda na identificação de SNPs, em sequências de DNA obtidas no laboratório da
Cátedra EU Marie Curie no ICAM.
Single Nucleotide Polymorphisms são variações numa base de DNA nas mesmas
regiões genómicas entre vários indivíduos. Estas variações podem influenciar ou não a
codificação de proteínas, e consequentemente a sua estrutura. Caso estas variações sejam
facilmente detectadas a nível do gene, ou a nível do fenótipo (características visíveis dos
genes), podem servir como marcadores para caracterizar um determinado conjunto de
indivíduos (o conjunto de indivíduos com essa variação). Neste projecto pretende-se criar
uma ferramenta que auxilie a detecção de SNPs em sequências de DNA da Oxidase
Alternativa obtidas no laboratório da EU Marie Curie Chair.
Existem várias metodologias e ferramentas para a identificação computacional de
SNPs. O primeiro passo consiste em alinhar as sequências de DNA em estudo, procurando
as regiões comuns entre elas. A partir deste alinhamento existem várias aproximações para
encontrar SNPs. A primeira normalmente consiste em perceber se as diferenças são
importantes tendo em conta a qualidade das sequências (diferenças em sequências de fraca
qualidade não são indicadores de SNPs), outro factor importante é a quantidade de
sequências em estudo, (o mesmo padrão de diferenças em muitas sequências é indicador de
SNPs), o número de cada um das bases na sequência, bem como a quantidade de
diferenças em cada uma delas podem também ser factores de decisão.
A abordagem efectuada passou em primeiro por identificar os programas que
permitissem efectuar uma alinhamento de múltiplas sequências, de seguida seleccionar um
algoritmo (já implementado) para a pesquisa de SNPs e criar uma ferramenta que permita
ajudar na automatização deste processo, onde através de uma interface gráfica o utilizador
selecciona as sequências que pretende analisar, bem como os parâmetros de input para
cada um dos programas. No fim é gerada uma imagem esquemática comos resultados. Este
último ponto encontra-se ainda em desenvolvimento.
Palavras-chave
Bioinformática, Scaffold Matrix Attachment Regions, Single Nucleotide
Polymorphisms, Oxidase Alternativa.

Table of Contents
1 Introduction ................................................................................................................. 1
1.1 Objectives ............................................................................................................... 3
1.2 Planning .................................................................................................................. 5
2 Basic Concepts ............................................................................................................. 7
2.1 Basic concepts on DNA .......................................................................................... 7
2.2 Gene transcription and gene expression ................................................................. 7
2.3 Genome sequencing projects .................................................................................. 9
2.4 Methods for analyzing gene expression ................................................................ 10
2.5 Chromatin Organization........................................................................................ 13
2.6 Scaffold Matrix Attachment Regions (S/MARs) .................................................. 14
2.7 In Silico S/MARs Annotation ............................................................................... 16
2.8 SNPs ...................................................................................................................... 17
2.9 In Silico SNPs identification ................................................................................. 18
2.10 Arabidopsis thaliana (Thale Cress) and Oryza sativa (Rice) ........................... 20
2.11 AOX .................................................................................................................. 21
2.12 AOX Gene Family ............................................................................................ 22
2.13 AOX as functional marker ................................................................................ 22
3 Project Description .................................................................................................... 25
3.1 Methodology ......................................................................................................... 25
3.1.1 Previous work on S/MARs annotations ............................................................ 25
3.1.2 Choosing a S/MARS Annotation program ....................................................... 26
3.1.3 SMARTest ......................................................................................................... 28
3.1.4 AOX gene sequences for Arabidopsis .............................................................. 28
3.1.5 AOX gene sequences for rice ............................................................................ 30
3.1.6 Data Integration and Analysis ........................................................................... 31

3.1.7 AOX gene Expression in Arabidopsis and rice ................................................. 32
3.1.8 Previous work on SNP identification ................................................................ 33
3.1.9 PolyBayes .......................................................................................................... 34
3.1.10 Development of an application to simplify the SNP identification process. .... 35
4 Work performed ........................................................................................................ 37
4.1 Localization of S/MARs within and in the neighborhood of AOX genes ............ 37
4.1.1 Obtaining genomic data for Arabidopsis and rice ............................................. 37
4.1.2 Analysis of gene sequences ............................................................................... 38
4.1.3 Comparing results with previous works ............................................................ 38
4.1.4 Generate an image representation from text files .............................................. 40
4.2 Finding evidence of AOX gene expression in rice ............................................... 42
4.3 Develop an application to identify regions of Single Nucleotide Polymorphisms in
AOX genes ...................................................................................................................... 43
4.3.1 Identification of Application Requirements ...................................................... 43
4.3.2 Describing the Application ............................................................................... 44
4.3.2.1 Sequences ................................................................................................... 44
4.3.3 Frameworks used .............................................................................................. 45
4.3.4 Application description ..................................................................................... 45
5 Conclusions ................................................................................................................ 49
6 References .................................................................................................................. 53
Index .......................................................................................................................................
Appendix 1(Confidential) .....................................................................................................
Appendix 2 (Confidential) ....................................................................................................
Microarray data in Yale Virtual Center for Cellular Expression Profiling of Rice .............
MPSS Gene Expression Summary for AOX Genes (According with Rice MPSS
database from University of Delaware) ...............................................................................

List of Figures
Figure 1 –. ........................................................................................................................... 11
Figure 2- ............................................................................................................................. 13
Figure 3 - ............................................................................................................................ 15
Figure 4 - ............................................................................................................................ 19
Figure 5 - ............................................................................................................................ 20
Figure 6 – ............................................................................................................................ 20
Figure 7 – ............................................................................................................................ 21
Figure 8 – ............................................................................................................................ 41
Figure 9 – ............................................................................................................................ 46
Figure 10 –. ......................................................................................................................... 47


1
1 Introduction
In recent years the availability of genomic data has experienced an exponential
growth as the price to obtain DNA sequences has decreased. This leaves room for
innovation applying informatics as well as mathematical and statistical methodologies, and
approaches to solve biological problems, which in turn generates even more data.
Parallel with this growth is the necessity to develop tools and approaches to acquire,
store, organize, archive, analyze, or visualize such data. This field of science is commonly
known as Bioinformatics, and it could be divided in two major categories: biological
information management and computational biology.
Bioinformatics today comprises as major research topics sequence analysis, genome
annotation, analysis of gene expression and regulation, computational evolutionary
biology, analysis of protein expression and prediction of protein structure among others. In
a modern approach Bioinformatics derives knowledge from computer analysis of
biological data, not only limited to genetic code but also from population statistical data
and scientific literature.
In the latest years several projects took place to obtain the complete genome of some
organisms. Arabidopsis thaliana (Thale cress) and Oryza sativa (Rice) was the first plants
to have their genome completely sequenced [1] [2] in 2000 and 2005 respectively, a new
set of projects at the genome scale could then take place.
Access to whole genome data provides also information to small scale projects aimed
at studying a smaller subset of already known or newly identified genes, since the analysis
of this sequences could provide new insights in gene regulation and function across
different species.
The Alternative oxidase is an enzyme encoded by a family of genes which is
responsible for an alternative pathway of respiration called “non-phosphorylating
bypasses”. This enzyme is present in plants, fungi, some yeast, algae, and in animal
kingdom, was found so far in phyla (mollusca, nematoda and chordata). Up to date the
enzyme has not been identified in humans. This alternative pathway of respiration could be
linked to many actions during plants life, which will be depicted in more detail later.

2
Once the whole genome sequencing projects for Arabidopsis and rice were finished
the AOX genes and neighbor regions could be analyzed in these species by bioinformatics
tools in search for regions that may have structural and regulatory functions.
One example of these regions is the Scaffold / Matrix Attachment Regions
(S/MARs). S/MARs could in a very simple way be defined as DNA regions that are bound
to non-histone proteins in the nucleus. When bounded to the nuclear matrix S/MARs serve
as anchors, organizing and compartmentalizing the DNA in functional domains.
In order to find possible relations between a differential regulation of AOX genes and
the S/MARs regions near these genes, in the first part of this study, a search will be
performed, to determine the informatic tool to analyze DNA sequences in the
neighborhood of AOX genes, searching for S/MARs. The results obtained will then be
summarized in images and / or tables, to better characterize the occurrence that may point
to their biological significance.
Another interesting aspect is the differences found in the DNA from different
organisms in the same species. The process of understanding these differences involves
applying biological computer algorithms to the DNA under study. If computer algorithms
present similarities and differences between DNA’s a more extensive analysis could be
initiated trying to understand their importance and further use.
Single Nucleotide Polymorphisms (SNPs) are variations in one nucleotide between
DNA from different organisms of the same specie. SNPs could serve to easily mark
differences between different sets of organisms. Integration of all these data is expected to
help in the context of a larger project (Stress adaptation in plants – A molecular approach
of social-economic interest) at the EU-Marie Curie Chair at the University of Évora,
related to understanding the role of AOX genes as functional marker for efficient cell
reprogramming and intended to contribute directly to molecular breeding on efficient plant
production [5], [6].
The second part of this project aims at creating a program to identify SNPs in DNA
sequences (mainly from carrot and olive but possibly from other species) analyzed in the
laboratory of the EU-Marie Curie Chair.
This report is organized in six chapters. Chapter 2 introduces basic concepts
necessary for understanding the developed work. Chapter 3 describes the objectives of this
work, the adopted methodology for each phase of the work, and the adjustments made to
3
the original planning. Chapter 4 describes the work performed in each phase according
with the adopted methodology. Chapter 5 contains a summary about what was done in this
project, as well as possible points of improvement. Chapter 6 lists the references used in
this work. Appendix 1 contains the results regarding S/MARs identification for
Arabidopsis thaliana and Oryza sativa in the neighborhood of AOX genes and Appendix 2
lists gene expression for AOX genes in Oryza sativa found in publicly available databases.
1.1 Objectives
The project is divided in two major parts, first, the identification of S/MARs in the
neighborhood of AOX genes in Arabidopsis thaliana and rice, and seconds the
development of an application to identify SNPs in AOX gene sequences of different
species. This first part of the project will introduce several concepts of Molecular Biology
and Bioinformatics. Understanding the biology concepts behind each phase is very
important since it will facilitate the development of a correct methodology to solve it.
There are several objectives for this phase namely:
• Understand the concept of S/MARs.
What they are, their importance in DNA organization, their structure,
influence on gene expression, etc. This will introduce at the same time concepts of
Molecular Biology that by themselves need to be understood. More advanced
topics will be introduced as the work progresses.
• Identify the previous work in computational S/MAR discovery.
Previous work on, computational S/MAR discovery will show the way how to
progress, and will reveal the limitations and possibilities of this approach
• S/MARs analysis
Locating the AOX genes in Arabidopsis and rice, and determine the
sequences to be analyzed will introduce the contact with genomic databases, and
with literature in order to confirm the correctness of AOX genes location and to
have a deeper understanding of AOX gene structure.
• Integration of results
Results must be verified, and presented in an intuitive way in order to
facilitate their analysis and presentation.

4
• Find evidence of AOX gene expression in Arabidopsis an rice
Locate databases and literature with evidence of gene expression for AOX
genes in Arabidopsis and rice. This information will be correlated with S/MARs
identification results in order to discover possible insights of S/MARs in AOX gene
regulation.
The second part of the project will focus on the development of an application to help
in SNPs identification for sequences of AOX genes in different species.
• Understand the concept of SNPs
Like S/MARs understanding the concept of SNPs will introduce a new set of
topics from Genetics that need to be assimilated, in order to understand better what
is intended to do in the next phases.
• Identify previous work on computational SNP discovery
Perform a survey regarding existent SNP scoring algorithms, as well as
literature regarding the use of these algorithms.
• Select a SNP scoring algorithm
Select the scoring algorithm to use in this work. This decision must be
supported with previous work.
• Implement an application customized according the necessities of the
workgroup
After the selection of the algorithm and analysis of previews approaches on
SNP computational discovery, the application should be implemented, in order to
facilitate the customization and integration of the scoring algorithm to the specific
needs in EU Marie Curie Chair, the application should also facilitate the
presentation of the results.
• Test the application and use it to find AOX regulatory sequences in
Arabidopsis and rice
The application need to be tested, among the workgroup, to ensure accurate
results, and usability, users should interact easily with the application.

5
1.2 Planning
In the beginning of this project, a planning comprising all phases of this project has
been elaborated. Objective analysis at the end of each phase and adjustments to the initial
planning were adopted and proved useful to establish and tune the methodology. However,
this initial planning needed to be adjusted for several reasons justified below.
The first delay is related with the beginning of the project, due to external reasons
concerned with the later than expected termination of the graduation. Thus, the project
could be started in agreement with the supervisor at the EU Marie Curie Chair only at the
beginning of October.
A second unforeseeable bias for the project happened through the fact that the
external supervisor of the project, Dr. Stephen Rudd, changed at the start of the project to a
position in the industry and could not stick to the agreements. This problem was solved by
a rapidly established risk management plan in discussion between the project leader, Birgit
Arnholdt-Schmitt and Stephen Rudd. Since then, Dr. Klaus Mayer1, who was responsibly,
involved in the former research activities of Stephen Rudd, agreed to overtake the role as
an external advisor for the newly emerging bioinformatics group at the Marie Curie Chair
by email contacts instead of Stephen Rudd. During my project, Dr. Klaus Mayer was
invited to visit the Chair and to give a talk about his activities and experiences. During that
visit, I had about three days of time to discuss my project personally with him. The
German scientist is now an official collaborator of the EU Marie Curie Chair.
A third bias concerns discrepancies found when comparing S/MARs identification
results, with results already available from other publications [9]. The reason of these
discrepancies was caused by differences in the data management for the Arabidopsis
genome in different data banks (the 4th release of the Arabidopsis genome available in
TIGR, and the 2nd version of the Arabidopsis genome used in [9] See also the discussion at
page 37 in the present report). This problem was not promptly identified. After
identification, Dr. Klaus Mayer made internal data (concerning new S/MAR annotation
based on the most recent data) available that helped to solve the problem rapidly.
1 http://mips.gsf.de/cgi-bin/webapp/ibi/person/getPerson.pl?Person=MayerKlaus

6
In the proposal, it is foreseen that the project will contribute to conference
presentations and/or a publication. Also, it was foreseen that expression profile data would
be used to enable a link between the data of S/MARs occurrence near AOX genes and the
activity of these genes. Because of the above mentioned biases, analyses of the expression
data, which are most important for any presentation or publication of the project’s tasks,
has been included before starting with the third and forth task related to SNP analyses.
Since analyses of the expression data will be central for the scientific success of the
project, I decided to ask for a prolongation for delivering this report after Dr. Francisco
Couto (my supervisor at the Department of Informatics) have said it was possible,
depending on the justification. Thus, the work related to SNPs started only after the 31th of
May. Though successfully treated, the task is more challenging than expected and will still
go on even after I will have submitted the project report. Generation of schematic images
from SNP analysis text files is in progress, the test phase needs still to be done. Only after
these two phases, the programme for SNP analysis in AOX genes currently identified at
the Chair can be started to run. Work of the project related to S/MARS and expression data
will now be submitted for presentation to a highly competitive conference that takes place
in October in the United Kingdom.

7
2 Basic Concepts
This chapter introduces a set of concepts from molecular biology necessary to
understand the problems that will be addressed by informatics tools or approaches in this
project. Concepts are presented in a simple way, but as more accurate as possible.
2.1 Basic concepts on DNA
DNA (Deoxyribonucleic acid) contains all the genetic information for the
development and functioning of living organisms. In eukaryotes such as animals and
plants, DNA is stored inside the cell nucleus (genomic DNA), packed in structures called
chromosomes. In prokaryotes, such as bacteria, DNA is in the cell's cytoplasm. DNA could
also be found in other cellular organelles such as mitochondria and plastids.
The three-dimensional structure of DNA consists of two long helical strands that are
coiled around a common axis forming a double helix. Nucleotides are the structural units
of DNA; they are characterized by four bases Adenine (A), Guanine (G), Cytosine (C) and
Thymine (T). These nucleotides are complementary, wherever there is an A in one strand
there is a T in the other, the same is true for the G and C bases. In RNA the T base is
replaced by the U (Uracil) [7].
The genome of an organism comprises its entire DNA (the genotype). In order to
synthesize a protein the DNA is first transcribed to RNA (Ribonucleic acid) who migrates
to the cytoplasm, the RNA is then translated to a protein in the ribosome (a complex
molecular machine composed of both RNA and protein).
Once the DNA is sequenced, the sequence corresponding to one strand of DNA is
obtained, this information could be stored as a long string of A's, G's, C's and T's, and in
this way be available for further computer analysis. It is only required to know the
sequence for one of the strands, since the other strand is complementary (an A in one
strand matches a T in the other, the same is true for G and C).
2.2 Gene transcription and gene expression
The discrete functional unit of the DNA that contains the information responsible for
the creation of a protein is called gene. For a gene to be transcribed a set of proteins called
transcription-factors assemble at a specific DNA site, called promoter that is usually

8
located (but not necessarily) before the gene. Only one strand of DNA is used for
transcription therefore it is called the template strand. An enzyme called RNA polymerase,
binds to the transcription-factors thereby initiating transcription.
RNA polymerase melts two strand DNA bonds, separating the two strands in the near
region, the direction in which a template DNA strand is transcribed is named downstream.
RNA polymerase advances downstream, a complimentary copy of the DNA template
strand is produced at the rate of about 1000 nucleotides per minute. We say it is a
complementary strand in the sense that Guanine nucleotide bases (G) are replaced for
Cytosine (C) ribonucleotide bases and vice-versa, Adenine bases (A) are replaced with
Uracil (U). Specific sequences in the template DNA signal the RNA polymerase to
terminate transcription. The synthesized RNA molecule is released, and RNA polymerase
dissociates from DNA.
In eukaryotic cells, the RNA molecule formed must undergo several transformations
before being translated to a protein. There are two types of regions, the coding regions
called exons, and non-coding regions called introns. After transcription, introns are
removed, thus only the exon regions codify a protein. The RNA with the introns and exons
is called a precursor RNA (pre-mRNA), while the RNA only with the exons is called
messenger RNA (mRNA).The mRNA traverses the nuclear membrane and is translated to
a protein in the ribosomes.
A set of three nucleotides is called a codon. For each codon there is a matching
amino acid. Translation begins with the start codon (AUG or Methionine) and ends with
any of the stop codons (UAA, UAG and UGA). The RNA regions before the start codons
and after the stop codons are called untranslated regions or UTRs. The region before start
codon is called 5’ UTR and the region after the stop codon is called 3’ UTR. In this way
the direction of transcription is downstream or from 5’ to 3’.
Before introns are removed, a sequence of several Adenine bases is added to the 3'
UTR of the pre-mRNA molecule. This sequence is commonly known as the polyA tail and
this process is called polyadenylation.
A gene may code for more than one protein, as a result of different mRNA
sequences, for a variety of reasons, such as the existence of more than one promoter for
each gene, different selection of sites for the polyadenylation or partial transcription of
9
some introns. This process is known as alternative splicing it may be responsible (among
other processes) for the production of different forms of a protein, also called isoforms.
Protein synthesis takes place in the cytoplasm in a complex of RNA and protein
called ribosome. As said before a set of 3 mRNA nucleotides is called a codon. For each
codon there is a corresponding amino acid, however for each amino acid there is more than
one corresponding codon. All amino acids bind to a key element called tRNA (Transfer
RNA) which will play a very important role in protein synthesis. Each tRNA has about 73
to 93 nucleotides, and contains a three-nucleotide sequence called anticodon, that matches
complementary codon in the mRNA.
Not all genes are transcribed at the same time. For example some genes are expressed
in some organs and not in others and vice-versa. If the gene is transcribed to RNA and later
translated to a protein it is said that the gene is “expressed” or “not expressed” otherwise.
Gene expression is controlled at transcription by signaling substances that bound to
specific receptors in the cell and trigger an intercellular pathway in order to produce a
specific protein. However, there are many other chemical and biochemical factors that
could influence the process of transcription. The rate of the transcription could also be
influenced by means of certain regulatory sequences called enhancers and silencers.
Enhancers could be located near or several thousand base pairs away in both upstream and
downstream directions, influencing transcription rate. Since they are located at the same
strand, they are called cis-acting elements. Other regulatory elements or factors are called
trans-acting elements.
A regulatory protein (usually called activator) bind to the enhancer sequence and
interacts directly with the transcription complex (RNA polymerase + transcription factors
+ other set of proteins called coactivators) assembled at the promoter(s) site influencing in
this way the transcription rate [7]. Like enhancers there are other sequences called silencers
located near or overlapping enhancers, where other type of proteins called repressors bind,
inhibiting the binding of activator sequences to enhancers.
2.3 Genome sequencing projects
The technology for sequencing DNA has improved largely since mid seventies when
the first methods for DNA sequencing were published by Gilbert W, Maxam A, and
Sanger F. Today’s methods rely mostly (in a simple description) on fluorescent marking of
10
nucleotides, and later optical recognition due to different wavelengths associated at each
nucleotide.
This evolution has led to a decrease in sequencing prices and allows more ambitious
projects to take place, like the human genome project, which has sequenced the whole
human genome sequence. Since today’s methods can sequence only sequences with 300 to
1000 nucleotides long, sequencing the whole genome of an organism is not a simple task.
The long DNA strands must first be divided into smaller redundant random
fragments. Once these smaller fragments are sequenced the longer DNA strands can be
assembled by computational means using the overlapped segments of smaller sequences.
This is a complex methodology because of the large amounts of information involved and
the sequence errors associated with the high repetitive regions of DNA (since a large part
of DNA is repetitive, very similar sequences could come from different parts of the larger
sequence).
Once DNA has been sequenced, annotation of genes takes place. Possible gene
sequences are first predicted using computer programs, a set of rules regarding DNA
organization, gene and RNA sequences already available in databases, and through
analysis of gene transcription. A locus is assigned to each gene. A locus is an identifier
unique for each gene and each organism.
Matching the identified genes to proteins is the next step. This is first performed
automatically (by informatics means), translating gene sequence to protein sequence and
look for similarities with other characterized proteins. If a match is found a description
corresponding to that protein is added to the gene (by using a gene ontology database),
otherwise the gene is characterized using general terms, such as: expressed if a RNA
transcript matching the gene is found in a database, hypothetical if no RNA transcript is
found, putative or probable if the protein exhibit limited sequence similarity, etc.
2.4 Methods for analyzing gene expression
In the latest years the analysis of gene expression has improved very rapidly, is
possible today to analyze the expression of several thousand genes simultaneously,
searching for genes that are expressed together (co-expressed genes), monitoring gene
expression while the cell undergoes some biological process, or search for genes that are
expressed differentially in different cell tissues.
11
Most of these techniques even if refined or reinvented over time rely on the principle
of specific probe target hybridization. The attraction of two complementary strands of
DNA is so strong that even if separated zip back together at right temperature and salt
conditions. This concept commonly known as hybridization is very useful for detecting
one strand using the other. A probe is synthesized in order to “hybridize” with the
complementary DNA or RNA strand.
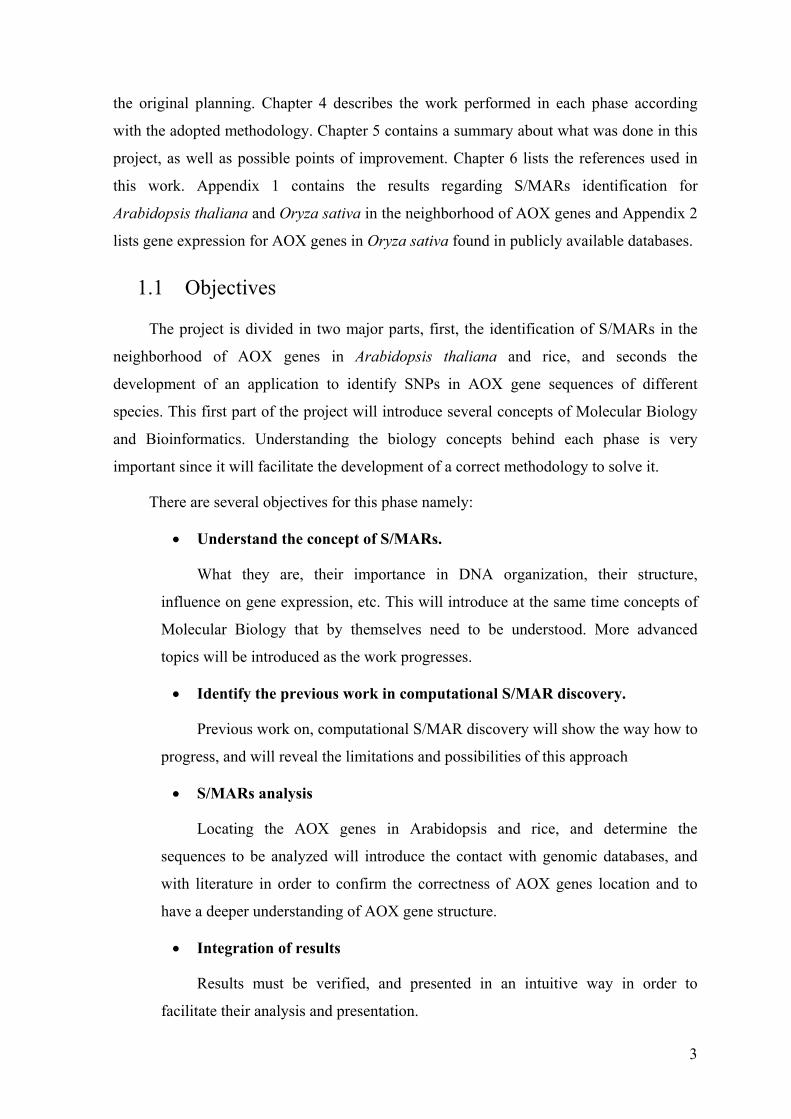
The conventional essays for analyzing gene expression are Northern Blotting, and
quantitative real-time PCR. Quantitative real-time PCR relies on the detection of a
fluorescent signal produced proportionally during the amplification of a PCR product. A
PCR or Polymerase Chain Reaction is designed to amplify a specific region of DNA, a
mixture of DNA, nucleotide bases, an enzyme to synthesize DNA (Taq polymerase) and
probes called primers are heated in order to separate DNA strands and cooled for the
probes (primers) to bind at complementary sites. Taq polymerase extends the DNA strands
in upstream (3'->5') direction [7]. This process is repeated several times or several cycles.
A reaction that cycles 20 times will amplify the specific target sequence 1 million times. In
Quantitative Real Time PCR the primers could be fluorescently-labeled, and the signal
obtained is proportional to the amount of PCR product.
Figure 1 – In this picture are represented the first three cycles of a PCR (Polymerase Chain Reaction). Sequences are heated to be separated, primers anneal to the DNA strands and Taq polymerase enzyme begins to extend the sequences in the direction of the primers. When this procedure is repeated other primers will anneal to the original and extended sequences, (thus the name chain reaction). The number of sequences corresponding to the location amplified at the end of each cycle will be 2n where n is the number of the cycle.

12
Newer methods for analyzing gene expression include SAGE (Serial Analysis of
Gene Expression), DNA Microarrays and MPSS (Massively Parallel Signature
Sequencing).
DNA Microarrays allows measuring the expression of thousand of genes in a single
experiment. There are several companies that supply this technology, as well as academic
laboratories, with several different methodologies, and different applications, but the basic
principles remain true for all of them. Thousands of probe sequences ranging from 25 to 70
or more base pairs called oligonucleotides (chemically synthesized and bounded
nucleotides) corresponding to a part of a particular gene or sequence of interest are
attached to a surface (such as glass, plastic or silicon) in properly identified spots. Usually
to evaluate gene expression, cDNA is used to from two samples that we want to compare.
cDNA is the reverse transcription of mRNA, this is, the complement to any mRNA
sequence with the U's replaced with T's. Thus cDNA does not have intron sequences.
The cDNAs of the two condition samples are fluorescently marked with different
colors (usually Red and Green), then they are mixed and hybridized with the microarray.
The spots will then have a specific intensity, corresponding to the cDNA that have
hybridized the probes. The ratio of the intensities is measured for each spot. If a condition
would stimulate the expression of one gene the spot would show a higher intensity of the
color matching that condition. The absence of color in a spot would indicate that the gene
is unexpressed in both conditions, and intermediate color intensity would mean that the
gene is expressed in both conditions.
Another recent method to measure gene expression is MPSS (Massively Parallel
Signature Sequencing), although not so widespread as the DNA Microarrays this is a very
powerful technique to measure expression of low expressed genes. In a very simplistic
description, MPSS rely on the creation of thousands of small random sequences (17 or 20
base pairs long) called signatures, the next step is matching these signatures to mRNA
molecules or transcripts (results of gene transcription). Millions of signatures are created in
order to have many copies of each signature. Each set of different signatures are tagged
and attached to a 5 micron microbead, signatures are then hybridized with cDNA,
(subjected a specific condition of study) and is possible to determine for each microbead
how many signature have cDNA attached , with the final goal of quantifying the number of
hybridizations for each different set of signatures. These methods and others are depicted
in more detail in [18].

13
With the whole genome sequencing projects releasing a high amount of data in
publicly available databases, a new set of projects devoted to understand gene expression
in whole genome have begun. Data from microarray and mpss experiments performed
under a diverse set of conditions is annotated in relational databases that are publicly
available through web interfaces. More complete sets of data are available usually under a
subscription fee.
2.5 Chromatin Organization
The DNA of a human cell measures
about 2 meters in total length and must be
contained in cells with diameters of less than
10μm [7]. It comes then at no surprise that a
complex degree of compaction is required.
In eukaryotic cells, DNA is associated
with histone proteins, in a highly condensed
nucleoprotein called chromatin. DNA is
tightly packaged into octamers known as
nucleosomes, which consists of four histone
proteins (H3, H4, H2A and H2B), around
which is wrapped 147 bp (base pairs) of
DNA. Individual nucleosomes are connected
through 155 to 210 base pairs of DNA. This
is the first level of chromatin compaction.
Each nucleosome is associated with
one H1 histone protein, and is packed in an
irregular spiral arrangement with
approximately six nucleosomes per turn,
folding into a 30nm chromatin fiber, this is
called the second level of chromatin
compaction.
Figure 2- The figure above represents the various levels of chromatin organization, from the DNA level to the chromosome level [7]

14
The nucleus of the cell is not simply an unorganized container for chromatin, rather,
there is a highly organized nuclear substructure comprising a fibrillar network of multiple
proteins called the nuclear matrix.
This substructure retains the general shape of the cell nucleus after the removal of
major part of DNA and DNA-associated proteins.
30 nm chromatin fiber attaches the nuclear matrix at specific sites called Matrix
Attachment Regions or Scaffold Associated Regions (S/MARs), this is called the third
level of chromatin compaction.
Besides these three levels of chromatin compaction presented there are more two
levels, that are not yet completely understood, as the 30 nm chromatin fiber coils numerous
times upon itself, forming fibers of 300nm, 700nm, and 1400nm.
As described before chromatin can assume a coiled from, mostly during the cell
division phase called mitosis. When cells exit mitosis the condensed chromosomes uncoil,
however, some chromatin regions remain coiled, these regions comprise heterochromatin.
The less condensed portions of chromatin are called euchromatin. Despite some exceptions
only genes in euchromatin are transcribed, since the high compaction of heterochromatin
block the binding of transcription factors.
The organization of DNA in euchromatic and heterochromatic regions can be flexible
depending on development, growth and interaction to the environment [6].
2.6 Scaffold Matrix Attachment Regions (S/MARs)
Scaffold Matrix Attachment Regions are 300 to 3000 nucleotides or base pairs long
proposed to play an important role in nuclear and chromosome organization. Whenever
associated with the nuclear scaffold the S/MARs divide the eukaryotic genomes in
individual 30nm chromatin loops, being this way related with the functional
compartmentalization of the genome. S/MARs were shown to control gene expression by
facilitating interactions between DNA activating complexes and genes, by controlling
chromatin accessibility and because of their location near the transcription units and
regulatory elements [8].
Rather than only a structural function S/MARs are supposed to play also a regulatory
role. S/MARS may additionally be defined as regulatory elements typically found outside
the transcribed regions and within introns. They typically augment transcription rates in a

15
highly context-dependent manner. S/MARs
containing genes have been shown to reach
overall significantly lower expression levels
compared with genes not associated with
S/MARs [9].
Figure 3 - After removing histone proteins, the scaffold proteins are well visible at electronic microscope, as the darker set of lines, attached to this darker lines are the DNA loops (without histones), the points of attachment between the DNA loops and scaffold proteins are the S/MARs. S/MARs have in this way a very important structural function serving as anchors for chromatin loops [7].
Transcription regulation of gene expression is known to involve formation of
dynamic chromatin loops mediated by S/MAR attachment to the nuclear matrix. The
attachment of a DNA sequence to the matrix will place the neighboring genes in proximity
of the transcription factors. The abundance of S/MARs in the upstream regulatory regions
of genes demonstrates their role in transcriptional regulation [10]. So far, this has not been
demonstrated in plants, but there are several studies that suggest a correlation between the
presence of S/MARs and gene expression [9].
It has been found that actively transcribed genes are associated with the nuclear
matrix and preferably in the periphery of the chromosome. Inactive or unexpressed genes
are found in tightly folded dense chromatin regions whereas active or expressed genes are
found in more unfolded regions characterized by loop bodies [8].
In transgenic plants it has been shown that when a sequence containing a gene
flanked by S/MARs is inserted in the plant genome, that gene is expressed. Furthermore
genes inserted in plant genome without flanking S/MARs suffer an effect called gene
silencing in which the gene is “turned off” by many factors, such as removing this gene
from plant genome (“gene elimination”), the position effect (since in transgenic plants a
gene may be inserted in different parts of the genome, different genes may suffer from
different regulation patterns influenced by neighbor sequences). S/MARs have shown to
minimize the gene silencing effects by acting as insulators (the gene would be integrated in
an independent loop flanked by S/MARs elements)[12].
The size of S/MARs anchored loops has also been implicated in relative expression
efficacy, negative correlation between S/MARs overlapping with genes, or intragenic
S/MARs and gene expression was found in [9], and, further, in [13] it is shown that
16
intragenic S/MARs also have a pronounced specificity for tissues organs and
developmental phases.
2.7 In Silico S/MARs Annotation
Experimental detection of S/MARs requires substantial effort and is not suitable for
large-scale screening of genomic sequences, thus, in silico prediction of S/MARs can
provide a crucial first step. Experimentally obtained S/MARs provided the work bases for
studies in order to determine guideline definitions for S/MARs, who could provide an
automated way of annotation.
The most comprehensive data collection of S/MARs publicly available is in S/MARt
DB1, a database dedicated to collect information about S/MARs. The database has up to
now information about 559 S/MAR sequences.
An evaluation of the sequences in S/MARt DB was carried in [14] as well as a
comparison with other sequences (promoters, exons, transcription factors, and other
regulatory sequences) in order to study the nucleotide composition and possible consensus
sequences. A consensus sequence is a way of defining a set of sequences where in some
positions the nucleotides could change, for example, the sequences ATGG and AAGC
could be represented by the consensus sequence AWGS where W stands for a T or A and S
stands for a G or C.
The study revealed that S/MARs have a rich content of Adenine and Thymine bases
(in some cases higher than 70%), failing to reveal a detectable organization among the
nucleotides that could be described by a consensus sequence. Other studies however [15]
reveal that most of S/MARs appear to have two separate sequences AATAAYAA and
AWWRTAANNWWGNNNC within 200 base pairs, and define a set of statistical rules to
help improve S/MARs finding, however care is suggested in the application of these rules
as different results may arise from different combination of rules.
There are several informatics programs to identify S/MARs in DNA sequences, such
as MAR-Finder (or MAR-Wiz)2, marscan (part of the EMBOSS bioinformatic package)3,
1 http://smartdb.bioinf.med.uni-goettingen.de/
2 http://futuresoft.org/MAR-Wiz/
3 http://emboss.sourceforge.net/
17
ChrClass1, and SMARTest (as part of the Genomatix GEMS Launcher package)2.
Different programs rely on different methods to identify S/MARS and produce different
types of results [16].
Specificity is the statistical measure of how well, a binary classification test, correctly
identifies a condition when it is truly not present. In contrast sensitivity is the statistical
measure of how well a binary classification test correctly identifies a condition when it is
truly present. Different programs show different tradeoff's regarding sensitivity and
specificity.
The low number of S/MARs sequences present in SMARt DB when compared with
other genomic sequences, is the major drawback for improvements in both specificity and
sensitivity of computer programs to predict S/MARs.
2.8 SNPs
SNPs (Single Nucleotide Polymorphisms) are variations in one nucleotide base
among DNA sequences from the same location, from different individuals. These
differences may induce changes in the synthesized protein. A different nucleotide in a
coding sequence may give rise to a different amino acid, in this case is called a
nonsynonymous SNP. However the possible combinations for different codons are 43 = 64
and the number of different amino acids is 20, meaning that are amino acids coded by
more than one codon. A SNP that does not change the code from an amino acid is called a
synonymous SNP.
However, even some synonymous SNPs may influence a translation to protein as the
SNP may occur at an intron/exon splice site, altering in this way the intron and exon
structure and consequently the ORF may code for a different protein[19]. An ORF (Open
Reading Frame) is usually defined as a stretch of DNA containing at least 100 codons that
begins with a start codon and ends with a stop codon. However there are very short genes
where this ORF definition is not valid (the number of codons is lower than 100) [7]. Other
SNPs may be located in the promoter areas influencing in this way the regulation and
expression of the corresponding gene [19].
1 http://www.filesearching.com/cgi-bin/s?t=n&l=en&q=ftp.bionet.nsc.ru/pub/biology/chrclass
2 http://www.genomatix.de

18
These changes in the protein structure may or may not be manifested in the
phenotype. The phenotype is the visible outcome of a gene's action, such as blue eyes
versus brown eyes.
An important feature of SNPs is serving as genetic markers for mapping specific
genetic trait characteristics. A genetic marker is a DNA sequence or part of it, easily
detectable by an experimental essay (for example if a SNP is linked to a change in the
phenotype the detection could be directly observable). A genetic marker marks a specific
point in the DNA, therefore it could serve to compare genotypes, explore evolutionary
differences in single species, or among several species.
SNPs are therefore important in complex disease mapping, as well as plant breeding.
Plant breeding aims at creating specific genotypes or phenotypes, using a wide variety of
techniques. When studying human diseases it is important to know if a certain disease
regarding a SNP is spread among the population, so the frequency of SNP occurrence is
important to define a link between SNP and the disease. In plant breeding it is possible to
propagate a specific polymorphism, thus the most important part is the SNP discovery
and/or association with a specific phenotype or genotype.
2.9 In Silico SNPs identification
Computational SNP discovery, have evolved in the last years. First approaches
relayed on visual comparison of several aligned sequences from multiples individuals. A
sequence alignment is a way of arranging the DNA or RNA or protein sequences to
identify conserved regions, as well as differences in the sequences.
Algorithms to produce the multiple sequence alignments are computational
intensive, as the number and length of sequences increases. There are several types of
algorithms, programs and frameworks to perform this task. There are several
computational methods to perform multiple sequence alignments, some rely on Dynamic
Programming and are efficient to perform an optimal alignment, however, are
computationally expensive.
Progressive alignment algorithms start with the alignment of the two most related
sequences and align each next sequence to those who are already aligned, this is a heuristic
algorithm, thus, it does not guarantee an optimal alignment, and the final result is also

19
dependent from the choice of the two primary sequences. ClustalW is based on progressive
alignment algorithms and is one of the most used multiple sequences alignment algorithms.
Iterative alignment algorithms make an initial alignment of groups of sequences,
and align the remaining sequences like in the progressive alignments, however the initial
sequences are repeatedly realigned. Other than the types referred above algorithms to
produce multiple sequence alignments could rely on Hidden Markov Models, genetics
algorithms, among other techniques.
Figure 4 - This image represents a partial protein alignment for AOX genes from different species, the image is adapted from [20] when rice AOX1c was identified. Conserved regions are marked black while different regions are marked white.
As previously have been said first SNP identification approaches relied on visual
comparison of the aligned sequences, although manual comparison is feasible for a small
number of sequences, standard accuracy criteria are hard to establish.
As the number of publicly available EST (Expression Sequence Tags) begun to
increase, tools to mine SNPs at a genome scale start to be applied. An EST (Expression
Sequence Tag) is a short transcribed sequence of mRNA or cDNA typically ranging from
500 to 800 base pairs. The EST corresponding to a set of previously known regions (as a
set of genes) were assembled in a larger sequence called contig. Assemblage and posterior

20
filtering of SNPs relayed mostly on parameters regarding sequence quality through quality
scores [21]. Quality scores are measures assigned to each base present in a sequence, in
order to determine if that base has been correctly sequenced to help distinguish between
SNPs and sequencing errors is essential [19].
Quality scores are assigned based on wavelengths intensities for each nucleotide
after having been sequenced. Sequence errors result from the impossibility to distinguish
between the wavelengths corresponding to each type of bases A, T, G and C.
Figure 5 - The image represents a plotted graph with the signal intensities (wavelenghts) from part of a sequence isolated at the EU-Marie Curie Chair. There are several programs capable or reading signal intensities from a file generated when sequencing is performed and piloting the graph. The first bases of the sequence would have a lower quality score, since it is difficult to distinguish between signal intensities while in the middle of the sequence the scores would be higher.
In order to assign a measure of confidence to SNP without regard the source
and overall sequence accuracy, a new set of statistical and mathematical models were
developed. PolyBayes [22] was designed according these models in order to calculate a
Bayesian probability. That mismatches between sequences are true polymorphisms rather
than sequencing errors.
2.10 Arabidopsis thaliana (Thale Cress) and Oryza sativa (Rice)
Arabidopsis is a model plant appreciated by the scientific
community, for several reasons, such as having a small genome
(~120Mb), a small size and a rapid life cycle (it takes about six
weeks from germination to mature seed). Arabidopsis was the
first plant to have his whole genome sequenced (in 2000) the
resources available today concerning these plants are far
extensive and well organized. Arabidopsis thaliana has five
chromosomes, and belongs to the biological group of
dicotyledons.
Figure 6 – Arabidopsis thaliana

21
Oryza sativa is a cereal very important in human diets, being the world’s most used
crop. This cereal has the smallest genome of all
the cereals (~430 Mb). The Oryza sativa is a good
model for characterizing the genes of other
cereals, and associating them with various
agronomic traits, cereals number of homologous
genes whose order are relatively conserved and
numerous resources for a genomic approach, such
as excellent genetic maps and efficient techniques for genetic transformation. Furthermore,
rice can also be used as a model genome for one of the two main groups of flowering
plants, the monocotyledons, in the same way as Arabidopsis thaliana is the model for the
other group, the dicotyledons. Oryza sativa has twelve chromosomes.
Figure 7 – Oryza sativa (Rice)
2.11 AOX
Plants, some fungi, algae, eubacteria, protists and more recently in animal kingdom
phyla (Mollusca, Nematoda and Chordata) contain an isoenzyme Alternative Oxidase [5]
[40]. An isoenzyme usually refers to several proteins that may have rather different
structures, but the same biological functions.
The alternative oxidase (AOX) is present in the inner membrane of mitochondria.
Mitochondria are organelles of eukaryotic cells, witch are also described as “cellular
power”, because they generate most of the cell’s energy. In the inner membrane of the
mitochondria electrons (obtained from photosynthesis and glucose catabolism), pass
though several complexes (complex I, II, III, IV and V). In complex IV oxygen is
incompletely reduced to water generating reactive oxygen species (ROS). ROS in a higher
concentration can cause great damage to cells, including dead.
In complex I, III and IV the proton move from membrane matrix into intermembrane
space. This creates a potential energy, referred to as proton-motive force. In complex V,
proton-motive force is dissipated by the generation of ATP (biological energy) [41]. This is
known as mitochondrial electron transport chain (ECT), cytochrome pathway or oxidative
phosphorylation. This pathway is very important for eukaryotic cells because it produces
energy (ATP) needed for their metabolism.

22
An alternative pathway is located between complex II and complex III where the
alternative oxidase enzyme is present. The alternative oxidase acts like complex IV
reducing oxygen to water, however without generating Reactive Oxygen Species, because
oxygen is completely reduced.
The activity of the Alternative Oxidase is regulated by stress conditions, the
concentration of Reactive Oxygen Species in cells, pathogen attack, stage development and
others [42]. Alternative oxidase can act to decrease formation of ROS [43], is involved in
the response to virus infection, heat production, and may prevent programmed cell death.
[40] [5] [43].
2.12 AOX Gene Family
Alternative Oxidase is an enzyme encoded by a small family of genes subdivided in
two subfamilies, AOX1 and AOX2. In Arabidopsis for instance there are 5 genes (AOX1a,
AOX1b, AOX1c and AOX1d) and AOX2, which have been first reported in [3]. In rice there
are 4 genes all belonging to the AOX1 family (AOX1a, AOX1b, AOX1c and AOX1d).
AOX1a and AOX1b were first reported in [4], while AOX1c has first been reported in [20].
Once the genomes of Arabidopsis and rice were completely sequenced, AOX1d was
identified in both Arabidopsis and rice.
In Soybean have been identified 3 genes, one belonging to AOX1 family and AOX2 to
AOX2 (AOX2a and AOX2b) [25]. AOX genes are distributed unevenly across different
species.
2.13 AOX as functional marker
A “functional marker” can be defined as genetic marker, deriving from sequences
well known (sequence motifs), from which the function is well characterized. Functional
markers are derived from polymorphic sites within genes, and are usually related to
phenotype variation.
Genetic markers resulting from functionally defined sequences apply to plant
breeding and biodiversity studies, as well as to human genetics. Markers are used in basic
plant research and plant breeding to characterize plant germination, assist in gene isolation,
etc.

23
Alternative Oxidase is proposed to be a functional marker for adaptation of plant
growth under stress [5]. This idea was been sustained from studies on the metabolic role of
alternative oxidase concerning respiration under stress condition, as well as the relation
between AOX activity and differential growth. For AOX to be accepted as a functional
marker, it is required to discover polymorphic sequences such as SNPs that can be used to
genotype and phenotypic characterizations [11].

24

25
3 Project Description
3.1 Methodology
3.1.1 Previous work on S/MARs annotations
The first S/MARs annotations were essentially performed by experiments regarding
the binding of DNA fragments with nuclear matrices that were experimentally prepared. In
[23] is performed a classification of S/MARS isolated from tobacco according to their
binding strength, strong, medium and week binders. The most common experimental
procedure used to isolate the S/MARs is also described [23].
As referred before under Basic Concepts there were several studies both by
laboratory essays and by study of previously identified sequences, aiming to understand
the S/MARs functioning at single gene level and at chromatin level. However, the role of
S/MARs in maintaining and regulating the cell genetic machinery despite important,
remained poorly understood. A summary of S/MARs structure and function could be found
in [24].
All S/MAR sequences present in SMARt DB were evaluated by searching for
recognizable patterns or “motifs”. Sequences from different species were not distinguished,
since they have not significant differences, and S/MARs sequences from one specie bind to
nuclear matrices of other specie [14].
To compensate the low number of sequences present on the database (245 at that
time), a Roulette Wheel selection algorithm was used to generate four additional sets of
data. A Roulette Wheel selection algorithm is a process of make a selection (in this case
any of the four bases A, T, C, G) using a fitness function who quantifies the optimality of a
solution, (in this case the fitness function was the frequency of occurrence of a given base
in the S/MARt DB sequences), the probability of selection is proportional to its fitness.
The results have shown that S/MARs have a rich content of Adenines (A) and
Thymines (T) especially when analyzing sequences with an AT content > 70%, as 12 % of
them contain S/MARs while only 3% contain promoters and 0.3% contain exons.
Conversely the portion of sequences with low AT content that contain S/MARs is
significantly lower (6.5%) than exons (67%) and promoters (47%).

26
Searches for consensus sequences describing S/MARs were performed using weight
matrices. A weight matrix is a way of describe a pattern or a motif through a matrix.
Usually in the rows of the matrix are the four DNA bases or if the matrix is applied to a
protein the letters corresponding to the amino acids. And in matrix columns we have the
frequency of occurrence for each of the bases or for each of the amino acids.
Weight matrices are usually constructed based on information provided by the
multiple alignments of several sequences, so that frequencies for each base or amino acid
can be calculated. Weight matrices are more powerful than consensus sequences because
they allow a probabilistic treatment.
In the search for consensus sequences describing S/MARS the IUPAC consensus
strings have been converted to weight matrices. IUPAC (International Union of Pure and
Applied Chemistry) have defined a set of characters to identify variabilities in similar
sequences so that they may be expressed by means of a consensus string. Results however
were inconclusive.
Another search was conducted especially for sequences of six nucleotides, and for
possible transcription factors related sequences but once again the results were
inconclusive. Some S/MARs were found in the majority of sequences but not in all.
Another interesting study [15] defined a set of probabilistic rules to find S/MARs, however
is suggested that these rules may conflict among themselves. A more complete list of
results and previous work could be found on [24].
3.1.2 Choosing a S/MARS Annotation program
For the task of annotating S/MARS in the vicinity of AOX genes in Arabidopsis
thaliana and rice SMARTest were chosen. This decision was based on several
considerations discussed below.
For the dataset considered in [16] SMARTest was found to have the best specificity
(63%), a lower value that the one specified in [17] (68%). Regarding sensitivity
SMARTest values are low (17% in [16]) and (38% in [17]). Analyzing data in [16] also
when comparing the values for other programs SMARTest showed lower sensitivity
values. However in comparison with the absolute values, regarding for instance ChrClass
program for 53 true positives, defined experimentally, ChrClass has identified 105
27
S/MARs, which shows a great number of false positives, despite lower number of true
positives marked by SMARTest, the number of false positives is also significantly lower 6
for SMARTest while 52 for ChrClass.
One reason for the low values of SMARTest sensitivity (identification of true
positives) could be, according to the authors, that the current library of weight matrices is
derived from a set of sequences where AT rich patterns could be over represented.
According to [16] the other S/MAR finder applications have shown inferior
performances finding S/MARs. They show inferior values of specificity when compared
with SMARTest and while sensitivity is higher, the number of false positives is also much
higher.
While the number of S/MARs identified by SMARTest was low when compared to
the other programs, the accuracy prediction was the highest among the applications tested.
According to definitions in [16] we could say that SMARTest has a lower efficiency
(number of experimental MARs hit by prediction)/(total number of experimental MARs),
but a high accuracy (number of true positive prediction)/(total number of predictions).
Other S/MAR studies at whole genome level have been reported in [9], [13] and [17]
showing the practical use of SMARTest for S/MAR prediction in long genomic sequences.
For the present project, it was concluded that SMARTest should be applied since large part
of S/MARs function, importance and identification remains poorly understood, SMARTest
is the most accurate tool to identify S/MARs, and, the feasibility of studying S/MAR
distribution along large genetic sequences was already demonstrated.
Characteristics of the applications mentioned above are summarized in the table
below according with [16]:
Program Name Strong points Weak points
SMARTest Best specificity (or accuracy), (number of true positive prediction)/(total number of predictions); Lowest number of false positives
Lower sensitivity
ChrClass Best tradeoff between sensitivity and specificity; Highest number of true positives (50,5 % of total predictions)
Highest number of false positives (49,5% of total predictions)
MAR-Finder Moderate numbers of S/MARs predictions Lower specificity
marscan Moderate numbers of S/MARs predictions Lower specificity
28
3.1.3 SMARTest
SMARTest analysis is based on a density analysis of S/MARs patterns represented
by a weight matrix library generated by comparative sequence analysis of experimentally
defined S/MAR sequences. The experimental sequences used to generate the weight
matrices library were taken from the SMART DB and EMBL databases, as well as
literature.
The sequences selected as the base dataset for S/MARs identification are aligned and
the weight matrices are created automatically using the program MatDefine. Another
program called MathInspector use the weight matrices created to search if a specific
sequence has a certain degree of similarity, expressed in the from of a probability.
SMARTest uses MathInspector to check if a sequence matches the weight matrices
defined by MatDefine. The SMARTest input sequence is divided in consecutive blocks of
300 bp (base pairs) called sliding windows, with increments of 5 base pairs. For example if
an input sequence with more than 300 base pairs is supplied to SMARTest for analysis, the
first 300 base pairs (from base 1 to 300) are processed, then the next 300 base pairs (from 6
to 306) are processed, and so on until the end of the input sequence.
The length of the sliding window is 300 base pairs because this is assumed to be the
minimum length of a S/MAR. Using this method of analysis the total length of a possible
identified S/MAR may vary, since consecutive sliding windows may have a high degree of
similarity with the weight matrices library consequently the length of the S/MAR will be
greater than 300.
Results of SMARTest comprise the beginning of S/MAR sequence with the input
sequence, the end of the S/MAR sequence, and the length of the S/MAR. SMARTest as
well as MatDefine and MathInspector are part of Gems Launcher, a proprietary framework
for functional analysis of genomic sequences. In order to use SMARTest, an academic
license was obtained from Genomatix Software.
3.1.4 AOX gene sequences for Arabidopsis
Since the complete genome of Arabidopsis was already released in 2000 [1], and
because Arabidopsis is a model plant in genetics and plant sciences, the resources available
are far extended and easy to find. Thus, it is appropriated to use the sequences of this
species for fundamental research.

29
Examples of databases containing the whole Arabidopsis genome sequence, gene
annotations, microarray data, genome browser among others resources are TAIR1, TIGR2 ,
mips3, ncbi4, and others.
TAIR (The Arabidopsis Information Resource)5 comprises a considerable set of tools
and data regarding the Arabidopsis genome. A quick search for each one of the AOX genes
show a lot of useful information, well grouped, and with several links to more specific
areas, such as external links, scientific articles regarding AOX genes, AOX gene
sequences, etc.
TAIR is based in TIGR 4th release of Arabidopsis genome, as well as the work
performed in this study. In downloads category it is possible to obtain a copy of the
Arabidopsis genome for each one of the 5 chromosomes as well as the mitochondrial and
plastid genomic sequences for later analysis. Having access to the complete Arabidopsis
genome sequence and the details about the genes, the next step is to determine the
sequences that need to be analyzed with SMARTest.
The average loop size of Arabidopsis has been estimated to 25kb (25000 base pairs)
[26], so the median size between two S/MARs regions attached to the nuclear matrix
should be 25kb, since S/MARs are the elements that bind chromatin to the nuclear matrix.
It should be considered, however, that this does not mean that only 2 S/MARs should be
found in this regions, since other S/MARS sequences may be present but not attached to
the nuclear matrix. Moreover, cells in different tissues and organs have a different
chromatin organization, so S/MARs that are bounded to the nuclear matrix in some tissues
could not be in others and vice-versa.
Since 25kb is only an average measure, a length of 50kb before and after the AOX
genes is sufficient for SMARTest to check, if some sequences match SMARTest weight
matrices. Since DNA is a helical double strand molecule, binding with the nuclear matrix
1 http://www.arabidopsis.org
2 http://www.tigr.org/tdb/e2k1/ath1/
3 http://mips.gsf.de/proj/plant/jsf/athal/index.jsp
4 http://www.ncbi.nlm.nih.gov/sites/entrez?Db=genomeprj&cmd=ShowDetailView&TermToSearch=13192
5 http://www.arabidopsis.org

30
may happen with any of the two strands, therefore both, forward strand and reverse strand,
in the neighborhood of AOX genes was analyzed for S/MARs sequences.
3.1.5 AOX gene sequences for rice
The complete rice genome sequence has been published in 2005 [2], by IRGSP
(International Rice Genome Sequencing Project). The complete sequences could be
downloaded from IRGSP page directly in the from of a text file corresponding to each of
the rice chromosomes. However, no information about the genes is available in the IRGSP
page.
In the RAP-DB (Rice Annotation Project) home page, it is possible to view these
sequences through a genome browser, as well as to perform several types of searches.
When searching for Alternative Oxidase genes a lot of inaccurate results are displayed.
Comparing against IRGSP build 3.0, 24 gene matches are found for Alternative Oxidase
genes. This number of matches is far too high since there are only 4 genes of Alternative
Oxidase. Comparing against IRGSP build 4.0, 7 gene matches are found. Once again,
genes are overrepresented and incorrectly annotated.
TIGR (The Institute for Genomic Research) has also developed a project for the
whole rice genome sequence, the TIGR Rice Genome Annotation1. TIGR Rice Genome
Annotation integrates a lot of useful tools, and allows several methods for gene search,
search for locus, function, homology (similarity), among others. Since AOX genes in rice
are annotated under general terms (a functional description is not available), a homology
search must be performed with manual selection of the candidates based on literature as
described in the next section. The genome sequence of TIGR Rice Database was used for
the project, since more powerful search tools are available and gene data of IRGSP
regarding Alternative Oxidase is highly inaccurate.
According to mips statistics page for plant genomes2 rice has an average gene density
per 10kb value of 1.66 while Arabidopsis has 2.74. Since no literature was found that
estimate the loop size for rice the length of the sequences to analyze was calculated based
on average gene density per 10kb. This is likely to be a gross estimation. The number of
1 http://www.tigr.org/tdb/e2k1/osa1/
2 http://mips.gsf.de/projects/medicago/statistics

31
genes in compared sequences was similar or the same, the number of S/MARs was under
study. This methodology was adopted since no better term for correlating the number of
S/MARs in Arabidopsis and rice was found. Thus, the length of the sequences to be
analyzed was calculated in 82530 base pairs before and after the AOX genes.
3.1.6 Data Integration and Analysis
After having S/MARs sequences in the neighborhood of AOX genes identified,
Arabidopsis data were compared with supplemental data from [9] to find any
discrepancies.
Results from SMARTest annotation program are shown in text format, (the
beginning, the end, and the length of the S/MAR) in this way they do not provide a
intuitive information regarding how close the S/MARs are from genes, exons and introns,
if they flank any gene, and if they could be important for gene regulation.
To understand better the results, a program was created to receive a file with the
details about the genes in the analyzed sequence, as well as the details about the S/MARs
position predicted by SMARTest. The output is an image representing the genes, and the
S/MARs.
Another program was created to draw the position of the analyzed sequence in the
chromosome. The images, as well as the output text data and the description of the genes
(based on TIGR data) will further be presented together for better understanding in the
Appendix 1 of this report. Because of the confidential nature of this work the results of this
Appendix should not be publicly available.
The programming language adopted to create the informatic tools described above is
C++. This decision has mainly two purposes. The first is to learn the basics of a
programming language that was not used during the course in Informatics. The second
reason was to facilitate the portability of codes between the Linux and Windows
environments without using to the java platform.
GD graphics library had been used to create images. GD is an open source graphics
library for dynamic creation of images especially in png, jpeg, and gif file formats, but
supports also other types of files. The GD library is currently part of the PHP project, and
is available for Linux, Windows, Mac OS X operating systems.
32
3.1.7 AOX gene Expression in Arabidopsis and rice
In order to investigate, if predicted S/MARs could have some influence on gene
regulation, a search for evidences of AOX gene expression in publicly available databases
will be performed.
A study of AOX gene expression in Arabidopsis has been reported in [27]. This study
used Genevestigator [28] as a tool. Genevestigator is a publicly available database,
comprising a repository of microarray data for Arabidopsis thaliana and a set of tools to
mine the available data. Expression of five AOX genes in Arabidopsis was analyzed using
the microarray data of various tissues, development stages and stress conditions [27].
Related to rice, several projects are devoted to gene expression analysis, most of
them based on microarray and mpss data. Examples of projects are the Rice Expression
Database1 based on IRGSP data, the NSF Rice Oligonucleotide Array Project2 , the Yale
Virtual Center for Cellular Expression Profiling of Rice3 and Rice MPSS plus database4.
Rice Expression Database was the first to be created, it has microarray data, available
in the from of photos from experiments performed, however the software to analyze the
data (ArrayGauge from Fujifilm company) is not available (only for owners of Fuji
microarray technologies), furthermore microarray probes for AOX genes are inconsistent
with both IRGSP and TIGR genome sequencing projects.
Rice Oligonucleotide Array Project or Rice Array project has a more accurate and
comprehensive set of data based on TIGR, but little evidence of AOX gene expression,
only microarray data for one gene (AOX1a) and only in two conditions.
Yale Virtual Center for Cellular Expression Profiling of Rice has whole-genome
microarray expression data based on TIGR. Evidence of expression for AOX genes is
found on different tissues and for all AOX genes.
The rice MPSS plus database includes a comprehensive set of signatures (small
sequences of 17 or 20 bp matching a gene) libraries, more than 20 MPSS signature
1 http://red.dna.affrc.go.jp/RED/
2 http://www.ricearray.org/rice_study.shtml
3 http://bioinformatics.med.yale.edu/rc/description.jspx
4 http://bioinformatics.med.yale.edu/rc/description.jspx

33
libraries derived from diverse tissues, submitted to abiotic stress (cold, drought, and salt
treatments) as well as different growth conditions (in light and in the dark) and different
developmental stages[29].
Considering the factors mentioned above, a summary of AOX gene expression in rice
was created, based on Yale Virtual Center for Cellular expression Profiling, and MPSS
plus database.
3.1.8 Previous work on SNP identification
As SNP studies become an important topic in medical research, plant science,
agriculture sciences, and other areas, a wide variety of searching techniques has been
developed. Most of them are experimental methodologies, but computational methods are
also widely applied, especially to perform a first selection that will be validated later by an
experimental essay.
As described before, computational methods for SNP identification have undergone a
significant evolution, from simple manual comparison of multiple aligned sequences to
intuitive commercial applications, freely available online tools, and some approaches that
integrate both laboratory experiments and software tools to identify SNPs in a large
number of genes.
Techniques to measure gene expression like microarrays are adapted to perform a
whole genome mapping of SNPs. DNA Vision1 is an example of a European company who
offers a wide variety of services regarding whole genome SNP genotyping as well as SNP
genotyping of previously selected genome areas.
SEQUENCHER from Gene Codes Corporation2 and HelixTree from Golden Helix,
Inc.3 are examples of quite sophisticated commercial software frameworks for SNP
identification.
In parallel with most sophisticated and expensive methods mentioned above a wide
variety of SNP scoring algorithms were published in academic papers. SNP scoring
1 http://www.dnavision.be
2 http://www.genecodes.com/
3 http://www.goldenhelix.com/helixtree_pbat.html
34
algorithms assign a confidence score to a specific site of a sequence that have a variation
among several individuals.
Bioinformatics Links Directory of Canadian Bioinformatics Workshops1 provides
links for tools and databases recommended from Bioinformatics experts. In the area of
sequence polymorphisms are listed 39 resources from which 22 are tools (to use online or
offline) to analyze SNPs, and some tools are not listed. Due to this diversity of tools
already available the most reasonable approach is to perform a selection of one more and
adapt them to the specific requirements of EU Marie Curie Chair laboratory.
PolyBayes [22] program is among the most widely used for computational SNP
detection. It was used in several studies to predict SNPs over large amounts of data in
Humans [22] [34], and in soybean [35]. It serves also as the SNP detection engine behind
the SNP discovery in two large scale projects; the SNP consortium2 one of three
sequencing centers founded by 10 pharmaceutical companies to generate over 300.000
SNP’s for public access and clone overlap SNP mining3 a project in Department of
Dermatology, Washington University School of Medicine to help produce a complete
reference sequence of the human genome.
3.1.9 PolyBayes
PolyBayes program is mainly divided into three parts each independent of the others,
an anchored multiple alignment algorithm, a paralog discrimination algorithm, and the
SNP detection algorithm. It has also a set of options to control how the output to the text
file is produced.
The purpose of the anchored multiple alignment algorithms is to produce an
alignment of the sequences based on that template sequence, or a sequence of reference.
Redundant sequences (or the sequences that provide the bases for SNP analysis) are
aligned or anchored with the reference sequences forming a cluster. The availability of
quality scores is recommended both to produce the alignment of the sequences and later to
use the PolyBayes SNP detection algorithm, although they are not required, the same is
1 http://bioinformatics.ca/links_directory/
2 http://snp.cshl.org/
3 http://polybayes.wustl.edu/overlapsnp
35
true for the reference sequence. The anchored alignment algorithm could be bypassed if
another alignment is available in the 'ace' file format. That file format has been established
by the first two applications to process the sequencing results generating quality base
scores (PHRED) and later produce multiple sequence alignments (PHRAP).
The next step in PolyBayes analysis is the paralog discrimination algorithm in the
presence of a reference sequence. This algorithm has been designed with the intention to
answer the question, if an aligned sequence is likely to have originated from the same
genomic location as the reference sequence or otherwise has come from a different but
very similar region.
The algorithm attempts to decide whether the numbers of discrepancies observed in
the aligned sequence are consistent with the number of sequencing errors expected (based
in quality scores) plus the expected differences among the sequences, in case the
discrepancies are higher than expected the sequence is considered to come from a different
location.
SNP detection algorithm calculates the probability that discrepancies at the analyzed
location represent true sequence variation as opposed to sequencing error. The algorithm
takes into account several parameters as for instance, nucleotide differences, the quality
scores of the nucleotides, the depth of the alignment (number of sequences), the base
composition of the sequences, expected polymorphism rates (à priori knowledge), and
calculates the probability that the site is polymorphic.
Other approaches have used PolyBayes as a base to implement a machine learning
approach in order to improve its prediction accuracy. This approach however was used on
large training sets previously classified, and may differ from genomes across different
species [36]. The using of a machine learning approach has however increased PolyBayes
prediction.
3.1.10 Development of an application to simplify the SNP
identification process.
After reviewing several algorithms to identify SNPs, PolyBayes was selected for SNP
identifications in the sequences analyzed at the EU Marie Curie Chair. The next step is
customizing this tool to the specific needs of the work group at the EU Marie Curie Chair.

36
A application will be developed in order to accept a set of sequences received
directly from the sequencing company (for instance Macrogen), clip parts of the sequence
that are not necessary, use PolyBayes program to perform SNP identification and generate
an image from PolyBayes text results. Sequences mentioned above are supposed to be
from the same genomic location of several plants of the same species. The application
should allow the user to adjust PolyBayes input parameters in order to customize SNP
identification for AOX genes in several plants, as well as optimize results.
PolyBayes multiple sequence alignment algorithm does not perform the alignments
internally, instead it is designed to use another program to perform the alignments
(cross_match) who is integrated in another package of programs (PHRED and PHRAP).
So, sequenced data is analyzed first with PHRED in order to assign quality scores to each
base, then cross_match and PHRAP are used by PolyBayes to perform the alignment.
CAP3 [37] is a program specifically designed to perform multiple sequence
alignments and could write the output in the '.ace' file format. Thus PolyBayes could use it
directly for SNP identification instead of cross_match and PHRAP, it does not require the
existence of quality scores but if available they are used by the alignment algorithm.
Sequencing companies usually pre-process sequences in order to supply quality scores to
the customer, regarding each sequence, as well as other useful information.
This approach has already been used in the context of other projects [36] [38], it
simplifies the analysis process, and gives the user a greater control of the assembly
process. Considering this, the application would also allow the user to adjust the input
parameters of CAP3 program, providing a default way for sequence assembly.
The developed application must support all the input parameters for CAP3 and
PolyBayes, although the user should know the effects of changing input parameters. Both
CAP3 and PolyBayes have their specific licenses terms, and thus cannot be freely
distributed, but are available free of charge for academic users from their authors.
Sequence files in FASTA format with the sequence text description, and the quality
scores are created and supplied to CAP3 with user input parameters; the output is then used
by PolyBayes also with user input parameters.

37
4 Work performed
4.1 Localization of S/MARs within and in the neighborhood of
AOX genes
4.1.1 Obtaining genomic data for Arabidopsis and rice
As described under methodology, the sequences used to find S/MARs are based on
TIGR 4th release of Arabidopsis genome, and TIGR 5th release of Rice Genome. The first
step was to locate the AOX genes in both genomes. For Arabidopsis using TAIR database
(The Arabidopsis Information Resource) this was a trivial task, as a simple search by name
was enough.
As described, rice AOX genes are not functionally annotated, so another search
method was required. A homology search with the complete gene sequences from AOX
also did not provide any results. The 3rd exon of Arabidopsis AOX gene is highly
conserved among plant species [3], so a homology search with the 3rd exon from AOX1a
was performed and several matches were found.
Four of these matches showed a high homology in protein with AOX while the others
showed only homology with some parts of AOX protein. These four matches were then
compared with literature to identify each of the genes.
AOX1a and AOX1b genes in Arabidopsis [3] and rice [4] are in a tandem repeat, this
is, one immediately after the other in the same strand of DNA. From the four initial
matches two match these criteria the locus LOC_OS04g51150 matches AOX1a and locus
LOC_OS04g51160 matches AOX1b, and have the same number of exons as well as the
same distance between exons as the ones reported in [4].
AOX1c has been first reported in [30], locus LOC_OS02g47200 has the same
distance between exons, and a higher homology at nucleotide and protein levels than locus
LOC_OS02g21300, so the former has been classified as AOX1d.
The sequence files corresponding to the whole chromosomes where AOX genes are
located were downloaded from TIGR ftp server. In Arabidopsis AOX1a, AOX1b and
AOX1c are located in the 3rd chromosome, AOX1d is located in the 1st chromosome and
AOX2 is located in the 5th chromosome. In rice, AOX1a and AOX1b are located in the 4th

38
chromosome while AOX1c and AOX1d are located in the 2nd chromosome. Since AOX1a
and AOX1b are in a tandem repeat (one after the other in the same DNA strand), the
sequence for S/MAR analysis will be practically the same for both genes (1.2kb
approximately in Arabidopsis and 1.9kb in Rice), eliminating the necessity of a separate
analysis for both genes
4.1.2 Analysis of gene sequences
Chromosome sequence files obtained range from 23 470 804 base pairs from
Arabidopsis chromosome 3 to 35 925 388 base pairs from rice chromosome 2. The next
step is to extract the sequences vicinity for each gene to perform the analysis. A simple
C++ application was created to obtain a specific part of the chromosome file, the input
parameters are the position of the first base pair (for the sequence to analyze) in the
chromosome file, the position of the last base pair (for the sequence to analyze) in the
chromosome file, and the text file where the sequence will be stored.
Since both strands of DNA are to be analyzed another small application was created
to obtain the complement sequence of a specific DNA sequence, the input parameters are
the filename with sequence input and the filename with the sequence output. Complement
strands are treated the same way as “standard” or forward strand regarding gene
positioning, however one must consider that gene transcription is processed in the reverse
direction.
Sequence analysis with SMARTest was then performed using the Genomatix web
interface for GEMS Launcher (the framework in where SMARTest is integrated). Since
SMARTest annotation values are relative to the input sequence supplied, the beginning
position of the S/MAR in the analyzed sequence is not the same as the beginning position
of the S/MAR in the chromosome, to address this problem an application was created to
convert the sequence relative coordinates to absolute positions in the chromosome. The
input parameters are the file with S/MAR annotations, the beginning of the analyzed
sequence in the chromosome and the file, where the absolute S/MAR positioning are to be
stored.
4.1.3 Comparing results with previous works
When comparing the achieved results with other studies that have already studies
S/MARs positioning at a genome scale for Arabidopsis [10], results were different.

39
Chromosome data used for S/MAR prediction in [10] was obtained and compared with
chromosome data downloaded from TIGR.
There are two techniques for sequencing a whole genome, the map based shotgun
sequencing and the whole genome shotgun sequence [44]. Since current sequencing
methods can only sequence from 500 to 1000 base pairs, the larger chromosome sequences
must first be divided in smaller sequences. The first method constructs a “genome map” of
150 000 bp replicated fragments and latter divide these fragments in smaller overlapping
and redundant fragments that can be sequenced, since fragments overlaps it is possible to
obtain the larger sequence of 150 000 bp comparing the overlapping sequences. The
second method uses a similar approach, but without constructing 150 000 bp fragments,
the genome is divided in small redundant overlapping fragments directly ready for
sequencing. This approach is more time efficient but the process of assembling the genome
sequence is more complex.
One of the major problems comes from highly repetitive genome sequences,
(although this is more significant in the whole genome shotgun sequencing method) as
these repetitive sequences could be from different places of the genome, and highly
repetitive sequences could contain structural sequences in between, these issues may lead
to mis-assembled genomes (often with gaps, regions in which none information is known)
[45].
When assembling the genome, the coverage is the average number of overlapping
sequences in which a nucleotide base is present, for example, a 12X genome coverage
means that in average every nucleotide base of the human genome is present in 12 different
overlapping sequences. Increasing the genome coverage in high repeat regions is a way to
overcome these difficulties. New versions of the genome are released as mis-assembling
issues and the gaps in the sequences are removed.
The differences in the results were due to different versions of the Arabidopsis
genome sequences. The version used in this work is the most recent version of Arabidopsis
genome (the TIGR 4th release of the Arabidopsis genome). The length of the S/MARs was
the same but the positioning of the S/MARs was different. Differences in the total length of
chromosome files range from hundreds of base pairs (in chromosome 5) to hundreds of
thousands (in chromosome 1 and 3).

40
4.1.4 Generate an image representation from text files
Text files do not provide an intuitive way for visualizing results, since distances
between genes and S/MARs, as well as S/MAR positioning and length are not easily
visualized.
An image representation is much more adequate, since it allows having a better idea
for possible S/MAR influence on gene expression, especially when complementing text
data with image data.
The program to generate the images was developed in C++ and has 4 classes as
shown in the UML diagram. The input parameters are, the base pair where the sequence
analyzed for S/MARs begins in the chromosome, ending base pair, image width, image
height, the file with the details about the genes in that sequence, the file with the details
about the S/MARs in that sequence.
Information regarding the genes comprises the locus of the gene, their positioning on
the chromosome (the position in the genome of the first and the last base pair of the gene),
the DNA strand (forward or complement), and a list with the positioning of the exons and
introns. Each exon and intron is characterized by an instance of the positioning class, (the
description and the first and last base pairs in the chromosome).
Each element of the S/MAR class has a description about the S/MAR represented,
the beginning and the end of the S/MAR in the chromosome as well as the DNA strand of
the S/MAR (forward or complement). The SequenceDrawer class reads the information
concerning the genes and the S/MARs from a text file and creates a list of genes and
S/MARs.
Depending on the height and width of the image as well as the size of the sequences
to display (supplied by the user), the program calculates the scale, draw the genes and the
S/MARs according to that scale in “.png” file format.

41
Figure 8 – UML diagram of the application that generates the image schemes based on the details of the genes and the S/MARs supplied in a text file
For Arabidopsis gene details were obtained from TAIR page1. Web pages with
details for each gene in each one of the analyzed sequences were saved, and an application
was created to extract the details from the text web pages and add the details to the text file
used to generate the images.
1 http://www.arabidopsis.org

42
For rice, gene details were obtained from TIGR Rice Database, more precisely from
TIGR Rice Genome Browser, since details about the positioning of exons and introns were
not available at individual gene details pages. Genome Browser allows the download of a
text file with the details of all the genes in a given interval for any chromosome. Text files
were downloaded and an application was created to parse these files and store the details in
the text file used to generate the images.
S/MARs text file are created with S/MARs predictions from forward and
complement DNA strands joined together, but marking for each S/MAR the strand of
which it belongs (forward or complement strand).
To have the notion where each analyzed sequence is placed in the whole
chromosome yet another application was created that receives the length of the
chromosome as well as the beginning and the end of the analyzed sequence. Images are
generated in “PNG” file format.
Images were processed to add more details, text details regarding identification and
positioning for each of the S/MARs. Identification, positioning and details for each gene
are presented together with the images and are available at the end of this report (Appendix
1).
4.2 Finding evidence of AOX gene expression in rice
Evidence of AOX gene expression for Arabidopsis in available microarray data is
well documented in [27], so it was not considered necessary to perform any more searches.
As described before search for AOX expression data in rice is based on two
databases, one of microarray data and the other of MPSS data. Both methods have been
briefly introduced before, but some more considerations are to be addressed in this section.
The units used for MPSS measure are in TPM (Transcripts Per Million), this is a
normalization performed to facilitate comparisons among different signatures scattered
among different libraries (different signatures for the same gene may be in different
libraries). Normalization is necessary to ensure that comparisons across different libraries
accurately reflect biological differences and not only the total number of tags sequenced.
A small expressed gene would have expression values ranging from 1 to 10 TPM,
while a much expressed gene may have more than 1000 TPM. The TPM value is obtained

43
for each signature dividing the RAW expression (number of hybridized signatures) by the
total number of signatures and multiplies by 1,000,000.
Microarray and MPSS are different technologies, the units for measuring gene
expression are different in kind (color intensity and number of transcripts), and the results
from both may not be directly comparable but nevertheless complementary. Microarray
have several limitations concerning accurate expression estimation of low expressed genes
while the assignment of individual signatures for each gene in MPSS can be difficult in
gene families with a high degree of similarity since a signature may match more than a
gene[31].
Even when comparing microarray results for different platforms after removing
potential sources of variability; it is shown that gene expression results may depend upon
the type of microarray used in experiments [32].
Both microarray and mpss experiments are replicated several times in order to
provide more data. This redundant data allows the assessment of a ‘confidence score’ and
thus increase the precision of gene expression estimation [33]. In the Yale Rice Project, it
is assumed that an expressed gene should be detected in at least 2 of 3
hybridizations/replicates.
Results of gene expression in these databases are presented in Appendix 2 of this
report.
4.3 Develop an application to identify regions of Single
Nucleotide Polymorphisms in AOX genes
4.3.1 Identification of Application Requirements
An Important part of application development is to understand the client
requirements, so that the application could be efficient (address user needs) and usable.
This is not an easy task, since most of user requirements are not trivial and not directly
perceptible especially when concepts from diverse areas are involved. Therefore the
requirements described below are not exhaustive or complete, instead represent the most
important points to consider.
• Application should run on Microsoft Windows

44
Almost all the members of the work group at EU Marie Curie Chair use Windows
operating systems on a daily basis, so the software should be developed for the Windows
platform.
• Graphic Interface
The programs required for SNP identification have already been described before,
both use a command line interface and the results are stored in text files. To improve
usability a graphical interface should be developed.
• Full customization of CAP3 and PolyBayes
While usability is an important part, functionality should not be forgotten. Users must
have access to all options for CAP3 and PolyBayes programs, so that program
customization for different species could be easily performed.
• Text files parsing and image generation
Intuitive visualization of results is also an important point, since in larger sequences,
or in sets of sequences, text output may become rather confusing and important results
could be lost. Also for publication purposes, images or schemes are easily handled, and
more suitable to show results.
• Read and Write access
Users must have read and write access in the directory where the application is
installed.
4.3.2 Describing the Application
As described before this application is intended to be used by the researchers at EU
Marie Curie Chair to map candidate SNPs in their sequences. They are the only entity that
will interact with the application.
4.3.2.1 Sequences
Sequences to use for SNP analysis consist of two types of files, which are received
from the sequencing company. One of the text files comprising the nucleotide bases and
one text file with the quality scores for each nucleotide in the sequence. Files with quality
scores are not mandatory, but recommended. The filenames for text sequences and quality

45
base scores should have the same filename, only different file extensions, for instance if
the sequence text file is “aox1c.txt” the quality scores filename should be “aox1c.qual.1”
Sequences must be contiguous, that is, they must be from the same genomic
location and there can be no gaps between them. The minimum number of sequences to
perform a SNP analysis is two when one of them is the reference sequence, other studies
that do not have a reference sequence consider four the minimum number of sequences for
an SNP prediction [39]. However more input sequences should be available for the SNP
prediction to be more accurate.
Since sequences come directly from the sequencing company, there is the necessity
to clip some parts called “vector extremities”, (in the beginning and possibly in the ending
of the sequence), the last 10 base pairs of the vector extremities need to be supplied.
4.3.3 Frameworks used
PolyBayes is a Perl script with some additional modules to perform the mathematical
computations. These modules were created by PolyBayes author and are distributed with
the program. Perl scripts are designed to be used in an UNIX / LINUX environment, so in
order for PolyBayes to be used in Windows a framework with the core binaries of Perl, and
the modules to run Perl scripts will be required. ActivePerl1 is a framework from
ActiveState Company for running Perl scripts on Windows, is freely available in under the
terms of the ActivePerl Community License.
CAP3 has its own version for Windows.
Once again the programming language chosen was C++, and the IDE to code the
interface is Visual Studio C++ 2005, so the .NET Framework Class Library will be used
for image generation.
4.3.4 Application description
This is still an undergoing project; the image generation option is not yet
implemented. Two Windows Form classes were implemented for user interface. The main
Form allows the user to select the sequences, introduce the input data and execute the
1 http://www.activestate.com/Products/activeperl/

46
programs, and will latter allow generation of the images with the results, it has also a text
box for display information to the user.
Figure 9 – Main Form, the user has the options to select the sequences, execute the programs to find SNPs and after generate an image based on output text results
Selecting the sequences to analyze will display a selection dialog box that filter the
“.txt” and ”phd.1” files (the extensions of the nucleotide bases and the quality scores).
When user confirms file selection, data in selected files is checked for proper file format
(verifications are not exhaustive), if data is in wrong file format a message is shown in a
dialog box and the user must repeat the selection process. After file selection, user should
hit the run program button, and a new Windows Form is then shown.
The Input Form has three main tabs, the first tab allows the user to introduce the
“vector extremities” for clipping, the second controls the input supplied to CAP3 and the
third shows the options to be supplied to PolyBayes.
After the DNA is sequenced, the sequence data files received from the sequencing
company contain some data that needs to be removed (the cloning vector extremities).
Since a sequence may have data regarding the nucleotide bases and the quality scores in
separate files, the first step is to match the text sequences to the quality scores, the
matching is done by filename, and sequence data identifiers inside the files. For each
different filename (discarding extensions) the program asks for the extremities of the
cloning vector in the tab “Sequence Clipping” (default values are already in the text input
boxes).
The tab “Sequence assembly (cap3)” allows changing default input parameters of
CAP3 for sequence assembly. Input parameter description is provided according CAP3
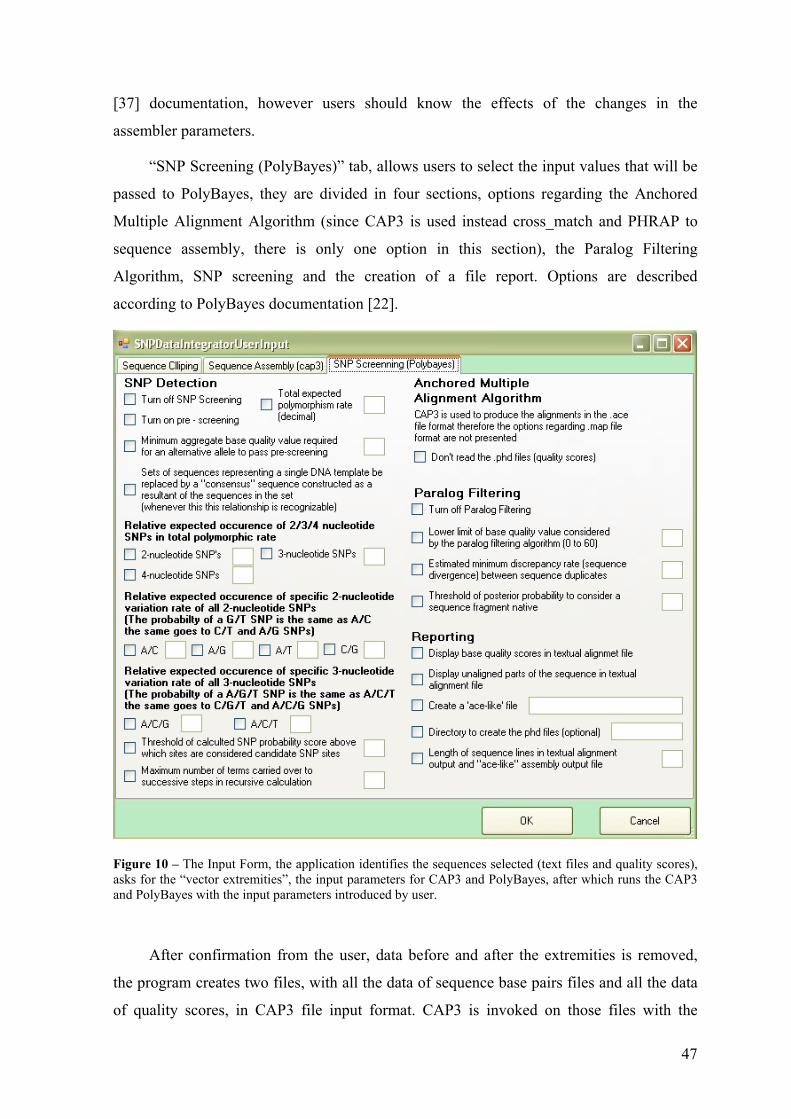
47
[37] documentation, however users should know the effects of the changes in the
assembler parameters.
“SNP Screening (PolyBayes)” tab, allows users to select the input values that will be
passed to PolyBayes, they are divided in four sections, options regarding the Anchored
Multiple Alignment Algorithm (since CAP3 is used instead cross_match and PHRAP to
sequence assembly, there is only one option in this section), the Paralog Filtering
Algorithm, SNP screening and the creation of a file report. Options are described
according to PolyBayes documentation [22].
Figure 10 – The Input Form, the application identifies the sequences selected (text files and quality scores), asks for the “vector extremities”, the input parameters for CAP3 and PolyBayes, after which runs the CAP3 and PolyBayes with the input parameters introduced by user.
After confirmation from the user, data before and after the extremities is removed,
the program creates two files, with all the data of sequence base pairs files and all the data
of quality scores, in CAP3 file input format. CAP3 is invoked on those files with the

48
options that user has selected, generates an “.ace” file with the assembly of the sequences
and the quality scores for each sequence, once CAP3 finishes his execution PolyBayes is
executed on the “.ace” file generated by CAP3 with the options selected by the user.
Depending on the number of sequences PolyBayes output could be very extensive,
this output is indented to be parsed, to generate image schemes. As said before this part of
the application is not yet implemented.
Testing phase has also not yet been performed, several studies have been conducted
in order to map SNPs in some plants, using computer and experimental approaches [36]
[39] [46], results are available on the Internet and will serve as basis to evaluate the
accuracy of the application described before.

49
5 Conclusions
All the programs available that allow the analysis of S/MAR sequences, as well as
literature that have already compared these programs were found in order to evaluate the
strengths and weaknesses regarding each one of them.
Publicly available databases were used to determine the location of AOX genes in
Arabidopsis thaliana and rice genomes. For Rice literature was used to locate and confirm
the correct location of the genes, since AOX genes are not annotated in rice genome. Once
the locus of the genes was found, the size of the S/MARs search area for Arabidopsis
thaliana and rice was determined.
Several small applications were developed for data conversion between different
formats, in order to use the previously selected S/MARTest program to locate S/MAR
regions in the vicinity of AOX genes in Arabidopsis thaliana and Rice. Schematic images
of the results were generated using an application developed for that purpose. Results were
then presented using both schematic images and text.
At this point was considered important to have information about expression of AOX
genes in both Arabidopsis and rice, to correlate with S/MARs predictions. This information
was obtained from publicly available databases. Two databases were used based on data
accuracy, and amount of data available.
A survey regarding previous work on computational SNP identification was
performed. A long list of SNP scoring algorithms were identified, and the methodology
selected was based in the program / algorithm PolyBayes, which was used for
computational SNP detection in several studies to predict SNPs over large amounts of data
in Humans [22] [34], and in soybean [35] and is the detection engine in two large scale
SNP identification projects. PolyBayes assigns a Bayesian probability value to each SNP
candidate position providing a more robust model than scoring models based on SNP
definition [19].
Since one of the major goals were to create an application customized to use at EU
Marie Curie Chair, another program was selected to perform the multiple sequence
alignments (CAP3), and a graphic interface was developed to integrate both programs,
allowing to use all the options of these two programs. The application is intended to
50
generate schematic images for the results although this functionality is not yet
implemented.
As mentioned before this project suffered biases regarding the original planning. This
was due to several reasons. The first is that this program is integrated, in a research project,
so all the phases could not be completely compartmentalized in the original planning,
which lead to the necessity of adding some phases, particularly the search for AOX gene
expression concerning Arabidopsis and rice.
Another reason was the difficulties found when comparing the results for S/MARs
identification with previous work, since results did not match and were due to different
versions of the Arabidopsis Genome. This problem was not rapidly identified and caused
some bias in the original planning.
Furthermore the context of this work requires a biological background,
complemented by informatics skills, as means to provide tools for solving the biological
problems, thus, a substantial part of the work was devoted to understand the biological
concepts, which are not often trivial, and took more time than initially planned. Once the
biological problems were depicted and the methodology established, solving the problems
using informatics approaches were rather intuitive.
This still and undergoing project, so the further work will be to finish SNP
application in order to generate image schemes from PolyBayes text output, testing the
functionality of this application with the members of the workgroup. If any problems will
be detected, by the test phase a second iteration of the development process will need to be
undertaken to solve these problems.
Improvements in computational S/MARs finders are a major step for a better
understanding of S/MARs function, and their implications in gene regulation. For this
improvement is essential the experimental identification of more S/MARs sequences.
Improvements in SNP prediction programs could pass through integrating a machine
learning approach, with already existent scoring algorithms. This approach was already
proven to work, but the machine learning algorithm must be trained in large training sets of
data, also differences in plant genomes make unfeasible to apply knowledge gained for
some plants to another [36].

51
C++ was the chosen language to implement all the applications, since it allows an
easy integration with libraries for rapid image generation, has a many functions for string
and Input/Output handling.

52

53
6 References
[1] – The Arabidopsis Genome Initiative (2000) Analysis of the genome sequence of the
flowering plant Arabidopsis thaliana. Nature 408:796-815
[2] – International Rice Genome Sequencing Project (2005) The map-based sequence of
the rice genome. Nature 436:793-800
[3] – Saisho D, Nambara E, Naito S, Tsutsumi N, Hirai A, Nakazono M (1997)
Characterization of the gene family for Alternative Oxidase from Arabidopsis thaliana.
Plant Molecular Biology 35:585-596
[4] – Ito Y, Saisho D, Nakazono M, Tsutsumi N, Hirai A (1997) Transcript levels of
tandem-arranged alternative oxidase genes in rice are increased by low temperature. Gene
203:121-129
[5] – Arnholdt-Schmitt B, Costa JH, Fernandes de Melo D (2006) AOX A functional
marker for efficient cell reprogramming under stress? Trends Plant Sci 11:281-287
[6] - Arnholdt-Schmitt B (2006) Efficient cell Reprogramming as a target for functional
marker strategies? Towards new prespectives in applied plant nutrition research. J. Plant.
Nutr. Soil Sci 168:617-624
[7] – Lodish H, Berk A, Matsudaira P, Kaiser CA, Krieger M, Scott MP, Zipursky L,
Darnell J (2003) Molecular Cell Biology. W. H. Freeman 5th Edition.
[8] – Girod PA, Mermond N (2003) Use of Scaffold Matrix Attachment Regions for
protein production. Gene Transfer and expression in Mammalian Cells. Chapter 10:359-
377 Elsevier Science.
[9] – Rudd S, Frish M, Grote K, Meyers BC, Mayer K, Werner T (2004) Genome Wide In
Silico Mapping of Scaffold / Matrix Attachment Regions in Arabidopsis Suggests
Correlation of Intagenic Scaffold / Matrix Attachment Regions with gene expression. Plant
Physiol 135: 715–722.
[10] – Ganapathi M, Srivastava P, Sutar SKD, Kumar K, Dasgupta D, Singh GP,
Brahmachari V, Bramachari SK (2005) Comparative analysis of chromatin landscape in
regulatory regions of human housekeeping and tissue specific genes. BMC Bioinformatics
6:126.

54
[11] – Arnholdt-Schmitt B, (2005) Functional markers and a ‘systemic strategy’:
convergency between plant breeding, plant nutrition and molecular biology. Plant
Physiology and Biochemistry 43:817-820
[12] – Nowak W, Gawloska M, Jarmoloswski A, Augustyniak J (2001) Effect of nuclear
matrix attachment regions on transgene expression in tobacco plants. Acta Biochimica
Polonica vol 48 3:637:646
[13] – Tetko IV, Haberer G, Rudd S, Meyers B, Mewes HW, Mayer K (2006)
Spatiotemporal expression control correlates with intragenic scaffold matrix attachment
regions (S/MARs) in Arabidopsis thaliana. PLoS Comput Biol 2(3): e21.
[14] – Leibich I, Bode J, Reuter I, Wingender E (2002) Evaluation of sequence motifs
found in Scaffold / Matrix Attached Regions (S/MARs). Nucleic Acids Research, Vol. 30
15:3433-3442
[15] – Singh GB, Kramer JA, Krawetz SA (1997) Mathematical model to predict regions
of chromatin attachment to the nuclear matrix. Nucleic Acids Research Vol 25 7:1419-
1425
[16] – Purbowasito W, Suda C, Yokomine T, Zubair M, Sado T, TsuTsui K, Sasaki H
(2004) Large-Scale Identification and Mapping of Nuclear Matrix-Attachment Regions in
the Distal Imprinted Domain of Mouse Chromosome 7. DNA Research 11:391-407
[17] – Frish M, Frech K, Klingenhoff A, Chartharius K, Leibich I, Werner T (2003) In
Silico Prediction of Scaffold/Matrix Attachment Regions in Large Genomic Sequences.
Genome Res 12:349-354
[18] – Meyers BC, Galbraith DW, Nelson T, Agrawal V (2004) Methods for
Transcriptional Profiling in Plants. Be Fruitful and Replicate. Plant Physiology Vol
135:637-652
[19] – Kwok PY (2003) Single Nucleotide Polymorphisms, Methods and Protocols.
Humana Press Inc.
[20] – Saika H, Ohtsu K, Hamanaka S, Nakazono M, Tsutsumi N, Hirai H (2002) AOX1c,a
novel rice gene for alternative oxidase; comparison with rice AOX1a and AOX1b. Genes
Genet. Syst. 77:31-38

55
[21] – Garg K, Green P, Nickerson DA (1999) Identification of Candidate Coding Region
Single Nucleotide Polymorphisms in 165 Human Genes Using Assembled Expressed
Sequence Tags. Genome Res. 9:1087-1092
[22] – Marth GT, Korf I, Yandell MD, Yeh RT, Gu Z, Zakeri H, Stitziel NO, Hillier LD,
Kwok PY, Gish WR (1999) A general approach to single-nucleotide polymorphism
discovery. Nature Genetics 23:452-456
[23] – Michalowski SM, Allen GC, Hall Jr. GE, Thompson WF, Spiker S (1999)
Characterization of Randomly-Obtained Matrix Attachment Regions (MARs) from Higher
Plants. Biochemistry 38:12795-12804
[24] – Chernov IP, Akopov SB, Nikolaev LG (2004) Structure and Functions of Nuclear
Matrix Associated Regions (S/MARs). Russian Journal of Bioorganic Chemistry, Vol 30
1:3-14
[25] – Whelan J, Millar AH, Day DA (1996) The alternative oxidase is encoded in a
multigene family in soybean. Plant 198:197-201
[26] – Paul AL, Ferl RJ (1998) Higher Order Chromatin Structures in Maize and
Arabidopsis. The Plant Cell 10:1349-1359
[27] – Clifton R, Millar AH, Whelan J (2006) Alternative oxidases in Arabidopsis: A
comparative analysis of differential expression in the gene family provides new insights
into function of non-phosphorylating bypasses. Biochimica et Biophisica Acta 1757:730-
741
[28] – Zimmermann P, Hirsch-Hoffman M, Gruissem W (2004) GENEVESTIGATOR.
Arabidopsis Microarray Database and Analysis Toolbox. Plant Physiology 136:2621-2632
[29] – Nobuta K, Venu RC, Lu C, Bélo A, Vemaraju K, Kulkarni K, Wang W, Pillay M,
Green PJ, Wang G, Meyers BC (2006) An expression atlas of rice mRNAs and small
RNAs. Nature Biotechnology 25:473-477
[30] – Saika H, Ohtsu K, Hamanaka S, Nakazono M, Tsutsumi N, Hirai A (2002) AOX1c,a
novel rice gene for alternative oxidase; comparison with rice AOX1a and AOX1b. Genes
Genet. Syst 77:31-38
[31] - Nakano M, Nobuta K, Vemaraju K, Tej SS, Skogen JW, Meyers BC (2006) Plant
MPSS databases: signature-based transcriptional resources for analyses of mRNA and
small RNA. Nucleic Acids Research 34, D731-D735

56
[32] - Tan PK, Downey TJ, Spitznagel Jr. EL, Xu P, Fu D, Dimitrov DS, Lempicki RA,
Raaka BM, Cam MC (2003) Evaluation of gene expression measurements from
commercial microarray platforms. Nucleic Acids Research 31, D5676-D5684
[33] - Causton HC, Quackenbush J, Brazama A (2003) Microarray Gene Expression Data
Analysis, A beginner’s guide. Blackwell Science Ltd.
[34] - The International SNP Map Working Group (2001) A map of human genome
sequence variation containing 1.42 million single nucleotide polymorphisms. Nature
409:928-933
[35] – Zhu YL, Song QJ, Hyten DL, Van Tassell CP, Matukumalli LK, Grimm DR, Hyatt
SM, Fickus EW, Young ND, Cregan PB (2002) Single Nucleotide Polymorphisms in
Soybean
[36] – Matukumalli LK, Grefenstette JJ, Hyten DL, Choi IY, Cregan PB, Tassel CPV
(2006) Application of machine learning in SNP discovery. BMC Bioinformatics 7:4
[37] – Huang X, Madan A (1999) CAP3: A DNA Sequence Assembly Program. Genome
Res. 9:868-877
[38] – Verjovski-Almeida S, DeMarco R, Martins EAL et al (2003) Transcriptome analysis
of the acoelomate human parasite Schistosoma mansoni. Nature Genetics 35:148-157
[39] – Batley J, Barker G, O’Sullivan H, Edwards KJ, Edwards D (2003) Mining for
Single Nucleotide Polymorphisms and Insertions/Deletions in Maize Expressed Sequence
Tag Data. Plant Physiology 132:84-91
[40] - Borecky J, Vercesi AE (2005) Plant uncoupling mitochondrial protein and
alternative oxidase: energy metabolism and stress. Bioscience Rep. 35: 271–286
[41] - Juszczuk IM, Rychter AM (2003) Alternative Oxidase in higher plants Acta
Biochimica Polonica Vol. 50 4:1257-1271
[42] - Vanlerberghe GC (1997) Alternative Oxidase: From Gene to Function. Plant
Physiology Plant Molecular Biology 48:703-734
[43] - Umbach AL, Ng VS, Siedow JN (2006) Regulation of plant alternative oxidase
activity: A tale of two cysteines. Biochimica et Biophysica Acta 1757:135-142
[44] – Venter JC, Smith HO, Hood L, (1996) A new strategy for genome sequencing.
Nature 381, 364 - 366

57
[45] – Salzberg SL, Yorke JA (2005) Beware of mis-assembled genomes. Bioinformatics
21:4320-4321.
[46] – Schmid KJ, Sörensen TR, Stracke R, Törjék O, Altmann T, Mitchell-Olds T,
Weisshaar B (2003) Large-Scale Identification and Analysis of Genome-Wide Single-
Nucleotide Polymorphisms for Mapping in Arabidopsis thaliana. Genome Res. 13:1250-
1257.

58

Index
Active Perl 44
Alternative Oxidase (AOX) 21
Arabidopsis thaliana 20
CAP3 35
Chromatin 13
Codon 8
DNA 7
Enhancers 9
Gene 7
Genotype 7
Gene Expression 8
Gene silencing 15
Gene Transcription 8
Gene Translation 8
Genetic markers 18, 22
Microarrays 12, 42
MPSS 12, 41
Multiple Sequence Alignments 18
Oryza sativa 21
Phenotype 18
PolyBayes 33
Protein synthesis 8
Quality Scores 20
Quantitative Real Time PCR 11
S/MARs 14, 24, 39
SMARTest 25, 27, 37
SNPs 17, 32
TAIR 28
TIGR 29
Whole genome sequencing 9, 38


Appendix 1(Confidential)
In this Appendix are presented the S/MARs identification results.
The Schematic images and text is presented together, for all AOX genes in
Arabidopsis Thaliana and Oryza sativa (Rice).
Results comprise a generated image depicting S/MAR sequences in the neighborhood
of AOX genes for Arabidopsis and Rice, an image concerning the positioning of the
analyzed section in the corresponding chromosome, position and strand of each S/MAR
and gene in the chromosome, and the location relative to AOX genes. It is also presented a
description of each gene according with database annotations.


Appendix 2 (Confidential)
In this Appendix are presented the results of gene expression evidence found for
AOX genes in rice regarding in microarray and MPSS data available in public available
databases.
Microarray data in Yale Virtual Center for Cellular Expression
Profiling of Rice
Searching this data for AOX genes in Yale Rice Project we can find data for each
one of the four AOX genes in rice (AOX1a, AOX1b, AOX1c and AOX1d). AOX1a has the
TIGR locus identifier LOC_OS04g51150, and the Yale microarray identifier:
Os054614_01 with the probe:
GAGAAGGAGGTGGTGGTCAACAGCTACTGGGGCATCGAGCAGTCGAAGAAGC
TGGTGCGGGAGGACGGCA, located approximately in the end of the first exon (bases
333 to 402).
AOX1a microarray expression could be found in:
• Leaf blade (2nd leaf ) – Stomata (138,959 in 2 replicates) • Root elongation zone – Endodermis (142.703 in 4 replicates) • Root elongation zone – Epidermis (131.204 in 2 replicates) • Root elongation zone – Cortex (91.224 in 4 replicates) • Root maturation zone – Endodermis (92.225 in 3 replicates)
And with low intensity values but in almost all replicates
• Coleoptile (24h post imbibition) – (70.19 in 4 replicates) • Leaf blade (2nd leaf ) – Epidermal Long Cell (15.777 in 4 replicates) • Radicle (24hr post imbibition) – (48.855 in 4 replicates) • Scutellum (24hr post imbibition) – (35.724 in 4 replicates)
AOX1b has TIGR locus identifier LOC_OS04g51160 and the Yale microarray
identifier Os023119_01 with the probe:
TCGTGAGCTACTGGGGCATCCAGCCGCCGAAGCTCGTGAAGGAGGACGGCAC
GGAATGGAAGTGGCTCAG located approximately in the end of the first exon.
AOX1b microarray expression could be found in:
• Leaf blade (2nd leaf ) – Bulliform (209.616 in 2 replicates) • Leaf blade (2nd leaf ) – Mesophyll (205.383 in 2 replicates)

• Root tip – Vascular bundle (158.51 in 3 replicates)
With low intensity values we can also found AOX1b expression in:
• Plumule – Dry Seed (55.105 in 2 replicates) • Epiblast – 12 hr post imbibition (30.892 in 2 replicates)
AOX1c has TIGR locus identifier LOC_Os02g47200 and the Yale microarray
identifier Os053159_01 with the probe:
CAGCTACTGGGGCATCGAGGCGTCGAAGCTCGCGAGCAAGGACGGCGTCGAG
TGGAAGTGGTCTTGCTTC located at the end of the first exon.
AOX1c microarray expression is lower than the other AOX genes in rice, since it
has low intensity values and is expressed in fewer tissues like:
• Shoot P3 (70.476 in 2 replicates) • Shoot – Axillary meristem (46.771 in 2 replicates) • Epiblast – Dry seed (44.838 in 3 replicates)
AOX1d has TIGR locus identifier LOC_Os02g21300 and the Yale microarray
identifier Os029770_01 with the probe:
ACACCACAACCCGGCGACGCTCGGTGACAAGGTTGCCAGGTGGACGGTCAAAT
CGTTGCGCTGGCCGGTT located in the middle of the second exon
AOX1d microarray expression has one high value in the root tip (vascular bundle)
and other small expression values as seen in more detail below:
• Root tip – Vascular bundle (314.416 in 2 replicates) • Whole leaf blade (fresh) (148.365 in 2 replicates)
Lower intensity values are found in:
• Root tip – Lateral root cap (58.799 in 2 replicates ) • Root tip – Cortex (52.286 in 2 replicates) • Shoot – Axillary meristem (15.761 in 4 replicates)

MPSS Gene Expression Summary for AOX Genes (According with Rice MPSS database from University of Delaware) Gene Signature (20 base pairs) Expression in TPM (Transcripts per Million)
9LA FLB 9RO 9RR MC0 MR48 MS3 MS12 MS24 MS96 NCL NCR NDR NLC NRB AOX1a GATCGGATATCACTGAGGAT 37 94 23 64 30 22 538 33 69 71
GATCCGCACGCTGCTGGAAG 102 39 AOX1b GATCATCATTCATCAACGGG 66 22 17 321 14 204 21 AOX1c GATCCGGATTCATGTGTGCA 15 16
GATCTGTGCTACCGCAGTAG GATCAGTCCTCCTCCGCCAC 19
AOX1d GATCCACTACAAGCCCAAGC GATCCACCCGCCGCTGTGCT 11 GATCGTTGCAGTTCCTCTCA 33 76
Gene Signature (20 base pairs) Expression in TPM (Transcripts per Million)
NSL NSR NYL PLA PLW PSN XC6 XR3 XR12 XR24 XS3 XS6 XS12 XS24 XS48 AOX1a GATCGGATATCACTGAGGAT 96 35 56 54 23 39 105 46 48 61 60 62 153
GATCCGCACGCTGCTGGAAG AOX1b GATCATCATTCATCAACGGG 16 AOX1c GATCCGGATTCATGTGTGCA 214
GATCTGTGCTACCGCAGTAG 52 GATCAGTCCTCCTCCGCCAC
AOX1d GATCCACTACAAGCCCAAGC 50 GATCCACCCGCCGCTGTGCT 22 GATCGTTGCAGTTCCTCTCA 2019

(More expressed conditions)
NSR – Young roots stressed in 250 mM NaCl for 24 h (RNA was isolated using TRIzol Reagent)
MS(3-12-24-96) – M. grisea S. Magnaporthe grisea or rice blast fungus showing susceptible reaction after 96h. Magnaporthe grisea is a plant
pathogenic fungus (causes an important disease affecting rice)
NCR – 14 Days - Young roots stressed in 4C cold for 24h biological replicate (RNA was isolated using TRIzol Reagent)
XR(3-12-24) - X.oryzae-R (Xanthomonas oryzae) after 3, 12 or 24hr - Leaves collected from 2 months old Nipponbare Xa21 plants 3, 12, or
24hr after Xanthamonas Oryzae inoculation showing resistance reaction
XS(3-6-12-24-48) - X.oryzae-S (Xanthomonas oryzae) after 3, 6, 12, 24 and 48hr - Leaves collected from 2 months old Nipponbare Xa21 plants
3, 6, 12, 24 and 48hr after Xanthamonas Oryzae inoculation showing susceptible reaction.
Xanthamonas Oryzae are Gram-negative rods and motile with a polar flagellum and is the causal agent of bacterial blight on rice. Bacterial
Blight disease is a major rice disease in tropical Asian countries
NSL – Young leaves stressed in 250 mM NaCl for 24h (RNA was isolated using TRIzol reagent)
9RR – Roots (Replicate) - 60 Days Mature Roots - Biological Replicate
(Less expressed conditions by alphabetic order)
9LA – Leaves - 60 Days Mature Leaves
9RO – Roots - 60 Days Mature Roots

FLB – F1 Hybrid 60 days Mature Leaf Replicate B (F1 hybrids is a term used in genetics and selective breeding. F1 stands for Filial 1, the first
filial generation seeds/plants or animal offspring resulting from a cross mating of distinctly different parental types )
MC0 – Mock treatment-0hr
MR48 - M. grisea S. Magnaporthe grisea or rice blast fungus showing resistance reaction after 48h. Magnaporthe grisea is a plant pathogenic
fungus (causes an important disease affecting rice)
NCL – 14 Days - Young leaves stressed in 4C cold for 24h (RNA was isolated using TRIzol Reagent)
NDR – 14 Days - Young roots stressed in drought for 5 days, biological replicate (RNA was isolated using TRIzol Reagent)
NLC – 60 days - Mature Leaves - Replicate C (RNA was isolated using TRIzol Reagent)
NRB – 60 days - Mature Roots - Replicate B (RNA was isolated using TRIzol Reagent)
NYL – 14 days - Young leaves (RNA was isolated using TRIzol Reagent)
PLA – Rice leaf, beet armyworm damaged, after 24 hr. The beet armyworm is one of the most well-known agricultural pest insects. Feeding on
the foliage of plants can completely defoliate small ones. Smaller larvae devour the parenchyma of leaves, so that all that remains is the thin
epidermis and veins. Larger larvae tend to burrow holes through thick areas of plants
PLW – Rice leaf, water weevil damaged, after 24 hr. Adult weevils are small (1/8 inch), grayish-black snout beetles which may have a darker
brown V-shaped area on their backs, who feed on the upper layer of cells (epidermis of leaves), producing long, narrow window like
(skeletonized) slits along the leaf called feeding "scars." Upon reaching host plants, flight muscles of adults degenerate. Larvae chew on roots of
developing rice and obtain oxygen from the host plant by means of paired hooks on the upper surface of their second through seventh abdominal
segments.

PSN – Rice developing seed, 6 days old, Nipponbare-Grain quality control.
XC(6) - Mock treatment 6hr- Leaves collected from 2 months old Nipponbare Xa21 plants 6hr after wound treatment.