biofuels - at what cost? a review of costs and benefits of ... · biofuels – at what cost? a...
TRANSCRIPT
wwwiisdorggsi copy 2013 The International Institute for Sustainable Development
BiofuelsmdashAt What Cost
A review of costs and benefits of UK biofuel policies
Chris Charles Richard Bridle Tom Moerenhout September 2013
copy 2013 The International Institute for Sustainable DevelopmentRESEARCH REPORT SEPTEMBER 2013Biofuels ndash At What Cost A review of costs and benefits of UK biofuel policies iiii
copy 2013 The International Institute for Sustainable DevelopmentPublished by the International Institute for Sustainable Development
About IISDThe International Institute for Sustainable Development (IISD) contributes to sustainable development by advancing policy recommendations on international trade and investment economic policy climate change and energy and management of natural and social capital as well as the enabling role of communication technologies in these areas We report on international negotiations and disseminate knowledge gained through collaborative projects resulting in more rigorous research capacity building in developing countries better networks spanning the North and the South and better global connections among researchers practitioners citizens and policy-makers
IISDrsquos vision is better living for allmdashsustainably its mission is to champion innovation enabling societies to live sustainably IISD is registered as a charitable organization in Canada and has 501(c)(3) status in the United States IISD receives core operating support from the Government of Canada provided through the International Development Research Centre (IDRC) from the Danish Ministry of Foreign Affairs and from the Province of Manitoba The Institute receives project funding from numerous governments inside and outside Canada United Nations agencies foundations and the private sector
Head Office161 Portage Avenue East 6th Floor Winnipeg Manitoba Canada R3B 0Y4 Tel +1 (204) 958-7700 | Fax +1 (204) 958-7710 | Website wwwiisdorg
About GSIGSI is an initiative of the International Institute for Sustainable Development (IISD) GSI is headquartered in Geneva Switzerland and works with partners located around the world Its principal funders have included the governments of Denmark the Netherlands New Zealand Norway Sweden and the United Kingdom The William and Flora Hewlett Foundation have also contributed to funding GSI research and communications activities
International Institute for Sustainable Development
Global Subsidies Initiative
International Environment House 2 9 chemin de Balexert 1219 Chacirctelaine Geneva Switzerland
Tel +41 22 917-8373 | Fax +41 22 917-8054
BiofuelsmdashAt What CostA review of costs and benefits of UK biofuel policies
Written by Chris Charles Richard Bridle Tom Moerenhout
September 2013
copy 2013 The International Institute for Sustainable DevelopmentRESEARCH REPORT SEPTEMBER 2013Biofuels ndash At What Cost A review of costs and benefits of UK biofuel policies iiiiii
AcknowledgementsFinancial support for this project was provided by BirdLife International the European Environmental Bureau (EEB) Transport and Environment and the Global Subsidies Initiative (GSI) of the International Institute for Sustainable Development (IISD)
The authors would like to warmly thank the following peer reviewers for their comments on the earlier drafts of this report (in alphabetical order) although any mistakes or omissions relating to the report are the sole responsibility of the authors
bull Alan Swinbank (School of Agriculture Policy and Development University of Reading)
bull Rob Bailey (Chatham House)
bull Three anonymous peer reviewers
The views expressed in this study do not necessarily reflect those of the GSIrsquos funders nor should they be attributed to them
copy 2013 The International Institute for Sustainable DevelopmentRESEARCH REPORT SEPTEMBER 2013Biofuels ndash At What Cost A review of costs and benefits of UK biofuel policies iv
Table of ContentsExecutive Summary 1
10 Introduction3
11 Key Policies 3
111 EU Policies and Objectives 3
112 UK Policies and Objectives 4
113 Implementing Targets for Biofuel Blending 4
114 Objectives of this Study 5
115 Methodology 5
20 Background 6
21 The Role of Sustainability in UK Policy 6
22 Market Formation and Trends 6
30 Support to the UK Biofuels Sector 7
31 Purpose 7
32 Introduction 7
33 UK Support Measures 9
331 Market Transfers 9
332 Budgetary Support Linked to Volume Produced or Consumed 12
333 RTFCs 13
334 Summary of Subsidies to Biofuels 14
40 Single Payment Scheme 15
41 Purpose 15
42 Introduction 15
43 Results16
50 Emission Reductions 17
51 Purpose 17
52 Introduction 17
53 Methodology 17
54 Direct Emissions 18
55 ILUC-Related Emissions 18
56 Estimated ILUC Emissions 20
57 Total Emissions 20
58 Emissions Savings from UK Biofuels 21
59 Carbon Dioxide Abatement Costs 22
60 Employment Creation 23
61 Purpose 23
62 Introduction 23
63 Is It a Numbers Game Jobs in the Bioethanol and Biodiesel Industries 23
copy 2013 The International Institute for Sustainable DevelopmentRESEARCH REPORT SEPTEMBER 2013Biofuels ndash At What Cost A review of costs and benefits of UK biofuel policies v
64 The Long-Term Security of Jobs 24
65 Rural Development and the Geographical Location of Jobs 25
66 Conclusions 26
70 Energy Security and Biofuel Trade 27
71 Purpose 27
72 Defining Energy Security 27
73 Conclusions 30
80 Renewable Energy Options 31
81 Purpose 31
82 Renewable Energy Targets 31
83 Deployments of Renewable Energy in Transport Fuels in the UK 32
84 Costs 33
85 Subsidies 35
86 Other Options for the Transport Target 36
90 Conclusion 37
91 Discussion 37
92 Policy Recommendations 38
References 39
Annex A Breakdown of Biofuel Production Plants in the UK 45
Annex B Research and Development for Advanced Biofuels 46
List of BoxesBox 1 Contextualizing the Numbers Subsidies to biofuels compared to subsidies to other energy sources 8
Box 2 The Mechanics of Biofuel Subsidies in Europe 8
Box 3 Methodological Note on Estimating the Support Provided by Member State Consumption Mandates 10
Box 4 Biofuel Production What types of jobs are being created 23
copy 2013 The International Institute for Sustainable DevelopmentRESEARCH REPORT SEPTEMBER 2013Biofuels ndash At What Cost A review of costs and benefits of UK biofuel policies vi
List of FiguresFigure 1 Emissions savings from biofuel use in the UK 21
Figure 2 UK biodiesel and bioethanol plants 26
Figure 3 Bioethanol consumed in the UK by feedstock (FY 20112012) 28
Figure 4 Country of origin for bioethanol feedstocks (20112012 reporting year) 29
Figure 5 Biodiesel consumed in the UK by feedstock (20112012 reporting year) 29
Figure 6 Country of origin for biodiesel feedstocks (20112012 reporting year) 30
Figure 7 Projected renewable energy generation in the UK in 2020 31
Figure 8 Renewable sources used to generate electricity heat and for transport 1990 to 2011 32
Figure 9 Renewable energy use in transport 33
Figure 10 Costs of energy generation from various renewable energy technologies biofuels and petroleum
products 34
Figure 11 Comparison between total support estimates for biofuels and UK ROC prices 35
Figure 12 2020 renewables target with biofuels restricted to 5 per cent and the shortfall to be found from other
sources 36
List of Tables Table 1 Market price support to bioethanol 20112012 11
Table 2 Market price support to biodiesel 20112012 12
Table 3 UK transport fuel excise taxes rates for UCO and consumption levels 2011 12
Table 4 Support provided through RTFCs for RTFO year 4 (20112012) 13
Table 5 Summary table of biofuel support provided in RTFO year 4 (20112012) 14
Table 6 SPS payments to areas used for biofeedstock production 16
Table 7 Direct indirect and total emissions associated with UK biofuel consumption in 2011 and 2020
(in million tonnes carbon dioxide equivalent) 18
Table 8 Biofuel-related jobs in the UK 24
Table 9 Breakdown of biofuel-related jobs in the UK based on EU development regions in 2011 25
Table 10 Petroleum products displaced by UK biofuel use in 20112012 27
copy 2013 The International Institute for Sustainable DevelopmentRESEARCH REPORT SEPTEMBER 2013Biofuels ndash At What Cost A review of costs and benefits of UK biofuel policies vii
Acronyms and AbbreviationsASCM CAP CO
2e
DECC DfT EU FY FQD GHG GSI HMRC IEA IFPRI ILUC LCOE MJ Mt NREAP OECD PPL PV RampD REA RED RFA ROC RTFO RTFCs SPS TOE UCO UK
Agreement on Subsidies and Countervailing Measures Common Agricultural policy carbon dioxide equivalent Department of Energy and Climate Change Department for Transport European Union fiscal year Fuel Quality Directive greenhouse gas Global Subsidies Initiative Her Majestyrsquos Revenue and Customs International Energy Agency International Food Policy Research Institute indirect land-use changes levelized cost of energy megajoules million tonnes National Renewable Energy Action Plan Organisation for Economic Co-operation and Development pence per litre Photovoltaic research and development Renewable Energy Association Renewable Energy Directive Renewable Fuels Agency Renewable Obligation Certificates Renewable Transport Fuel Obligation Renewable Transport Fuel Certificates Single Payment Scheme tonne of oil equivalent used cooking oil United Kingdom
copy 2013 The International Institute for Sustainable DevelopmentRESEARCH REPORT SEPTEMBER 2013Biofuels ndash At What Cost A review of costs and benefits of UK biofuel policies 1
Executive Summary This report evaluates some of the principal issues associated with the United Kingdomrsquos (UK) biofuels industry support policies employment creation emissions abatement and the role of biofuels and other renewable technologies in meeting European Union (EU) renewable energy targets The report assesses the costs and benefits of the objectives that EU member states such as the UK have set out to achievemdashincreased energy security improvements in environmental performance and the generation of additional economic value
The Renewable Transport Fuel Obligation (RTFO) was introduced in November 2005 by the Government of the United Kingdom to promote the use of renewable fuels This report focuses on RTFO year four as it provides a recent full year for available data (April 2011ndashApril 2012) The main mechanisms and policies associated with the RTFO include the use of binding blending targets a market for trading Renewable Transport Fuel Certificates (RTFCs) in order for obligated parties to meet their targets and an excise tax exemption for biodiesel produced from used cooking oil (UCO)
In the third year of RTFO (20102011) bioethanol consumption was reported as 586 million litres and biodiesel was reported as 854 million litres with the total number of litres consumed being 1440 million litres In RTFO year four bioethanol consumption was 698 million and biodiesel consumption was 933 million litres with total consumption at 1632 million litres (Department for Transport 2013d)
Support to Biofuels
Support to the UK biofuel industry in RTFO year 4 (20112012) was estimated at between pound44 million and pound74 million for ethanol and between pound315 million and pound371 million for biodiesel Total support to biofuels was estimated to be between pound359 million and pound445 million
The main support mechanism for promoting biofuels in the UK are blending mandates that put upwards pressure on EU wholesale biofuels prices which are then compared to lower world wholesale biofuel prices It was estimated that the UK biofuels sector received market price support of between pound42 million and pound72 million for ethanol and between pound153 million and pound209 million for biodiesel via higher EU wholesale prices
During RTFO year four 19 billion RTFCs were issued and 874 million were traded at an average price of 13 pence per certificate Biofuel producersrsquo trading certificates were a minor part of the trading system with obligated parties such as fossil-fuel supply companies undertaking the majority of trades Additional revenue for biofuel producers trading RTFCs was estimated at around pound3 million to pound4 million
Biodiesel production from UCO was supported by a 20 pence-per-litre excise tax exemption up until March 2012 which in RTFO year 4 resulted in pound161 million in foregone revenue
Biofuel Carbon Abatement Costs
UCO-based biodiesel has the lowest abatement costs of all biofuels in the UK (around pound154 per tonne of carbon dioxide [CO
2] avoided) First-generation biodiesel (not including biodiesel from UCO)1 on the other hand is
1 First-generation biofuels are produced from the sugars and vegetable oils contained in arable crops which can be extracted using conventional technology Second-generation biofuels are produced from lignocellulosic biomass or woody crops agricultural residues or waste and it is more difficult to extract the required fuel
copy 2013 The International Institute for Sustainable DevelopmentRESEARCH REPORT SEPTEMBER 2013Biofuels ndash At What Cost A review of costs and benefits of UK biofuel policies 2
responsible for slight emission increases and no abatement cost was calculated Bioethanol had an abatement cost of around pound115 per tonne of CO
2 avoided in 2011 Combining all types of biofuels an abatement cost a little under pound165
per tonne of CO2 avoided was calculated mainly due to the low emission profiles of UCO
Jobs Created by the UK Biofuels Industry
The wide range of direct and indirect jobs created by the UK biofuel sector was estimated at between 1356 and 7500 in 2011 A variety of methodologies for assessing the number of jobs created are applied in measuring biofuel and renewable energy jobs reflecting the challenges in assessing the numbers and duration of sectorial jobs The UK government tracks the numbers of biofuel-related jobs in order to help assess if biofuel policies are meeting their official objectives
Energy Security and Biofuel and Feedstock Trade
Trade in biofuels and feedstock is significant for the UK RTFO data for year four showed corn sourced from outside of the EU principally from the United States was the main feedstock for bioethanol The main feedstock for biodiesel was overwhelmingly UCO sourced from the UK and within Europe
Conclusions
The UKrsquos biofuel policyrsquos success at meeting its stated objectives has been subject to debate This report shows that in some instances the benefits to the UK biofuels sector and economy from biofuel policies have been few unclear or require greater monitoring and elaboration in order to examine the related costs and benefits of meeting the UKrsquos biofuel policy objectives
copy 2013 The International Institute for Sustainable DevelopmentRESEARCH REPORT SEPTEMBER 2013Biofuels ndash At What Cost A review of costs and benefits of UK biofuel policies 3
10 IntroductionBiofuels can be used as liquid transport fuels and are principally produced from biomass The two main biofuels in use bioethanol and biodiesel can be substituted for petrol or diesel for use in vehicle engines and aviation The main production process for bioethanol is through a process of sugar and starch crop fermentation The more common feedstocks are corn sugar beets and sugarcane Biodiesel is produced through the transesterification of fats from vegetable oil feedstocks such as palm oil rapeseed and soybeans They can also be produced from waste products such as used cooking oil (UCO) and tallow which is rendered fat from animals A range of production processes that do not use food-based feedstocks is currently being investigated in Europe and elsewhere
Policy-makers have been trying to tackle the major issue of greenhouse gas (GHG) emissions from burning transport fossil fuels in order to mitigate climate change Biofuels have been considered a potential way to reduce the use of conventional petroleum products in order to reduce GHG emissions Crop-based feedstocks remove carbon from the atmosphere as part of photosynthesis during their lifetime and when they are converted to biofuels and burned in combustion engines they can propel a vehicle with no net production of GHGs Biofuels offer a less carbon-intensive transport fuel in a sector where renewable alternatives to transport fossil fuels are difficult for policy-makers to implement
As energy and climate policy has developed policy-makers have begun to implement emissions standards and life-cycle calculation methodologies for emissions savings for biofuels on the basis that different biofuel production pathways have different emissions savings and life-cycle emission costs Emissions have included those generated by chemical inputs and fertilizers fossil fuels used to run farm machinery and refineries and emissions from transporting the fuels from the point of production to the point of use Another source of emissions identified is land-use change linked to human activities such as deforestation resulting from new agricultural land needed to accommodate the increased production of biofeedstocks (Joint Research Centre 2010a Joint Research Centre 2010b) These emissions can be direct or indirect
11 Key Policies
111 EU Policies and Objectives The UK is obliged to comply with two principal EU Directives (1) the Renewable Energy Directive (RED) 200928EC (European Commission 2009a) which requires member states to meet 10 per cent of their transport energy demand from renewable sources by 2020 and (2) the Directive on the Quality of Petrol and Diesel Fuels (Fuel Quality Directive or FQD 200930EC) (European Commission 2009b) which requires that member states reduce the emissions intensity of their transport fuels by at least 6 per cent by 2020 Both the RED and FQD require biofuels to deliver emissions reductions of at least 35 per cent compared to fossil transport fuels From 2017 this target increases to 50 per cent and from 2018 it increases to 60 per cent for new biofuel production refineries Support is provided to biofuels on the basis that biofuels can deliver a range of public goods The key policy objectives of these directives are (a) reducing GHG emissions (b) promoting the security of energy supply and (c) providing opportunities for employment and regional development in particular in rural and isolated areas (European Commission 2009a)
copy 2013 The International Institute for Sustainable DevelopmentRESEARCH REPORT SEPTEMBER 2013Biofuels ndash At What Cost A review of costs and benefits of UK biofuel policies 4
112 UK Policies and ObjectivesIn November 2005 the Government of the United Kingdom announced the introduction of the Renewable Transport Fuel Obligation (RTFO) affirming that together with fuel duty incentives it would be the countryrsquos primary mechanism to deliver the objectives set out in the European Commissionrsquos Biofuels Directive (European Commission 2003)
The RTFO obliges suppliers of fossil fuels (if they supply over 450000 litres of petroleum per annum) to deliver a specified percentage of the road fuels they supply in the UK market as renewable fuels As well as requiring fuel suppliers to meet targets relating to the volumes of biofuels supplied the RTFO requires companies to provide reports on the carbon and sustainability of biofuels Administered by the Renewable Fuels Agency (RFA) until March 31 2011 when it was closed responsibility for managing the RTFO now rests with the UKrsquos Department for Transport (DfT) (Renewable Fuels Agency 2011)
113 Implementing Targets for Biofuel BlendingThe RTFO outlines the levels of obligation on a volume basismdashthat is to say the percentage of fuels that must come from biofuels The following percentages for blending biofuels with fossil fuels by volume were called for in the revised RTFO
bull 25 per cent in fiscal year (FY) 20082009
bull 325 per cent in FY 20092010
bull 35 per cent in FY 20102011
bull 4 per cent in FY 20112012
bull 45 per cent in FY 20122013
bull 475 per cent from 2013 and onwards (DfT 2013d)
If oil companies do not meet their obligation by delivering enough biofuels they pay a so-called buyout price currently set at 30 pence per litre (ppl) (NFPAS 2013b) The buyout price acts as a safety valve for suppliers unable to redeem enough Renewable Transport Fuel Certificates (RTFCs) to meet the required amount of blended biofuel (Kutas Lindberg amp Steenblik 2007) The RTFO currently allows suppliers to claim two RTFCs per litre for biofuels derived from waste products This double counting creates an incentive for suppliers to source these biofuels over agriculturally produced biofuels which may have undesirable impacts on food prices and lead to land-use change As a result of this incentive nearly all biodiesel currently supplied in the UK is derived from used cooking oil (UCO) and category one tallow (a type of tallow produced especially for energy production)
The RED sets targets by energy content rather than volume Products with lower energy content such as renewable fuels will require higher levels of consumption on a volumetric basis in order to achieve the same energetic value The energy density of biodiesel is around 90 per cent that of fossil-fuel diesel while for bioethanol it is only around two thirds that of petrol The number of litres of biofuel needed to travel a certain distance compared to if only fossil fuels were used goes up and can thus increase fuel costs for the motorist while also increasing tax revenue from the product if it is subject to excise taxation
The UKrsquos RTFO is based on a set of volume percentage targets In order to achieve the same percentage target for renewable energy use by energetic value additional biofuels will need to be consumed given their lower overall energy value (DfT 2009) The UK government is currently considering what policies will ensure that it meets the EUrsquos RED commitment of using 10 per cent renewable transport fuels by energy content (as opposed to overall volume) by 2020
copy 2013 The International Institute for Sustainable DevelopmentRESEARCH REPORT SEPTEMBER 2013Biofuels ndash At What Cost A review of costs and benefits of UK biofuel policies 5
On October 17 2012 a legislative proposal was tabled at the European Commission (EC) (European Commission 2012b) to limit food-based biofuels counting toward the EUrsquos 10 per cent target for renewable energy in transport at 5 per cent Separate from any decision at the EU level from April 15 2013 the UK blending target for all types of biofuels will be 475 per cent of total transport fuel volume
114 Objectives of this StudyThe study is set against the three key official objectives in EU directives that are used to justify the support given to the EU biofuel industry (1) reducing carbon emissions from transport (2) supporting rural development and (3) improving energy security This study analyzes the cost-effectiveness of this support
This study reviews a selection of costs and benefits associated with the use of biofuels that are linked to a wide range of stakeholders including motorists the general public taxpayers the biofuels industry itself and EU farmers Depending on the method used to assess biofuel use it may deliver a cost under one scenario and benefit under another Some costs of using biofuels are subsidizing the industry which can be paid for by taxpayers or motorists increased food prices due to the use of food-based biofuels which pushes up commodity prices2 higher motoring costs because biofuels are more expensive than fossil fuels at the pump and food-based feedstocks resulting in indirect land-use changes (ILUC) generating more emissions than they displace leading to biodiversity destruction or negatively affecting vulnerable people
Some of the benefits of using biofuels are their ability to displace the use of fossil fuels in order to improve energy security allowing countries to be less reliant on unstable oil imports for the refining of petrol and diesel a reduction in emissions from biofuels replacing dirty petroleum transport fuels employment creation in biofuel refining facilities other parts of the supply chain and the wider economy biofuel companies contributing to the tax base of governments through company tax returns the use of food-based feedstock crops improving farmersrsquo income via higher commodity prices production of co-products and bioethanolrsquos use as a fuel additive to improve vehiclesrsquo engine performance3
115 Methodology For empirical data used in this study there were a number of discrepancies found among different data sources European-level data sources such as Eurostat and the European Commission were used while national data came primarily from the DfT On issues such as biofuel production consumption and direct jobs preference was given to the data compiled by the industry associations (European Diesel Board ePure) and also used by Ecofys and EurObservrsquoER The authors reviewed the most frequently cited and recent studies looking at the range of available estimates and best available scientific research4 RTFO year four (April 15 2011 to April 14 2012) was the reference year for the study (at the time the study was being prepared it provided the most recent full year of data) with some 2011 calendar year data used in some calculations
2 A significant amount has been written on the effects of biofuels on food commodity prices but this report does not address this issue Ecofys Fraunhofer BBH EEG amp Winrock International (2013) found that between 2007 and 2010 EU-27 biofuel production may have contributed to relatively low amounts of between 1ndash2 per cent of wheat and coarse grain price increases and non-cereal food commodities by about 4 per cent This issue was outside the scope of this study
3 Some of these issues are explored in an earlier IISD research publication Biofuels ndash At What Cost A review of costs and benefits of EU biofuel policies (Charles Gerasimchuk Bridle amp Morenhout 2013) Additional information on these issues is available from intergovernmental organizations such as the Organisation for Economic Co-operation and Development (OECD) Food and Agriculture Organization of the United Nations the International Energy Agency (IEA) biofuel industry associations and a wide range of research organizations
4 When interpreting these estimates for policy the authors were guided by the Precautionary Principle which states that ldquowhen an activity raises threats of harm to human health or the environment precautionary measures should be taken even if some cause-and-effect relationships are not fully established scientificallyrdquo (Wingspread Conference on the Precautionary Principle 1998) This principle is legally binding for the EU and has taken the form of Article 191 of the Treaty on the Functioning of the European Union (Consolidated Version of the Treaty on the Functioning of the European Union 2008)
copy 2013 The International Institute for Sustainable DevelopmentRESEARCH REPORT SEPTEMBER 2013Biofuels ndash At What Cost A review of costs and benefits of UK biofuel policies 6
20 Background
21 The Role of Sustainability in UK PolicyUK policy-makers have identified two key factors in considering the impact of biofuels (1) biofuelrsquos ability to deliver emission reductions and (2) evidence that increased production of feedstocks affects food commodity prices The UK government has conducted extensive public consultations assessing the impacts of increasing the overall percentage of renewable transport fuels (DfT 2011a) There has been considerable debate on whether raising the biofuel blending mandate is the right decision especially given questions surrounding biofuelrsquos environmental and social impacts A major UK government investigation called the The Gallagher Review of the Indirect Effects of Biofuels Production identified that recent research on ILUC resulting from increased biofuel production had shown that ldquodisplaced agricultural production causes land-use change impact on both the greenhouse gas lifecycle emissions of biofuels and biodiversityrdquo (Gallagher 2008 p 7) The review also concluded that ldquobiofuels contribute to rising food prices that adversely affect the poorestrdquo (Gallagher 2008 p 9) and recommended that targets ldquohigher than 5 by volume (4 by energy) should only be implemented beyond 201314 if biofuels are shown to be demonstrably sustainable (including avoiding indirect land-use change)rdquo (Gallagher 2008 p 8) Consequently there are currently no stated plans to increase RTFO blending targets
22 Market Formation and Trends The market turnover5 of the UKrsquos biofuel industry is estimated at curren1 billion by EurObservrsquoER (2013 p 157) The UK biofuel industry has members within the Renewable Energy Association (REA) (REA 2013) representing British renewable energy producers and promoting the use of renewable energy in the UK
Based on EurObservrsquoER figures the UKrsquos bioethanol consumption in the 2011 calendar year was reported as 677 million litres while biodiesel consumption was 960 million litres (EurObservrsquoER 2013 p 65) The UK DfT publishes biofuel consumption data for financial years based on mandatory reports by fuel suppliers as part of the RTFOrsquos reporting conditions It also provides data based on feedstock country of origin estimated GHG savings and other sustainability data (Bailey 2013 DfT 2013d)
5 Turnover figures calculated by EurObservrsquoER are expressed in current euros and focus on the main economic investment activity of the supply chain (manufacturing distribution and installation of equipment plant operations and maintenance)
copy 2013 The International Institute for Sustainable DevelopmentRESEARCH REPORT SEPTEMBER 2013Biofuels ndash At What Cost A review of costs and benefits of UK biofuel policies 7
30 Support to the UK Biofuels Sector
31 PurposeThis section provides an assessment and quantified figure for the level of support provided to biofuel production and consumption in the UK The support estimate put forward here is principally for conventional biofuels
32 IntroductionThis section provides an assessment and quantified figure for the level of support provided to biofuel production and consumption in the UK The support estimate put forward here is principally for conventional biofuels but also refers to support for second-generation or advanced biofuels Identifying and measuring the various support mechanisms is a complex challenge Often the necessary data are not available either because member states do not report on their measures or because official statistical datamdashfor example on trade volumesmdashare not available
The Global Subsidies Initiative (GSI) method for estimating support is based on valuing individual support programs and a bottom-up approach The method aims to value individual policies or programs provided by policy-makers at different points in the production and consumption value chain The benefit of this approach is that it provides better information on who bears the costs of the policy and the potential beneficiaries For example it provides a financial value on the benefit of EU mandates for those biofuel producers selling into the EU biofuels market meanwhile measuring the cost of excise tax exemptions for biofuel consumption allows for a better understanding of the cost to taxpayers due to foregone revenue
There are other approaches to measuring subsidies such as that used by the International Energy Agency (IEA) and described further below The price-gap approach applied by the IEA is relatively less resource intensive and measures the cost of using biofuels by estimating the additional expense of ethanol and biodiesel per litre (multiplied by the amount of biofuels consumed in a given year and country) versus petrol and diesel Motoristsrsquo additional expenditure on biofuels is estimated as the cost of the policy or subsidy It does however mean the cost of individual policy instruments such as research and development (RampD) grants capital grants or special excise taxes are not valued nor are the beneficiaries of these policies clearly identified
The support estimate provided by GSI assesses a variety of policies (and identifies their beneficiaries) It is a broad estimate that should be considered for the wider biofuels industry or sector as opposed to specifically for biofuel producers
copy 2013 The International Institute for Sustainable DevelopmentRESEARCH REPORT SEPTEMBER 2013Biofuels ndash At What Cost A review of costs and benefits of UK biofuel policies 8
BOX 1 CONTEXTUALIZING THE NUMBERS SUBSIDIES TO BIOFUELS COMPARED TO SUBSIDIES TO OTHER ENERGY SOURCESAll energy sources in the world are subsidized Historically the most subsidized energy source is fossil fuels The IEA estimates that fossil-fuel consumer subsidies in non-Organisation for Economic Co-operation and Development (OECD) countries amounted to US$523 billion in 2011 (IEA 2012) while the GSI estimates fossil-fuel producer subsidies worldwide at US$100 billion (APEC Energy Working Group 2012) These estimates of fossil-fuel subsidy value do not include the non-internalized environmental externalities including the cost of GHG emissions to society Many countries introduced energy-efficiency measures subsidies to biofuels and renewable technologies among other objectives with the aim of creating public goods in the form of carbon emission reductions and to level the ldquoplaying fieldrdquo already distorted by subsidies to fossil fuels The high level of subsidies to fossil fuels and especially petroleum transport fuels poses barriers to introducing a diversified energy mix This is especially true in the transport sector because subsidies to fossil-fuel producers encourage the continued exploration and extraction of fossil fuels while consumer subsidies lower the price of the final product to consumers
UK support polices included a legally enforceable mandate to blend biofuels excise tax exemptions RampD grants to second-generation biofuels and previously some regionally focused support policies
BOX 2 THE MECHANICS OF BIOFUEL SUBSIDIES IN EUROPE In laymanrsquos terms the word ldquosubsidyrdquo is often thought to refer only to a direct transfer of funds from a government to a private actor In contrast under international law ldquosubsidyrdquo includes a wide range of preferential treatmentmdashfinancial and otherwisemdashthat governments provide to consumers and producers on various grounds Subsidies are often justified as public goods that the market has failed to create or as being temporary measures to enable maturation of new technologies and to create a larger market for subsidized products with the objective of reducing their cost and increasing their competitiveness over time (OECD 1996)
One of the most authoritative ldquosubsidyrdquo definitions is formulated in Article 1 of the Agreement on Subsidies and Countervailing Measures (ASCM) which has been agreed to by 155 members of the World Trade Organization and covers direct and indirect transfer of funds and liabilities various forms of tax relief RampD grants access to capital land water and public infrastructure at below-market rates and market and price support Notably in order to be considered a subsidy such preferential treatment has to be specific to a company or industry compared to other economic agents
Importantly for the subject matter of this report the ASCM definition does not include market price support induced through tariffs or mandates Meanwhile consumption mandates have become the main policy providing government support to biofuels in many countries
Therefore a number of stakeholders and experts including the IEA and the GSI consider the market price support enabled by consumption mandates to be a subsidy (Lang 2010 IEA 2011) Mandates act in the same way as other forms of support driving up market-clearing prices setting the demand floor and thereby improving competitiveness of biofuel producers (Koplow 2009a)
copy 2013 The International Institute for Sustainable DevelopmentRESEARCH REPORT SEPTEMBER 2013Biofuels ndash At What Cost A review of costs and benefits of UK biofuel policies 9
33 UK Support Measures
331 Market TransfersMarket price support broadly measures the intervention affecting both consumer and producer prices by artificially elevating the price of biofuels In the EU mandatory blending rates and border protection through tariffs are among the most important instruments (European Commission 2011a) The former establishes mandatory requirements for the share of biofuels in transport fuels sold whereas the latter aims at protecting European production of biofuels through tariffs on biofuel imports A mandate allows biofuel producers to overcome technical or other barriers imposed by primary fuel suppliers who may object to the use of biofuels while also providing long(er)-term targets thus enhancing the predictability of market developments and reducing investment risks As mandates put upward pressure on wholesale biofuel clearing prices (the price at which a market clears or sells its product) the beneficiaries of this policy are biofuel producers who are able to sell into the EU market at an elevated price if the mandates were reduced or removed As biofuels are currently more expensive to produce than fossil fuels the additional costs at the pump are borne by consumers
Market size (the total value of transactions) can be estimated by measuring the total production or consumption of biofuels and some measure of the market price To put the following market price support estimates in context the 2011 market size of the UKrsquos ethanol industry was estimated at pound379 million6 and the biodiesel market at pound725 million7
Valuing the support provided to the biofuels sector from mandates is challenging This paper recognizes that there is a range of factors other than blending mandates that may affect EU wholesale biofuel prices (such as higher production costs sustainability costs and tariffs on imported biofuels) and hence this is an initial effort to put forward a preliminary assessment of the level of market price support provided via blending mandates in the UK
6 Ethanolrsquos industryrsquos market size in the UK in 2011 was calculated as the number of litres of ethanol consumed (698 million) (source (DfT 2013c DfT 2013d) multiplied by an average EU price per litre price for ethanol (pound054 per litre) (source OECD amp Food and Agriculture Organization 2011)
7 Biodiesel industryrsquos market size in the UK in 2011 was calculated as the number of litres of biodiesel consumed (933 million) (source (DfT 2013c DfT 2013d) multiplied by an average EU price per litre price for ethanol (pound078 per litre) (source OECD amp Food and Agriculture Organization 2011)
copy 2013 The International Institute for Sustainable DevelopmentRESEARCH REPORT SEPTEMBER 2013Biofuels ndash At What Cost A review of costs and benefits of UK biofuel policies 10
BOX 3 METHODOLOGICAL NOTE ON ESTIMATING THE SUPPORT PROVIDED BY MEMBER STATE CONSUMPTION MANDATESThe level of support provided by the consumption mandates is assessed from the viewpoint of a theoretical producer of biofuel (whether located inside or outside the EU) A biofuel producer will identify the best market to sell their product based on a range of factors but principally it will be determined by the price they are able to secure In the EU prices for bioethanol and biodiesel are higher than average world prices hence a biofuel producer will factor in transport costs for their product and then estimate the profit they could make from selling into the EU market The higher price for biofuel in the EU represents demand (and supply) forces This analysis attempts to estimate the value of biofuel consumption mandates introduced by member states (the consumption mandates help establish a market for biofuels) while recognizing there is a range of other factors affecting biofuel clearing prices (these are discussed further below) The value of consumption mandates implemented by EU member states in support of bioethanol and biodiesel consumption is estimated in this report as the difference between the EU wholesale price for biofuels and a world reference price minus an adjustment for freight costs The amount of support estimated is very sensitive to changes in either world or EU reference prices8 See Koplow (2009b) for a deeper discussion on the challenges in applying a price-gap methodology
Limitations to this Analysis
There are a number of factors that complicate this method of assessment There may also be a range of other factors pushing up (or down) EU wholesale market prices that are not accounted for in this method These may include
bull EU biofuel production costs will be higher than production costs in non-EU countries due to a range of factors including higher energy costs salaries and health and safety compliance etc
bull The extent to which the EU market prices contribute to world reference prices will also affect any price-gap calculations While bioethanol produced in the EU is a small part of the world market (as an average during 2008ndash2010 bioethanol was around 6 per cent of world production) biodiesel produced in Europe forms a significant part of the global biodiesel market (as an average during 2008ndash2010 around 52 per cent of world production9) (OECD amp Food and Agriculture Organization 2011)
bull Sustainability costs involving administrative and reporting requirements to meet EU regulations can result in additional operational costs pushing up EU biofuel prices as opposed to upward pressure from blending mandates These costs can push up EU prices and the theoretical size of support provided by the mandates (Charles amp Wooders 2011)
bull Imported biofuel from outside of the EU is subject to border taxes such as taxes on undenatured bioethanol of curren019 and curren010 on denatured and import duty on biodiesel (65 per cent ad valorem) (Ecofys amp German Union for the Promotion of Oils and Protein Plants 2012) The effect of EU tariffs or anti-dumping duties on bioethanol and biodiesel while correcting unfair market situations also pushes up the costs of imported biofuels thereby increasing EU biofuel prices and increasing the size of the price-gap and the support value
bull There could also be a range of other policies or market forces affecting wholesale market prices
Due to the complexity of these forces acting on EU whole market prices they were not accounted for as part of the method for measuring market price support
8 Reference prices both EU and world wholesale biofuel market prices used in this report to measure the size of market price support vary slightly from wholesale biofuel reference prices applied in IISDrsquos 2013 study (Charles Gerasimchuk Bridle amp Morenhout 2013) which may reflect any differences in support estimates
9 Based on average volumes between 2008ndash2010
copy 2013 The International Institute for Sustainable DevelopmentRESEARCH REPORT SEPTEMBER 2013Biofuels ndash At What Cost A review of costs and benefits of UK biofuel policies 11
Market price support for bioethanol was calculated by multiplying production and imports figures by a price gap of between pound006-010 ppl (the difference between EU bioethanol wholesale average price of pound050-05410 per litre and the world bioethanol average price pound041 of per litre minus transport and handling charges)
TABLE 1 MARKET PRICE SUPPORT TO BIOETHANOL 20112012
20112012UK production of fuel ethanol (million litres) 33
UK fuel ethanol imports (litres) 665
EU ethanol wholesale average price (poundlitre) 050-054
World ethanol average price (poundlitre) 041
Transport and handling charges Brazil to the EU (poundlitre) 003
UK price gap (poundlitre) 006-010
Market price support-production (million pound) 2-3
Market price support-imports (million pound) 40-69
Total Market price support (million pound) 42-72
Currency conversions OECD World ethanol price of US$06441 converted to EUR at a rate of US$1 = curren072 as applied in other GSI country reports then converted to GBP at a rate of curren1 = pound0862 OECD EU ethanol price provided in local currency [EUR] converted into GBP at curren1 EUR = pound0862 Currency conversion rates are average rates for 2011 drawn from wwwoandacom
SourcesBioethanol production statistics source DfT (2013d)Bioethanol imports source Authorrsquos calculations (consumption for 20112012 minus 2011 production figures)Bioethanol consumption source DfT (2013d) DfT (2013c)EU bioethanol wholesale average price source OECD amp Food and Agriculture Organization (2011)World bioethanol wholesale average price source OECD amp Food and Agriculture Organization (2011)Transport and handling charges Brazil to the EU (poundlitre) source (personal communication with Brazilian bioethanol expert February 2013) 0035 pence per litre for shipping bioethanol from Brazil to Europe was used as a proxy for distribution costs which would need to be paid by the bioethanol producer (personal communications with Brazilian bioethanol expert 2013) It is possible that this is a lower-bound estimate with shipping costs from Brazil to Europe being higher depending on conditions which would reduce the price-gap figure and the level of support via the mandates to bioethanol
Market price support for biodiesel was calculated by multiplying production and import figures by a price gap of pound016ndashpound022 per litre (the difference between EU biodiesel wholesale average price of pound072ndashpound07811 per litre and the world bioethanol average price of pound052 per litre minus transport and handling charges)
10 A sensitivity analysis was provided for the EU wholesale ethanol price to develop a range estimate11 A sensitivity analysis was provided for the EU wholesale ethanol price to develop a range estimate
copy 2013 The International Institute for Sustainable DevelopmentRESEARCH REPORT SEPTEMBER 2013Biofuels ndash At What Cost A review of costs and benefits of UK biofuel policies 12
TABLE 2 MARKET PRICE SUPPORT TO BIODIESEL 20112012
2011 2012UK production of biodiesel (litres) 155
UK biodiesel imports (litres) 778
EU biodiesel wholesale average price (poundlitre) 072-078
World biodiesel average price (poundlitre) 052
Internal domestic transport and handling charges (poundlitre) 0035
UK price gap (poundlitre) 016-022
Market price supportmdashproduction (million pound) 25-35
Market price supportmdashimports (million pound) 128-175
Total Market price support (million pound) 153-209
Currency conversions Ecofys world Biodiesel price of US$0822l converted to EUR at a rate of US$1 = curren072 as applied in other GSI country reports then converted to GBP at a rate of curren1 = pound0862 Currency conversion rates are average rates for 2011 drawn from wwwoandacom
Note There may be significant variation in the Biodiesel World Reference Price depending on the data source The Ecofys Biodiesel world reference price was selected as it was part of a global review of world biodiesel markets and appeared to be most recent assessment of world biodiesel prices available
SourcesSource DfT (2013d)Source Authorrsquos calculations (consumption for 20112012 minus 2011 production figures)Source BigOilnet (2012)Source Ecofys amp German Union for the Promotion of Oils and Protein Plants (2012 p 82)Source authorrsquos calculations 0035 ppl for biodiesel distributed within Europe was used as a proxy for distribution costs which would need to be paid by the biodiesel producers
332 Budgetary Support Linked to Volume Produced or Consumed To decrease the end price of biofuels to consumers and make them similar to the prices of the conventional petroleum-based fuels European governments have introduced fiscal incentives for the commercialization of biofuels
In 2008 the fuel duty rate was simplified to a single rate for diesel and two rates for petrol The fuel duty charged on both biodiesel and ethanol decreased slightly to 20 ppl After April 1 2010 the preferential rates of duty for biofuels ended with ethanol and biodiesel taxed at the same per-litre rate as petrol and diesel However biodiesel produced from used cooking oil was the exception which benefited from an exemption of 20 ppl for another two years up until March 31 2012 Table 3 sets out the level of support provided in 2011 (Her Majestyrsquos Revenue and Customs [HMRC] 2013)
TABLE 3 UK TRANSPORT FUEL EXCISE TAXES RATES FOR BIODIESEL MADE FROM UCO AND CONSUMPTION LEVELS 2011
20112012 BIODIESEL FROM UCO 2011
Quantity consumed (million litres)
Diesel excise tax (poundL)
UCO biodiesel excise tax (poundL)
Excise tax exemption (poundL)
Loss of fiscal revenue
(million pound)
800 068 048 020 161
Source DfT (2013d) HMRC (2013)
copy 2013 The International Institute for Sustainable DevelopmentRESEARCH REPORT SEPTEMBER 2013Biofuels ndash At What Cost A review of costs and benefits of UK biofuel policies 13
333 RTFCsUnder the RTFO fossil-fuel suppliers are required to blend a percentage of fuels for road transport supplied in the UK from renewable sources that are deemed sustainable or ldquothat a substitute amount of money is paidrdquo (DfT 2013a) All fuel suppliers (suppliers of fossil fuels and biofuels) that supply at least 450000 litres of fuel per year are obligated to participate under the scheme Companies owning biofuels at the point where duty would normally be paid are awarded one RTFC per litre of biofuel or kilogram of biomethane supplied (DfT 2013a) Fuels produced from certain feedstocks (such as wastes and residues as well as those from lignocellulosic and non-edible cellulosic material) are eligible for double countingmdashthat is to say they earn two RTFCs Any company in possession of biofuels including biofuel producers may claim certificates that can potentially be sold to obligated companies that may then use them to meet their obligation target Any companies unable to provide the correct number of RTFCs to match their blending obligation must pay a buy-out price of 30 ppl (DfT 2013a) As noted by the DfT the ldquopotential income stream represented by the awarding of RTFCs will become the main government support mechanism for biofuels in the UKrdquo (DFT 2013a)
Based on DfT data in RTFO year 4 19 billion certificates were issued with about 874 million traded between all parties The majority of trading took place between obligated fossil-fuel companies (those companies having to blend biofuels) with biofuel companies only redeeming and trading a small number of certificates Biofuel companies are likely only selling small volumes of biofuels directly into the fuels market for consumption (and owning the biofuels at the point custom duty is due) so they can claim certificates Table 4 contains the number of certificates traded by biofuel companies (a subset of the total 874 million certificates traded between all parties) to other biofuel companies12 or fossil-fuel and biofuel producing and distributing companies13 applying an average price of pound013 per certificate (NFPAS 2013a) The trading of RTFCs theoretically provides a small amount of additional revenue to biofuel companies14 This paper recognizes the RTFC system is not principally designed to incentivize biofuel production but under some circumstances it can provide an additional revenue stream to biofuel producers as acknowledged by the DfT Due to the complexity of the transport fuels market and the RTFC allocation and trading system this is only an illustrative example of a potential revenue stream for biofuel producers resulting from this trading system
TABLE 4 SUPPORT PROVIDED THROUGH RTFCS FOR RTFO YEAR 4 (20112012)
20112012 RTFCS TRADED BY
BIOFUEL COMPANIES TO OTHER PARTIES (MILLION)
RTFO YEAR 4 AVERAGE RTFC
PRICE (pound)
LEVEL OF SUPPORT
(MILLION pound) 27 013 35
SourcesRTFCs issued during RTFO year 4 (April 2011 to April 2012) of which 284 million were double counting from biodiesel produced from UCO resulting in an additional 284 million RTFCs being issued Source DfT (2013b 2013d) Source NFPAS (2013a)
12 The HMRC code HO930 is used for biofuel companies 13 The HMRC code HO10 is used for fossil fuel and biofuel-producing and distributing companies14 The challenges are measuring the value of the potential support calculating the exact price or value of the RTFC and that companies may
hold over or bank 25 per cent of RTFCs into the following year For this analysis the number of RTFCs issued in RTFO year 4 and an average price is taken as a proxy to estimate the additional potential revenue
copy 2013 The International Institute for Sustainable DevelopmentRESEARCH REPORT SEPTEMBER 2013Biofuels ndash At What Cost A review of costs and benefits of UK biofuel policies 14
334 Summary of Subsidies to BiofuelsTable 5 summarizes the potential support provided to the UK biofuels sector in 20112012 through RTFCs excise tax exemptions and blending mandates15
TABLE 5 SUMMARY TABLE OF BIOFUEL SUPPORT PROVIDED IN RTFO YEAR 4 (20112012)
RTGO YEAR 4 (20112012) ETHANOL BIODIESEL TOTALSExcise Tax exemptions (UCO biodiesel production) (million pound)
161 161
Market price support through RTFO blending mandates (million pound)
42ndash72 153ndash209 195ndash281
RTFCs (million pound) 175 175 35
Total subsidy (million pound) 44ndash74 315ndash371 359ndash445
UK biofuel consumption (million litres) 698 933 1631
Summary numbers rounded to the nearest million GBP When summed rows or columns may show some variation due to rounding
15 The cost of the RTFO policy based on a 5 per cent biofuel target was estimated by Chatham House (p 22 2013) to be pound460 million in the 20132014 fiscal year This assessment was based on the additional costs to ethanol and biodiesel motorists versus the cheaper conventional fuels they replace
copy 2013 The International Institute for Sustainable DevelopmentRESEARCH REPORT SEPTEMBER 2013Biofuels ndash At What Cost A review of costs and benefits of UK biofuel policies 15
40 Single Payment Scheme
41 PurposeThis section estimates the size of agricultural payments under the Single Payment Scheme (SPS) provided to farmers growing food crops based on their end consumptive use whether it is for food or biofeedstock markets
42 Introduction UK farmers are eligible for subsidies under the SPS sometimes referred to as the Single Farm Payment Scheme which is part of the EUrsquos Common Agricultural Policy (CAP) Introduced in 2005 the SPS was part of the CAP reforms designed to decouple subsidies from production-related aid and allows farmers greater freedom to switch to alternative enterprises such as bioenergy crop production The aim of the regulation was also to help simplify and modernize CAPrsquos administration (Europa 2009) There are no specific SPS payments or schemes to support biofeedstock production rather annual energy crops grown for biofeedstock production (eg oilseed rape sugar beet and cereals) are eligible for the SPS payment as are other crops that meet the necessary SPS regulations (Business Link UK 2011) Our analysis does not infer that the SPS payments are a direct subsidy or transfer to the biofuels industry Instead we have calculated the portion of the SPS payments going to farmers growing energy crops in order to better understand how the CAP is spent and the type of cropping activities it supports This will help to support better policy making Hence knowing what percentage of SPS payments accrue to farmers for growing crops destined for the biofuels market versus crops destined for food or feed markets is of public benefit
Average SPS per-hectare rates are based on European Parliament figures (see Table 14 European Parliament 2010) which estimate a flat per-hectare rate for each member state and for the EU as a whole for the year 2013 (after a number of CAP reforms have been implemented)16
The following formula was applied to determine the level of SPS payments provided to farmers growing crops for biofuel production
Hectares used for biofeedstock production per annum X SPS per hectare rate =
SPS payments for UK biofeed production per annum
16 The number of hectares of arable land used for biofeedstock production may be underestimated in certain cases as a result of a lack of data SPS payments may also be overestimated as this calculation does not take into account the production of co-products from biofuel production
copy 2013 The International Institute for Sustainable DevelopmentRESEARCH REPORT SEPTEMBER 2013Biofuels ndash At What Cost A review of costs and benefits of UK biofuel policies 16
43 Results
Table 6 shows the amount of land being used to grow biofeedstocks and the SPS payments that have accrued to farmers for this activity
TABLE 6 SPS PAYMENTS TO AREAS USED FOR BIOFEEDSTOCK PRODUCTION
COUNTRY HA FEEDSTOCK YEAR (HA) AVERAGE (EURHA)1 TOTAL (EUR MILLION)
European Union 36000002 2008 266 958
United Kingdom 729183 2010 247 18
Sources 1 European Parliament (2010) 2 Ecofys Agra CEAS Chalmers University IIASA amp Winrock (2011) 3 Government of the United Kingdom (2011)
This section summarizes the distribution of SPS payments based on the quantities of land used to produce biofeedstocks noting that SPS payments are not used to promote energy crops directly and are available to farmers regardless of cropsrsquo final end use Based on available cropping data for 2010 curren18 million in farm payments went to the farmers growing crops that went to biofuel production Of this figure around curren125 million in SPS payments went to farmers growing biodiesel feedstock and around curren55 million to farmers producing ethanol feedstock The amount of SPS payments provided to farmers growing crops channelled to food or other markets was not calculated
copy 2013 The International Institute for Sustainable DevelopmentRESEARCH REPORT SEPTEMBER 2013Biofuels ndash At What Cost A review of costs and benefits of UK biofuel policies 17
50 Emission Reductions
51 PurposeThis section estimates the amount of direct and indirect emissions from biofuels based on UK government biofuel consumption data and European Commission emission factors generating carbon abatement costs for ethanol and biodiesel
52 IntroductionEmissions from biofuels can be broadly split up into two categories (1) direct emissions from the cultivation processing and transport of biofuels including direct land-use change and (2) emissions from ILUC associated with growing biofuel feedstock crops (European Commission 2012a) This section assesses emissions and emission savings associated with the following fuels and feedstocks non-land-using biodiesel (produced from tallow and used cooking oil) conventional biodiesel (produced from virgin vegetable oils) and bioethanol It is based on biofuel consumption in the UK for the 2011ndash2012 fiscal year
53 MethodologyThe amount of emissions produced or saved depends to a large extent on which crop or feedstock source is being used to produce the biofuel and the life-cycle emissions profile associated with its production In most European countries there is a lack of data on what types of feedstock biofuels consumed in the EU are derived from The UK government however does provide a good level of information under the requirements of the RTFO annually publishing the volume of biofuels consumed and the types of feedstock upon which their production had been based
This analysis estimates the amount of emissions and emissions savings for FY 2011ndash2012 based on actual consumption data and for the 2020 calendar year based on projections of biodiesel and bioethanol consumption in the UKrsquos National Renewable Energy Action Plan (NREAP) (Beurskens Hekkenberg amp Verthman 2011)17 The consumption figures for FY 2011ndash2012 in energy terms amounted to 43 billion megajoules (MJ) For biodiesel for the year 2020 we assumed a business-as-usual scenario from the first half of the financial year 2012ndash2013 as a result 100 per cent of biodiesel consumption through until 2020 is based on biodiesel produced from UCO and tallow However this assumption could be undermined by specific concerns relating to UCO biodiesel (see below) and the fact that the principal policy support from biodiesel made from UCO and for UCO (double counting) may be adjusted
For estimates of direct emissions from biofuels the assessment relied on the emission factors used by the European Commission in its October 17 2012 proposal to amend the Fuel Quality Directive (FQD) and the Renewable Energy Directive (RED) (European Commission 2012b) To estimate biofuel-associated emissions from ILUC the analysis used central ILUC factors proposed by the European Commission in the same proposal The European Commission uses a zero ILUC factor for biodiesel produced from UCO and tallow feedstocks These factors are based on the Laborde (2011) study which the European Commission considers best available science in the area of ILUC-modelling (European Commission 2012a)
17 It should be noted that with the pending proposal to cap food-based biofuels and potential legislative changes of EU biofuels policy consumption levels may change affecting the accuracy of the business-as-usual scenario projections
copy 2013 The International Institute for Sustainable DevelopmentRESEARCH REPORT SEPTEMBER 2013Biofuels ndash At What Cost A review of costs and benefits of UK biofuel policies 18
TABLE 7 DIRECT INDIRECT AND TOTAL EMISSIONS ASSOCIATED WITH UK BIOFUEL CONSUMPTION IN 2011 AND 2020 (IN MILLION TONNES CARBON DIOXIDE EQUIVALENT)
DIRECT EMISSIONS ILUC EMISSIONS TOTAL EMISSIONS
2011 2020 2011 2020 2011 2020Non-land-using biodiesel 024 096 0 0 024 096
Conventional biodiesel 014 0 018 0 031 0
Ethanol 048 191 017 088 065 279
Total 085 287 035 088 120 375
Source Authorrsquos calculations
In FY 2011ndash2012 the UK consumed about twice as much biodiesel as bioethanol Emissions from biodiesel consumption in the UK market are not necessarily much higher than those of bioethanol as a result of the use of tallow and UCO for biodiesel which has a zero ILUC factor and a direct emissions factor that is lower than other types of biodiesel feedstock Conventional biodiesel however is more emissions intensive in terms of direct emissions and particularly ILUC emissions Bioethanol is generally less emissions intensive than conventional biodiesel This is true for direct emissions but even more so for ILUC emissions in which bioethanol emits an amount of carbon dioxide about four times less per unit of energy than conventional biodiesel (Laborde 2011)
54 Direct EmissionsIn terms of direct emissions biofuels consumed in the UK were responsible for 085 million tonnes of carbon dioxide equivalent (Mt CO
2e) more than half of that was associated with bioethanol given the low emissions from biodiesel
produced from UCO When projecting forward to 2020 UKrsquos NREAP clearly demonstrates that the proportion of bioethanol in total biofuel consumption is set to increase That means biofuels will be responsible for direct emissions of around 29 Mt CO
2e by 2020 of which 19 Mt is associated with bioethanol and about 1 Mt with biodiesel from
UCO and tallow
55 ILUC-Related EmissionsWhat is ILUC
ILUC refers to the displacement of farming for feed or food production to other areas as a result of arable land being used for biofuel feedstock production Simply put when the use of arable land in the EU shifts from food or feed production to the production of biofeedstocks and food or feed demand patterns do not change extra crops grown on additional land is needed to meet that demand and substitute for biofeedstocks diverted to biofuel production (Joint Research Centre 2008 2010a)
This additional demand is often met by increasing the cultivation of food or feed crops in jurisdictions outside of the EU for subsequent exportation to the EU market When carbon sinks such as forests and peatlands are cleared for such production indirect emissions as a result of EU biofuel policies occur (Joint Research Centre 2008 Joint Research Centre 2010b) In particular vegetable oil markets are globally linked and thus prone to ILUC Direct and indirect LUC are not phenomena exclusive to biofuels Agricultural and trade policies among others can have significant land-use change effects
copy 2013 The International Institute for Sustainable DevelopmentRESEARCH REPORT SEPTEMBER 2013Biofuels ndash At What Cost A review of costs and benefits of UK biofuel policies 19
Measuring or observing the exact extent of ILUC is not possible as feedstock producers cannot measure land-use change patterns in different parts of the world however it is possible to model some estimates (di Lucia Ahlgren amp Ericsson 2012) This analysis estimates ILUC-associated emissions in line with the European Commissionrsquos proposal for biofuel emission reporting (European Commission 2012b) The European Commission relies on ILUC factors developed by Laborde (2011)
Background on the International Food Policy Research Institute Model
The Laborde (2011) study is built upon a general equilibrium model that is based on future projections of agricultural productivity biofuel policies and international trade Such projections are based on assumptions that are subject to a wide degree of uncertainty (Joint Research Centre 2008 Laborde 2011) The most advanced modelling exercise to date was performed by the International Food Policy Research Institute (IFPRI) To reduce uncertainty IFPRI performed 1000 rounds of Monte Carlo simulations in which they scrutinized a sensitivity analysis of seven parameters that have the most important effect on the supply side of the model
Some Key Issues
Uncertainty relating to the projected results is the main reason why models are often criticized Like any model the IFPRI model is imperfect As the author himself recognizes there is room for improvement with regards to assumptions related to land-use expansion and substitution Uncertainties related to additional land needed are both independent from and dependent on policies (Laborde 2011)
Other issues have included whether the model sufficiently accounts for the protein content of biofuel co-products and that palm oil is modelled as a perennial crop Consequently the reporting factors in the proposals are criticized for being inaccurate The French National Institute for Agricultural Research (2013) recently published a report stating assumptions on crop yields for biodiesel feedstocks may be lower than actually observed
One such issue relating to policy assumptions is how the modelled emissions are partially dependent on the assumption that increased palm oil production will take place on peatland forest areas in countries like Indonesia and Malaysia According to Delzeit (2012) this is formally illegal according to Indonesian law and the assumption is dependent on political factors such as the non-enforcement of existing regulations A review of the Indonesian moratorium on new forest concessions found that there have in fact been clearings in primary forest in spite of the moratorium In addition the moratorium only applies to new concessions and it excludes secondary forests which are also large carbon sinks (Union of Concerned Scientists Greenpeace and World Resources Institute 2012) Similarly one could argue that IFPRIrsquos numbers are underestimated as they assume higher yields in the baseline than most other ILUC models (Marelli 2013)
The use of Labordersquos ILUC factors for consumption in 2011 may also raise some questions because the ILUC factors in that study are for the year 2020 based on an increase in biofuel consumption relative to a 2008 baseline In this regard it is important to note that as part of the sensitivity analysis mentioned above the European Commission requested that Laborde investigate the linearity of the ILUC factors As the European Commission points out in its impact assessment accompanying the proposal it should be noted that some crops with a strong non-linearity effect will indeed have a lower ILUC factor at lower consumption volumes (European Commission 2012a) This is particularly the case for vegetable oils like rapeseed
Nevertheless based on the Laborde analysis the European Commission still regarded the factors as the best available approach to estimate ILUC-related emissions of all biofuel consumption today This is therefore the approach
copy 2013 The International Institute for Sustainable DevelopmentRESEARCH REPORT SEPTEMBER 2013Biofuels ndash At What Cost A review of costs and benefits of UK biofuel policies 20
our study follows until a more sound methodology is developed and published in an authoritative source We do advise that the uncertainties related to an ILUC emissions estimation for the year 2011 are taken into account when considering the results of our study18
56 Estimated ILUC EmissionsIn 2011 ILUC emissions associated with UK biofuel consumption were around 035 Mt CO
2e of which almost 020 Mt
was from biodiesel These numbers are indicative of the high ILUC emissions associated with virgin vegetable oil use for biofuel production while the consumption of conventional biodiesel represented only 18 per cent of conventional biofuels use it was responsible for a similar amount of ILUC emissions as bioethanol which represented 82 per cent of conventional biofuels In 2020 only bioethanol will be responsible for ILUC emissions as we assume that since the second half of 2012 100 per cent of biodiesel has been produced from tallow and UCO
57 Total EmissionsTotal emissions associated with biofuel consumption in the UK totalled a little over 12 Mt CO
2e in 2011 of which 035
Mt was related to ILUC Eighty per cent of these total emissions come from conventional biodiesel and bioethanol however they only accounted for 40 per cent in terms of energy supply In terms of biofuel use UCO and tallow perform much better according to current accounting rules
Current ILUC accounting rules for biofuels from waste products may disregard certain ILUC associated with an increase in demand for these waste products due to their increased value Bailey (2013) points to potential indirect effects related to a wide variety of other products using tallow such as soap and animal feed Chatham House analysis uses research by Brander et al (2009) who estimated that tallow-produced biodiesel would lead to more modest emission decreases and could even be responsible for slight net emission increases Bailey concludes that at higher usemdashwhich is expected toward 2020mdashthe risk of ILUC emissions increases and ldquomay already be materialrdquo This would alter the entire emission balance of UK biodiesel which under current accounting rules appears very positive at this moment
For UCO potential indirect effects are mainly related to its rising price Double counting of UCO makes waste oil more attractive and pushes up the prices If these prices are higher than refined palm oil prices and if the price differential is sufficiently large it is theoretically possible that market participants will import more palm oil which is consumed quickly and wastefully to be resold as waste oil (UCO) for biofuel production In FY 2011ndash2012 only 17 per cent of UCO came from the UK 42 per cent came from within Europe and another 20 per cent from North America Small amounts came from different places in the world and around 20 per cent had unknown origins This is particularly concerning since the origin of UCO is the first step in being able to guarantee that UCO is indeed waste oil and not either virgin oil or virgin oil wastefully and quickly consumed to be resold as UCO
18 For di Lucia Ahlgren and Ericsson (2012) the Precautionary Principle implies the selection of high ILUC factors to guide policy-making that aims to improve the certainty that no negative ILUC occurs The choice of factors from central values would imply a preventative approach which aims at reducing the risk of negative ILUC but has less certainty of its success than higher values Our analysis is in line with the approach of the European Commission based on central ILUC factors
copy 2013 The International Institute for Sustainable DevelopmentRESEARCH REPORT SEPTEMBER 2013Biofuels ndash At What Cost A review of costs and benefits of UK biofuel policies 21
58 Emissions Savings from UK Biofuels
Once the total emissions associated with biofuel consumption have been calculated the next step is to estimate whether biofuels are responsible for net emissions savings or not To do this one estimates what level of emissions would be emitted if fossil fuels were used to cover an equal transport energy demand In line with the European Commission (2012a) the analysis used a fossil-fuel comparator of 903 grams per MJ
The results indicate a large difference between conventional biodiesel and bioethanol Conventional biodiesel typically is responsible for a slight net emission increase while bioethanol is responsible for some emission reductions In 2011 they were a little over 06 Mt CO
2e As projected in the UKrsquos NREAP an increase in bioethanol consumption could
lead to savings of almost 4 Mt CO2e in 2020
Tallow-based biodiesel and UCO perform very well in terms of emissions savings given their low direct emissions and zero ILUC emissions factor At least this is the case if they are genuinely waste which is not guaranteed In our calculations however we assumed they were genuine waste In 2011 these types of biodiesel were then responsible for over 2 Mt CO
2e of emissions savings In 2020 if UCO and tallow provided 100 per cent of biodiesel consumed in
the UK the emission savings potential goes up to over 8 Mt CO2e
FIGURE 1 EMISSIONS SAVINGS FROM BIOFUEL USE IN THE UKSource Authorrsquos calculations based on DfT (2013d) Beurskens Hekkenberg amp Vethman (2011) European Commission (2012a)
copy 2013 The International Institute for Sustainable DevelopmentRESEARCH REPORT SEPTEMBER 2013Biofuels ndash At What Cost A review of costs and benefits of UK biofuel policies 22
59 Carbon Dioxide Abatement Costs
The abatement cost estimates how much it costs for a given technology to reduce 1 tonne of CO2e from the
atmosphere in order to mitigate climate change The abatement cost is only calculated for 2011 as this study does not provide biofuel subsidy estimates for 2020 Based on this approach abatement costs are highly dependent on subsidy estimates which can be calculated using a variety of methodologies and may vary significantly (they can also change from year to year depending on the policies assessed and estimation method adopted) The abatement cost figure in this study is on a support-cost basis in which costs have been calculated using a bottom-up approach (see chapter 3 Support to the UKrsquos Biofuels Sector) Another method to calculate abatement costs is based on an economic or fossil-fuel reference in which the baseline against which the RTFO would be set is not international biofuel prices but rather fossil energy prices Generally this methodology results in higher abatement costs19
In 2011 bioethanol had an estimated abatement cost of around pound115 (curren132) per tonne CO2 abated (the overall level of
support divided by the amount of carbon avoided to provide a per-tonne carbon abatement cost)
Conventional biodiesel is very different from non-land-using biodiesel such as UCO and tallow Since 90 per cent of biodiesel consumed in the UK is UCO based the portion of the market price support estimate (the level of subsidy provided by blending mandates and estimated in chapter 3 Support to the UKrsquos Biofuels Sector) has been allocated to UCO-produced biodiesel consumption given that it is the main source of biodiesel used (effectively the cost part of the equation received a proportion of the subsidy estimate split by the level of consumption) In addition UCO-based biodiesel received an excise tax exemption of pound02 per litre As a result UCO-based biodiesel has an abatement cost of around pound154 (curren178)20 per tonne of CO
2 abated It should be noted that this figure is based on a
cost-calculation that still includes the pound020 per litre excise tax exemption for UCO This tax exemption represented pound161 million in support out of the total support of pound315 million to pound371 million for UCO-based biodiesel in 2011 Therefore abatement costs for UCO-based biodiesel without the excise tax exemption are significantly lower
On average biofuel use including the net emissions increase from conventional biodiesel use in FY 2011 results in an overall net abatement cost of around pound165 (curren189) per tonne of CO
2 abated in the UK21
19 One example of such an approach for the calculation of abatement costs for biofuels in the UK can be found in Bailey (2013) 20 Abatement costs are converted from GBP to EUR based on average 2011 exchange rates 21 While this analysis estimates the cost of carbon abatement further analysis would be valuable to assess the cost of carbon if no action on climate
change was undertaken
copy 2013 The International Institute for Sustainable DevelopmentRESEARCH REPORT SEPTEMBER 2013Biofuels ndash At What Cost A review of costs and benefits of UK biofuel policies 23
60 Employment Creation
61 PurposeThis section provides a review of employment estimates generated for the UK biofuels sector and the geographical distribution of jobs within the UK
62 Introduction In a time of economic recession the UK government like many EU governments considers the potential impacts of biofuel and energy-sector policy options on employment As this section illustrates if job creation is considered an important objective for supporting the development and deployment of biofuels the level of detailed information available on employment effects is probably inadequate
BOX 4 BIOFUEL PRODUCTION WHAT TYPES OF JOBS ARE BEING CREATED The biofuel industry involves the construction of biofuel plants which can provide short-term construction-related jobs including labourers civil works personnel surveyors structural engineers quantity surveyors and electricians (Kretschmer B et al 2013 p 45 Greene amp Wiley 2012)
Once the plants are completed examples of jobs in general administration and management include plant and operations managers office administrators health and safety managers environment officers labourers financial accounting staff feedstock purchasers marketing and logistics personnel (IEEP 2011 p 45 Greene amp Wiley 2012)
Liquid biofuels for transport differ from wind and solar renewable energy as they involve energy inputs that are not freely available (in contrast with the wind and solar radiation) such as crops used as biofeedstocks or residues from various industries The production of agricultural commodities used as biofuel feedstocks results in jobs in agriculturemdashnotably those of farmers and seasonal workers (Charles Gerasimchuk Bridle amp Morenhout 2013)
To the extent that they are based on residues or waste products the collection and pre-treatment of second-generation biofuels generates jobs in this stage of the production process Refining bioethanol and biodiesel requires technically skilled labour like chemists plant operators and engineers before the biofuel can be distributed for sale (ePure 2012a)
Research and development activity is carried out by the industry and can also involve academic institutions throughout the UK (Kretschmer B et al 2013 p 45 Greene amp Wiley 2012)
Bioethanol and biodiesel industry representatives claim an expansion of biofuel consumption either first- or second-generation fuels would create direct jobs within the industry and additional jobs in other sectors such as agriculture (ePure 2012a European Diesel Board [EBB] 2012)
63 Is It a Numbers Game Jobs in the Bioethanol and Biodiesel Industries Based on an employment factor22 proposed by the European Renewable Ethanol Association (ePure) for every 1 million litres of domestically produced renewable bioethanol approximately 16 jobs are created (ePure 2012) Based on an employment factor for the EU biodiesel industry extrapolated from a EurObservrsquoER figure of 0007 jobs per 22 Employment factors estimates the average number of jobs per unit of capacity installed or fuel generated in litres multiplied across the production
base or volume of litres produced in the EU in a given year (data sources could include reports and studies surveys in industry and farming case studies national statistics on consumption and production capacities)
copy 2013 The International Institute for Sustainable DevelopmentRESEARCH REPORT SEPTEMBER 2013Biofuels ndash At What Cost A review of costs and benefits of UK biofuel policies 24
tonne of oil equivalent (toe) every 1 million litres of biodiesel produced in the EU is roughly estimated to create 53 jobs23 (EurObservrsquoER 2012 p 157) Table 8 summarizes employment estimates based on a selection of biofuel production figures and employment multipliers
TABLE 8 BIOFUEL-RELATED JOBS IN THE UK
UK ETHANOL PRODUCTION
NUMBER OF JOBS
UK BIODIESEL
PRODUCTION
NUMBER OF JOBS
TOTAL NUMBER OF
JOBS2011 Industry production figures (litres) 320000000 5120 246776000 1308 6428
20112012 RTFO year 4 production figures (litres)
33423734 534 155328209 822 1356
Sources ePure (2012b) EBB (2012) DfT (2013d) DfT (2013c) ePure (2012a) EurObservrsquoER (2012 p 157)
The table above shows that the number of biofuel-related jobs ranges from 1356 to 6428 depending on the level of biofuel production assumed Figures generated by the REA (2012 p 29) estimated approximately 3500 UK biofuel jobs in 20102011 spread across 200 supply chain companies The report noted the Vivergo Fuels plant in Hull was ldquocreating around 80 permanent full-time highly skilled jobsrdquo (REA 2012 p 49) and supporting over a 1000 jobs through the companyrsquos supply chain A report published by EurObservrsquoER (2012 p 173) estimated UK employment across the biofuel supply chain at 7500 in 2011 There appears to be a broad range of employment numbers for direct and indirect jobs in the UK depending on which calculation methods were used
One challenge to the claims that the biofuels sector creates new indirect jobs is that many of the agricultural-related jobs could likely exist with or without the biofuels sector A key issue is one of additionality in that the additional jobs created by the biofuels sector are likely those associated with biofuel processing facilities or transport (due to the increased use of tankers to move biofuels given the challenges in transporting them through piping networks) (Swenson 2006)
64 The Long-Term Security of JobsIf job creation is a key goal for supporting the biofuels industry the sustainability and quality of jobs are important issues Increasing amounts of imported biofuels and feedstocks (such as rapeseed soybeans wheat and corn) are being observed (DfT 2013d) Increased imports will lead to reduced biofuel production in the EU and lead to a decrease in jobs within the UK and EU and an increase in jobs in foreign countries exporting biofuels to the EU market (Charles Gerasimchuk Bridle amp Morenhout 2013) Furthermore the UK government is considering whether to halt an increase in RTFO blending mandates in response to sustainability concerns If support to the EU biofuels industry is steadily reduced overtime this may affect UK or EU biofuel production levels with the number of biofuel-linked jobs falling (or increasing) based on changing domestic production levels
There is currently a lot of interest in the number of jobs created through the development of renewable energy It is estimated that the UKrsquos offshore wind sector will create 16200 jobs across 790 companies with the turnover24 of the sector being pound21 billion Solar photovoltaic (PV) is anticipated to create up to 25000 jobs by the end of 2011 23 The EurObservrsquoER based its estimate of the socioeconomic impacts of EU biodiesel and vegetable oil production on an assumption of 0007 jobs
per toe (EurObservrsquoER 2012 p 157)24 Turnover as defined in this study includes companies in the supply chain where 20 per cent of their turnover is supplied into the sector with only
the sales activity relating to the renewable sector included in the analysis as turnover (Greene amp Wiley 2012)
copy 2013 The International Institute for Sustainable DevelopmentRESEARCH REPORT SEPTEMBER 2013Biofuels ndash At What Cost A review of costs and benefits of UK biofuel policies 25
across 2200 individual companies (REA 2012 p 27) with a turnover of pound18 billion in FY 2010ndash2011 Governments find it challenging to compare the relative effectiveness of investing in one renewable energy sector over another with the objective of creating employment The sustainability and quality of jobs will likely be a factor of the specific industryrsquos ability to continue without ongoing regulatory support
65 Rural Development and the Geographical Location of Jobs The EU supports the use of biofuels in order to pursue ldquoopportunities offered by biofuels in terms of economic activity and job creation within the context of the cohesion policy and rural development policyrdquo (European Commission 2006) The geographic spread of jobs is seen as important with many rural areas of Europe experiencing higher-than-average unemployment and average incomes being lower in rural areas compared with cities Hence bioethanol and biodiesel industry jobs in rural areas are seen to correspond to one of the original policy objectives for subsidizing biofuels rural development
Table 9 provides an illustrative breakdown of the potential spread of biofuel-related jobs between EU-designated Competitiveness and Employment regions and Convergence regions based on a formula that incorporates the distribution of production capacity between regions and their surface land
TABLE 9 BREAKDOWN OF BIOFUEL-RELATED JOBS IN THE UK BASED ON EU DEVELOPMENT REGIONS IN 201125
EMPLOYMENT FIGURES BASED ON 2011 PRODUCTION FIGURES ETHANOL BIODIESEL
EU designated region Number of jobs Percentage split between region
Number of jobs Percentage split between region
Competitiveness and Employment region 1164 89 4557 89
Convergence region 144 11 563 11
Total 1308 100 5120 100
Source Ethanol production ePure (2012b) biodiesel production European Diesel Board (2012) Biofuel production numbers are converted into number of jobs based on employment multiplier factors Bioethanol ePure [2012a] Biodiesel European Biodesel Board EurObservrsquoER (2011)
The locations of UK biodiesel and bioethanol plants26 represented in Figure 2 are shown in relation to the European designations for Convergence Regions (where per capita GDP is less than 75 per cent of the European average) and Competitiveness and Development Regions A variety of factors affect the selection of biofuel refining plants such as the local road network and access to ports and feedstocks Any jobs created in the agricultural sector are likely to be located near biofuel plants as feedstocks are generally sourced locally unless they are imported
25 The employment figures represented in this table are illustrative and the number of jobs separated by region does not represent specific UK job figures To estimate the number of jobs in the UK that have both Convergence regions and Competitiveness and Employment regions the surface area of the Convergence region was divided by the total surface area of the UK (Internet World Stats 2013) to establish the percentage surface area of the country with Convergence designated areas The geographic location of UK biofuel refineries was then plotted between Convergence regions and Competitiveness and Employment regions a percentage of the countriesrsquo installed production capacity was estimated for each region The two percentages (for the amount of land designated as either Convergence or Competiveness and Employment regions and the average distribution of installed production capacity split between the two regions) were then averaged out and used as the factor multiplied with biofuel production for that year in order to estimate whether jobs were situated in Convergence regions or Competitiveness and Employment regions
26 The UK biofuel plants plotted on the UK map are listed in Annex A The list of pants may not be exhaustive
copy 2013 The International Institute for Sustainable DevelopmentRESEARCH REPORT SEPTEMBER 2013Biofuels ndash At What Cost A review of costs and benefits of UK biofuel policies 26
FIGURE 2 UK BIODIESEL AND BIOETHANOL PLANTSSource GSI data collection (a list of biofuel plants locations and refining capacity is located in Annex A) Map of the UK showing Convergence or Competiveness and Employment areas source European Commission (2013) Reprinted with permission
In general there is not a high degree of correlation between the economically underdeveloped Convergence Regions and the locations of plants in the UK However it should be noted that the UKrsquos Midlands (where some of the biofuel plants are located) is economically less developed than the south of England (Department for Communities and Local Government 2007 p 5) and would benefit from employment creation initiatives
66 ConclusionsDue to the complexity of job counting it is difficult to estimate the number and quality of sectoral jobs in the biofuels sector or in the renewable energy sector more broadly The range of different employment estimates produced for the biofuels sector is not directly comparable given varying methodologies Previous reports have identified the question of additionality in job counting for biofuels arguing that farm-based agricultural jobs in the biofuel supply chain would still exist without the biofuel industry There are also concerns about a substitution effect whereby jobs created along the biofuel supply chain are displacing jobs in other sectors such as the petroleum supply industry Given the economic slowdown in Europe and high unemployment rates job creation is an important factor for policy-makers and jobs created in the biofuels industry can be viewed as important to an economy in recession especially if they are in poorer rural areas The biofuels sector may deliver net economic and employment benefits if related jobs are sustainable and not linked to ongoing subsidies Better monitoring of the number of biofuel sector-related jobs will help contrast the anticipated benefits from the industry against any associated costs
copy 2013 The International Institute for Sustainable DevelopmentRESEARCH REPORT SEPTEMBER 2013Biofuels ndash At What Cost A review of costs and benefits of UK biofuel policies 27
70 Energy Security and Biofuel Trade
71 Purpose This section discusses international trade in biofuels and feedstocks and the role of biofuels in supporting energy security objectives through displacing the use of crude oil or petroleum products imported from outside of the EU
72 Defining Energy Security The IEA defines energy security as the uninterrupted availability of energy products at an affordable price (IEA 2013) The European Commission adds a sustainability dimension by describing security of energy supply as
[T]he uninterrupted physical availability of energy products on the market at a price which is affordable for all consumers (private and industrial) while respecting environmental concerns and looking toward sustainable development (European Commission 2000)
Energy security can be improved by increasing the security of supply of traditional energy sources (through long-term contracts or investments) increasing the diversity of energy sources (both geographically and the types of fuels) reducing demand (by improving energy efficiency) and increasing flexibility within the energy sector27
The European Commissionrsquos strategy for energy security is linked to its strategies for diversification emissions reduction and energy efficiency Biofuels have the potential to improve energy security by diversifying fuel supply including from primary sources that are locally available and more widely distributed than crude oil (European Commission 2006) The same considerations are as valid for the EU as individual member countries including the UK
There are two key parameters to assess the effectiveness of meeting the objective of improving energy security through expanding the share of biofuels in the energy mix
bull Quantifying the amount of imported fossil fuels replaced with biofuels
bull Analyzing to what extent the biofuels replacing fossil fuels are domestically produced or imported (in the case of imports concerns over energy security remain)
Table 10 illustrates the amount of petrol and diesel displaced by biofuel use in the UK
TABLE 10 PETROLEUM PRODUCTS DISPLACED BY UK BIOFUEL USE IN 20112012
LITRES OF BIOFUEL CONSUMED
20112012 (LITRES) MJTOTAL
PETROL AND DIESEL DISPLACED BY
20112012 (LITRES)
TOTAL PETROL AND DIESEL CONSUMED IN THE UK IN
2011 (LITRES)Ethanol 676539175 14396753644 447104150 16548681462
Biodiesel 959668795 31765037126 884819976 28547483643
Source DfT (2013d)Calorific Values (CV) (MJlitre) bioethanol 2128 biodiesel 3310 gasoline 3220 diesel oil 3590 Source authorrsquos calculations 2011 energy consumption figures dieselmdash2099 million tonnes converted at 1360 litres per tonne petrolmdash1389 million tonnes converted at 1191 litres per tonne Source for conversion factor DfT (2011d)Source Department of Energy and Climate Change (DECC) (2012) 27 There is trend in Europe to reduce energy consumption due to the economic slowdown Consumption was down 6 per cent between
2008 and 2011 (Eurostat 2013b) though some modes of transportation showed increases in absolute terms with energy consumption in road transport use in the EU-27 rising by 20 million toe between 2000 and 2010 (Eurostat 2013b)
copy 2013 The International Institute for Sustainable DevelopmentRESEARCH REPORT SEPTEMBER 2013Biofuels ndash At What Cost A review of costs and benefits of UK biofuel policies 28
Generally trade balance data in the EU may be confusing because of third-party trade (re-export and re-import) Further Harmonised System trade codes do not always distinguish between feedstocks and other commodities being imported or exported for biofuel production or other purposes (for instance bioethanol is also used for technical purposes other than road transport fuels and in the beverages industry)28 Therefore analyzing trade flows of biofuels and their feedstock in the EU necessitates a lot of assumptions and caveats However the UKrsquos DfT provides relatively clear figures on the type of feedstock (reported in litres) and country of origin as part of the RTFO reporting29
The share of bioethanol feedstock source and country of origin for RTFO year 4 is displayed in the following diagrams Corn is the main feedstock providing 517 million litres out of a total 674 million litres consumed in the 2011201230 year (DfT 2013d) A significant reduction of sugarcane feedstocks sourced from Brazil has been observed compared to previous years (Bailey 2013)
FIGURE 3 BIOETHANOL CONSUMED IN THE UK BY FEEDSTOCK (FY 20112012)Source DfT (2013d)Note Percentages may not equal to 100 per cent due to rounding
Currently bioethanol feedstock is mainly sourced from outside of the UK and Europe with corn from the United States being the main source In terms of energy security having such a significant amount feedstocks sourced from outside the UK or EU may pose some concerns
28 Biofuels can also be traded as blends with fossil fuels and trade statistics do not always make a clear distinction of pure and blended products29 Other trade statistics are available on biofuel and feedstock such as USDA Global Agricultural Information Network (GAIN) EU-27 and
national reports (USDA 2011) Trade data is generated as part of RTFO obligations requiring fuel suppliers to submit information on the volume of all renewable or partially renewable fuels that are covered by the RTFO and the origin of biofeedstocks (DfT 2013c)
30 Ethanol consumption figures for FY 20112012 may vary slightly to consumption figures represented in other parts of the paper due to the way data has been presented in DfT RTFO year 4 data spreadsheets
copy 2013 The International Institute for Sustainable DevelopmentRESEARCH REPORT SEPTEMBER 2013Biofuels ndash At What Cost A review of costs and benefits of UK biofuel policies 29
FIGURE 4 COUNTRY OF ORIGIN FOR BIOETHANOL FEEDSTOCKS (20112012 REPORTING YEAR)Source DfT (2013d) Notes Europe includes Serbia and the Ukraine
The main feedstock for biodiesel production is overwhelmingly from UCO making up 88 per cent of all feedstocks
FIGURE 5 BIODIESEL CONSUMED IN THE UK BY FEEDSTOCK (20112012 REPORTING YEAR)Source DfT (2013d)
The majority of biodiesel and feedstocks are sourced from inside of Europe 461 million litres from a total 874 million litres consumed in the UK originated from within Europe After Europe (excluding the UK) the UK was the next largest source of biofeedstock providing 155 million litres The origin of biodiesel and feedstocks do not pose major security of supply concerns for UK biodiesel consumption However if additional food commodities must be imported to replace feedstocks directed to the production of biodiesel as is likely then energy security benefits may be eroded due to the requirement to import additional food commodities
copy 2013 The International Institute for Sustainable DevelopmentRESEARCH REPORT SEPTEMBER 2013Biofuels ndash At What Cost A review of costs and benefits of UK biofuel policies 30
FIGURE 6 COUNTRY OF ORIGIN FOR BIODIESEL FEEDSTOCKS (20112012 REPORTING YEAR)Source DfT (2013d) Notes Europe includes Switzerland and Ukraine
73 Conclusions Trade in biofuels and feedstock is significant for the UK RTFO data for year 4 showed corn sourced from outside of the European Union principally from the United States was the main feedstock for bioethanol An overreliance on one country can be risky if corn production in the United States drops If this happened the ability of the UK to source feedstocks from other countries would depend on spare capacity in countries such as Brazil to meet demand The main feedstock for biodiesel was overwhelmingly UCO sourced from the UK and within Europe
copy 2013 The International Institute for Sustainable DevelopmentRESEARCH REPORT SEPTEMBER 2013Biofuels ndash At What Cost A review of costs and benefits of UK biofuel policies 31
80 Renewable Energy Options
81 PurposeThis section evaluates the costs of meeting EU renewable energy targets while reducing the role of food-based biofuels due to EU caps and increasing the contribution from other forms of renewable energy
82 Renewable Energy TargetsThe UKrsquos NREAP anticipates the overall EU target for renewable energy in final energy consumption coming from the electricity heating and cooling and transport sectors These sectors have the following subtargets for the amount of renewable energy to be generated 31 per cent electricity (RES-E) 12 per cent heating and cooling (RES-HampC) and 103 per cent in transport31 (RES-T) coming from renewable forms (European Renewable Energy Council 2011) The renewable energy generated as part of these sectoral subtargets aggregated together results in 15 per cent of all final energy consumed coming from renewable sources (European Renewable Energy Council 2011)
In their report for ECN Beurskens Hekkenberg and Vethman (2011) find that the UK has projected a total of 20510 toe (238531GWh) of renewable energy generation in 2020 according to the NREAP It is expected that the majority of this energy generation will be derived from electricity production (48 per cent) followed by heating and cooling (30 per cent) with a smaller contribution from transport (22 per cent) This level of renewable energy generation is projected to account for between 137 per cent and 15 per cent of total consumption depending on adjustments made for additional energy-efficiency measures and aviation In the reference scenario the overall contribution of energy from renewables is 137 per cent This is in line with the overall target agreed by the UK government and the EU for 2020
FIGURE 7 PROJECTED RENEWABLE ENERGY GENERATION IN THE UK IN 2020 Source Beurskens Hekkenberg amp Vethman (2011)
31 The sectors across the economy in which energy is consumed have been divided by EU policy-makers into renewable electricity heating amp cooling and transport sectors These sectors are typically further subdivided to address specific subcomponents of the sector
copy 2013 The International Institute for Sustainable DevelopmentRESEARCH REPORT SEPTEMBER 2013Biofuels ndash At What Cost A review of costs and benefits of UK biofuel policies 32
In 2011 the majority of renewable energy in final consumption was generated in the form of electricity (62 per cent) with the remainder being split between heat (12 per cent) and transport fuel (26 per cent) The historical generation of electricity heat and fuel for transport is shown in Figure 8 To meet the targets set out above will require a relative increase in the contributions from heat and transport fuel
FIGURE 8 RENEWABLE SOURCES USED TO GENERATE ELECTRICITY HEAT AND FOR TRANSPORT 1990 TO 2011Source DECC (2012a)
The economic social and environmental concerns around the production and consumption of biofuels that have led to the EU proposal to cap food-crop-based biofuels raise the question of whether it would be possible to reach the target for the total generation of renewable energy without expanding the use of biofuels and instead increasing generation of renewable energy from electricity or heating and cooling
83 Deployments of Renewable Energy in Transport Fuels in the UKTo promote renewable energy in the UK the government has used a number of measures most notably the RTFO UK energy statistics show that the current use of renewable energy in transport is broadly in line with EU targets (DECC 2012a) However in response to concerns over the sustainability of biofuels the UK government has no plans to increase the obligation on road transport fuel providers beyond 5 per cent (Department for Transport 2012) If the RTFO mandate is not increased through to 2020 future targets may not be reached The UK government will need to scale up other renewable energy technologies or energy efficiency in order to meet RES-T targets Figure 9 shows this comparison
copy 2013 The International Institute for Sustainable DevelopmentRESEARCH REPORT SEPTEMBER 2013Biofuels ndash At What Cost A review of costs and benefits of UK biofuel policies 33
FIGURE 9 RENEWABLE ENERGY USE IN TRANSPORT Source Beurskens Hekkenberg amp Vethman (2011) DECC (2012a)
84 Costs
At an economic level the cost implications of shifting from biofuels to other forms of renewable energy depends on the energy content and production costs of biofuels compared to other options Data for biofuels production costs was taken from the IEA World Energy Outlook (IEA 2012) and data for the cost of energy from renewables was taken from a recent IRENA (2012) report on generation cost Figure 10 shows a summary of this comparison
copy 2013 The International Institute for Sustainable DevelopmentRESEARCH REPORT SEPTEMBER 2013Biofuels ndash At What Cost A review of costs and benefits of UK biofuel policies 34
FIGURE 10 COSTS OF ENERGY GENERATION FROM VARIOUS RENEWABLE ENERGY TECHNOLOGIES BIOFUELS AND PETROLEUM PRODUCTSSource IEA (2012) IRENA (2012) authorrsquos calculations
The levelized cost of energy (LCOE) is a measure of the total cost per unit of energy generated It includes all the costs associated with the production of energy including the cost of investment and operations plus maintenance and any inputs LCOE provides a single value for the cost of energy to allow a comparison of technologies with different investment and operating costs However the comparison does not account for the usefulness of each of these forms of energy Liquid fuels are easy to store and very energy dense but conversion to mechanical work has a lower efficiency than electric motors Electricity must be consumed instantaneously (or stored chemically) which is currently expensive Despite the shortcomings of LCOE it provides a useful comparison of the cost of energy particularly in the context of our analysis in this report of the cost of meeting the EU target for renewable energy production
The comparison presented in Figure 11 shows that the costs of biodiesel and conventional bioethanol are similar to other renewable energy technologies although the midpoint of the ranges is higher than for some of the more widely deployed technologies including wind and biomass Data from IRENA is not available for offshore wind a technology that is expected to expand considerably However other sources generally indicate that offshore wind is considerably more expensive than onshore wind (Mott Macdonald 2011) and therefore is likely to be the same or more expensive than renewable energy from biofuels However the potential for future cost reductions is not the same for all technologies Solar PV costs have fallen at a rate of 15ndash24 per cent with each doubling in production since 2004 (Bazilian et al 2013) The LCOE from wind power declined by a factor of three between 1980 and 2003 but rose between 2004 and 2009 before falling slightly in recent years From 2013 to 2030 both PV and wind are projected to see further reductions in the LCOE (BNEF 2013 Lantz Wiser amp Hand 2012) The cost of material inputs for the production of renewable energy technologies such as wind turbines and solar PV panels can be estimated with some level of accuracy while feedstock costs used to produce first-generation biofuels are more difficult to
copy 2013 The International Institute for Sustainable DevelopmentRESEARCH REPORT SEPTEMBER 2013Biofuels ndash At What Cost A review of costs and benefits of UK biofuel policies 35
predict due to volatility in market prices First-generation biofuels have a relatively low potential for cost reduction in part because so much of the cost is tied to the feedstock (IEA 2011)
The cost of meeting a greater proportion of the renewable energy target from other (non-biofuel) sources is likely to be more costly than using biofuels with the extent of costs being dependent on the ability to employ lower cost renewables such as onshore wind It is worth bearing in mind that onshore wind is facing a number of challenges from the availability of good sites to local opposition groups While solar PV continues to realize cost reductions it is still significantly more expensive than biofuels on an energy basis The support required to incentivize production depends on the alternatives and end uses so a direct comparison requires detailed analysis However further expansion of renewable electricity may be limited by access to grid infrastructure although this may be ameliorated by demand-side management and aggregation The NREAP plans have been developed considering existing constraints and further analysis would be required to established the technical viability of replacing biofuels with other sources of renewable energy
85 Subsidies As a preliminary indication of the costs of reducing the use of biofuels and increasing the use of other renewables the estimate of total support for biofuels calculated as part of this study was compared with the value of the UKrsquos main renewable energy support mechanism the Renewable Obligation Certificates (ROCs) (DECC 2013) Data for the average ROC price were taken from E-ROC (2013) The results of this comparison are shown in Figure 11
FIGURE 11 COMPARISON BETWEEN TOTAL SUPPORT ESTIMATES FOR BIOFUELS AND UK ROC PRICES Source IISD (estimated within this report) E-ROC (2013) DECC (2013) and author calculations
Figure 11 shows that the support to biofuels is lower than the support provided by the main support instruments in the UK (this analysis includes only one source of support for renewable electricity production [ROCs] and so is likely to be an underestimate) The cost for biodiesel (based on the subsidy level) is just below onshore wind and the support to bioethanol is significantly lower on a per-unit basis of energy If it is possible to increase renewable electricity generation from the most competitive technologies notably onshore wind then the cost increase may be
copy 2013 The International Institute for Sustainable DevelopmentRESEARCH REPORT SEPTEMBER 2013Biofuels ndash At What Cost A review of costs and benefits of UK biofuel policies 36
small However if additional generation were to come from more expensive technologies such as offshore wind or PV subsidy and deployment costs may increase These findings indicate a reduction in biofuel consumption and a corresponding increase in other sources of renewable energy which will possibly increasemdashor at least not reducemdashthe cost of meeting the 2020 renewable energy targets Without detailed analysis and understanding of subsidies to electricity production it is difficult to understand the magnitude of this change
While the financial costs of meeting the UKrsquos renewable energy target are a critical issue they should not be the sole factor in deciding what policies to pursue A key goal of the 2020 renewable targets is to realize environmental benefits through the deployment of renewable energy technologies The concern around the environmental impacts of some biofuels may undermine this objective A shift towards technologies with widely accepted environmental credentials would reduce the cost of environmental benefits including emissions reductions if not the absolute cost of meeting the renewable energy targets
86 Other Options for the Transport Target If the level of renewable energy from biofuels deployed in the transport sector were reduced to 5 per cent (based on the cap on food-based biofuels) this would leave a shortfall of 11 per cent (based on the transport sectorrsquos contribution of renewable energy towards the overall 15 per cent renewable energy target) of the renewable energy target which would then need to be found from other sources
Other options could include an increase in the use of other transport technologies such as hydrogen or electric cars running on renewable electricity though it is clear there are a number of challenges to scale up such technologies from currently low levels Decarbonizing the electricity sector for example would allow for much wider deployment of electric road vehicles and rail Increased use of renewable energy from the heating and cooling sector could also be explored
FIGURE 12 2020 RENEWABLES TARGET WITH BIOFUELS RESTRICTED TO 5 PER CENT AND THE SHORTFALL TO BE FOUND FROM OTHER SOURCESSource Beurskens Hekkenberg amp Vethman (2011) author calculations
copy 2013 The International Institute for Sustainable DevelopmentRESEARCH REPORT SEPTEMBER 2013Biofuels ndash At What Cost A review of costs and benefits of UK biofuel policies 37
90 ConclusionIf the role of food-crop based biofuels in meeting the UKrsquos renewable energy transport target is capped the cost of scaling up other technologies in its place will be dependent on a range of factors including the availability of renewable resources financial and non-financial barriers that may hamper greater deployment and the learning potential of specific technologies to reduce investment costs and subsidy levels Given the complexity of factors affecting the ability to bring forward renewable energy technologies this analysis does not recommend scaling up or substituting specific renewable technologies over others However in the context of binding EU targets for renewable energy use it recommends that the UK government policy should support the use of low-carbon technologies that can deliver GHG savings up to and beyond 2020 targets
91 Discussion
The UK biofuels market and regulatory framework have some notable points
The UKrsquos uses a substantial amount of UCO for biodiesel production
RTFO reporting shows UCO was the dominant feedstock for biodiesel consumption encouraged by a 20 ppl excise tax exemption that expired in March 2012 as well as double counting In RTFO year 4 (20112012) UCO feedstock amounted to 8004 million litres which was 499 per cent of all feedstock Relative to food-based biodiesel consumption UCO provides a more sustainable feedstock in terms of indirect emissionsmdashthough there could still be a range of unintended outcomes from its use
The UK and its Blending Target
The UK has no stated objectives to increase the blending mandates The deceleration of the required blending levels was recommended by Gallagherrsquos review and based on a position that the UK should proceed cautiously ldquountil the evidence is clearer about the wider environmental and social effects of biofuelsrdquo (DfT p 7 2009a) Changes to the investment framework are obviously a concern for investors who seek policies with transparency longevity and certainty (Deutsche Bank 2009) however growing evidence of the impact of ILUC and emissions reductions has meant that governments such as the UK have applied the Precautionary Principle to target setting in order to avoid policies that may have a negative environmental impact
copy 2013 The International Institute for Sustainable DevelopmentRESEARCH REPORT SEPTEMBER 2013Biofuels ndash At What Cost A review of costs and benefits of UK biofuel policies 38
92 Policy Recommendations The recommendations that can be drawn from this study suggest that it is advisable for UK policy-makers along with those at the national government level to recognize the following
bull Monitoring and regularly publishing support figures for biofuels as well as all forms of energy (including fossil fuels and nuclear) is important for improving the transparency of public policy-making
bull The UK government could consider improving its official government statistics on the number and types of jobs generated by the biofuels policies further in particular by disaggregating indirect and direct jobs created in UK This would provide better information on how many jobs within the UK economy had been created by the biofuels sector
bull Biofuel blending targets are a significant intervention in the liquid fuels transport market and the UK governmentrsquos current decision to maintain 5 per cent volumetric blending levels is a practical decision due to concerns over the impact of ILUC arising from biofeedstock production
bull In terms of biofuel GHG emission accounting if the UK government included ILUC as part of its accounting approach it would be applying a precautionary approach and it would ensure that public money does not support biofuels that increase carbon dioxide emissions
bull Biofuel support policies should differentiate between conventional and second-generation biofuels bioethanol and biodiesel and ideally between feedstocks (such as UCO versus palm oil) given the varying environmental performance of fuels and production processes
copy 2013 The International Institute for Sustainable DevelopmentRESEARCH REPORT SEPTEMBER 2013Biofuels ndash At What Cost A review of costs and benefits of UK biofuel policies 39
ReferencesAPEC Energy Working Group (2012) Reforming fossil-fuel subsidies to reduce waste and limit CO
2 emissions while
protecting the poor Retrieved from httpwwwiisdorggsisitesdefaultfilesffs_apecpdf
Bailey R (2013) The trouble with biofuels Costs and consequences of expanding biofuel use in the United Kingdom Catham House Retrieved from httpwwwchathamhouseorgpublicationspapersview190783
Bazilian M Onyeji I Liebreich M MacGill I Chase J Shahe J et al (2013) Re-considering the economics of photovoltaic power Renewable Energy 53 329ndash338
Beurskens LWM Hekkenberg M amp Vethman P (2011 November) Renewable energy projections as published in the national renewable energy action plans of the European Member States ECN amp EEA Retrieved from httpwwwecnnldocslibraryreport2010e10069pdf
BigOilnet (2012) Pump optimisation model London Platts European Market Scan Retrieved from httpwwwbigoilnet
BNEF (2013 June 29) Global renewable energy market outlook 2013 Retrieved from httpaboutbnefcomfact-packsglobal-renewable-energy-market-outlook-2013-fact-pack
Brander M Hutchison C Sherrington C Ballinger A Beswick C Baddeley A et al (2009) Methodology and evidence base on the indirect greenhouse gas effects of using wastes residues and by-products for biofuels and bioenergy Retrieved from httpwwwbioenergywikinetimagesaa5Ecometrica_Methodologypdf
Business Link UK (2011 April) Information Support Compliance Retrieved from httpwwwbusinesslinkgovukbdotgactiondetailitemId=1084769721amptype=RESOURCES
Charles C Gerasimchuk I Bridle R amp Morenhout T (2013) Biofuels ndash At what cost A review of costs and benefits of EU biofuel policies IISD Retrieved from httpwwwiisdorgpublicationspubaspxpno=2780
Charles C amp Wooders P (2012 January) Biofuels ndash At what cost Mandating ethanol and biodiesel consumption in the United Kingdom IISD Retrieved from httpwwwiisdorggsisitesdefaultfilesbf_awc_ukpdf
Delzeit R (2012) Review of the IFPRI study Assessing the land use change consequences of European biofuel policies and its uncertainties Germany Kiel Institute for the World Economy
Department for Communities and Local Government (2007) East Midlands Competitiveness Programme 2007ndash13 Retrieved from httpswwwgovukgovernmentuploadssystemuploadsattachment_datafile132071North_Derbyshire_and_North_Nottinghamshire_informationpdf
Department for Transport (2009) Explanatory Memorandum to the Renewable Transport Fuel Obligations (Amendment) order 2009 London Retrieved from httpwwwlegislationgovukuksi2009843pdfsuks-iem_20090843_enpdf
Department for Transport (2011a March) Consultation on the implementation of the transport elements of the Renew-able Energy Directive Retrieved from httpwwwdftgovukconsultationsopen2011-05redconsultationdocu-ment1pdf
Department for Transport (2011b March 11) Fuel Quality Directive IA No DFT00048 London DfT
copy 2013 The International Institute for Sustainable DevelopmentRESEARCH REPORT SEPTEMBER 2013Biofuels ndash At What Cost A review of costs and benefits of UK biofuel policies 40
Department for Transport (2011c April 20) Presentations given at consultation meetings on the RED and FQD on 31 March and 4 April 2011 Retrieved from httpwwwdftgovukpgrroadsenvironmentrenewable-fuelsredredfqd-presesntations
Department for Transport (2011d) Transport statistics Great Britain 2011 Retrieved from httpassetsdftgovukstatisticsreleasestransport-statistics-great-britain-2011energy-notespdf
Department for Transport (2012 November 5) Renewable Transport Fuels Obligation Retrieved from httpswwwgovukrenewable-transport-fuels-obligation
Department for Transport (2013a) Renewable Transport Fuels Obligation Retrieved from httpswwwgovukgovern-mentpublicationsrtfo-guidance
Department for Transport (2013b) Renewable Transport Fuel Obligation statistics Obligation period 4 201112 report 6 Retrieved from httpswwwgovukgovernmentpublicationsrenewable-transport-fuel-obligation-statistics-obligation-period-4-2011-12-report-6
Department for Transport (2013c) RTFO Guidance Part One Process Guidance Retrieved from httpswwwgovukgovernmentuploadssystemuploadsattachment_datafile175673part-1-process-guidance-yr6-v60pdf
Department for Transport (2013d) RTFO 2011ndash2012 year four report London UK Department for Transport
Department of Energy and Climate Change (2012a July) Digest of UK energy statistics (DUKES) Retrieved from httpswwwgovukgovernmentpublicationsrenewable-sources-of-energy-chapter-6-digest-of-united-kingdom-energy-statistics-dukes
Department of Energy and Climate Change (2012b) Energy consumption in the UK London Retrieved from httpswwwgovukgovernmentorganisationsdepartment-of-energy-climate-changeseriesenergy-consumption-in-the-uk
Department of Energy and Climate Change (2013) Renewable Obligation Certificate (ROC) Banding Retrieved from httpchpdeccgovukcmsroc-banding
Deutsche Bank (2009) Paying for renewable energy TLC at the right price Retrieved from httpwwwdbccacomdbccaEN_mediaPaying_for_Renewable_Energy_TLC_at_the_Right_Pricepdf
di Lucia L Ahlgren S amp Ericsson K (2012) The dilemma of indirect land-use changes in EU biofuel policy An empirical study of policy-making in the context of scientific uncertainty Environmental Science amp Policy 16 9ndash19
Ecofys Agra CEAS Chalmers University IIASA amp Winrock International (2011) Biofuels baseline 2008 Retrieved from httpwwwecofyscomfilesfilesecofys_2011_biofuels_baseline(2008)pdf
Ecofys amp German Union for the Promotion of Oils and Protein Plants (2012) International biodiesel markets Develop-ments in production and trade Retrieved from httpwwwecofyscomenpublicationinternational-biodiesel-mar-kets
Ecofys Fraunhofer BBH EEG amp Winrock International (2013) Renewable energy progress and biofuels sustainability Brussels Retrieved from httpeceuropaeuenergyrenewablesreportsdoc2013_renewable_energy_progresspdf
ePure (2012a) European renewable ethanol Jobs amp growth Retrieved from httpwwwepureorgsitesdefaultfilespdffe7f000001-0f82-cc9bpdf
copy 2013 The International Institute for Sustainable DevelopmentRESEARCH REPORT SEPTEMBER 2013Biofuels ndash At What Cost A review of costs and benefits of UK biofuel policies 41
ePure (2012b August 28) Production statistics Retrieved from httpwwwepureorgstatisticsinfoProduction-data1
E-ROC (2013) Track record Retrieved from httpwwwe-roccouktrackrecordhtm
EurObservrsquoER (2011) Eacutetat des eacutenergies renouvelables en Europe 11e edition Brussels Retrieved from httpwww energies-renouvelablesorgetat_energies_renouvelablesasp
EurObservrsquoER (2012) Biofuels barometer Retrieved from httpwwweurobserv-erorgpdfbaro210pdf
EurObservrsquoER (2013) Eacutetat des eacutenergies renouvables en Europe Eacutedition 2012 Retrieved from httpwwwenergies-renouvelables orgobserv-erstat_barobarobilanbarobilan12pdf
Europa (2009 January 19) Single Farm Payment Europa Summaries of EU legislation Retrieved from httpeuropaeulegislation_summariesagriculturegeneral_frameworkag0003_enhtm
European Commission (2000) Towards a European strategy for the security of energy supply Brussels European Commission
European Commission (2003 May 8) Directive 200330EC of the European Parliament and of the Council of 8 May 2003 on the promotion of the use of biofuels or other renewable fuels for transport Retrieved from httpeurlexeuropaeuLexUriServLexUriServdouri=OJL200312300420046ENPDF
European Commission (2006) Biofuels in the European Union Brussels European Commission
European Commission (2009a) DIRECTIVE 200928EC on the promotion of the use of energy from renewable sources (Renewable Energy Directive April 23) Retrieved from httpeur-lexeuropaeuLexUriServLexUriServdouri=OJ L200914000160062enPDF
European Commission (2009b) Directive 200930EC on the quality of petrol and diesel fuels (Fuel Quality Direc-tive) Retrieved from httpeur-lexeuropaeuLexUriServLexUriServdouri=CELEX32009L0030ENNOT
European Commission (2011a) Global trade and impact study Retrieved from httptradeeceuropaeudoclib docs2010marchtradoc_145954pdf
European Commission (2012a) Impact assessment accompanying the document ldquoProposal for a directive of the Eu-ropean Parliament and of the Council amending Directive 9870EC relating to the quality of petrol and diesel fuels and amending Directive 200928EC on the promotion of the use of energy from renewable sourcesrdquo Brussels European Commission
European Commission (2012b) Proposal for a directive of the European Parliament and of the Council amending Direc-tive 9870EC relating to the quality of petrol and diesel fuels and amending Directive 200928EC on the promotion of the use of energy from renewable sources Brussels European Commission Brussels
European Commission (2013) Cohesion Policy UK Retrieved from httpeceuropaeuregional_policyat-las2007ukindex_enhtm
European Diesel Board (2012) Production statistics Retrieved from httpwwwebb-euorgstatsphp
copy 2013 The International Institute for Sustainable DevelopmentRESEARCH REPORT SEPTEMBER 2013Biofuels ndash At What Cost A review of costs and benefits of UK biofuel policies 42
European Parliament (2010) The single payment scheme after 2013 New approach - new targets Directorate-General for Internal Policies Policy Department B Structural and Cohesion Policies Retrieved from httpcapreformeuwp-contentuploads201005EST31208pdf
European Renewable Energy Council (2011) Mapping renewable energy pathways towards 2020 EU road map Retrieved from httpwwwerecorgfileadminerec_docsDocumentsPublicationsEREC-roadmap-V4_finalpdf
Eurostat (2013a) Consumption of energy Brussels European Commission Retrieved from httpeppeurostateceuropaeustatistics_explainedindexphpConsumption_of_energy
Eurostat (2013b) Energy consumption Brussels European Commission Retrieved from httpeppeurostateceuropaeucacheITY_PUBLIC8-13022013-BPEN8-13022013-BP-ENPDF
Gallagher E (2008) The Gallagher Review of the indirect effects of biofuels production Renewable Fuels Agency Re-trieved from httpwwwunidoorgfileadminuser_mediaUNIDO_Header_SiteSubsitesGreen_Industry_Asia_Conference__Maanila_GC13Gallagher_Reportpdf
Government of the United Kingdom (2011) First progress report on the promotion and use of energy from renewable sources for the United Kingdom Brussels European Commission
Greene L amp Wiley T (2012) Renewable energy Made in Britain Jobs turnover and policy framework by technology (2012 assessment) United Kingdom Renewable Energy Association
Her Majestyrsquos Revenue and Customs (2013) Biofuels and other fuel substitutes Retrieved from httpcustomshmrcgovukchannelsPortalWebAppchannelsPortalWebAppportal_nfpb=trueamp_pageLabel=pageExcise_ShowContentampid=HMCE_CL_000205amppropertyType=document
International Energy Agency (2011a) Technology roadmap biofuels for transport Retrieved from httpwwwieaorgpublicationsfreepublicationspublicationbiofuels_roadmappdf
International Energy Agency (2011b) World energy outlook 2011 Paris IEA
International Energy Agency (2012) World energy outlook 2012 Paris IEAOECD
International Energy Agency (2013) Energy Security Retrived from httpwwwieaorgtopicsenergysecurity
Internet World Stats (2013) Usage and population statistics Retrieved from httpwwwinternetworldstatscomeuropahtm
IRENA (2012) Renewable power generation costs in 2012 An overview Retrieved from httpwwwirenaorgmenuindexaspxmnu=SubcatampPriMenuID=36ampCatID=141ampSubcatID=277
Joint Research Centre (2008) Biofuels in the European context Facts and uncertainties European Commission Re-trieved from httpeceuropaeudgsjrcdownloadsjrc_biofuels_reportpdf
Joint Research Centre (2010a) Indirect land use change from increased biofuels demand European Commission Retrieved from httpeceuropaeuenergyrenewablesconsultationsdocpublic_consultation_ilucstudy_4_iluc_modelling_comparisonpdf
copy 2013 The International Institute for Sustainable DevelopmentRESEARCH REPORT SEPTEMBER 2013Biofuels ndash At What Cost A review of costs and benefits of UK biofuel policies 43
Joint Research Centre (2010b) Critical issues in estimating ILUC emissions European Commission Retrieved from httppublicationsjrceceuropaeurepositorybitstream111111111229081reqno_jrc64429_cirtical20is-sues20in20estimating20iluc20emissions20pdf20versionpdf
Koplow D (2009a) A boon to bad biofuels Federal tax credits and mandates underwrite environmental damage at taxpayer expense Earth Track amp Friends of the Earth Retrieved from httpwwwearthtracknetfilesuploaded_filesFOE20VEETC20Evaluation20FINALpdf
Koplow D (2009b) Measuring energy subsidies using the price-gap approach What does it leave out Winnipeg IISD Re-trieved from httpwwwiisdorgpdf2009bali_2_copenhagen_ff_subsidies_pricegappdf
Kretschmer B Allen B Kieve D amp Smith C (2013) Shifting away from conventional biofuels Sustainable alternatives for the use of biomass in the UK transport sector An IEEP discussion paper produced for ActionAid London Institute for European Environmental Policy (IEEP)
Kutas G Lindberg C amp Steenblik R (2007 October) Biofuels ndash at what cost Government support for ethanol and biodiesel in the European Union Retrieved from httpwwwiisdorggsisitesdefaultfilessubsidies_to_biofuels_in_the_eu_finalpdf
Laborde D (2011) Assessing the land use change consequences of European biofuel policies Washington DC Interna-tional Food Policy Research Institute
Lang K (2010) Defining fossil-fuel subsidies for the G-20 Which approach is best Geneva IISD-GSI
Lantz E Wiser R amp Hand M (2013) IEA Wind Task 26 The past and future cost of wind energy Retrieved from httpwwwieawindorgindex_page_postingsWP2_task26pdf
Marelli L (2013 February 20) Methodologies to assess ILUC Workshop in Sustainable Biofuels addressing Indirect Land Use Change Brussels Belgium
Mott Macdonald (2011 October) Costs of low-carbon generation technologies Retrieved from httparchivethecccorgukawsRenewables20ReviewMML20final20report20for20CCC20920may202011pdf
NFPAS (2013a) A strong track record Retrieved from httpwwwnfpas-auctionscouketoctrackrecordhtml
NFPAS (2013b) FAQs Retrieved httpwwwnfpas-auctionscouketocfaqshtml
Organisation for Economic Co-operation and Development (1996) Subsidies and the environment Exploring the link-ages Paris OECD
Organisation for Economic Co-operation and Development amp Food and Agriculture Organization (2011) OECD-FAO agricultural outlook 2011ndash2020 Retrieved from httpstatsoecdorgviewhtmlaspxQueryId=30104ampvh=0000ampvf=0amplampil=blankamplang=en
Renewable Fuels Agency (2011 February 1) About the RTFO Retrieved from httpwwwrenewablefuelsagencygovukaboutthertfo
Renewable Fuels Agency (2011 January) Year Two of the RTFO ndash Renewable Fuels Agency report on the Renewable Transport Fuel Obligation Retrieved May 12 2011 from httpwwwrenewablefuelsagencygovuksitesrfafilesYear_Two_RTFO_v2pdf
copy 2013 The International Institute for Sustainable DevelopmentRESEARCH REPORT SEPTEMBER 2013Biofuels ndash At What Cost A review of costs and benefits of UK biofuel policies 44
Swenson D (2006 June) Input-outrageous The economic impacts of modern biofuels production Iowa State Univer-sity Department of Economics Retrieved from httpwwweconiastateeduresearchotherp11233
Union of Concerned Scientists Greenpeace and World Resources Institute (2012) Indonesiarsquos moratorium on new forest concessions A review Retrieved from httpwwwucsusaorgassetsdocumentsglobal_warmingindonesia-moratorium-forest-carbon-stocks-summarypdf
US Department of Agriculture (2011) EU-27 annual biofuels report GAIN Report Retrieved from httpgainfasusdagovRecent20GAIN20PublicationsBiofuels20Annual_The20Hague_EU-27_6-22-2011pdf
Wingspread Conference on the Precautionary Principle (1998) Wingspread Consensus Statement on the Precau-tionary Principle Retrieved from httpwwwsehnorgwinghtml
copy 2013 The International Institute for Sustainable DevelopmentRESEARCH REPORT SEPTEMBER 2013Biofuels ndash At What Cost A review of costs and benefits of UK biofuel policies 45
Annex A Breakdown of Biofuel Production Plants in the UK
COMPANY LOCATION CAPACITY (MILLION LITRES)
YEAR OF FIRST OPERATION
CAPEX (MILLION euro) TYPE
British Sugar Wissington 70 2007 31 bioethanol
Ensus (Wilton) Wilton 400 2009 372 bioethanol
Butamax - demo Hull 189 2012 39 bioethanol
SolenaBritish Airways - 1st commercial
East London 0 2014 project biodiesel
Greenenergy Immingham plant
Immingham 023 2006 284 biodiesel
Argent Energy Motherwell plant
Motherwell (Scotland)
5094 2005 21 biodiesel
Harvest energy SealSands
Middlesbrough 283 2006 56 biodiesel
copy 2013 The International Institute for Sustainable DevelopmentRESEARCH REPORT SEPTEMBER 2013Biofuels ndash At What Cost A review of costs and benefits of UK biofuel policies 46
Annex B Research and Development for Advanced Biofuels The European Union and Member States foster research and development activities in the field of biofuels through various programs these programs are directed at research and development into advanced biofuels (in contrast to first-generation biofuels) from non-edible feedstocks such as wood and straw
The European Commission-funded projects listed in the table below generally involve a consortium of organizations often spread across a large number of countries that share the total value of the project funding (often only a smaller portion of the overall project funding is directed to activities within a particular country such as the UK)32 UK government-funded projects will however have a UK focus
TABLE B1 UKRELATED RESEARCH AND DEVELOPMENT PROJECTS FOR ADVANCED BIOFUELS
PROJECT NAME DURATION
EU CONTRIBUTION
(EUROS) COORDINATOR DESCRIPTION SOURCE
SUSTOIL062008-052010
992197University of Manchester
Develop advanced biorefinery schemes to convert whole EU oil-rich crops (rapeseed olive and sunflower) into energy (fuels power and heat) food and bioproducts
httpcordiseuropaeuprojectsindexcfmfuseaction=appdetailsampTXT=SUSTOILampFRM=1ampSTP=10ampSIC=ampPGA=ampCCY=ampPCY=ampSRC=ampLNG=enampREF=87800
VALORGAS032010-082013
348546200University of
Southhampton
Explores how energy potential can be realized through effective collection pre-processing and optimization of the fuel conversion technology and considers how integration of these aspects with improving conversion efficiencies
httpcordiseuropaeuprojectsindexcfmfuseaction=appdetailsampTXT=VALORGASampFRM=1ampSTP=10ampSIC=ampPGA=ampCCY=ampPCY=ampSRC=ampLNG=enampREF=94057
INTESUSAL052011-042015
5000000
National Renewable
Energy Centre limited
Demonstrates an optimized approach to generate biofuels from algae in a sustainable manner on an industrial scale
httpcordiseuropaeuprojectsindexcfmfuseaction=appdetailsampTXT=INTESUSALampFRM=1ampSTP=10ampSIC=ampPGA=ampCCY=ampPCY=ampSRC=ampLNG=enampREF=100473
SUPRA-BIO022010-072013
12318163University of Manchester
Focuses on innovative research and development of critical unit operations by improving the economic and sustainable production of fuels chemicals and materials from biomass requires capture of the maximum energy and monetary value from sustainable feedstock
httpcordiseuropaeuprojectsindexcfmfuseaction=appdetailsampTXT=SUPRA-BIOampFRM=1ampSTP=10ampSIC=ampPGA=ampCCY=ampPCY=ampSRC=ampLNG=enampREF=94178
The Algae Biofuels Challenge
2008-2015 18000000A range of
organizations
The objective is to overcome barriers to the commercialization of microalgae biofuels
httpwwwccapacukdocu-mentsBPSJan2010_Carbon-Trustpdf
32 Research and development project funding can also be divided across non-biofuel related research activities involving energy or agricultural applications In addition to the EC funding these projects receive financial contributions from the private sector
wwwiisdorggsi GSI is an initiative of the International Institute for Sustainable Development
Further details and contact informationFor further information contact Peter Wooders at +41 22 917-8790 pwoodersiisdorg or Damon Vis-Dunbar at +41 22 917-8848 dvis-dunbariisdorg
International Institute for Sustainable Development
Global Subsidies Initiative
International Environment House 2 9 chemin de Balexert 1219 Chacirctelaine Geneva Switzerland
Tel +41 22 917-8373 | Fax +41 22 917-8054
- BOX 1 CONTEXTUALIZING THE NUMBERS SUBSIDIES TO BIOFUELS COMPARED TO SUBSIDIES TO OTHER ENERGY SOURCES
- BOX 2 THE MECHANICS OF BIOFUEL SUBSIDIES IN EUROPE
- BOX 3 METHODOLOGICAL NOTE ON ESTIMATING THE SUPPORT PROVIDED BY MEMBER STATE CONSUMPTION MANDATES
- Box 4 Biofuel production What types of jobs are being created
-
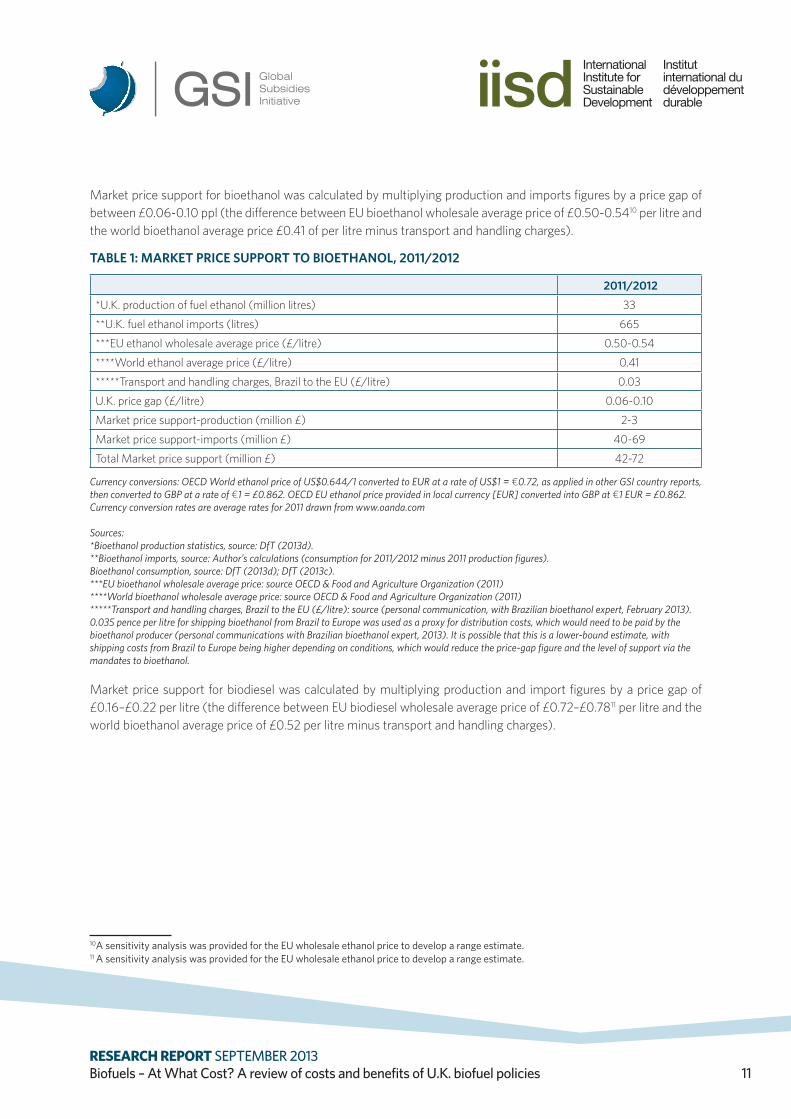
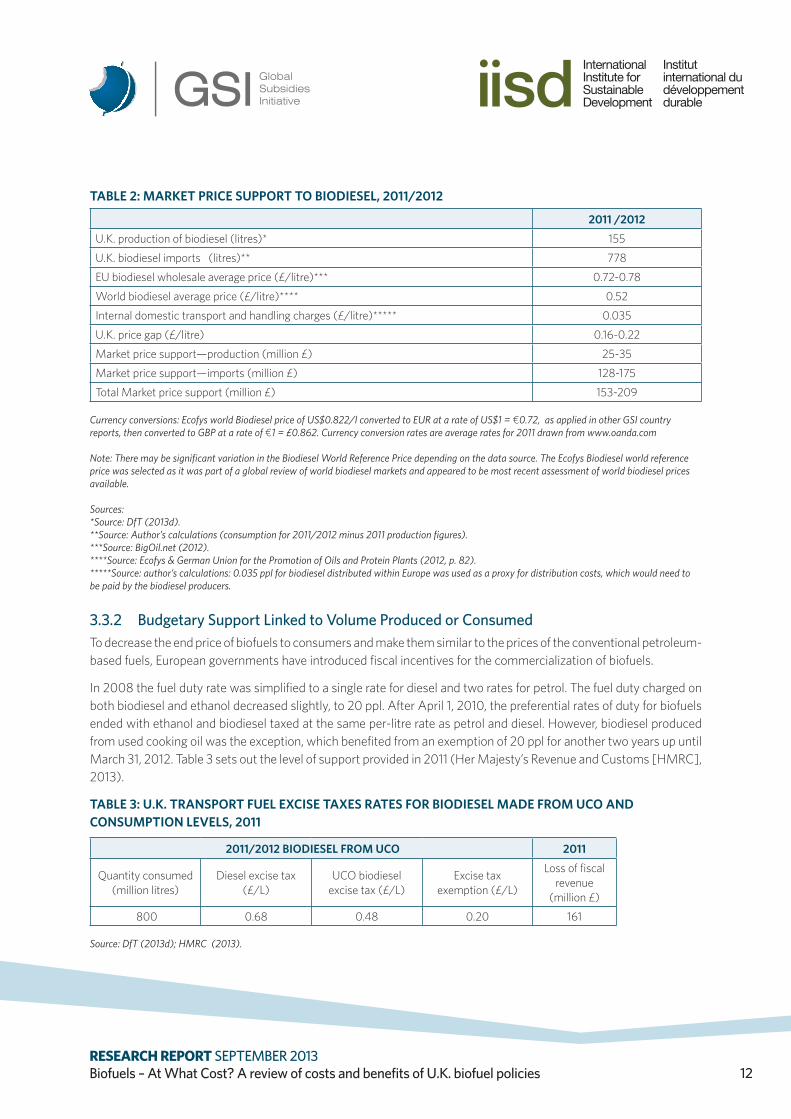
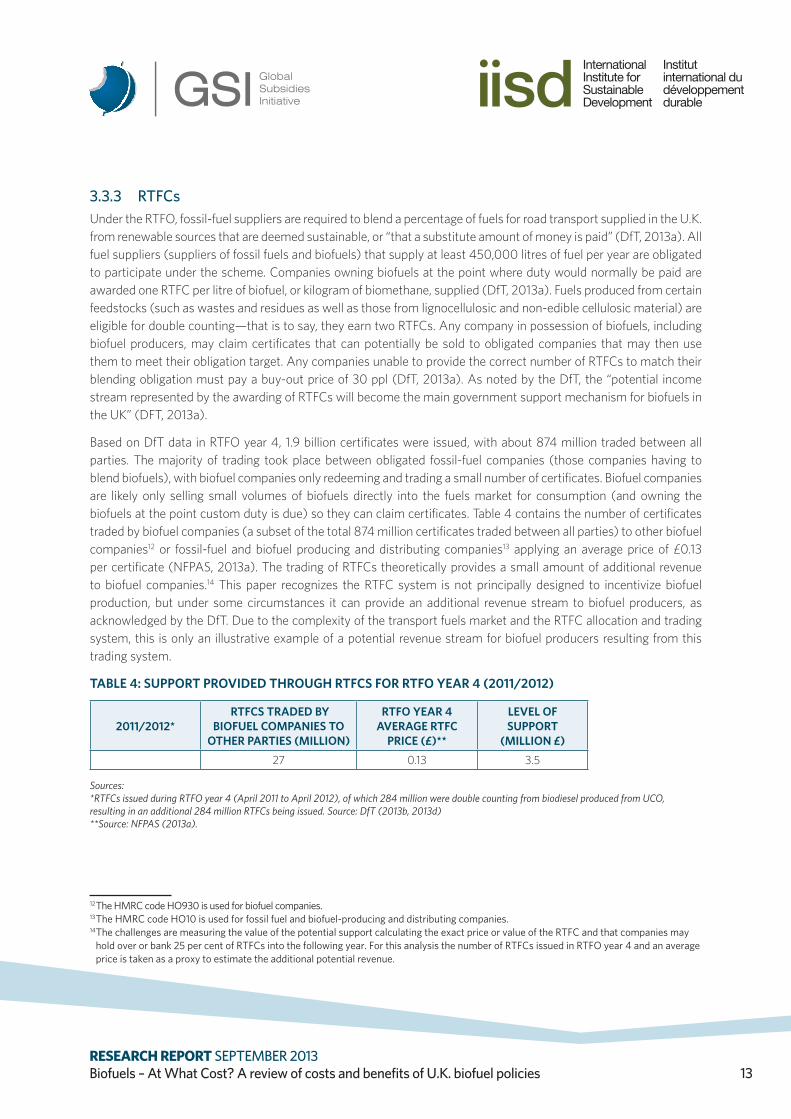
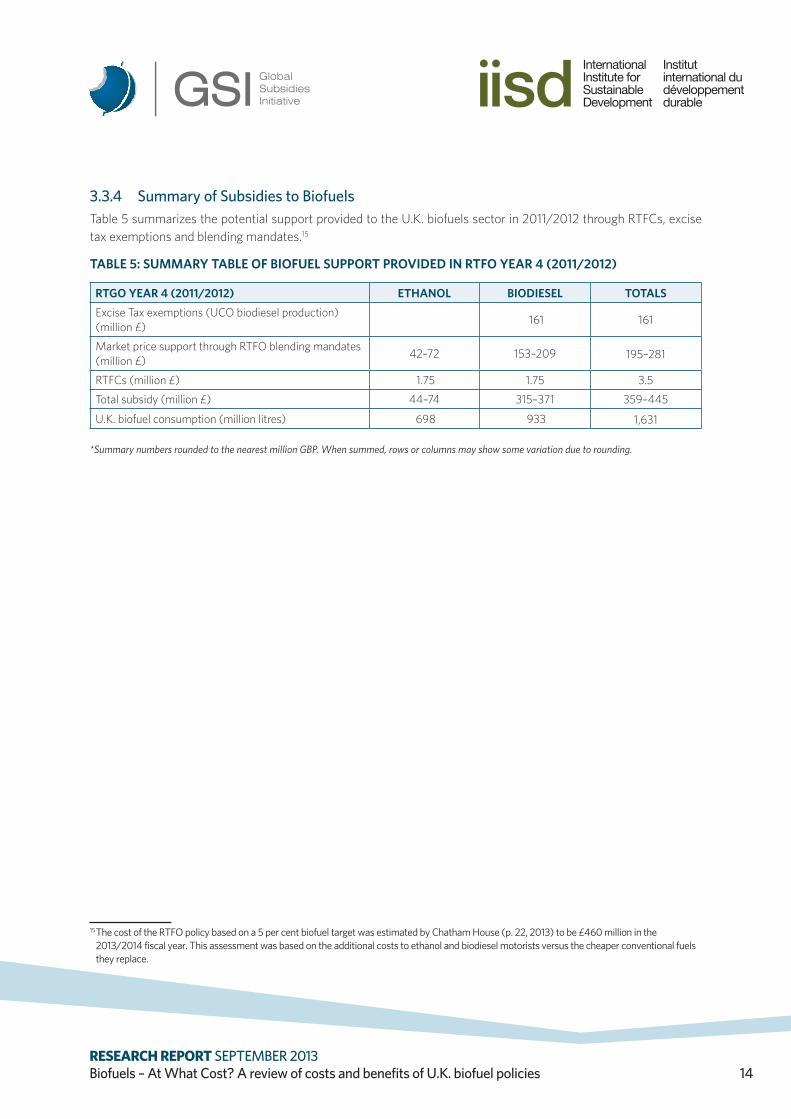
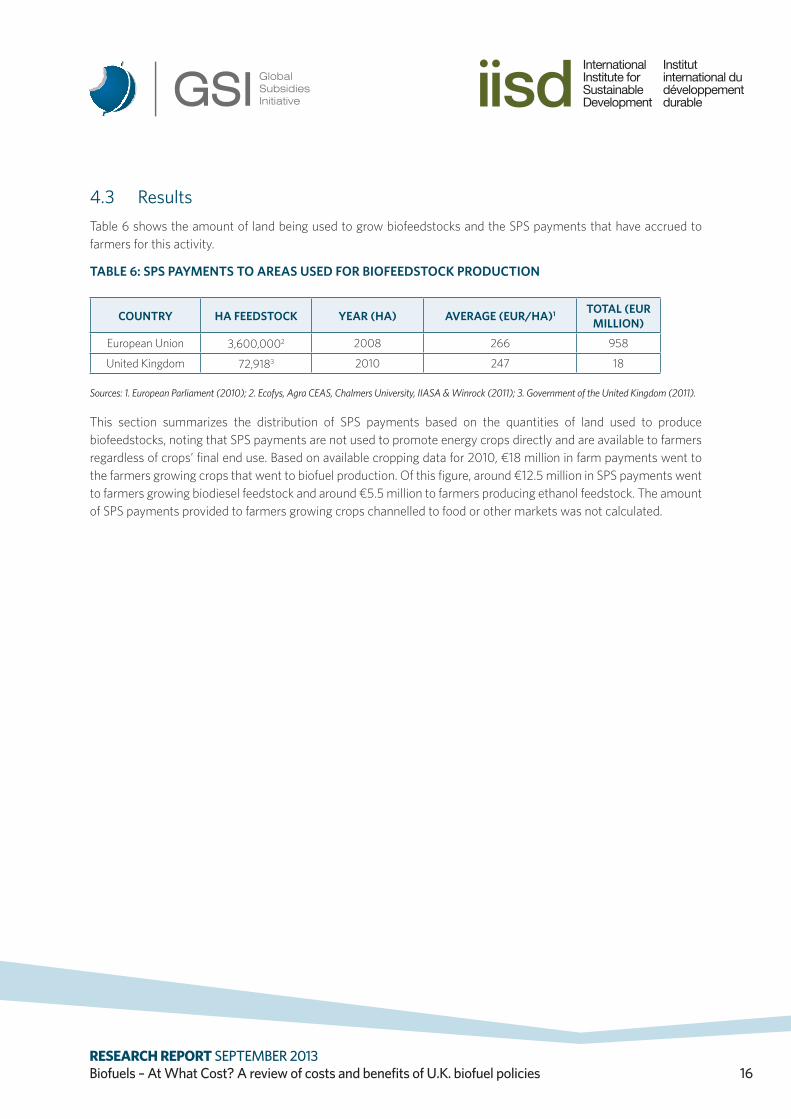
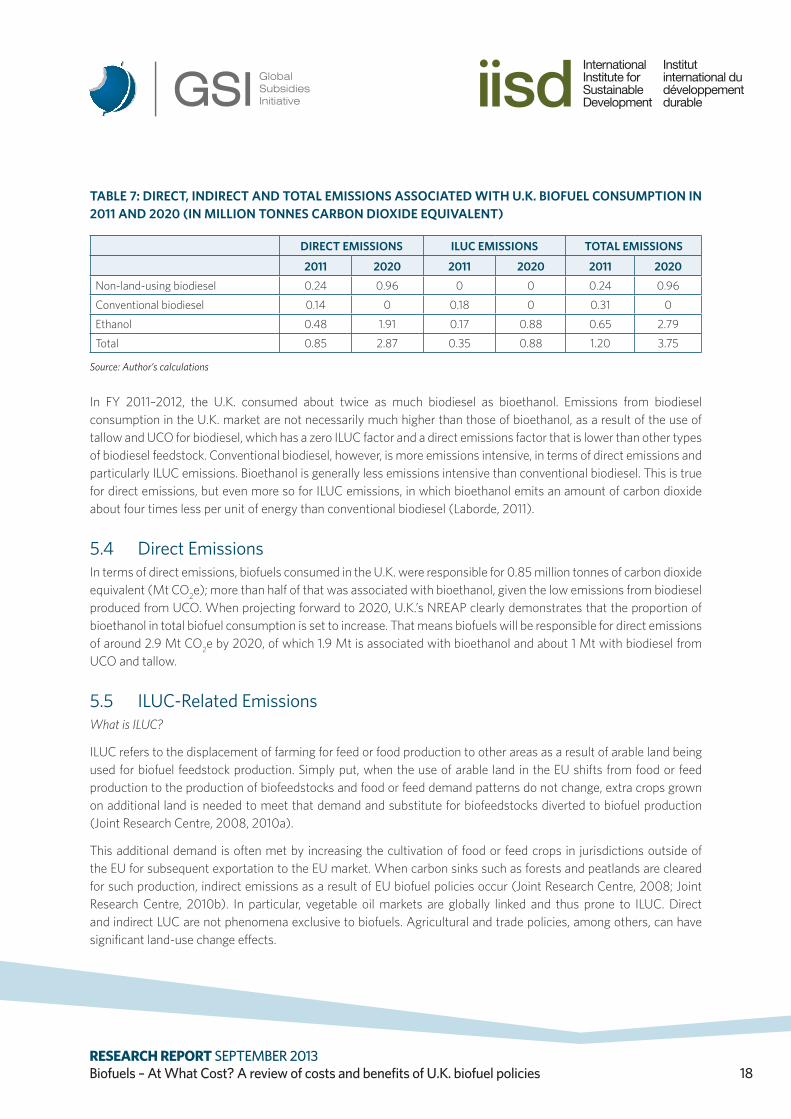
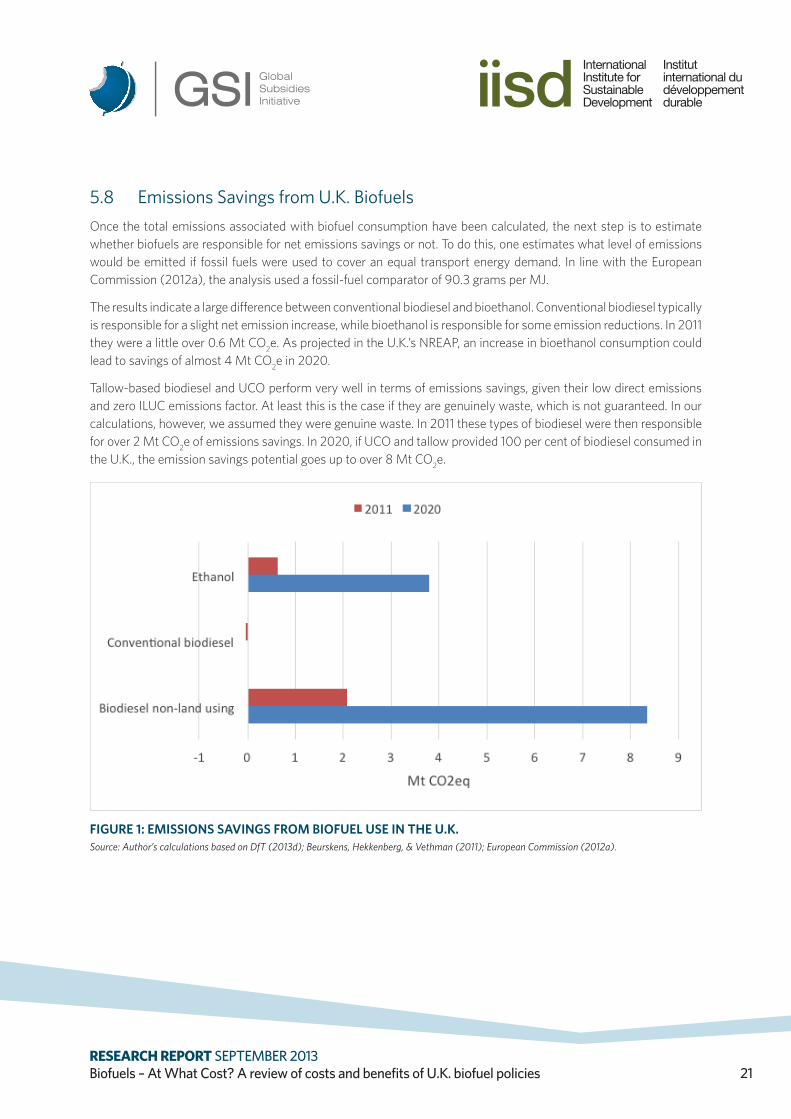
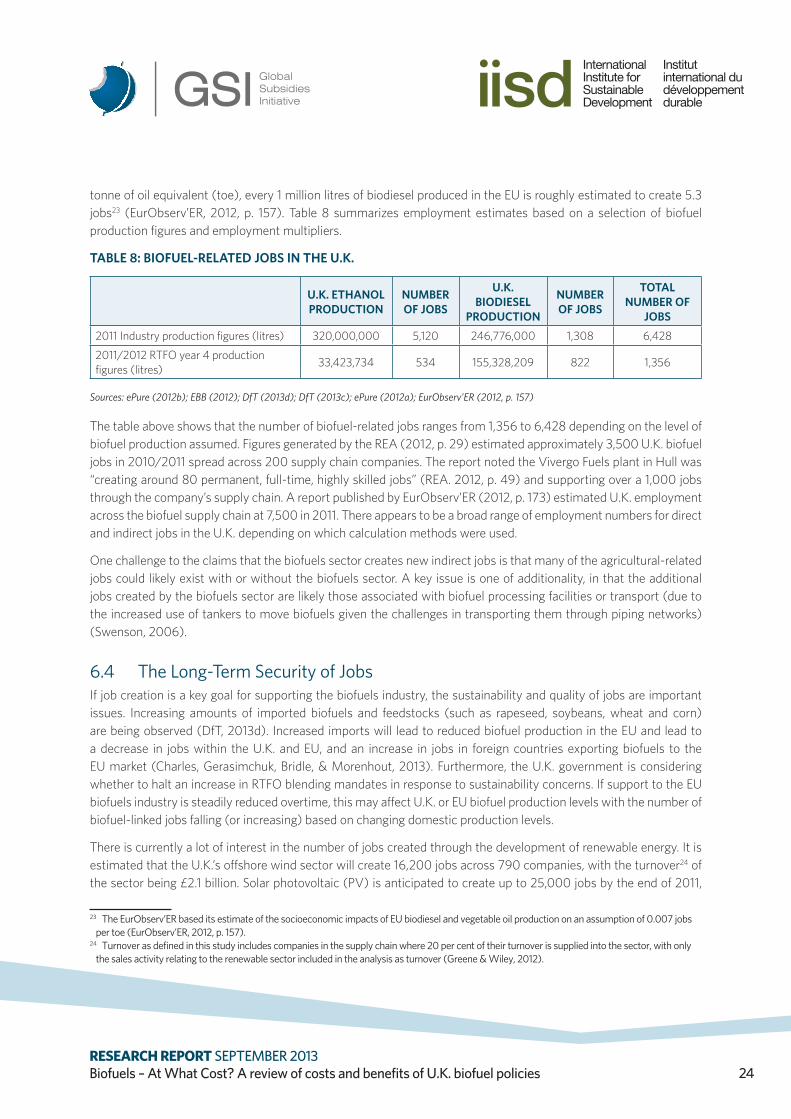
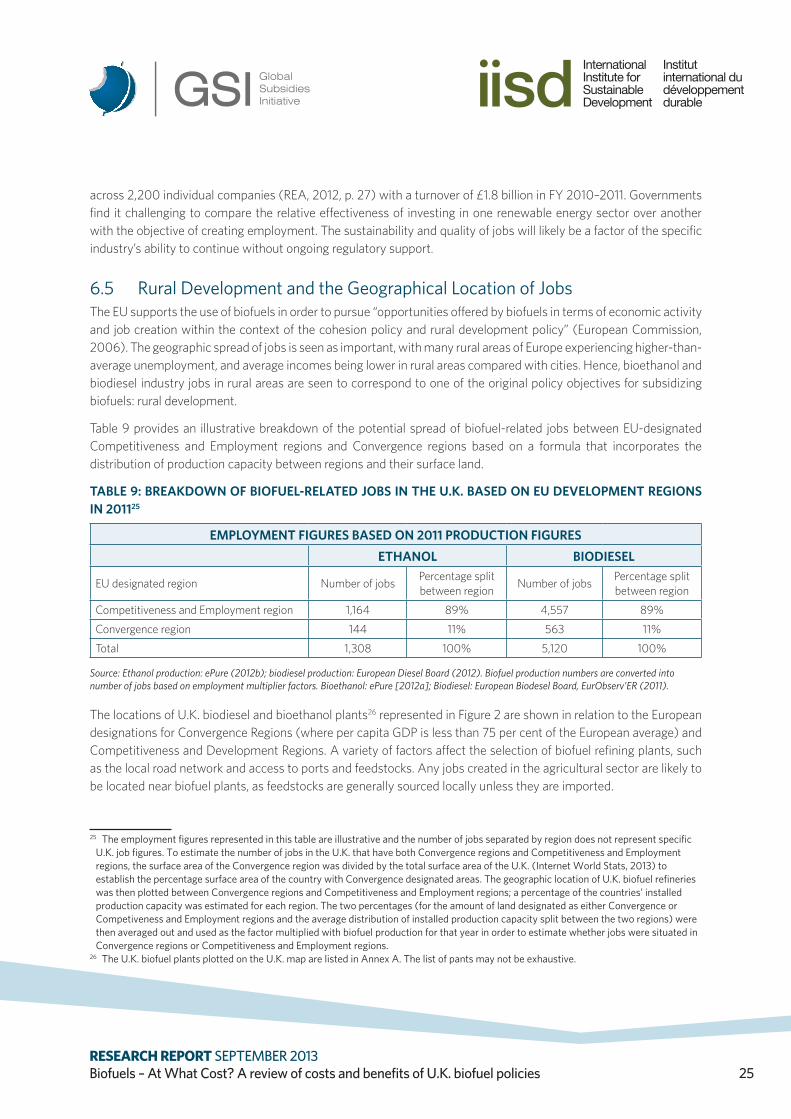
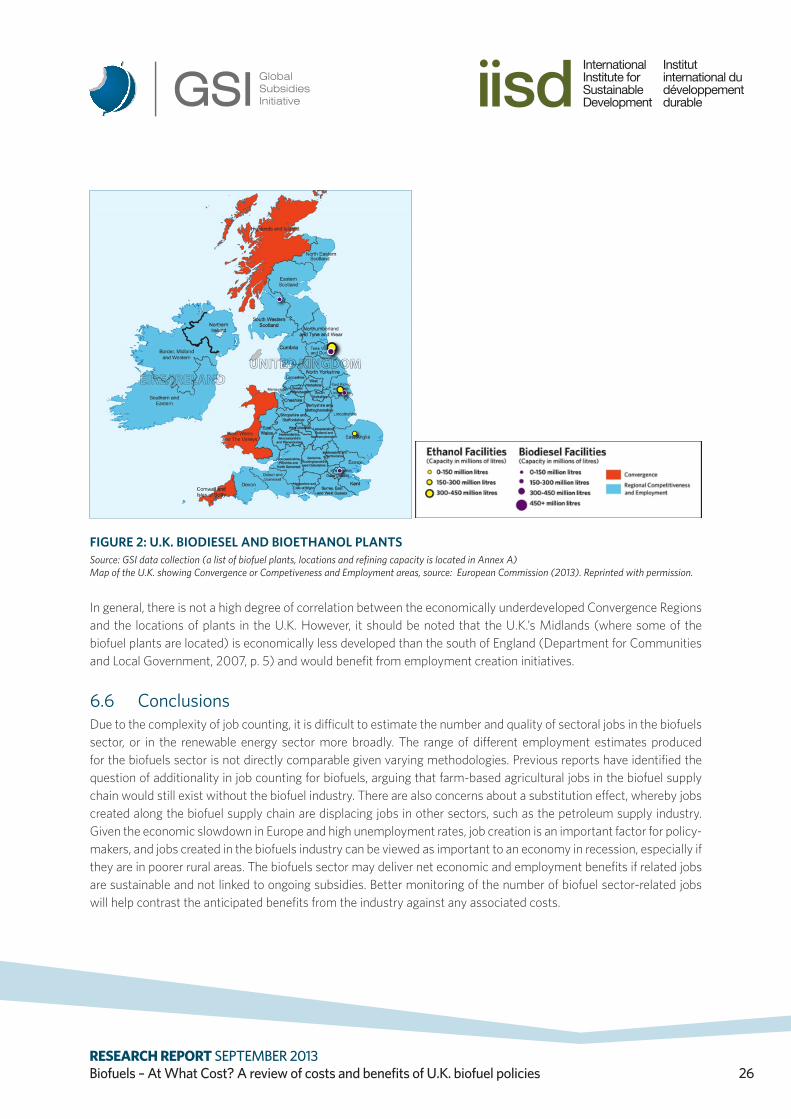
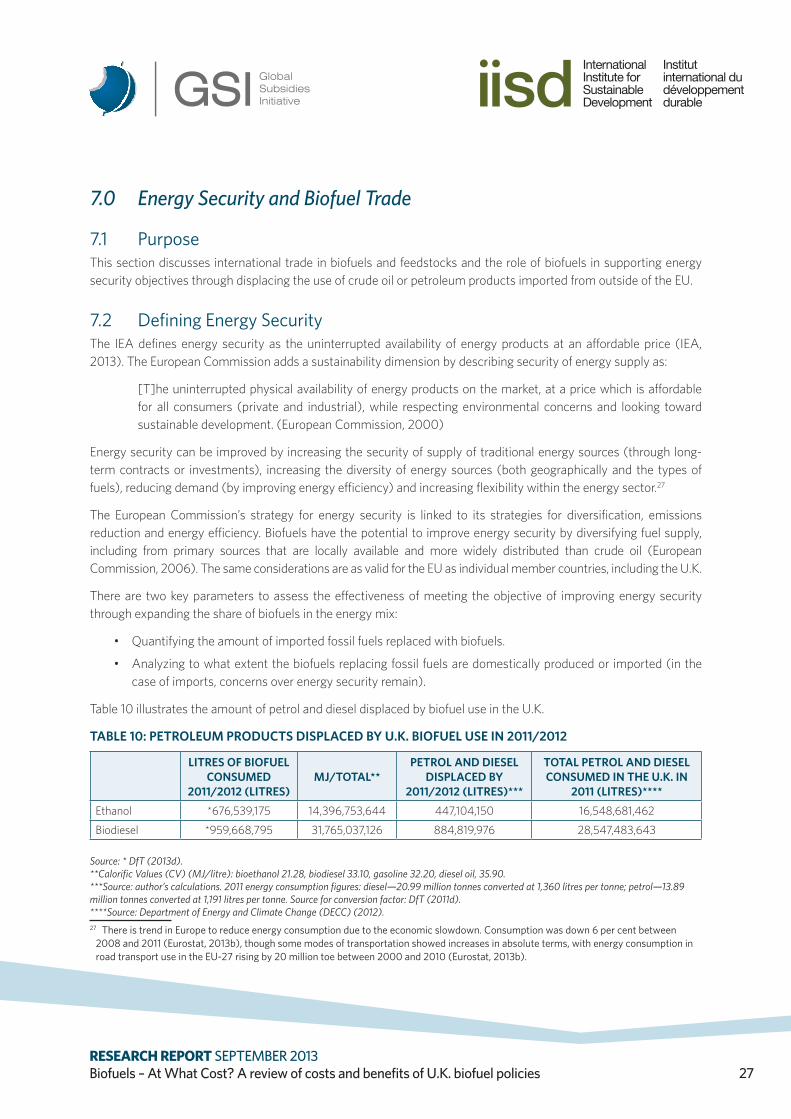
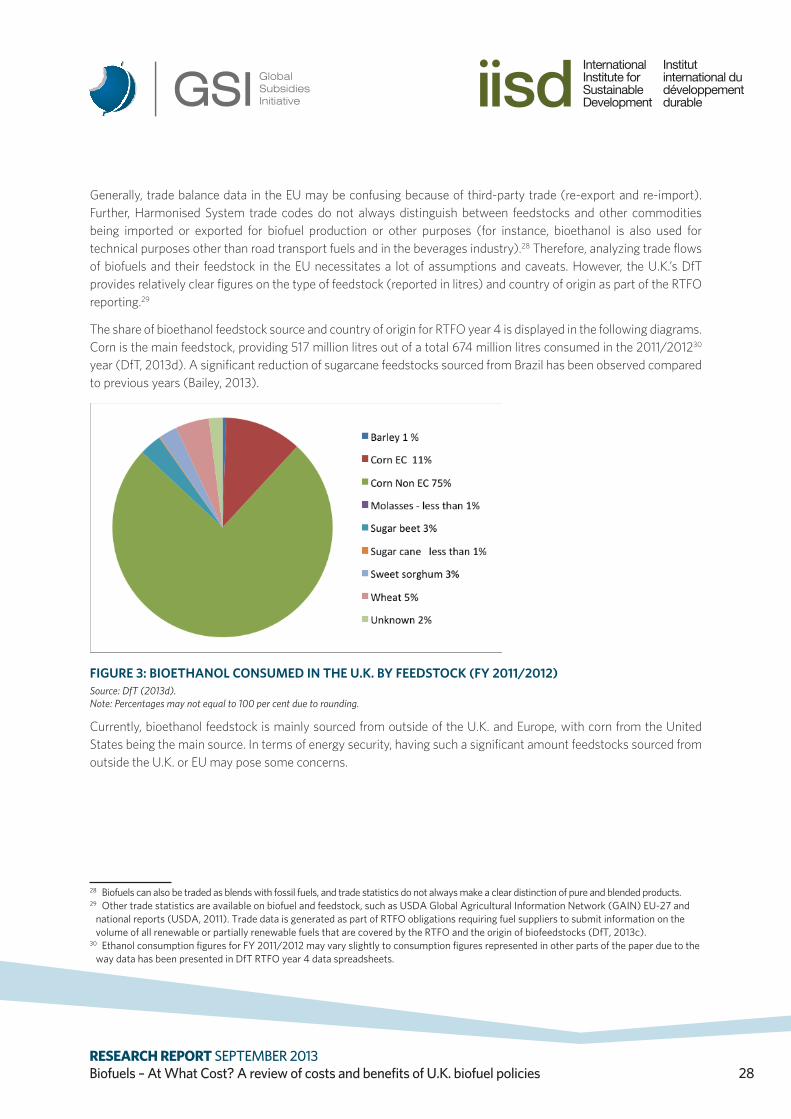
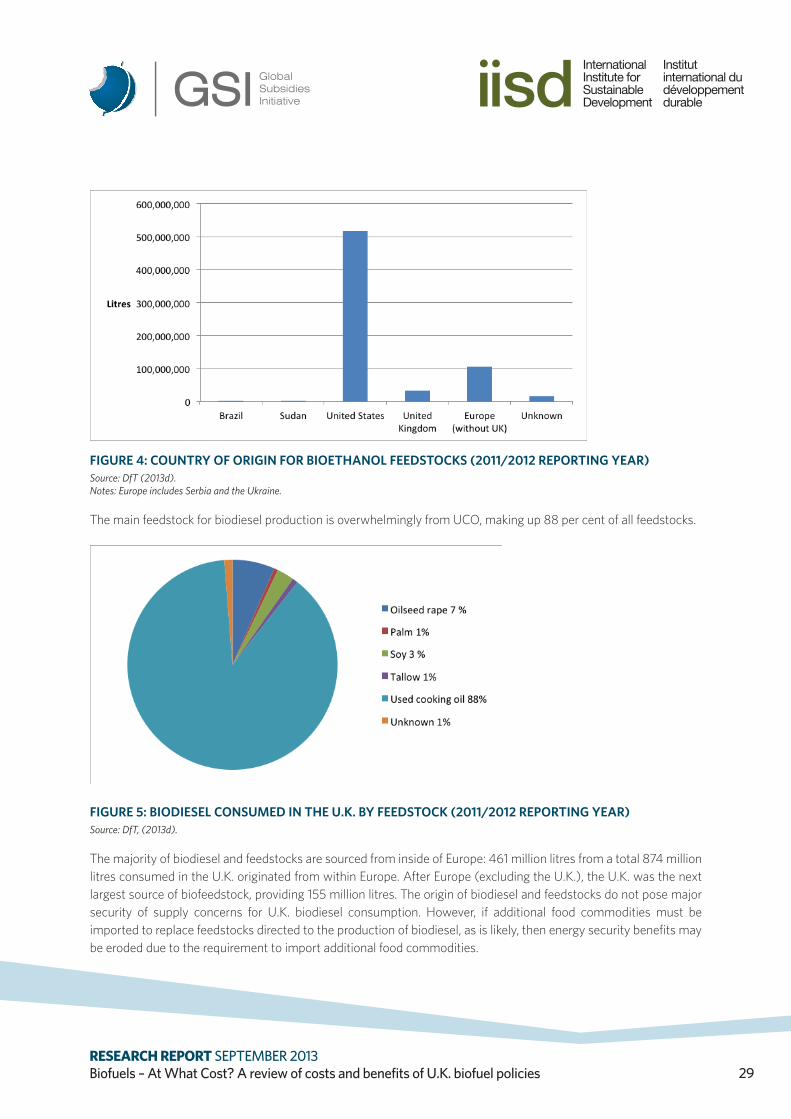
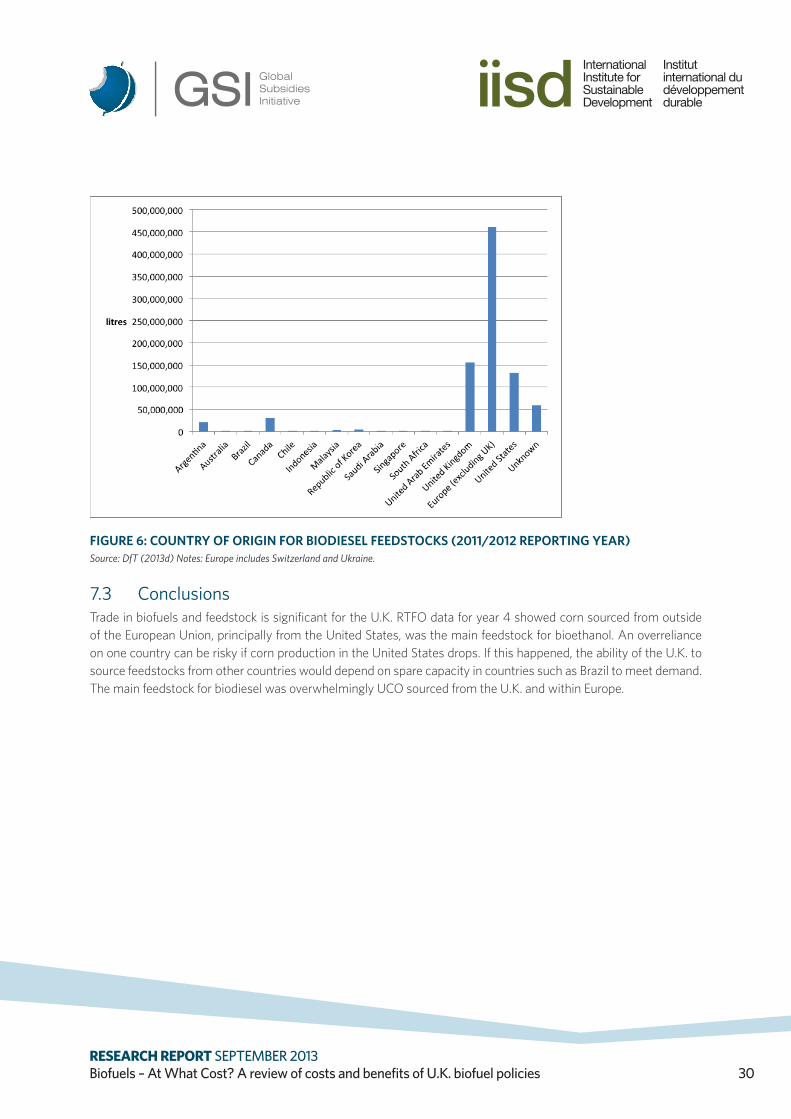
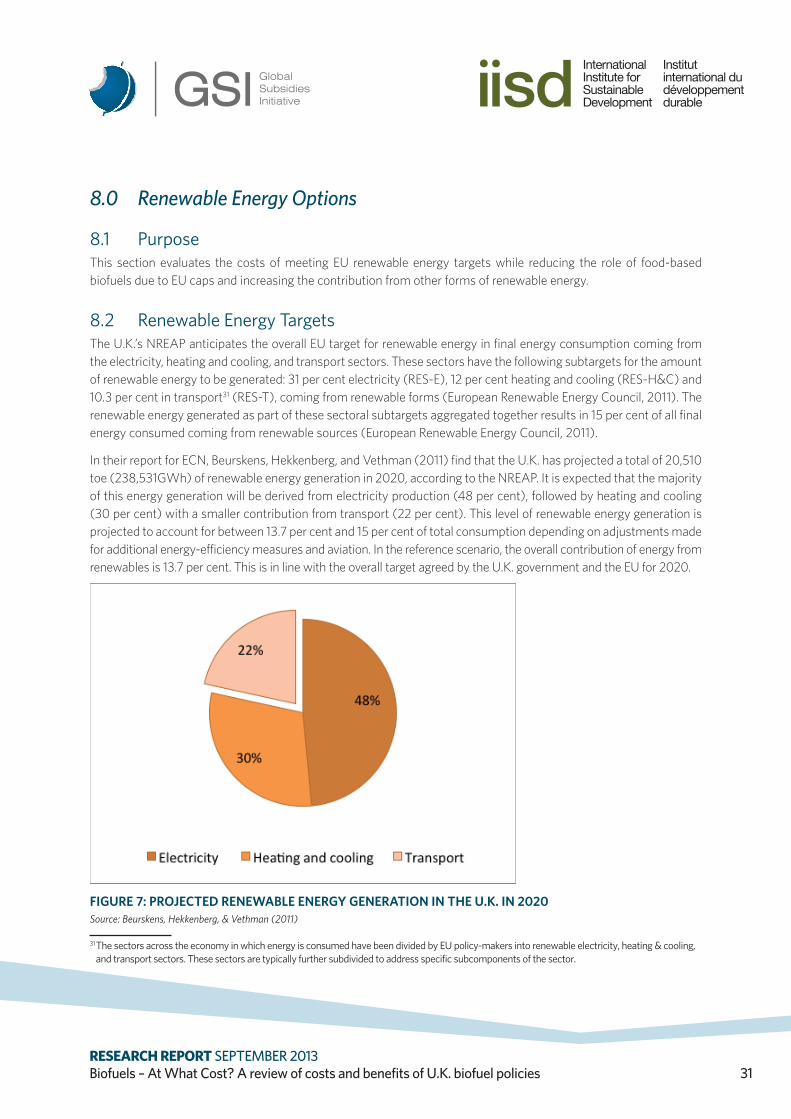
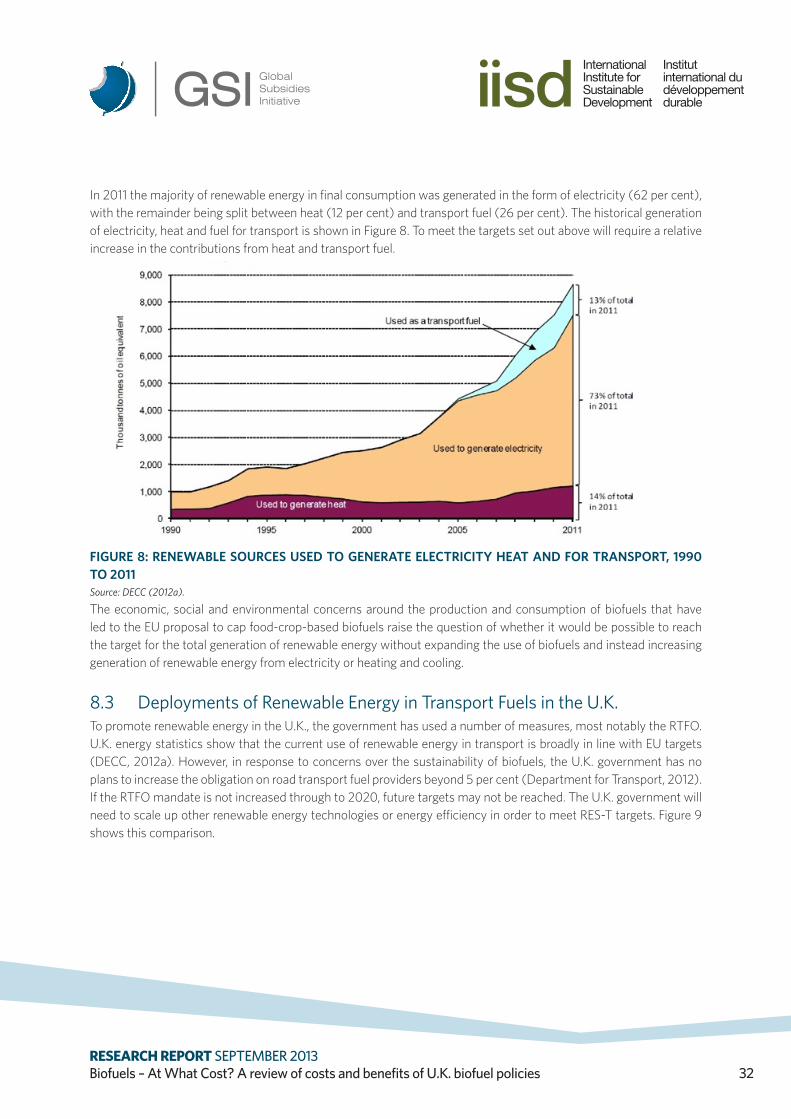
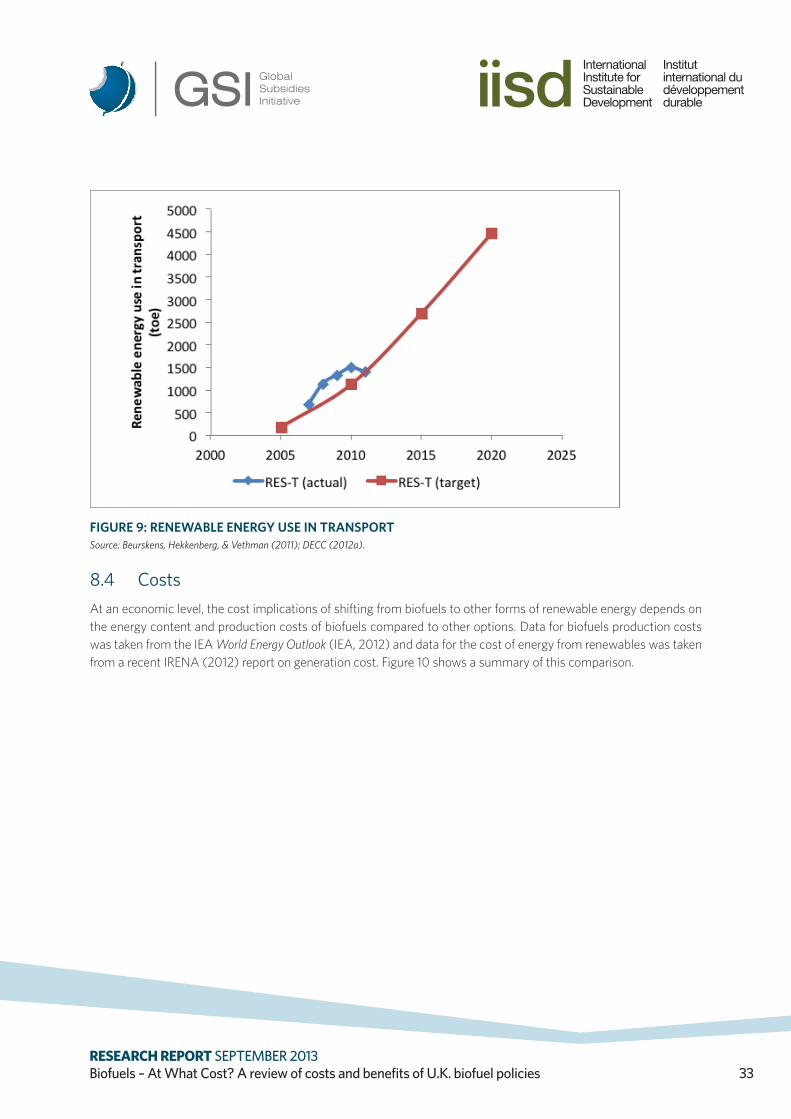
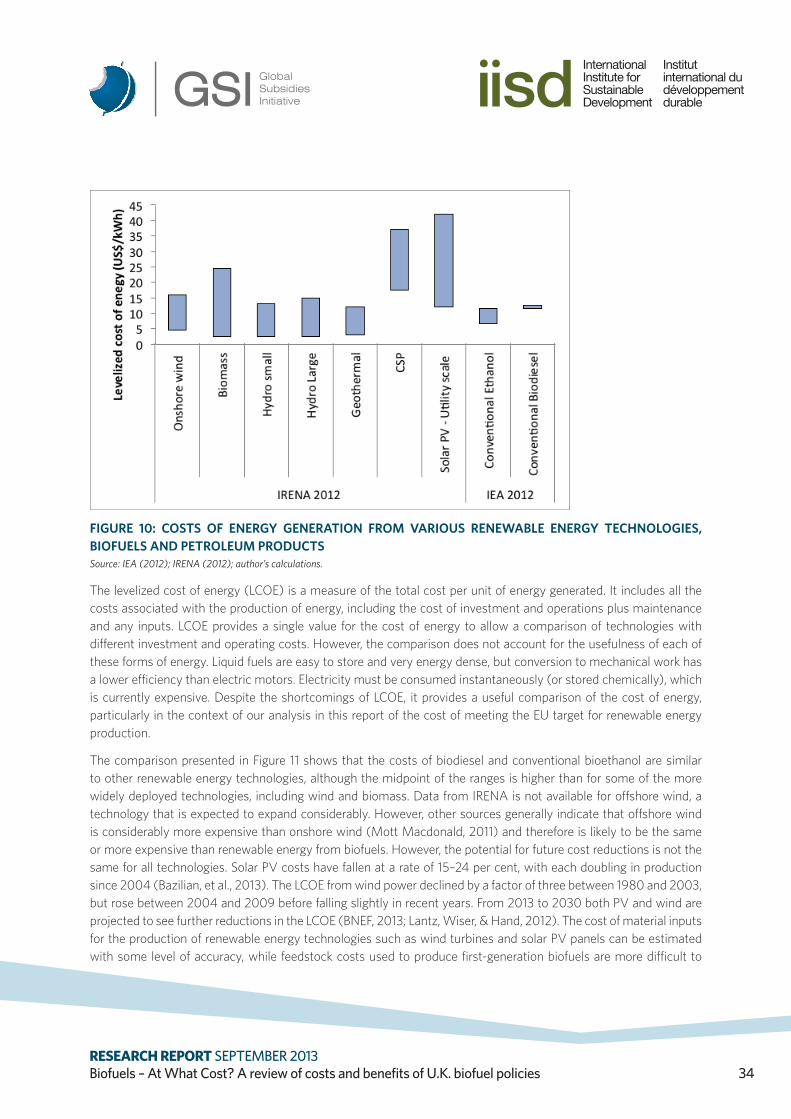
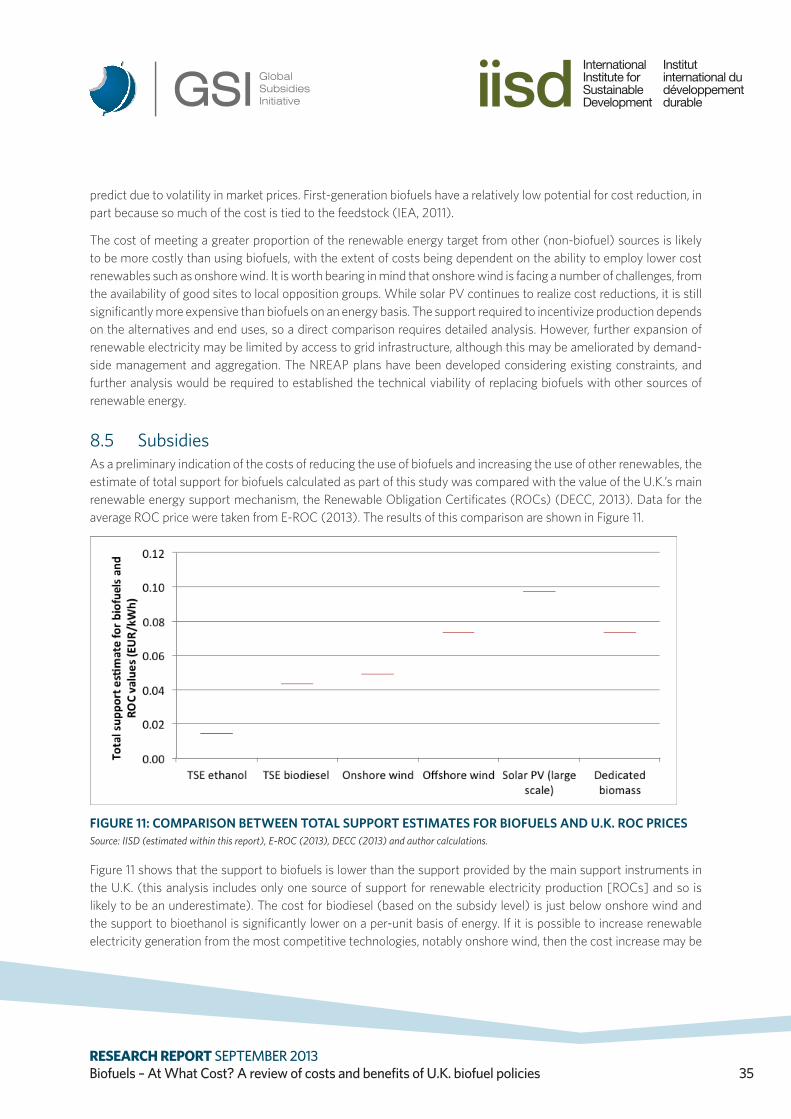
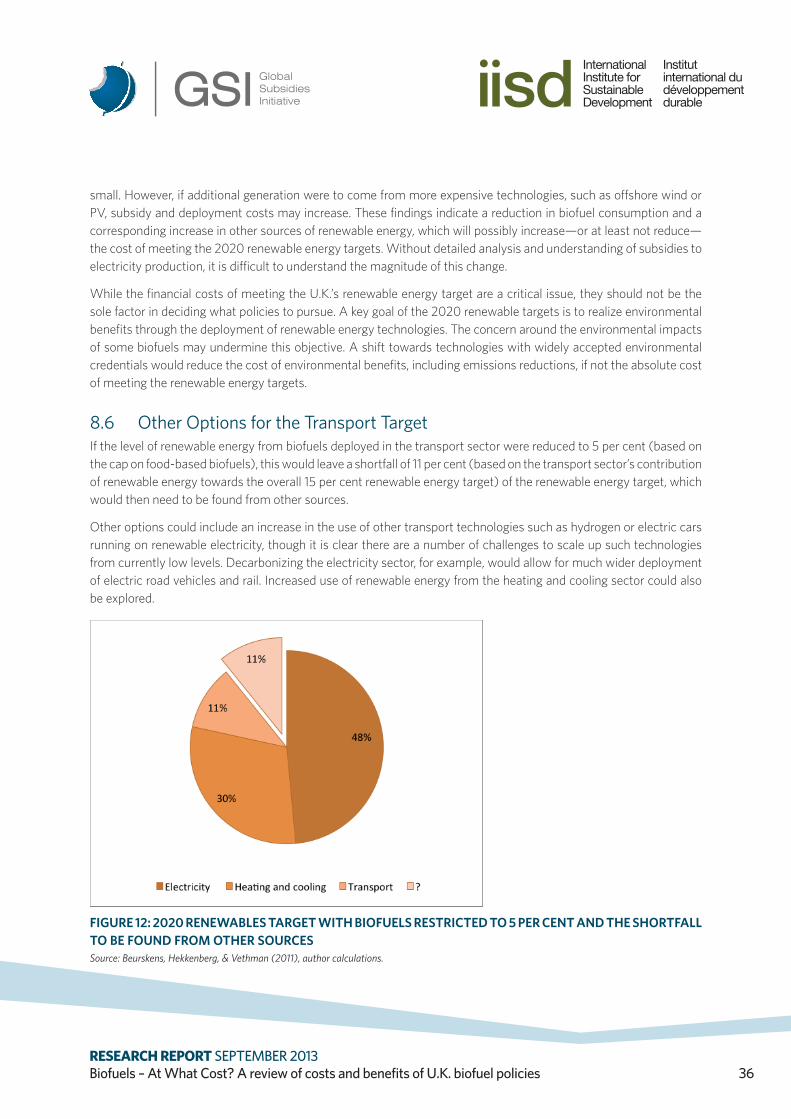
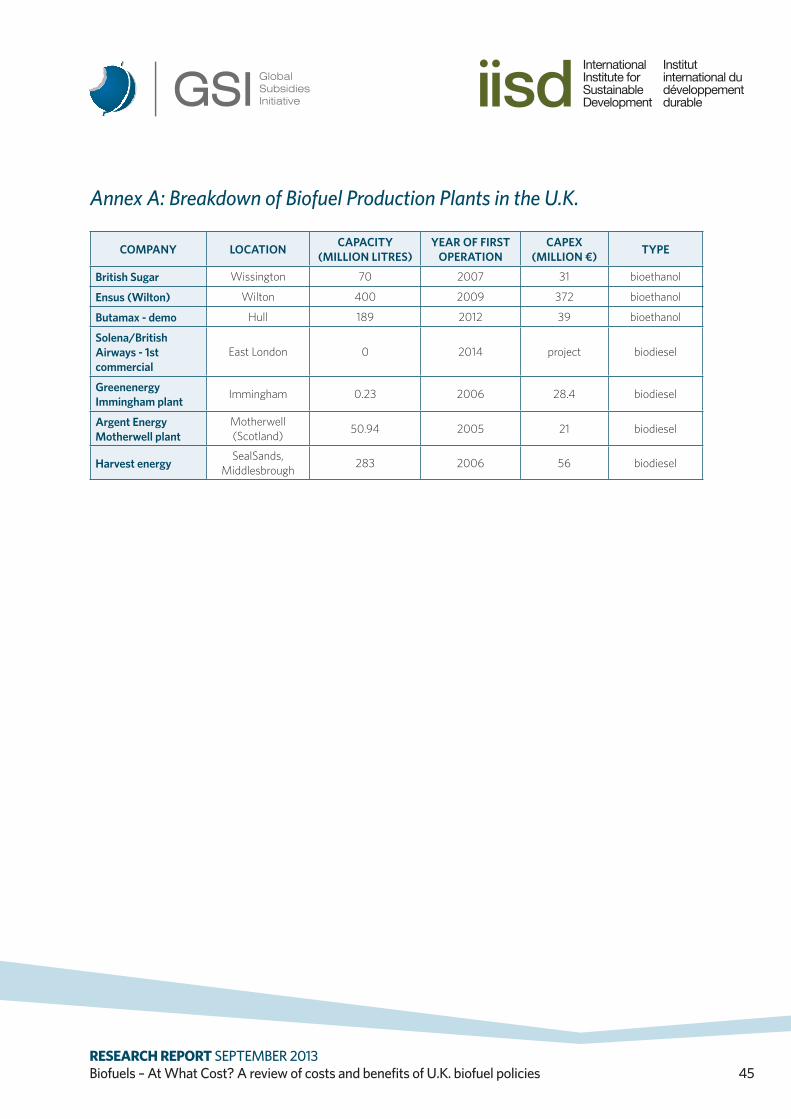
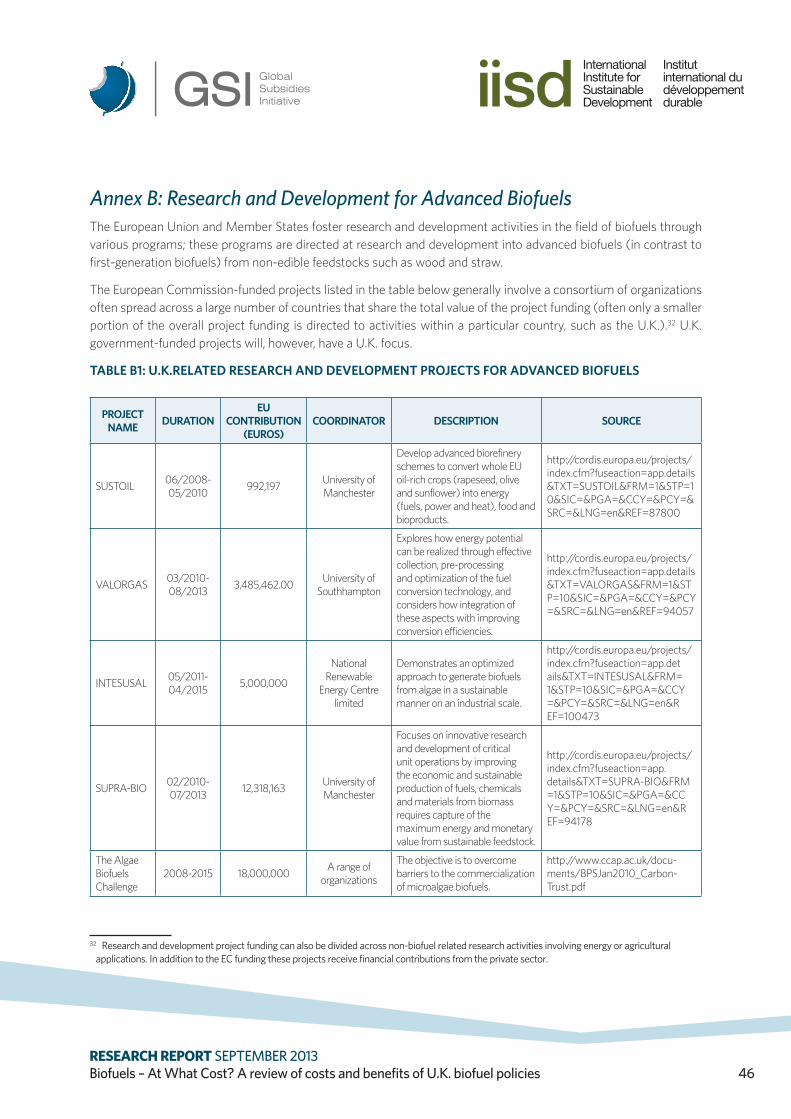