biofluid proteomics: potential, pitfalls, and solutions · biofluid proteomics: potential,...
TRANSCRIPT
Biofluid Proteomics: Potential, Pitfalls, and Solutions
Biofluid Proteomics: Potential, Pitfalls, and Solutions
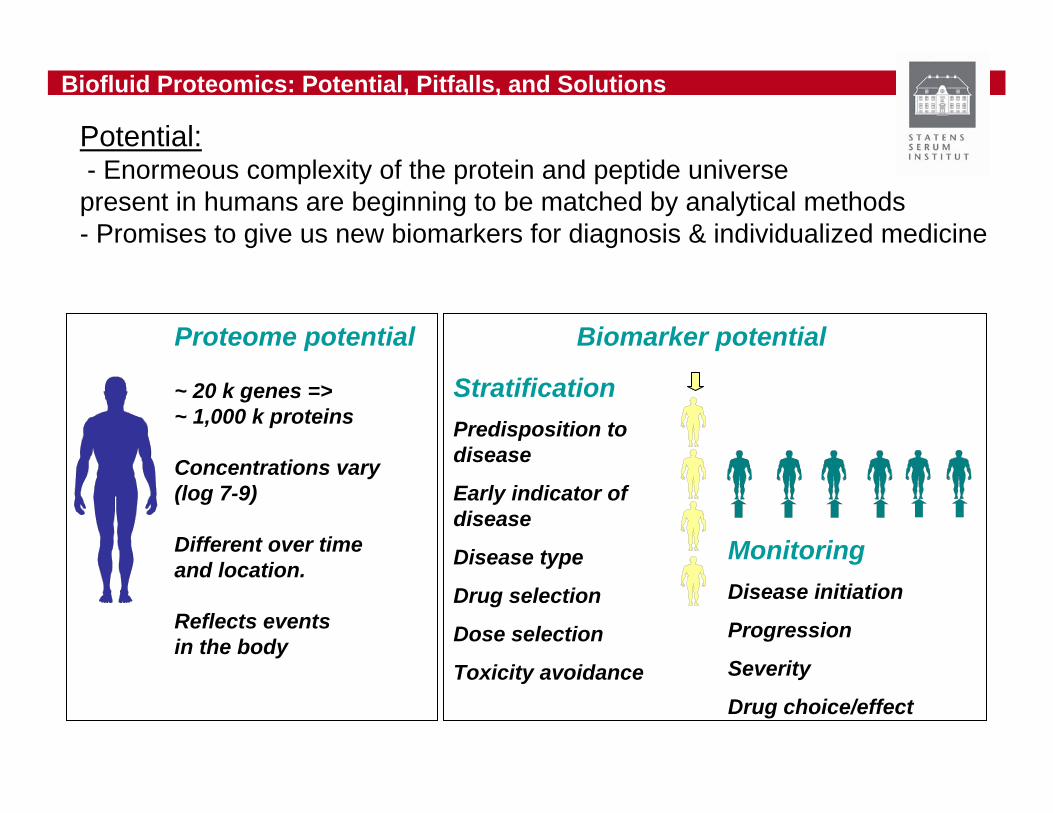
Potential:- Enormeous complexity of the protein and peptide universe present in humans are beginning to be matched by analytical methods- Promises to give us new biomarkers for diagnosis & individualized medicine
StratificationPredisposition to disease
Early indicator of disease
Disease type
Drug selection
Dose selection
Toxicity avoidance
MonitoringDisease initiation
Progression
Severity
Drug choice/effect
Proteome potential
~ 20 k genes => ~ 1,000 k proteins
Concentrations vary (log 7-9)
Different over time and location.
Reflects events in the body
Biomarker potential

Biofluid Proteomics: Potential, Pitfalls, and Solutions
Evolution of protein analytical methods• Zone gel electrophoresis
- 5-10 bands• Immunoelectrophoresis
- 20-50 proteins• SDS-polyacrylamide gel electrophoresis
- 50-100 protein bands• Two-dimensional gel electrophoresis – more than 1000
proteins• Mass spectrometry - ~30,000 data points/sample; 100 of
peptides/proteins• Two-dimensional on-line separations (e.g. LC-mass
spec) - 1,000 of proteins
Biofluid Proteomics: Potential, Pitfalls, and Solutions
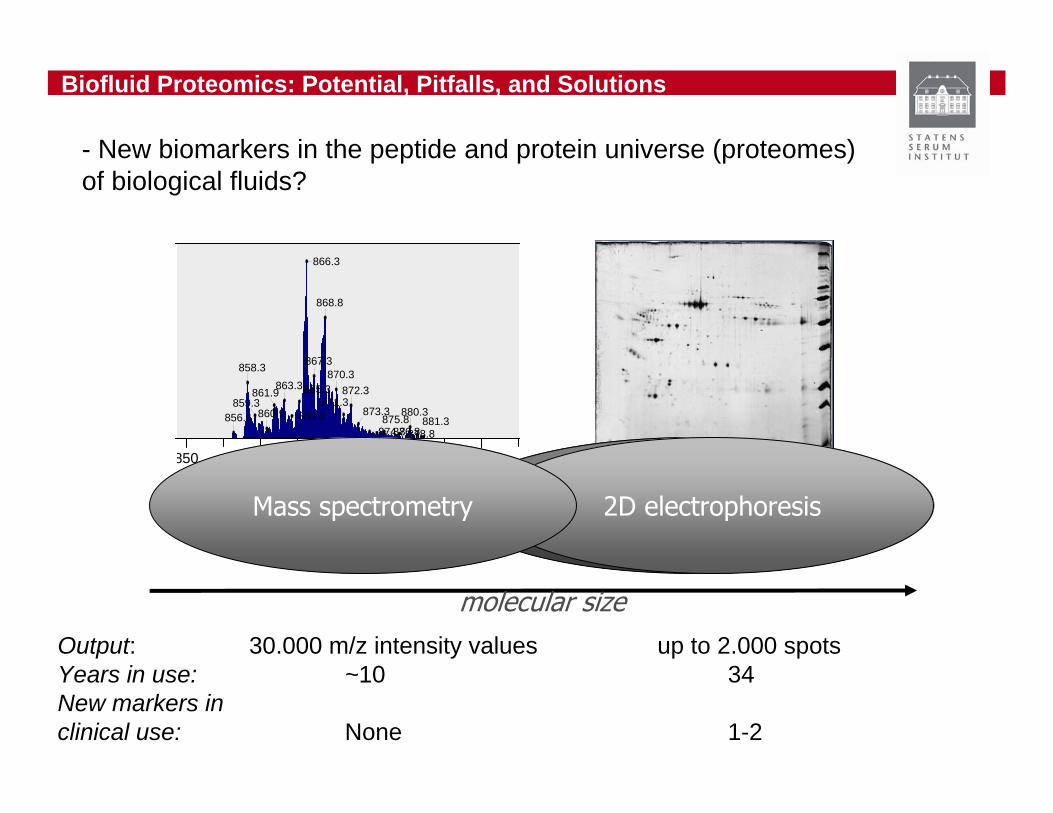
- New biomarkers in the peptide and protein universe (proteomes)of biological fluids?
866.3
868.8
867.3858.3 870.3863.3865.3861.9 872.3
871.3859.3864.3 873.3 880.3860.9
876.8874.8856.4 875.8
878.8881.3
850 860 870 880 890m/z
Output: 30.000 m/z intensity values up to 2.000 spots Years in use: ~10 34New markers inclinical use: None 1-2
2D electrophoresisMass spectrometry
molecular size
Biofluid Proteomics: Potential, Pitfalls, and Solutions
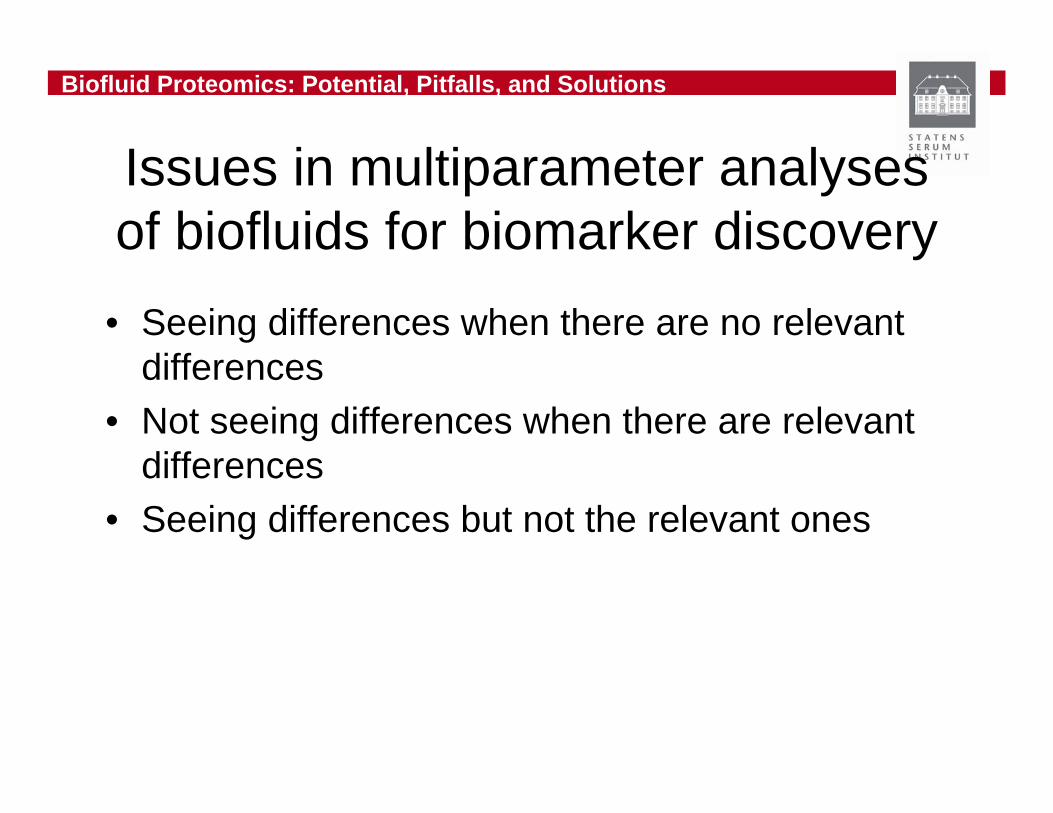
Issues in multiparameter analysesof biofluids for biomarker discovery• Seeing differences when there are no relevant
differences• Not seeing differences when there are relevant
differences• Seeing differences but not the relevant ones
Biofluid Proteomics: Potential, Pitfalls, and Solutions
Variability in biofluid analysis
• We are interested in the biological variables associated with a specific pathological condition
• This is obscured by tremendous noise
Biofluid Proteomics: Potential, Pitfalls, and Solutions
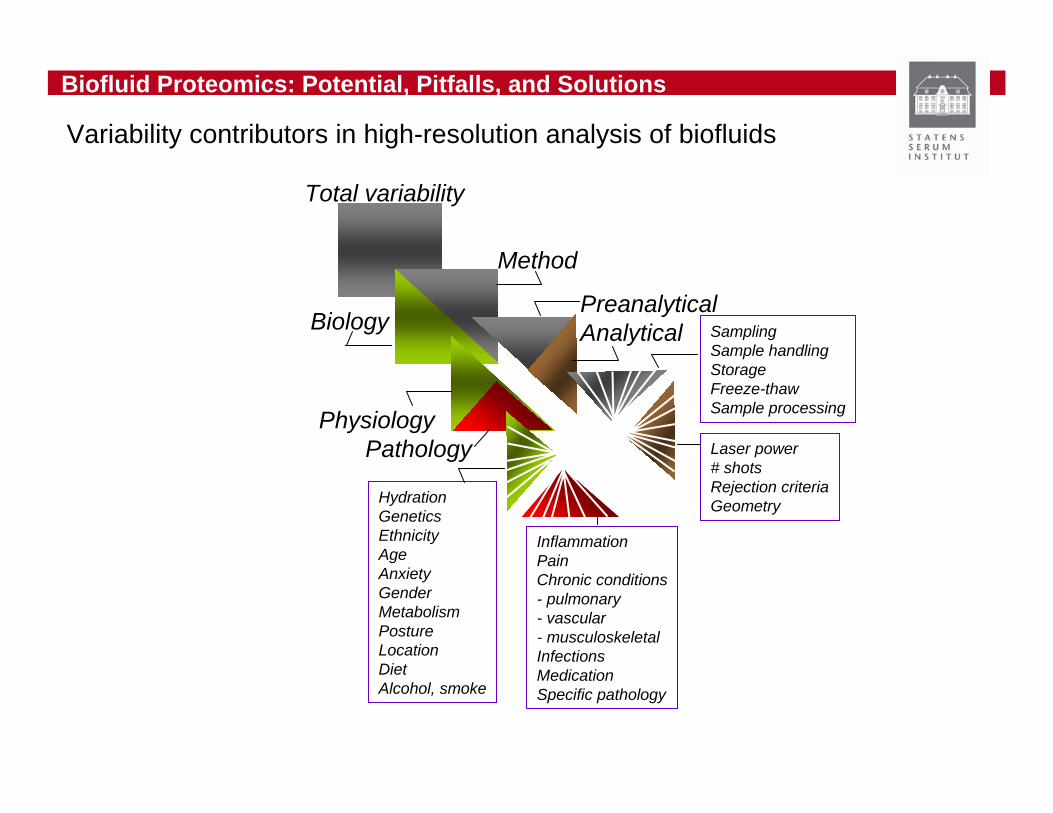
Total variability
Biology
Method
PhysiologyPathology
HydrationGeneticsEthnicityAgeAnxietyGenderMetabolismPostureLocationDietAlcohol, smoke
InflammationPainChronic conditions- pulmonary- vascular- musculoskeletalInfectionsMedicationSpecific pathology
PreanalyticalAnalytical Sampling
Sample handlingStorageFreeze-thawSample processing
Laser power# shotsRejection criteriaGeometry
Variability contributors in high-resolution analysis of biofluids

Biofluid Proteomics: Potential, Pitfalls, and Solutions
Seeing differences between groups using analyses yielding multiple variables
• Overfitting is an obvious risk – too many data and too few samples– We need at least 10 times more samples than
features!– Look for univariate effects– Bonferroni-correct significance levels (p/N)– Use PCA first or other unsupervised method– Do permutation analysis– Independently train, cross-validate, and validate

Biofluid Proteomics: Potential, Pitfalls, and Solutions
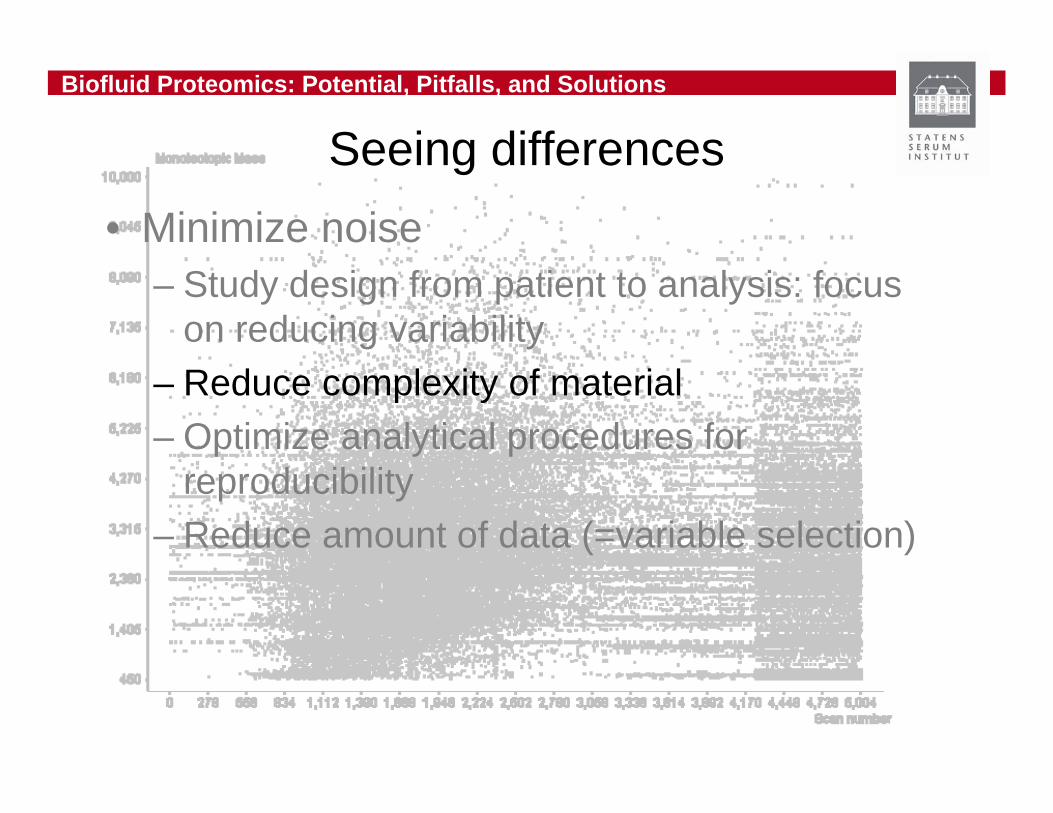
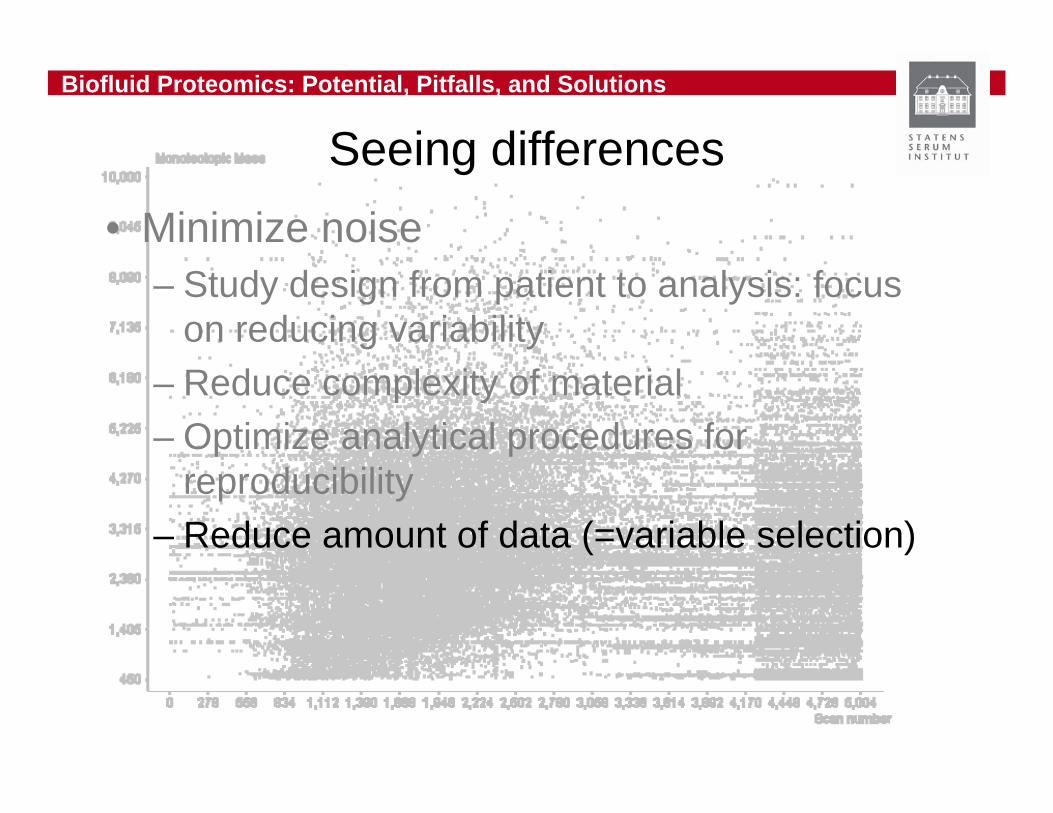
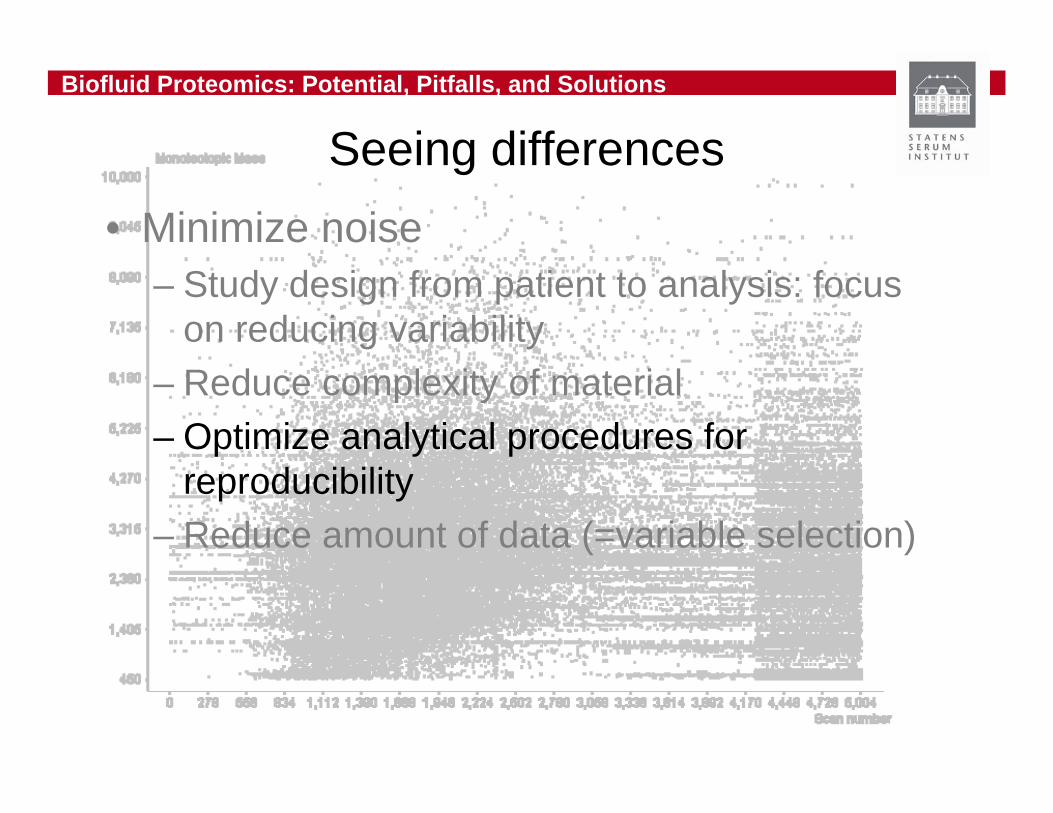
Seeing differences
• Minimize noise– Study design from patient to analysis: focus
on reducing variability– Reduce complexity of material– Optimize analytical procedures for
reproducibility– Reduce amount of data (=variable selection)

Biofluid Proteomics: Potential, Pitfalls, and Solutions
• All samples (disease and disease-control) collected in a specialized clinic following uniform and strict guidelines. Only womenwith a risk-of-malignancy index RMI > 150, and age > 18 years are included.
• >400 sera were collected. 25 % expected malignant (borderline to stage IV). 75 % are expected to be benign conditions
• Samples are thawed on ice and handled on a fractionation robot using WCX beads and IMAC-Cu beads at 22°C and humidity set to35%
Ovarian Cancer proteomicsPelvic Mass Study
Minimize noise - Study Design
Biofluid Proteomics: Potential, Pitfalls, and Solutions
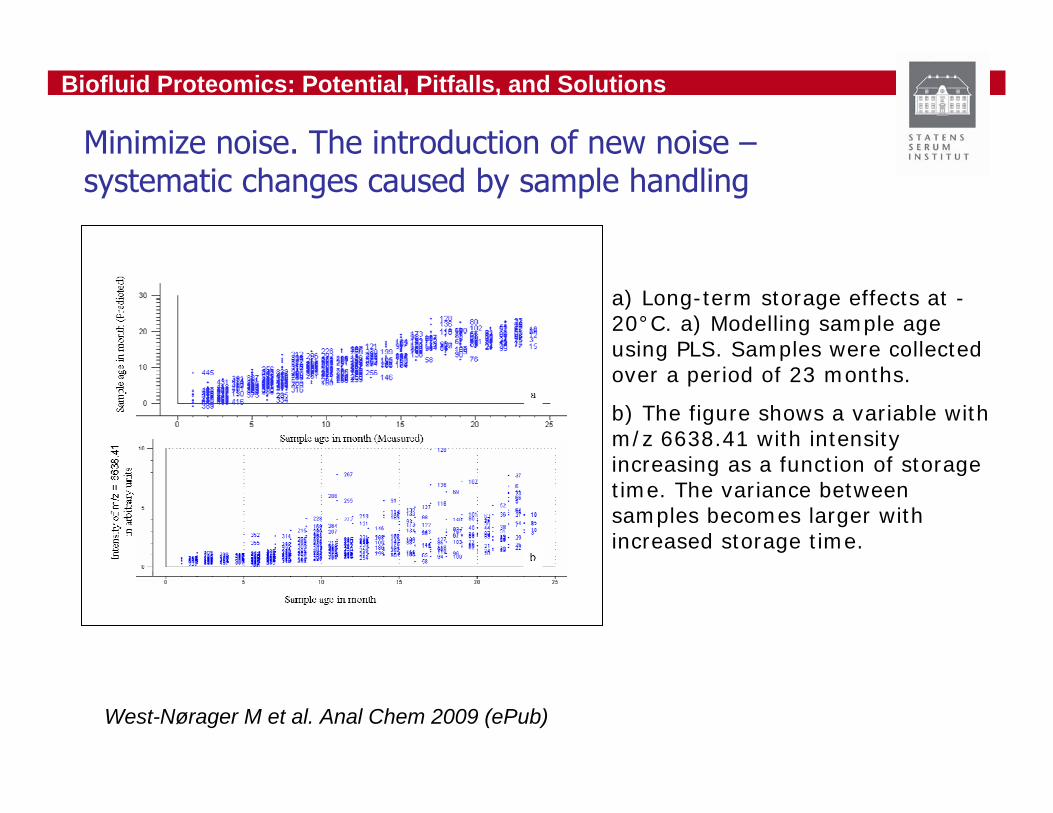
Minimize noise. The introduction of new noise –systematic changes caused by sample handling
a) Long-term storage effects at -20°C. a) Modelling sample age using PLS. Samples were collected over a period of 23 months.
b) The figure shows a variable with m/z 6638.41 with intensity increasing as a function of storage time. The variance between samples becomes larger with increased storage time.
West-Nørager M et al. Anal Chem 2009 (ePub)
Biofluid Proteomics: Potential, Pitfalls, and Solutions
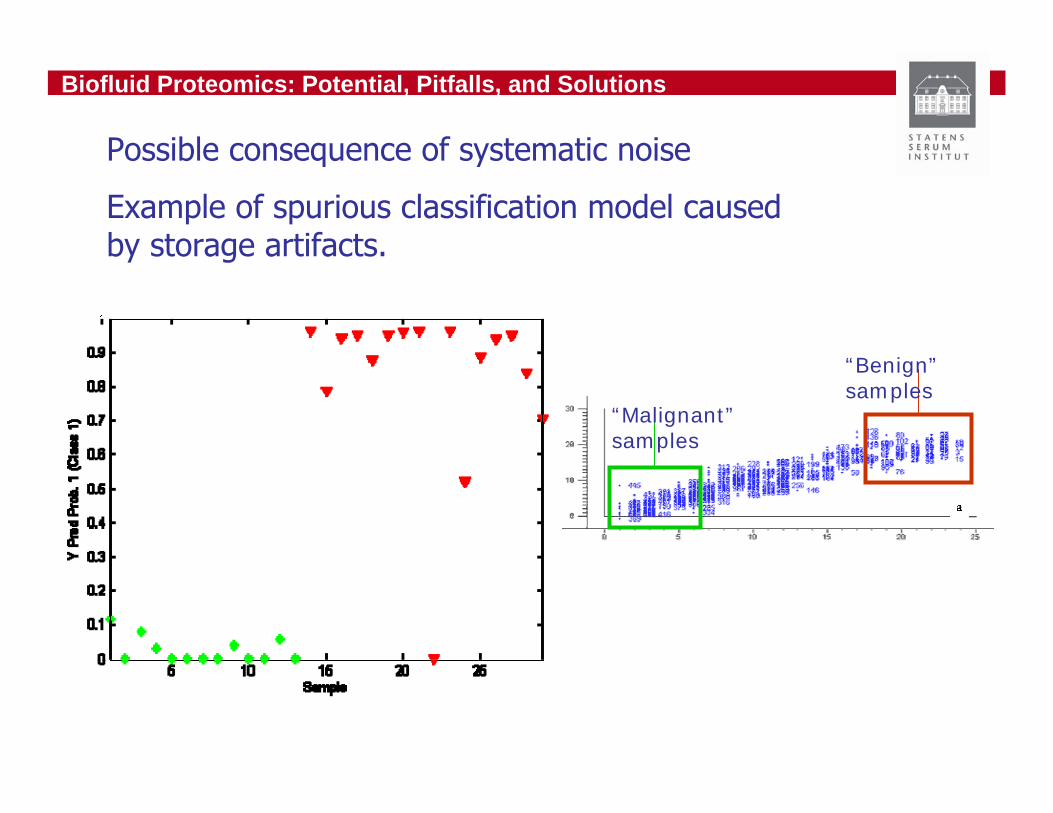
Possible consequence of systematic noise
Example of spurious classification model caused by storage artifacts.
“Malignant”samples
“Benign”samples
Biofluid Proteomics: Potential, Pitfalls, and Solutions
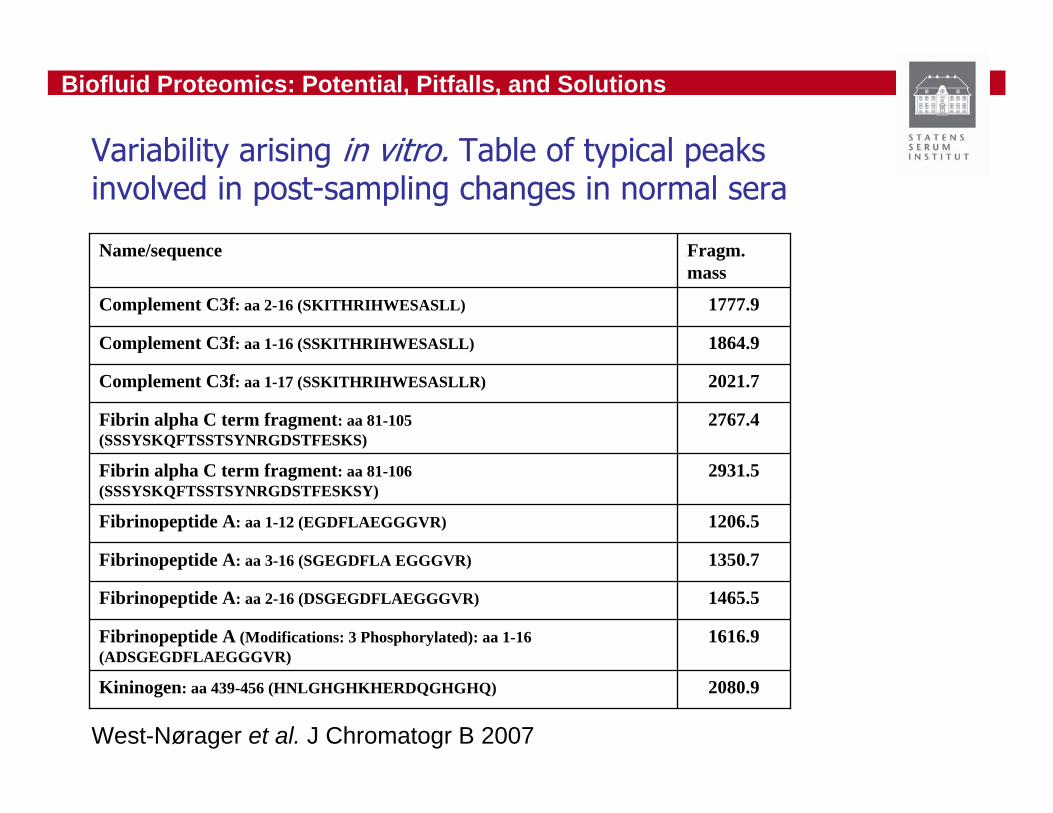
Variability arising in vitro. Table of typical peaks involved in post-sampling changes in normal sera
2080.9Kininogen: aa 439-456 (HNLGHGHKHERDQGHGHQ)
1616.9Fibrinopeptide A (Modifications: 3 Phosphorylated): aa 1-16 (ADSGEGDFLAEGGGVR)
1465.5Fibrinopeptide A: aa 2-16 (DSGEGDFLAEGGGVR)
1350.7Fibrinopeptide A: aa 3-16 (SGEGDFLA EGGGVR)
1206.5Fibrinopeptide A: aa 1-12 (EGDFLAEGGGVR)
2931.5Fibrin alpha C term fragment: aa 81-106 (SSSYSKQFTSSTSYNRGDSTFESKSY)
2767.4Fibrin alpha C term fragment: aa 81-105 (SSSYSKQFTSSTSYNRGDSTFESKS)
2021.7Complement C3f: aa 1-17 (SSKITHRIHWESASLLR)
1864.9Complement C3f: aa 1-16 (SSKITHRIHWESASLL)
1777.9Complement C3f: aa 2-16 (SKITHRIHWESASLL)
Fragm. mass
Name/sequence
West-Nørager et al. J Chromatogr B 2007

Biofluid Proteomics: Potential, Pitfalls, and Solutions
Minimizing noise.Serum proteomics, WCX-beads
Time, temperature, biology, and day-to-day variation
0, 30, 60, and 120 min.0, 30, 60, and 120 min.
Biofluid Proteomics: Potential, Pitfalls, and Solutions
• Minimize noise– Study design from patient to analysis: focus
on reducing variability– Reduce complexity of material– Optimize analytical procedures for
reproducibility– Reduce amount of data (=variable selection)
Seeing differences
Biofluid Proteomics: Potential, Pitfalls, and Solutions
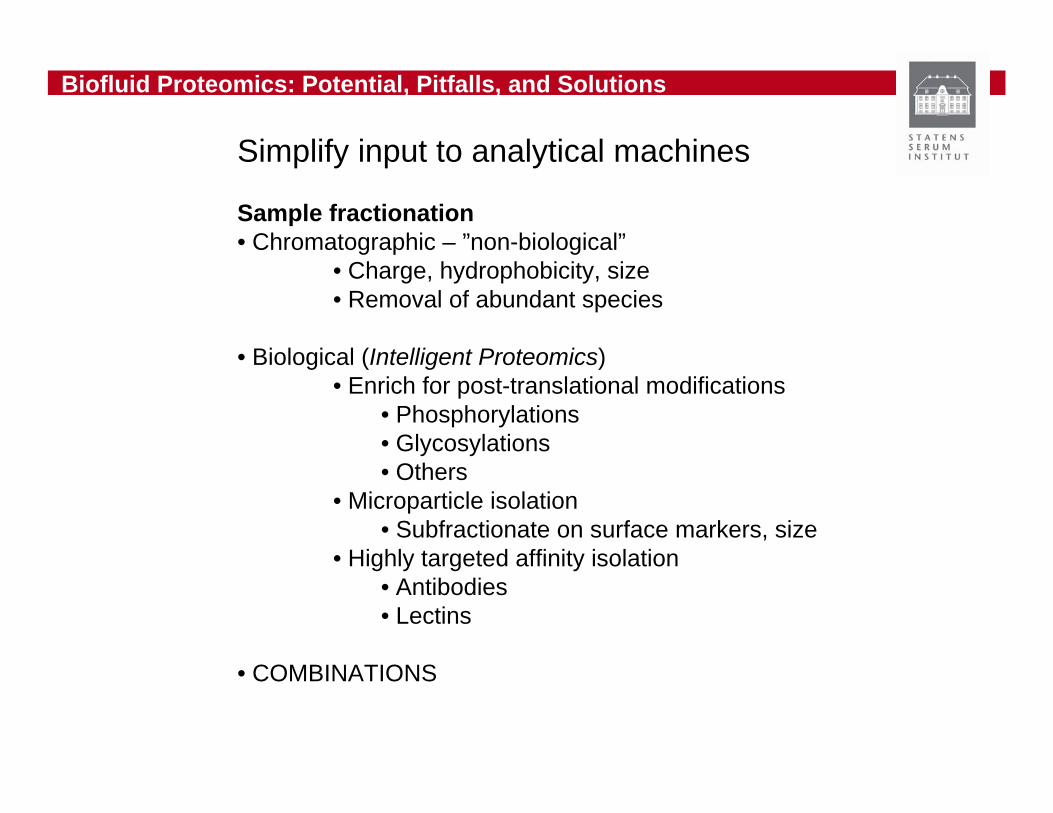
Simplify input to analytical machines
Sample fractionation• Chromatographic – ”non-biological”
• Charge, hydrophobicity, size• Removal of abundant species
• Biological (Intelligent Proteomics)• Enrich for post-translational modifications
• Phosphorylations• Glycosylations• Others
• Microparticle isolation• Subfractionate on surface markers, size
• Highly targeted affinity isolation• Antibodies• Lectins
• COMBINATIONS
Biofluid Proteomics: Potential, Pitfalls, and Solutions
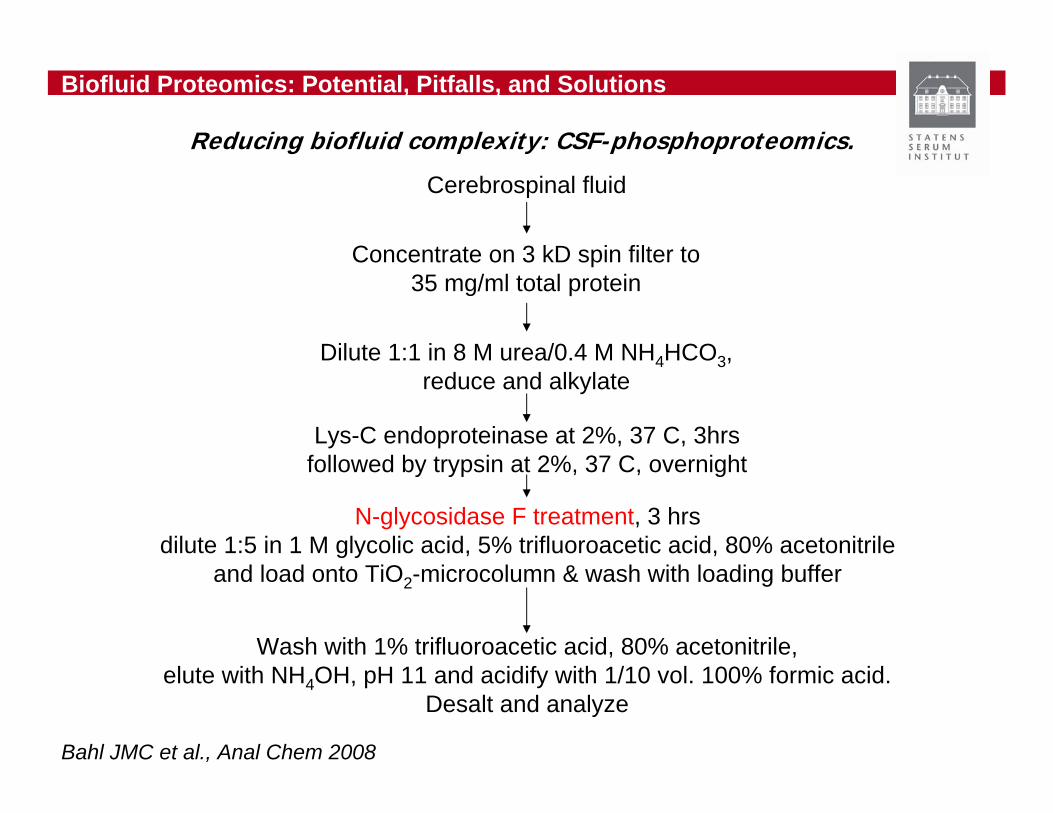
Cerebrospinal fluid
Concentrate on 3 kD spin filter to35 mg/ml total protein
Dilute 1:1 in 8 M urea/0.4 M NH4HCO3,reduce and alkylate
Lys-C endoproteinase at 2%, 37 C, 3hrsfollowed by trypsin at 2%, 37 C, overnight
N-glycosidase F treatment, 3 hrsdilute 1:5 in 1 M glycolic acid, 5% trifluoroacetic acid, 80% acetonitrile
and load onto TiO2-microcolumn & wash with loading buffer
Wash with 1% trifluoroacetic acid, 80% acetonitrile,elute with NH4OH, pH 11 and acidify with 1/10 vol. 100% formic acid.
Desalt and analyze
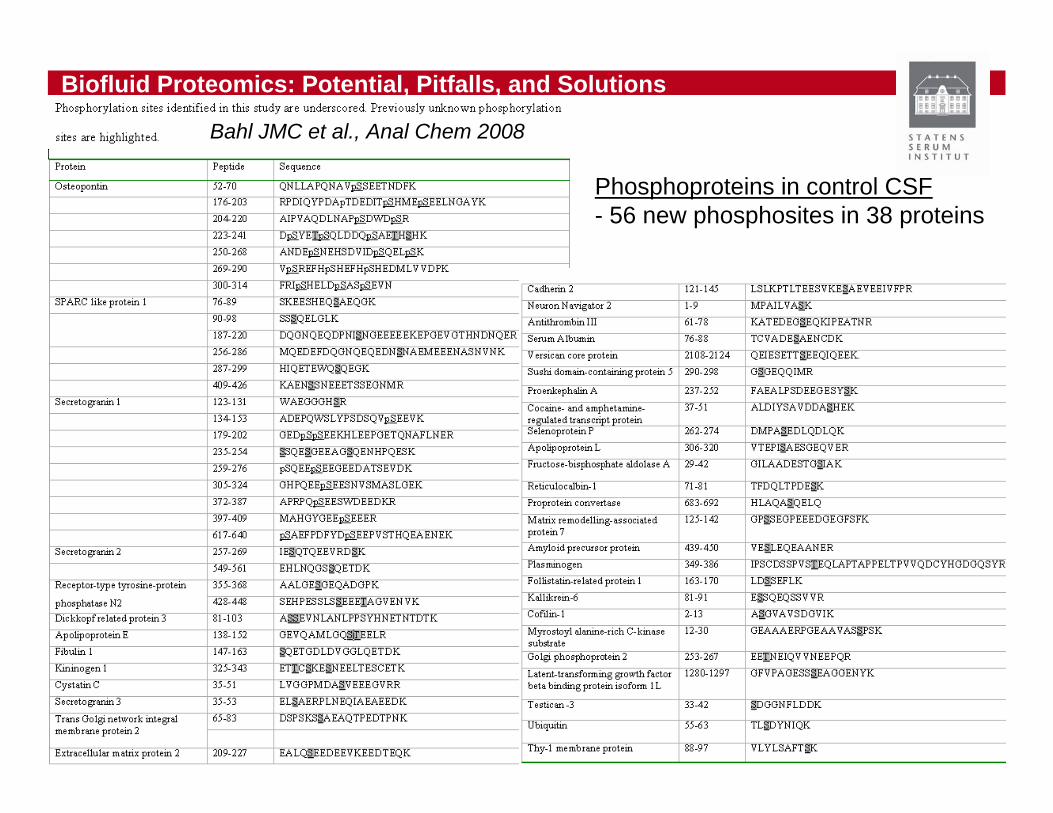
Reducing biofluid complexity: CSF-phosphoproteomics.
Bahl JMC et al., Anal Chem 2008
Biofluid Proteomics: Potential, Pitfalls, and Solutions
Phosphoproteins in control CSF- 56 new phosphosites in 38 proteins
Bahl JMC et al., Anal Chem 2008
Biofluid Proteomics: Potential, Pitfalls, and Solutions
• Minimize noise– Study design from patient to analysis: focus
on reducing variability– Reduce complexity of material– Optimize analytical procedures for
reproducibility– Reduce amount of data (=variable selection)
Seeing differences
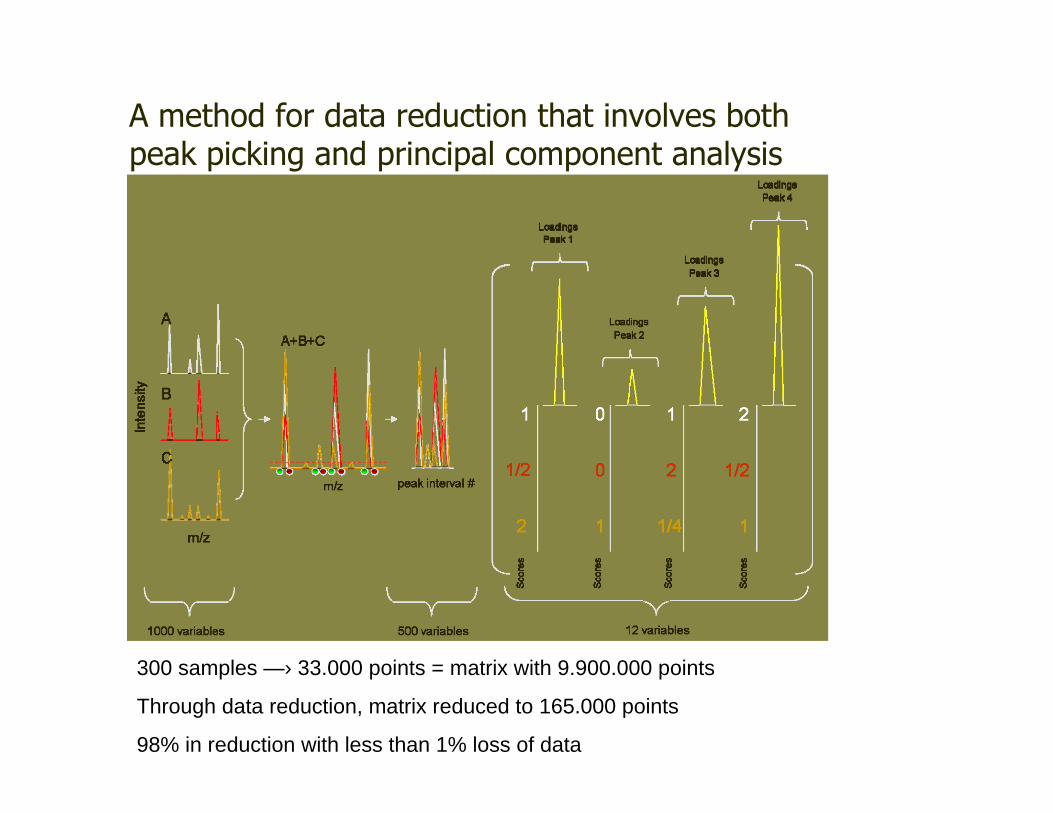
A method for data reduction that involves both peak picking and principal component analysis
300 samples —› 33.000 points = matrix with 9.900.000 points
Through data reduction, matrix reduced to 165.000 points
98% in reduction with less than 1% loss of data
Biofluid Proteomics: Potential, Pitfalls, and Solutions
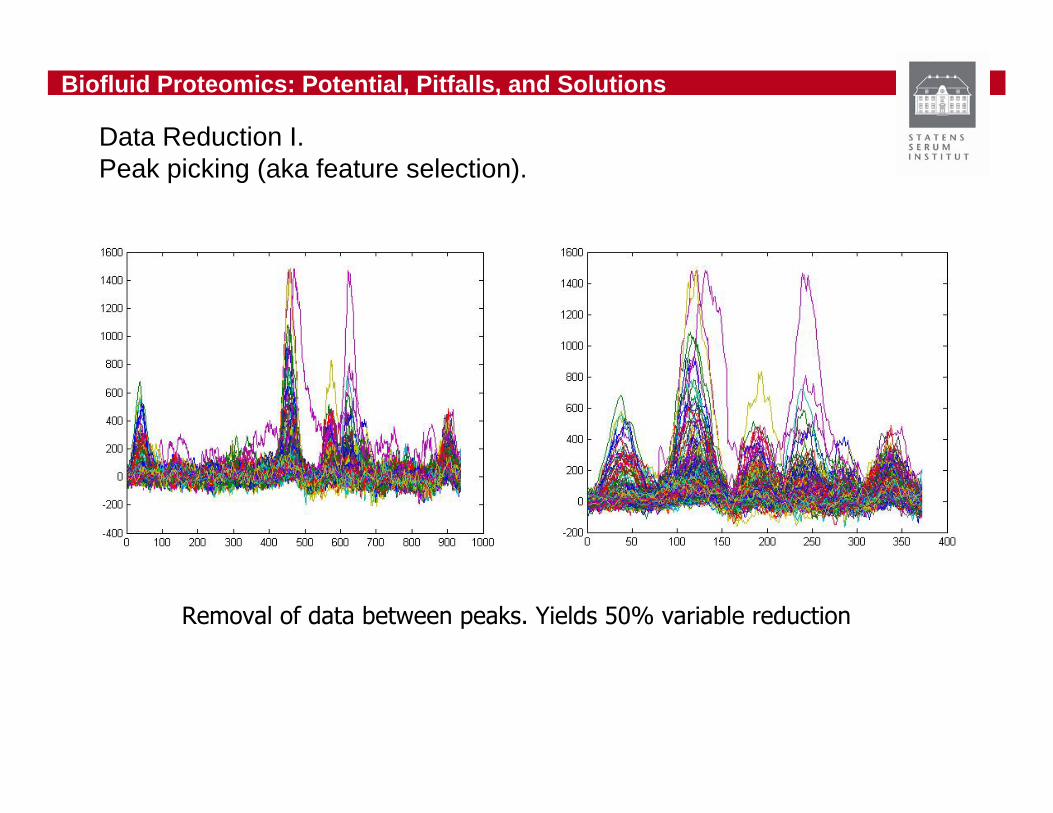
Removal of data between peaks. Yields 50% variable reduction
Data Reduction I.Peak picking (aka feature selection).

Biofluid Proteomics: Potential, Pitfalls, and Solutions
Data Reduction II.PCA (principal component analysis) performed in each peak interval (MatLab-script available)
Peak #107 Peak #114
Procedure reduces the cumulated data matrix from 8,745,000 to137,000 data sets. Thus, every sample is represented by 520 variables, - a reduction of 98% without loosing information
West-Nørager et al. Anal Chem ePub 2009
Biofluid Proteomics: Potential, Pitfalls, and Solutions
• Minimize noise– Study design from patient to analysis: focus
on reducing variability– Reduce complexity of material– Optimize analytical procedures for
reproducibility– Reduce amount of data (=variable selection)
Seeing differences

MALDIMALDI--TOF MS reproducibilityTOF MS reproducibility
A----B----
Zoom
Spot to spotSpot to spot variation ivariation inn same runsame runRR2 2 usually usually ≥≥ 0.90.999
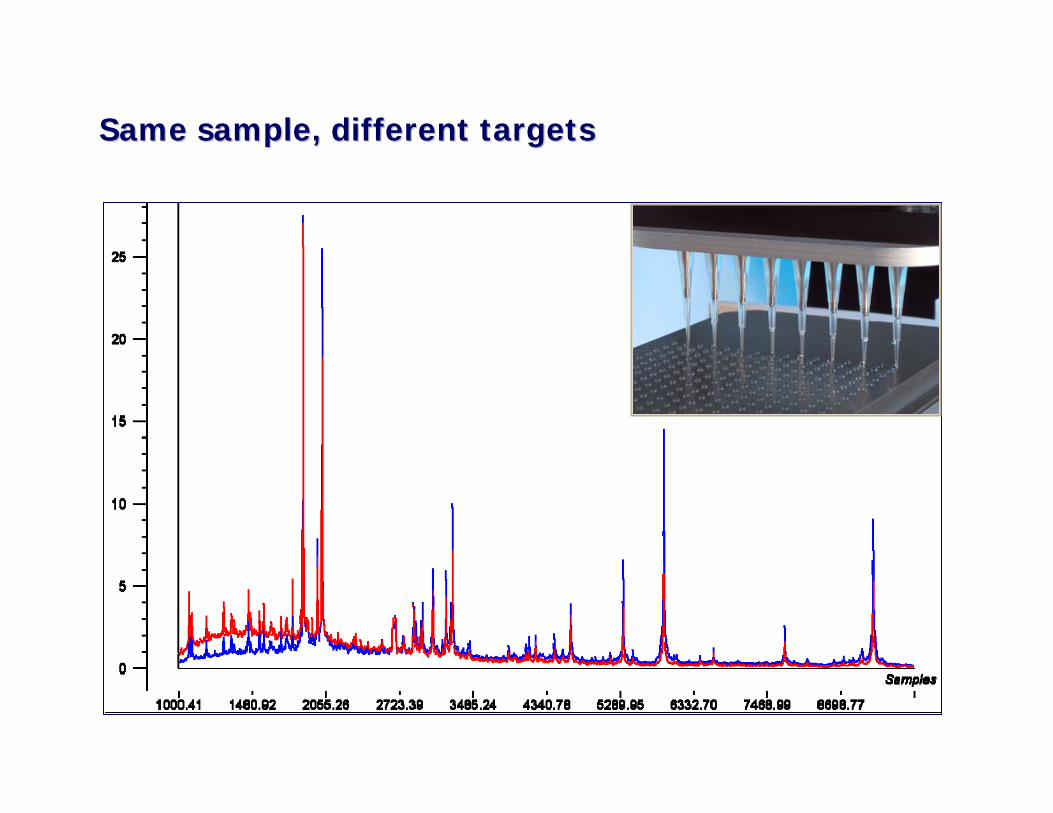
Same sample, Same sample, differentdifferent targetstargets
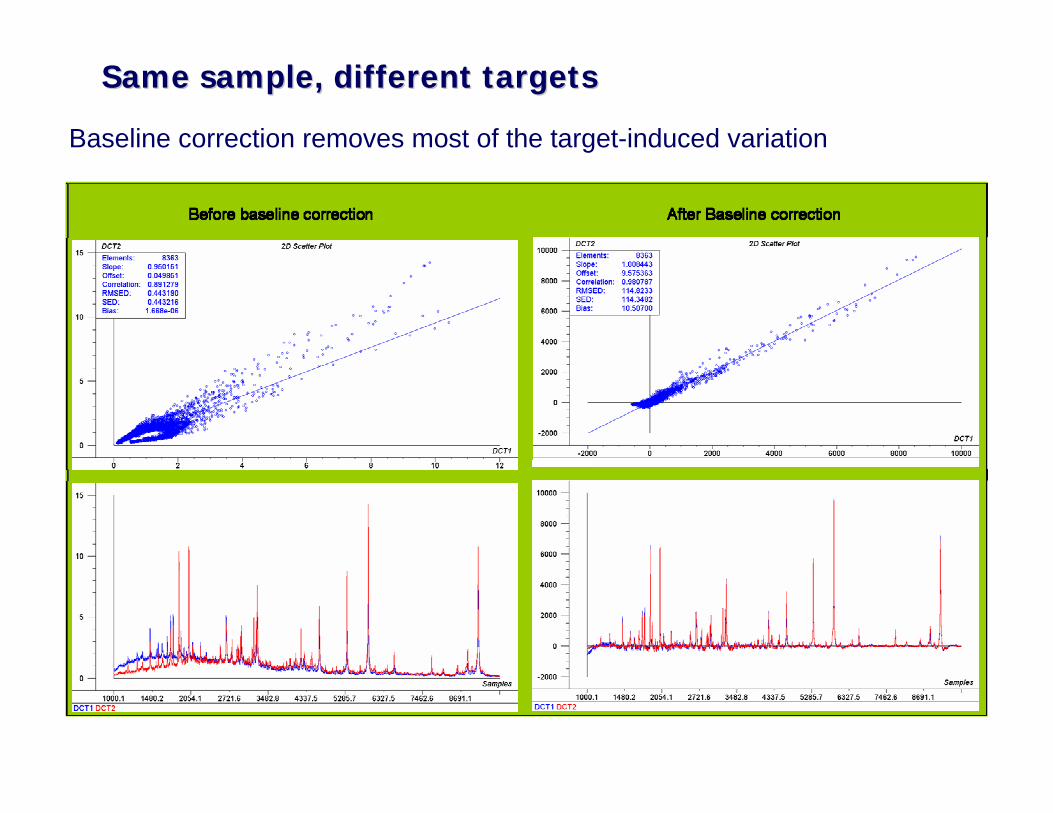
Baseline correction removes most of the target-induced variation
Same sample, Same sample, differentdifferent targetstargets

b
a
b
a
PCA analysis of the crystallization process at three different humidity levels (20%, 33%, and 46%) using replicates of two different samples.Score plots show both the biological difference (PC1) and the different crystallization dependent on the humidity level (PC2). The related loading plots outline the variables accountable for the object pattern in the score plot.
Ambient humidity during sample crystallization affects results
PC1 PC246% 33%
20%

Seeing differences between groups Seeing differences between groups using analyses yielding multiple using analyses yielding multiple variablesvariables
Overfitting is an obvious risk Overfitting is an obvious risk –– too many data too many data and too few samplesand too few samples–– We need at least 10 times more samples than We need at least 10 times more samples than
features!features!–– Look for univariate effectsLook for univariate effects–– BonferroniBonferroni--correct significance levels (correct significance levels (pp/N)/N)–– Use PCA first or other unsupervised methodUse PCA first or other unsupervised method–– Do permutation analysisDo permutation analysis–– Independently train, crossIndependently train, cross--validate, and validatevalidate, and validate
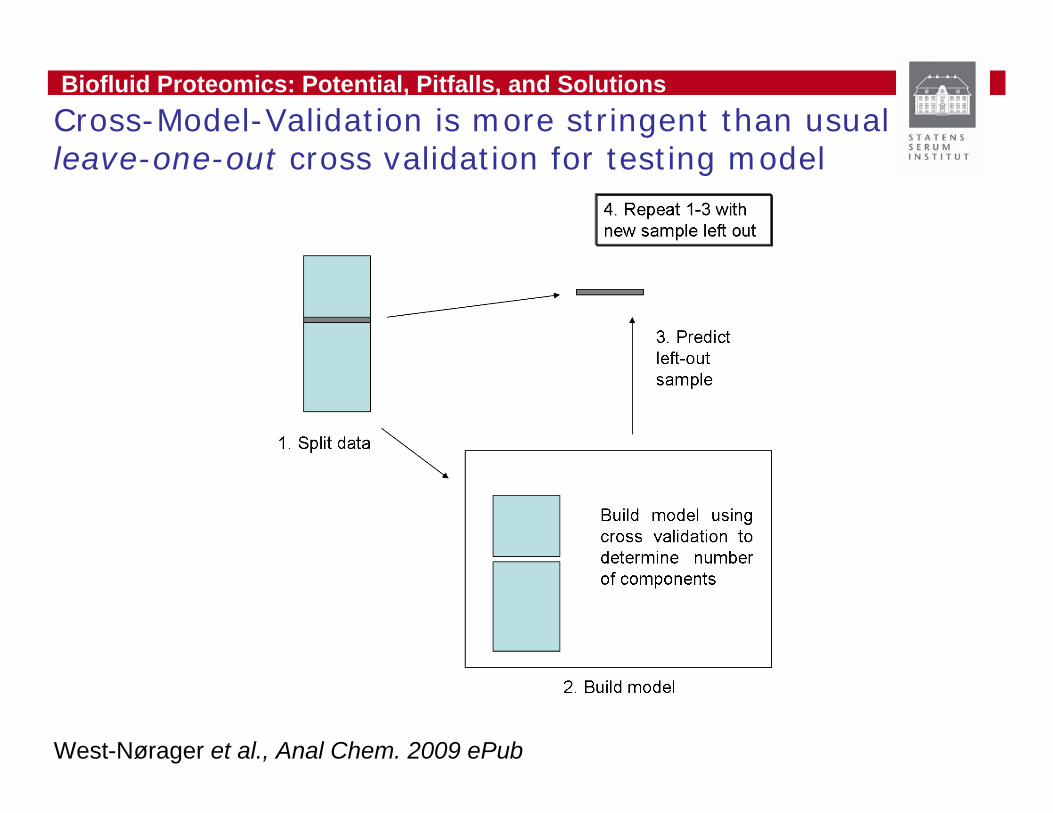
Biofluid Proteomics: Potential, Pitfalls, and SolutionsCross-Model-Validation is more stringent than usual leave-one-out cross validation for testing model
West-Nørager et al., Anal Chem. 2009 ePub
Biofluid Proteomics: Potential, Pitfalls, and Solutions
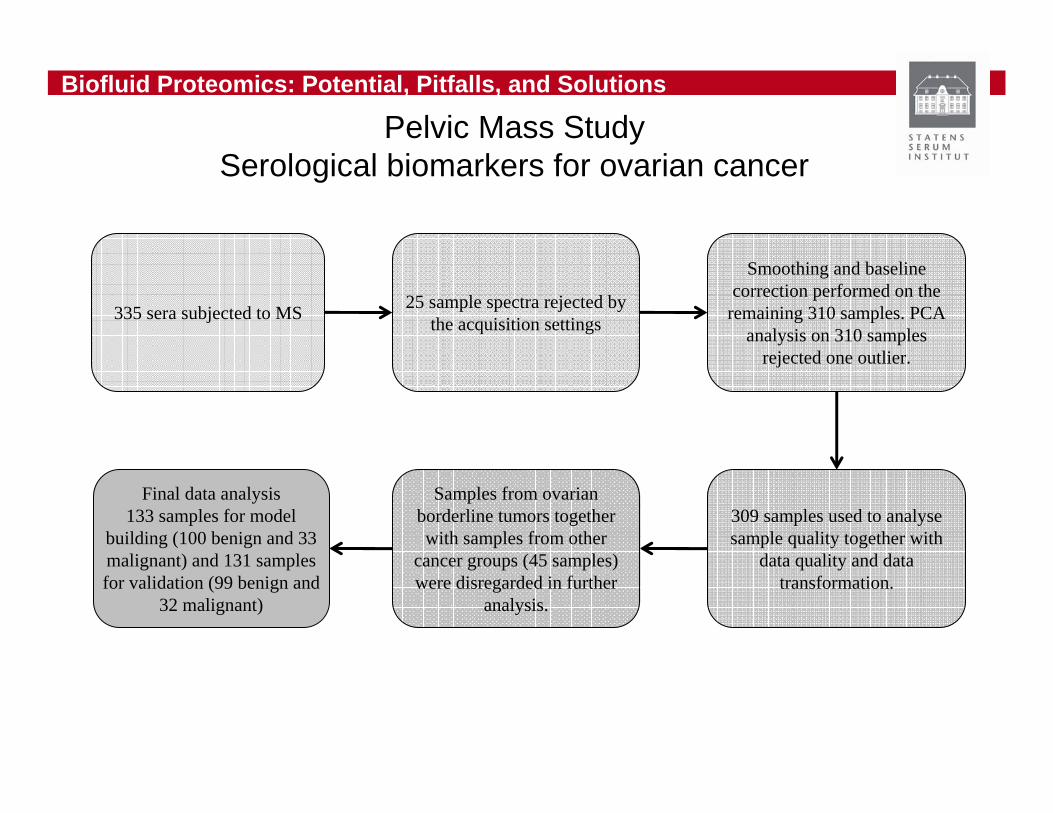
335 sera subjected to MS 25 sample spectra rejected by the acquisition settings
Smoothing and baseline correction performed on the
remaining 310 samples. PCA analysis on 310 samples
rejected one outlier.
309 samples used to analyse sample quality together with
data quality and data transformation.
Samples from ovarian borderline tumors together with samples from other
cancer groups (45 samples) were disregarded in further
analysis.
Final data analysis133 samples for model
building (100 benign and 33 malignant) and 131 samples for validation (99 benign and
32 malignant)
Pelvic Mass StudySerological biomarkers for ovarian cancer
Biofluid Proteomics: Potential, Pitfalls, and Solutions
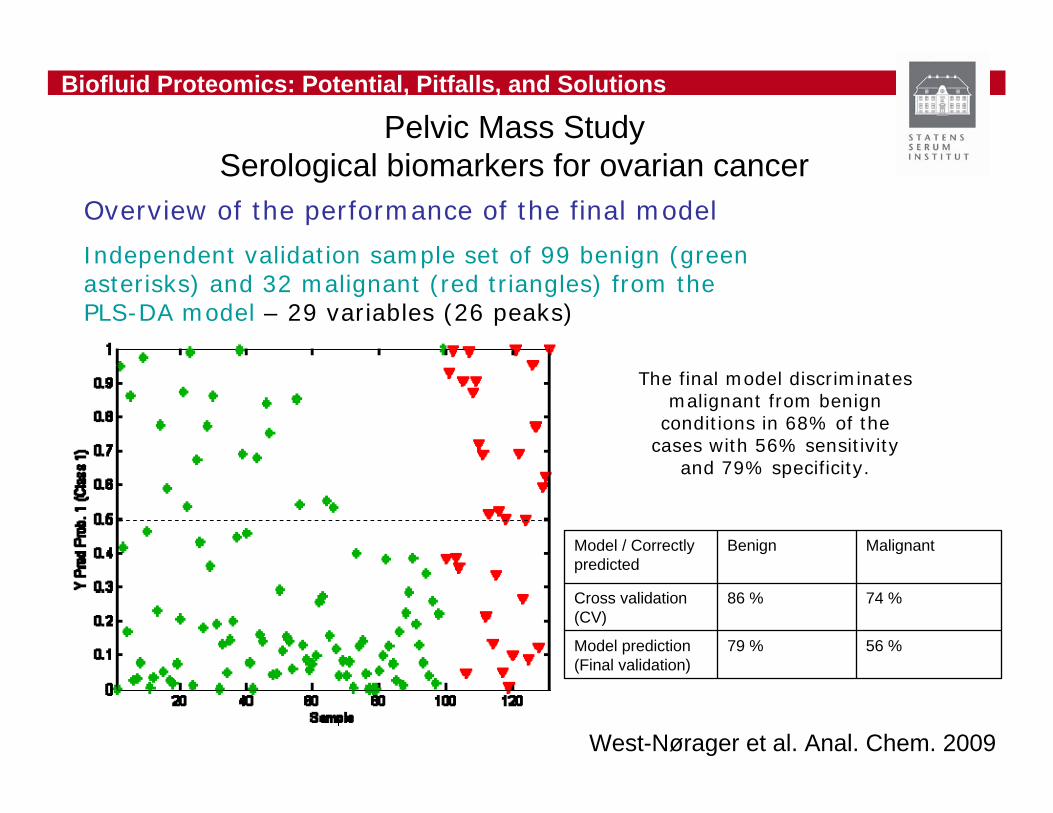
Overview of the performance of the final model
Independent validation sample set of 99 benign (green asterisks) and 32 malignant (red triangles) from the PLS-DA model – 29 variables (26 peaks)
The final model discriminates malignant from benign
conditions in 68% of the cases with 56% sensitivity
and 79% specificity.
West-Nørager et al. Anal. Chem. 2009
Pelvic Mass StudySerological biomarkers for ovarian cancer
56 %79 %Model prediction (Final validation)
74 %86 %Cross validation (CV)
MalignantBenignModel / Correctly predicted

Clinical proteomics
Goal: Measurements that discriminate and characterize disease vs. health
What the Analyst wants: Comprehensible, quantitative, and reproducible measurements of the contents of complex biosamples
What the Statistician wants: The best descriptors for maximizing the distinction between two or more groups of samples
What the Physician wants: Laboratory tests that increase life expectancy of patients

Mikkel WestMikkel West--NNøøragerragerEstrid HEstrid HøøgdallgdallClaus HClaus Høøgdallgdall
Rasmus BroRasmus BroMartin R.LarsenMartin R.LarsenSSøøren Skov Jensenren Skov Jensen
AcknowledgementsAcknowledgementsJustyna Czarna BahlJustyna Czarna BahlKeld PoulsenKeld PoulsenMark Lim, NIHMark Lim, NIH