biofeedback association for applied psychophysiology & biofeedback … · 2015-12-18 ·...
TRANSCRIPT
Biofeedback �Association for Applied Psychophysiology & BiofeedbackVolume 41, Issue 1, pp. 13–25 www.aapb.orgDOI: 10.5298/1081-5937-41.1.05
SPECIAL ISSUESPECIAL ISSUE
Heart Rate Variability Anatomy and Physiology
Fred Shaffer, PhD, BCB,1 and John Venner, MAE2
1Truman State University, Department of Psychology, Kirksville, MO; 2Truman State University, Department of Health and Exercise Science, Kirksville, MO
Keywords: heart rate variability, respiration, autonomic nervous system, biofeedback
Heart rate variability (HRV) is generated by the interaction
of multiple regulatory mechanisms that operate on
different time scales. This article examines the regulation
of the heart, the meaning of HRV, Thayer and Lane’s
neurovisceral integration model, the sources of HRV, HRV
frequency and time domain measurements, Porges’s poly-
vagal theory, and resonance frequency breathing. The
medical implications of HRV biofeedback for cardiovascular
rehabilitation and inflammatory disorders are considered.
Regulation of the Heart
The Heart
The heart is a hollow, muscular organ, about the size of a
closed fist. The heart beats about 100,000 times a day and
2.5 billion times during a typical lifetime. The heart
contains four chambers, two atria and two ventricles. The
atria are upper chambers that receive returning venous
blood. The ventricles are located below the atria and pump
blood from the heart into the arteries.
Deoxygenated blood enters the right atrium through the
superior and inferior vena cava. After passing through the
right atrioventricular orifice (tricuspid valve), blood flows
into the right ventricle and is pumped via the pulmonary
arteries to the lungs. There, wastes are removed and oxygen
is replaced. Oxygenated blood returns through the
pulmonary veins to the left atrium and passes through
the left atrioventricular orifice (mitral valve) and into the
left ventricle. During contraction, blood is ejected through
the aorta to the arterial system.
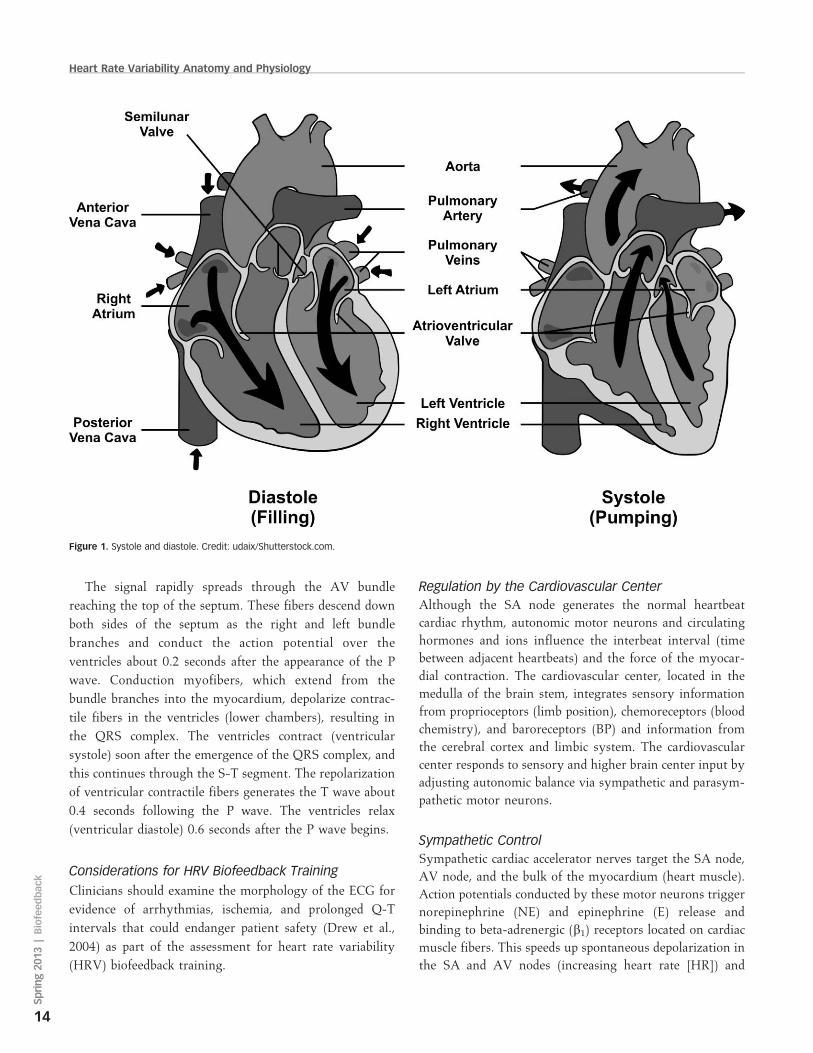
The Cardiac Cycle
The cardiac cycle consists of systole (ventricular contrac-
tion) and diastole (ventricular relaxation). During systole
(about 0.3 seconds), blood pressure (BP) peaks as contrac-
tion by the left ventricle ejects blood from the heart.
Systolic BP is measured here. During diastole (about 0.4
seconds), BP is lowest as the left ventricle relaxes. Diastolic
BP is measured at this time (see Figure 1).
Pacemakers
The heart contains autorhythmic fibers that spontaneously
generate the pacemaker potentials that initiate cardiac
contractions. These fibers continue to initiate heartbeats
after surgeons sever all cardiac nerves and remove a heart
from the chest cavity for transplantation. Autorhythmic
fibers function as pacemakers and provide a conduction
pathway for pacemaker potentials.
The sinoatrial (SA) node and atrioventricular (AV) node
are the two internal pacemakers that are primarily
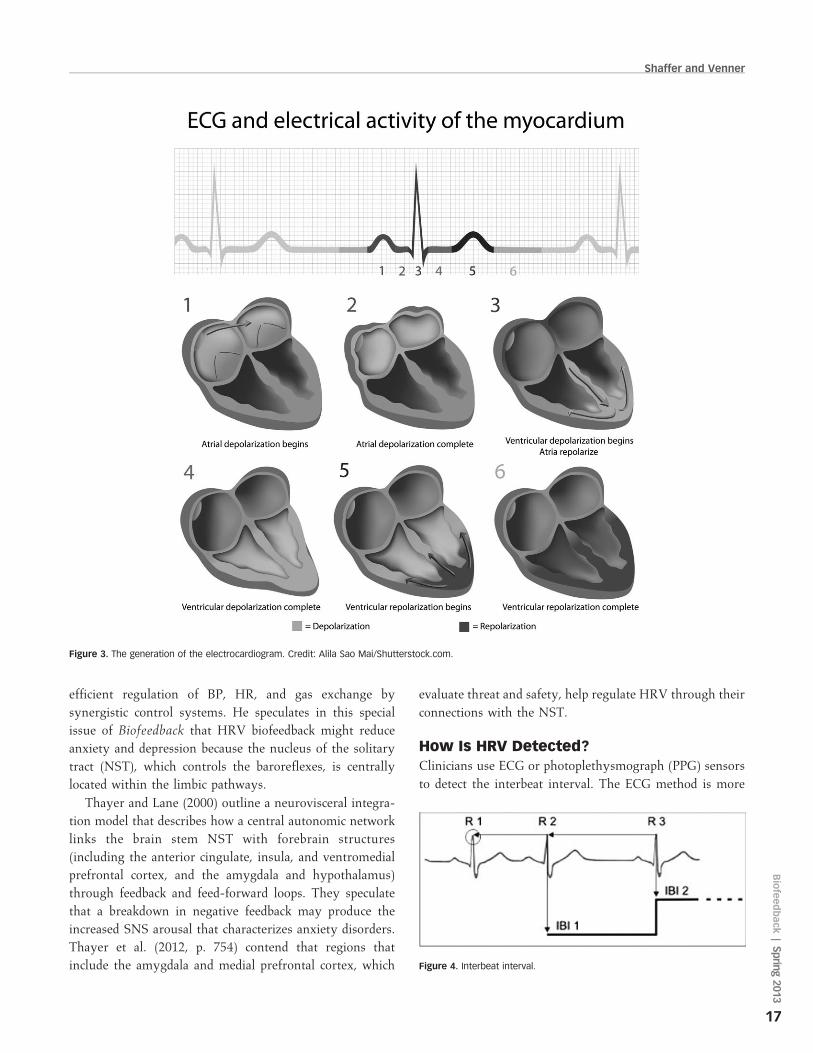
responsible for the heart rhythm. The electrocardiogram
(ECG) records the action of this electrical conduction
system (see Figure 2).
Cardiac Conduction
In a healthy heart, the SA node initiates each cardiac cycle
through spontaneous depolarization of its autorhythmic
fibers. The SA node’s firing of about 100 action potentials
per minute usually prevents slower parts of the conduction
system and myocardium (heart muscle) from generating
competing potentials. The AV node can replace an injured
or diseased SA node as pacemaker and spontaneously
depolarizes 40 to 60 times per minute. The SA node fires an
impulse that travels through the atria to the AV node in
about 0.03 seconds and causes the AV node to fire. The P
wave of the ECG is produced as contractile fibers in the atria
depolarize and culminates in contraction of the atria (atrial
systole).
13
Biofeedback
|Sprin
g2013
The signal rapidly spreads through the AV bundle
reaching the top of the septum. These fibers descend down
both sides of the septum as the right and left bundle
branches and conduct the action potential over the
ventricles about 0.2 seconds after the appearance of the P
wave. Conduction myofibers, which extend from the
bundle branches into the myocardium, depolarize contrac-
tile fibers in the ventricles (lower chambers), resulting in
the QRS complex. The ventricles contract (ventricular
systole) soon after the emergence of the QRS complex, and
this continues through the S-T segment. The repolarization
of ventricular contractile fibers generates the T wave about
0.4 seconds following the P wave. The ventricles relax
(ventricular diastole) 0.6 seconds after the P wave begins.
Considerations for HRV Biofeedback Training
Clinicians should examine the morphology of the ECG for
evidence of arrhythmias, ischemia, and prolonged Q-T
intervals that could endanger patient safety (Drew et al.,
2004) as part of the assessment for heart rate variability
(HRV) biofeedback training.
Regulation by the Cardiovascular Center
Although the SA node generates the normal heartbeat
cardiac rhythm, autonomic motor neurons and circulating
hormones and ions influence the interbeat interval (time
between adjacent heartbeats) and the force of the myocar-
dial contraction. The cardiovascular center, located in the
medulla of the brain stem, integrates sensory information
from proprioceptors (limb position), chemoreceptors (blood
chemistry), and baroreceptors (BP) and information from
the cerebral cortex and limbic system. The cardiovascular
center responds to sensory and higher brain center input by
adjusting autonomic balance via sympathetic and parasym-
pathetic motor neurons.
Sympathetic Control
Sympathetic cardiac accelerator nerves target the SA node,
AV node, and the bulk of the myocardium (heart muscle).
Action potentials conducted by these motor neurons trigger
norepinephrine (NE) and epinephrine (E) release and
binding to beta-adrenergic (b1) receptors located on cardiac
muscle fibers. This speeds up spontaneous depolarization in
the SA and AV nodes (increasing heart rate [HR]) and
Figure 1. Systole and diastole. Credit: udaix/Shutterstock.com.
Heart Rate Variability Anatomy and Physiology
14
Spring20
13|Biofeedback
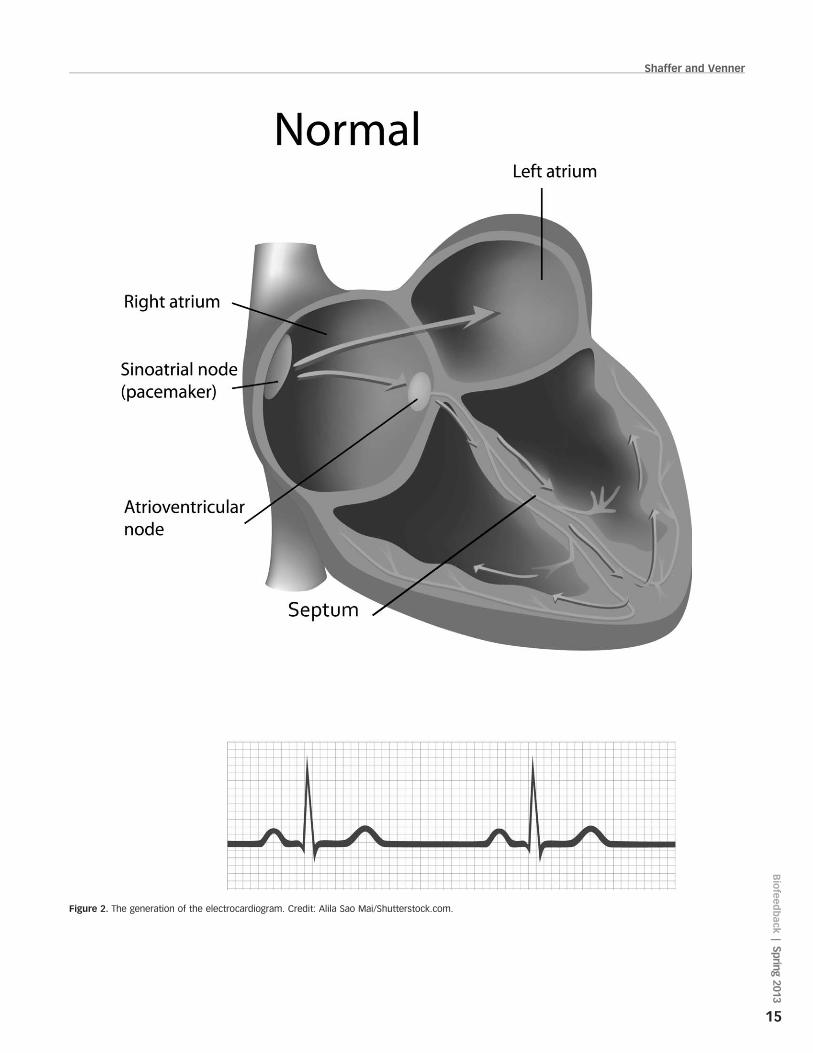
Figure 2. The generation of the electrocardiogram. Credit: Alila Sao Mai/Shutterstock.com.
Shaffer and Venner
15
Biofeedback
|Sprin
g2013
strengthens the contractility of the atria and ventricles. The
number of beta-adrenergic receptors is reduced, and their
cardiac muscle contraction in response to NE and E binding
is weakened in failing hearts (Ogletree-Hughes et al., 2001).
Parasympathetic ControlThe parasympathetic vagus (X) nerves similarly innervate
the SA node, AV node, and atrial cardiac muscle. Firing by
these motor neurons triggers acetylcholine release and
binding to muscarinic (mainly M2) receptors. This decreas-
es the rate of spontaneous depolarization in the SA and AV
nodes (slowing HR). Because there is sparse vagal
innervation of the ventricles, vagal tone minimally affects
the ventricular contractility.
Autonomic Balance
In a healthy heart, there is a dynamic balance between
sympathetic nervous system (SNS) and parasympathetic
nervous system (PNS) influences. PNS control predomi-
nates at rest, resulting in an average HR of 75 beats per
minute (bpm). This is significantly slower than the SA
node’s intrinsic rate, which decreases with age, from an
average 107 bpm at 20 years to 90 bpm at 50 years (Opthof,
2000). The parasympathetic branch can slow the heart to 20
or 30 bpm or briefly stop it (Tortora & Derrickson, 2012).
This illustrates the response called accentuated antagonism
(Olshansky et al., 2008). Parasympathetic nerves exert their
effects more rapidly (,1 second) than sympathetic nerves
(.5 seconds; Nunan, Sandercock, & Brodie, 2010).
Cardiac Regulation by Hormones and Ions
Circulating hormones and ions also influence the heart. E,
NE, and thyroid hormones increase HR and contractibility.
The cations (positive ions) Kþ, Ca2þ, and Naþ significantly
affect cardiac function. Although elevated plasma levels of
Kþ and Naþ decrease HR and contraction force, elevated
intracellular Ca2þ levels have the opposite effect (Tortora &
Derrickson, 2012).
What Is HRV?HRV consists of changes in the time intervals between
consecutive heartbeats (Task Force of the European Society
of Cardiology and the North American Society of Pacing
and Electrophysiology [Task Force], 1996). HRV is
produced by the interaction of multiple regulatory mech-
anisms that operate on different time scales (Moss, 2004).
Circadian rhythms, core body temperature, and metabolism
contribute to 24-hour HRV recordings, which represent the
gold standard for clinical HRV assessment. The autonomic,
cardiovascular, and respiratory systems produce short-term
(e.g., 5-minute) HRV measurements (see Figure 3).
Why Is HRV Important?
A Healthy Heart Is Not a MetronomeWhen the time intervals between heartbeats significantly
change across successive breathing cycles, this shows that
the cardiovascular center can effectively modulate vagal
tone. During inhalation, the cardiovascular center with-
draws vagal inhibition of the S-A node (speeding the heart).
Conversely, during exhalation, it restores vagal inhibition
(slowing the heart) via the release of acetylcholine (Eckberg
& Eckberg, 1982). This phenomenon, called respiratory
sinus arrhythmia (RSA), is mediated by the vagus nerve
and is largely responsible for generating HRV (Lehrer,
2013). The modulation of vagal tone helps maintain the
dynamic autonomic balance critical to cardiovascular health.
Autonomic imbalance due to deficient vagal inhibition is
implicated in increased morbidity and all-cause mortality
(Thayer, Yamamoto, & Brosschot, 2010).
HRV Is a Marker for Disease andAdaptability
Reduced HRV Is Associated with Disease and Loss ofAdaptabilityReduced HRV is associated with vulnerability to physical
and psychological stressors and disease (Lehrer, 2007). Low
HRV is a marker for cardiovascular disorders, including
hypertension, especially with left ventricular hypertrophy;
ventricular arrhythmia; chronic heart failure; and ischemic
heart disease (Bigger et al., 1995; Casolo, Balli, Taddei,
Amuhasi, & Gori, 1989; Maver, Strucl, & Accetto, 2004;
Nolan et al., 1992; Roach, Wilson, Ritchie, & Sheldon,
2004). Low HRV predicts sudden cardiac death, especially
due to arrhythmia following myocardial infarction, and
post–heart attack survival (Bigger et al., 1992; Bigger,
Fleiss, Rolnitzky, & Steinman, 1993; Kleiger, Miller,
Bigger, & Moss, 1987).
Reduced HRV is also seen in disorders with autonomic
dysregulation, including anxiety and depressive disorders
and asthma, and vulnerability to sudden infant death
(Agelink, Boz, Ullrich, & Andrich, 2002; Carney et al.,
2001; Cohen & Benjamin, 2006; Giardino, Chan, & Borson,
2004; Kazuma, Otsuka, Matsuoka, & Murata, 1997).
Lehrer (2007) believes that HRV indexes adaptability
and marshals evidence that increased RSA represents more
Heart Rate Variability Anatomy and Physiology
16
Spring20
13|Biofeedback
efficient regulation of BP, HR, and gas exchange by
synergistic control systems. He speculates in this special
issue of Biofeedback that HRV biofeedback might reduce
anxiety and depression because the nucleus of the solitary
tract (NST), which controls the baroreflexes, is centrally
located within the limbic pathways.
Thayer and Lane (2000) outline a neurovisceral integra-
tion model that describes how a central autonomic network
links the brain stem NST with forebrain structures
(including the anterior cingulate, insula, and ventromedial
prefrontal cortex, and the amygdala and hypothalamus)
through feedback and feed-forward loops. They speculate
that a breakdown in negative feedback may produce the
increased SNS arousal that characterizes anxiety disorders.
Thayer et al. (2012, p. 754) contend that regions that
include the amygdala and medial prefrontal cortex, which
evaluate threat and safety, help regulate HRV through their
connections with the NST.
How Is HRV Detected?Clinicians use ECG or photoplethysmograph (PPG) sensors
to detect the interbeat interval. The ECG method is more
Figure 4. Interbeat interval.
Figure 3. The generation of the electrocardiogram. Credit: Alila Sao Mai/Shutterstock.com.
Shaffer and Venner
17
Biofeedback
|Sprin
g2013
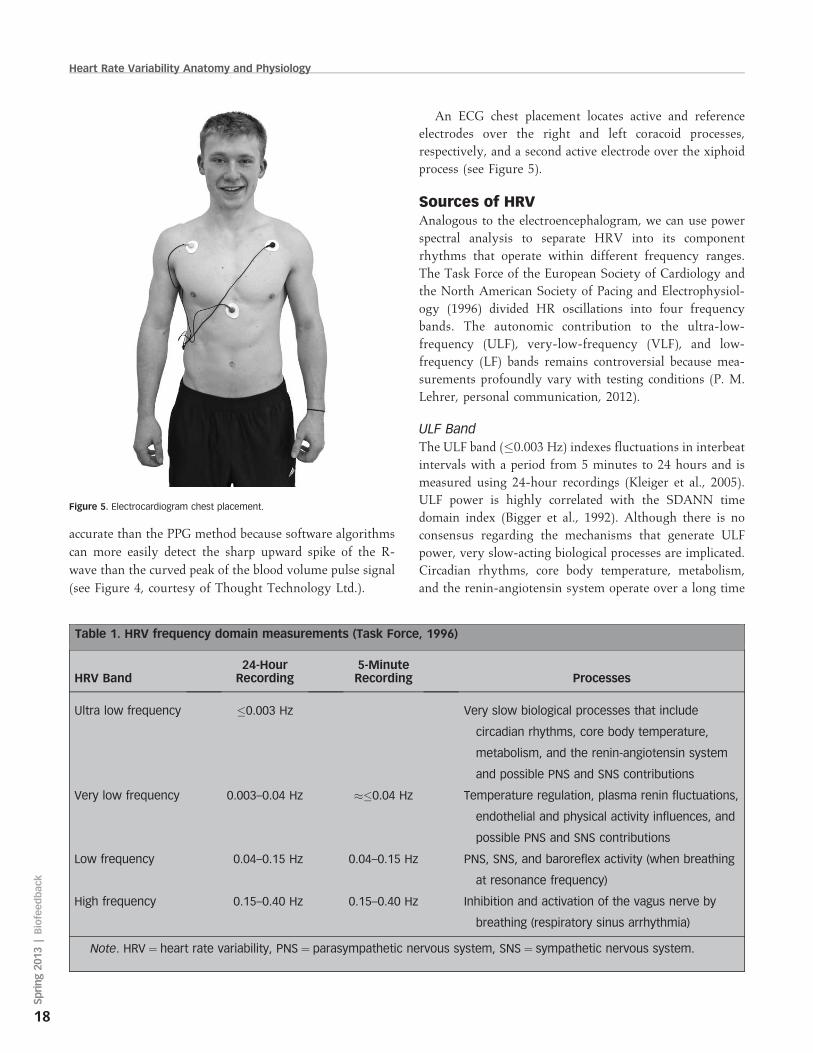
accurate than the PPG method because software algorithms
can more easily detect the sharp upward spike of the R-
wave than the curved peak of the blood volume pulse signal
(see Figure 4, courtesy of Thought Technology Ltd.).
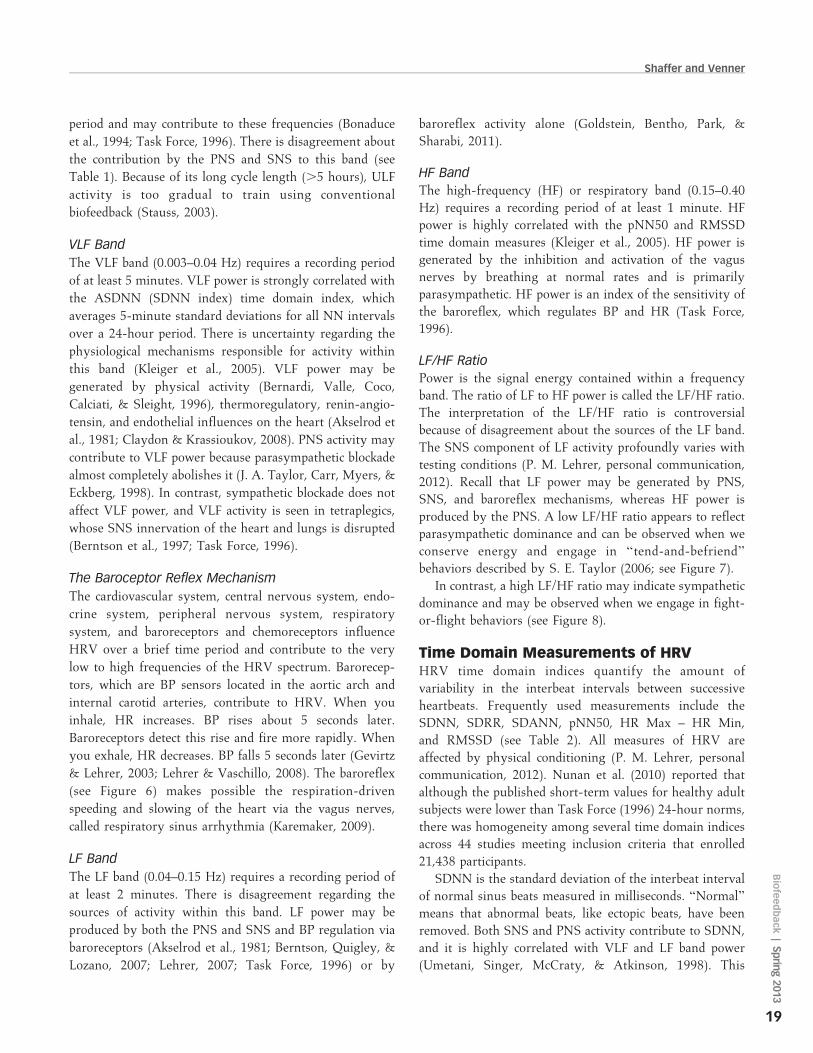
An ECG chest placement locates active and reference
electrodes over the right and left coracoid processes,
respectively, and a second active electrode over the xiphoid
process (see Figure 5).
Sources of HRVAnalogous to the electroencephalogram, we can use power
spectral analysis to separate HRV into its component
rhythms that operate within different frequency ranges.
The Task Force of the European Society of Cardiology and
the North American Society of Pacing and Electrophysiol-
ogy (1996) divided HR oscillations into four frequency
bands. The autonomic contribution to the ultra-low-
frequency (ULF), very-low-frequency (VLF), and low-
frequency (LF) bands remains controversial because mea-
surements profoundly vary with testing conditions (P. M.
Lehrer, personal communication, 2012).
ULF Band
The ULF band (�0.003 Hz) indexes fluctuations in interbeat
intervals with a period from 5 minutes to 24 hours and is
measured using 24-hour recordings (Kleiger et al., 2005).
ULF power is highly correlated with the SDANN time
domain index (Bigger et al., 1992). Although there is no
consensus regarding the mechanisms that generate ULF
power, very slow-acting biological processes are implicated.
Circadian rhythms, core body temperature, metabolism,
and the renin-angiotensin system operate over a long time
Table 1. HRV frequency domain measurements (Task Force, 1996)
HRV Band24-Hour
Recording5-MinuteRecording Processes
Ultra low frequency �0.003 Hz Very slow biological processes that include
circadian rhythms, core body temperature,
metabolism, and the renin-angiotensin system
and possible PNS and SNS contributions
Very low frequency 0.003–0.04 Hz »�0.04 Hz Temperature regulation, plasma renin fluctuations,
endothelial and physical activity influences, and
possible PNS and SNS contributions
Low frequency 0.04–0.15 Hz 0.04–0.15 Hz PNS, SNS, and baroreflex activity (when breathing
at resonance frequency)
High frequency 0.15–0.40 Hz 0.15–0.40 Hz Inhibition and activation of the vagus nerve by
breathing (respiratory sinus arrhythmia)
Note. HRV ¼ heart rate variability, PNS ¼ parasympathetic nervous system, SNS ¼ sympathetic nervous system.
Figure 5. Electrocardiogram chest placement.
Heart Rate Variability Anatomy and Physiology
18
Spring20
13|Biofeedback
period and may contribute to these frequencies (Bonaduce
et al., 1994; Task Force, 1996). There is disagreement about
the contribution by the PNS and SNS to this band (see
Table 1). Because of its long cycle length (.5 hours), ULF
activity is too gradual to train using conventional
biofeedback (Stauss, 2003).
VLF Band
The VLF band (0.003–0.04 Hz) requires a recording period
of at least 5 minutes. VLF power is strongly correlated with
the ASDNN (SDNN index) time domain index, which
averages 5-minute standard deviations for all NN intervals
over a 24-hour period. There is uncertainty regarding the
physiological mechanisms responsible for activity within
this band (Kleiger et al., 2005). VLF power may be
generated by physical activity (Bernardi, Valle, Coco,
Calciati, & Sleight, 1996), thermoregulatory, renin-angio-
tensin, and endothelial influences on the heart (Akselrod et
al., 1981; Claydon & Krassioukov, 2008). PNS activity may
contribute to VLF power because parasympathetic blockade
almost completely abolishes it (J. A. Taylor, Carr, Myers, &
Eckberg, 1998). In contrast, sympathetic blockade does not
affect VLF power, and VLF activity is seen in tetraplegics,
whose SNS innervation of the heart and lungs is disrupted
(Berntson et al., 1997; Task Force, 1996).
The Baroceptor Reflex Mechanism
The cardiovascular system, central nervous system, endo-
crine system, peripheral nervous system, respiratory
system, and baroreceptors and chemoreceptors influence
HRV over a brief time period and contribute to the very
low to high frequencies of the HRV spectrum. Barorecep-
tors, which are BP sensors located in the aortic arch and
internal carotid arteries, contribute to HRV. When you
inhale, HR increases. BP rises about 5 seconds later.
Baroreceptors detect this rise and fire more rapidly. When
you exhale, HR decreases. BP falls 5 seconds later (Gevirtz
& Lehrer, 2003; Lehrer & Vaschillo, 2008). The baroreflex
(see Figure 6) makes possible the respiration-driven
speeding and slowing of the heart via the vagus nerves,
called respiratory sinus arrhythmia (Karemaker, 2009).
LF Band
The LF band (0.04–0.15 Hz) requires a recording period of
at least 2 minutes. There is disagreement regarding the
sources of activity within this band. LF power may be
produced by both the PNS and SNS and BP regulation via
baroreceptors (Akselrod et al., 1981; Berntson, Quigley, &
Lozano, 2007; Lehrer, 2007; Task Force, 1996) or by
baroreflex activity alone (Goldstein, Bentho, Park, &
Sharabi, 2011).
HF BandThe high-frequency (HF) or respiratory band (0.15–0.40
Hz) requires a recording period of at least 1 minute. HF
power is highly correlated with the pNN50 and RMSSD
time domain measures (Kleiger et al., 2005). HF power is
generated by the inhibition and activation of the vagus
nerves by breathing at normal rates and is primarily
parasympathetic. HF power is an index of the sensitivity of
the baroreflex, which regulates BP and HR (Task Force,
1996).
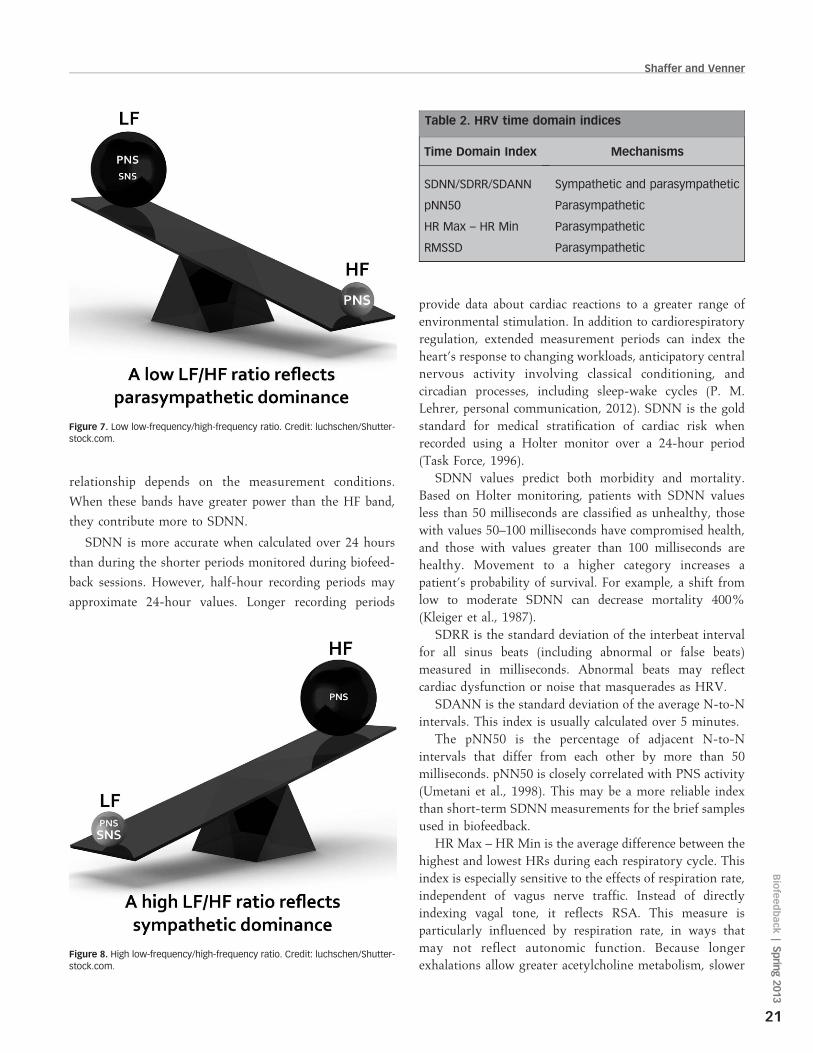
LF/HF RatioPower is the signal energy contained within a frequency
band. The ratio of LF to HF power is called the LF/HF ratio.
The interpretation of the LF/HF ratio is controversial
because of disagreement about the sources of the LF band.
The SNS component of LF activity profoundly varies with
testing conditions (P. M. Lehrer, personal communication,
2012). Recall that LF power may be generated by PNS,
SNS, and baroreflex mechanisms, whereas HF power is
produced by the PNS. A low LF/HF ratio appears to reflect
parasympathetic dominance and can be observed when we
conserve energy and engage in ‘‘tend-and-befriend’’
behaviors described by S. E. Taylor (2006; see Figure 7).
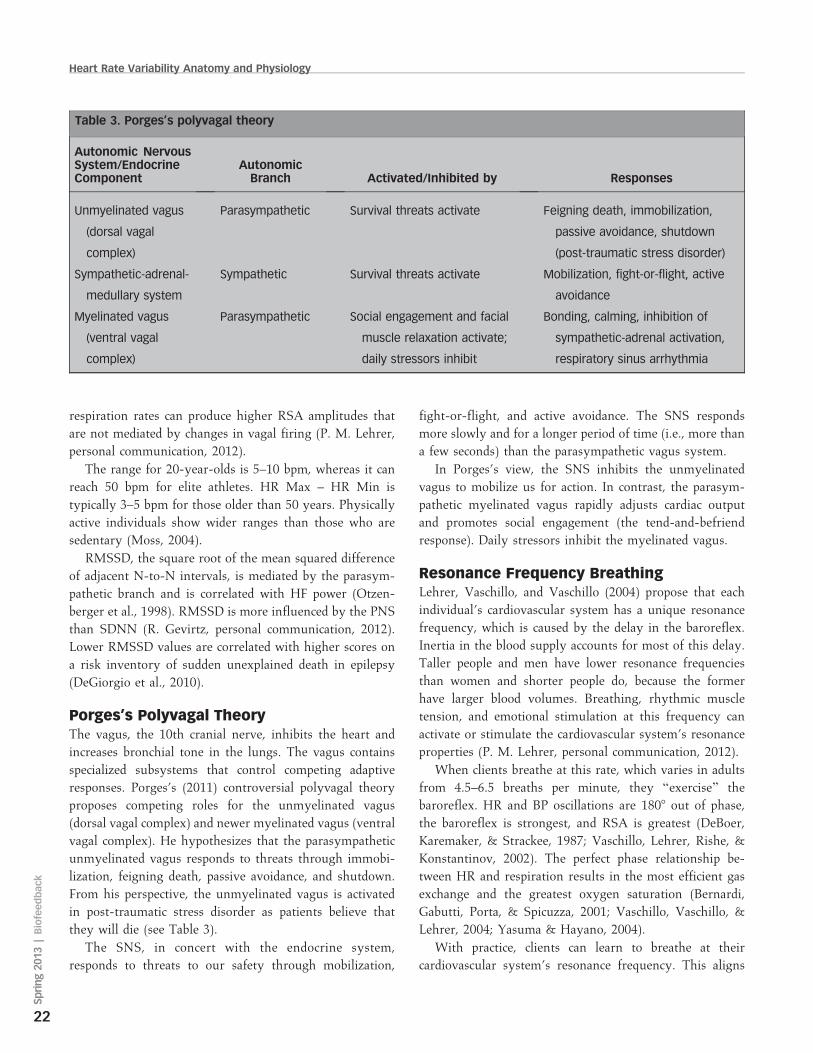
In contrast, a high LF/HF ratio may indicate sympathetic
dominance and may be observed when we engage in fight-
or-flight behaviors (see Figure 8).
Time Domain Measurements of HRVHRV time domain indices quantify the amount of
variability in the interbeat intervals between successive
heartbeats. Frequently used measurements include the
SDNN, SDRR, SDANN, pNN50, HR Max – HR Min,
and RMSSD (see Table 2). All measures of HRV are
affected by physical conditioning (P. M. Lehrer, personal
communication, 2012). Nunan et al. (2010) reported that
although the published short-term values for healthy adult
subjects were lower than Task Force (1996) 24-hour norms,
there was homogeneity among several time domain indices
across 44 studies meeting inclusion criteria that enrolled
21,438 participants.
SDNN is the standard deviation of the interbeat interval
of normal sinus beats measured in milliseconds. ‘‘Normal’’
means that abnormal beats, like ectopic beats, have been
removed. Both SNS and PNS activity contribute to SDNN,
and it is highly correlated with VLF and LF band power
(Umetani, Singer, McCraty, & Atkinson, 1998). This
Shaffer and Venner
19
Biofeedback
|Sprin
g2013
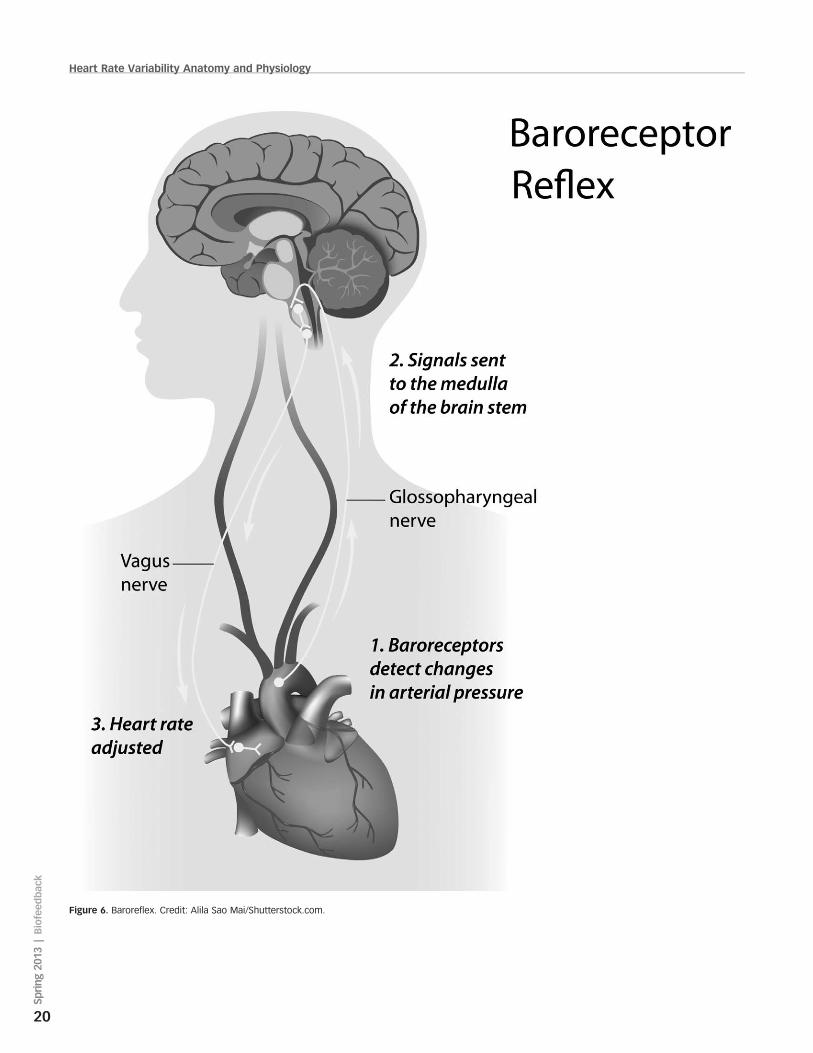
Figure 6. Baroreflex. Credit: Alila Sao Mai/Shutterstock.com.
Heart Rate Variability Anatomy and Physiology
20
Spring20
13|Biofeedback
relationship depends on the measurement conditions.
When these bands have greater power than the HF band,
they contribute more to SDNN.
SDNN is more accurate when calculated over 24 hours
than during the shorter periods monitored during biofeed-
back sessions. However, half-hour recording periods may
approximate 24-hour values. Longer recording periods
provide data about cardiac reactions to a greater range of
environmental stimulation. In addition to cardiorespiratory
regulation, extended measurement periods can index the
heart’s response to changing workloads, anticipatory central
nervous activity involving classical conditioning, and
circadian processes, including sleep-wake cycles (P. M.
Lehrer, personal communication, 2012). SDNN is the gold
standard for medical stratification of cardiac risk when
recorded using a Holter monitor over a 24-hour period
(Task Force, 1996).
SDNN values predict both morbidity and mortality.
Based on Holter monitoring, patients with SDNN values
less than 50 milliseconds are classified as unhealthy, those
with values 50–100 milliseconds have compromised health,
and those with values greater than 100 milliseconds are
healthy. Movement to a higher category increases a
patient’s probability of survival. For example, a shift from
low to moderate SDNN can decrease mortality 400%
(Kleiger et al., 1987).
SDRR is the standard deviation of the interbeat interval
for all sinus beats (including abnormal or false beats)
measured in milliseconds. Abnormal beats may reflect
cardiac dysfunction or noise that masquerades as HRV.
SDANN is the standard deviation of the average N-to-N
intervals. This index is usually calculated over 5 minutes.
The pNN50 is the percentage of adjacent N-to-N
intervals that differ from each other by more than 50
milliseconds. pNN50 is closely correlated with PNS activity
(Umetani et al., 1998). This may be a more reliable index
than short-term SDNN measurements for the brief samples
used in biofeedback.
HR Max – HR Min is the average difference between the
highest and lowest HRs during each respiratory cycle. This
index is especially sensitive to the effects of respiration rate,
independent of vagus nerve traffic. Instead of directly
indexing vagal tone, it reflects RSA. This measure is
particularly influenced by respiration rate, in ways that
may not reflect autonomic function. Because longer
exhalations allow greater acetylcholine metabolism, slower
Table 2. HRV time domain indices
Time Domain Index Mechanisms
SDNN/SDRR/SDANN Sympathetic and parasympathetic
pNN50 Parasympathetic
HR Max – HR Min Parasympathetic
RMSSD Parasympathetic
Figure 8. High low-frequency/high-frequency ratio. Credit: luchschen/Shutter-stock.com.
Figure 7. Low low-frequency/high-frequency ratio. Credit: luchschen/Shutter-stock.com.
Shaffer and Venner
21
Biofeedback
|Sprin
g2013
respiration rates can produce higher RSA amplitudes that
are not mediated by changes in vagal firing (P. M. Lehrer,
personal communication, 2012).
The range for 20-year-olds is 5–10 bpm, whereas it can
reach 50 bpm for elite athletes. HR Max – HR Min is
typically 3–5 bpm for those older than 50 years. Physically
active individuals show wider ranges than those who are
sedentary (Moss, 2004).
RMSSD, the square root of the mean squared difference
of adjacent N-to-N intervals, is mediated by the parasym-
pathetic branch and is correlated with HF power (Otzen-
berger et al., 1998). RMSSD is more influenced by the PNS
than SDNN (R. Gevirtz, personal communication, 2012).
Lower RMSSD values are correlated with higher scores on
a risk inventory of sudden unexplained death in epilepsy
(DeGiorgio et al., 2010).
Porges’s Polyvagal TheoryThe vagus, the 10th cranial nerve, inhibits the heart and
increases bronchial tone in the lungs. The vagus contains
specialized subsystems that control competing adaptive
responses. Porges’s (2011) controversial polyvagal theory
proposes competing roles for the unmyelinated vagus
(dorsal vagal complex) and newer myelinated vagus (ventral
vagal complex). He hypothesizes that the parasympathetic
unmyelinated vagus responds to threats through immobi-
lization, feigning death, passive avoidance, and shutdown.
From his perspective, the unmyelinated vagus is activated
in post-traumatic stress disorder as patients believe that
they will die (see Table 3).
The SNS, in concert with the endocrine system,
responds to threats to our safety through mobilization,
fight-or-flight, and active avoidance. The SNS responds
more slowly and for a longer period of time (i.e., more than
a few seconds) than the parasympathetic vagus system.
In Porges’s view, the SNS inhibits the unmyelinated
vagus to mobilize us for action. In contrast, the parasym-
pathetic myelinated vagus rapidly adjusts cardiac output
and promotes social engagement (the tend-and-befriend
response). Daily stressors inhibit the myelinated vagus.
Resonance Frequency BreathingLehrer, Vaschillo, and Vaschillo (2004) propose that each
individual’s cardiovascular system has a unique resonance
frequency, which is caused by the delay in the baroreflex.
Inertia in the blood supply accounts for most of this delay.
Taller people and men have lower resonance frequencies
than women and shorter people do, because the former
have larger blood volumes. Breathing, rhythmic muscle
tension, and emotional stimulation at this frequency can
activate or stimulate the cardiovascular system’s resonance
properties (P. M. Lehrer, personal communication, 2012).
When clients breathe at this rate, which varies in adults
from 4.5–6.5 breaths per minute, they ‘‘exercise’’ the
baroreflex. HR and BP oscillations are 1808 out of phase,
the baroreflex is strongest, and RSA is greatest (DeBoer,
Karemaker, & Strackee, 1987; Vaschillo, Lehrer, Rishe, &
Konstantinov, 2002). The perfect phase relationship be-
tween HR and respiration results in the most efficient gas
exchange and the greatest oxygen saturation (Bernardi,
Gabutti, Porta, & Spicuzza, 2001; Vaschillo, Vaschillo, &
Lehrer, 2004; Yasuma & Hayano, 2004).
With practice, clients can learn to breathe at their
cardiovascular system’s resonance frequency. This aligns
Table 3. Porges’s polyvagal theory
Autonomic NervousSystem/EndocrineComponent
AutonomicBranch Activated/Inhibited by Responses
Unmyelinated vagus
(dorsal vagal
complex)
Parasympathetic Survival threats activate Feigning death, immobilization,
passive avoidance, shutdown
(post-traumatic stress disorder)
Sympathetic-adrenal-
medullary system
Sympathetic Survival threats activate Mobilization, fight-or-flight, active
avoidance
Myelinated vagus
(ventral vagal
complex)
Parasympathetic Social engagement and facial
muscle relaxation activate;
daily stressors inhibit
Bonding, calming, inhibition of
sympathetic-adrenal activation,
respiratory sinus arrhythmia
Heart Rate Variability Anatomy and Physiology
22
Spring20
13|Biofeedback
the three oscillators (baroreflex, HR, and BP) at that
frequency and moves the peak frequency from the HF
range (»0.2 Hz) to the LF range (»0.1 Hz). Breathing at the
resonance frequency more than doubles the energy in the
LF band of the ECG (0.04–0.15 Hz) and centers the peak
frequency at the cardiovascular system’s resonance fre-
quency. This corresponds to Institute of HeartMath’s
concept of coherence, in which a client produces a ‘‘narrow,
high-amplitude, easily visualized peak’’ from 0.09–0.14 Hz
(Ginsberg, Berry, & Powell, 2010, p. 54; McCraty,
Atkinson, Tomasino, & Bradley, 2009).
Although HRV biofeedback training immediately pro-
duces large-scale increases in baroreflex gain, months of
steady practice can increase gain when clients are not
receiving feedback (Lehrer, 2013; Lehrer et al., 2003).
Increased baroreflex gain is analogous to a more sensitive
thermostat. The body regulates BP and gas exchange more
effectively. Increased baroreflex gain means that the
cardiovascular system produces large-scale HR increases
and decreases when a client inhales and exhales. This, in
turn, translates into greater HRV.
Remodeling Failing HeartsMoravec and McKee (2013) report preliminary evidence in
this issue that HRV biofeedback may act like a left
ventricular assist device to help remodel failing hearts.
Patients trained to slow their breathing down to 8–9 breaths
per minute increased the numbers of b1 receptors on cardiac
muscle fibers and cardiac muscle contraction in response to
NE and E. HRV biofeedback for heart failure patients
represents a paradigm shift. Instead of only targeting
sympathetic activation, HRV biofeedback teaches patients
to restore autonomic balance by decreasing SNS arousal
while simultaneously increasing PNS activity.
Modulation of ImmunityResonance frequency breathing, like vagal nerve stimula-
tion (VNS), may influence the parasympathetic cholinergic
cytokine control system that modulates immunity through
interleukins and interferons (Gevirtz, 2013; Tracey, 2007).
Interleukin-6 (IL-6) may increase the risk of myocardial
infarction by promoting inflammation in coronary arteries
(Ridker, Rifai, Stampfer, & Hennekens, 2000).
Lehrer et al. (2010) demonstrated that subjects trained to
breathe at their resonance frequency minimized the
reduction of HRV, headache, and eye photosensitivity
following an injection of lipopolysaccharide, which is an
inflammatory cytokine. Purcell, Urlakis, and Shaffer (2010)
reported preliminary evidence that resonance frequency
breathing can reduce levels of IL-6.
SummaryThe SA node generates the fundamental cardiac rhythm,
which is modulated by autonomic motor neurons and
circulating hormones and ions. There is a dynamic balance
between sympathetic and parasympathetic branches in a
healthy heart. HRV is generated by multiple regulatory
mechanisms that operate on different time scales. HRV
biofeedback exercises the baroreflex and can produce large-
scale HR changes and greater respiratory efficiency.
Resonance frequency breathing may increase resilience
against stressors, reduce hypertension, and improve the
prognosis of patients diagnosed with cardiovascular and
respiratory disorders. This behavioral intervention may
have the potential to help remodel failing hearts and
modulate immunity via the parasympathetic cholinergic
cytokine control system.
AcknowledgmentsThe authors want to express their profound thanks to
Richards S. Gevirtz and Paul Lehrer for their generous
contributions to this article, and to Winston Vanderhoof for
his graphics.
References
Agelink, M. W., Boz, C., Ullrich, H., & Andrich, J. (2002).Relationship between major depression and heart rate vari-ability: Clinical consequences and implications for antidepres-sive treatment. Psychiatry Research, 113, 139–149.
Akselrod, S., Gordon, D., Ubel, F. A., Shannon, D. C., Barger, A.C., & Cohen, R. J. (1981). Power spectrum analysis of heartrate fluctuation: A quantitative probe of beat-to-beat cardio-vascular control. Science, 213, 220–222.
Bernardi, L., Gabutti, A., Porta, C., & Spicuzza, L. (2001). Slowbreathing reduces chemoreflex response to hypoxia andhypercapnia, and increases baroreflex sensitivity. Journal ofHypertension, 19, 2221–2229.
Bernardi, L., Valle, F., Coco, M., Calciati, A., & Sleight, P. (1996).Physical activity influences heart rate variability and very-low-frequency components in Holter electrocardiograms. Cardio-vascular Research, 32, 234–237.
Berntson, G. G., Bigger, J. T., Eckberg, D. L., Grossman, P.,Kaufmann, P. G., Malik, M., et al. (1997). Heart ratevariability: Origins, methods, and interpretive caveats. Psy-chophysiology, 34, 623–648.
Berntson, G. G., Quigley, K. S., & Lozano, D. (2007).Cardiovascular psychophysiology. In J. T. Cacioppo, L. G.Tassinary, & G. G. Berntson, (Eds.), Handbook of psycho-physiology (3rd ed., pp. 182–210). New York: CambridgeUniversity Press.
Bigger, J. T., Fleiss, J. L., Rolnitzky, L. M., & Steinman, R. C.(1993). The ability of several short-term measures of RRvariability to predict mortality after myocardial infarction.Circulation, 88, 927–934.
Shaffer and Venner
23
Biofeedback
|Sprin
g2013
Bigger, J. T., Fleiss, J. L., Steinman, R. C., Rolnitzky, L. M.,Kleiger, R. E., Rottman, J. N., et al. (1992). Frequency domainmeasures of heart period variability and mortality aftermyocardial infarction. Circulation, 85, 164–171.
Bigger, J. T., Fleiss, J. L., Steinman, R. C., Rolnitzky, L. M.,Schneider, W. J., Stein, P. K., et al. (1995). RR variability inhealthy, middle-aged persons compared with patients withchronic coronary heart disease or recent acute myocardialinfarction. Circulation, 91, 1936–1943.
Bonaduce, D., Marciano, F., Petretta, M., Migaux, M. L.,Morgano, G., Bianchi, V., et al. (1994). Effects of convertingenzyme inhibition on heart period variability in patients withacute myocardial infarction. Circulation, 90, 108–113.
Carney, R. M., Blumenthal, J. A., Stein, P. K., Watkins, L.,Catellier, D., Berkman, L. F., et al. (2001). Depression, heartrate variability, and acute myocardial infarction. Circulation,104, 2024–2028.
Casolo, G., Balli, E., Taddei, T., Amuhasi, J., & Gori, C. (1989).Decreased spontaneous heart rate variability in congestiveheart failure. American Journal of Cardiology, 64, 1162–1167.
Claydon, V. E., & Krassioukov, A. V. (2008). Clinical correlates offrequency analyses of cardiovascular control after spinal cordinjury. American Journal of Physiology—Heart and Circula-tory Physiology, 294, H668–H678.
Cohen, H., & Benjamin, J. (2006). Power spectrum analysis andcardiovascular morbidity in anxiety disorders. AutonomicNeuroscience: Basic and Clinical, 128, 1–8.
DeBoer, R. W., Karemaker, J. M., & Strackee, J. (1987).Hemodynamic fluctuations and baroreflex sensitivity inhumans: A beat-to-beat model. American Journal of Physiol-ogy—Heart and Circulatory Physiology, 253, H680–H689.
DeGiorgio, C. M., Miller, P., Meymandi, S., Chin, A., Epps, J.,Gordon, S., et al. (2010). RMSSD, a measure of vagus-mediated heart rate variability, is associated with risk factorsfor SUDEP: The SUDEP-7 Inventory. Epilepsy and Behavior,19, 78–81.
Drew, B. J., Califf, R. M., Funk, M., Kaufman, E. S., Krucoff, M. W.,Laks, M. M., et al. (2004). Practice standards for electrocardio-graphic monitoring in hospital settings: An American HeartAssociation scientific statement from the Councils on Cardio-vascular Nursing, Clinical Cardiology, and CardiovascularDisease in the young. Circulation, 110, 2721–2746.
Eckberg, D. L., & Eckberg, M. J. (1982). Human sinus noderesponses to repetitive, ramped carotid baroreceptor stimuli.American Journal of Physiology—Heart and CirculatoryPhysiology, 242, H638–H644.
Gevirtz, R. (2013). The nerve of that disease: The vagus nerve andcardiac rehabilitation. Biofeedback, 41, 32–38.
Gevirtz, R. N., & Lehrer, P. (2003). Resonant frequency heart ratebiofeedback. In M. S. Schwartz & F. Andrasik (Eds.),Biofeedback: A practitioner’s guide (3rd ed., pp 245–250).New York: The Guilford Press.
Giardino, N. D., Chan, L., & Borson, S. (2004). Combined heartrate variability and pulse oximetry biofeedback for chronicobstructive pulmonary disease. Applied Psychophysiology andBiofeedback, 29, 121–133.
Ginsberg, J. P., Berry, M. E., & Powell, D. A. (2010). Cardiaccoherence and posttraumatic stress disorder in combat veter-ans. Alternative Therapies, 16, 52–60.
Goldstein, D. S., Bentho, O., Park, M. Y., & Sharabi, Y. (2011).Low frequency power of heart rate variability is not a measureof cardiac sympathetic tone but may be a measure ofmodulation of cardiac autonomic outflows by baroreflexes.Experimental Physiology, 96, 1255–1261.
Karemaker, J. M. (2009). Counterpoint: Respiratory sinusarrhythmia is due to the baroreflex mechanism. Journal ofApplied Psychology, 106(5), 1742–1743.
Kazuma, N., Otsuka, K., Matsuoka, I., & Murata, M. (1997). Heartrate variability during 24 hours in asthmatic children.Chronobiology International, 14, 597–606.
Kleiger, R. E., Miller, J. P., Bigger, J. T., Moss, A. J., & theMulticenter Post-Infarction Research Group. (1987). Decreasedheart rate variability and its association with increasedmortality after acute myocardial infarction. American Journalof Cardiology, 59, 256–262.
Kleiger, R. E., Stein, P. K., Bigger, J. T. (2005). Heart ratevariability: Measurement and clinical utility. Annals ofNoninvasive Electrocardiology, 10(1), 88–101.
Lehrer, P. M. (2007). Biofeedback training to increase heart ratevariability. In P. M. Lehrer, R. M. Woolfolk, & W. E. Sime(Eds.), Principles and practice of stress management (3rd ed.).New York: Guilford Press.
Lehrer, P. M. (2013). How does heart rate variability biofeedbackwork? Resonance, the baroreflex, and other mechanisms.Biofeedback, 41, 26–31.
Lehrer, P., Karavidas, M. K., Lu, S. E., Coyle, S. M., Oikawa, L. O.,Macor, M., et al. (2010). Voluntarily produced increases inheart rate variability modulate autonomic effects of endotoxininduced systemic inflammation: An exploratory study. AppliedPsychophysiology and Biofeedback, 35, 303–315.
Lehrer, P. M., & Vaschillo, E. (2008). The future of heart ratevariability biofeedback. Biofeedback, 36(1), 11–14.
Lehrer, P. M., Vaschillo, E. V., & Vaschillo, B. (2004). Heartbeatsynchronizes with respiratory rhythm only under specificcircumstances. Chest, 126, 1385–1386.
Lehrer, P. M., Vaschillo, E., Vaschillo, B., Lu, S. E., Eckberg, D. L.,Edelberg, R., et al. (2003). Heart rate variability biofeedbackincreases baroreflex gain and peak expiratory flow. Psychoso-matic Medicine, 65, 796–805.
Maver, J., Strucl, M., & Accetto, R. (2004). Autonomic nervoussystem and microvascular alterations in normotensives with afamily history of hypertension. Blood Press, 13, 95–100.
McCraty, R., Atkinson, M., Tomasino, D., & Bradley, R. T.(2009). The coherent heart: Heart-brain interactions, psycho-physiological coherence, and the emergence of system-wideorder. Integral Review, 5(2), 10–115.
Moravec, C. S., & McKee, M. G. (2013). Psychophysiologicremodeling of the failing human heart. Biofeedback, 41, 7–12.
Moss, D. (2004). Heart rate variability (HRV) biofeedback.Psychophysiology Today, 1, 4–11.
Nolan, J., Flapan, A. D., Capewell, S., MacDonald, T. M., Neilson,J. M., Ewing, D. J. et al. (1992). Decreased cardiac parasym-
Heart Rate Variability Anatomy and Physiology
24
Spring20
13|Biofeedback
pathetic activity in chronic heart failure and its relation to leftventricular function. British Heart Journal, 67, 482–485.
Nunan, D., Sandercock, G. R. H., & Brodie, D. A. (2010). Aquantitative systematic review of normal values for short-termheart rate variability in healthy adults. Pacing and ClinicalElectrophysiology, 33, 1407–1417.
Ogletree-Hughes, M. L., Stull, L. B., Sweet, W. E., Smedira, N. G.,McCarthy, P. M., Moravec, C. S., et al. (2001). Mechanicalunloading restores beta-adrenergic responsiveness and reversesreceptor down-regulation in the failing human heart. Circula-tion, 104, 881–886.
Olshansky, B., Sabbah, H. N., Hauptman, P. J., & Colucci, W. S.(2008). Parasympathetic nervous system and heart failure:Pathophysiology and potential implications for therapy.Circulation, 118, 863–871.
Opthof, T. (2000). Thenormal range and determinants of the intrinsicheart rate in man. Cardiovascular Research, 45, 177–184.
Otzenberger, H., Gronfier, C., Simon, C., Charloux, A., Ehrhart,J., Piquard, F., et al. (1998). Dynamic heart rate variability: Atool for exploring sympathovagal balance continuously duringsleep in men. American Journal of Physiology, 275, H946–H950.
Porges, S. W. (2011). The polyvagal theory: Neurophysiologicalfoundations of emotions, attachment, communication, andself-regulation. New York: W. W. W. Norton & Company.
Purcell, E., Urlakis, M., & Shaffer, F. (2010). Physical andemotional effects of resonant diaphragmatic breathing. AppliedPsychophysiology and Biofeedback, 35, 327.
Ridker, P. M., Rifai, N., Stampfer, M. J., & Hennekens, C. H.(2000). Plasma concentration interleukin-6 and the risk offuture myocardial infarction among apparently healthy men.Circulation, 101, 1767–1772.
Roach, D., Wilson, W., Ritchie, D., & Sheldon, R. (2004).Dissection of long-range heart rate variability: Controlledinduction of prognostic measures by activity in the laboratory.Journal of the American College of Cardiology, 43, 2271–2277.
Stauss, H. M. (2003). Heart rate variability. American Journal ofPhysiology: Regulatory, Integrative and Comparative Physi-ology, 285, R927–R931.
Task Force of the European Society of Cardiology and the NorthAmerican Society of Pacing and Electrophysiology. (1996).Heart rate variability: Standards of measurement, physiologicalinterpretation, and clinical use. Circulation, 93, 1043–1065.
Taylor, J. A., Carr, D. L., Myers, C. W., & Eckberg, D. L. (1998).Mechanisms underlying very-low-frequency RR-interval os-cillations in humans. Circulation, 98, 547–555.
Taylor, S. E. (2006). Tend and befriend: Biological bases ofaffiliation under stress. Current Directions in PsychologicalScience, 15, 273–277.
Thayer, J. F., Ahs, F., Fredrikson, M., Sollers, J. J., & Wager, T. D.(2012). A meta-analysis of heart rate variability and neuroim-
aging studies: Implications for heart rate variability as a marker
of stress and health. Neuroscience and Biobehavioral Reviews,
36, 747–756.
Thayer, J. F., & Lane, R. D. (2000). A model of neurovisceral
integration in emotion regulation and dysregulation. Journal of
Affective Disorders, 61, 201–216.
Thayer, J. F., Yamamoto, S. S., & Brosschot, J. F. (2010). The
relationship of autonomic imbalance, heart rate variability and
cardiovascular disease risk factors. International Journal of
Cardiology, 141, 122–131.
Tortora, G. J., & Derrickson, B. H. (2012). Principles of anatomy
and physiology (13th ed.). New York: John Wiley & Sons, Inc.
Tracey, K. J. (2007). Physiology and immunology of the
cholinergic anti-inflammatory pathway. Journal of Clinical
Investigation, 117, 289–296.
Umetami, K., Singer, D. H., McCraty, R., & Atkinson, M. (1998).
Twenty-four hour time domain heart rate variability and heart
rate: Relations to age and gender over nine decades. Journal of
the American College of Cardiology, 31, 593–601.
Vaschillo, E., Lehrer, P., Rishe, N., & Konstantinov, M. (2002).
Heart rate variability biofeedback as a method for assessing
baroreflex function: A preliminary study of resonance in the
cardiovascular system. Applied Psychophysiology and Bio-
feedback, 27, 1–27.
Vaschillo, E., Vaschillo, B., & Lehrer, P. (2004). Heartbeat
synchronizes with respiratory rhythm only under specific
circumstances. Chest, 126, 1385–1386.
Yasuma, F., & Hayano, J. (2004). Respiratory sinus arrhythmia:
Why does the heartbeat synchronize with respiratory rhythm?
Chest, 125, 683–690.
Fred Shaffer John Venner
Correspondence: Fred Shaffer, PhD, BCB, Truman State Universi-ty, Department of Psychology, Kirksville, MO, email: [email protected].
Shaffer and Venner
25
Biofeedback
|Sprin
g2013