bio-medical waste audit report - documents.gov.indocuments.gov.in/ua/9746.pdfbio-medical waste audit...
TRANSCRIPT
Contents
1. OVERVIEW ...................................................................... 1-7 1.1 Objectives............................................................................. 1 1.2 Methodology......................................................................... 2 1.3 Constraints ........................................................................... 4 1.5 Observations ........................................................................ 5 1.6 Profile of Sample facilities .................................................... 7 2. WASTE GENERATION TRENDS.................................. 8-32
2.1 Large Hospitals .................................................................... 8
2.2 Community Health Centers ............................................... 14
2.3 Primary Health Centers ...................................................... 21
2.4 Additional Primary Health Centers .................................... 27
2.5 Sub Centers & Out Reach ................................................. 32
Abbreviations APHC Additional Primary Health Centre
BMW Bio Medical Waste
BMWM Bio Medical Waste Management
BH Base Hospital
CBWTF Common Bio Medical Waste Treatment Facility
CHC Community Health Centre
CH Combined Hospital
CGWB Central Ground Water Board
CPCB Central Pollution Control Board
CMS Chief Medical Superintendant
DH District Hospital
DHF District Hospital Female
DHM District Hospital Male
DHQ District Head Quarter
DPCC Delhi Pollution Control Board
HCF Health Care Facility
HCWM Health Care Waste Management
HPSEPPCB Himachal Pradesh State Environment Protection & Pollution
Control Board
HQ Head Quarters
IC Infection Control
IMEP Infection Management & Environment Plan
MS Medical Superintendent
MOIC Medical Officer in Charge
NABL National Accreditation Board for Testing & Calibration Laboratories
RFH Rural Female Hospital
SAD State Allopathic Dispensary
SC Sub Centre
UAHSDP Uttaranchal Health Systems Development Project
UEPPCB Uttarakhand Environment Protection & Pollution Control Board
UKHSDP Uttarakhand Health Systems Development Project
Overview Due to it typical physiographical disposition and very low density of population, the BMWM needs of the State of Uttarakhand will have large variations from most of the other States. There are remote villages which are not connected by motorable roads. Even the foot tracks are difficult to travel due to rugged topography. Dehradun is only town in the State which has more than 5 lac population. The density of population varies greatly in different parts of the State. The minimum density of population is 37 people per squire kilometre in district Uttarkashi to 613 people per squire kilometre in district Haridwar. The State is divided into three zones, namely High Hills, Mid Hills and Foothills/Plains. With these wide variations, the quantity of waste generated in the healthcare facilities of the State was likely to vary from the standard norms prescribed for bio-medical waste generation. In view of the above facts, it was considered advisable to go in for waste audit to ascertain the quantity of bio-medical waste in the different categories of healthcare facilities to form a basis for developing treatment and disposable system as per the specific requirement of the State. Objectives
The study has been conducted through survey with a view to:
Identify the items of waste generated in the Health Care Facilities coming into the waste stream.
Quantify each category of bio-medical waste as specified by the Bio Medical Waste (Management and Handling) Rules, 2000.
Identify the recyclable items in both general and infectious waste.
Ascertain generation of both infectious and general waste per bed per day for Sub Centres (SC), Additional Primary Health Centres (APHC) and Primary Health Centres (PHCs), Community Health Centres (CHC) and Combined Hospital (CH) and Outreach Sessions.
( 1 )
Project average generation of waste by different types of healthcare facilities.
Methodology
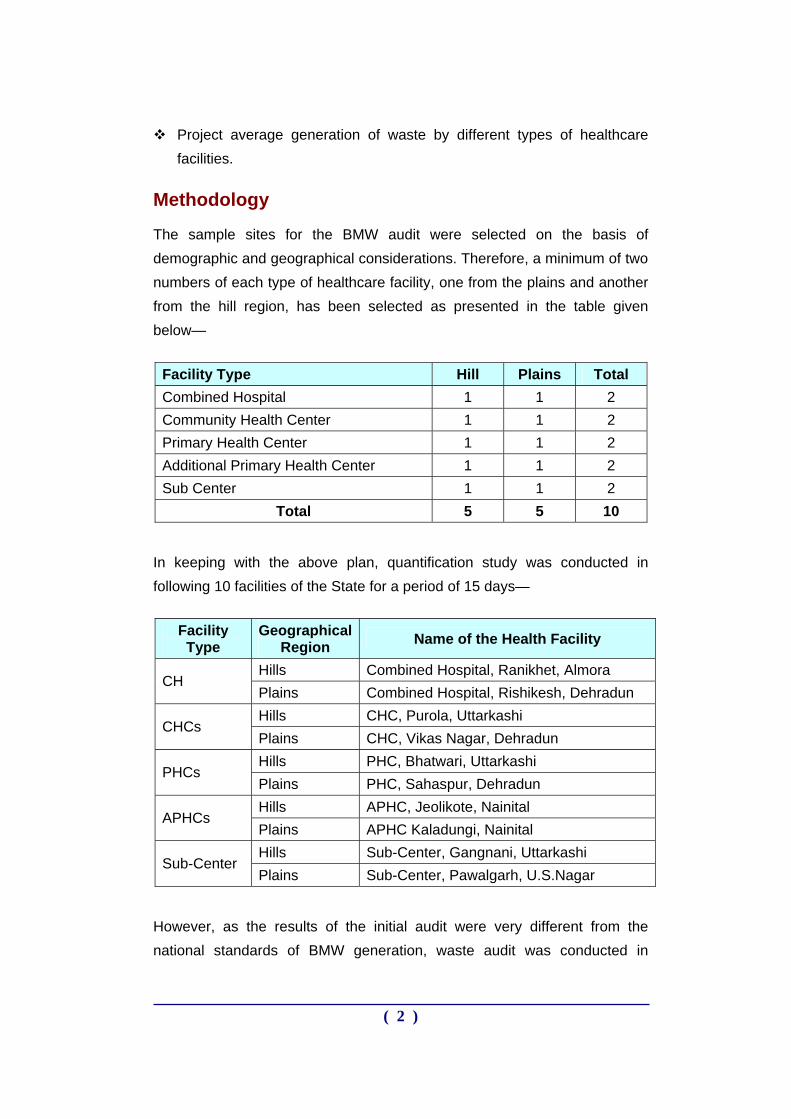
The sample sites for the BMW audit were selected on the basis of demographic and geographical considerations. Therefore, a minimum of two numbers of each type of healthcare facility, one from the plains and another from the hill region, has been selected as presented in the table given below—
Facility Type Hill Plains Total Combined Hospital 1 1 2 Community Health Center 1 1 2 Primary Health Center 1 1 2 Additional Primary Health Center 1 1 2 Sub Center 1 1 2
Total 5 5 10
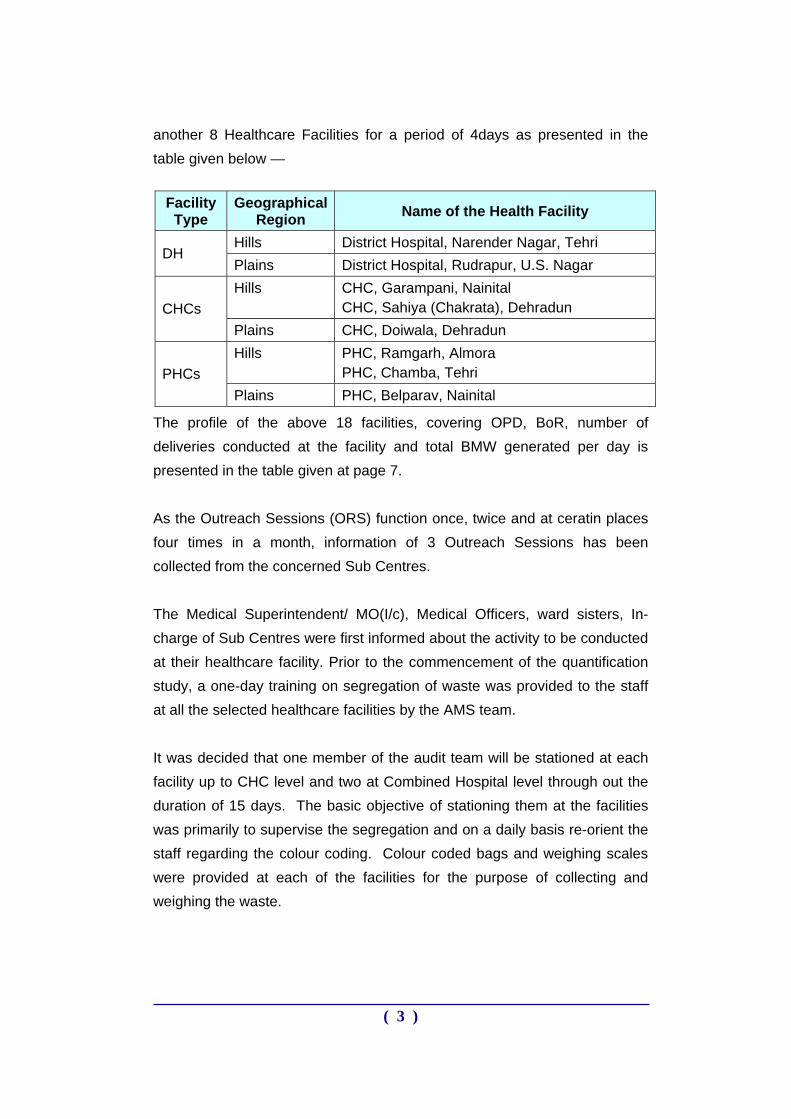
In keeping with the above plan, quantification study was conducted in following 10 facilities of the State for a period of 15 days—
Facility Type
Geographical Region Name of the Health Facility
Hills Combined Hospital, Ranikhet, Almora CH
Plains Combined Hospital, Rishikesh, Dehradun Hills CHC, Purola, Uttarkashi
CHCs Plains CHC, Vikas Nagar, Dehradun Hills PHC, Bhatwari, Uttarkashi
PHCs Plains PHC, Sahaspur, Dehradun Hills APHC, Jeolikote, Nainital
APHCs Plains APHC Kaladungi, Nainital Hills Sub-Center, Gangnani, Uttarkashi
Sub-Center Plains Sub-Center, Pawalgarh, U.S.Nagar
However, as the results of the initial audit were very different from the national standards of BMW generation, waste audit was conducted in
( 2 )
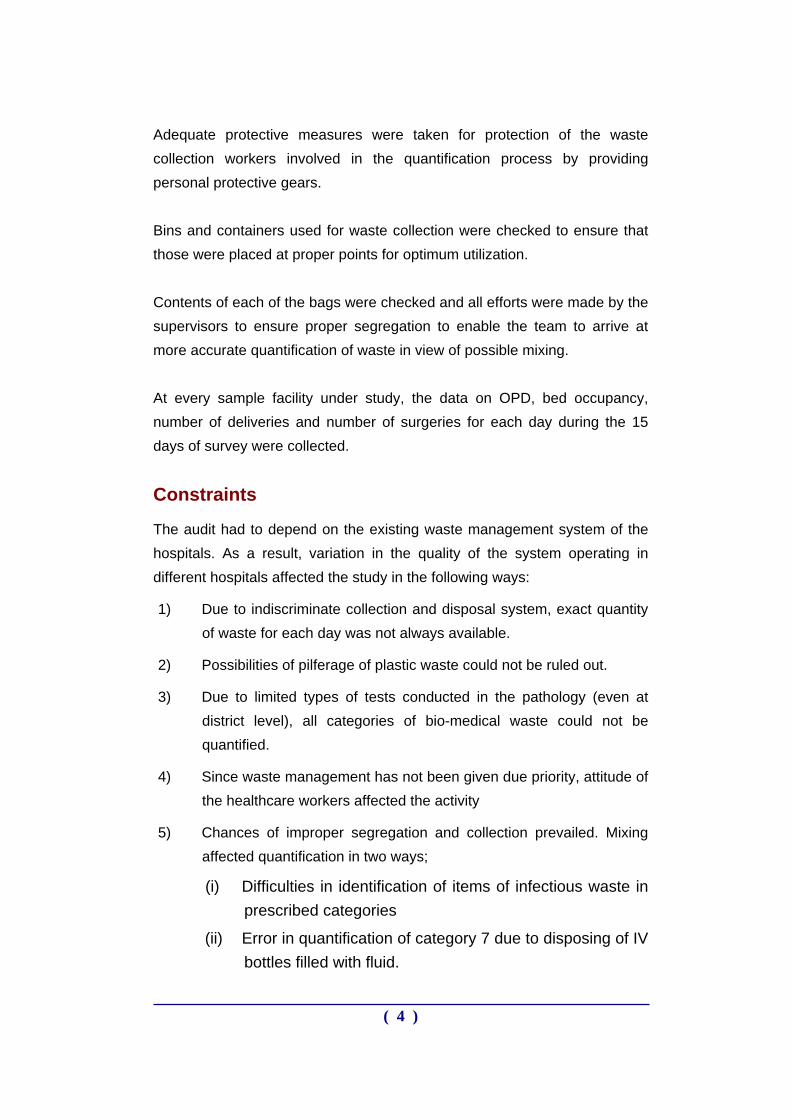
another 8 Healthcare Facilities for a period of 4days as presented in the table given below —
Facility Type
Geographical Region Name of the Health Facility
Hills District Hospital, Narender Nagar, Tehri DH
Plains District Hospital, Rudrapur, U.S. Nagar Hills CHC, Garampani, Nainital
CHC, Sahiya (Chakrata), Dehradun CHCs Plains CHC, Doiwala, Dehradun Hills PHC, Ramgarh, Almora
PHC, Chamba, Tehri PHCs Plains PHC, Belparav, Nainital
The profile of the above 18 facilities, covering OPD, BoR, number of deliveries conducted at the facility and total BMW generated per day is presented in the table given at page 7. As the Outreach Sessions (ORS) function once, twice and at ceratin places four times in a month, information of 3 Outreach Sessions has been collected from the concerned Sub Centres. The Medical Superintendent/ MO(I/c), Medical Officers, ward sisters, In-charge of Sub Centres were first informed about the activity to be conducted at their healthcare facility. Prior to the commencement of the quantification study, a one-day training on segregation of waste was provided to the staff at all the selected healthcare facilities by the AMS team. It was decided that one member of the audit team will be stationed at each facility up to CHC level and two at Combined Hospital level through out the duration of 15 days. The basic objective of stationing them at the facilities was primarily to supervise the segregation and on a daily basis re-orient the staff regarding the colour coding. Colour coded bags and weighing scales were provided at each of the facilities for the purpose of collecting and weighing the waste.
( 3 )
Adequate protective measures were taken for protection of the waste collection workers involved in the quantification process by providing personal protective gears. Bins and containers used for waste collection were checked to ensure that those were placed at proper points for optimum utilization. Contents of each of the bags were checked and all efforts were made by the supervisors to ensure proper segregation to enable the team to arrive at more accurate quantification of waste in view of possible mixing. At every sample facility under study, the data on OPD, bed occupancy, number of deliveries and number of surgeries for each day during the 15 days of survey were collected.
Constraints
The audit had to depend on the existing waste management system of the hospitals. As a result, variation in the quality of the system operating in different hospitals affected the study in the following ways:
1) Due to indiscriminate collection and disposal system, exact quantity of waste for each day was not always available.
2) Possibilities of pilferage of plastic waste could not be ruled out.
3) Due to limited types of tests conducted in the pathology (even at district level), all categories of bio-medical waste could not be quantified.
4) Since waste management has not been given due priority, attitude of the healthcare workers affected the activity
5) Chances of improper segregation and collection prevailed. Mixing affected quantification in two ways;
(i) Difficulties in identification of items of infectious waste in prescribed categories
(ii) Error in quantification of category 7 due to disposing of IV bottles filled with fluid.
( 4 )
Observations
During quantification study, the following observations related to infection control and waste management were recorded—
The general cleanliness in the healthcare facilities was not up to the desired level.
It was observed that waste management has not been given due priority and there was no regular administrative monitoring.
Number of available Safai Karmacharis (sweepers) was inadequate
In all the HCFs bins were available but the size of the bins did not match the quantity of waste generated in the healthcare facilities. The placement of bins did not match the waste generation trends. A single bin system is in place at the sampled facilities.
The staff of the HCFs is unaware about proper segregation and disposal of bio-medical waste.
Mixing of general waste with infectious waste is a common feature.
Open burning was taking place at all the healthcare facilities. Awareness regarding hazards of open burning is absent.
IV bottles were included during quantification. But usually these bottles are not disposed of in the waste stream. Storing of IV bottles and selling them to kabadiwalas is a common practice found in the healthcare facilities situated in the plains or more populated towns/ cities. It is a matter of serious concern because many of these used IV bottles approximately (sixty per cent) were attached with IV sets which pose direct threat of prick injury and infection to the waste handlers.
The used IV bottles and disposable syringes received at the quantification point were not cut or mutilated.
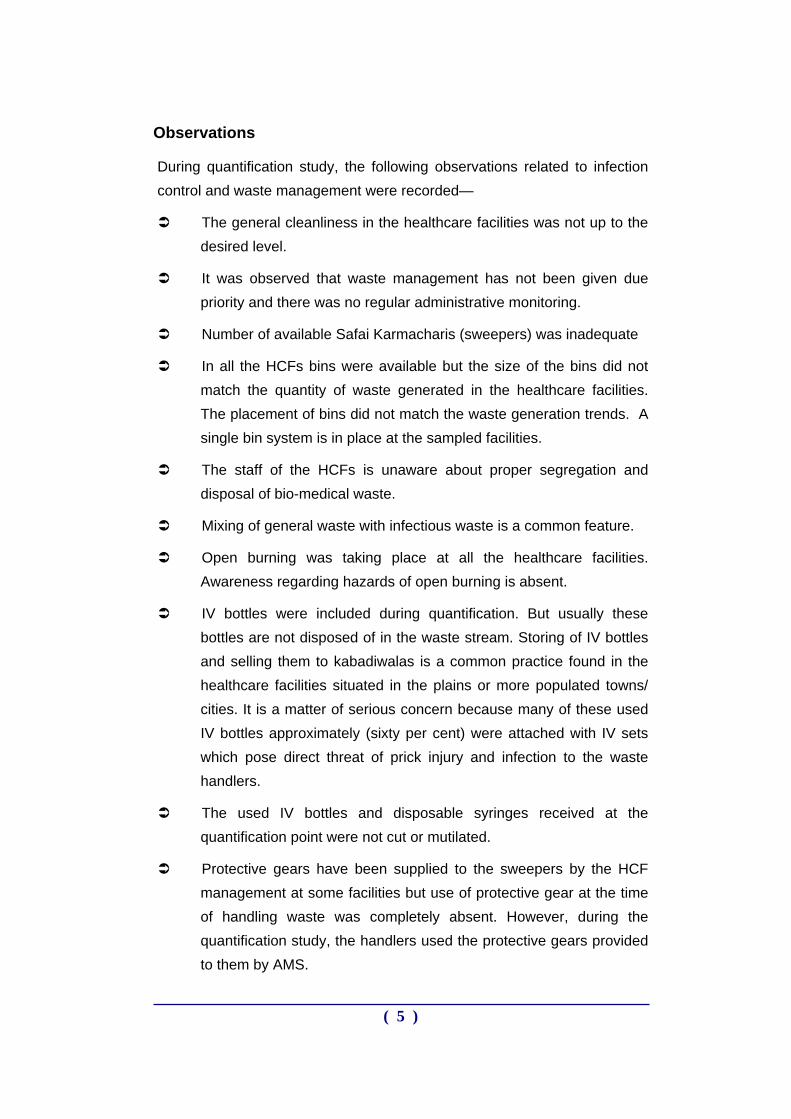
Protective gears have been supplied to the sweepers by the HCF management at some facilities but use of protective gear at the time of handling waste was completely absent. However, during the quantification study, the handlers used the protective gears provided to them by AMS.
( 5 )
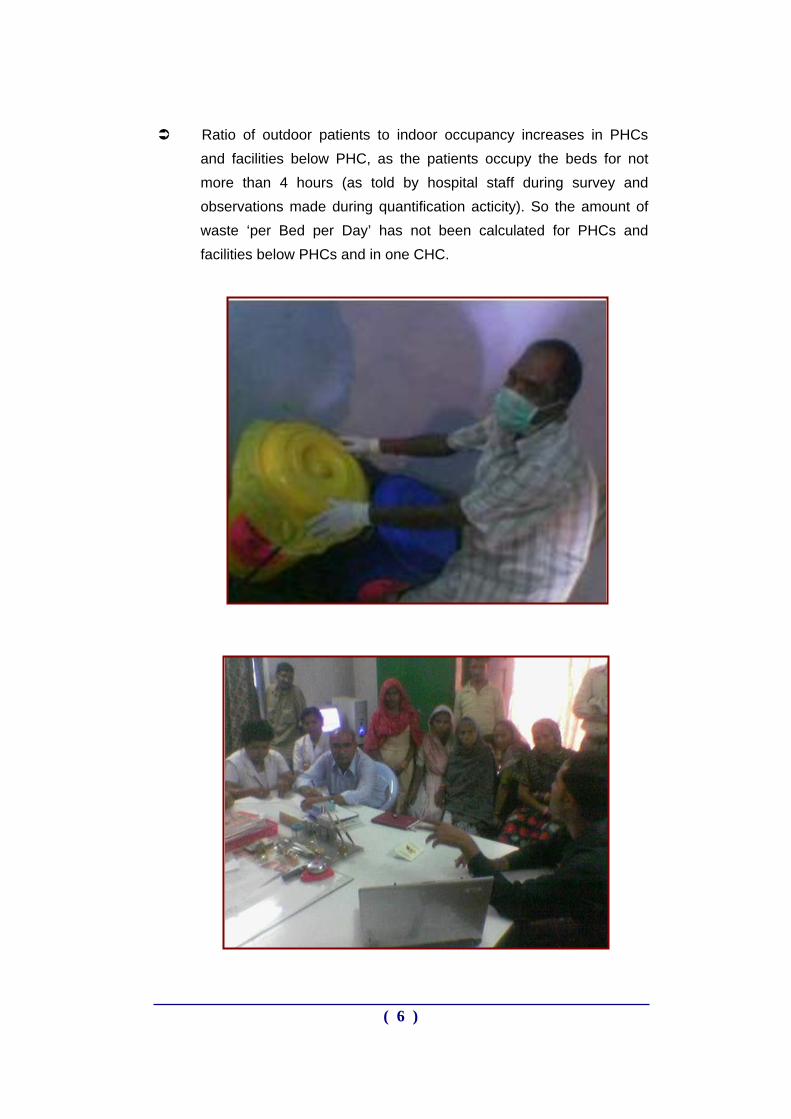
Ratio of outdoor patients to indoor occupancy increases in PHCs and facilities below PHC, as the patients occupy the beds for not more than 4 hours (as told by hospital staff during survey and observations made during quantification acticity). So the amount of waste ‘per Bed per Day’ has not been calculated for PHCs and facilities below PHCs and in one CHC.
( 6 )
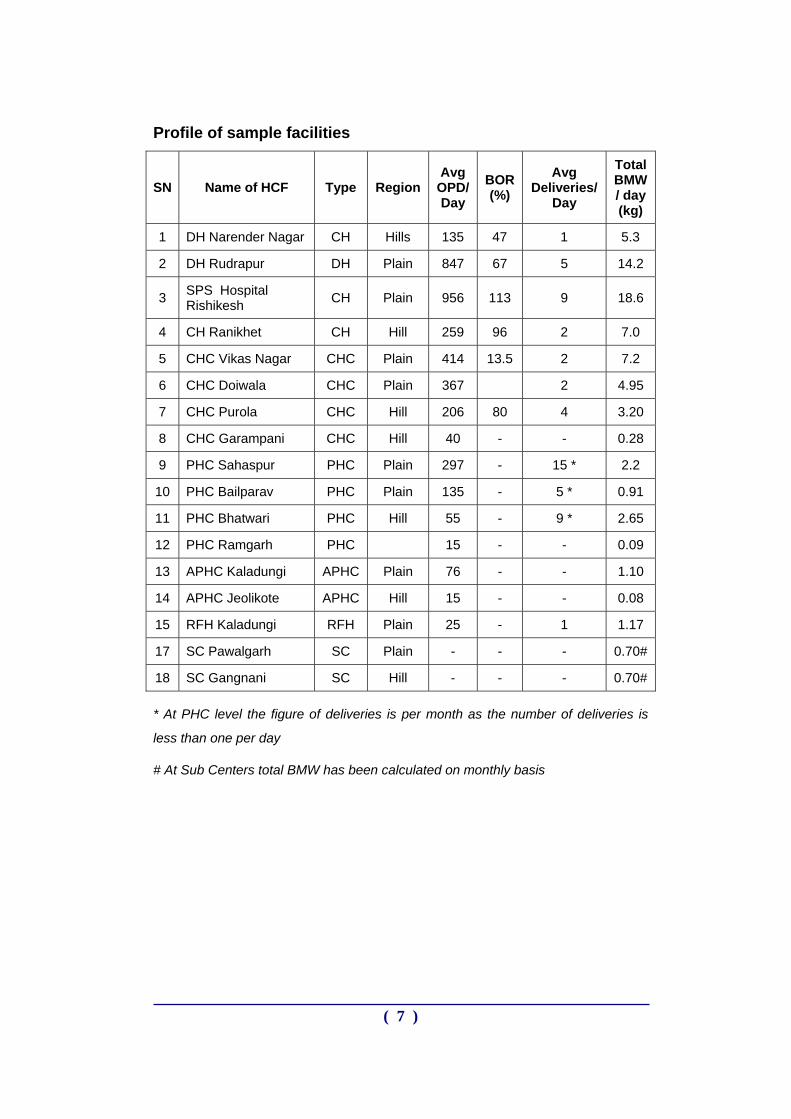
Profile of sample facilities
SN Name of HCF Type Region Avg
OPD/ Day
BOR (%)
Avg Deliveries/
Day
Total BMW / day (kg)
1 DH Narender Nagar CH Hills 135 47 1 5.3
2 DH Rudrapur DH Plain 847 67 5 14.2
3 SPS Hospital Rishikesh CH Plain 956 113 9 18.6
4 CH Ranikhet CH Hill 259 96 2 7.0
5 CHC Vikas Nagar CHC Plain 414 13.5 2 7.2
6 CHC Doiwala CHC Plain 367 2 4.95
7 CHC Purola CHC Hill 206 80 4 3.20
8 CHC Garampani CHC Hill 40 - - 0.28
9 PHC Sahaspur PHC Plain 297 - 15 * 2.2
10 PHC Bailparav PHC Plain 135 - 5 * 0.91
11 PHC Bhatwari PHC Hill 55 - 9 * 2.65
12 PHC Ramgarh PHC 15 - - 0.09
13 APHC Kaladungi APHC Plain 76 - - 1.10
14 APHC Jeolikote APHC Hill 15 - - 0.08
15 RFH Kaladungi RFH Plain 25 - 1 1.17
17 SC Pawalgarh SC Plain - - - 0.70#
18 SC Gangnani SC Hill - - - 0.70#
* At PHC level the figure of deliveries is per month as the number of deliveries is
less than one per day
# At Sub Centers total BMW has been calculated on monthly basis
( 7 )
WASTE GENERATION TRENDS LARGE HOSPITALS
(DISTRICT HOSPITAL/ COMBINED HOSPITALS) The section on large hospitals consists of district hospitals and combined hospitals. The BMW audit was conducted in four large hospitals, two situated in the hills and two in the plains. The names of the healthcare facilities are listed below.
SPS Combined Hospital Rishikesh
JLN District Hospital Rudrapur
GSM Combined Hospital Ranikhet
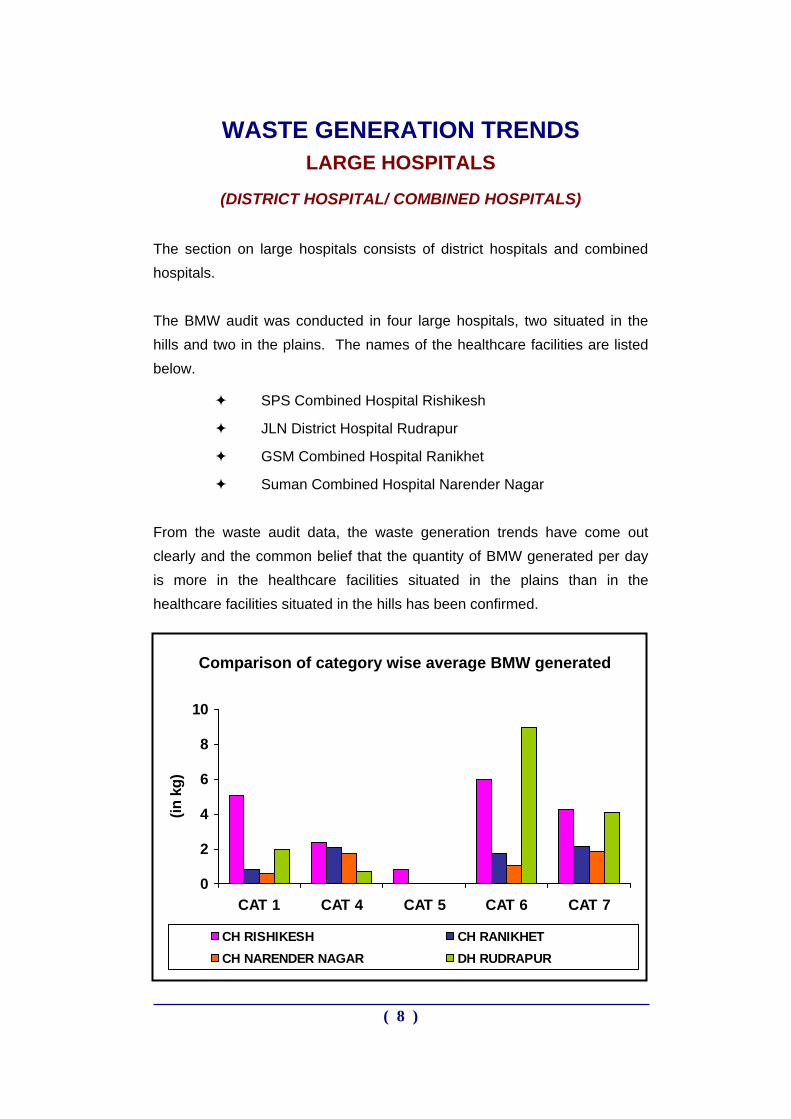
Suman Combined Hospital Narender Nagar From the waste audit data, the waste generation trends have come out clearly and the common belief that the quantity of BMW generated per day is more in the healthcare facilities situated in the plains than in the healthcare facilities situated in the hills has been confirmed.
Comparison of category wise average BMW generated
0
2
4
6
8
10
CAT 1 CAT 4 CAT 5 CAT 6 CAT 7
(in k
g)
CH RISHIKESH CH RANIKHETCH NARENDER NAGAR DH RUDRAPUR
( 8 )
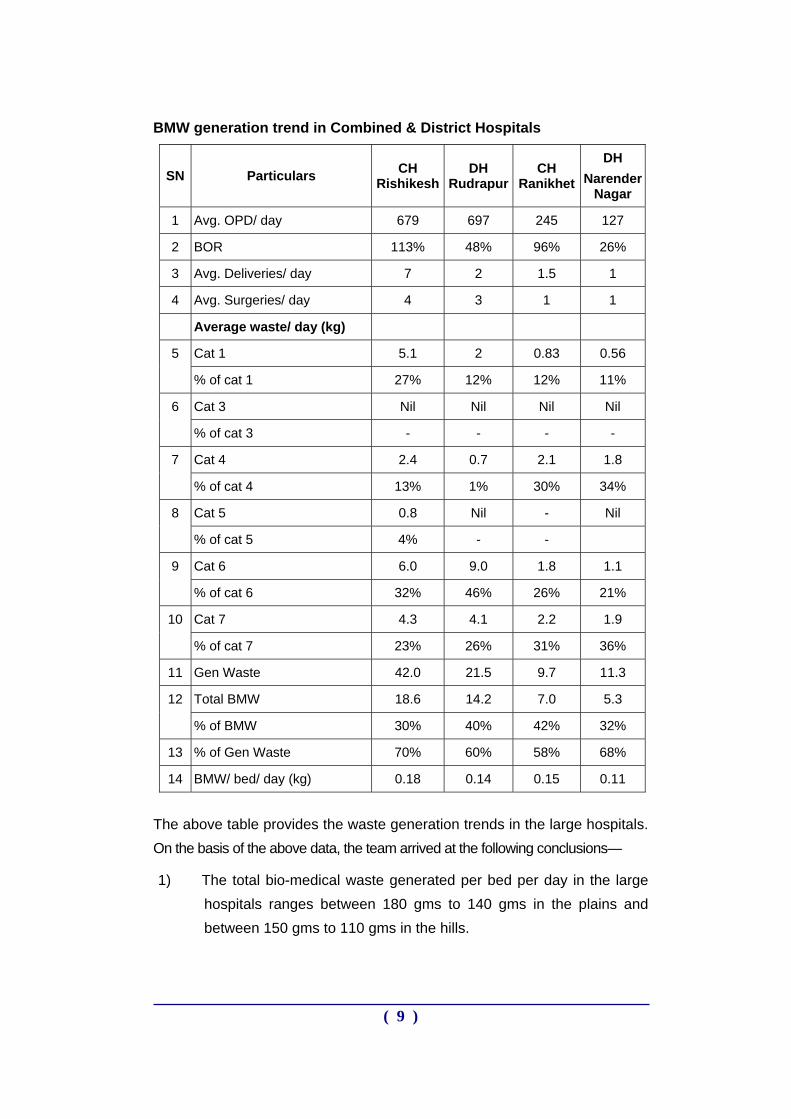
BMW generation trend in Combined & District Hospitals
SN Particulars CH Rishikesh
DH Rudrapur
CH Ranikhet
DH Narender
Nagar
1 Avg. OPD/ day 679 697 245 127
2 BOR 113% 48% 96% 26%
3 Avg. Deliveries/ day 7 2 1.5 1
4 Avg. Surgeries/ day 4 3 1 1
Average waste/ day (kg)
Cat 1 5.1 2 0.83 0.56 5
% of cat 1 27% 12% 12% 11%
Cat 3 Nil Nil Nil Nil 6
% of cat 3 - - - -
Cat 4 2.4 0.7 2.1 1.8 7
% of cat 4 13% 1% 30% 34%
Cat 5 0.8 Nil - Nil 8
% of cat 5 4% - -
Cat 6 6.0 9.0 1.8 1.1 9
% of cat 6 32% 46% 26% 21%
Cat 7 4.3 4.1 2.2 1.9 10
% of cat 7 23% 26% 31% 36%
11 Gen Waste 42.0 21.5 9.7 11.3
Total BMW 18.6 14.2 7.0 5.3 12
% of BMW 30% 40% 42% 32%
13 % of Gen Waste 70% 60% 58% 68%
14 BMW/ bed/ day (kg) 0.18 0.14 0.15 0.11
The above table provides the waste generation trends in the large hospitals. On the basis of the above data, the team arrived at the following conclusions—
1) The total bio-medical waste generated per bed per day in the large hospitals ranges between 180 gms to 140 gms in the plains and between 150 gms to 110 gms in the hills.
( 9 )
2) The average bio-medical waste generated per bed per day in plains is 160 gms and in the hills, it is 130 gms per bed per day
3) The average difference in BMW generated per bed per day between
the large hospitals situated in the hills and those situated in the plains is 30 gms per bed per day. This 30 gms is not a very significant difference but the cause behind the small quantities of the total BMW generated per day in the healthcare facilities situated in the hills is as follows; a. Number of beds lesser than those in the plain
b. Less number of OPD per day
c. Lack of manpower, both medical and para-medical
4) The percentage of bio-medical waste out of the total hospital waste ranges from 30% to 42%
5) The percentage of general waste out of the total hospital waste
ranges from 70% to 58%. Due to poor segregation practices the percentage of bio-medical waste is high, however, this percentage was attained due to continuous supervision and monitoring and reorientation during the period of waste audit. The percentage of bio-medical waste on normal days is 50 to 60 percent.
6) The quantity of waste sharps is also very high in the large hospitals,
excepting District Hospital Rudrapur. It was observed that glass vials constituted 60% of the total quantity of waste sharps. If these vials are segregated and put into a different stream, the quantity of waste sharps will be reduced.
( 10 )
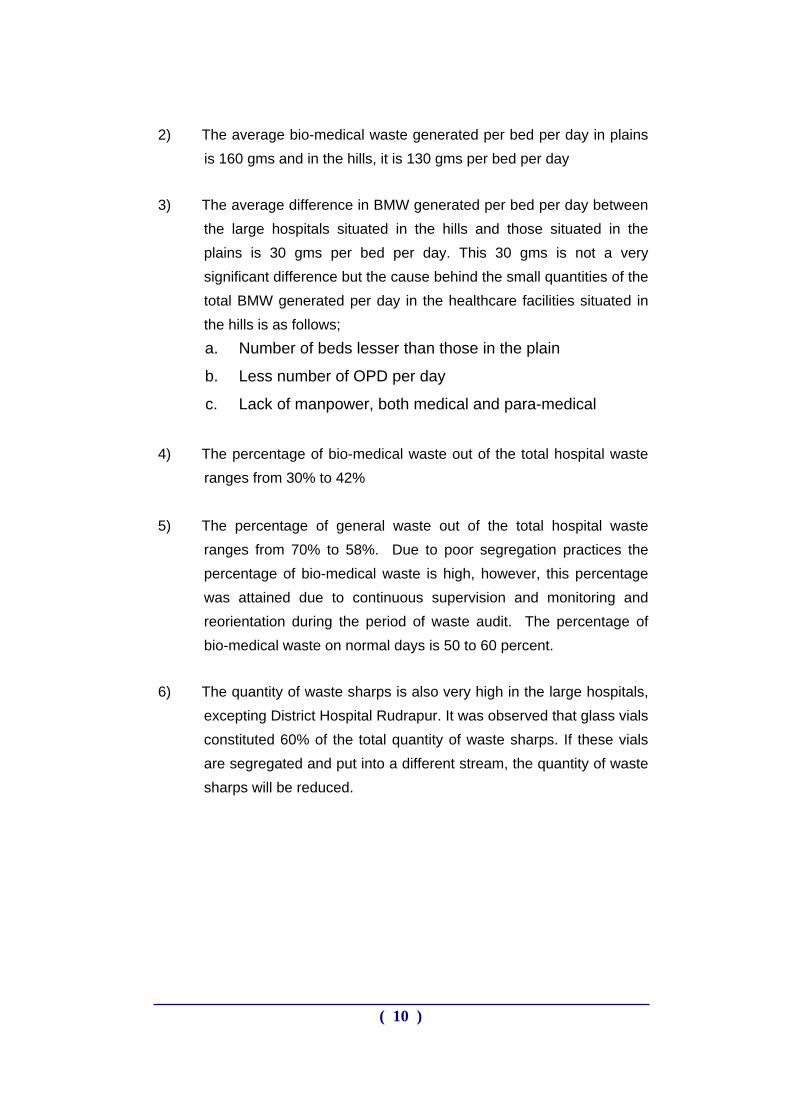
23%
33% 4% 13%
27%
CAT 1 - 27% CAT 4 - 13% CAT 5 - 4%CAT 6 - 32% CAT 7 - 23%
Category-wise percentage of BMWM generated at SPS CH RISHIKESH
Category-wise percentage of BMWM generated at JLN DH RUDRAPUR
53%
2%
1%
14%30%
CAT 1 - 12% CAT 4 - 1% CAT 5 - 0%CAT 6 - 46% CAT 7 - 26%
( 11 )
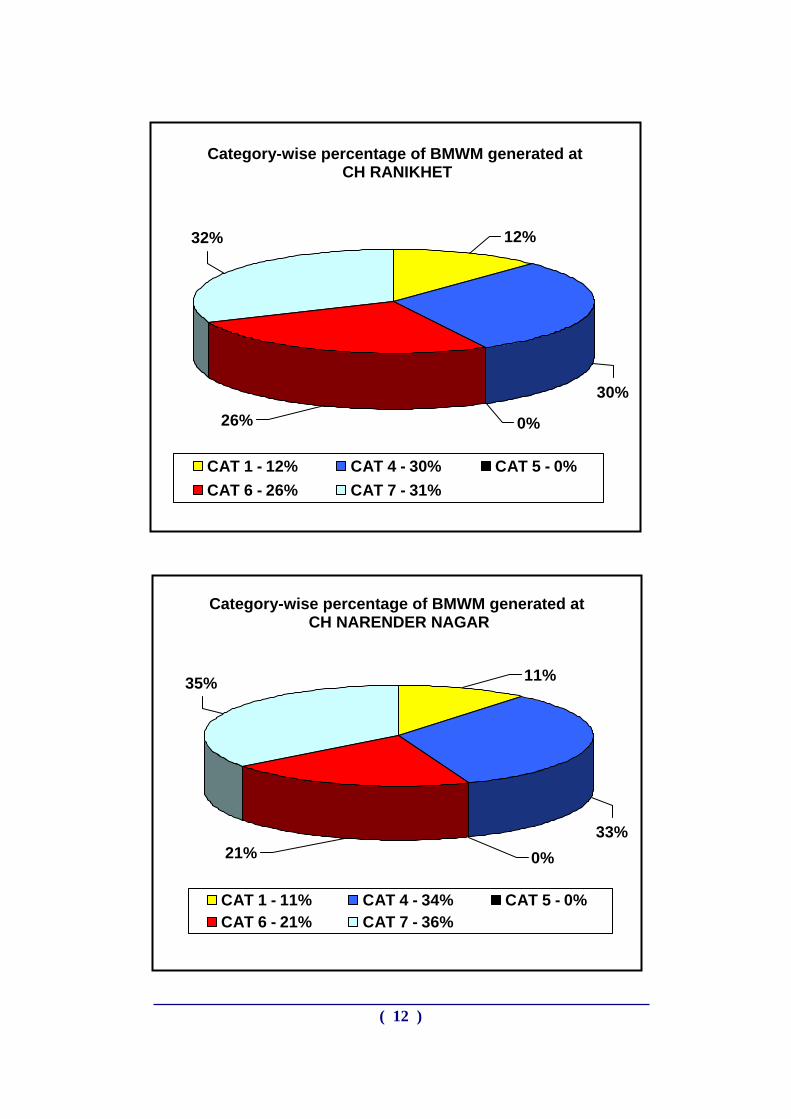
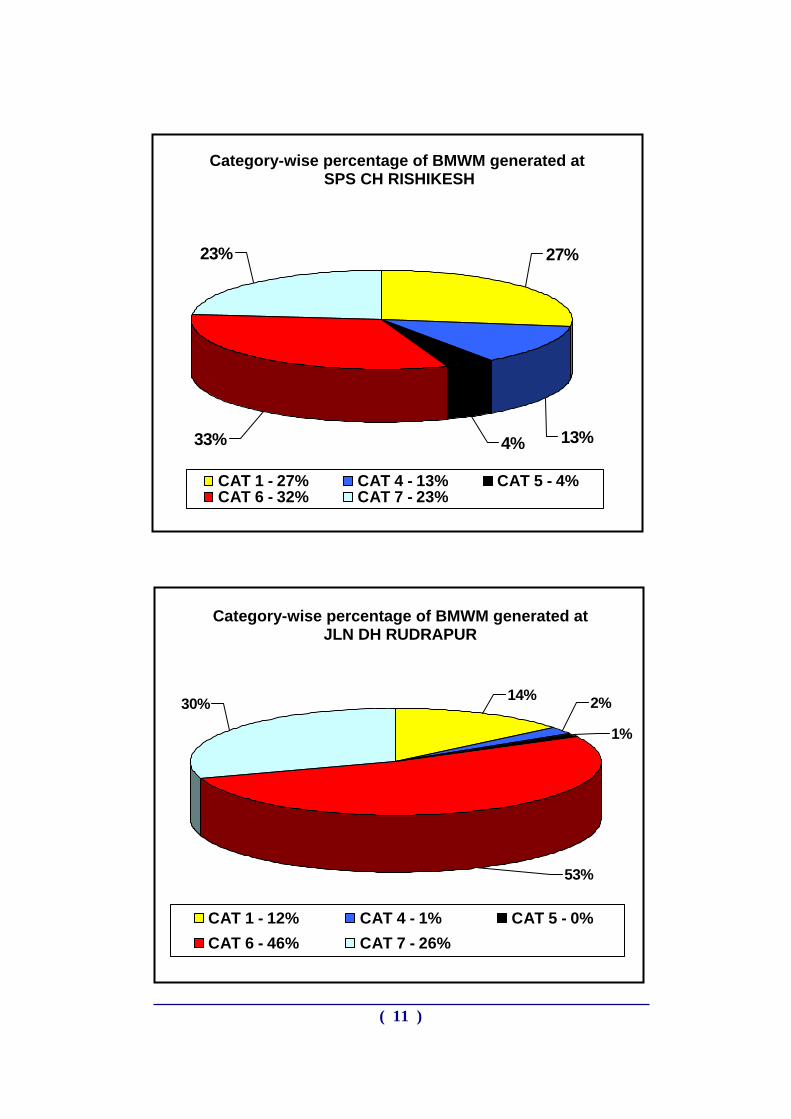
12%32%
30%
0%26%
CAT 1 - 12% CAT 4 - 30% CAT 5 - 0%CAT 6 - 26% CAT 7 - 31%
Category-wise percentage of BMWM generated at CH RANIKHET
Category-wise percentage of BMWM generated at CH NARENDER NAGAR
0%21%
35%
33%
11%
CAT 1 - 11% CAT 4 - 34% CAT 5 - 0%CAT 6 - 21% CAT 7 - 36%
( 12 )
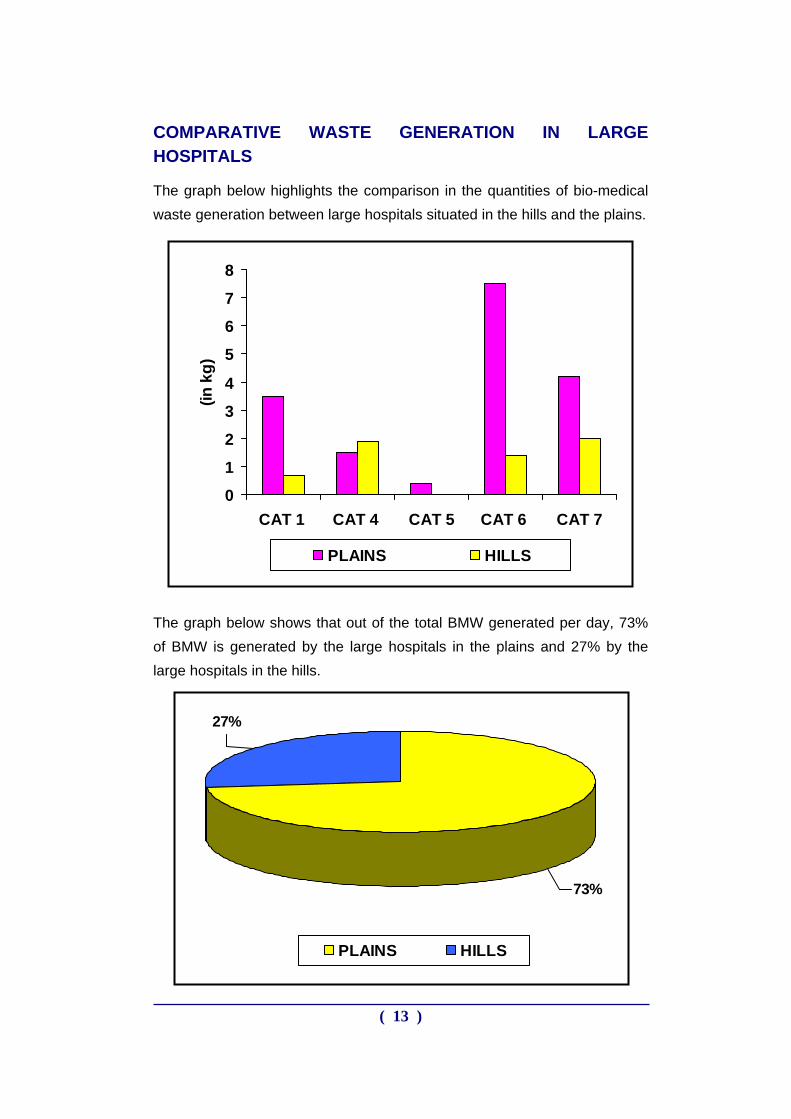
COMPARATIVE WASTE GENERATION IN LARGE HOSPITALS
The graph below highlights the comparison in the quantities of bio-medical waste generation between large hospitals situated in the hills and the plains.
0
1
2
3
4
5
6
7
8
CAT 1 CAT 4 CAT 5 CAT 6 CAT 7
(in k
g)
PLAINS HILLS
The graph below shows that out of the total BMW generated per day, 73% of BMW is generated by the large hospitals in the plains and 27% by the large hospitals in the hills.
27%
73%
PLAINS HILLS
( 13 )
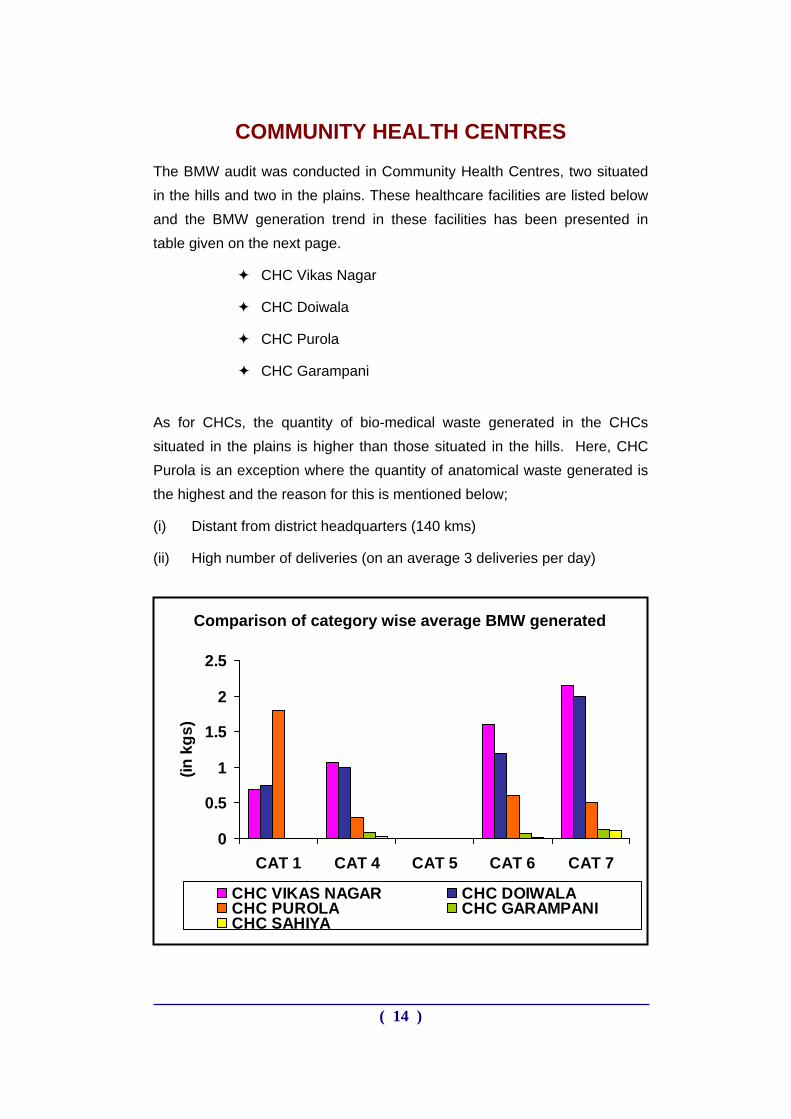
COMMUNITY HEALTH CENTRES
The BMW audit was conducted in Community Health Centres, two situated in the hills and two in the plains. These healthcare facilities are listed below and the BMW generation trend in these facilities has been presented in table given on the next page.
CHC Vikas Nagar
CHC Doiwala
CHC Purola
CHC Garampani
As for CHCs, the quantity of bio-medical waste generated in the CHCs situated in the plains is higher than those situated in the hills. Here, CHC Purola is an exception where the quantity of anatomical waste generated is the highest and the reason for this is mentioned below;
(i) Distant from district headquarters (140 kms)
(ii) High number of deliveries (on an average 3 deliveries per day)
0
0.5
1
1.5
2
2.5
CAT 1 CAT 4 CAT 5 CAT 6 CAT 7
(in k
gs)
CHC VIKAS NAGAR CHC DOIWALACHC PUROLA CHC GARAMPANICHC SAHIYA
Comparison of category wise average BMW generated
( 14 )
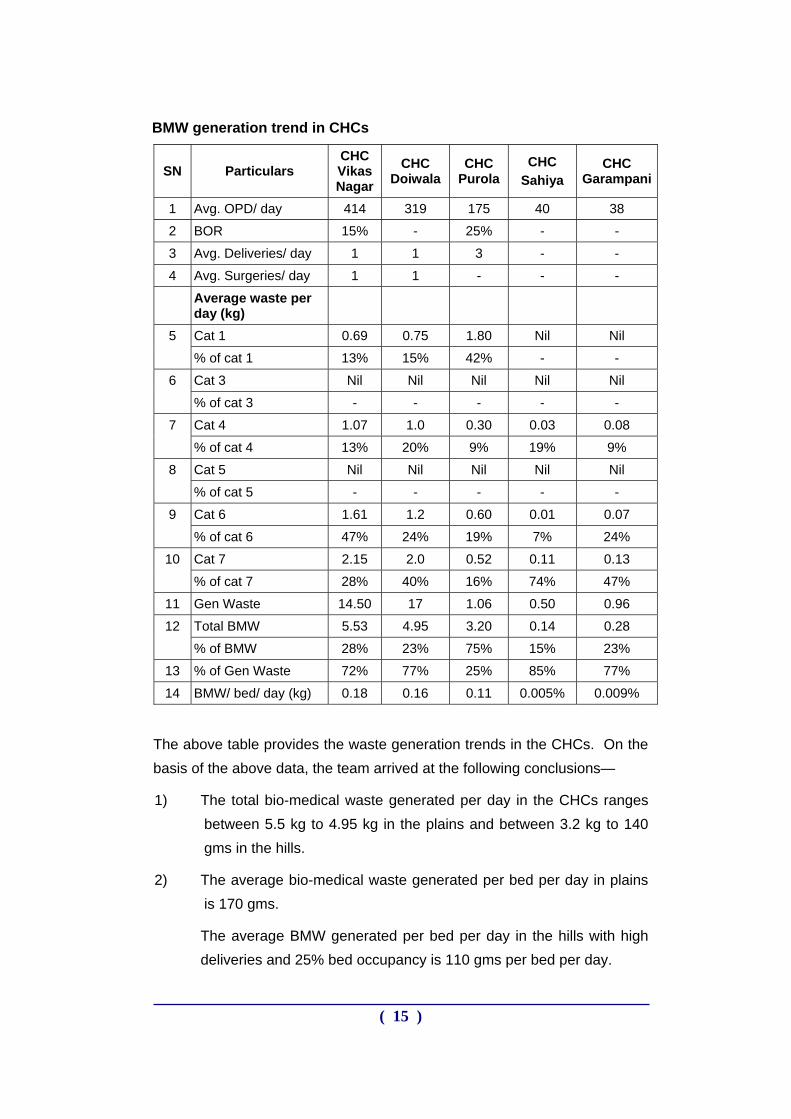
BMW generation trend in CHCs
SN Particulars CHC Vikas Nagar
CHC Doiwala
CHC Purola
CHC Sahiya
CHC Garampani
1 Avg. OPD/ day 414 319 175 40 38
2 BOR 15% - 25% - -
3 Avg. Deliveries/ day 1 1 3 - -
4 Avg. Surgeries/ day 1 1 - - -
Average waste per day (kg)
Cat 1 0.69 0.75 1.80 Nil Nil 5
% of cat 1 13% 15% 42% - -
Cat 3 Nil Nil Nil Nil Nil 6
% of cat 3 - - - - -
Cat 4 1.07 1.0 0.30 0.03 0.08 7
% of cat 4 13% 20% 9% 19% 9%
Cat 5 Nil Nil Nil Nil Nil 8
% of cat 5 - - - - -
Cat 6 1.61 1.2 0.60 0.01 0.07 9
% of cat 6 47% 24% 19% 7% 24%
Cat 7 2.15 2.0 0.52 0.11 0.13 10
% of cat 7 28% 40% 16% 74% 47%
11 Gen Waste 14.50 17 1.06 0.50 0.96
Total BMW 5.53 4.95 3.20 0.14 0.28 12
% of BMW 28% 23% 75% 15% 23%
13 % of Gen Waste 72% 77% 25% 85% 77%
14 BMW/ bed/ day (kg) 0.18 0.16 0.11 0.005% 0.009%
The above table provides the waste generation trends in the CHCs. On the basis of the above data, the team arrived at the following conclusions—
1) The total bio-medical waste generated per day in the CHCs ranges between 5.5 kg to 4.95 kg in the plains and between 3.2 kg to 140 gms in the hills.
2) The average bio-medical waste generated per bed per day in plains is 170 gms.
The average BMW generated per bed per day in the hills with high deliveries and 25% bed occupancy is 110 gms per bed per day.
( 15 )
The average BMW generated in hills with low or no deliveries and no IPD (like the sample facility CHC Garampani and CHC Sahiya) the bio-medical waste generated per day is 280 gms.
3) The average difference in BMW generated per bed per day between the CHCs situated in the hills and those situated in the plains is 60 gms per bed per day.
4) The percentage of bio-medical waste out of the total hospital waste is not more than 28%. CHC Purola again is an exception where the percentage of bio-medical waste is 75 %
5) The percentage of general waste out of the total hospital waste ranges from 72% to 77%. Due to poor segregation practices, the percentage of bio-medical waste is higher. However, this percentage was attained due to continuous supervision and monitoring and reorientation during the period of waste audit. Otherwise, the percentage of bio-medical waste on normal days is 80 to 90 percent.
6) The quantity of waste sharps is also very high and it was observed that glass vials constituted a large part of waste sharps at CHCs as well.
7) In both the CHCs situated in the plains, the average plastic waste (category 7) generated per day is 2 kg, which is approximately 60 kg in a month and in the hills, approximately 10 kg of plastic on an average is being generated in one month. Currently none of the CHCs are carrying out any treatment of these plastic wastes. In Uttarakhand there are 49 CHCs and in one month together these CHCs on an average are generating approximately 960 Kg of plastic waste in the plains and 330 kg in the hills. Thus, around 15480 kg of plastic generated by the CHCs alone in one year, which is either being burnt in the open pits or these contaminated plastic items are being spuriously sold to the kabadiwalas without any pre-treatment.
( 16 )
28%
46%0%
13%13%
CAT 1 - 13% CAT 4 - 13% CAT 5 - 0%
CAT 6 - 47% CAT 7 - 28%
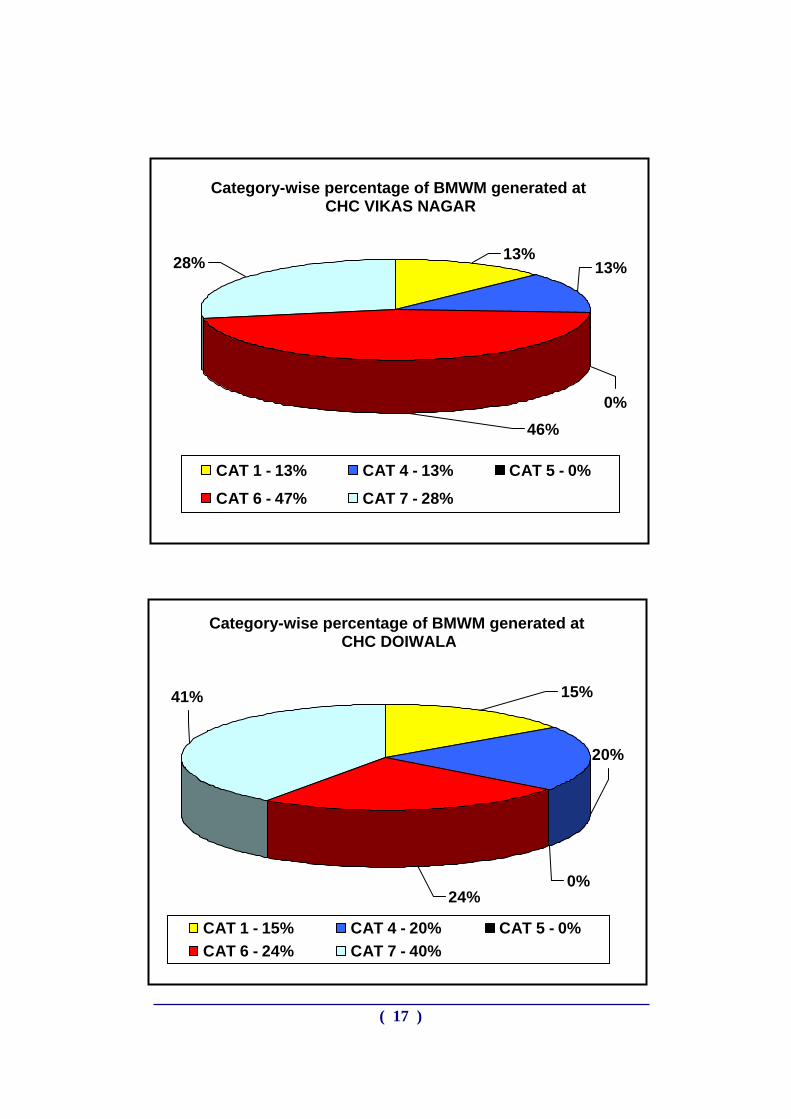
Category-wise percentage of BMWM generated at CHC VIKAS NAGAR
Category-wise percentage of BMWM generated at CHC DOIWALA
20%
24%0%
41% 15%
CAT 1 - 15% CAT 4 - 20% CAT 5 - 0%CAT 6 - 24% CAT 7 - 40%
( 17 )
21% 10%0%
48%21%
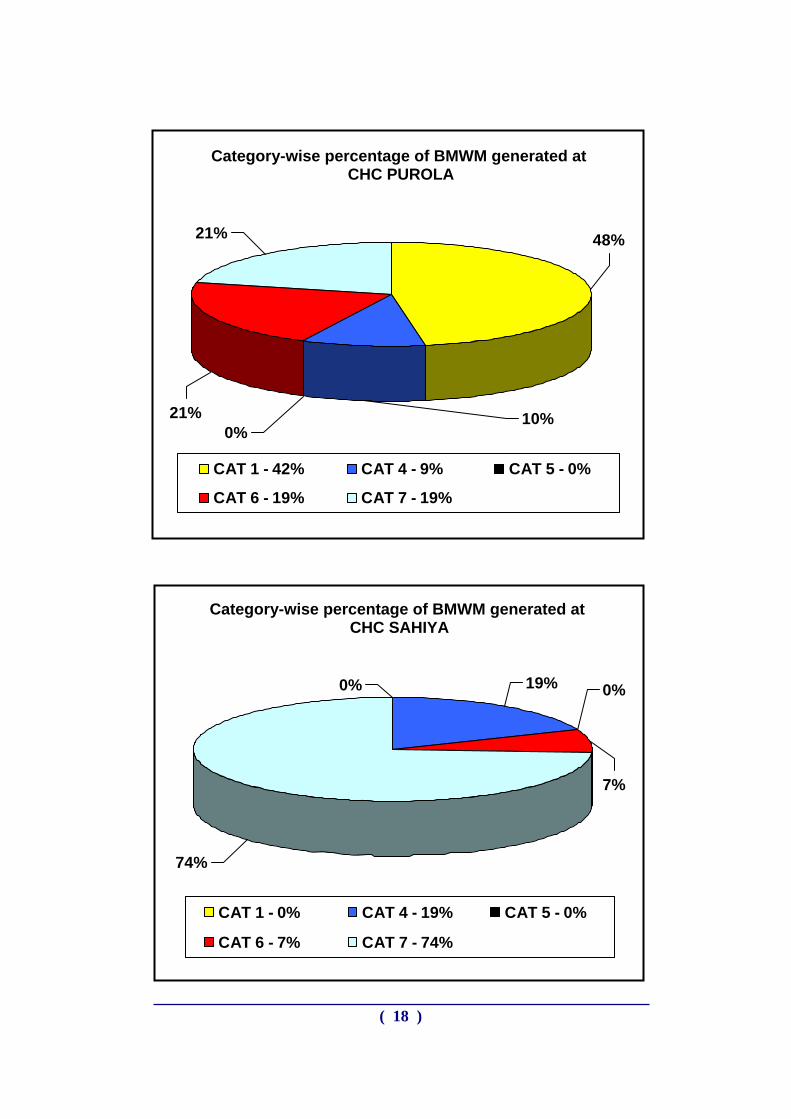
CAT 1 - 42% CAT 4 - 9% CAT 5 - 0%
CAT 6 - 19% CAT 7 - 19%
Category-wise percentage of BMWM generated at CHC PUROLA
Category-wise percentage of BMWM generated at CHC SAHIYA
74%
0%
7%
19%0%
CAT 1 - 0% CAT 4 - 19% CAT 5 - 0%
CAT 6 - 7% CAT 7 - 74%
( 18 )
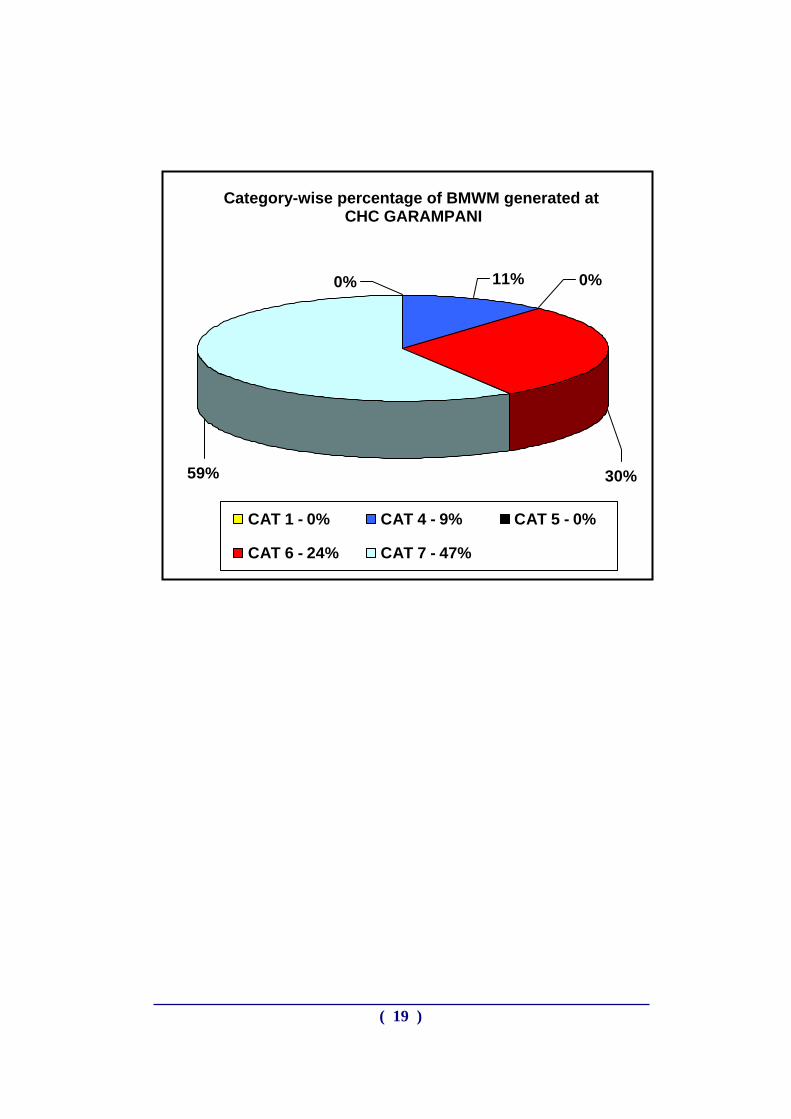
Category-wise percentage of BMWM generated at
CHC GARAMPANI
0%
59% 30%
0%11%
CAT 1 - 0% CAT 4 - 9% CAT 5 - 0%
CAT 6 - 24% CAT 7 - 47%
( 19 )
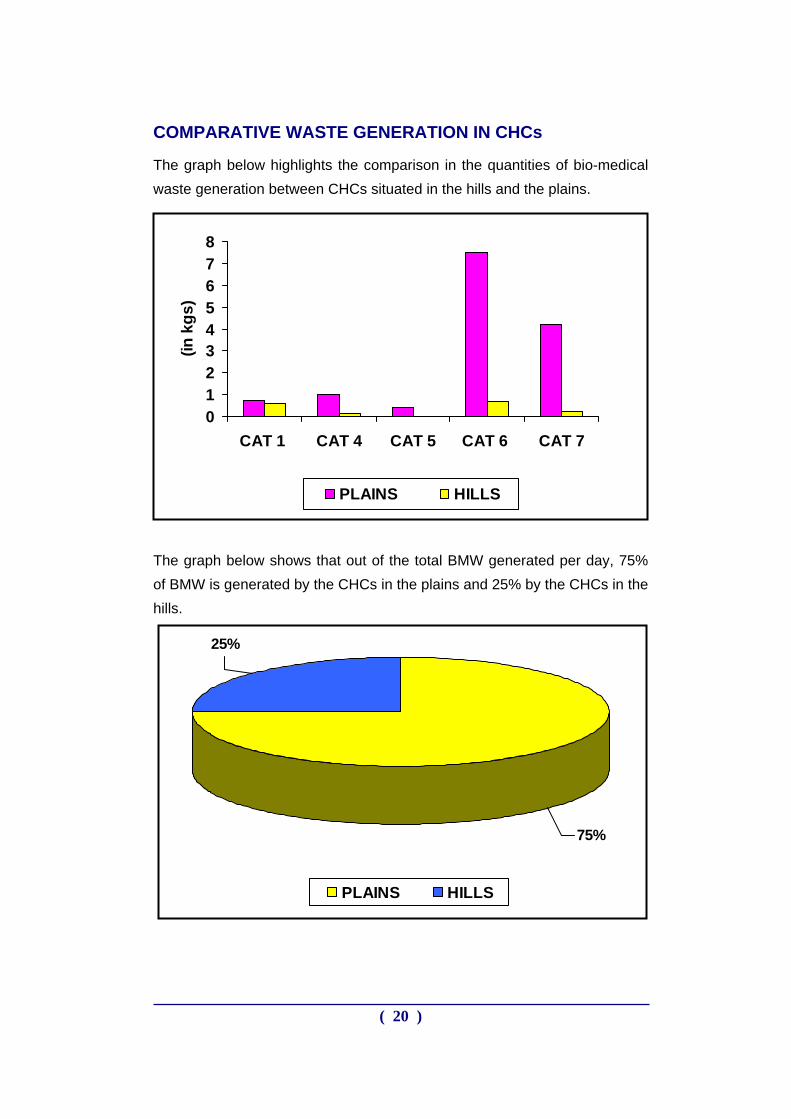
COMPARATIVE WASTE GENERATION IN CHCs
The graph below highlights the comparison in the quantities of bio-medical waste generation between CHCs situated in the hills and the plains.
012345678
CAT 1 CAT 4 CAT 5 CAT 6 CAT 7
(in k
gs)
PLAINS HILLS
The graph below shows that out of the total BMW generated per day, 75% of BMW is generated by the CHCs in the plains and 25% by the CHCs in the hills.
25%
75%
PLAINS HILLS
( 20 )
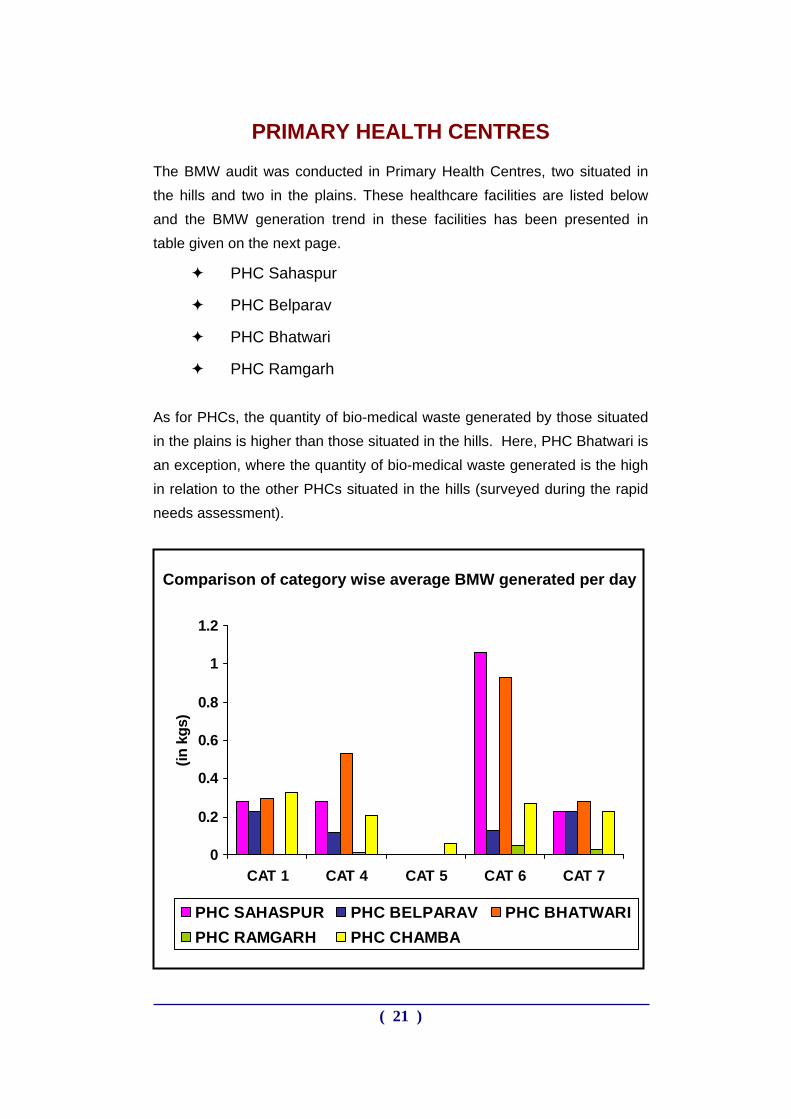
PRIMARY HEALTH CENTRES
The BMW audit was conducted in Primary Health Centres, two situated in the hills and two in the plains. These healthcare facilities are listed below and the BMW generation trend in these facilities has been presented in table given on the next page.
PHC Sahaspur
PHC Belparav
PHC Bhatwari
PHC Ramgarh As for PHCs, the quantity of bio-medical waste generated by those situated in the plains is higher than those situated in the hills. Here, PHC Bhatwari is an exception, where the quantity of bio-medical waste generated is the high in relation to the other PHCs situated in the hills (surveyed during the rapid needs assessment).
0
0.2
0.4
0.6
0.8
1
1.2
CAT 1 CAT 4 CAT 5 CAT 6 CAT 7
(in k
gs)
PHC SAHASPUR PHC BELPARAV PHC BHATWARIPHC RAMGARH PHC CHAMBA
Comparison of category wise average BMW generated per day
( 21 )
BMW generation trend in PHCs
SN Particulars PHC Sahaspur
PHC Belparav
PHC Bhatwari
PHC Chamba
PHC Ramgarh
1 Avg. OPD/ day 288 58 45 35 16
2 BOR - - - - -
3 Avg. Deliveries/ day
0.5 - - - -
4 Avg. Surgeries/ day
- - - - -
Average waste/ day (kg)
Cat 1 0.28 0.23 0.3 0.33 Nil 5
% of cat 1 13% 25% 15% 30% - Cat 3 Nil Nil Nil Nil Nil
6 % of cat 3 - - - - - Cat 4 0.28 0.12 0.53 0.21 0.01
7 % of cat 4 13% 12% 26% 19% 4% Cat 5 Nil Nil Nil 0.06 Nil
8 % of cat 5 - - - 6% - Cat 6 1.06 0.13 0.93 0.27 0.05
9 % of cat 6 47% 36% 46% 24% 58% Cat 7 0.65 0.23 0.28 0.23 0.03
10 % of cat 7 28% 25% 14% 21% 38%
11 Gen Waste 1.8 1.42 0.7 1.30 0.3 Total BMW 2.26 0.91 2.05 1.1 0.086
12 % of BMW 55% 39% 75% 46% 21%
13 % of Gen Waste (kg) 45% 61% 25% 54% 79%
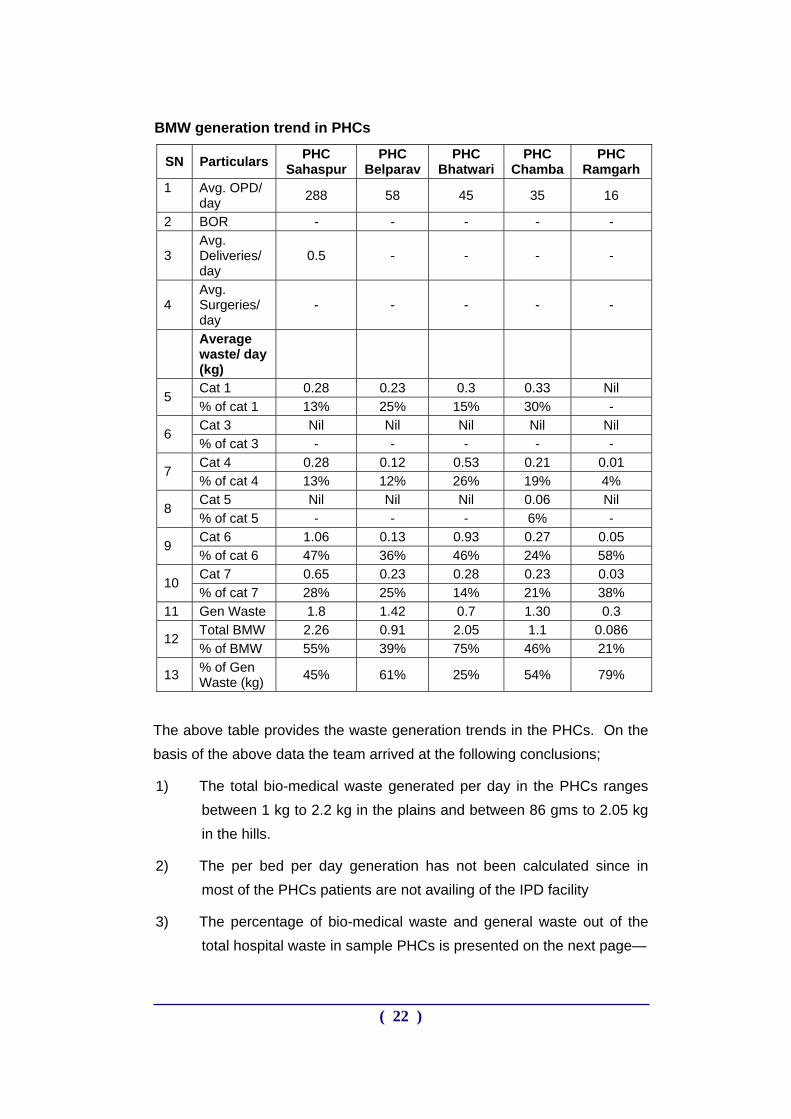
The above table provides the waste generation trends in the PHCs. On the basis of the above data the team arrived at the following conclusions;
1) The total bio-medical waste generated per day in the PHCs ranges between 1 kg to 2.2 kg in the plains and between 86 gms to 2.05 kg in the hills.
2) The per bed per day generation has not been calculated since in most of the PHCs patients are not availing of the IPD facility
3) The percentage of bio-medical waste and general waste out of the total hospital waste in sample PHCs is presented on the next page—
( 22 )
SN Facility % of BMW out of the total waste generated
% of general waste out of the total waste
generated
1. PHC, Sahaspur 55% 45%
2. PHC, Belparav 39% 61%
3. PHC, Bhatwari 75% 25%
4. PHC, Ramgarh 21% 79%
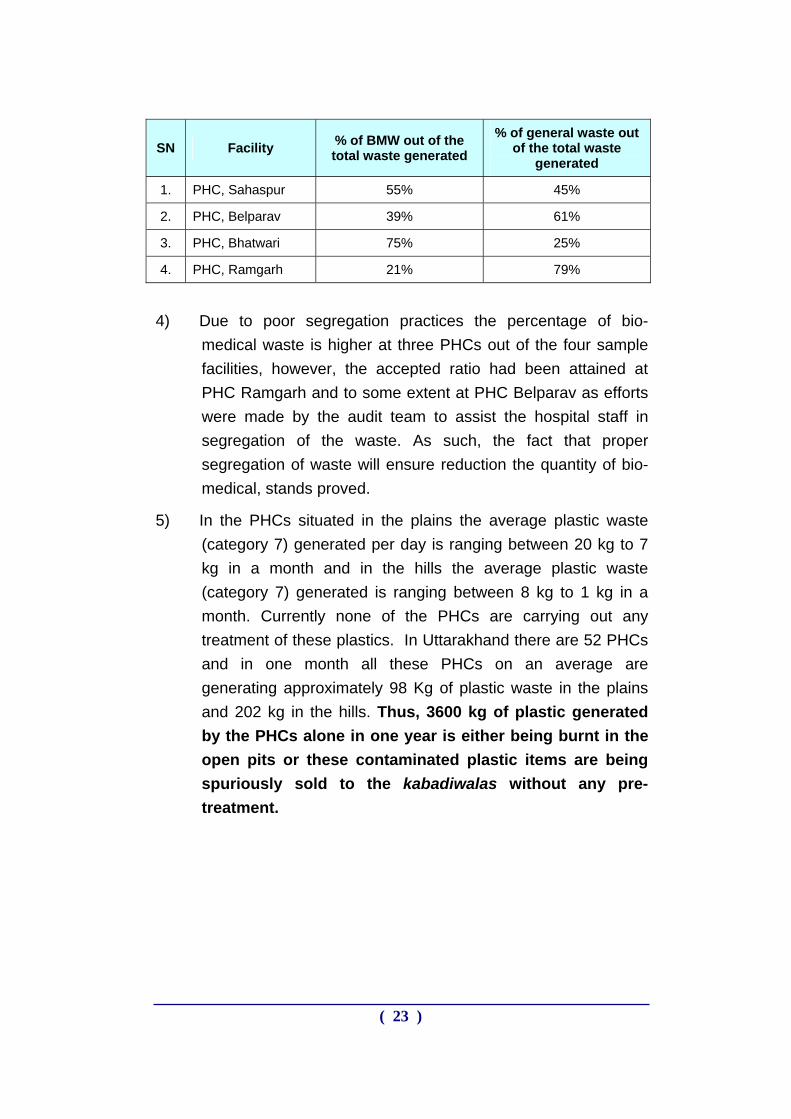
4) Due to poor segregation practices the percentage of bio-
medical waste is higher at three PHCs out of the four sample facilities, however, the accepted ratio had been attained at PHC Ramgarh and to some extent at PHC Belparav as efforts were made by the audit team to assist the hospital staff in segregation of the waste. As such, the fact that proper segregation of waste will ensure reduction the quantity of bio-medical, stands proved.
5) In the PHCs situated in the plains the average plastic waste (category 7) generated per day is ranging between 20 kg to 7 kg in a month and in the hills the average plastic waste (category 7) generated is ranging between 8 kg to 1 kg in a month. Currently none of the PHCs are carrying out any treatment of these plastics. In Uttarakhand there are 52 PHCs and in one month all these PHCs on an average are generating approximately 98 Kg of plastic waste in the plains and 202 kg in the hills. Thus, 3600 kg of plastic generated by the PHCs alone in one year is either being burnt in the open pits or these contaminated plastic items are being spuriously sold to the kabadiwalas without any pre-treatment.
( 23 )
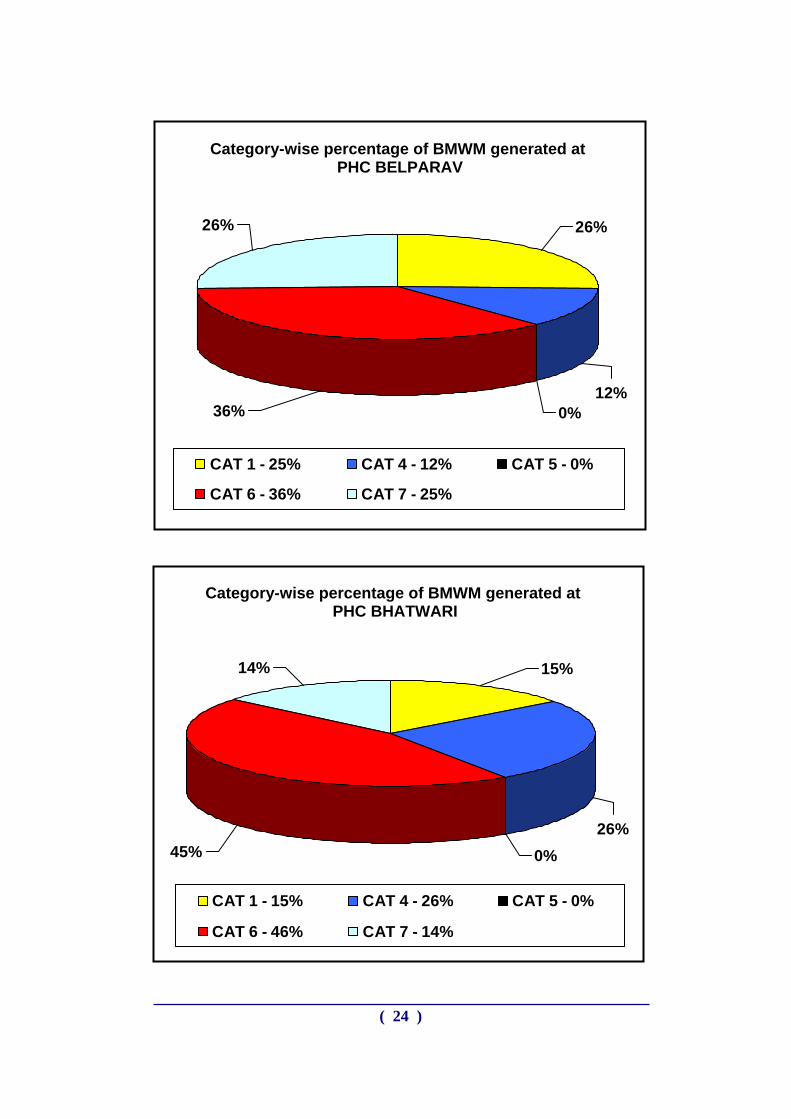
Category-wise percentage of BMWM generated at
PHC BELPARAV
36% 0%12%
26%26
%
CAT 1 - 25% CAT 4 - 12% CAT 5 - 0%
CAT 6 - 36% CAT 7 - 25%
Category-wise percentage of BMWM generated at PHC BHATWARI
14% 15%
26%0%45%
CAT 1 - 15% CAT 4 - 26% CAT 5 - 0%
CAT 6 - 46% CAT 7 - 14%
( 24 )
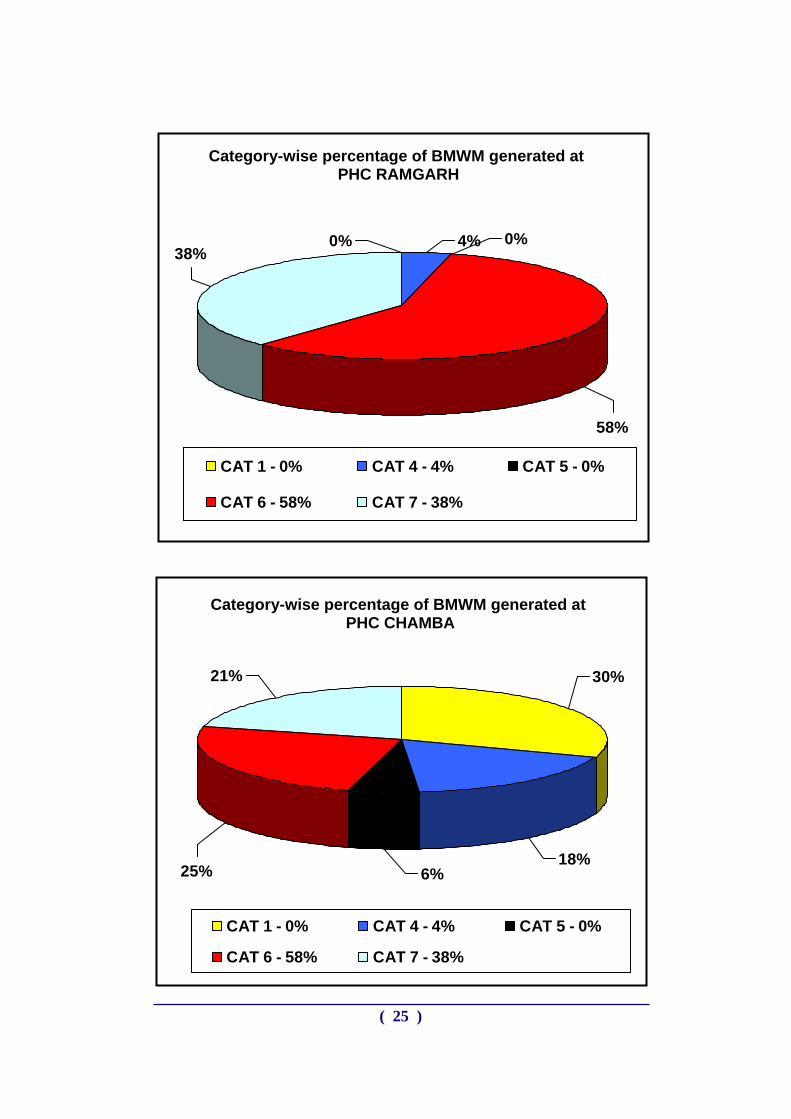
Category-wise percentage of BMWM generated at PHC RAMGARH
( 25 )
58%
38%0% 4% 0%
CAT 1 - 0% CAT 4 - 4% CAT 5 - 0%
C CAT 7 - 38%AT 6 - 58%
6%25%
21% 30%
18%
CAT 1 - 0% CAT 4 - 4% CAT 5 - 0%
CAT 6 - 58% CAT 7 - 38%
Category-wise percentage of BMWM generated at PHC CHAMBA
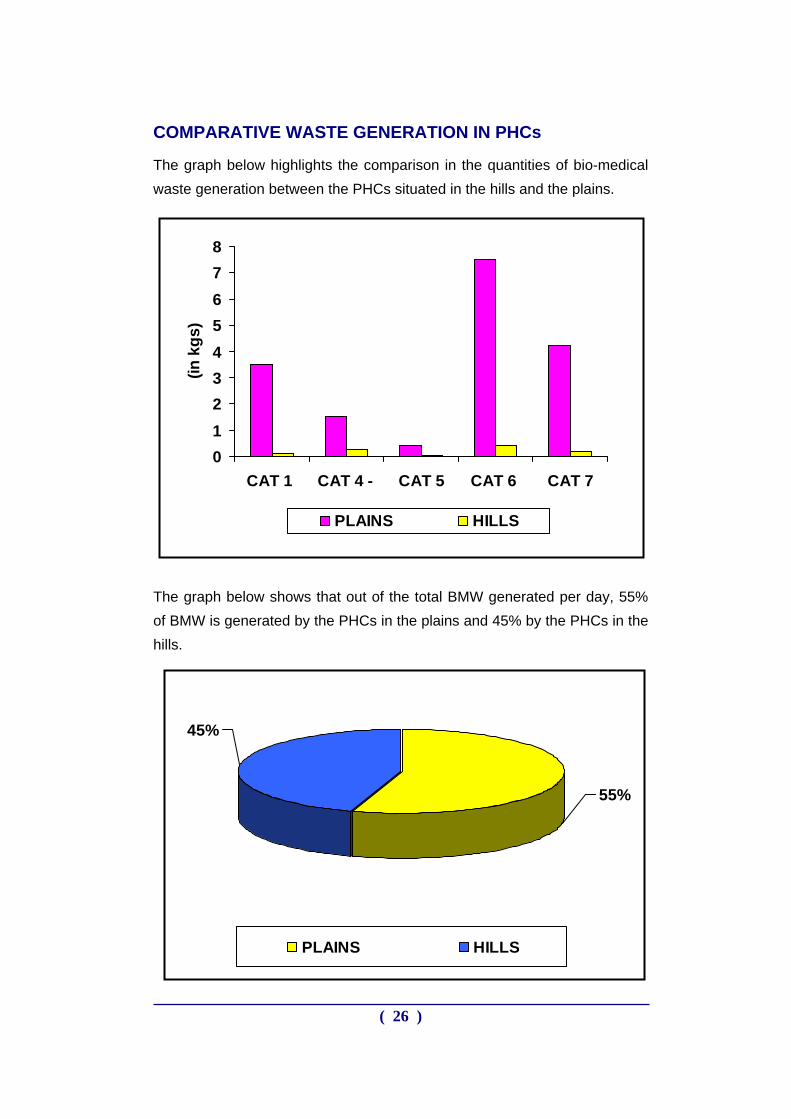
COMPARATIVE WASTE GENERATION IN PHCs
The graph below highlights the comparison in the quantities of bio-medical waste generation between the PHCs situated in the hills and the plains.
012345678
CAT 1 CAT 4 - CAT 5 CAT 6 CAT 7
(in k
gs)
PLAINS HILLS
The graph below shows that out of the total BMW generated per day, 55% of BMW is generated by the PHCs in the plains and 45% by the PHCs in the hills.
45%
55%
PLAINS HILLS
( 26 )
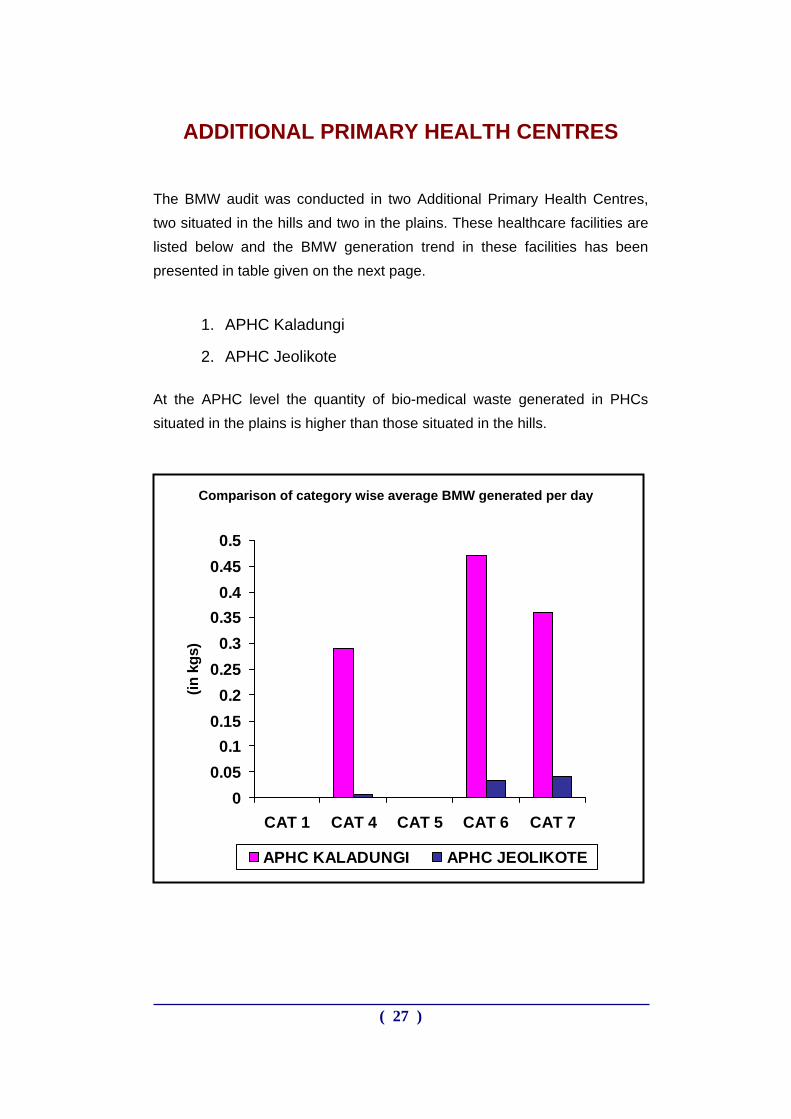
ADDITIONAL PRIMARY HEALTH CENTRES
The BMW audit was conducted in two Additional Primary Health Centres, two situated in the hills and two in the plains. These healthcare facilities are listed below and the BMW generation trend in these facilities has been presented in table given on the next page.
1. APHC Kaladungi
2. APHC Jeolikote
At the APHC level the quantity of bio-medical waste generated in PHCs situated in the plains is higher than those situated in the hills.
00.05
0.10.15
0.20.25
0.30.35
0.40.45
0.5
CAT 1 CAT 4 CAT 5 CAT 6 CAT 7
(in k
gs)
APHC KALADUNGI APHC JEOLIKOTE
Comparison of category wise average BMW generated per day
( 27 )
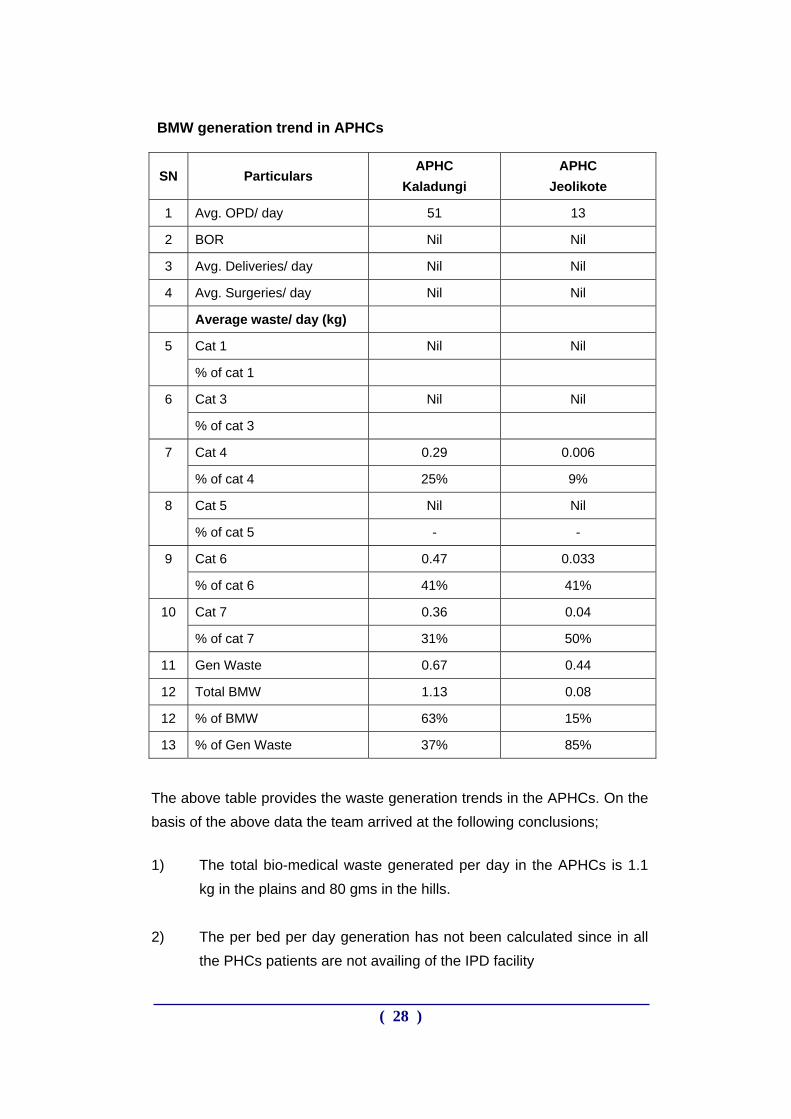
BMW generation trend in APHCs
SN Particulars APHC
Kaladungi APHC
Jeolikote
1 Avg. OPD/ day 51 13
2 BOR Nil Nil
3 Avg. Deliveries/ day Nil Nil
4 Avg. Surgeries/ day Nil Nil
Average waste/ day (kg)
Cat 1 Nil Nil 5
% of cat 1
Cat 3 Nil Nil 6
% of cat 3
Cat 4 0.29 0.006 7
% of cat 4 25% 9%
Cat 5 Nil Nil 8
% of cat 5 - -
Cat 6 0.47 0.033 9
% of cat 6 41% 41%
Cat 7 0.36 0.04 10
% of cat 7 31% 50%
11 Gen Waste 0.67 0.44
12 Total BMW 1.13 0.08
12 % of BMW 63% 15%
13 % of Gen Waste 37% 85%
The above table provides the waste generation trends in the APHCs. On the basis of the above data the team arrived at the following conclusions;
1) The total bio-medical waste generated per day in the APHCs is 1.1 kg in the plains and 80 gms in the hills.
2) The per bed per day generation has not been calculated since in all
the PHCs patients are not availing of the IPD facility
( 28 )
3) The percentage of bio-medical waste out of the total hospital waste
at APHC Kaladungi is 63% and general waste is 37% and percentage of bio-medical waste is 15% and general waste is 85% at APHC Jeolikote.
High per cent of bio-medical waste is due to the OPD attendance and no bed occupancy.
4) In the APHC situated in the plains the average plastic waste
(category 7) generated is 11 kg in a month and in the hills the average plastic waste (category 7) generated is 1 kg in a month. Currently none of the APHCs are carrying out any treatment of these plastic wastes. In Uttarakhand there are 177 APHCs and in one month all these APHCs on an average are generating approximately 770 Kg of plastic waste in the plains and 107 kg in the hills. 10524 kg of plastic waste is generated only by the APHCs in one year is either being burnt in the open pits or these contaminated plastic items are being spuriously sold to the kabadiwalas without any pre-treatment.
( 29 )
0%
30%0%16%
54%
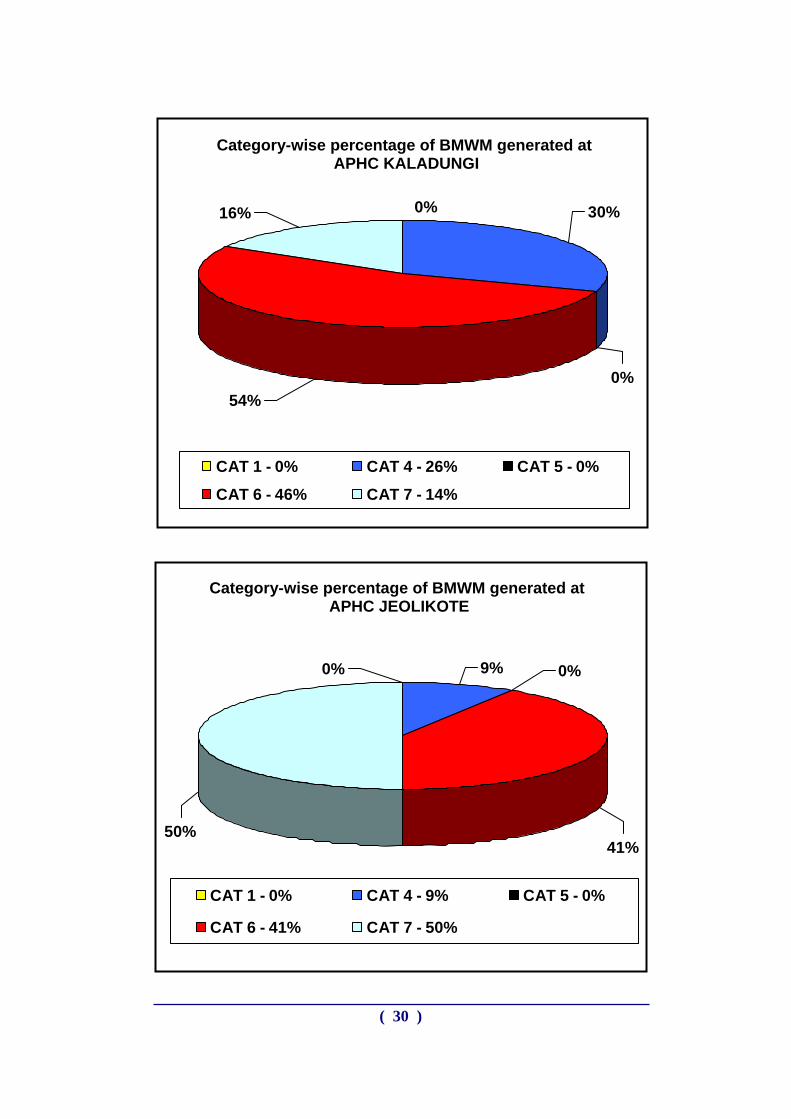
CAT 1 - 0% CAT 4 - 26% CAT 5 - 0%
CAT 6 - 46% CAT 7 - 14%
Category-wise percentage of BMWM generated at APHC KALADUNGI
Category-wise percentage of BMWM generated at APHC JEOLIKOTE
50%
0% 9% 0%
41%
CAT 1 - 0% CAT 4 - 9% CAT 5 - 0%
CAT 6 - 41% CAT 7 - 50%
( 30 )
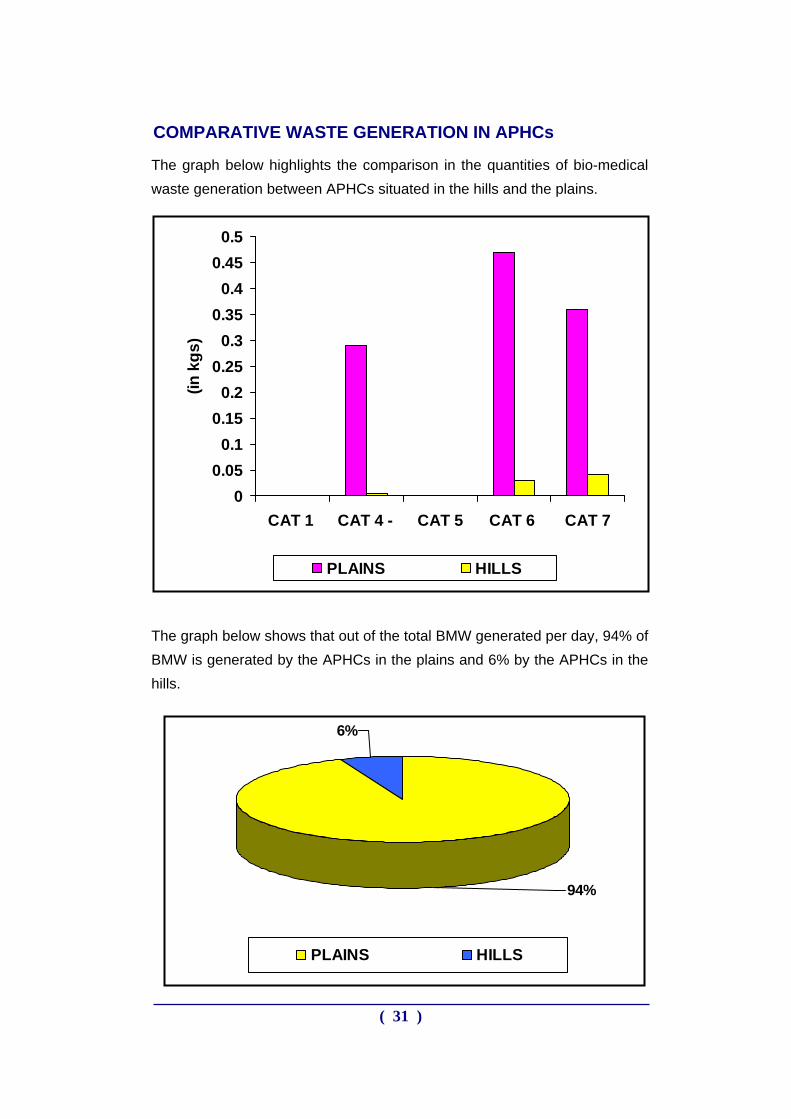
COMPARATIVE WASTE GENERATION IN APHCs
The graph below highlights the comparison in the quantities of bio-medical waste generation between APHCs situated in the hills and the plains.
The graph below shows that out of the total BMW generated per day, 94% of BMW is generated by the APHCs in the plains and 6% by the APHCs in the hills.
00.05
0.10.15
0.20.25
0.30.35
0.40.45
0.5
CAT 1 CAT 4 - CAT 5 CAT 6 CAT 7
(in k
gs)
PLAINS HILLS
6%
94%
PLAINS HILLS
( 31 )
SUB CENTRES AND OUT REACH
The quantification for BMW at Sub-Centres and out reach activities have been calculated on the basis of interviews conducted with ANMs. The outcomes of the interviews are given below :-
The quantification of BMW has been estimated on the basis of syringes, gloves, gauze material, etc. supplied to the Sub-Centers.
Since there is a huge variation in the quantity (such as number of syringes, gloves, gauze material, etc.) of materials supplied to different Sub-Centers, the average has been calculated to maintain uniformity.
The average number of disposable syringes supplied to the Sub-Centers per month is 40. The approximate weight of disposable syringe is 8 gms. and accordingly, the approximate weight of syringes works out to 320gms. (40 x 8 gms.) per Sub-Center.
The average number of gloves supplied to the Sub-Centers per month is 10. The approximate weight of disposable gloves is 8 gms. and accordingly, the approximate weight of disposable gloves works out to 80 gms. (10 x 8 gms.) per Sub-Center.
The average weight of gauze and cotton used by the Sub-Center per month is 300 gms.
Therefore —
It is estimated that the average total BMW generated per month per Sub-Center is approximately 700 gms.
It is estimated that the average plastic component of BMW per month per Sub-Center is approximately 400 gms.
All the aforesaid findings regarding waste generation at various types of HCFs have been made use of in developing the strategy on Infection Control and Bio-Medical Waste Management.
( 32 )
CONCLUSION
The distribution of BMW and General Waste was varying to a great extent. The reasons for variations were many but important ones are —
(i) The PHC and below do not have indoor patients in most of the areas, therefore general waste is recorded less as people normally throw waste out side the building.
(ii) At times half filled bottle of Glucose is thrown, which increases the proportion of BMW.
(iii) In case of CHC Purola, it was noticed that the number of deliveries are too high for a CHC. The numbers are comparable to a District Hospital. It probably owes to its location. (The category 1 forms about 42% & BMW in case of CHC Purola). Further, as informed earlier in remote areas, the general waste is thrown all around and is difficult to capture, that is why the ratios are very odd at times.
(iv) At times cloth pieces are mixed with placenta.
(v) The weight of the placenta was found to be surprisingly is on the higher side at certain places especially in the hills. This is again attributed to poor segregation practices like, cloth pieces, blankets, etc being mixed with placenta and thrown in the yellow bins.
It has come out very clearly during the BMW audit exercise and the rapid assessment that segregation and understanding the need and importance of segregation needs to be imbibed in the minds of the health functionaries from CMO level to the safai karamchari. It is extremely essential that a training plan should be in place and strictly followed.
* * * * *
( 33 )