binder1 - case
TRANSCRIPT
28 CASE 2 STARBUCKS ----------------------------------
Growth of operating margm was primarily due to lower cost of sales as a percentage of related revenues, partially offset by lower income from equity investees. Lower cost of sales was primarily due to a sales mix shift to more profitable products.
Starbucks Corporation, press release, Starbucks Reports First Quarter Fiscal 2009 Results, January 28, 2009.
2 Starbucks Corporation, press release, Starbucks RePOrTS First Quarter Fiscal 2009 Results, January 28, 2009.
3 Starbucks Corporation, press release, Starbucks Reports First Quarter Fiscal 2009 Results, January 28, 2009.
4 This drav.'S upon information from ~Starbuck's Timeline and History, ~ www.starbucks.comlaboutusltimeline.asp. accessed October 6, 2009 and J. Wiggins "When the Coffee Goes Cold," Financial Times, December 13, 2008.
5 J. Wiggins "When the Coffee goes Cold," Financial Times, December 13,2008.
6 Trouble Brews at Starbucb (Ivey School of Management, University of Western Ontario, Case No. 9B09A, 2009).
7 Quoted in: Howard Schultz: Building the Starbllcks Community (Harvard Business School Case No. 9·406· 127,2006).
8 "Starbucks: A Visual Cup 0' Joe," Contempor;lry Design Foundation, www.cdf.nrg/issuejournaVstarbucks_a_ visual_Cllp_ojoc.html, accessed May 15,2009.
9 "Starbucks Instant: Will It Pass The T;lStc Test?" Fortune, February 13, 2007, hnp://money.cnn.com/ 2009!02/ I3!newslcnmpanieslstarbucks _instant. fortune!, acces'ied May 19,2009.
10 J. Wiggins "When the Coffee goes Cold,~ Fhumcial Times, December 13,2008.
,
--';>
-/
~ ~v~/--.!.I..,.:..\ ,.", /17/ I \\
32 CASE 3 U.S. AIRLINE INDUSTRY _____________________________ _
The history of the U.s. airline industry falls into two main phases: the period of regulation up until 1978, and the period of deregulation since then.
The Airlines Under Regulation (Pre-I97S)
The first scheduled airline services began in the 1920s-primarily for carrying mail rather than passengers. By the early 1930s, transcontinental routes were controlled by three airlines: United Airlines in the north, American Airlines in the south, and TWA through the middle. New entry and growing competition (notably from Delta and Continental) led to the threat of instability in the industry, and in 1938 Congress established the Civil Aeronautics Board (CAB) with authority to administer the structure of the industry and competition within it. The CAB awarded interstate routes to the existing 23 airlines, established safety guidelines and priorities, and strict rules for fares, airmail rates, route entry and exit, mergers and acquisitions and interfirm agreements. Fares were set by CAB on the basis of cost plus a reasonable rate of return . The outcome was an ossification of industry structure--despite more than 80 applications, not a single new carrier was approved between 1938 and 1978.
During the 1970s, a major shift occurred in political opinion as increasing support for economic liberalism resulted in demands for less government regulation and greater reliance on market forces. Political arguments for deregulation were supported by new developments in economics. The case for regulation had been based traditionally on arguments about "natural monopoly'" ----competitive markets were impossible in industries where scale economies and network effects were important. During the early 1970s, the theory of contestable markets was developed. The main argument was that industries did not need to be competitively structured in order to result in competitive outcomes. So long as barriers to entry and exit were low then the potential for "hit-and-run" entry would cause established firms to charge competitive prices and earn competitive rates of return. The outcome was the Airline Deregulation Act, which, in October 1978, abolished the CAB and inaugurated a new era of competition in the airline industry.4
The Impact of Deregulation
The abolition of controls over entry, route allocations and fares resulted in a wave of new entrants and an upsurge in price competition. By 1980, 20 new carriersincluding People Express, Air Florida, and Midway-had set up.
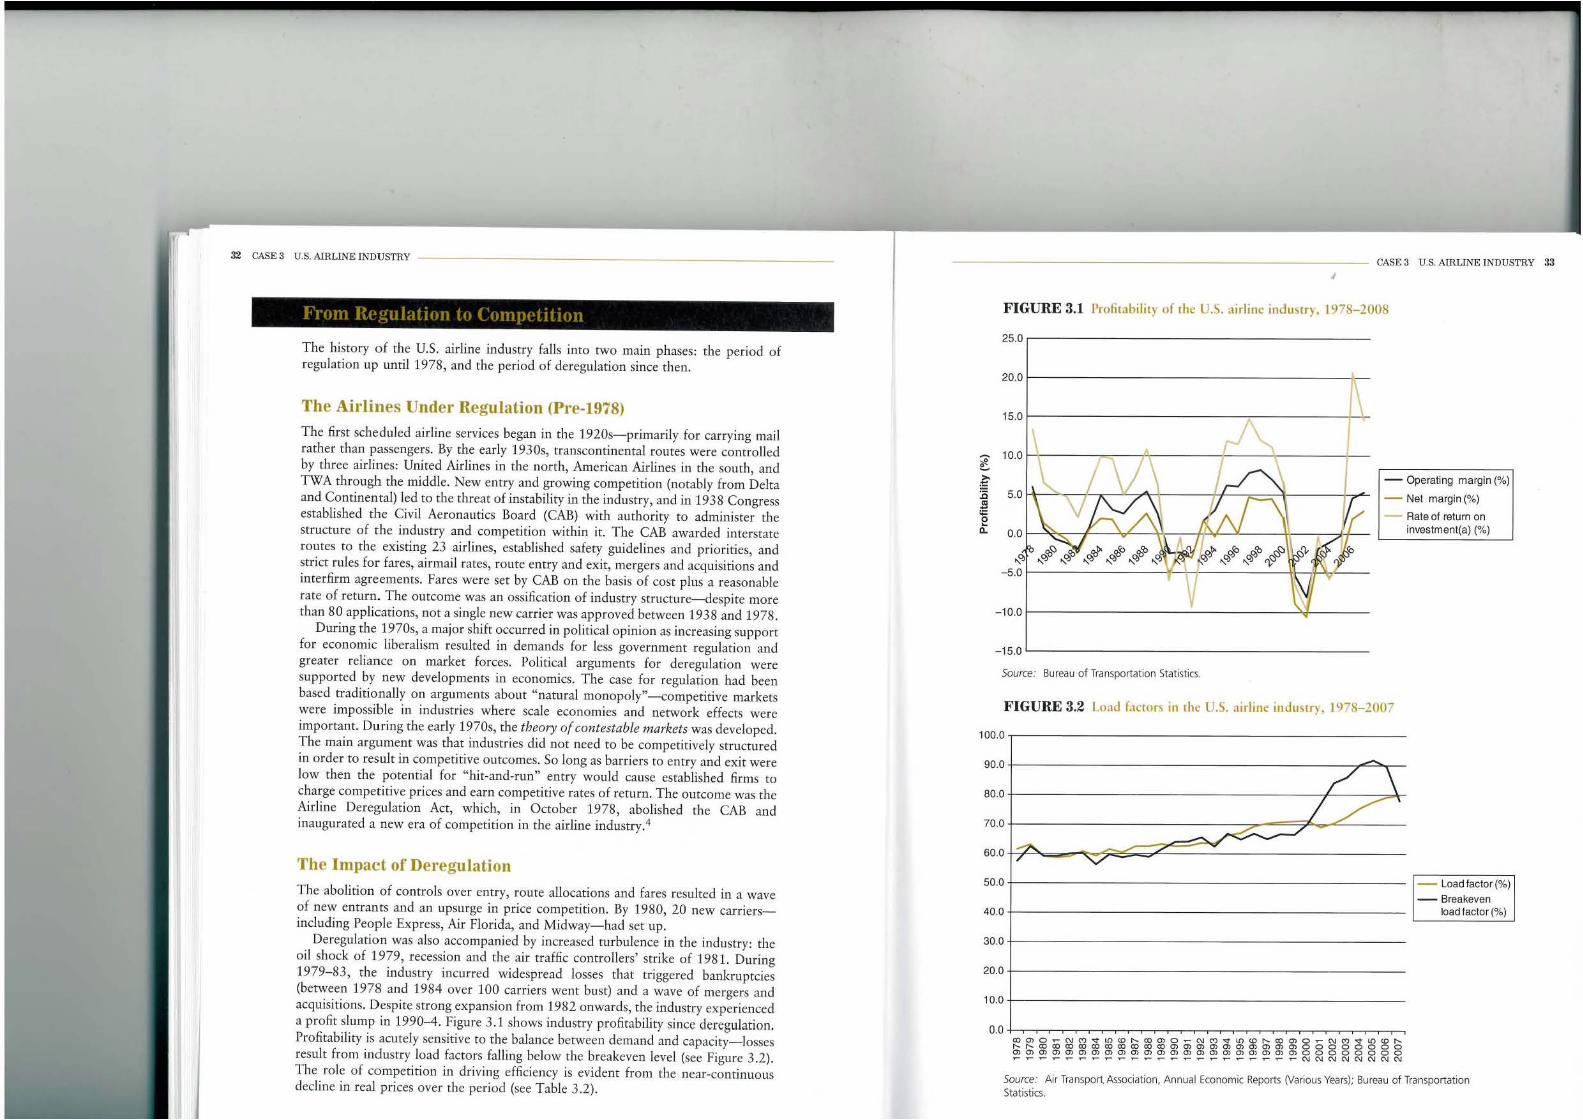
Deregulation was also accompanied by increased turbulence in the industry: the oil shock of 1979, recession and the air traffic controllers' strike of 1981. During 1979-83, the industry incurred widespread losses that triggered bankruptcies (between 1978 and 1984 over 100 carriers went bust) and a wave of mergers and acquisitio ns. Despite strong expansion from 1982 onwards, the industry experienced a profit slump in 1990-4. Figure 3 .1 shows industry profitability since deregulation, Profitability is acutely sensitive to the balance between demand and capacity- losses result from industry load factors falling below the breakeven level (see Figure 3 .2). The role of competition in driving efficiency is evident from the near-continuous decline in real prices over the period (see Table 3.2).
CASE 3 U.S. AIRLINE INDUSTRY 33 I
FIGURE 3.1 Profitability of the U.S. airline ind ustry, 1978- 2008
25.
20.
15.
! 10.
i" ~ 5.
~ ~ o.
-5 ..
- 10.
- 15
l
l
l
A l \
"" IV\ I~
1\ VA!/- :AI '\ l
?>~. RP' ~'O ~ " .~ 0.,c1f 0.,0:1'-0 ';;Jr§' ~ .... OJ .... OJ "OJ "OJ "OJ "OJ ~ , , " l
)
)
Source: Bureau of Transportat ion Stat istics.
~ -
- Operating margin (%)
(,., - Net margin (%)
- Rate of return on investment(a) (%)
WJ(J ~
FIGURE 3.2 Load factor~ in the U.S. airline industry, 1978-2007
100.0
90.0 ,
80.0 , / \ 70.0 , / /
./
60.0 .-?o.. V'
50.0 load faclor (%)
- Breakeven 40.0 load factor (%)
30.
20.
10.
o. _ _ _ • __ . _ . _ L
~~*~*re**~*~*m~~~~~~~~*~§~~~~~~ Source.· Air Transport Association, Annual Economic Reports (Various Years); Bureau of Transportation Statistics.
I
34 CASE3 u.s. AlHLINE INDUSTRY _________ _________ _______ ____ _
TABLE 3.2 The falling price of air travel: revenue per passenger seat mile (cents)
1960 1965 1970 1975 1980 1985 1990 1995 2000
At nominal prices 6.1 6.1 6.0 7.7 11.5 12.2 13.4 13.5 14.6 At constant 20.3 19.4 1 S.4 14.3 14.0 11.3 10.2 8.9 8.5 1984 prices
Source: Bureau of Transporta t ion Statist ics.
Changes in the structure of the airline industry during the 1980s and 19905 were primarily a resuJt of the strategies of the airlines as they sought to adjust to the new conditions of competition in the industry and gain competitive advantage.
Route Stralegies: The Hub-and-Spoke System
During the 1980s the major airlines reorganized their route maps. A system of predominantly point-to-point routes was replaced by one where each airline concentrated its routes on a few major airports linked by frequent services using large aircraft, with smaller, nearby airports connected to these hubs by shorter routes using smaller aircraft. This "hub-and-spoke" system offered two major benefits:
• It allowed greater efficiency through reducing the total number of routes needed to link a finite number of cities within a neh't'ork and concentrating traveler and maintenance facil ities in fewer locations . It permitted the use of larger, more cost-efficient aircraft for interhub travel. The efficiency benefits of rhe hub-and-spoke system were reinforced by scheduling flights so that incoming short-haul arrivals were concentrated at particular times to allow passengers to be pooled for the longer hau l flights on large aircraft.
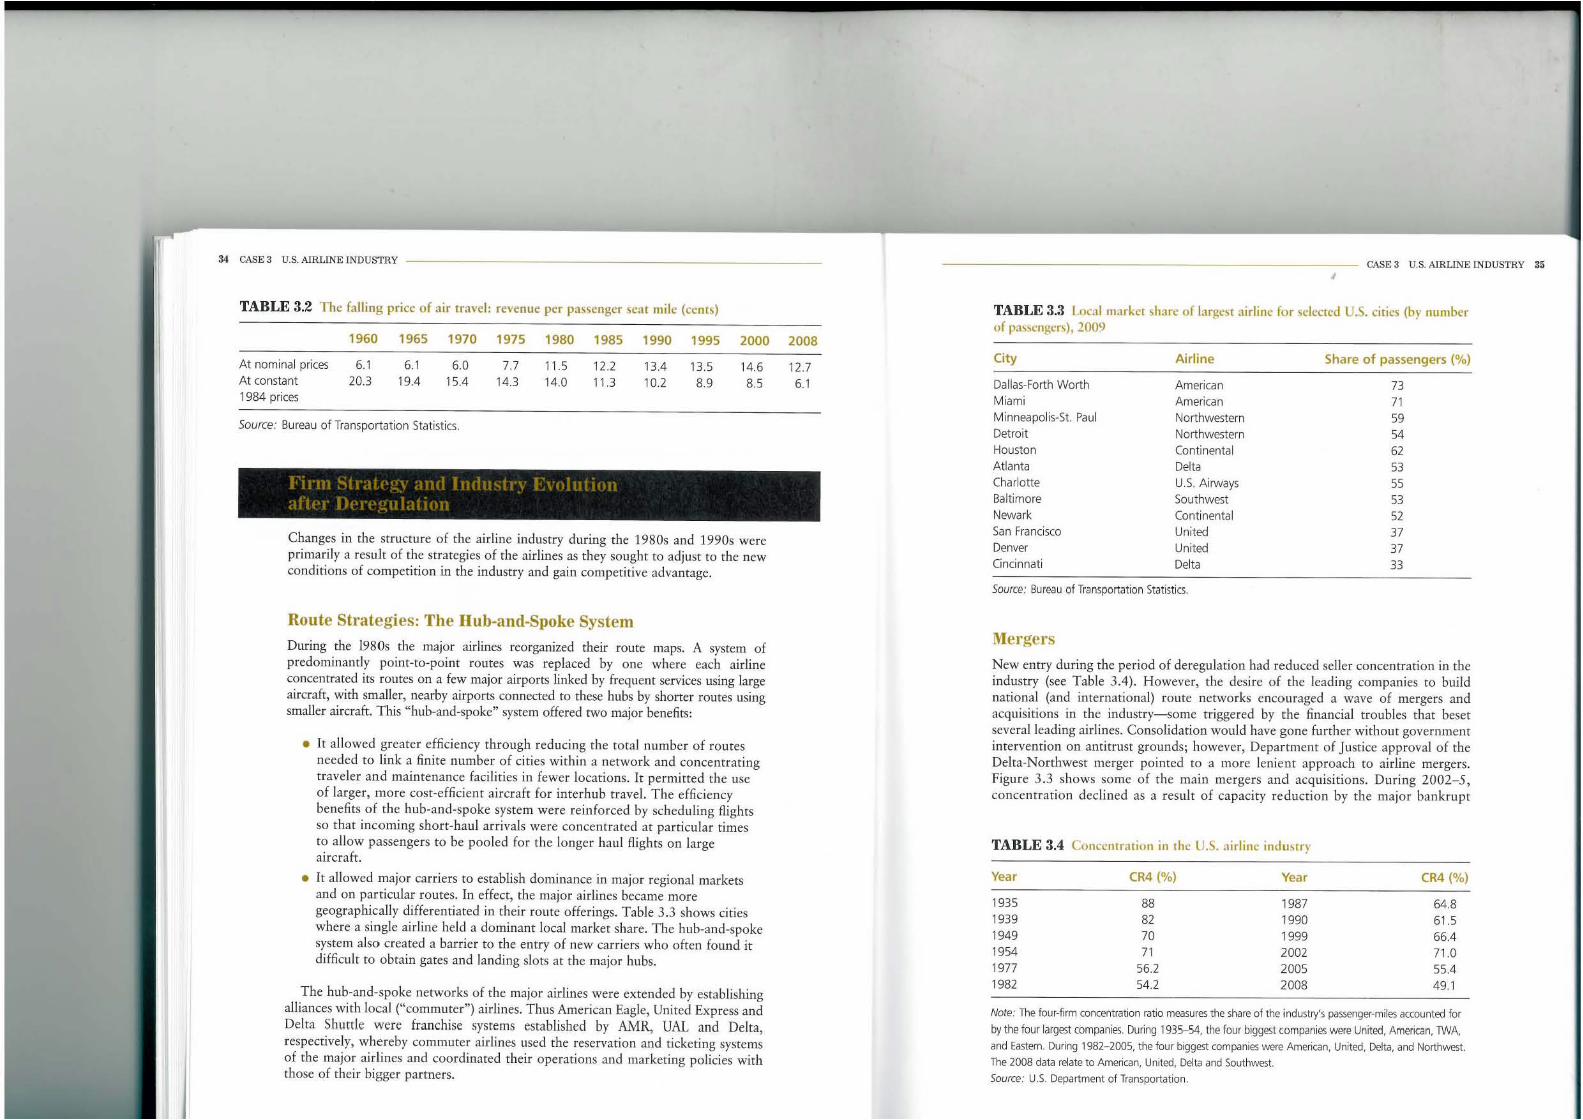
• It allowed major carriers to establish dominance in major regional markets and on particular routes. In effect, the major airlines became more geographically differentiated in their rome offerings. Table 3.3 shows cities where a single airline held a dominant local market share. The hub-and-spoke system also created a barrier to the entry of new carriers who often found it difficult to obtain gates and landing slots at the major hubs.
The hub-and-spoke networks of the major airlines were extended by establishing alliances with local {"commuter"} airli nes. Thus American Eagle, United Express and Delta Shuttle were franchise systems established by AMR, UAL and Delta, respectively, whereby commuter airlines used the reservation and ticketing systems of the major airlines and coordinated their operations and marketing policies with those of their bigger partners.
2008
12.7
6.1
CASE 3 U.S. AlRLINE INDUSTRY 35 I
TABLE 3.3 Local market share of largest airline for ~clected U.S. cities (by number of pa~scngcrs), 2009
City Airline
Dallas-Forth Worth American M iami American M inneapol is·St. Paul Northwestern Detroit Northwestern Houston Continental Atlanta Delta Charlotte U.s. Airways Balt imore Southwest Newark Continental San Francisco United Denver United Cincinnati Delta
Source: Bureau of Transportation Statistics.
Mergers
Share of passengers (%)
73 71 59 54 62 53 55 53 52 37 37 33
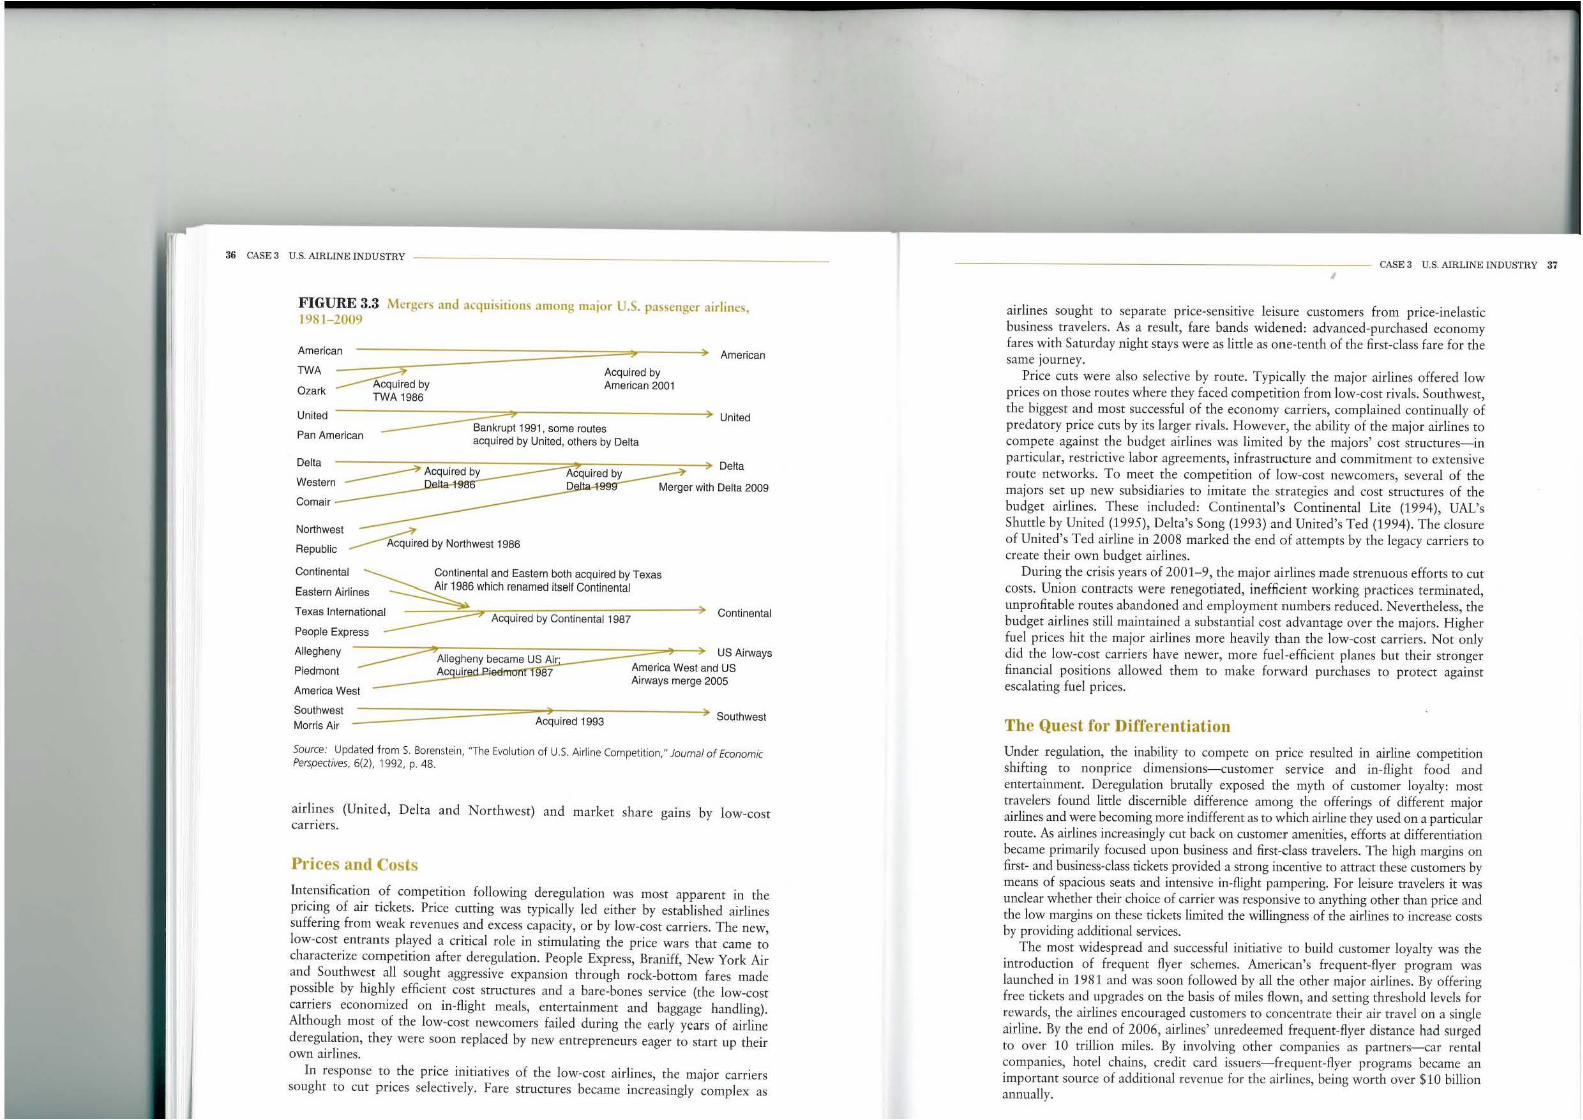
New entry during the period of deregulation had reduced seHer concentration in the industry (see Table 3.4). However, the desire of the leading companies to build national (and international) route networks encouraged a wave of mergers and acquisitions in the industry-some triggered by the financial troubles that beset several leading airlines. Consolidation would have gone further without government intervention on antitrust grounds; however, Department of Justice approval of the Delta-Northwest merger pointed to a more lenient approach to airline mergers. Figure 3.3 shows some of the main mergers and acquisitions. During 2002-5, concentration declined as a result of capacity reduction by the major bankrupt
TABLE 3.4 ConcclHr:nioll in the U.S. airline industry
Year CR4 (%) Year CR4 (%)
1935 88 1987 64.8 1939 82 1990 61.5 1949 70 1999 66.4 1954 71 2002 71.0 1977 56.2 2005 55.4 1982 54.2 2008 49. 1
Note : The four·fi rm concentrat ion ratio measures the share of the industry's passenger-miles accounted for
by the four largest companies. During 1935--54. the four biggest companies were United. American, TWA.
and Eastern. During 1982- 2005, the four biggest companies wcre American, United, Delta, and Northwest. The 2008 data reate to American, United, Delta and Southwest. Source.' U.S. Department of Transportation .
36 CASE 3 U.S. AIRLINE INDUSTRY
FIGURE 3.3 Mergers :lnd acquisilions among major U.S. pa'~cnger airlines, 1981-2009
TWA ~ )0 American
ACQUired by Acquired by TWA 1986 American 2001
American
Ozark
U .~... = ) United nflcu Bankrupt 1991, some routes
Pan American acquired by United, others by Delta
Delta ~Acq~uiredby ~ ------:::;;-;;::=::::;;;:;---=:::==~;;;:;;;;;;;;;;:--=='>-» Delta
wester~~ ~~ Merger with Delta 2009 Comair
Northwest --~
R bl· ____ Acquired by Northwest 1986
epu fC
Continental Continental and Eastern both acquired by Texas
E t A· ... · Air 1986 which renamed itself Continental as em fumes
Texas Internationa~ Acquired by Continental 1987 ) Continental
People Express
Allegheny
Piedmont
America West
Southwest Morris Air
Allegheny became US Air: ACQuir~7
us Airways America West and US Airways merge 2005
, Acquired 1993 ) Southwest
Source: Updated from S. Borenstein, 'The Evolution of U.S. Ai rline Competition,« Joumal of Economic Perspectives. 6(2), 1992. p. 48.
airlines (United, Delta and Northwest) and market share gains by low-cost carriers.
Prices and Costs
Intensification of competition following deregulation was most apparent in the pricing of air tickets. Price cutting was typically led either by established airlines suffering from weak revenues and excess capacity, or by low-cost carriers. The new, low-cost entrants playcd a critical role in stimulating the price wars that came to characterize competition after deregulation. People Express, Braniff, New York Air and Southwest all sought aggressive expansion through rock-bottom fares made possible by highly efficient cost strucrures and a bare-bones service (the low-cost carriers economized on in-flight meals, entertainment and baggage handling). Although most of the low-cost newcomers failed during the early years of airline deregulation, they were soon replaced by new entrepreneurs eager to start up their own airlines.
In response to the price initi:ltives of the low-cost airlines, the major carriers sought to cut prices selectively. Fare structures became increasingly complex as
CASE 3 u.S. AIRLINE INDUSTRY 37 ,
airlines sought to separate price-sensitive leisure customers from price-inelastic business travelers. As a result, fare bands widened : advanced-purchased economy fares with Saturday night stays were as little as one-tenth of the first-class fare for the same journey.
Price cuts were also selective by route. Typically the major airlines offered low prices on those routes where they faced competition from low-cost rivals. Southwest, the biggest and most successful of the economy carriers, complained continually of predatory price cuts by its larger rivals. However, the ability of the major airlines to compete against the budget airlines was limited by the majors' COSt structures-in particular, restrictive labor agreements, infrastructure and commitment to extensive rOute networks. To meet the competition of low-cost newcomers, several of the majors set up new subsidiaries to imitate the strategies and cost structures of the budget airlines. These included: Continental's Continental Lite (1994), UAL's Shuttle by United (1995), Delta's Song (1993) and United's Ted (1994). The closure of United's Ted airline in 2008 marked the end of attempts by the legacy carriers to create their own budget airl ines.
During the crisis years of 2001-9, the major airlines made strenuous efforts to Cut costs. Union conttacts were renegotiated, inefficient working practices terminated, unprofitable routes abandoned and employment numbers reduced. Nevertheless, the budget airlines still maintained a substantia! cost advantage over the majors. Higher fuel prices hit the major airlines more heavily than the low-cost carriers. Not only did the low-cost carriers have newer, more fuel-efficient planes but their stronger financial positions allowed them to make forward purchases to protect against escalating fuel prices.
The Quest for Differentiation
Under regulation, the inability to compete on price resulted in airline competition shifting to non price dimensions-customer service and in-flight food and entertainment. Deregulation brutally exposed the myth of customer loyalty: most travelers found little discernible difference among the offerings of different major airlines and were becoming more indifferent as to which airline they used on a particular route. AJ; airlines increasingly cur back on customer amenities, efforts at differentiation became primarily focused upon business and first-class travelers. The high margins on first- and business-class tickets provided a strong incentive to attract these customers by means of spacious seats and intensive in~flight pampering. For leisure travelers it was unclear whether their choice of carrier was responsive to anything other than price and the low margins on these tickets limited the willingness of the airlines to increase costs by providing additional services.
The most widespread and successful initiative to build customer loyalty was the introduction of frequent flyer schemes. American's frequent-flyer program was launched in 1981 and was soon followed by all the othcr major airlines. By offering free tickets and upgrades on the basis of miles flown, and setting threshold levels for rewards, the airlines encouraged customers to concentrate their air travel on a single airline. By the end of 2006, airlines' unredeemed frequent-flyer distance had surged to over 10 trillion miles. By involving other companies as partners--car rental companies, hotel chains, credit card issuers- frequent-flyer programs became an important source of addition::t1 revenue for the airlines, being worth over $10 billion annu:llly.
38 CASE 3 U.S. AIRLINE INDUSTRY _____________________________ _
The Airlines
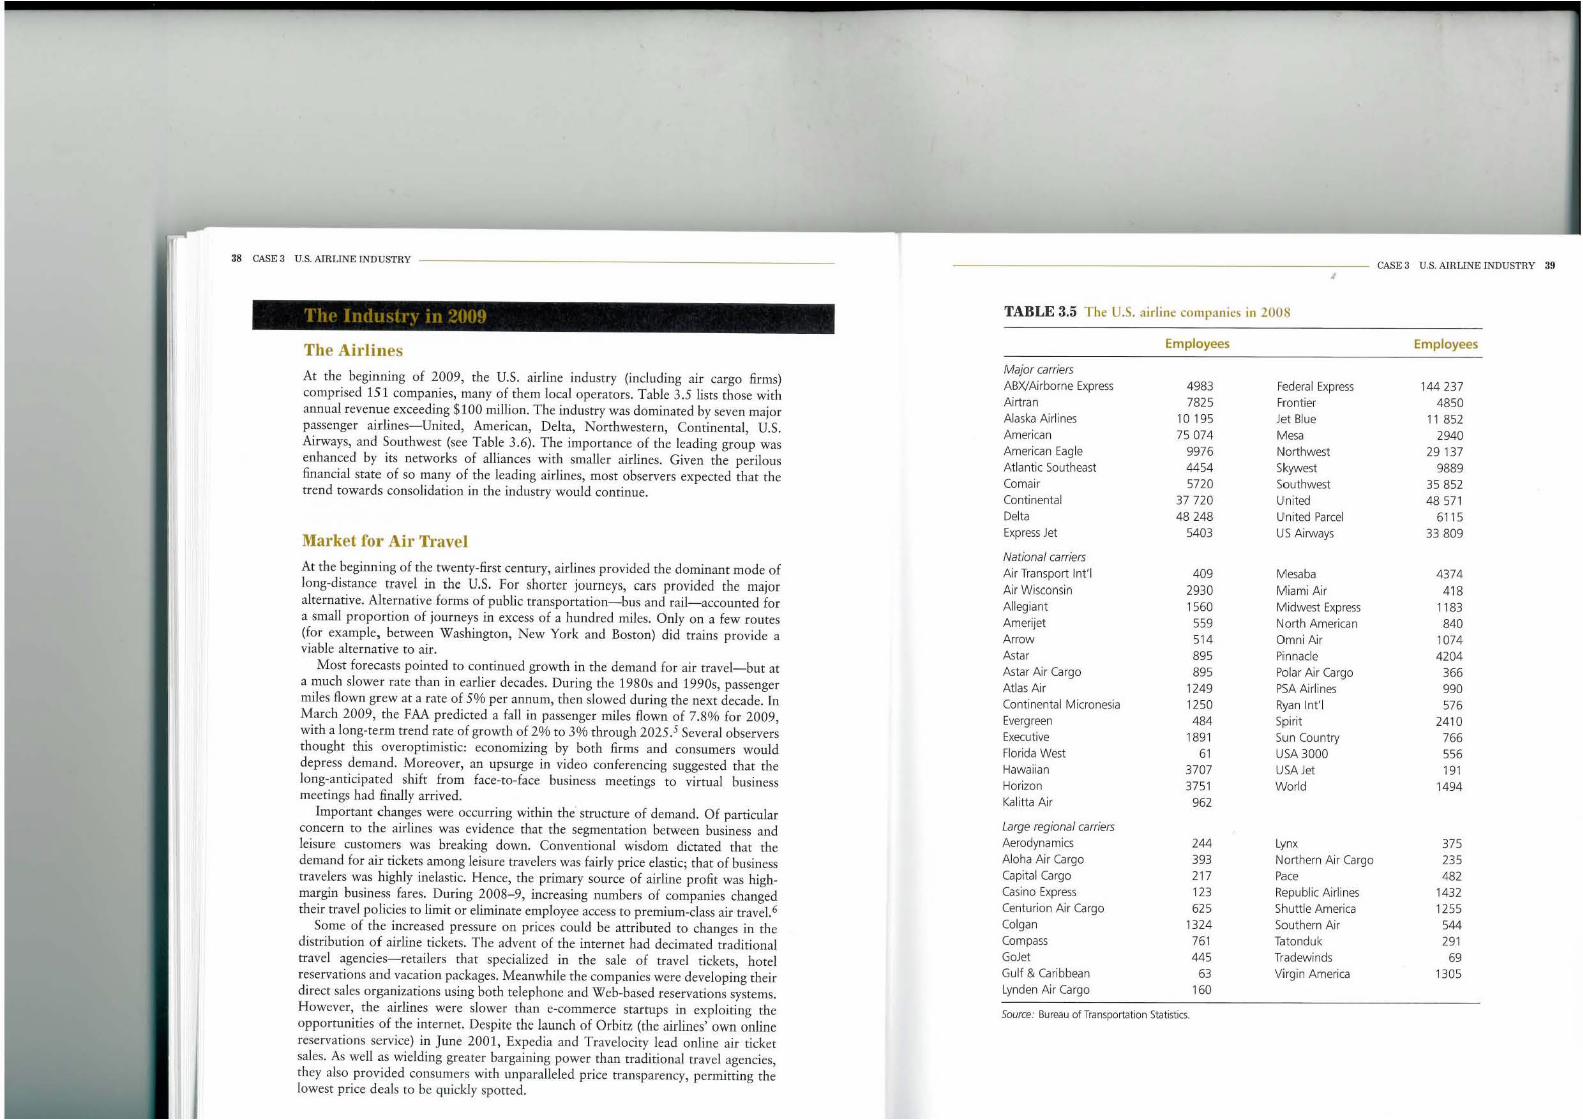
At the beginning of 2009, the U.S. airline industry (including air cargo firms) comprised 151 companies, many of them local operators. Table 3.5 lists those with annual revenue exceeding $100 million . The industry was dominated by seven major passenger airlines-United, American, Delta, Northwestern, Continental, U.S. Airways, and Southwest (see Table 3.6). The importance of the leading group was enhanced by its networks of alliances with smaller airlines. Given the perilous financial state of so many of the leading airlines, most observers expected that the trend towards consolidation in the industry would continue.
Markel for Air Travel
At the beginning of the twenty-first cenrury, airlines provided the dominant mode of long-distance travel in the V.S, For shoner journeys, cars provided the major alternative. Alternative forms of public transportation-bus and rail-accounted for a small proportion of journeys in excess of a hundred miles. Only on a few routes (for example, between Washington, New York and Boston) did trains provide a viable alternative to air.
Most forecasts pointed to continued growth in the demand for air travel-but at a much slower rate than in earlier decades. During the 1980s and 1990s, passenger miles flown grew at a rate of 5% per annum, then slowed during the next decade. In March 2009, the FM predicted a fall in passenger miles flown of 7.8% for 2009, with a long-term trend rate of growth of 2% to 3% through 2025.5 Several observers thought this overoptimistic: economizing by both firms and consumers would depress demand. Moreover, an upsurge in video conferencing suggested that the long-anticipated shift from face-to-face business meetings to virtual business meetings had finally arrived.
Important changes were occurring within the structure of demand. Of particular concern to the airlines was evidence that the segmentation between business and leisure customers was breaking down. Conventional wisdom dictated that the demand for air tickets among leisure travelers was fairly price elastic; that of business travelers was highly inelastic. Hence, the primary source of airline profit was highmargin business fares. During 2008-9, increasing numbers of companies changed their travel policies to limit or eliminate employee access to premium-class air travel.6
Some of the increased pressure on prices could be attributed to changes in the distribution of airline tickets. The advent of the internet had decimated traditional travel agencies-retailers that specialized in the sale of travel tickets, hotel reservations and vacation packages. Meanwhile the companies were developing their direct sales organizations using both telephone and Web-based reservations systems. However, the airlines were slower than e-commerce startups in exploiting the opportunities of the internee Despite the launch of Orbitz (the airlines' own online reservations service) in June 2001, Expedia and Travelocity lead online air ticket sales. As well as wielding greater bargaining power than traditional travel agencies, they also provided consumers with unparalleled price transparency, permitting the lowest price deals to be quickly spotted.
,
TABLE 3.5 T he U.S. airline companies in 2008
Employees
Major carriers ABXlAirborne Express 4983 Airtran 7825 Alaska Ai rl ines 10195 American 75074 American Eagle 9976 Atlantic Southeast 44S4 Comair 5720 Continental 37720 Delta 48248 Express Jet 5403
National carriers Air Transport Int'l 409 Air Wisconsin 2930 Allegiant 1560 Amerijet 559 Arrow 514 Astar 895 Astar Air Cargo 895 Atlas Air 1249 Conti nental Micronesia 1250 Evergreen 484 Executive 1891 Florida West 61 Hawaiian 3707 Horizon 3751 Kal itta Air 962
Large regional carriers Aerodynamics 244 Aloha Air Cargo 393 Capital Cargo 217 Casino Express 123 Centurion Air Cargo 625 Colgan 1324 Compass 761 GoJet 445 Gulf & Caribbean 63 Lynden Air Cargo 160
Source: Bureau of Transportation Statistics.
Federal Express Frontier Jet Blue Mesa Northwest Skywest Southwest Un ited United Parcel US Airways
Mesaba Miami Air Midwest Express North American Omni Air Pinnacle Pola r Air Cargo PSA Airl ines Ryan Int' l Spirit Sun Country
USA 3000 USA Jet
World
Lynx Northern Air Cargo Pace Republic Airli nes Shuttle America Southern Air Tatonduk Tradewinds Virgin America
CASE 3 U.S. AIHLlNE INDUSTRY 39
Employees
144 237 4850
11 852 2940
29137 9889
35852 48 571
6115 33809
4374 418
1183 840
1074 4204
366 990 576
2410 766 556 191
1494
375 235 482
1432 1255 544 291 69
1305
30 CASE 3 U.S. AIRLINE INDUSTRY
The year 2009 marked a cenrury of passenger air travel. On November 19, 1909, Deutsche Luftschiffahrt AG had been formed to fly passengers by Zeppelin airships between Berlin, Potsdam and Dusseldorf.] The centenary passed without commemoration or celebration in the U.S. airline industry. Most airline executives were too busy struggling to remain solvent in the face of the worst economic downturn since the 1930s.
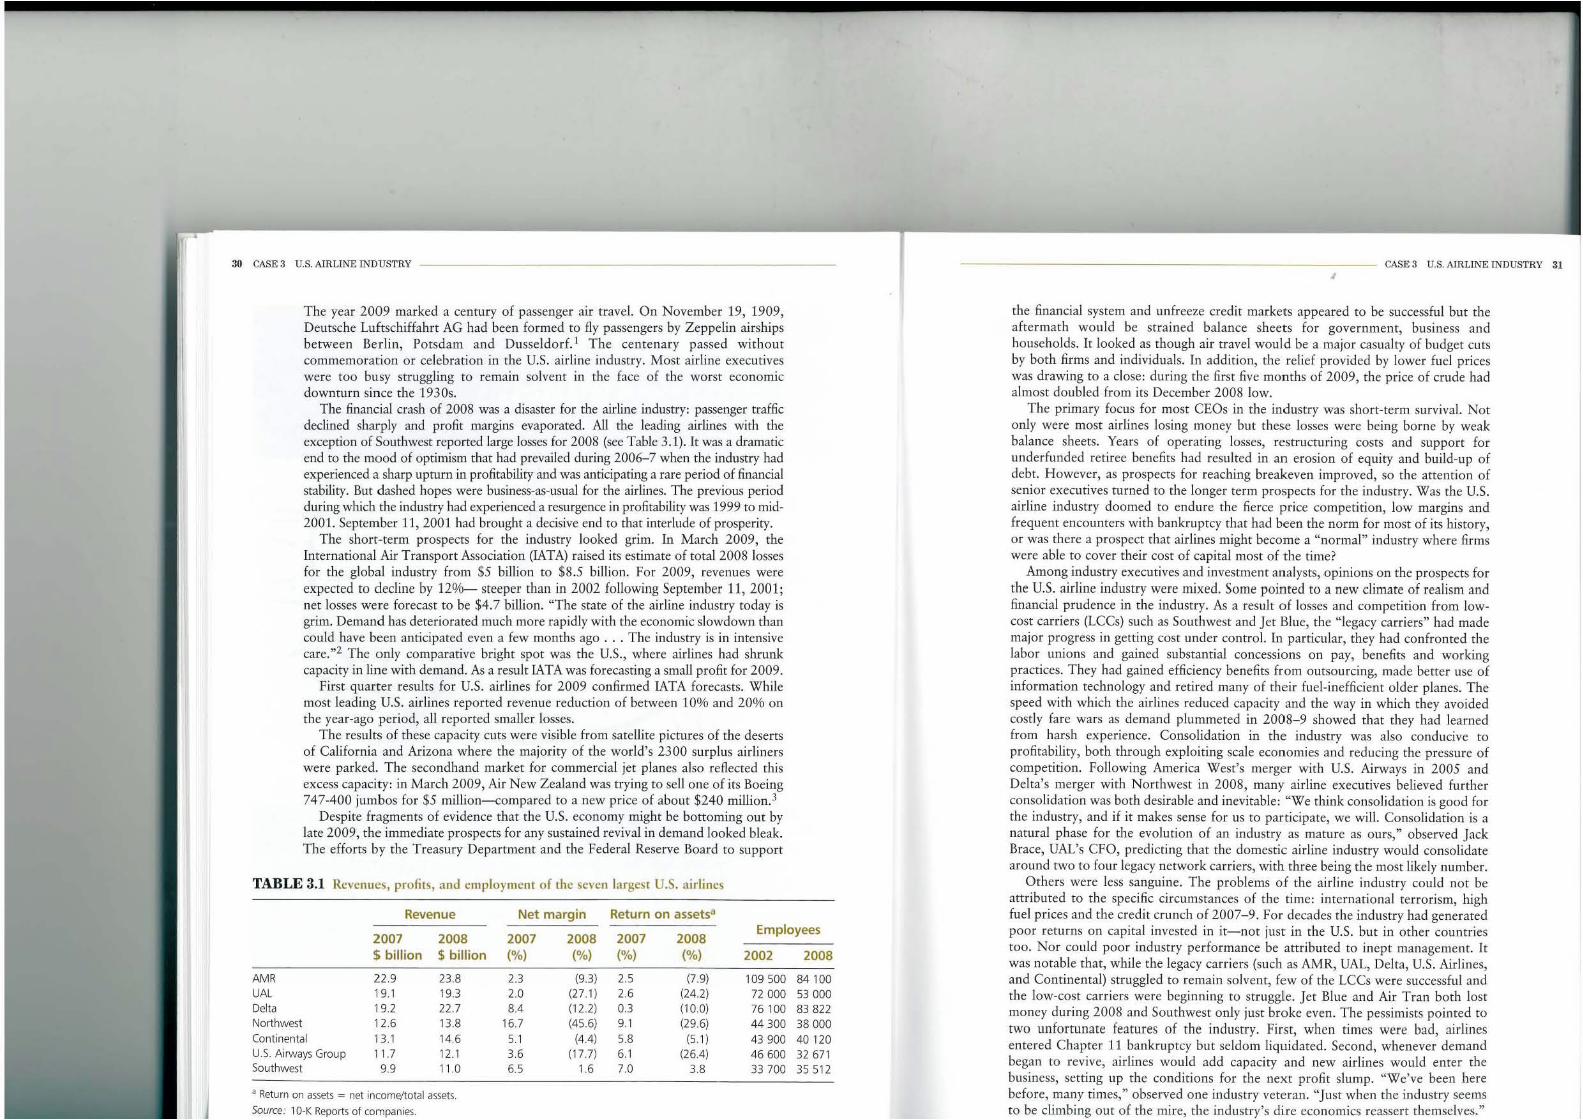
The financial crash of 200S was a disaster for the airline industry: passenger traffic declined sharply and profit margins evaporated. All the leading airlines with the exception of Southwest reported large losses for 2008 (see Table 3.1). It was a dramatic end to the mood of optimism that had prevailed during 2006-7 when the industry had experienced a sharp uprum in profitability and was anticipating a rare period of financial stability. But dashed hopes were business-as-usual for the airlines. The previous period during which the industry had experienced a resutgence in profitability was 1999 to mid-2001. September 11,2001 had brought a decisive end to that interlude of prosperity.
The short-term prospects for the industry looked grim. In March 2009, the International Air Transport Association (lATA) raised its estimate of total 2008 losses for the global industry from $5 billion to $S.5 billion. For 2009, revenues were expected to decline by 129il- steeper than in 2002 following September 11, 2001; net losses were forecast to be $4.7 billion. "The state of the airline industry today is grim. Demand has deteriorated much mote rapidly with the economic slowdown than could have been anticipated even a few months ago ... The industry is in intensive care.,,2 The only compatative bright spot was the U.S., where airlines had shrunk capacity in line with demand. As a result lATA was forecasting a small profit for 2009.
First quarter results for U.S. airlines for 2009 confirmed lATA forecasts. While most leading U.S. airlines reported revenue reduction of between 10% and 20% on the year-ago period, all reponed smaller losses.
The results of these capacity cuts were visible from satellite pictures of the deserts of California and Arizona where the majority of the world's 2300 surplus airliners were parked. The secondhand market for commercial jet planes also reflected this excess capacity: in March 2009, Air New Zealand was trying to sell one of its Boeing 747-400 jumbos for $5 mil1ion--compared to a new price of about $240 million.J
Despite fragments of evidence that the U.S. economy might be bottoming out by late 2009, the immediate prospects for any sustained revival in demand looked bleak. The efforts by the Treasury Department and the Federal Reserve Board to support
TABLE 3.1 Revenues , profits, and employmcnr of the seven largest U.S. airlines
Revenue Net margin Return on assets"
2007 2008 2007 2008 2007 2008 Employees
S billion $ billion (%) (%) (%) (%) 2002 2008
AMR 22 .9 23.8 2.3 (93) 2.5 (79) 109500 84100 UAl 19.1 19.3 2.0 (27.1) 2.6 (24.2) 72 000 53000 Delta 19.2 22.7 8.4 (1 2.2) 03 (100) 76 100 83822 Northwest 12.6 13.8 16.7 (45.6) 9.1 (29.6) 44300 38000 Continental 13.1 14 .6 5.1 (4.4) 5.8 (5.1 ) 43900 40120 U.S. Airways Group 11.7 12 .1 3.6 (17.7) 6.1 (26.4) 46600 32671 Southwest 9.9 11.0 6.5 1.6 7.0 3.8 33700 35 512
d Return on assets = net incomeltotal assets. Source: 10-K Reports of companies.
CASJo: 3 U.S. AIRLINE INDUSTRY 31 I
the financial system and unfreeze credit markets appeared to be successful but the aftermath would be strained balance sheets for government, business and households. It looked as though air travel would be a major casualty of budget cuts by both firms and individuals. In addition, the relief provided by lower fuel prices was drawing to a close: during the first five months of 2009, the price of crude had almost doubled from its December 200S low.
The primary focus for most CEOs in the industry was short-term survival. Not only were most airlines losing money but these losses were being borne by weak balance sheets. Years of operating losses, restructuring costs and support for underfunded retiree benefits had resulted in an erosion of equity and build-up of debt. However, as prospects for reaching breakeven improved, so the attention of senior executives turned to the longer term prospects for the industry. Was the U.S. airline industry doomed to endure the fierce price competition, low margins and frequent encounters with bankruptcy that had been the norm for most of its history, or was there a prospect that airlines might become a "normal" industry where firms were able to cover their cost of capital most of the time?
Among industry executives and investment analysts, (Jpinions on the prospects for the U.S. airline industry were mixed. Some pointed to a new climate of realism and financial prudence in the industry. As a result of losses and competition from lowcost carriers (LCCs) such as Southwest and Jet Blue, the "legacy carriersn had made major progress in getting cost under control. In particular, they had confronted the labor unions and gained substantial concessions on pay, benefits and working practices. They had gained efficiency benefits from outsourcing, made better use of information technology and retired many of their fuel-inefficient older planes. The speed with which the airlines reduced capacity and the way in which they avoided costly fare wars as demand plummeted in 2008-9 showed that they had learned from harsh experience. Consolidation in the industry was also conducive to profitability, both through exploiting scale economies and reducing the pressure of competition. Following America West's merger with U.S. Airways in 2005 and Delta's merger with Northwest in 2008, many airline executives believed further consolidation was both desirable and inevitable: "We think consolidation is good for the industry, and if it makes sense for us to participate, we will. Consolidation is a natural phase for the evolution of an industry as mature as ours," observed Jack Brace, UAL's CFO, predicting that the domestic airline industry would consolidate around twO to four legacy network carriers, with three being the most likely number.
Others were less sangui ne. The problems of the airline industry could not be attributed to the specific circumstances of the time: international terrorism, high fuel prices and the credit crunch of 2007-9. For decades the industry had generated poor returns on capital invested in it-not just in the U.S. but in other countries too. Nor could poor industry performance be attributed to inept management. It was notable that, while the legacy carriers (such as AMR, UAL, Delta, U.S. Airlines, and Continental) struggled to remain solvent, few of the Lces were successful and the low-cost carriers were beginning to struggle. Jet Blue and Air Tran both lost money during 2008 and Southwest only just broke even. The pessimists pointed to two unfortunate features of the industry. First, when times were bad, airlines entered Chapter 1] bankruptcy but seldom liquidated. Second, whenever demand began to revive, airlines would add capacity and new airlines would enter the business, setting LIp the conditions for the next profit slump. "We've been here before, many times, " observed one industry veteran. "Just when the industry seems to be climbing our of the mire, the industry's dire economics reassert themselves."
40 CAS},; 3 U.S. AIRLINE INDUSTRV
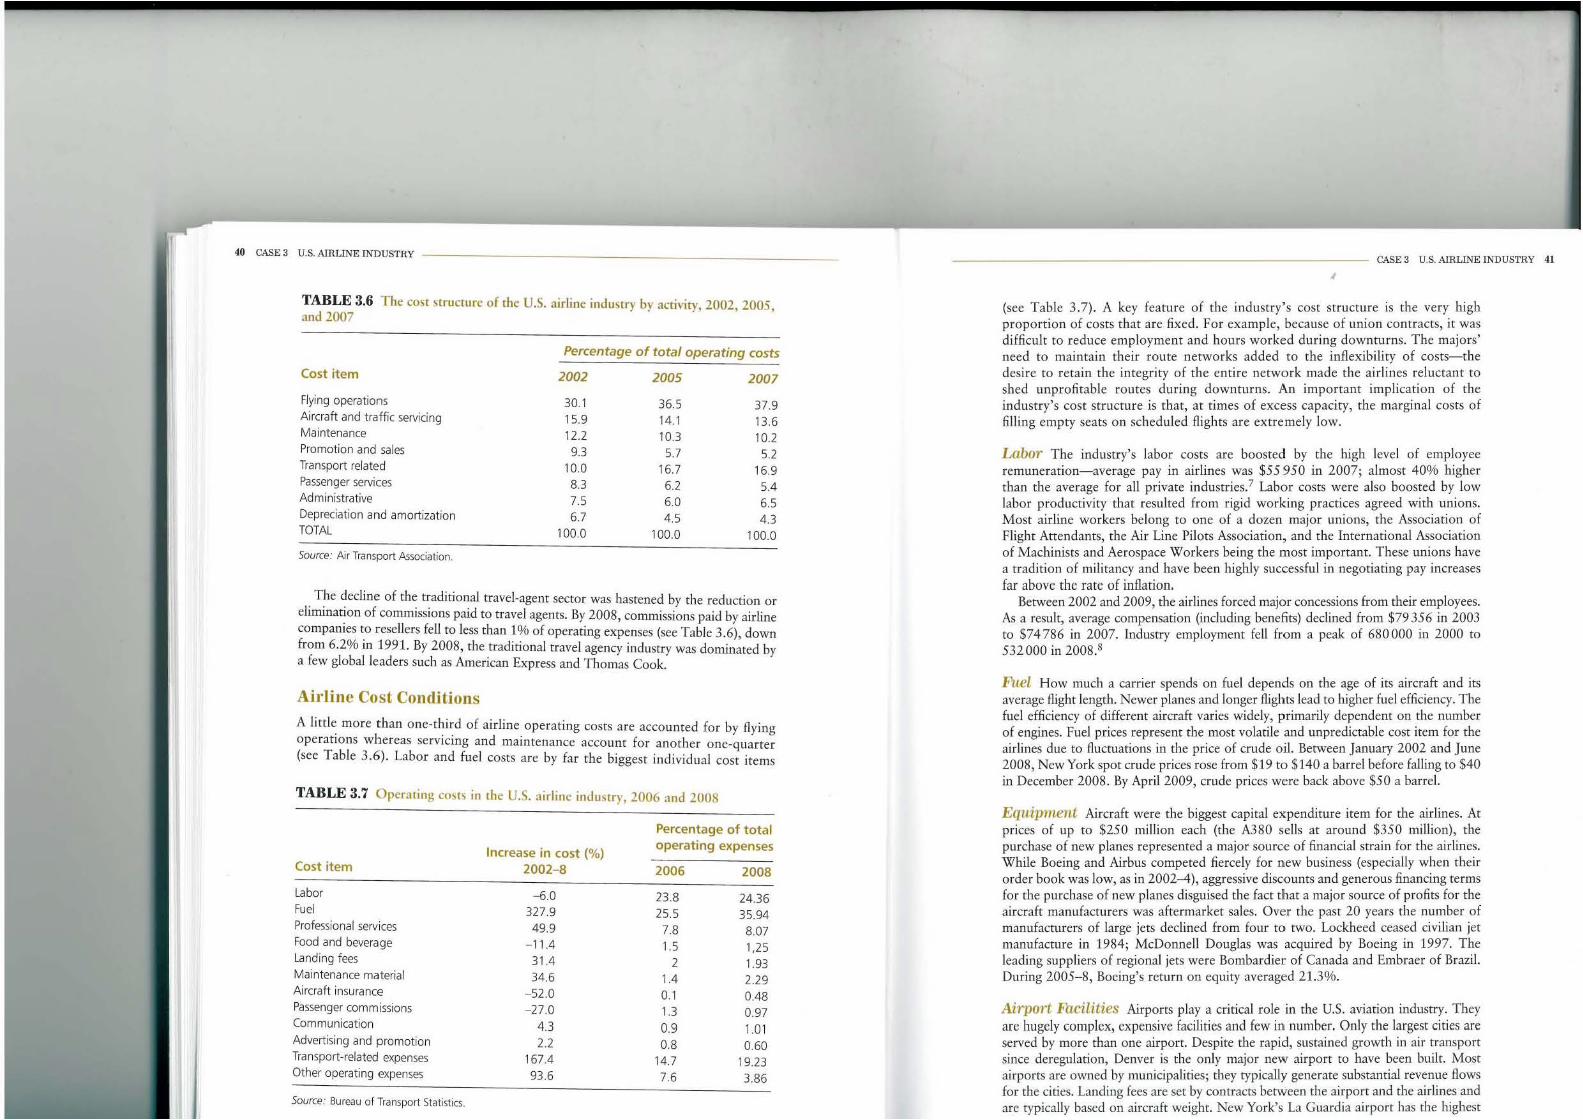
TABLE 3.6 The cost structure of the U.S. airline industry by activity, 2002, 2005, and 2007
Percentage of total operating costs
Cost item 2002 2005 2007
Flying operations 30.1 36.5 37.9 Aircraft and traffic servicing 15.9 14.1 13.6 Maintenance 12.2 10.3 10.2 Promotion and sales 9.3 5.7 52 Transport related 10.0 16.7 16.9 Passenger services 8.3 6.2 54 Admin istrative 75 6.0 65 Depreciation and amortization 6.7 45 43 TOTAL 100.0 100.0 100.0
Source. Air Transport Association.
The decline of the traditional travel-agent sector was hastened by the reduction or elimination of commissions paid to travel agents. By 2008, commissions paid by airline companies to rescUers fell to less chan 1 % of operating expenses (sec Table 3 .6), down from 6.2% in 1991. By 2008, the traditional travel agency industry was dominated by a few global leaders such as American Express and Thomas Cook.
Airline Cost Conditions
A little more than one-third of airline operating costs are accounted for by flying operations whereas servicing and maintenance account for another one-quatter (see Table 3.6). Labor and fuel costs are by far the biggest individual cost items
TABLE 3.7 O perating cost~ in the U.S. airline j ndll~try, 2006 and 200S
Percentage of tota l
Increase in cost (%) operating expenses
Cost item 2002-8 2006 2008
Labor - 6.0 23.8 24 .36 Fuel 327.9 25.5 35.94 Professional serv ices 49.9 7.8 8.07 Food and beverage - 11.4 15 1,25 Landing fees 31.4 2 1.93 Maintenance material 34.6 14 2.29 Aircraft insurance -52.0 0.1 0.48 Passenger commissions - 27.0 1.3 0.97 Communication 43 0.9 1.01 Advert ising and promotion 2.2 08 0.60 Transport-related expenses 167.4 14.7 19.23 Other operating expenses 93.6 7.6 3.86
Source: Bureau of Transport Statistics.
CAS" 3 U.S. AIRLINE INDUSTRY 41
I
(see Table 3.7). A key feature of the industry's cost structure is the very high proportion of costs that are fixed. For example, because of union contracts, it was difficult to reduce employment and hours worked during downturns . The majors' need to maintain their route networks added to the inflexibility of costs-the desire to retain the integrity of the entire network made the airlines reluctant to shed unprofitable routes during downturns. An important implication of the industry's cost structure is that, at times of excess capacity, the marginal costs of filling empty seats on scheduled flights are extremely low.
Labor The industry's labor costs are boosted by the high level of employee remuneration-average pay in airlines was $55950 in 2007; almost 40% higher than the average for all private industries'? Lahor costs were also boosted by low labor productivity that resulted from rigid working practices agreed with unions. Most airline workers belong to one of a dozen major unions, the Association of Flight Attendants, the Air Line Pilots Association, and the International Association of Machinists and Aerospace Workers being the most important. These unions have a tradition of militancy and have been highly successful in negotiating pay increases far above the rate of inflation.
Between 2002 and 2009, the airlines forced major concessions from their employees. A5 a result, average compensation (including benefits) declined from $79356 in 2003 to $74786 in 2007. Industry employment fell from a peak of 680000 in 2000 to 532000 in 2008.8
Fuel How much a carrier spends on fuel depends on the age of its aircraft and its average flight length. Newer planes and longer flights lead to higher fuel efficiency. The fuel efficiency of different aircraft varies widely, primarily dependent on the number of engines. Fuel prices represent the most volatile and unpredictable cost item for the airlines due to fluctuations in the price of crude oil. Between January 2002 and June 2008, New York spot crude prices rose from $19 to $140 a barrel before falling to $40 in December 2008. By April 2009, crude prices were back above $50 a barrel.
Equipment Aircraft were the biggest capital expenditure item for the airlines. At prices of up to $250 mil!ion each (Ihe A380 sells at around $350 million), the purchase of new planes represented a major source of financial strain for the airlines. While Boeing and Airbus competed fiercely for new business (especially when their order book was low, as in 2002-4), aggressive discounts and generous financing terms for the purchase of new planes disguised the fact that a major source of profits for the aircraft manufacturers was aftermarket sales. Over the past 20 years the number of manufacturers of large jets declined from four to two. Lockheed ceased civilian jet manufacture in 1984; McDonnell Douglas was acquired by Boeing in 1997. The leading suppliers of regional jets were Bombardier of Canada and Emhracr of Brazil. During 20OS-8, Boeing's return on equity averaged 21.3%.
Airport Facilities Airports playa critical role in the U.S. aviation industry. They are hugely complex, expensive facili[ies and few in number. Only the largest cities are served by more than one airport. Despite the rapid, sustained growth in air transport since deregulation, Denver is the only major new airport to have been built. Most airports are owned by municipalities; they typically generate substantial revenue flows for the cities. Landing fees are set by contracts between the airport and the airlines and are typically based on aircraft weight. New York's La Guardia airport has the highest
« CASE3 u.s. AIRUNE INDUSTRY
The mood of pessimism was reflected in stock-market valuation of airline companies and in theif credit ratings. The total market capitalization of all quoted U.S. passenger airline companies at the end of May 2009 was $17.4 billion-less than half the value of its largest supplier, Boeing, and a mere 4% of the market value of Exxon Mobil. The market's view of the airlines' debt was similarly bleak. Only Southwest had an investment grade credit rating; all other airline debt was rated "junk" (below BBB-) by S&P. In the second quarter of 2009, Fitch downgraded the debt ratings of both AMR and UAL to CCc.
On the positive side, the legacy airlines had been successful in reducing their cost base through productivity improvements and reductions in compensation and benefits. As a result the cost gap between the LCCs and the legacy airlines had narrowed. However, although this had improved the competitive situation of the legacy airlines relative to the LCCs, it appeared that industry-wide cost reductions-whether from lower fuel prices or greater efficiency-did little to improve the profitability of the airline industry as a whole. The intensity of price competition meant that industrywide COSt reductions tended to be passed on to customers in lower fares.
The key issue was whether industry consolidation and a greater willingness to reduce capacity might lead to firmer pricing on the industry. The speed of capaciry adjustment during 2008 and 2009 suggested that the airlines were more willing to adjust capacity to demand-and also more able to do so as a result of more flexible union agreements. The key issue was whether the new discipline would survive the next upturn in the industry. It was possible that the tightening of credit markets might help maintain a more cautious approach to capacity expansion. The long-term failure of the industry to earn a rate of return that came close to covering its cost of capital was likely to imply continuing difficulties for the airlines in financing new planes and other capital equipment. Doug Parker, U.s. Airways CEO, observed: "We have in this business been able to fund long-term losses with outside capital . .. and that is going to be harder to do in the future," citing "fundamental" changes for airlines' financial partners such as banks, aircraft makers, lessors and other suppliers.l0
The evidence of past revivals in the industry suggested that they came to an end either as a result of external events or by the industry's own propensity to overinvest. [n the case of the two previous upturns-1996-99 and 2006-08-external events were the critical factors (the September 11 terrorist attacks and the financial crisis of 2008) . But even without adverse external events, the industry had shown a tendency towards over-optimism and lack of financial discipline that has fuelled investment in new capacity both by established airlines and new start-ups. With forecasts that demand for air travel would pick up gradually during the latter part of 2009 and into 2010, the key question was whether the airlines would be able to maintain the disciplined approach to cost control, capacity, and pricing that they had shown since the onset of the financial crisis.
Most encouraging was the success of the airlines in COSt cutting. Yet, the efforts of the major airlines in improving operational efficiency also raised some perplexing questions. The widespread assumption had been that, if the major airlines could reduce their COStS to the level of Southwest and the other low-cost carriers, they could enjoy profit levels similar to those experienced by Southwest. Despite the cfforts of the majors, Southwest, Jet Blue and the other budget airlines still retained a substantial cost advantage over the legacy carriers. Even if the major airlines could continue to reduce costs, who would the beneficiaries be-the long-suffering shareholders of the companies, or travelers as competition to fill seats encouraged the airlines to pass on cost reductions to customers in the form of lower prices?
u.s. Centennial of Flight Commission, ~The Early Years of German Commercial Aviation,~ www.centennialoftlight. gov/essay/Commercial_ Aviation/germany{f ran 19 .htm, accessed October 7, 2009.
2 ~ Airline Industry in Intensive Care, ~ Financial Times, March 25, 2009.
3 "Deserts Littered by State of Airline Industry, ~ Financial Times, March 5, 2009.
4 Abolition of the CAB meant that the primary responsibility for airline regulation was with the Federal Aviation Administration, which was responsible for airline safety.
5 ~FAA: Air Travel will Fall 7.8% in '09,~ CNN, March 31, 2009, htrp:!!money.cnn.com!2009/03/3 l/news/companies/ Airlines/index.htlll, accessed October 29, 2009.
CASE3 U.S,AIRLINE INDUSTRY 45 ,
6 "Business Travel Blues," Washington P05t, March 17, 2009, http://www.washingtonpost.com!wp-dyn!content! article/2009/03/l7/ AR200903 170 1280.hun 1, accessed October 209, 2009.
7 Air Transport Association, 2008 Economic Report, ATA, Washington DC.
8 Air Transport Association, 2008 ECOIlOmic Report, ATA, Washington DC.
9 On the principles of contestability and its application to the U.S. airline industry see: S. Martin, "The Theory of Contesmble Markets,·' discussion paper, Department of Economics, Purdue University, July 2000.
10 "Airlines: Where Capital Goes to Die," Busines5 Week. May S, 2009.
42 CASE 3 u.s. AIRLINE INDUSTRY
landing fees in the U.S., charging over $6000 for a Boeing 747 to land. In 2007, the airlines paid over $2 billion to U.S. airports in landing fees and a further $3.0 billion in passenger facility charges.
Four U.S. airports-JFK and La Guardia in New York, Chicago's O'Hare, and Washington's Reagan National---are officially "congested" and t."lkeoff and landing slots are allocated to individual airlines where the airlines assume de {acto ownership. The cutback in airline capacity during 2008 and 2009 has temporarily relieved problems of congestion and reversed the escalation in the value of takeoff and landing slots.
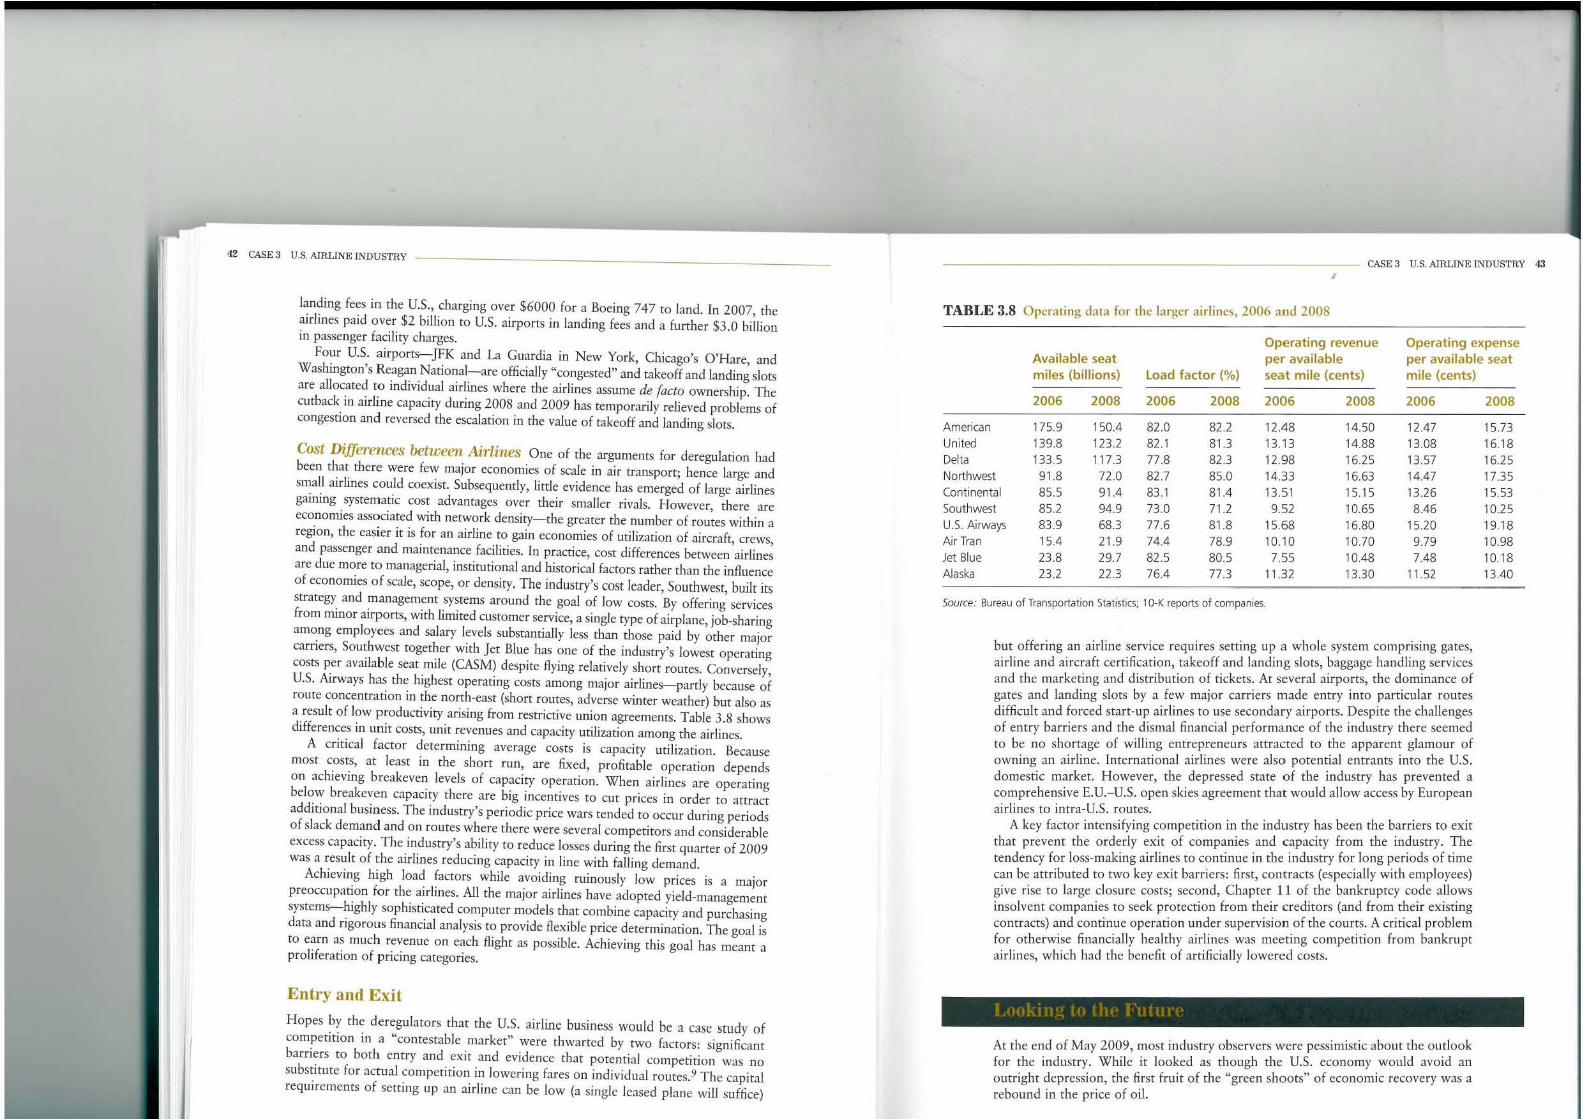
Cost Differences between Airlines One of the arguments for deregulation had been that there were few major economies of scale in air transport; hence large and small airlines could coexist. Subsequently, little evidence has emerged of large airlines gaining systematic cost advantages over their smaller rivals. However, there are economies associated with network density-the greater the number of routes within a region, the easier it is for an airline to gain economies of utilization of aircraft, crews, and passenger and maintenance facilities. In practice, COSt differences between airlines are due more to managerial, institutional and historicaJ factors rather than the influence of economies of scale, scope, or density. The industry's cost leader, Sourhwest, built irs strategy and management systems around the goal of low costs. By offering services from minor airports, with limited customer service, a single type of airplane, job-sharing among employees and salary levels substantially less than those paid by other major carriers, Southwest together with Jet Blue has one of the industry'S lowest operating costs per available seat mile (CASM) despite flying relatively short routes. Conversely, U.S. Airways has the highest operating costs among major airlines-partly because of route concentration in the north-east (shorr routes, adverse winter weather) but also as a result of low productivity arising from restrictive union agteements. Table 3.8 shows differences in unit COSts, unit revenues and capacity utilization among the airlines.
A critical factor determining average costs is capacity utilization. Because most costs, at least in the shorr run, are fixed, profitable operation depends on achieving breakeven levels of capacity operation. When airlines are operating below breakeven capacity there are big incentives to cur prices in order to attract additional business. The industry's periodic price wars tended to occur during periods of slack demand and on routes where there were several competitors and considerable excess capacity. The industry's ability to reduce losses during the first quarter of 2009 was a result of the airlines reducing capacity in line with falling demand.
Achieving high load factors while avoiding ruinously low prices is a major preoccupation for the airlines. All the major airlines have adopted yield-management systems-highly sophisticated computer models that combine capacity and purchasing data and rigorous financial analysis to provide flexible price determination . The goal is to earn as much revenue on each flight as possible. Achieving this goal has meant a proliferation of pricing categories.
Entry and Exit
Hopes by the deregubtors that the U.S. airline business would be a case study of competition in a "contestable market" were thwarted by two factors: significant barriers to both entry and exit and evidence that potential competition was no substitute for actual competition in lowering fares on individual routes.9 The capital requirements of setting up an airline can be low (a single leased plane will suffice)
CASE 3 u.S. AIRLINE INDUSTRY 4:l ,
TABLE 3.8 O perating data fo r the larger airlines, 2006 and 2008
Available seat mi les (billions) Load factor (%)
Operating revenue per avai lable seat mile (cents)
Operating expense per available seat mile (cents)
2006 2008 2006 2008 2006 2008 2006
American 175.9 150.4 82.0 82.2 12.48 14.50 12.47 United 139.8 123.2 82.1 81.3 13.13 14.88 13.08 Delta 133.5 117.3 77.8 82.3 12.98 16.25 13.57 Northwest 91.8 72.0 82.7 85.0 14.33 16.63 14.47 Continental 85.5 91.4 83.1 81.4 13.51 15.15 13.26 Southwest 85.2 94.9 73.0 71.2 9.52 10.65 8.46 U.S. Airways 83.9 68.3 77.6 81.8 15.68 16.80 15.20 Air Tran 15.4 21.9 74.4 78.9 10.10 10.70 9.79 Jet Blue 23.8 29.7 825 805 7.55 10.48 7.48 Alaska 23.2 22.3 76.4 77.3 11.32 13.30 11.52
Source: Bureau of Transportation Statistics; 1 O·K reports of companies.
but offering an airline service requires setting up a whole system comprising gates, airline and aircraft certification, takeoff and landing slots, baggage handling services and the marketing and distribution of rickets. At several airports, the dominance of gates and landing slots by a few major carriers made entry into particular TOutes difficult and forced start-up airlines to use secondary airports. Despite the challenges of entry barriers and the dismal financial performance of the industry there seemed to be no shortage of willing entrepreneurs attracted to the apparent glamour of owning an airline. International airlines were also potential entrants into the U.S. domestic market. However, the depressed state of the industry has prevented a comprehensive E.U.-U.S. open skies agreement that would allow access by European airlines to intra-U.S. routes.
A key factor intensifying competition in the industry has been the barriers to exit that prevent the orderly exit of companies and capacity from the industry. The tendency for loss-making airlines to continue in the industry for long periods of time can be attributed to two key exit barriers: first, contracts (especially with employees) give rise to large closure costs; second, Chapter 11 of the bankruptcy code allows insolvent companies to seek protection from their creditors (and from their existing contracts) and continue operation under supervisioll of the courts. A critical problem for otherwise financ ially healthy airlines was meeting competition from bankrupt airlines, which had the benefit of artificially lowered costs.
At the end of May 2009, most industry observers were pessimistic about the outlook for the industry. While it looked as though [he U.S. economy would avoid an outright depression, the first fruit of the "green shoots" of economic recovery was a rebound in the price of oil.
2008
15.73 16.18 16.25 17.35 15.53 10.25 19.18 10.98 10.18 13.40