bharti airtel - amazon s3 · airtel vodafone idea (incl spice) reliance bsnl+mtnl tata tele aircel...
TRANSCRIPT

Bharti AirtelInvestor Conference Presentation –
November 2016
Disclaimer
Certain numbers in this presentation have been rounded off for ease of representation
The information contained in this presentation is only current as of its date. All actions and statements made herein or otherwise shall be subject to the applicable
laws and regulations as amended from time to time. There is no representation that all information relating to the context has been taken care off in the presentation
and neither we undertake any obligation as to the regular updating of the information as a result of new information, future events or otherwise. We will accept no
liability whatsoever for any loss arising directly or indirectly from the use of, reliance of any information contained in this presentation or for any omission of the
information. The information shall not be distributed or used by any person or entity in any jurisdiction or countries were such distribution or use would be contrary to
the applicable laws or Regulations. It is advised that prior to acting upon this presentation independent consultation / advise may be obtained and necessary due
diligence, investigation etc may be done at your end. You may also contact us directly for any questions or clarifications at our end.
This presentation contain certain statements of future expectations and other forward-looking statements, including those relating to our general business plans and
strategy, our future financial condition and growth prospects, and future developments in our industry and our competitive and regulatory environment. In addition to
statements which are forward looking by reason of context, the words ‘may, will, should, expects, plans, intends, anticipates, believes, estimates, predicts, potential or
continue’ and similar expressions identify forward looking statements.
Actual results, performances or events may differ materially from these forward-looking statements including the plans, objectives, expectations, estimates and
intentions expressed in forward looking statements due to a number of factors, including without limitation future changes or developments in our business, our
competitive environment, telecommunications technology and application, and political, economic, legal and social conditions in India. It is cautioned that the
foregoing list is not exhaustive
“The information contained herein does not constitute an offer of securities for sale in the United States. Securities may not be sold in the United States absent
registration or an exemption from registration under the U.S. Securities Act of 1933, as amended. Any public offering of securities to be made in the United States
will be made by means of a prospectus and will contain detailed information about the Company and its management, as well as financial statements. No money,
securities or other consideration is being solicited, and, if sent in response to the information contained herein, will not be accepted.”
Investor Relations :- http://www.airtel.in
For any queries, write to: [email protected]
2
What Guides Us
3
• Win customers for life through differentiated experience, products and world class technology
Customer Centricity
• Growth despite challenges
• Grow market share, strip out waste
• Accelerate non-mobile businesses
Performance Excellence
• Highest corporate governance and disclosure rankings
Transparency & Ethical Governance
Investment Highlights
4
Large residual opportunity
Bulk investments already in place; good spectrum bank
Diversified operator with scale and dominance in marketplace
Demonstrated best in class execution
1
2
3
4
5
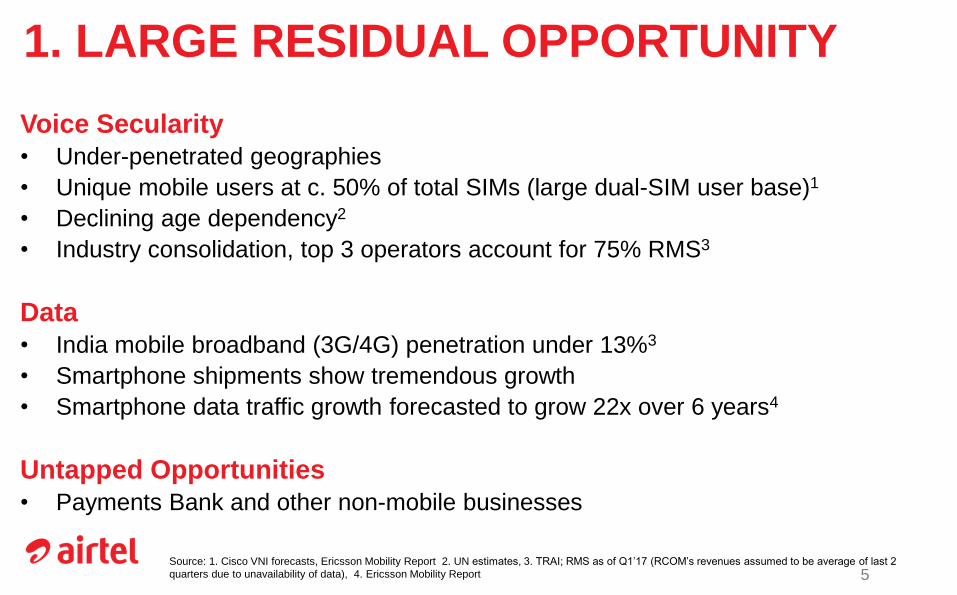
1. LARGE RESIDUAL OPPORTUNITY
Voice Secularity
• Under-penetrated geographies
• Unique mobile users at c. 50% of total SIMs (large dual-SIM user base)1
• Declining age dependency2
• Industry consolidation, top 3 operators account for 75% RMS3
Data
• India mobile broadband (3G/4G) penetration under 13%3
• Smartphone shipments show tremendous growth
• Smartphone data traffic growth forecasted to grow 22x over 6 years4
Untapped Opportunities
• Payments Bank and other non-mobile businesses
Source: 1. Cisco VNI forecasts, Ericsson Mobility Report 2. UN estimates, 3. TRAI; RMS as of Q1’17 (RCOM’s revenues assumed to be average of last 2
quarters due to unavailability of data), 4. Ericsson Mobility Report
6
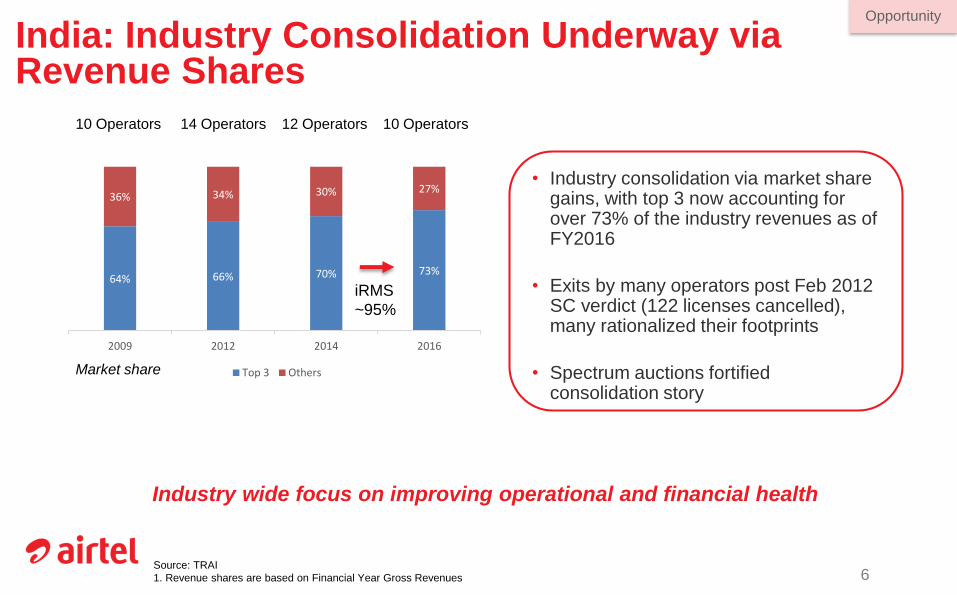
10 Operators 14 Operators 12 Operators 10 Operators
Market share
Industry wide focus on improving operational and financial health
• Industry consolidation via market share gains, with top 3 now accounting for over 73% of the industry revenues as of FY2016
• Exits by many operators post Feb 2012 SC verdict (122 licenses cancelled), many rationalized their footprints
• Spectrum auctions fortified consolidation story
Source: TRAI
1. Revenue shares are based on Financial Year Gross Revenues
64% 66% 70% 73%
36% 34% 30% 27%
2009 2012 2014 2016
Top 3 Others
iRMS
~95%
India: Industry Consolidation Underway via Revenue Shares
Opportunity
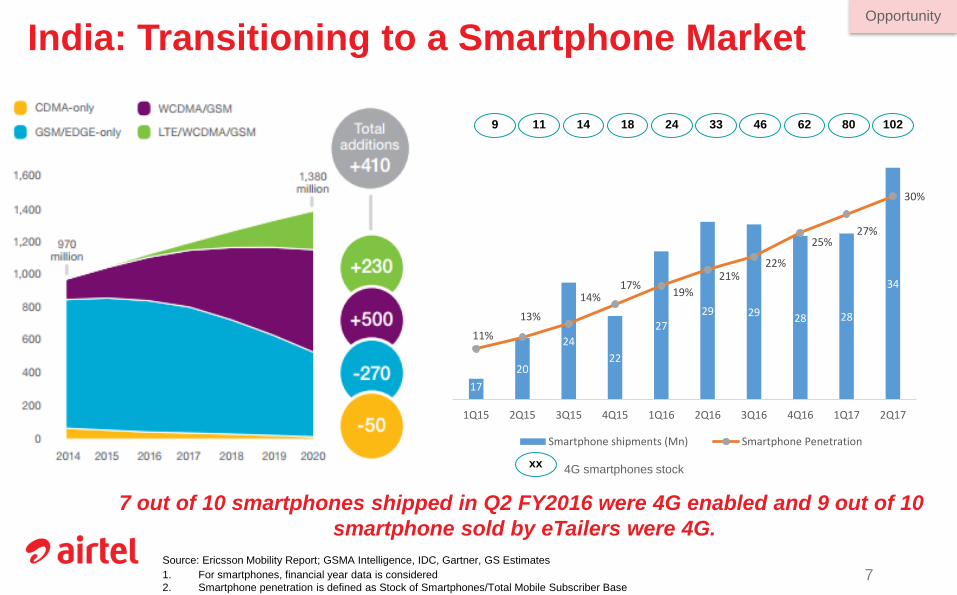
7 out of 10 smartphones shipped in Q2 FY2016 were 4G enabled and 9 out of 10
smartphone sold by eTailers were 4G.
7
India: Transitioning to a Smartphone Market
Source: Ericsson Mobility Report; GSMA Intelligence, IDC, Gartner, GS Estimates
Opportunity
17
20
24
22
2729 29 28 28
34
11%
13%
14%17%
19%
21%22%
25%27%
30%
5%
10%
15%
20%
25%
30%
35%
15
17
19
21
23
25
27
29
31
33
35
1Q15 2Q15 3Q15 4Q15 1Q16 2Q16 3Q16 4Q16 1Q17 2Q17
Smartphone shipments (Mn) Smartphone Penetration
1. For smartphones, financial year data is considered
2. Smartphone penetration is defined as Stock of Smartphones/Total Mobile Subscriber Base
10280624633241814119
xx4G smartphones stock
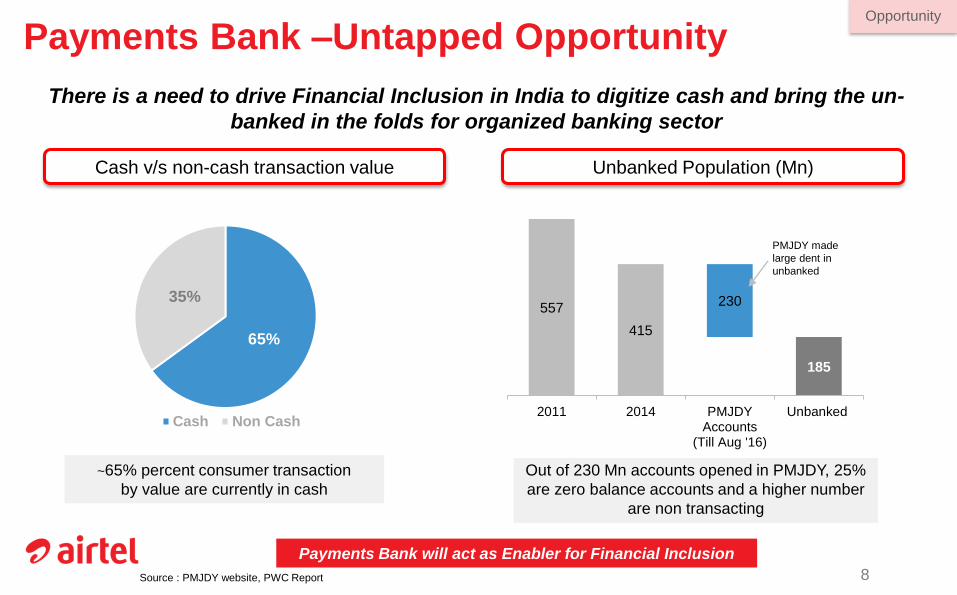
Payments Bank will act as Enabler for Financial Inclusion
~65% percent consumer transaction
by value are currently in cash
65%
35%
Cash Non Cash
Out of 230 Mn accounts opened in PMJDY, 25%
are zero balance accounts and a higher number
are non transacting
There is a need to drive Financial Inclusion in India to digitize cash and bring the un-
banked in the folds for organized banking sector
557
415
185
230
2011 2014 PMJDYAccounts
(Till Aug '16)
Unbanked
PMJDY made
large dent in
unbanked
Source : PMJDY website, PWC Report
Payments Bank –Untapped OpportunityOpportunity
Cash v/s non-cash transaction value Unbanked Population (Mn)
8
9
2. BULK INVESTMENTS IN PLACE
Spectrum Bank
• Successful re-farming of sub-GHz spectrum for 3G
• 3G/4G coverage pan-India
• Highest spectrum market share ex-MTNL/BSNL
Largest network of towers and base stations
• 95.1% voice population coverage
• Mobile broadband towers up 57% over the last year
Largest network of optic fiber
• Global and national long distance fiber – over 448,799 RKms
• Added c. 4,768 RKms over the past quarter
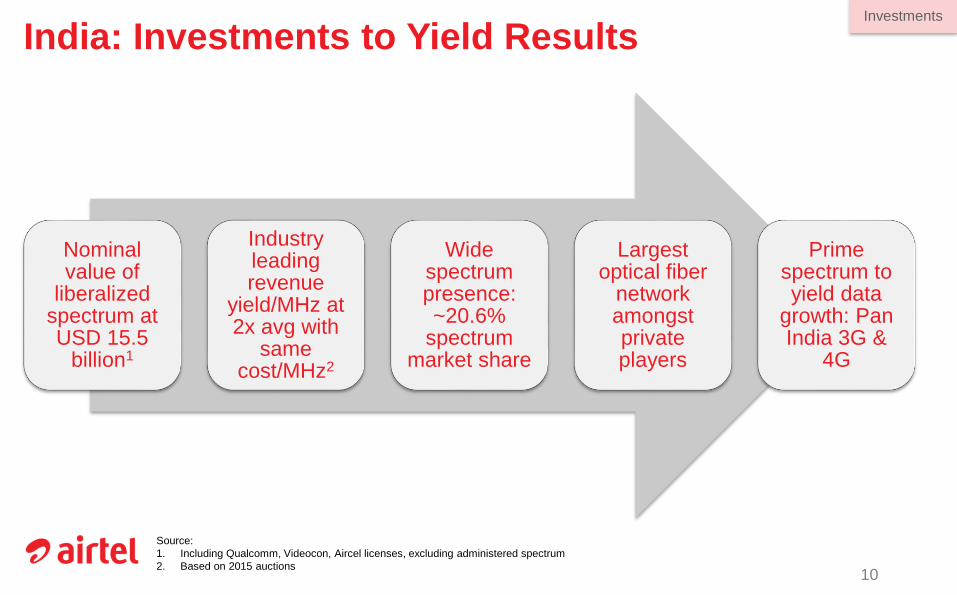
Source:
1. Including Qualcomm, Videocon, Aircel licenses, excluding administered spectrum
2. Based on 2015 auctions10
Nominal value of
liberalized spectrum at USD 15.5
billion1
Industry leading revenue
yield/MHz at 2x avg with
same cost/MHz2
Wide spectrum presence: ~20.6%
spectrum market share
Largest optical fiber
network amongst private players
Prime spectrum to yield data
growth: Pan India 3G &
4G
India: Investments to Yield ResultsInvestments
Source: TRAI, Department of Telecom, Company Filings
1. Including Qualcomm, Videocon, Aircel licenses, excluding administered spectrum 11
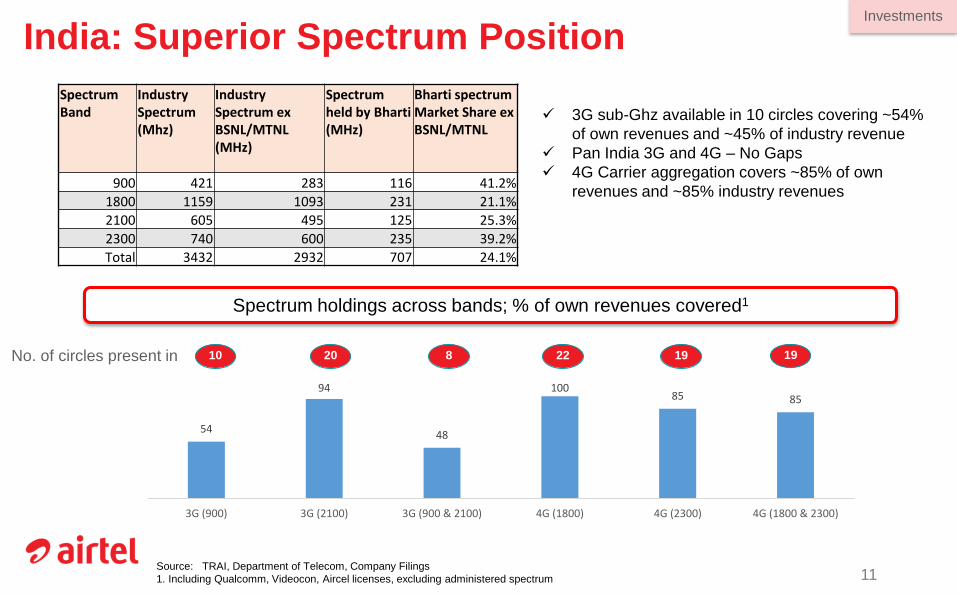
India: Superior Spectrum Position
3G sub-Ghz available in 10 circles covering ~54%
of own revenues and ~45% of industry revenue
Pan India 3G and 4G – No Gaps
4G Carrier aggregation covers ~85% of own
revenues and ~85% industry revenues
10 20 8 22 19 19No. of circles present in
Spectrum holdings across bands; % of own revenues covered1
Investments
54
94
48
10085 85
3G (900) 3G (2100) 3G (900 & 2100) 4G (1800) 4G (2300) 4G (1800 & 2300)
Spectrum Band
Industry Spectrum (Mhz)
Industry Spectrum ex BSNL/MTNL (MHz)
Spectrum held by Bharti (MHz)
Bharti spectrum Market Share ex BSNL/MTNL
900 421 283 116 41.2%
1800 1159 1093 231 21.1%
2100 605 495 125 25.3%
2300 740 600 235 39.2%
Total 3432 2932 707 24.1%
12
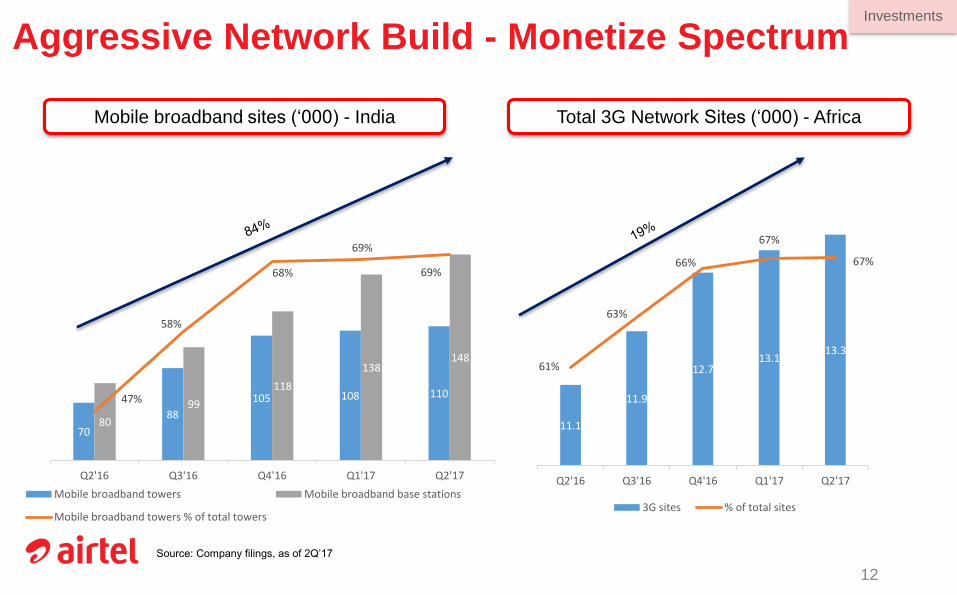
Aggressive Network Build - Monetize Spectrum
Source: Company filings, as of 2Q’17
Mobile broadband sites (‘000) - India Total 3G Network Sites (‘000) - Africa
Investments
70
88
105 108 110
80
99
118
138148
47%
58%
68%
69%
69%
40
60
80
100
120
140
Q2'16 Q3'16 Q4'16 Q1'17 Q2'17
40%
45%
50%
55%
60%
65%
70%
Mobile broadband towers Mobile broadband base stations
Mobile broadband towers % of total towers
11.1
11.9
12.713.1
13.3
61%
63%
66%
67%
67%
55%
57%
59%
61%
63%
65%
67%
69%
10.0
10.5
11.0
11.5
12.0
12.5
13.0
13.5
Q2'16 Q3'16 Q4'16 Q1'17 Q2'17
3G sites % of total sites
13
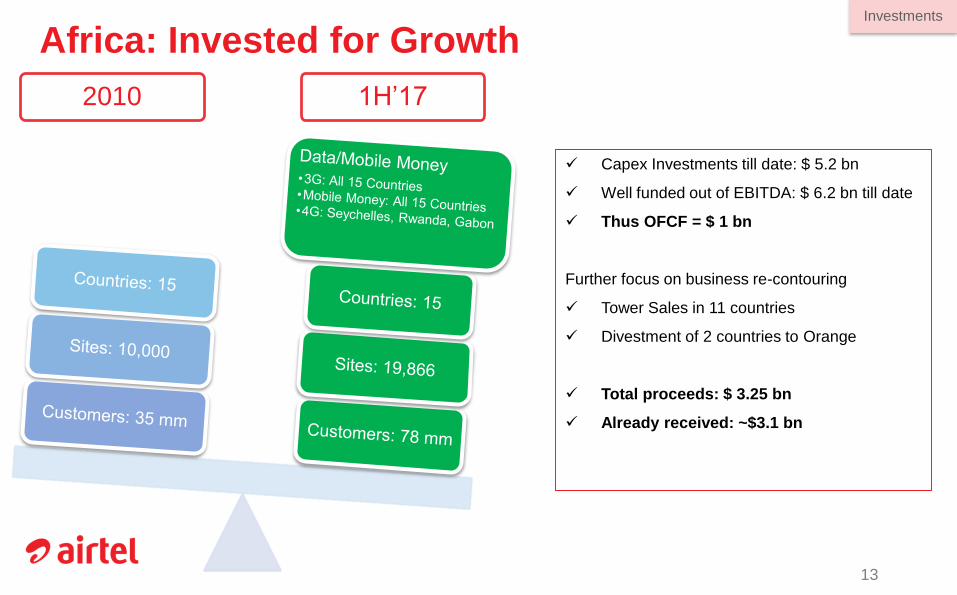
Africa: Invested for Growth
1H’172010
Capex Investments till date: $ 5.2 bn
Well funded out of EBITDA: $ 6.2 bn till date
Thus OFCF = $ 1 bn
Further focus on business re-contouring
Tower Sales in 11 countries
Divestment of 2 countries to Orange
Total proceeds: $ 3.25 bn
Already received: ~$3.1 bn
Investments
14
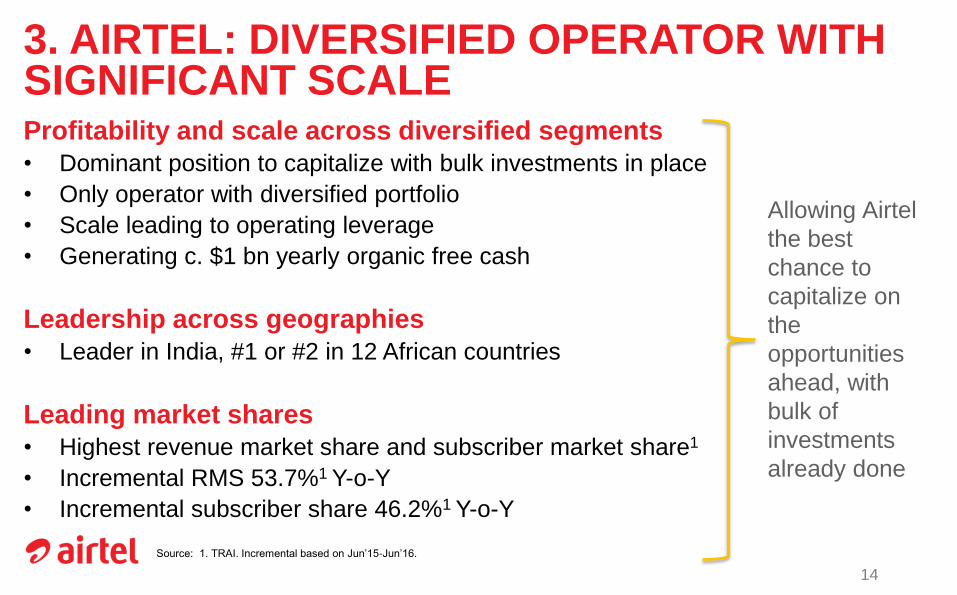
3. AIRTEL: DIVERSIFIED OPERATOR WITH SIGNIFICANT SCALEProfitability and scale across diversified segments
• Dominant position to capitalize with bulk investments in place
• Only operator with diversified portfolio
• Scale leading to operating leverage
• Generating c. $1 bn yearly organic free cash
Leadership across geographies
• Leader in India, #1 or #2 in 12 African countries
Leading market shares
• Highest revenue market share and subscriber market share1
• Incremental RMS 53.7%1 Y-o-Y
• Incremental subscriber share 46.2%1 Y-o-Y
Source: 1. TRAI. Incremental based on Jun’15-Jun’16.
Allowing Airtel
the best
chance to
capitalize on
the
opportunities
ahead, with
bulk of
investments
already done
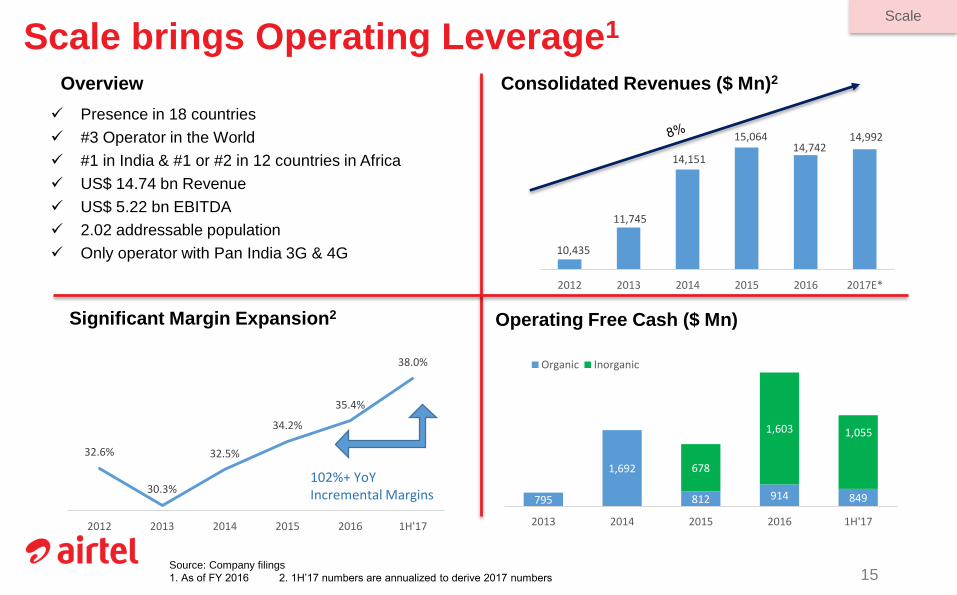
Scale brings Operating Leverage1
15
Overview Consolidated Revenues ($ Mn)2
Operating Free Cash ($ Mn)Significant Margin Expansion2
Presence in 18 countries
#3 Operator in the World
#1 in India & #1 or #2 in 12 countries in Africa
US$ 14.74 bn Revenue
US$ 5.22 bn EBITDA
2.02 addressable population
Only operator with Pan India 3G & 4G
Source: Company filings
1. As of FY 2016 2. 1H’17 numbers are annualized to derive 2017 numbers
Scale
32.6%
30.3%
32.5%
34.2%
35.4%
38.0%
2012 2013 2014 2015 2016 1H'17
102%+ YoY Incremental Margins
678
1,603
157
10,435
11,745
14,151
15,064 14,742
14,992
2012 2013 2014 2015 2016 2017E*
795
1,692
812 914 849
678
1,603
2013 2014 2015 2016 1H'17
Organic Inorganic
1,055
16
4. BEST IN CLASS EXECUTION
Q2’17 highlights
• India – Broad based revenue growth across mobile, DTH, Homes, Enterprise segments
– Mobile revenue up 7.9% YoY via industry leading net subscriber additions, incremental RMS
– Data volumes up 55%, Data ARPU up 4.2% YoY
– Voice volumes grew 11.1% YoY, highest in the last 20 quarters
• Africa– Revenue growth 3.7% YoY
– Data volumes up by 116% YoY, now 16.3% of mobile revenues
– Voice volumes up 9.2% YoY
– Airtel Money has 9.1 mn active customers, up 15% YoY, transacting c. $3.7 bn / quarter
• Strong operating leverage– EBITDA margin expansion of 370 bps YoY
– Net Income before exceptional items up 18.3% YoY
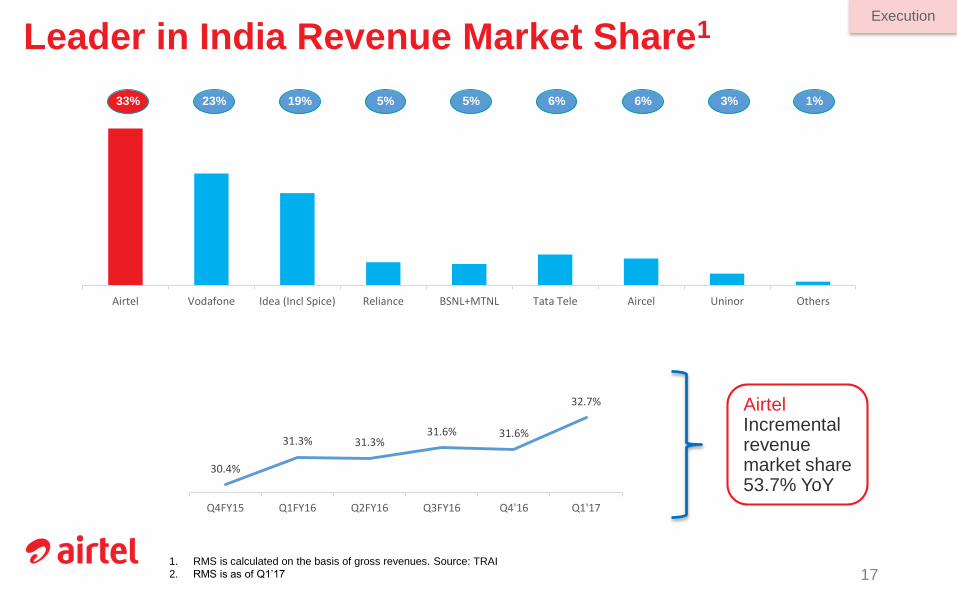
Leader in India Revenue Market Share1
17
1%3%6%6%5%5%19%23%33%
1. RMS is calculated on the basis of gross revenues. Source: TRAI
2. RMS is as of Q1’17
AirtelIncremental revenue market share 53.7% YoY
Execution
Airtel Vodafone Idea (Incl Spice) Reliance BSNL+MTNL Tata Tele Aircel Uninor Others
30.4%
31.3% 31.3%31.6% 31.6%
32.7%
Q4FY15 Q1FY16 Q2FY16 Q3FY16 Q4'16 Q1'17
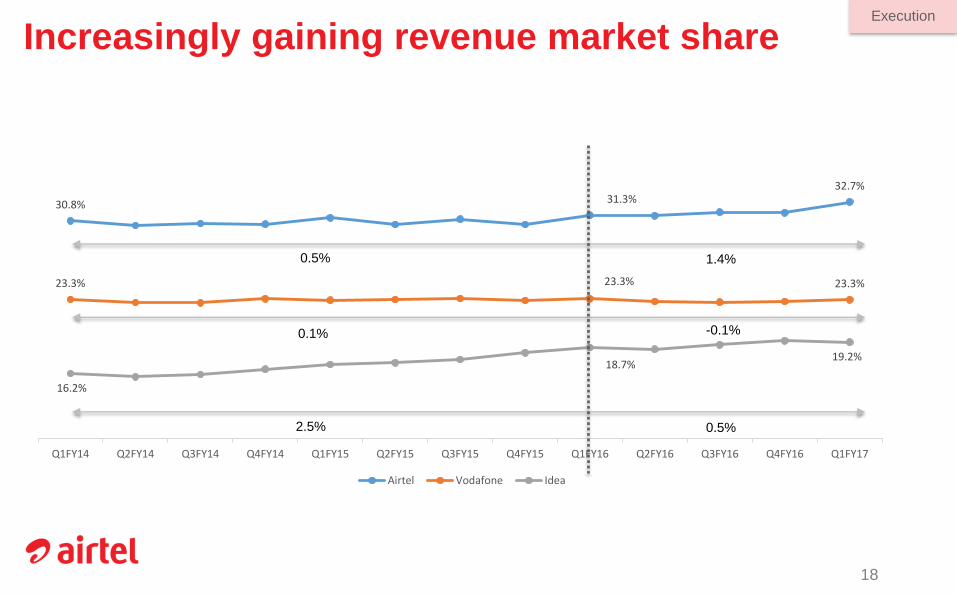
Increasingly gaining revenue market share
18
Execution
30.8% 31.3%32.7%
23.3% 23.3% 23.3%
16.2%
18.7%19.2%
Q1FY14 Q2FY14 Q3FY14 Q4FY14 Q1FY15 Q2FY15 Q3FY15 Q4FY15 Q1FY16 Q2FY16 Q3FY16 Q4FY16 Q1FY17
Airtel Vodafone Idea
0.5% 1.4%
-0.1%
0.5%
0.1%
2.5%
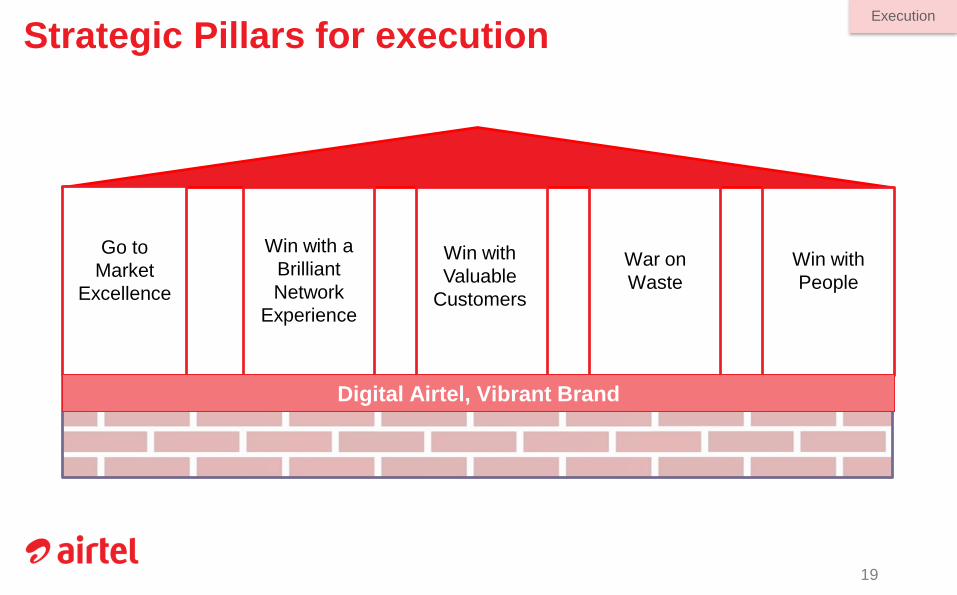
Strategic Pillars for execution
19
Execution
Vibrant Brand
Go to
Market
Excellence
War on
Waste
Win with
People
Win with a
Brilliant
Network
Experience
Digital Airtel, Vibrant Brand
Win with
Valuable
Customers
20
Execution
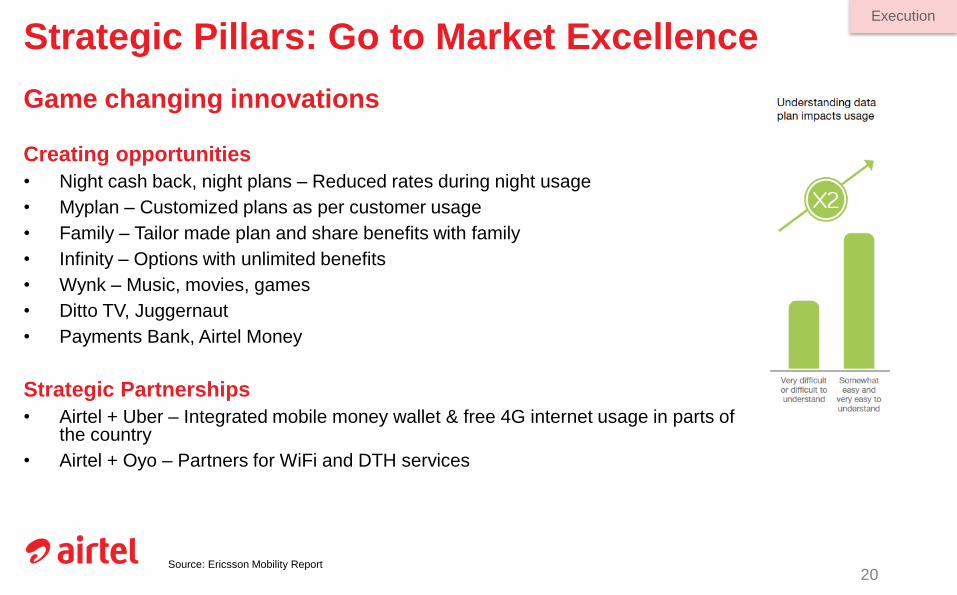
Creating opportunities
• Night cash back, night plans – Reduced rates during night usage
• Myplan – Customized plans as per customer usage
• Family – Tailor made plan and share benefits with family
• Infinity – Options with unlimited benefits
• Wynk – Music, movies, games
• Ditto TV, Juggernaut
• Payments Bank, Airtel Money
Strategic Partnerships
• Airtel + Uber – Integrated mobile money wallet & free 4G internet usage in parts of the country
• Airtel + Oyo – Partners for WiFi and DTH services
Source: Ericsson Mobility Report
Strategic Pillars: Go to Market Excellence
Game changing innovations
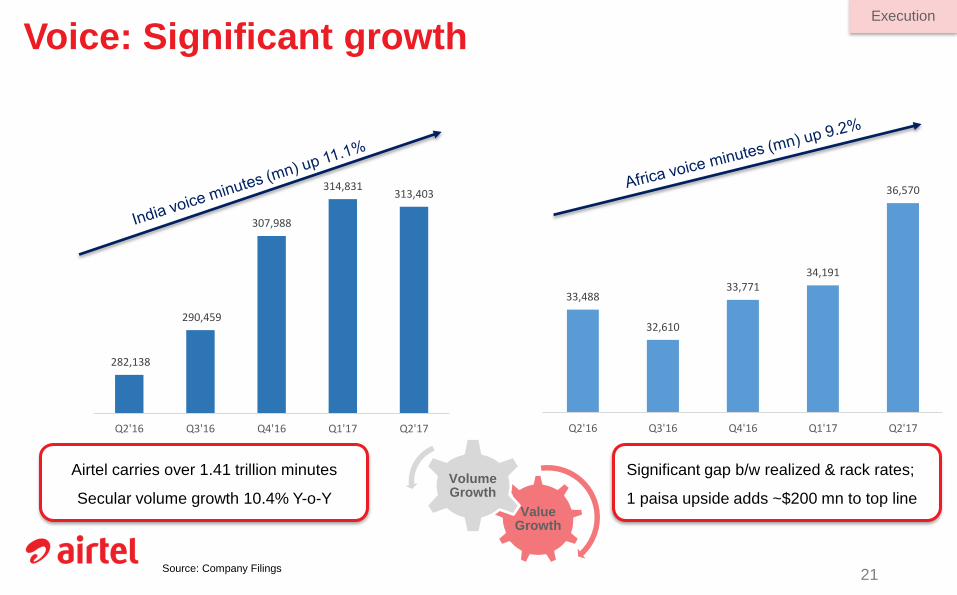
Voice: Significant growth
21
Value Growth
Volume Growth
Significant gap b/w realized & rack rates;
1 paisa upside adds ~$200 mn to top line
Airtel carries over 1.41 trillion minutes
Secular volume growth 10.4% Y-o-Y
Execution
Source: Company Filings
282,138
290,459
307,988
314,831 313,403
Q2'16 Q3'16 Q4'16 Q1'17 Q2'17
33,488
32,610
33,771 34,191
36,570
Q2'16 Q3'16 Q4'16 Q1'17 Q2'17
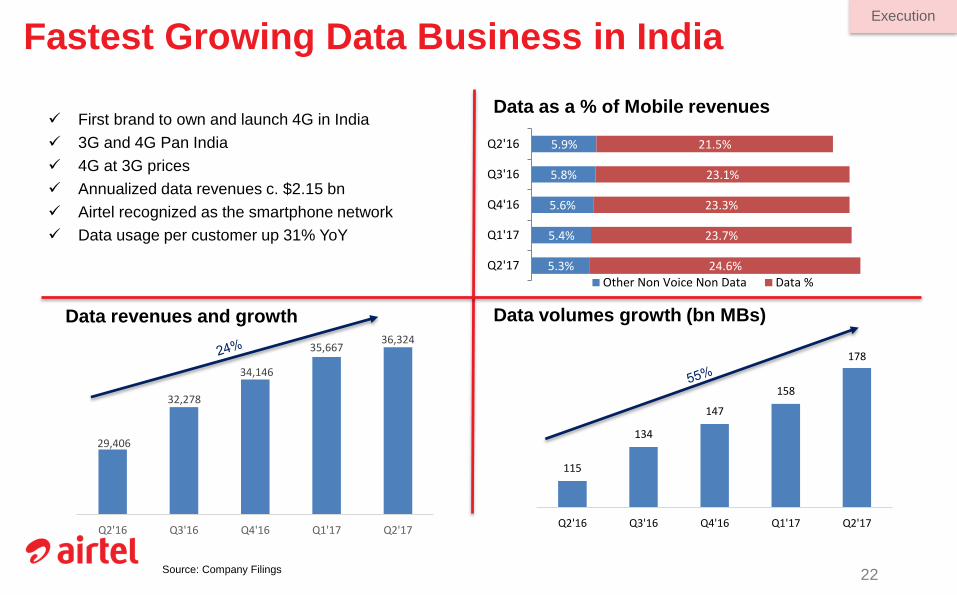
Fastest Growing Data Business in India
22
First brand to own and launch 4G in India
3G and 4G Pan India
4G at 3G prices
Annualized data revenues c. $2.15 bn
Airtel recognized as the smartphone network
Data usage per customer up 31% YoY
Data revenues and growth
Data as a % of Mobile revenues
Data volumes growth (bn MBs)
Execution
Source: Company Filings
5.3%
5.4%
5.6%
5.8%
5.9%
24.6%
23.7%
23.3%
23.1%
21.5%
Q2'17
Q1'17
Q4'16
Q3'16
Q2'16
Other Non Voice Non Data Data %
115
134
147
158
178
Q2'16 Q3'16 Q4'16 Q1'17 Q2'17
29,406
32,278
34,146
35,66736,324
Q2'16 Q3'16 Q4'16 Q1'17 Q2'17
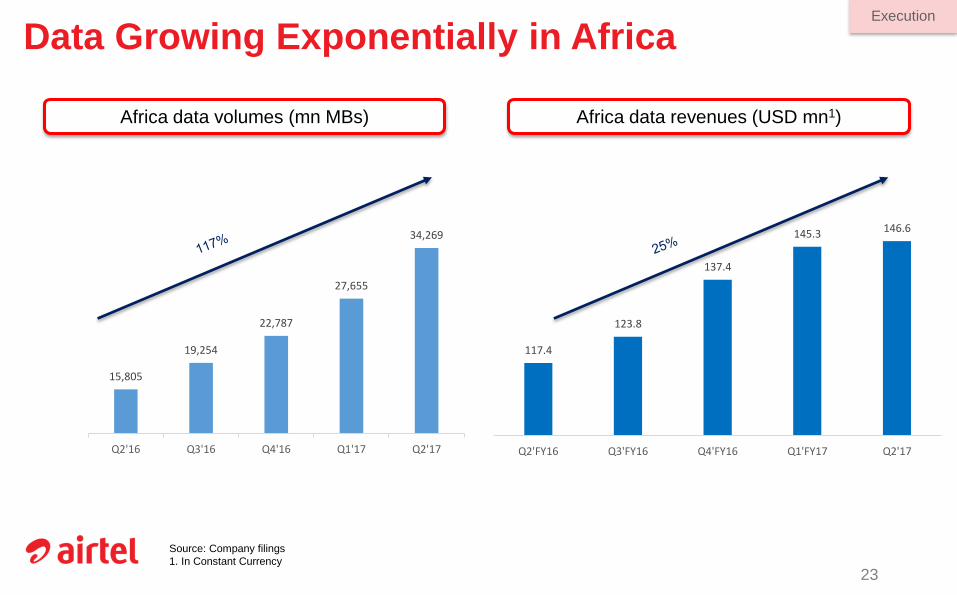
Data Growing Exponentially in Africa
23
Source: Company filings
1. In Constant Currency
Africa data volumes (mn MBs) Africa data revenues (USD mn1)
Execution
15,805
19,254
22,787
27,655
34,269
Q2'16 Q3'16 Q4'16 Q1'17 Q2'17
117.4
123.8
137.4
145.3 146.6
Q2'FY16 Q3'FY16 Q4'FY16 Q1'FY17 Q2'17
24
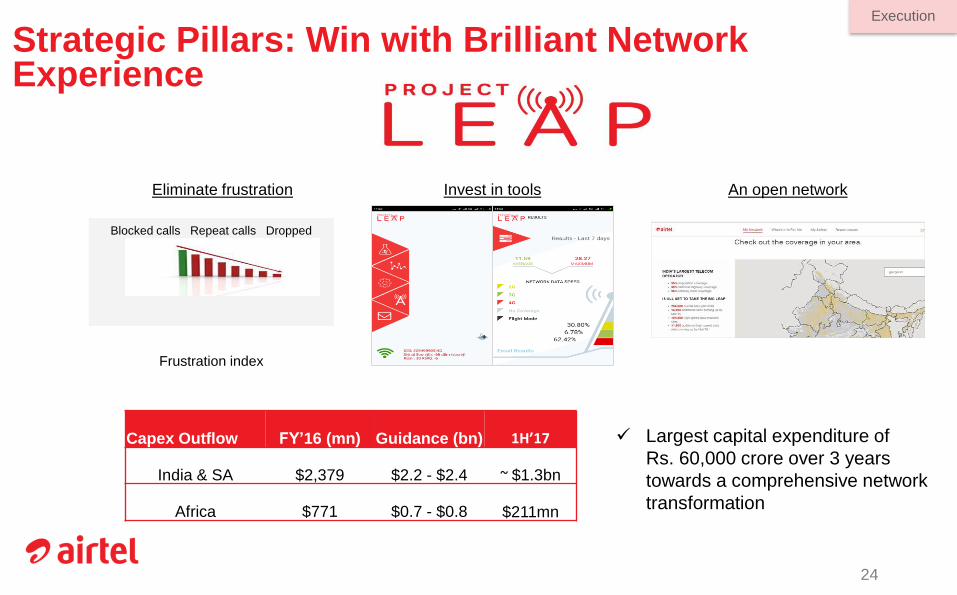
Strategic Pillars: Win with Brilliant Network Experience
Blocked calls Repeat calls Dropped
calls
Frustration index
An open networkInvest in toolsEliminate frustration
Capex Outflow FY’16 (mn) Guidance (bn) 1H’17
India & SA $2,379 $2.2 - $2.4 ~ $1.3bn
Africa $771 $0.7 - $0.8 $211mn
Largest capital expenditure of
Rs. 60,000 crore over 3 years
towards a comprehensive network
transformation
Execution
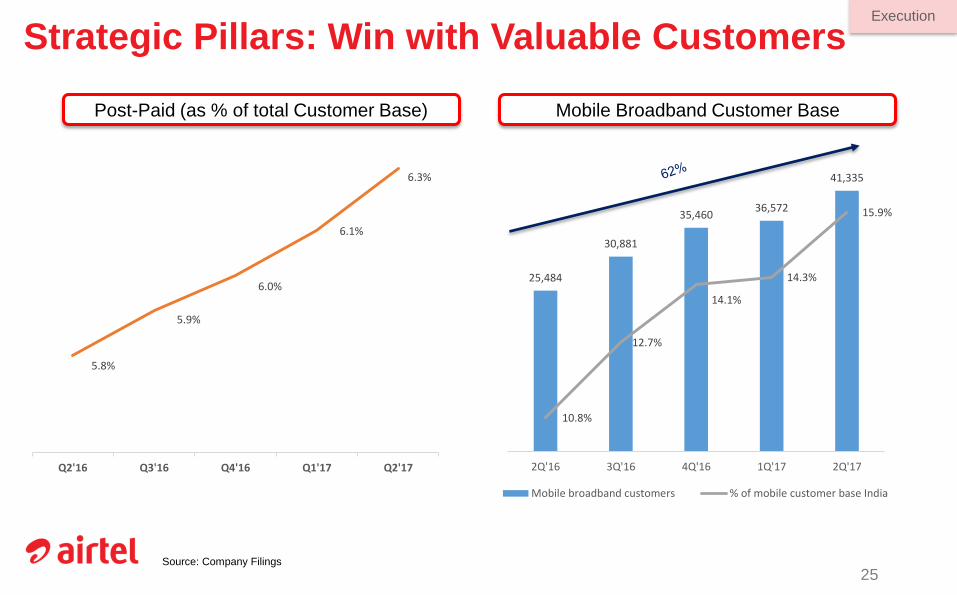
Strategic Pillars: Win with Valuable Customers
25
Execution
Source: Company Filings
5.8%
5.9%
6.0%
6.1%
6.3%
5.5%
5.6%
5.7%
5.8%
5.9%
6.0%
6.1%
6.2%
6.3%
6.4%
0
0
0
1
1
1
1
Q2'16 Q3'16 Q4'16 Q1'17 Q2'17
25,484
30,881
35,460 36,572
41,335
10.8%
12.7%
14.1%
14.3%
15.9%
10.0%
11.0%
12.0%
13.0%
14.0%
15.0%
16.0%
17.0%
0
5,000
10,000
15,000
20,000
25,000
30,000
35,000
40,000
45,000
2Q'16 3Q'16 4Q'16 1Q'17 2Q'17
Mobile broadband customers % of mobile customer base India
Mobile Broadband Customer BasePost-Paid (as % of total Customer Base)
26
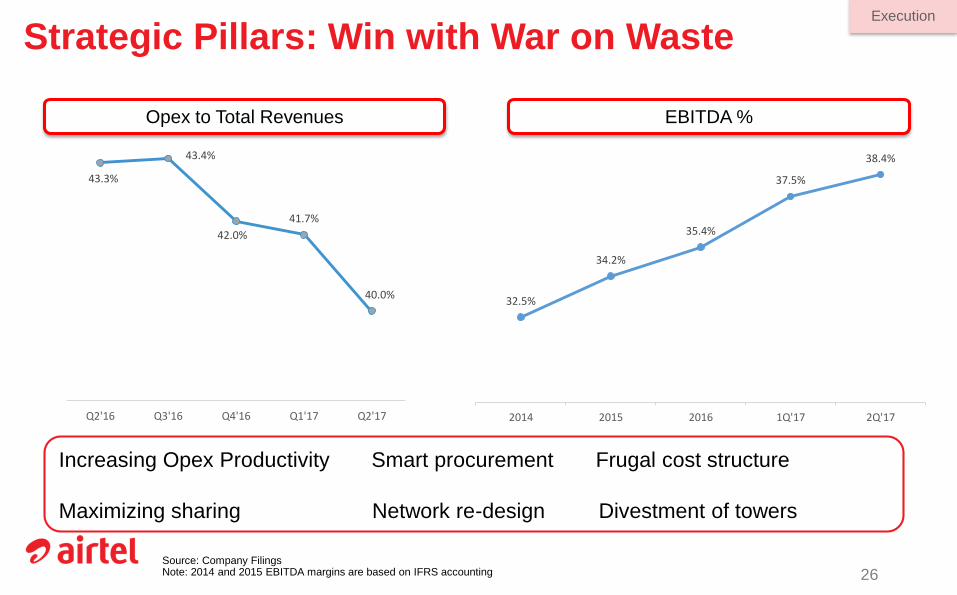
Strategic Pillars: Win with War on Waste
Increasing Opex Productivity Smart procurement Frugal cost structure
Maximizing sharing Network re-design Divestment of towers
Execution
Source: Company FilingsNote: 2014 and 2015 EBITDA margins are based on IFRS accounting
43.3%
43.4%
42.0%
41.7%
40.0%
38.0%
39.0%
40.0%
41.0%
42.0%
43.0%
44.0%
0
0.2
0.4
0.6
0.8
1
1.2
Q2'16 Q3'16 Q4'16 Q1'17 Q2'17
32.5%
34.2%
35.4%
37.5%
38.4%
2014 2015 2016 1Q'17 2Q'17
Opex to Total Revenues EBITDA %
STRONG CORPORATE
PROFILE
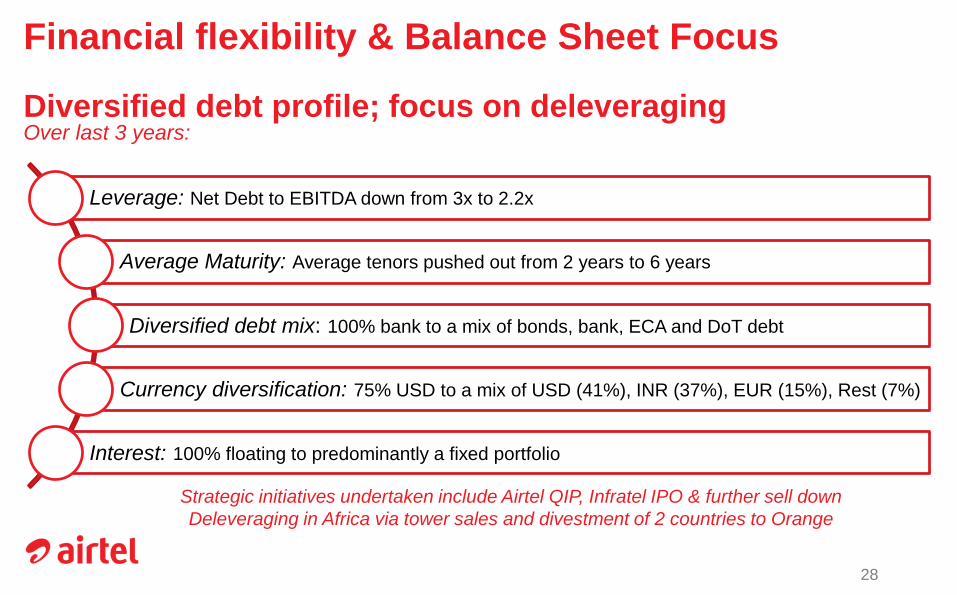
Financial flexibility & Balance Sheet Focus
Diversified debt profile; focus on deleveragingOver last 3 years:
Leverage: Net Debt to EBITDA down from 3x to 2.2x
Average Maturity: Average tenors pushed out from 2 years to 6 years
Diversified debt mix: 100% bank to a mix of bonds, bank, ECA and DoT debt
Currency diversification: 75% USD to a mix of USD (41%), INR (37%), EUR (15%), Rest (7%)
Interest: 100% floating to predominantly a fixed portfolio
28
Strategic initiatives undertaken include Airtel QIP, Infratel IPO & further sell down
Deleveraging in Africa via tower sales and divestment of 2 countries to Orange
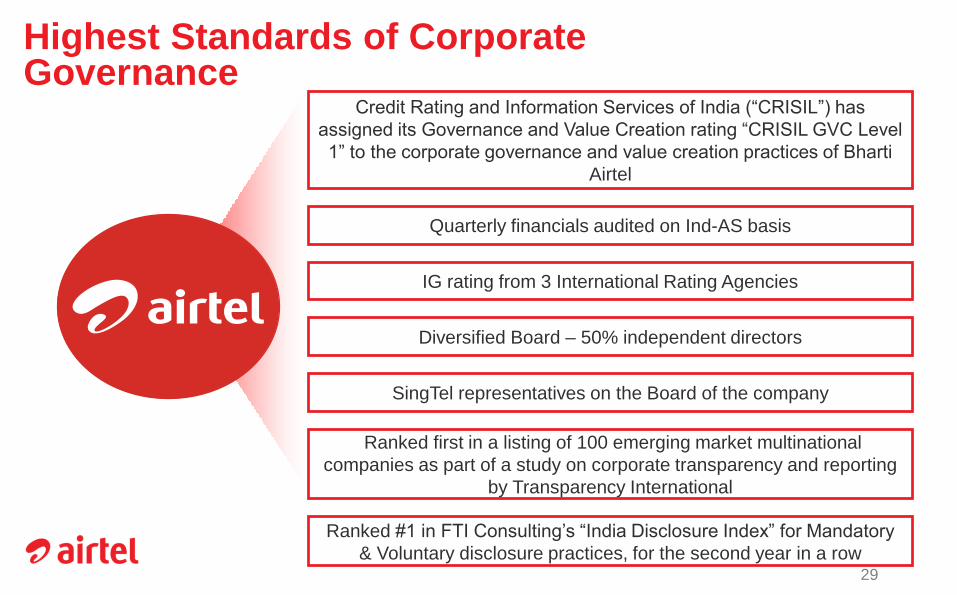
Highest Standards of Corporate Governance
Credit Rating and Information Services of India (“CRISIL”) has
assigned its Governance and Value Creation rating “CRISIL GVC Level
1” to the corporate governance and value creation practices of Bharti
Airtel
Quarterly financials audited on Ind-AS basis
Diversified Board – 50% independent directors
SingTel representatives on the Board of the company
Ranked first in a listing of 100 emerging market multinational
companies as part of a study on corporate transparency and reporting
by Transparency International
IG rating from 3 International Rating Agencies
29
Ranked #1 in FTI Consulting’s “India Disclosure Index” for Mandatory
& Voluntary disclosure practices, for the second year in a row
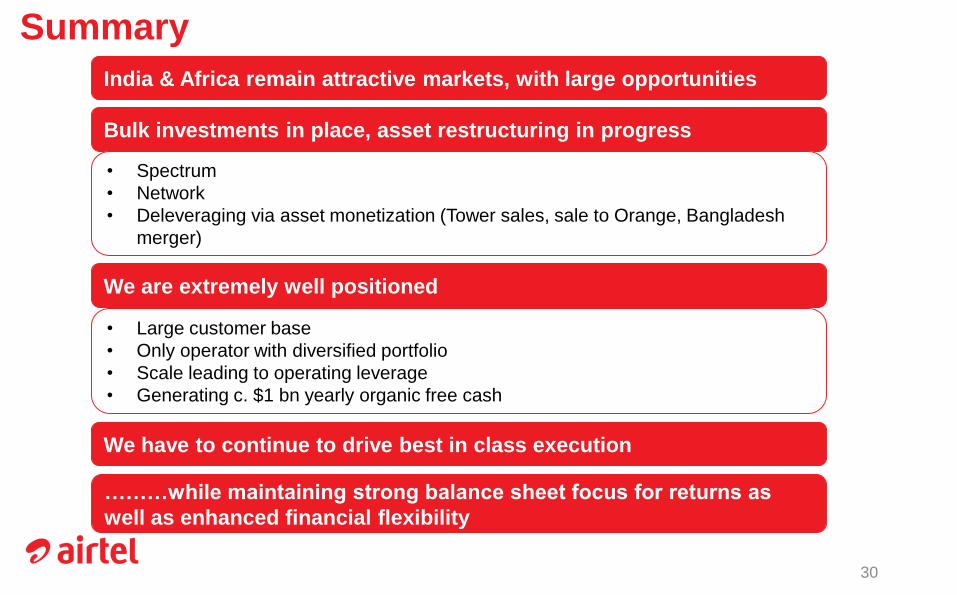
Summary
India & Africa remain attractive markets, with large opportunities
We are extremely well positioned
• Large customer base
• Only operator with diversified portfolio
• Scale leading to operating leverage
• Generating c. $1 bn yearly organic free cash
Bulk investments in place, asset restructuring in progress
• Spectrum
• Network
• Deleveraging via asset monetization (Tower sales, sale to Orange, Bangladesh
merger)
We have to continue to drive best in class execution
30
………while maintaining strong balance sheet focus for returns as
well as enhanced financial flexibility
THANK YOU