beta and gamma dose - sandia.govprod.sandia.gov/techlib/access-control.cgi/1988/881605.pdf · beta...
TRANSCRIPT
NUREG/CR-5175 SAND88-1605
-
Beta and Gamma Dose l '----------.J
Calculations for PWR and BWR Containments
Prepared by D. B. King
Sandia National Laboratories
Prepared for U.S. Nuclear Regulatory Commission
I
-
-
II
II
I
I
-
When printing a copy of any digitized SAND Report, you are required to update the
markings to current standards.
AVAILABILITY NOTICE
Availability of Reference Materials C~ed in NRC Publications
Most documents cited In NRC publications will be available from one of the following sources:
1. The NRC Public Document Room, 2120 L Street , NW, Lower Level , Washington, DC 20555
2. The Superintendent of Documents, U. S. Government PrInting Office, P.O. Box 37082 , Washington, DC 20013-7082
3. The National Technical Information Service, Springfield, VA 22161
Although the listing that follows represents the majority of documents cited In NRC publications, It Is not Intended to be exhaustive.
Referenced documents available for Inspection and copying for a fee from the NRC Public Document Room Include NRC correspondence and Internal NRC memoranda ; NRC Office of Inspection and Enforcement bulletins, circulars, Information notices , Inspection and Investigation notices; Licensee Event Reports; vendor reports and correspondence; Commission papers; and applicant and licensee documents and correspondence.
The following documents In the NUREG series are available for purchase from the GPO Sales Program: formal NRC staff and contractor reports, NRC-sponsored conference proceedings , and NRC booklets and brochures. Also available are Regulatory Guides, NRC regulations In the Code of Federal Regulations, and Nuclear Regulatory Commission Issuances.
Documents available from the National Technical Information Service Include NUREG series reports and technical reports prepared by other federal agencies and reports prepared by the Atomic Energy Commission, forerunner agency to the Nuclear Regulatory Commission .
Documents available from public and special technical libraries Include all open literature Items, such as books, journal and periodical articles, and transactions. Federal Register notices, federal and state legislatlon, and congressional reports can usually be obtained from these libraries .
Documents such as theses , dissertations, foreign reports and translations, and non-NRC conference proceedings are available for purchase from the organization sponsoring the publication cited .
Single copies of NRC draft reports are available free , to the extent of supply, upon written request to the Office of Information Resources Management, Distribution Section , U.S. Nuclear Regulatory Commission , Washington , DC 20555.
Copies of Industry codes and standards used In a substantive manner In the NRC regulatory process are maintained at the NRC Library, 7920 Norfolk Avenue, Bethesda, Maryland , and are available there for reference use by the public. Codes and standards are usually copyrlghted and may be purchased from the originating organization or, If they are American National Standards , from the American National Standards Institute , 1430 Broadway, New York, NY 10018.
DISCLAIMER NOTICE
This report was prepared as an a=unt of work sponsored by an agency of the United States Government. Neitherthe United States Government nor any agency thereof, or any of their employees, makes any warranty, expresed or implied, or assumes any legal liability of responsibility for any third party's use, or the results of such use, of any Information, apparatus, product or process disclosed In this report, or represents that its use by such third party would not Infringe privately owned rights.
1

Beta and Gamma Dose Calculations for PWR and BWR Containments
Manuscript Completed: June 1989 Date Published: July 1989
Prepared by D.B. King
Sandia National Laboratories Albuquerque, NM 87185
Prepared for Division of Engineering Office of Nuclear Regulatory Research U.S. Nuclear Regulatory Commission Washington, DC 20555 NRC FIN AI051
NVREG/CR-5175 SAND88-1605 R3,RV

Other Report in the Series
NUREG/CR-4949, "Source Term Calculations for Assessing Radiation Dose to Equipment", R.S. Denning, R. Freeman-Kelly, P. Cybulskis, L.A.Curtis, Battelle Columbus Laboratory, July 1989.
ABSTRACT
Analyses of gamma and beta dose in selected regions in PWR and BWR containment buildings have been performed for a range of fission product releases from selected severe accidents. The objective of this study was to determine the radiation dose that safety-related equipment could experience during the selected severe accident sequences. The resulting dose calculations demonstrate the extent to which design basis accident qualified equipment would also be qualified for the severe accident environments. Surry was chosen as the representative PWR plant while Peach Bottom was selected to represent BWRs. Battelle Columbus Laboratory performed the source term release analyses. The AB epsilon scenario (an intermediate to large LOCA with failure to re~over onsite or offsite electrical power) was selected as the base case surry accident, and the AE scenario (a large break LOCA with one initiating event and a combination of failures in two emergency cooling systems) was selected as the base case Peach Bottom accident. Radionuclide release was bounded for both scenarios by including spray operation and arrested sequences as variations of the base scenarios. Sandia National Laboratories used the source terms to calculate dose to selected containment regions. Scenarios with sprays operational resulted in a total dose comparable to that (2.20 x 10⁸ rads) used in current equipment qualification testing (for design basis accidents or Regulatory Guide 1.89). The base case scenarios resulted in some calculated doses roughly an order of magnitude above the current 2.20 x 10⁸ rad equipment qualification test region.
iiijiv

CONTENTS
EXECUTIVE SUMMARy ....................................................... 1
1 . 0 INTRODUCTION ...................................................... 3
2.0 SOURCE TERM CALCULATIONS .......................................... 5
2.1 Surry Source Term Calculations ............................... 5 2.2 Peach Bottom Source Term Calculations ........................ 6
3.0 RADIATION DOSE CALCULATIONAL TOOLS ................................ 7
4.0 CONTAINMENT MODELS ................................................ 9
5.0 DOSE RESULTS .............................. ; ...................... 21
5.1 Surry Dose Results .......................................... 21
5.l.l Case 1 Dose Results .... ...... . . . .22 5.l. 2 Case 2 Dose Results ........... . .. .32 5.l. 3 Case 3 Dose Results .... .... . . .. .35 5.l.4 Case 4 Dose Results ...... ......... . . . .38
5.2 Peach Bottom Dose Results ................................... 41
5.2.1 5.2.2 5.2.3
Case 1 Dose Results .................................. 41 Case 2 Dose Results .................................. 47 Case 3 and Case 4 Dose Results ....................... 49
5.3 Comments on Surry and Peach Bottom Case 1 and Case 2 Dose Results ..................................... 51
5.4 Comments on PATH and ITS Isotope Inventory .................. 52 5.5 Other Dose Rate and Dose Work ............................... 59
6.0 SUMMARY AND RECOMMENDATIONS ...................................... 63
REFERENCES ............................................................ 65
APPENDIX A ITS CONTAINMENT BUILDING ZONES ............................ A-l
APPENDIX B ADDITIONAL DOSE RATE AND DOSE FIGURES ..................... B-l
APPENDIX C AIRBORNE, WALL, FLOOR, AND SUMP CONTRIBUTIONS TO DOSE RATES FOR SELECTED CONTAINMENT LOCATIONS .......... C-l
APPENDIX D MAJOR ISOTOPE CONTRIBUTORS TO TOTAL DOSE .................. D-l
-v-

4.1 4.2 4.3 4.4 4.5 4.6 4.7
5.1.1 5.1. 2 5.1. 3 5.1.4 5.1.5 5.1.6 5.1. 7 5.1.8 5.1.9 5.1.10
5.2.1 5.2.2 5.2.3
5.4.1 5.4.2 5.4.3
A.l A.2 A.3 A.4 A.5
B.l B.2 B.3 B.4 B.5
-B.6 B.7 B.8 B.9 B.10 B.ll B.12 B.l3
LIST OF FIGURES
Surry Containment Section A ................................... 10 Surry Containment Section B ................................... 11 Surry Plan View Elevation 74.92 Feet .......................... 12 Surry Plan View Elevation 0 Feet .............................. 13 Surry Plan View Elevation 24.08 Feet .......................... 14 Surry Plan View Elevation 45.92 Feet .......................... 15 Peach Bottom Containment Section .............................. 19
Surry Case 1 Basement Total Gamma Dose ........................ 23 Surry Case 1 Basement Total Beta Dose ......................... 24 Surry Case 1 Annulus Total Gamma Dose ..•......... "'; ............ 25 Surry Case 1 Annulus Total Beta Dose .......................... 25 Surry Case 1 Operating Floor and Dome Total Gamma Dose · ....... 26 Surry Case 1 Operating Floor and Dome Total Beta Dose .- ........ 26 Surry Case 1 Steam Generator A Cubicle Gamma Total Dose ....... 28 Surry Case 1 Steam Generator A Cubicle Beta Total Dose ........ 28 Surry Case 1 RHR Cubicle Total Gamma Dose ..................... 29 Surry Case 1 RHR Cubicle Total Beta Dose ...................... 29
Peach Bottom Case 1 Drywell Total Gamma Dose .................. 42 Peach Bottom Case 1 Drywell Total Beta Dose ................... 43 Peach Bottom Case 1 Wetwell Total Gamma Dose .................. 44
Reg Guide 1.89 Noble Gas Gamma and Beta Dose .................. 60 Surry Case 4 Annulus Total Gamma and Beta Dose ................ 61 Surry Case 4 Dome Total Gamma and Beta Dose ........... _ ....... 62
Surry Containment Zones for Surface Sources .................. A-2 Surry Containment Zones for Floor Sources .................... A-3 Surry Steam Generator A Cubicle Zones ........................ A-4 Peach Bottom Drywell Zones for Surface Sources ............... A-5 Peach Bottom Drywell Zones for Floor Sources ................. A-6
Surry Case 1 Basement Gamma Dose Rate ................. , ...... B-l Surry Case 1 Basement Beta Dose Rate ., ....................... B-2 Surry Case 1 Annulus Gamma Dose Rate ......................... B-3 Surry Case 1 Annulus Beta Dose Rate .......................... B-3 Surry Case 1 Operating Floor and Dome Gamma Dose Rates · ...... B-4 Surry Case 1 Operating Floor and Dome Beta Dose Rates ........ B-4 Surry Case 1 Steam Generator A Cubicle Gamma Dose Rates ...... B-5 Surry Case 1 Steam Generator A Cubicle Beta Dose Rates · ...... B-5 Surry Case 1 RHR Cubicle Gamma Dose Rates .................... B-6 Surry Case 1 RHR Cubicle Beta Dose Rates ..................... B-6 Surry Case 1 Steam Generator B Gamma Dose Rate ............... B-7 Surry Case 1 Steam Generator B Beta Dose Rate .... -............ B-7 Surry Case 1 Steam Generator B Total Gamma Dose ....... , ...... B-B
-vi-
B.l4 B.lS
B.l6
B.l7
B.l8
B.l9 B.20 B.2l B.22 B.23 B.24 B.2S B.26 B.27
B.28 B.29 B.30 B.3l B.32 B.33 B.34 B.3S B.36 B.37 B.38 B.39 B.40 B.4l B.42 B.43
B.44
B.4S
B.46
B.47 B.48 B.49 B.SO
LIST OF FIGURES (Continued)
Surry Case 1 Steam Generator B Total Beta Dose ............... B-8 Surry Case 1 In-Core Instrumentation Room Gamma Dose Rate .............................. ',' .................... B- 9 Surry Case 1 In-Core Instrumentation Room Beta Dose Rate ..................... " ............................. B-9 Surry Case 1 In-Core Instrumentation Room Total Gamma Dose .................................................. B-lO Surry Case 1 In-Core Instrumentation Room Total Beta Dose ................................................... B-lO Surry Case 2 Basement Gamma Dose Rate ....................... B-ll Surry Case 2 Basement Beta Dose Rate ........................ B-ll Surry Case 2 Basement Total Gamma Dose ...................... B-l2 Surry Case 2 Basement Total Beta Dose ....................... B-l2 Surry Case 2 Annulus Gamma Dose Rate ........................ B-l3
Surry Case 2 Annulus Beta Dose Rate ........................ B-l3 Surry Case 2 Annulus Total Gamma Dose ....................... B-l4 Surry Case 2 Annulus Total Beta Dose ........................ B-l4 Surry Case 2 Operating Floor and Dome Gamma Dose Rate ................................................... B-lS Surry Case 2 Operating Floor and Dome Beta Dose Rate ........ B-lS Surry Case 2 Operating Floor and Dome Total Gamma Dose ...... B-l6 Surry Case 2 Operating Floor and Dome Total Beta Dose ....... B-l6 Surry Case 2 Steam Generator A Gamma Dose Rate .............. B-l7 Surry Case 2 Steam Generator A Beta Dose Rate ............... B-l7 Surry Case 2 Steam Generator A Total Gamma Dose ............. B-l8 Surry Case 2 Steam Generator A Total Beta Dose .............. B-l8 Surry Case 2 RHR Cubicle Gamma Dose Rate .................... B-l9 Surry Case 2 RHR Cubicle Beta Dose Rate ..................... B-l9 Surry Case 2 RHR Cubicle Total Gamma Dose ................... B-20 Surry Case 2 RHR Cubicle Total Beta Dose .................... B-20 Surry Case 2 Steam Generator B Gamma Dose Rates ............. B-2l Surry Case 2 Steam Generator B Beta Dose Rates .............. B-2l Surry Case 2 Steam Generator B Total Gamma Dose ............. B-22 Surry Case 2 Steam Generator B Total Beta Dose .............. B-22 Surry Case 2 In-Core Instrumentation Room Gamma Dose Rates .................................................. B-23 Surry Case 2 In-Core Instrumentation Room Beta Dose Rates .................................................. B- 23 Surry Case 2 In-Core Instrumentation Room Total Gamma Dose .................................................. B- 24 Surry Case 2 In-Core Instrumentation Room Total Beta Dose ................................................... B- 24 Surry Case 3 Basement Gamma Dose Rate ....................... B-2S Surry Case 3 Basement Beta Dose Rate ........................ B-2.S Surry Case 3 Basement Total Gamma Dose ...................... B-26 Surry Case 3 Basement Total Beta Dose ....................... B-26
-vii-
B.5l B.52 B.53 B.54 B.5S
B.56
B.57
B.58
B.59 B.60 B.6l B.62 B.63 B.64 B.65 B.66 B.67 B.68 B.69 B.70 B.71
B.72
B.73
B.74
B.75 B.76 B.77 B.78 B.79 B.80 B.8l B.82 B.83 B.84 B.85 B.86 B.87 B.88
..
LIST OF FIGURES (Continued)
Surry Case 3 Annulus Gamma Dose Rate ........................ B-27 Surry Case 3 Annulus Beta Dose Rate ......................... B-27 Surry Case 3 Annulus Total Gamma Dose ....................... B-28 Surry Case 3 Annulus Total Beta Dose ........................ B-28 Surry Case 3 Operating Floor and Dome Gamma Dose Rate ................................................... B-29 Surry Case 3 Operating Floor and Dome Beta Dose Rate ................................................... B-29 Surry Case 3 Operating Floor and Dome Total Gamma Dose .................................................. B-30 Surry Case 3 Operating Floor and Dome Total Beta Dose ................................................... B - 30 Surry Case 3 Steam Generator A Gamma Dose Rate .............. B-3l Surry Case 3 Steam Generator A Beta Dose Rate ............... B-3l Surry Case 3 Steam Generator A Total Gamma Dose ............. B-32 Surry Case 3 Steam Generator A Total Beta Dose .............. B-32 Surry Case 3 Steam Generator B Gamma Dose Rate .............. B-33 Surry Case 3 Steam Generator B Beta Dose Rate ............... B-33 Surry Case 3 Steam Generator B Total Gamma Dose ............. B-34 Surry Case 3 Steam Generator B Total Beta Dose .............. B-34 Surry Case 3 RHR Cubicle Gamma Dose Rate .................... B-35 Surry Case 3 RHR Cubicle Beta Dose Rate ..................... B-35 Surry Case 3 RHR Cubicle Total Gamma Dose ................... B-36 Surry Case 3 RHR Cubicle Total Beta Dose .................... B-36 Surry Case 3 Incore Instrumentation Room Gamma Dose Rate ................................................... B-37 Surry Case 3 Incore Instrumentation Room Beta Dose Rate ................................................... B-37 Surry Case 3 Incore Instrumentation Room Total Gamma Dose .................................................. B- 38 Surry Case 3 Incore Instrumentation Room Total Beta Dose ................................................... B-38 Surry Case 4 Basement Gamma Dose Rate ....................... B-39 Surry Case 4 Basement Beta Dose Rate ........................ B-39 Surry Case 4 Annulus Gamma Dose Rate ........................ B-40 Surry Case 4 Annulus Beta Dose Rate ......................... B-40 Surry Case 4 Basement Gamma Total Dose ...................... B-4l Surry Case 4 Annulus To-tal Gamma Dose ....................... B-4l Surry Case 4 Operating and Dome Gamma Dose Rate ............. B-42 Surry Case 4 Operating Floor and Dome Beta Dose Rate ........ B-42 Surry Case 4 Operating Floor and Dome Gamma Total Dose ...... B-43 Surry Case 4 Operating Floor and Dome Beta Total Dose ....... B-43 Surry Case 4 Steam Generator A Gamma Dose Rate .............. B-44 Surry Case 4 Steam Generator A Beta Dose Rate ............... B-44 Surry Case 4 Steam Generator A Gamma Total Dose ............. B-45 Surry Case 4 Steam Generator A Beta Total Dose .............. B-4S
-viii-

LIST OF FIGURES (Concluded)
B.89 Surry Case 4 Steam Generator B Gamma Dose Rate .............. B-46 B.90 Surry Case 4 Steam Generator B Beta Dose Rate ............... B-46 B.91 Surry Case 4 Steam Generator B Total Gamma Dose ............. B-47 B.92 Surry Case 4 Steam Generator B Total Beta Dose .............. B-47 B.93 Surry Case 4 RHR Cubicle Gamma Dose Rate .................... B-48 B.94 Surry Case 4 RHR Cubicle Beta Dose Rate ..................... B-48 B.95 Surry Case 4 RHR Cubicle Total Gamma Dose ................... B-49 B.96 Surry Case 4 RHR Cubicle Total Beta Dose .................... B-49 B.97 Surry Case 4 Incore Instrumentation Room Gamma
Dose Rate ................................................... B-50 B.98 Surry Case 4 Incore Instrumentation Room Beta
Dose Rate ................................................... B-50 B.99 Surry Case 4 Incore Instrumentation Room Total
B.100
B.101 B.102 B.103 B.104 B.l05 B.106 B.107 B.108 B.109 B.110 B.l11 B.112 B.113 B.114 B.115 B.116 B.117 B.118 B.119 B.120 B.121 B.122 B.123 B.124
Gamma Dose .................................................. B-51 Surry Case 4 Incore Instrumentation Room Total Beta Dose ................................................... B-51 Peach Bottom Case 1 Drywe11 Gamma Dose Rates · ............... B-52 Peach Bottom Case 1 Drywe11 Total Gamma Dose · ............... B-53 Peach Bottom Case 1 Drywe11 Beta Dose Rates " ...... " ....... B-54 Peach Bottom Case 1 Drywe11 Total Beta Dose · ................ B-55 Peach Bottom Case 1 Wetwe11 Gamma Dose Rate · ................ B-56 Peach Bottom Case 1 Wetwe11 Total Gamma Dose .,. " ...... " ... B-57 Peach Bottom Case 2 Drywe11 Gamma Dose Rate ....... '" ....... B-58 Peach Bottom Case 2 Drywe11 Total Gamma Dose ... " .. " ....... B-59 Peach Bottom Case 2 Drywe11 Beta Dose Rate .................. B-60 Peach Bottom Case 2 Drywe11 Total Beta Dose ................. B-61 Peach Bottom Case 2 Wetwe11 Gamma Dose Rates · ............... B-62 Peach Bottom Case 2 Wetwe11 Total Gamma Doses ............... B-63 Peach Bottom Case 3 Drywe11 Gamma Dose Rates · ............... B-64 Peach Bottom Case 3 Drywe11 Total Gamma Dose · ............... B-65 Peach Bottom Case 3 Drywe11 Beta Dose Rates · ................ B-66 Peach Bottom Case 3 Drywe11 Total Beta Dose · ................ B-67 Peach Bottom Case 3 Wetwe11 Gamma Dose Rate · ... " ........... B-68 Peach Bottom Case 3 Wetwell Total Gamma Dose · ............... B-69 Peach Bottom Case 4 Drywe11 Gamma Dose Rate ................. B-70 Peach Bottom Case 4 Drywe11 Beta Dose Rate .................. B-70 Peach Bottom Case 4 Drywe11 Total Gamma Dose · ............... B-7l Peach Bottom Case 4 Drywe11 Total Beta Dose '" .............. B-71 Peach Bottom Case 4 Wetwe11 Gamma Dose Rate · .. , ............. B-72 Peach Bottom Case 4 Wetwe11 Total Gamma Dose · ............... B-72
-ix-

4.1 4.2 4.3 5.1 5.2 5.3 5.4 5.5 5.6 5.7 5.8 5.9 C.l C.2 C.3 C.4 C.5 C.6 C.7
C.8
C.9 C.10 C.ll C.12 C .13 C.14 C.15 C.16 C.l7
C.18
C.19 C.20 C.21 C.22 C.23 C.24 C.25 C.26 C.27 C.28 C.29 C.30
LIST OF TABLES
Surry Compartment Identification ............................ 16 Surry Dose Point Locations .................................. 17 Peach Bottom Dose Point Locations ........................... 20 Case 1 Dose Rate and Total Dose .............................. 30 Case 2 Dose Rate and Total Dose.............................. 33 Case 3 Dose Rate and Total Dose .............................. 36 Case 4 Dose Rate and Total Dose .......................... , ... 39 Peach Bottom Case 1 Dose Rate and Dose ....................... 46 Peach Bottom Case 2 Dose Rate and Total Dose ................. 48 Peach Bottom Case 3 Dose Rate and Total Dose ............... " 50 Radionuclide Inventory Calculated by BCL .................... 54 Gamma Total Energies Used by PATH ........................... 56 Surry Case 1 Basement Gamma Dose Rates ...................... C-l Surry Case 1 Basement Beta Dose Rates ....................... C-2 Surry Case 1 Annulus Gamma Dose Rates ....................... C-3 Surry Case 1 Annulus Beta Dose Rates ................... ..... C-4 Surry Case 1 Dome Gamma Dose Rates .......................... C-5 Surry Case 1 Dome Beta Dose Rates ........................... C-6 Surry Case 1 Steam Generator A Cubicle Gamma Dose Rates ...................................................... . C-7 Surry Case 1 Steam Generator A Cubicle Beta Dose Rates ....................................................... C-8 Surry Case 1 RHR Cubicle Gamma Dose Rates ................... C-9 Surry Case 1 RHR Cubicle Beta Dose Rates ................... C-lO Surry Case 2 Basement Gamma Dose Rates ..................... C-ll Surry Case 2 Basement Beta Dose Rates ...................... C-12 Surry Case 2 Annulus Gamma Dose Rates ...................... C-13 Surry Case 2 Annulus Beta Dose Rates ....................... C-14 Surry Case 2 Dome Gamma Dose Rates ......................... C-15 Surry Case 2 Dome Beta Dose Rates .......................... C-16 Surry Case 2 Steam Generator A Cubicle Gamma Dose Rates ...................................................... C-17 Surry Case 2 Steam Generator A Cubicle Beta Dose Rates ...................................................... C-18 Surry Case 3 Basement Gamma Dose Rate ...................... C-19 Surry Case 3 Annulus Gamma Dose Rate ....................... C-20 Surry Case 4 Basement Gamma Dose Rate ...................... C-2l Surry Case 4 Annulus Gamma Dose Rate ....................... C-22 Peach Bottom Case 1 Drywell Gamma Dose Rates ............... C-23 Peach Bottom Case 1 Drywell Beta Dose Rates ................ C-26 Peach Bottom Case 1 Wetwell Gamma Dose Rates ............... C-28 Peach Bottom Case 2 Drywell Gamma Dose Rates ............... C-29 Peach Bottom Case 2 Drywell Beta Dose Rates ................ C-33 Peach Bottom Case 2 Wetwell Gamma Dose Rates .............. . C-35 Peach Bottom Case 3 Wetwell Gamma Dose Rates ............... C-36 Peach Bottom Case 4 Wetwell Gamma Dose Rates ............ ... C-37
-x-
LIST OF TABLES (Concluded)
D.l Surry Major Radionuclide Contributors to Gamma Dose ......... D-l D.2 Surry Major Radionuclide Contributors to Beta Dose .......... D-S D.3 Peach Bottom Drywell Major Radionuclide
Contributors to Gamma Dose .................................. D-9 D.4 Peach Bottom Drywell Radionuclide Contributors
to Beta Dose ............................................... D-13 D.S Peach Bottom Wetwell Major Radionuclide Contributors
to Gamma Dose .............................................. D-17 D.6 Peach Bottom Wetwell Major Radionuclide Contributors
to Beta Dose ............................................... D-21
-xi-

Acknowledgment
This study could not have been completed without the assistance of Sarah Higgins -and Mike Luker of Sandia National Laboratories. I thank them for their patience, enthusiasm, and inexhaustible supply of energy.
-xii-

EXECUTIVE SUMMARY
Analytical investigations of potential beta and gamma radiation dose to selected regions in PWR and BWR containment buildings have been conducted for a range of fission product releases from selected severe accidents. Total dose was calculated for the selected severe accident sequences using NUREG-0956 methods. Battelle Columbus Laboratory (BCL) has calculated time-dependent distributions of radionuclides within containment following severe accident scenarios using the NRC source term code package. The selected LWR severe accident conditions did not satisfy the design basis accident (DBA) criteria but were realistic estimates of severe accidents that have many characteristics of the prescribed DBA as used in the equipment qualification rule lOCFR50.49 and Regulatory Guide 1.89. Sandia National Laboratories (SNL) used the resulting radionuclide distributions to calculate radiation dose in containment. The dose calculation results provide a basis to evaluate the extent to which DBA qualified equipment is also qualified for the selected severe accident environments.
Surry was chosen to be the representative PWR plant because it is one of the NuREG-1150 reference plants for which many source term code package analyses have been performed. Peach Bottom was selected as a representative BWR plant due to available source term code package work that supported the preparation of NUREG-0956. Both plants have been extensively analyzed and are representative of a large number of plants.
The accident scenario selected by BCL for the PWR analysis was the AB epsilon scenario. The AB epsilon scenario is an intermediate to large LOCA with failure to recover onsite or offsite electrical power. BCL noted that this scenario would produce the most severe radionuclide release into containment. Three additional variations of the AB epsilon scenario were developed to envelope the radionuclide release for less severe accidents. The first variation investigated the effect of reestablishing core cooling and arresting the sequence before vessel failure by removing all radionuclide contribution from the core-concrete attack period. Variation two simulated spray operation with full core meltdown. All airborne activity (except noble gas activity) and surface activity were washed to the sump. The third variation was an arrested sequence with spray operation. No leakage from containment to the environment was assumed in any of the cases.
The BWR accident scenario selected to determine radionuclide relea·se to containment was the AE sequence. The AE sequence is a large break LOCA with one initiating event and a combination of failures in two emergency cooling systems. The AE sequence is analogous to the PWR AB sequence. Three additional variations of the AE scenario were also developed to bound the radionuclide release. These variations were identical in nature to the PWR variations for no core-concrete attack and containment spray operation.
Calculated radionuclide releases for the source terms were time dependent locational distributions within containment following the accident. Locational distribution refers to airborne radionuclide release, radionuclide plateout on walls, radionuclide deposition to floors, or radionuclide release washed into the sump. The BCL Surry PWR source term

calculations treated the containment as a single volume and the Peach Bottom BWR source term calculations treated the containment as two volumes (the drywell and wetwell).
Gamma dose rate was calculated by Sandia using the PATH point kernel code. PATH calculations are based upon exponential attenuation from source point to dose point with appropriate adjustment by buildup factors. PATH was developed at General Atomic. Beta dose rates were calculated using the ITS code. ITS calculations use Monte Carlo solution of linear time-integrated electron radiation transport.
Combinational geometry subroutines in PATH and ITS allowed true modeling of each room or containment region in both Surry and Peach Bottom. Major structures such as walls, ceilings, and floors were modeled for each containment. Rooms and containment regions were generally further divided into subzones for beta dose calculations.
The results of this study represent a scoping effort and provide approximate estimate of dose. The radionuclide release for the airborne, plateout, and waterborne sources was assumed to be uniformly distributed throughout containment at each calculational time period. Containment models were kept relatively simple due to the scoping nature of this study. The calculations do allow the effects of engineering safety features (ESF) operation from case to case to be compared. The effect of compartment size and structure on dose 'Will also be evident from the results.
The accident scenario calculations with sprays operational for the Surry PWR resulted in a maximum total dose of 2.60 X 10⁸ rads in interior compartments, 1.80 X 10⁸ rads in the basement, 2.3 X 10⁸ rads in the annulus, and 7.3 X 10⁷ rads in the dome region. Maximum Peach Bottom total dose during spray operation was calculated to be 1.10 x 10⁸ rads in the drywell. For comparison, Reg Guide 1. 89, Appendix D, sugges ts an equipment qualification dose of 2.20 X 10⁸ rads. Safety-related equipment is currently tested through -2.2 x 10⁸ rads. Radionuclide release to containment during spray operation appears to pose no significant challenge to equipment tested to 2.20 X i08 rads.
The base Surry AB epsilon severe accident scenario calcu~ations resulted in maximum total doses of 2.3 x 10⁹ rads in interior c6mpartments, 3 x 10⁹ rads in the basement, 1.2 X 10⁹ rads in the annulus, and 1.7 x 10⁹
rads in the dome region. Peach Bottom severe accident calculations resulted in a maximum total dose of 1.8 x 10⁹ rads in the drywell. The calculated total dose is roughly an order of magnitude above current equipment qualification testing limits.
The results from this study suggest two follow-on tasks. Studies designed to calculate the physical transport of radionuclides from the release point in containment to other parts of containment should be performed. Assuming instantaneous radionuclide dispersement in containment results in low dose rate calculations in the release zone and conservative dose rate calculations far from the release point. The base case Surry and Peach Bottom beta surface dose rate calculations should be re-examined with more finely divided zoned regions; this exercise should result in improved (and possibly lower) dose calculations.
-2-
1.0 INTRODUCTION
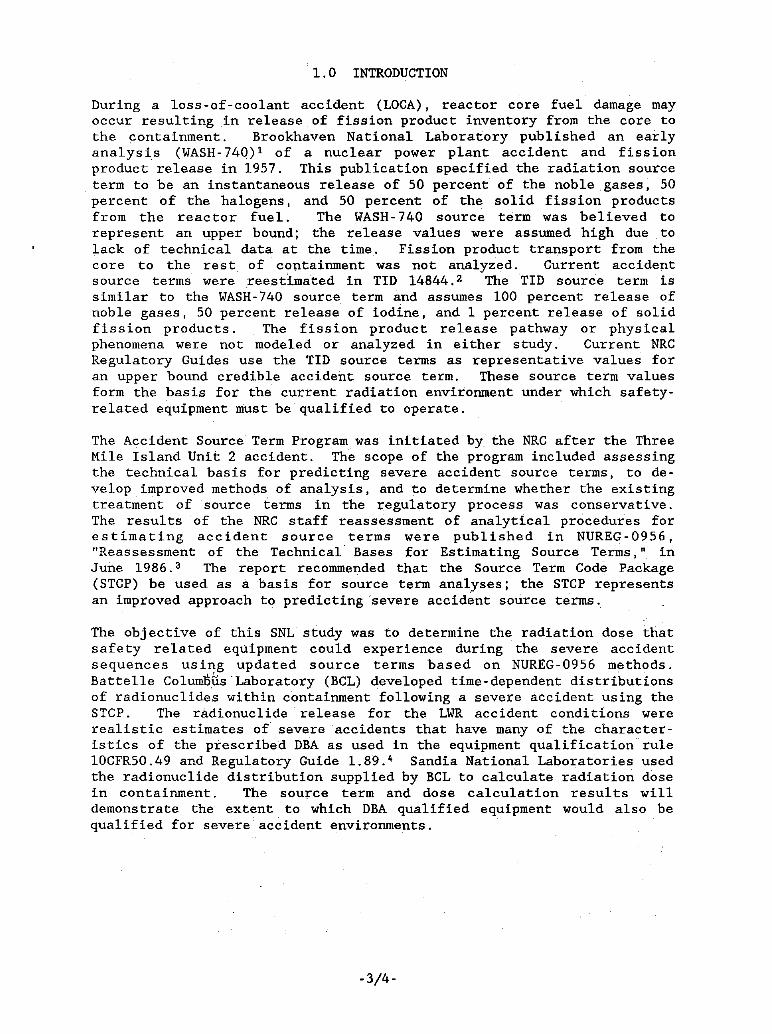
During a loss-of-coolant accident (LOCA), reactor core fuel damage may occur resulting in release of fission product inventory from the core to the containment. Brookhaven National Laboratory published an early analysis (WASH-740)1 of a nuclear power plant accident and fission product release in 1957. This publication specified the radiation source term to be an instantaneous release of 50 percent of the noble gases, 50 percent of the halogens, and 50 percent of the solid fission products from the reactor fuel. The WASH-740 source term was believed to represent an upper bound; the release values were assumed high due to lack of technical data at the time. Fission product transport from the core to the rest of containment was not analyzed. Current accident source terms were reestimated in TID 14844.2 The TID source term is similar to the WASH-740 source term and assumes 100 percent release of noble gases, 50 percent release of iodine, and 1 percent release of solid fission products. The fission product release pathway or physical phenomena were not modeled or analyzed in either study. Current NRC Regulatory Guides use the TID source terms as representative values for an upper bound credible accident source term. These source term values form the basis for the current radiation environment under which safetyrelated equipment must be qualified to operate.
The Accident Source Term Program was initiated by the NRC after the Three Mile Island Unit 2 accident. The scope of the program included assessing the technical basis for predicting severe accident source terms, to develop improved methods of analysis, and to determine whether the existing treatment of source terms in the regulatory process was conservative. The results of the NRC staff reassessment of analytical procedures for estimating accident source terms were published in NUREG-0956, "Reassessment of the Technical' Bases for Estimating Source Terms," in June 1986. 3 The report recommended that the Source Term Code Package (STCP) be used as a basis for source term analyses; the STCP represents an improved approach to predicting severe accident source terms.
The objective of this SNL study was to determine the radiation dose that safety related equipment could experience during the severe accident sequences using updated source terms based on NUREG-0956 methods. Battelle ColumBb.sLaboratory (BCL) developed time-dependent distributions of radionuclides within containment following a severe accident using the STCP. The radionuclide release for the LWR accident conditions were realistic estimates of severe accidents that have many of the characteristics of the prescribed DBA as used in the equipment qualification rule 10CFR50.49 and Regulatory Guide 1. 89. 4 Sandia National Laboratories used the radionuclide distribution supplied by BCL to calculate radiation dose in containment. The source term and dose calculation results will demonstrate the extent to which DBA qualified equipment would also be qualified for severe accident environments.
-3/4-

2.0 SOURCE TERM CALCULATIONS
Source term calculations were performed for a PWR containment (Surry) and a BWR containment (Peach Bottom). Surry was chosen as a representative PWR containment because it is one of the NUREG-1150 reference plants for which a number of STCP analyses have been performed. Peach Bottom was also chosen due to STCP work performed to support the preparation of NUREG-0956. Both plants have been extensively analyzed and are representative of a large number of plants.
2.1 Surry Source Term Calculations
Three accident scenarios were considered for the Surry source term calculations: AB epsilon, S2D epsilon, and TMLB epsilon. BCL concluded that the AB epsilon scenario would provide the best basis for analyzing equipment radiation dose and dose rates. BCL noted that the AB epsilon scenario involved the fastest core meltdown due to early core uncovery, there was little radionuclide retention in the reactor coolant system, there was no overlying pool of water in the reactor cavity which could scrub out the released radionuclides, and there was no operation of containment sprays which could lead to rapid removal of airborne radionuclides. The conditions listed above would produce a radionuclide release into containment simulating a severe accident.
Four variations of the AB epsilon scenario were developed to provide an envelope of radionuclide release. Case 1 STCP was the base case with full core meltdown; the results were taken directly from the STCP analyses. No leakage to the environment from containment was assumed; therefore, the results were renormalized to account for· any predicted leakage to the environment by the STCP analyses. The Case 1 calculation ended at 24 hours at which time airborne radionuclides other than the noble gases were assumed to be deposited to surfaces. Case 2 investigated the effect of reestablishing core cooling and arresting the sequence without RPV failure. The radionuclide contribution from the core-concrete attack period was thus removed. Case 3 simulated containment spray operation by removing all airborne radioactivity (except noble gas activity) instantaneously to the sump. No activity was assumed to remain on the containment surfaces. Case 3 also involved full core meltdown. Case 4 was an arrested sequence with spray operation and simulated a design basis accident. Airborne activity in Case 4 was transferred directly to the sump and no activity was assumed on the containment surfaces.
For all cases, ORIGEN2 calculations were performed to determine the time dependent inventory of radionuclides during the first year following the accident. The ORIGEN2 calculations were needed because the codes used to calculate dose rate to equipment require the activity of all released radionuclides as a function of time.
-5-

2.2 Peach Bottom Source Term Calculations
BCL selected the AE sequence to use for calculating radionuclide release to containment for a severe accident. The AE sequence is analogous to the PWR AB sequence. The characteristics of the AE sequence which made it appropriate to use as a base case are early core uncovery and fission product release, little retention in the reactor coolant system, direct release of radionuclides to the drywell during the in-vessel melting period, large ex-vessel release of fission products, and no operation of the drywell spray.
Four variations of the AE sequence were also developed to bound the radionuclide release to containment. Case 1 was the base case with full core meltdown. Any leakage which was predicted to occur after containment failure by the STCP was reassigned to the airborne species in the drywell. Case 2 was an arrested sequence; the contribution due to the core-concrete attack was removed from the results. Case 3 simulated drywell spray operation by removing all airborne radionuclides to the suppression pool. No activity was assumed to remain on the drywell surfaces. Full core meltdown was assumed. Case 4 simulated an arrested sequence with drywell sprays operating and approximates a design basis accident.
An ORIGEN2 calculation was also performed for the Peach Bottom Source term calculations.
Sections 1.0 and 2.0 of the text have summarized the text from NUREG/CR-4949, "Source Term Calculations for Assessing Radiation Dose to Equipment. " This work was performed by Battelle Columbus Laboratory. The reader is referred to NUREG/CR-4949 for greater detail regarding the source term calculations.
Source term is defined in this report to be the release of radioactive material from the core to the containment. Release of radioactive material from the containment to the environment was not considered in this report.
Radionuclide releases for the source terms were time-dependent locational distributions within containment following the severe accident. The locational distributions refer to airborne radionuclide release, radionuclide diffusion to walls, radionuclide deposition to floors, and radionuclide release to the sump. The Surry PWR source term calculations treated the containment as a single volume and the Peach Bottom BWR source term calculations treated the containment as two volumes (the drywell and thewetwell).
-6-

3.0 RADIATION DOSE CALCULATIONAL TOOLS
Two computer codes were used to calculate radiation dose rate in containment for the radioactive beta and gamma fission product source terms calculated by BCL. One code (PATH) was used to calculate gamma dose rate, and the second code (ITS) was used to calculate beta dose rate.
The PATH5 code is a shielding code which uses the common point-kernel integration technique to treat gamma radiation from reactors, radioactive components, and complex piping systems. The code is based upon exponential attenuation from source point to dose point with appropriate adjustment by buildup factors. PATH's major features include complex geometry capability, various source options, and an extensive data library for radionuclides. The PATH code was developed by the General Atomic Company.
Beta or electron dose rates were calculated using ITS6, "The Integrated Series of Coupled Electron/Photon Monte Carlo Transport Codes." This series of codes allow the state-of-the-art Monte Carlo solution of linear time - integrated coupled electron/photon radiation transport problems. Physical rigor of the codes has been maintained by using the best available cross sections and sampling distributions as well as the most complete physical model for describing the production and transport of electron/photon cascade from 1. 0 GeV to 1. 0 keV. The particular code version chosen out of the integrated TIGER series (ITS) was ACCEPT. The ACCEPT code provides the ability to calculate electron transport through three -dimensional multimaterial geometries. The ITS was developed at Sandia National Laboratories.
-7/8-
o ,
4.0 CONTAINMENT MODELS
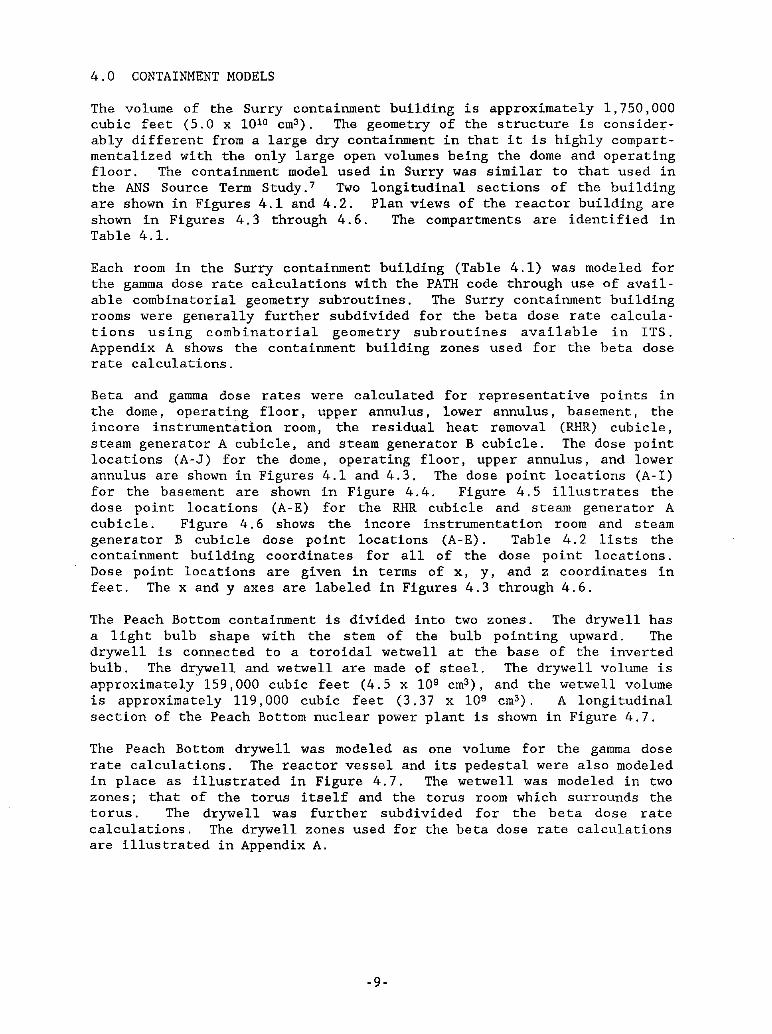
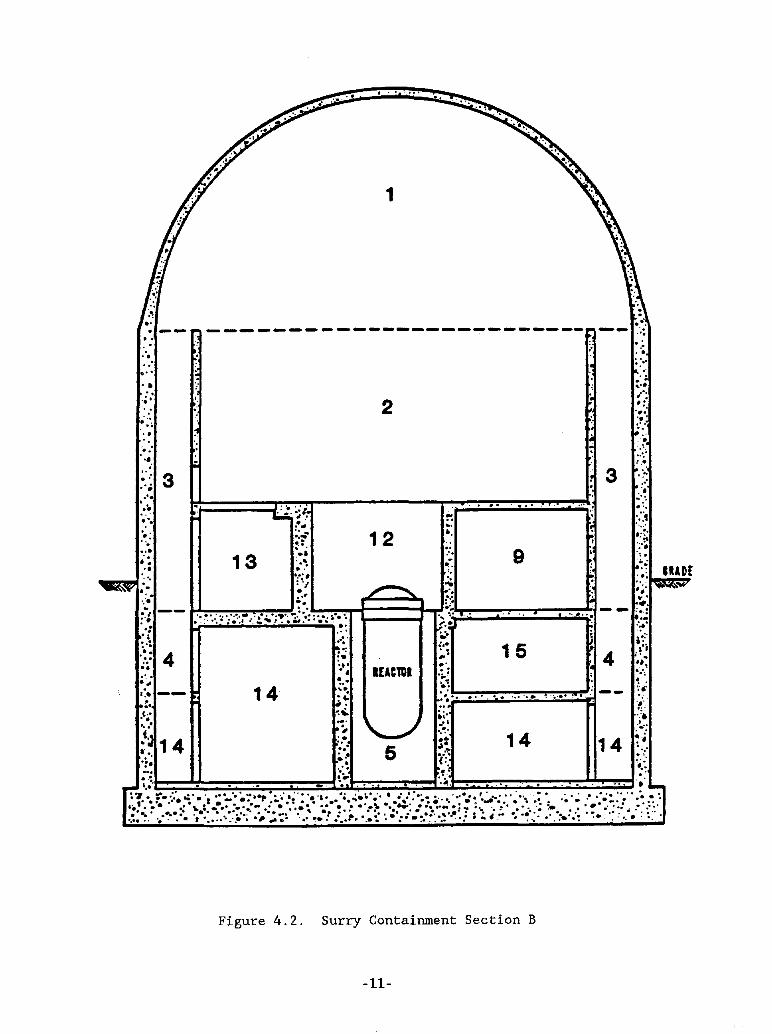
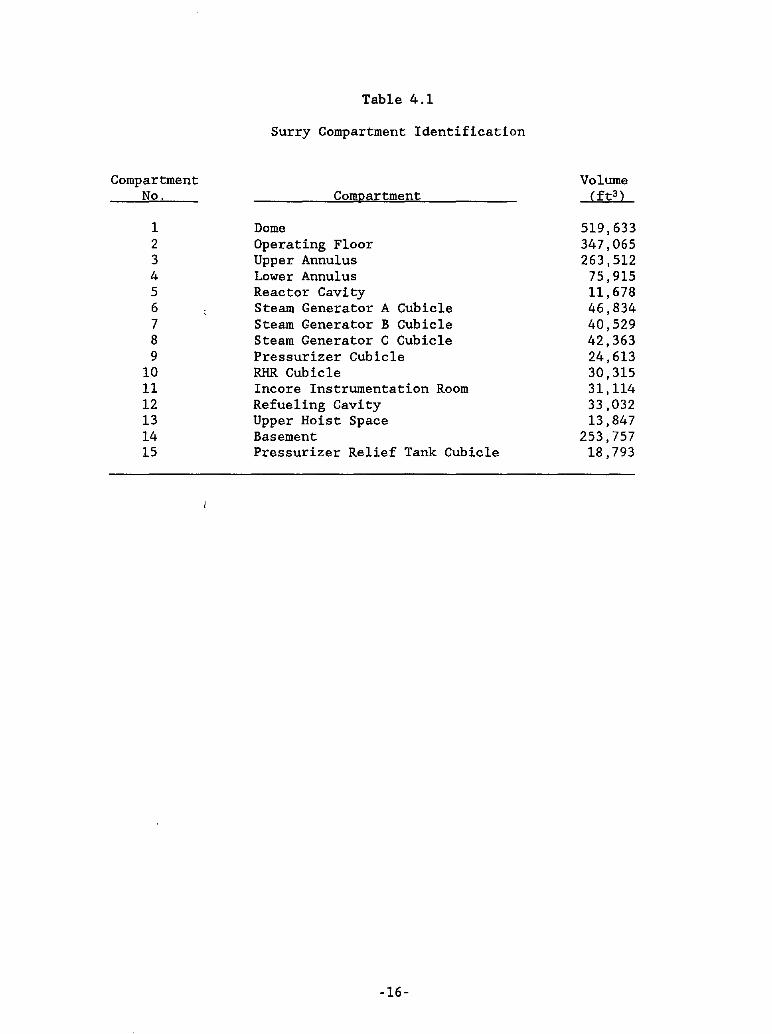
The volume of the Surry containment building is approximately 1,750,000 cubic feet (5.0 x 1010 cm3). The geometry of the structure is considerably different from a large dry containment in that it is highly compartmentalized with the only large open volumes being the dome and operating floor. The containment model used in Surry was similar to that used in the ANS Source Term Study.7 Two longitudinal sections of the building are shown in Figures 4.1 and 4.2. Plan views of the reactor building are shown in Figures 4.3 through 4.6. The compartments are identified in Table 4.1.
Each room in the Surry containment building (Table 4.1) was modeled for the gamma dose rate calculations with the PATH code through use of available combinatorial geometry subroutines. The Surry containment building rooms were generally further subdivided for the beta dose rate calculations using combinatorial geometry subroutines available in ITS. Appendix A shows the containment building zones used for the beta dose rate calculations.
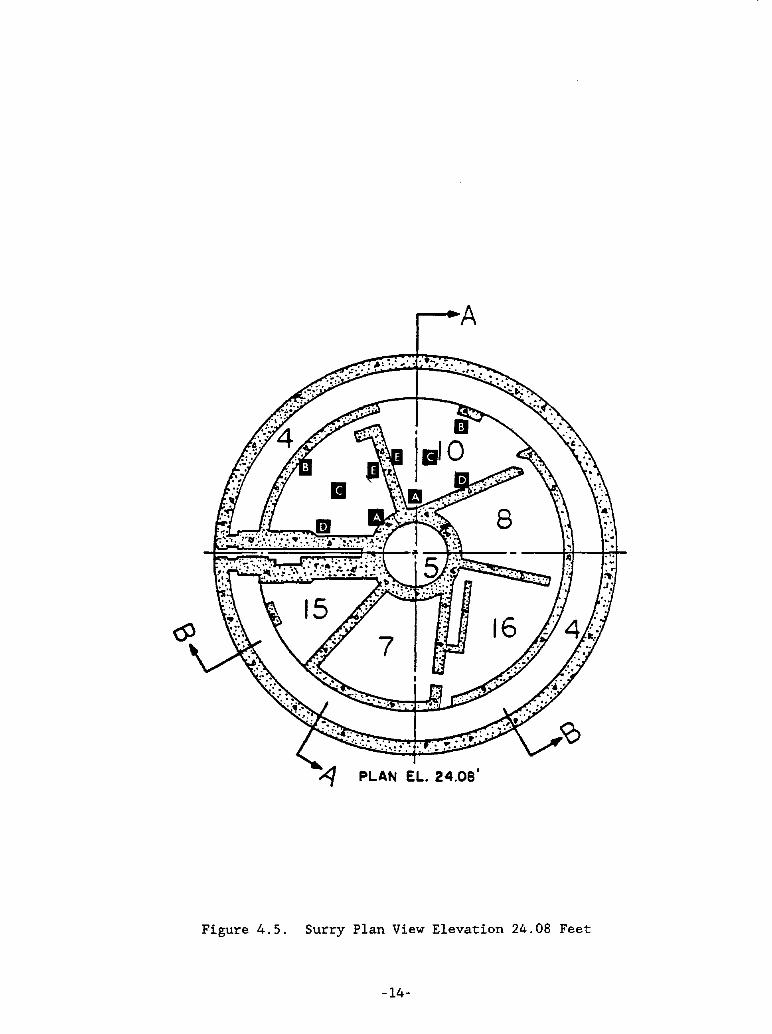
Beta and gamma dose rates were calculated for representative points in the dome, operating floor, upper annulus, lower annulus, basement, the incore instrumentation room, the residual heat removal (RHR) cubicle, steam generator A cubicle, and steam generator B cubicle. The dose point locations (A-J) for the dome, operating floor, upper annulus, and lower annulus are shown in Figures 4.1 and 4.3. The dose point locations (A-I) for the basement are shown in Figure 4.4. Figure 4.5 illustrates the dose point locations (A-E) for the RHR cubicle and steam generator A cubicle. Figure 4.6 shows the incore instrumentation room and steam generator B cubicle dose point locations (A-E). Table 4.2 lists the containment building coordinates for all of the dose point locations. Dose point locations are given in terms of x, y, and z coordinates in feet. The x and y axes are labeled in Figures 4.3 through 4.6.
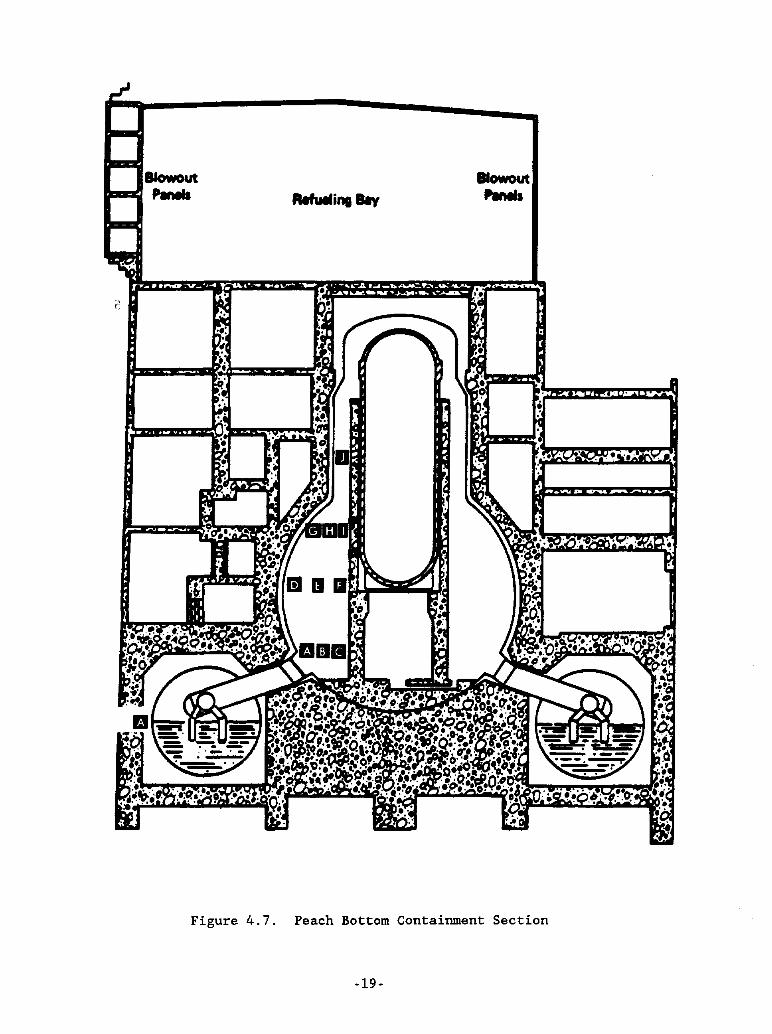
The Peach Bottom containment is divided into two zones. The drywell has a light bulb shape with the stem of the bulb pointing upward. The drywell is connected to a toroidal wetwell at the base of the inverted bulb. The drywell and wetwell are made of steel. The drywell volume is approximately 159,000 cubic feet (4.5 x 109 cm3 ) , and the wetwell volume is approximately 119,000 cubic feet (3.37 x 109 cm3 ). A longitudinal section of the Peach Bottom nuclear power plant is shown in Figure 4.7.
The Peach Bottom drywell was modeled as one volume for the gamma dose rate calculations. The reactor vessel and its pedestal were also modeled in place as illustrated in Figure 4.7. The wetwell was modeled in two zones; that of the torus itself and the torus room which surrounds the torus. The drywell was further subdivided for the beta dose rate calculations. The drywell zones used for the beta dose rate calculations are illustrated in Appendix A.
-9-

. , .. ~.
•• . "
. ,'
..; ,. "
•
m
3 II
4
14
.... , .. ..,
1 II
-------0
1 1
10
.. , .. .. ..
2
----------
Ie
, ' . .. ~
' . . ·i
Figure 4.1. Surry Containment Section A
-10-
,. -
" ~ .
-: . g, ..
e'
• , . .. • "
'.' : • .. · , ' . .. · : 3 '. , ,. , '. , ,
.~: ". . • '. ~ "
.:-, , :'. ':
" :.: . ~ : 4 . , ,'. . , ::.
1
------------------------- --
13
14
Figure 4.2.
2
12
.,: .
IUC'101
-:'-~,
:. , . " , '. 5 ~ .. • " ,
" ~. .
3
:0: ., " :' 9
~~=~~--~ •... e;. : .. , . .. ' .. .~:
15 4 •• . , , '~~:::::::::::::::ZJ--. .•. ~ ..........•.. -.... ,' '," 0" .~. ." '.-:' . .. ~. ..It (: . f ~
' .. 14 14
Surry Containment Section B
-11-
.',
" , . ',~
· . ". ,'. , , · ' '.:. ~~.: . ...
. .... , '. -:. · ~ . .. ,~ .. '; ~ . ',"'f
~.' ':" ':, :~.: ~.;

PLAN EL. 74.92'
Figure 4.3. Surry Plan View Elevation 74.92 Feet
-12-

PLAN Elo O'
Figure 4.4. Surry Plan View Elevation 0 Feet
-13-
.---·A
PLAN EL. 24.08'
Figure 4.5. Surry Plan View Elevation 24.08 Feet
-14-
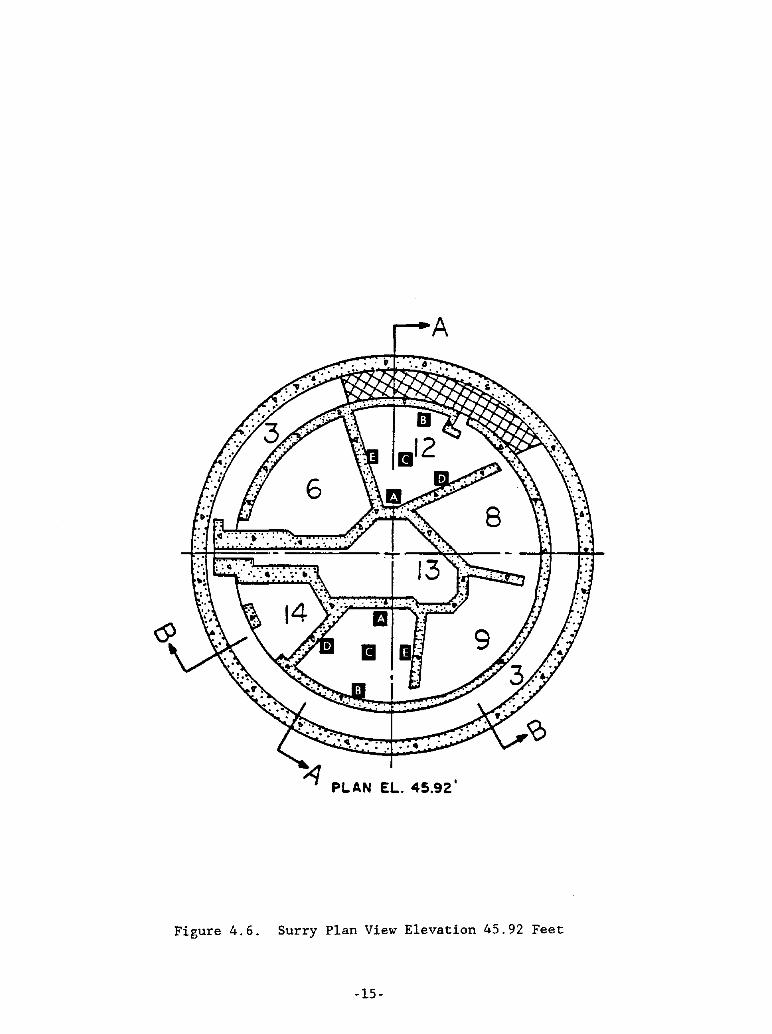
Figure 4.6. Surry Plan View Elevation 45.92 Feet
-15-
Compartment No.
1 2 3 4 5 6 7 8 9
10 11 12 13 14 15
Table 4.1
Surry Compartment Identification
Compartment
Dome Operating Floor Upper Annulus Lower Annulus Reactor Cavity Steam Generator A Cubicle Steam Generator B Cubicle Steam Generator C Cubicle Pressurizer Cubicle RHR Cubicle Incore Instrumentation Room Refueling Cavity Upper Hoist Space Basement Pressurizer Relief Tank Cubicle
-16-
Volume (ft3 )
519,633 347,065 263,512
75,915 11,678 46,834 40,529 42,363 24,613 30,315 31,114 33,032 13,847
253,757 18,793
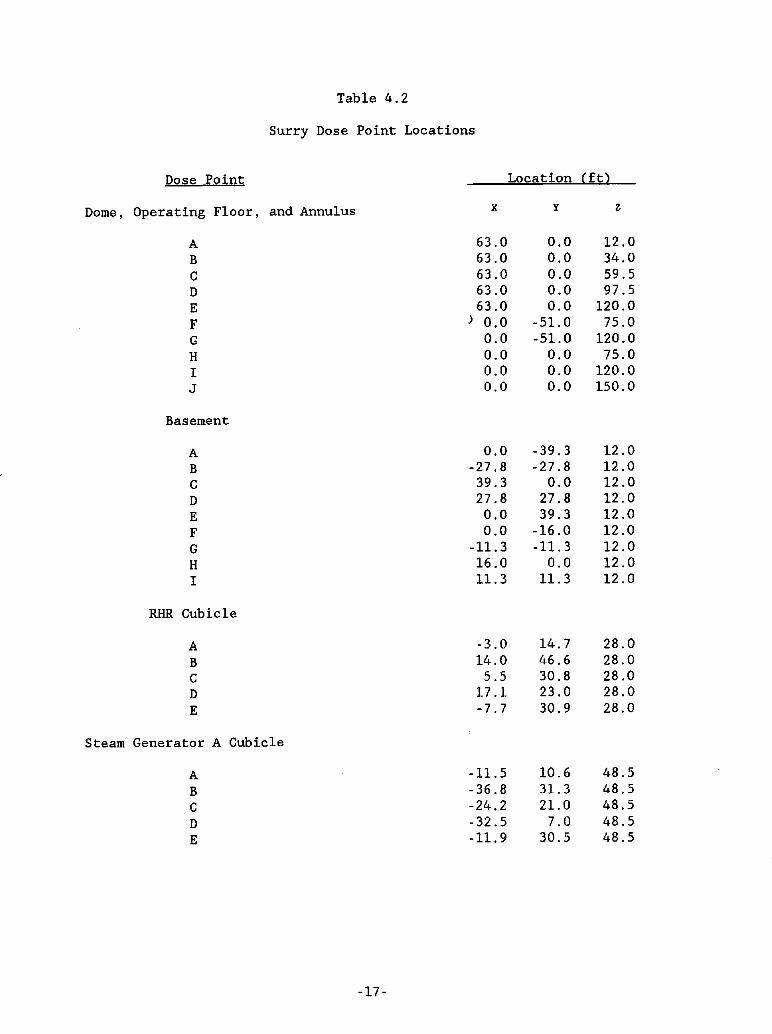
Table 4.2
Surry Dose Point Locations
Dose Point Location (ft)
Dome, Operating Floor, and Annulus x y z
A 63.0 0.0 12.0 B 63.0 0.0 34.0 C 63.0 0.0 59.5 D 63.0 0.0 97.5 E 63.0 0.0 120.0 F ) 0.0 -51.0 75.0 G 0.0 -51.0 120.0 H 0.0 0.0 75.0 I 0.0 0.0 120.0 J 0.0 0.0 150.0
Basement
A 0.0 -39.3 12.0 B -27.8 -27.8 12.0 C 39.3 0.0 12.0 D 27.8 27.8 12.0 E 0.0 39.3 12.0 F 0.0 -16.0 12.0 G -11.3 -11.3 12.0 H 16.0 0.0 12.0 I 11.3 11.3 12.0
RHR Cubicle
A -3.0 14.7 28.0 B 14.0 46.6 28.0 C 5.5 30.8 28.0 D 17.1 23.0 28.0 E -7.7 30.9 28.0
Steam Generator A Cubicle
A -11.5 10.6 48.5 B -36.8 31.3 48.5 C -24.2 21.0 48.5 D -32.5 7.0 48.5 E -11.9 30.5 48.5
-17-
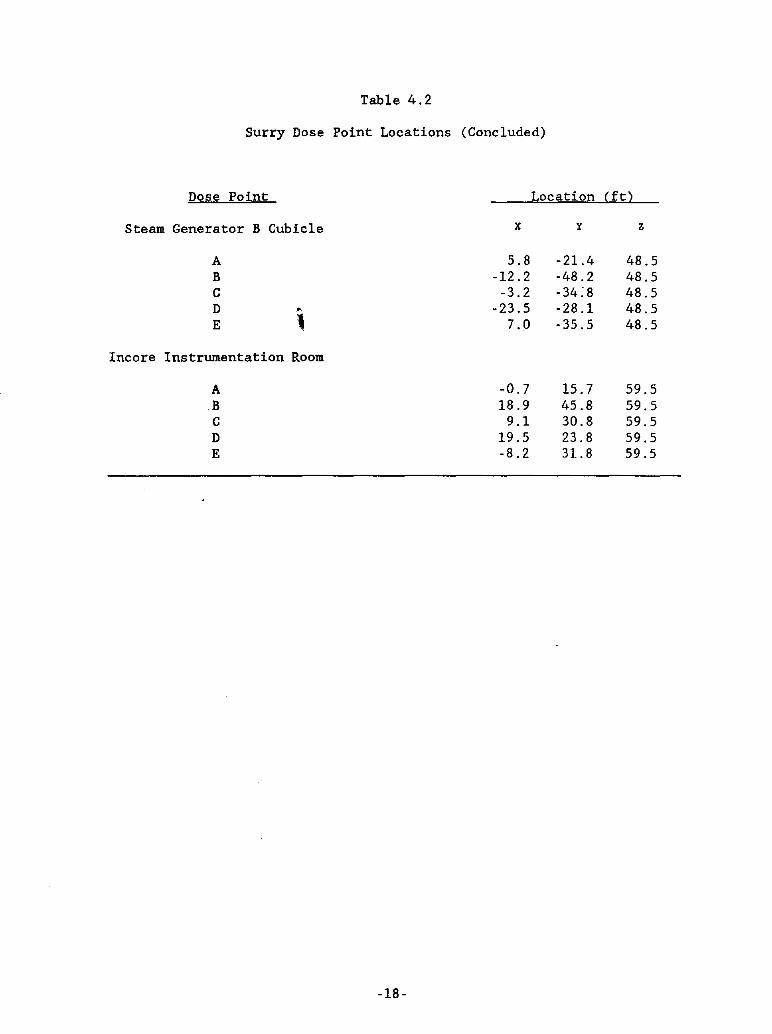
Table 4.2
Surry Dose Point Locations (Concluded)
Dose Point Location (ft)
Steam Generator B Cubicle x y z
A 5.8 -21.4 48.5 B -12.2 -48.2 48.5 C -3.2 -34:8 48.5 D " -23.5 -28.1 48.5 E • 7.0 -35.5 48.5
Incore Instrumentation Room
A -0.7 15.7 59.5 B 18.9 45.8 59.5 C 9.1 30.8 59.5 D 19.5 23.8 59.5 E -8.2 31.8 59.5
-18-
Blowout PIneIa
Figure 4.7. Peach Bottom Containment Section
-19-

Beta and gamma doses were calculated for representative points in the drywell and wetwell torus room. Dose point locations for the drywell and torus room are shown in Figure 4.7. Location J in the drywell represents three dose points at the same drywell elevation. Location A in the wetwell represents two dose points at the midpoint elevation of the torus. The first wetwell point is in the torus room and the second wetwell point is in one of the quad rooms. Table 4.3 lists the dose point coordinates for the drywell and torus room.
Table 4.3
Peach Bottom Dose Point Locations
Dose Point Location Cft)
Drywe11 x y z
A 26.8 0.0 126.7 B 20.1 0.0 126.7 C 13.9 0.0 126.7 D 32.0 0.0 145.0 E 23.3 0.0 145.0 F 13.9 0.0 145.0 G 26.7 0.0 163.6 H 20.3 0.0 163.6 I 13.9 0.0 163.6 J 18.8 0.0 187.2 K 16.4 0.0 187.2 L 13.9 0.0 187.2
Wetwell
A -52.5 -51.0 112.6 B -56.0 -54.0 112.6
-20-

5.0 DOSE RESULTS
The dose rate and dose results presented in this report represent a scoping effort to obtain an estimate of dose rate and dose. Containment models were kept relatively simple due to the scoping nature of this study. Experience gained in using PATH, ITS, and the containment models will provide better insight into using these tools for future accident dose calculations.
Dose rate is very specific to containment building structure and timedependent spatial distribution of radionuclides as well as knowledge of radionuclide energy release and accident scenarios. The radionuclide release for the airborne, plate-out, and waterborne sources was assumed to be uniformly distributed throughout containment; multicompartment radionuclide transport throughout containment after the accident scenarios was beyond the scope of this work. Treating the source as uniformly spatially distributed is expected to result in high estimates of dose in the Surry containment building during early time periods in the accident. Other studies have assumed uniform distribution in PWR containments that are relatively open and have modeled the containments as large open cylinders. Treating source terms as being uniformly distributed in Peach Bottom should produce reasonable results because the drywell is relatively open, and uniform mixing could also be expected to occur for radionuclide release into the wetwell.
These calculations also allow the relative magnitudes of dose and dose rate for each case to be compared. The effects of ESF operation can also be compared from case to case.
The effect of compartment size and structure on dose rate and total dose will also be evident from the results. Modeling of major equipment was beyond the scope of this work. All compartments and regions in containment are modeled as open rooms. Maj or structural features such as floors, walls, and ceilings have been taken into account.
5.1 Surry Dose Results
Four variations of the AB epsilon scenario were calculated. This scenario involves an intermediate to large LOCA with failure to recover onsite or offsite electrical power. Containment vessel meltthrough occurs. Case 1 is the base case or the AB epsilon scenario itself. Case 2 investigates the effect of arresting the base scenario; all coreconcrete attack radionuclide release is removed. Case 3 is the base case with sprays operational; all airborne activity (except noble gas) has been removed to the sump. Containment surfaces are assumed to have no activity. Full core meltdown occurs. Case 4 is similar to Case 3 but is an arrested sequence.
The results are presented in terms of dose rate and total dose to selected containment regions. Figures are used to illustrate combined airborne, wall, floor, or sump total doses. Abbreviated tables are used to present combined airborne, wall, floor, or sump dose rates at one hour and one year; the integrated total dose at one year for these source
-21-

terms is also presented in the abbreviated 'table . Detailed tables are presented in Appendix C, which break out the individual airborne, wall, floor, or sump contribution to dose rates for selected containment locations.
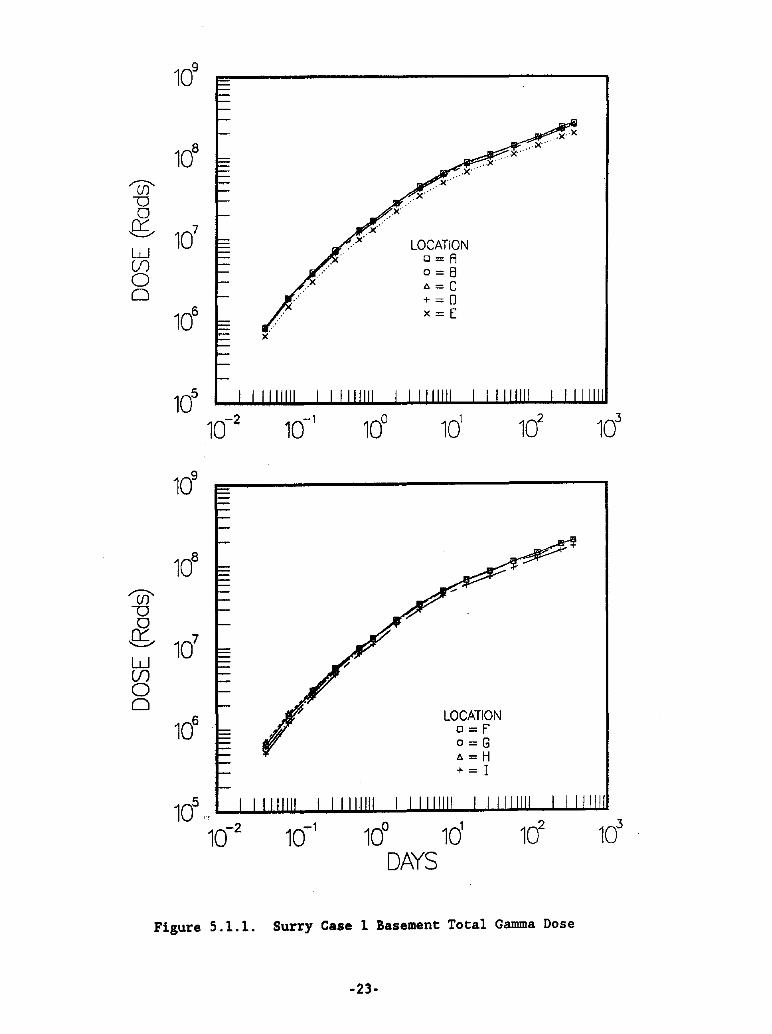
5.1.1 Case 1 Dose Results
Figures 5.1.1 and 5.1.2 illustrate total dose for the Case 1 accident at the basement dose point locations A through I. Basement integrated gamma dose at one year ranged from 1.7 to 2.7 X 10⁸ rads. Basement integrated beta dose at one year ranged from 0.97 to 2.8 X 10⁹ rads. Appendix C lists the relative dose rate contributions of the airborne, wall, and floor sources for representatiye locations in containment. Tables C.l and C.2 indicate that the floor source was the leading contributor to gamma and beta dose at location A in the basement. The wall source contribution to total gamma dose at location F showed a substantial increase when compared to location A but did not surpass the contribution due to the floor source. For total beta dose at location F, the wall source and floor source contributions to total dose were approximately equivalent.
Total dose for the Surry annulus is shown in Figures 5.1.3 and 5.1.4. Gamma dose was largest for the location point at the top of the annulus which views the rest of the dome region and at the bottom of the annulus which views the rest of the basement region. Beta dose was highest at the bottom of the annulus. Annull.1s integrated g;?mma ,and beta dose ranged from 0.6 to 1.0 x 10⁸ rads and 0.25 to 1.1 x 10⁹ rads, respectively. The wall source was the maj or contributor to gamma total dose for annulus locations C and E; both the floor and wall source were major contributors to gamma total dose at location A (Table C. 3) . The airborne and wall sources were the major contributors to beta total dose at locations C and E; the floor source made no contribution to total beta dose at C and E. Both source contributions were roughly equivalent. The floor, wall, and airborne sources were approximately equal contributors to beta total dose at location A (Table C.4).
Operating floor and dome total dose are illustrated in Figures 5.1.5 and 5.1.6. Gamma dose was highest at the t,op of the operating floor while beta dose was highest near the walls and floors of the operating floor. Gamma total dose at one year ranged from 0.57 to 1. 90x 108 rads. Beta total dose ranged from 1.1 x 10⁸ rads in the dome center to 1.8 x 10⁹
rads along the walls and floors of the operating floor. The floor and wall sources were major contributors to gamma total dose at locations H, I, and J. The airborne source term was also a significant contributor ,to total dose through 8 hours but rapidly decayed thereafter (Table C. 5). Maj or contributors to the total beta dose at location J were the airbo'rne and wall sources; the operating floor source made no contribution. The airborne source was the only significant contributor to total beta dose at location I; wall and floor source contributions were minor. Total beta dose at location H was due to the airborne and wall sources (Table C.6).
-22-
108
'(j)' v 0
Q; 10
7
W LOCATION
U1 (J=A
0 0=8
0 A=C + = 0
106 x=[
)(
108
'(j)' v 0
Q; 10
7
W U1 0 0
106 LOCATION
(J=P 0=8 A=H + = I
5 10 "
10-2 10-1 10° 101
102
103
DAYS
Figure 5.1.1. Surry Case 1 Basement Total Gamma Dose
·23·

108
'(f)' "U 0
,Q; 10
7
W U) LOCATION
0 o=A 0 o=B
t>.=c 10
6 +=0
109
'(f)' """0 0
,Q; 10
8
W U)
LOCATION 0 0 o=F"
o=G
107 t>.=H
+ = I
Figure 5.1.2. Surry Case 1 Basement Total Beta Dose
-24-

108
'Ci)' "D 0 ~ 10
7
W (f) LOCATION 0 D=A 0 0=8
106
l> = C + = 0 x = E
Figure 5 .. 1.3. Surry Case 1 Annulus Total Gamma Dose
1dO
Figure 5.1.4. Surry Case 1 Annulus Total Beta Dose
-25-

108
'if)' u 0
b 107
W UJ LOCATION 0 D=F
0 0= G
106 t; = H
+ = 1 x = J
Figure 5.1.5. Surry Case 1 Operating Floor and Dome Total Gamma Dose
'if)' u 0
b W UJ 0 0
1dO
109
108
107
LOCATION 0= F o=G t; = H + = 1 x = J
Ffgure 5.1.6. Surry Case 1 Operating Floor and Dome Total Beta Dose
-26-

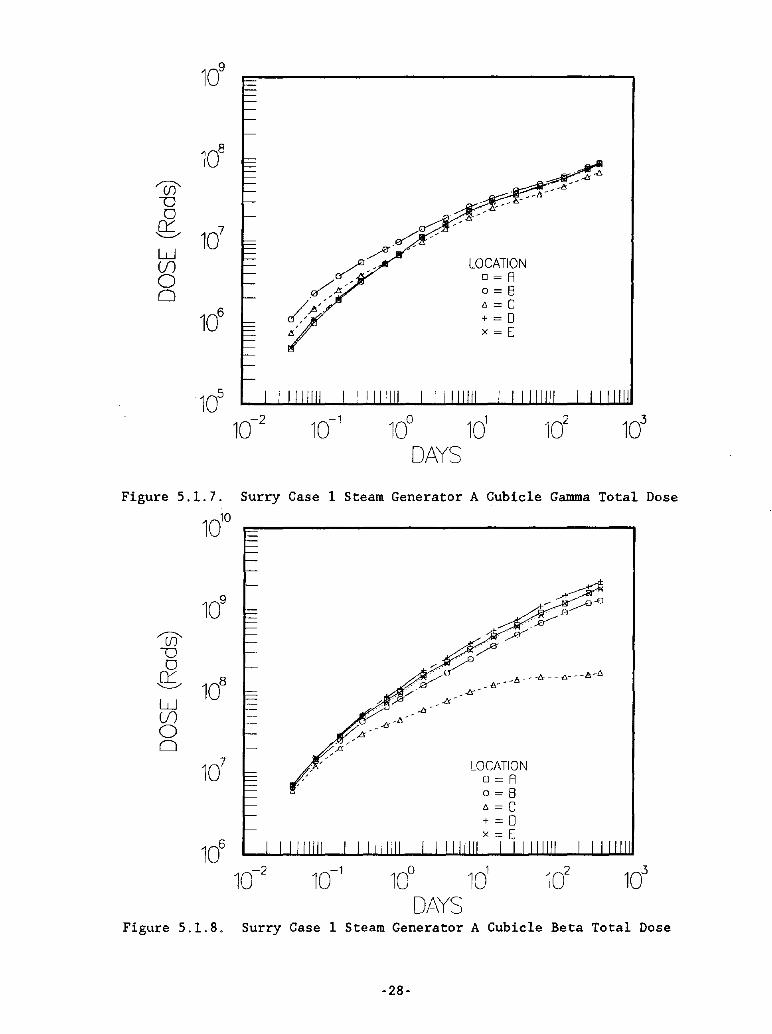
Figures 5.1.7 and 5.1.8 show total dose for the steam generator A cubicle. Gamma dose showed minor fluctuation with respect to cubicle position. Beta dose rate at the walls also showed minor variations with respect to wall location. Beta dose rate at the compartment center was significantly decreased compared to beta dose rate at the walls (wall and floor sources had less effect at the compartment center). Total gamma dose for the cubicle ranged from 6.8 x 10⁷ rads to 8.9 x 10⁷ rads. Total beta dose along the walls at one year ranged fr·om 1.3 x 10⁹ to 2.2 x 10⁹
rads, and total centerline beta dose at one year was approximately 1.7 x 10⁸ rads. The wall sources were the maj or contributors to locations D and E for total gamma dose. Contribution to total dose at location C was equally distributed between the wall and floor sources (Table C.7). The floor, wall, and airborne sources were approximately equivalent contributors to the total beta dose at locations D and E; the airborne source was the major contributor to dose at location C (Table C.8).
The gamma and beta dose rate figures corresponding to Figures 5.1.1 through 5.1.8 are shown in Appendix B. Steam generator B cubicle dose rate and dose figures were similar to those of steam generator A cubicle and are shown in Appendix B.
The RHR cubicle total dose is pictured in Figures 5.1.9 and 5.1.10. The RHR cubicle has a volume of 30315 ft3 compared to the steam generator A cubicle volume of 46834 ft3 . Gamma dose was lower than that in the steam generator A cubicle and showed almost no variation with respect to cubicle position. As in the steam generator A cubicle, beta dose at the walls was higher than the centerline beta dose rate. However, the difference between the centerline and wall dose rate in the RHR cubicle was not as great as the difference in the steam generator A cubicle because the RHR cubicle is 25 percent smaller than the steam generator A cubicle.
The in-core instrumentation room calculated dose rate and total dose values were similar to those of the RHR cubicle and are shown in Appendix B.
Table 5.1 partially summarizes the dose rate and total dose values by presenting the gamma and beta dose rates at 1 hour and 1 year for each location. Gamma and beta total dose is listed at one year.
The gamma and beta dose rate and dose are tabularized in Appendix C.for each calculated time period and according to airborne, wall, floor, or sump source.
-27-
108
'(jJ --0 0
,Q; 10
7
W (J) LOCATION
0 0= A 0 0=8
[, = C
106
+ = 0 x = E
100 1d DAYS
Figure 5.1.7. Surry Case 1 Steam Generator A Cubicle Gamma Total Dose
'(jJ --0 0
,Q; W (J) 0 0
1010
109
108
107 LOCATION
0= A 0= B [, = C + = 0 x = E
Figure 5.1.8. Surry Case 1 Steam Generator A Cubicle Beta Total Dose
-28-

108
'(j)' v 0
,Q; 10
7
W (f) 0 0 LOCATION
106 D=A
0=8 [; = C + = 0 x = E
Figure 5.1.9. Surry Case 1 RHR Cubicle Total Gamma Dose
109
'(j)' v 0
,Q; 10
8
W (f) 0 0 LOCATION
107 0= A
0=8 [; = C + = 0 x = E
Figure 5.1.10. Surry Case 1 RHR Cubicle Total Beta Dose
-29-
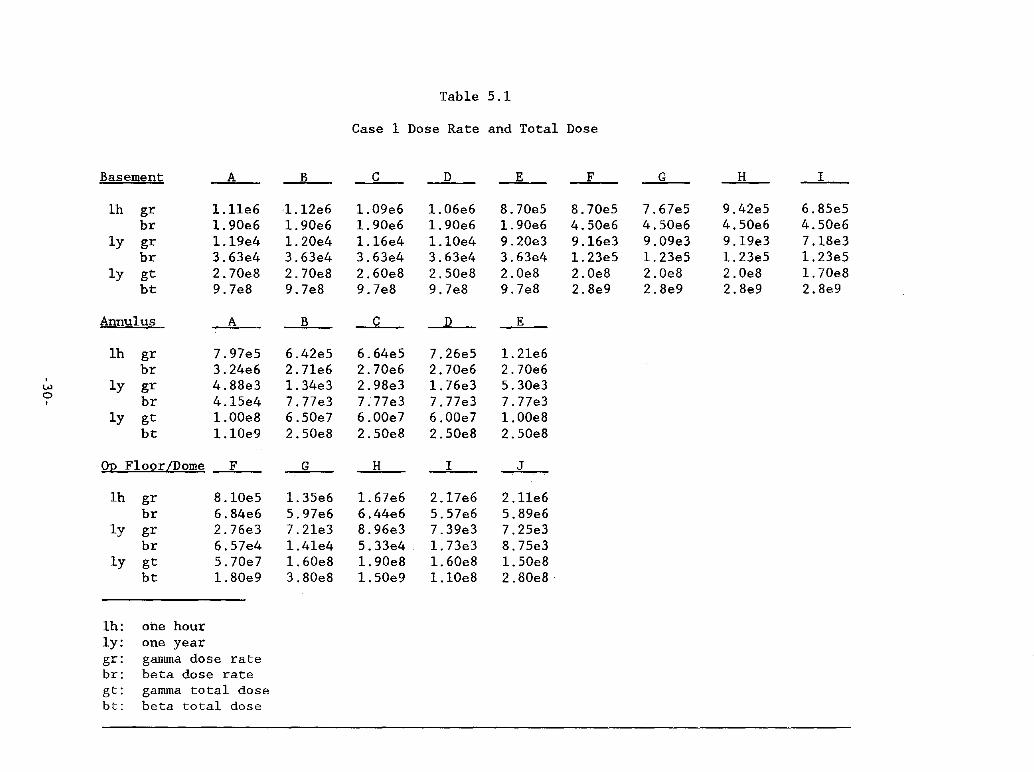
Table 5.1
Case 1 Dose Rate and Total Dose
Basement A B C D E F G H _1_
lh gr 1.lle6 1.12e6 1.0ge6 1.06e6 8.70es 8.70es 7.67es 9.42es 6.8seS br 1.90e6 1. 90e6 1.90e6 1.90e6 1.90e6 4.s0e6 4.S0e6 4.S0e6 4.s0e6
ly gr 1.1ge4 1.20e4 1.16e4 1.l0e4 9.20e3 9.l6e3 9.0ge3 9.lge3 7.l8e3 br 3.63e4 3.63e4 3.63e4 3.63e4 3.63e4 1.23es 1. 23eS 1.23eS 1.23eS
ly gt 2.70e8 2.70e8 2.60e8 2.S0e8 2.0e8 2.0e8 2.0e8 2.0e8 1.70e8 bt 9.7e8 9.7e8 9.7e8 9.7e8 9.7e8 2.8e9 2.8e9 2.8e9 2.8e9
Annulus A B C D E
lh gr 7.97es 6.42es 6.64es 7.26es 1.2le6 br 3.24e6 2.7le6 2.70e6 2.70e6 2.70e6 ,
ly 4.88e3 1.34e3 2.98e3 1. 76e3 S.30e3 w gr 0 br 4.lse4 7. ne3 7.77e3 7.77e3 7.ne3 ,
ly gt 1.OOe8 6.s0e7 6.00e7 6.00e7 1.00e8 bt 1.lOe9 2.S0e8 2.s0e8 2.s0e8 2.S0e8
Op Floor/Dome F G H 1 J
lh gr 8.l0es 1. 3Se6 1. 67e6 2.l7e6 2.lle6 br 6.84e6 S.97e6 6.44e6 s.s7e6 S.8ge6
ly gr 2.76e3 7.2le3 8.96e3 7.3ge3 7.2se3 br 6.S7e4 1.4le4 s.33e4 1. 73e3 8.7se3
ly gt s.70e7 1.60e8 1.90e8 1.60e8 1.sOe8 bt 1.80e9 3.80e8 1.SOe9 1.lOe8 2.80e8
lh: one hour ly: one year gr: gamma dose rate br: beta dose rate gt: gamma total dose bt: beta total dose
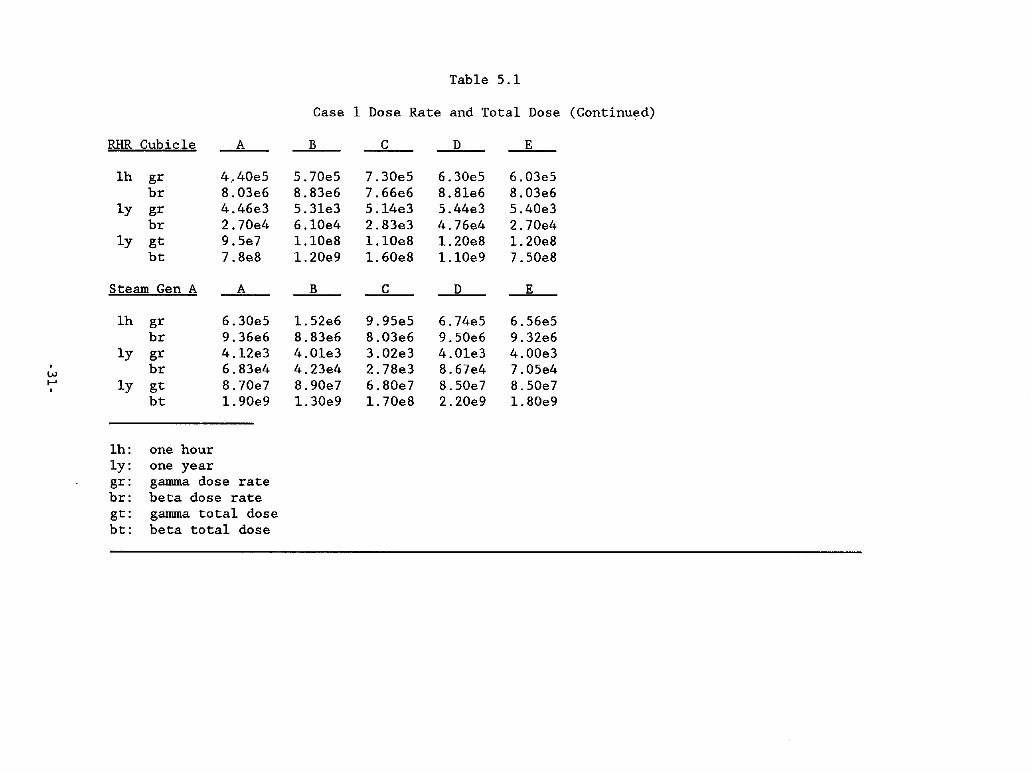
Table 5.1
Case 1 Dose Rate and Total Dose (Continued)
RHR Cubicle A B C D ---E.
lh gr 4,.40es s.70es 7.30es 6.30es 6.03es br 8.03e6 8.83e6 7.66e6 8.8le6 8.03e6
ly gr 4.46e3 s.3le3 s.14e3 s.44e3 s.40e3 br 2.70e4 6.l0e4 2.83e3 4.76e4 2.70e4
ly gt 9.se7 1.lOe8 1.l0e8 1. 20e8 1.20e8 bt 7.8e8 1. 20e9 1.60e8 1.l0e9 7.s0e8
Steam Gen A A B C D ---E.
lh gr 6.30es 1.s2e6 9.9ses 6.74es 6.s6es br 9.36e6 8.83e6 8.03e6 9.s0e6 9.32e6
ly gr 4.l2e3 4.0le3 3.02e3 4.0le3 4.00e3 . br 6.83e4 4.23e4 2.78e3 8.67e4 7.0se4 Vol ,... ly gt 8.70e7 8.90e7 6.80e7 8.s0e7 8.s0e7 . bt 1.90e9 1. 30e9 1.70e8 2.20e9 1.80e9
lh: one hour ly: one year gr: gamma dose rate br: beta dose rate gt: gamma total dose bt: beta total dose

5.1.2 Case 2 Dose Results
The Case 2 scenario simulated resumption of emergency core cooling and arresting core meltdown by removing the core-concrete radionuclides calculated in Case 1. Removal of radionuclide activity attributed to the core-concrete attack period resulted in lower dose rates at the selected dose point locations. Table 5.2 summarizes the dose rate' and total dose values for gamma and beta radiation and may be compared to Table 5.1 to see the effect of arresting core meltdown. For example, Case 1 basement total gamma and beta dose were 1.7 x 10⁸ to 2.7 x 10⁸ rads and 0.97 x 10⁹ to 2.8 x 10⁹ rads, respectively. Corresponding Case 2 basement total gamma and beta dose were calculated to be 1.1 x 10⁸ to 1.5 x 10⁸ rads and 0.18 x 10⁹ to 1.3 x 10⁹ rads, respectively. The reductions in total dose were due mainly to reductions in activity of the floor and wall sources; the airborne source activity also decreased but not as significantly as the floor and wall sources. The trends noted for Case 1 also apply to the results of Case 2.
Gamma and beta dose rate values for Case 2 are shown in Appendix B. Airborne, wall, and floor contributions for selected containment locations are listed in Appendix C.
-32-

Table 5.2
Case 2 Dose Rate and Total Dose
Basement A _ B_ C D E F G H _1 _
lh gr 1.13e6 1.13e6 1.11e6 1.07e6 8.80e5 8.3ge5 7.28e5 8.42e5 6.64e5 br 1.84e6 1.84e6 1.84e6 1.84e6 1.84e6 4.40e6 4.40e6 4.40e6 4.40e6
1y gr 8.4ge3 8.50e3 8.24e3 7.85e3 6.67e3 6.7ge3 6.71e3 6.83e3 5.85e3 br 5.13e3 5.13e3 5.13e3 5.13e3 5.13e3 7.14e4 7.14e4 7. 14e411> 7.14e4
ly gt 1.50e8 1.50e8 1.50e8 1.40e8 1.20e8 1. 20e8 1.20e8 1.20e8. 1.10e8 bt 1.80e8 1.80e8 1.80e8 1.80e8 1.80e8 1.30e9 1.30e9 1.30e9. 1.30e9
Annulus A B C D E
lh gr 7.96e5 6.43e5 6.64e5 7.27e5 1.21e6 br 3.22e6 2.70e6 2.70e6 2.70e6 2.70e6
ly gr 4.01e3 2.9ge3 2.8ge3 3.45e3 5.33e3 br 6.42e3 2.90e3 2.90e3 2.90e3 2.90e3 , ..., ly gt 7.30e7 5.4e7 5.30e7 6.30e7 9.60e7 ..., , bt 2.40e8 1.2e8 1.2e8 1.2e8 1.20e8
Op Floor/Dome F G H I -1
1h gr 8.10e5 1.35e6 1. 67e6 2.17e6 2.11e6 br 6.92e6 6.06e6 5.65e6 5.66e6 5.98e6
ly gr 8.02e2 1. 27e3 4.5ge3 3.41e3 5.38e3 br 1.77e4 1.0ge4 8.56e3 1. 74e3 6.0ge3
1y gt 4.ge7 9.60e7 1.50e8 1.20e8 1. 20e8 bt 4.6e8 2.6e8 3.0e8 9.ge7 1.80e8
h: hour y: year
gr: gamma dose rate br: beta dose rate gt: gamma total dose bt: beta total dose
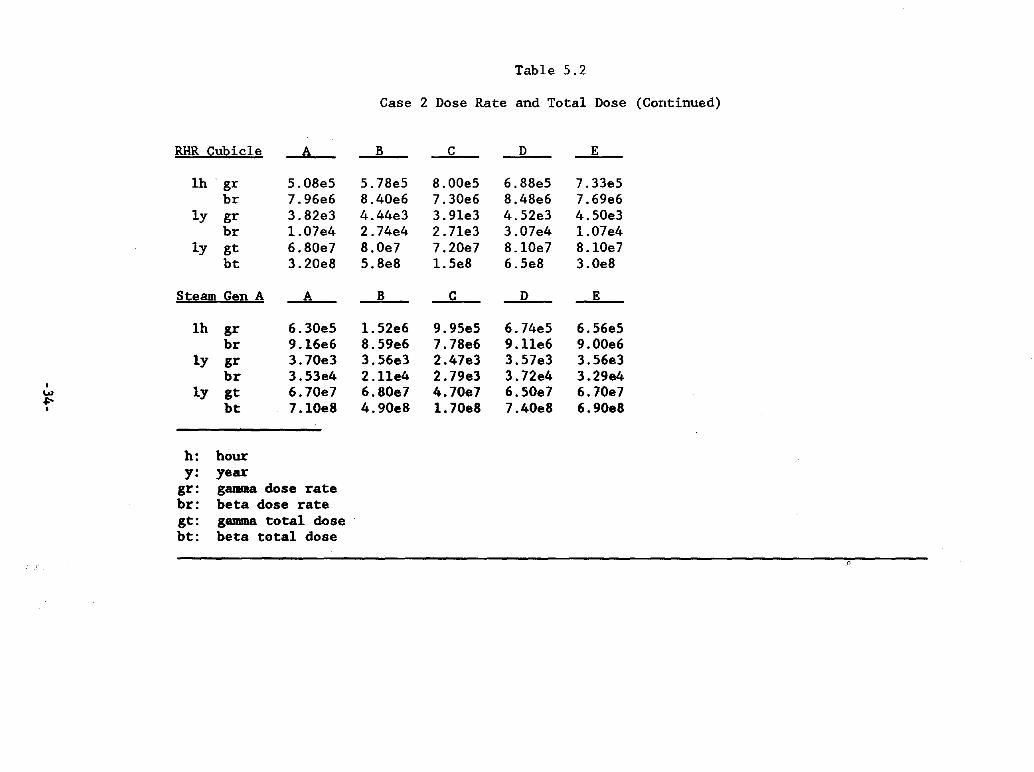
Table 5.2
Case 2 Dose Rate and Total Dose (Continued)
RHR Cubicle A B C D _E_
lh gr 5.08e5 5.78e5 8.00e5 6.88e5 7.33e5 br 7.96e6 8.40e6 7.30e6 8.48e6 7.6ge6
ly gr 3.82e3 4.44e3 3.91e3 4.52e3 4.50e3 br 1.07e4 2.74e4 2.71e3 3.07e4 1.07e4
ly gt 6.80e7 8.0e7 7.20e7 8.10e7 8.l0e7 bt 3.20e8 5.8e8 1.5e8 6.5e8 3.0e8
Steam Gen A A B C D -E.
lh gr 6.30e5 1.52e6 9.95e5 6.74e5 6.56e5 br 9.l6e6 8.5ge6 7.78e6 9.11e6 9.00e6
1y gr 3.70e3 3.56e3 2.47e3 3.57e3 3.56e3 br 3.53e4 2.11e4 2.7ge3 3.72e4 3.2ge4
I 1y 6.70e7 6.80e7 4.70e7 6.50e7 6.10e7 \0> gt
~ bt 7.10e8 4.90e8 1.70e8 7.40e8 6.90e8 I
h: hour y: year
gr: gamma dose rate br: beta dose rate gt: gamma total dose bt: beta total dose
D

5.1.3 Case 3 Dose Results
Table 5.3 shows the basement total dose for the Case 3 accident scenario. Calculations showed slight gamma dose rate dependence on position. The combined air and sump sources caused the gamma dose in the basement to be larger than the beta dose during spray operation. Basement total gamma dose at one ye~r ranged from 1 x 10⁸ to 1.4 X 10⁸ rads, and total beta dose at one yea~ was 3.7 x 10⁷ rads. Total gamma dose was dominated by the sump source contribution; the airborne source contribution was at least one order of magnitude smaller than that of the sump source (Table C.19). The beta total dose was due entirely to the airborne source; the sump source was attenuated completely within the sump water.
Gamma dose decreased with increasing annulus elevation as the sump source activity had' less influence at higher containment elevations (Table C.20). Gamma total dose in the annulus ranged from 7 x 10⁷ rads at the lower annulus levels to 2.9 x 10⁶ rads at the top of the annulus. Total beta dose at one year for the annulus was 6.8 x 10⁷ rads.
Gamma and beta total dose in the upper regions of containment were due only to airborne sources. Gamma dose for the Case 3 operating floor and dome region were largest in the dome and at the top of the operating floor region. Total gamma dose ranged from' 1.6 x 10⁶ rads to 4.6 X 10⁶
rads while total. beta dose was 1.6 x 10⁸ rads. .
The steam generator A cubicle airborne source resulted in slight gamma dose variation with respect to the. five dose point locations. The steam generator A cubicle was modeled as one volume for the beta calculations, therefore, spatial dose rate calculations we,re not possible. Total dose gamma values at one year ranged from 9.6 x 10⁵ to 1.7 X 10⁶ rads, and the total dose beta value was calculated to be 2.6 X 10⁸ rads. Dose rates and total dose value figures for Case 3 are presented in Appendix B.
The airborne and sump contributions to dose rate for the document and annulus regions are listed in Appendix. C. All dose rates for the remainder of containment are due to airborne activity only.
-35-
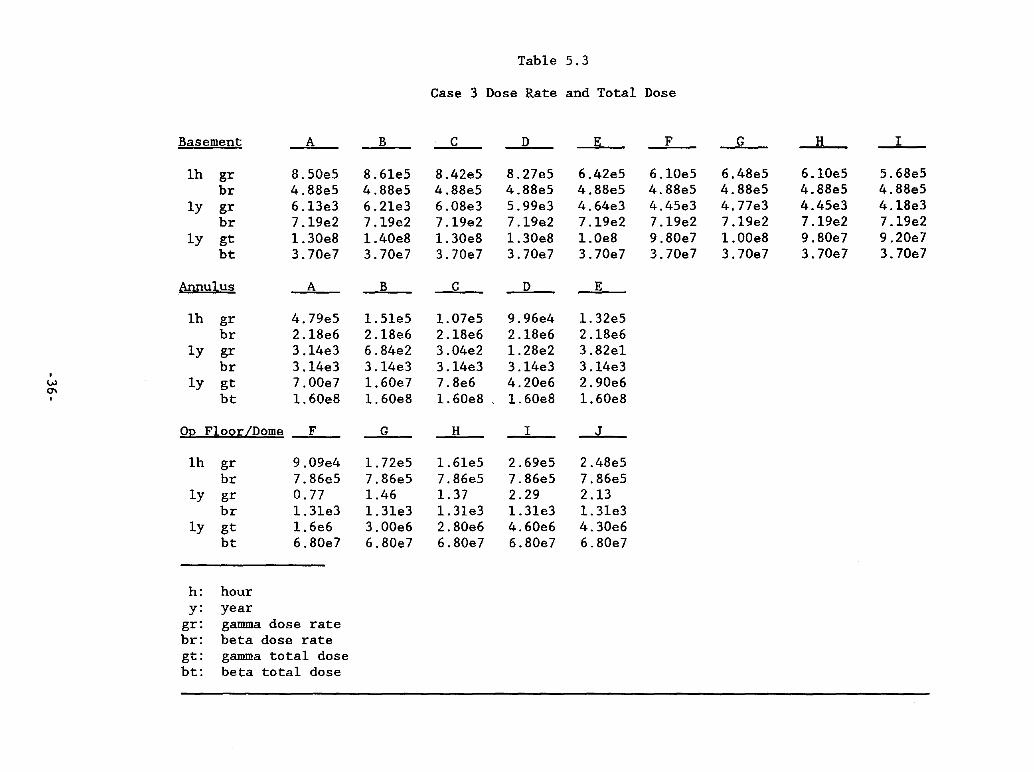
Table 5.3
Case 3 Dose Rate and Total Dose
Basement A B C D E F G H I
lh gr 8.S0eS 8.6leS 8.42eS 8.27eS 6.42eS 6.l0eS 6.48eS 6.l0eS S.68eS br 4.88eS 4.88eS 4.88eS 4.88eS 4.88eS 4.88eS 4.88eS 4.88eS 4.88eS
ly gr 6.13e3 6.2le3 6.08e3 S.9ge3 4.64e3 4.4Se3 4.77e3 4.4Se3 4.l8e3 br 7.lge2 7.lge2 7.lge2 7.lge2 7.lge2 7.lge2 7.lge2 7.lge2 7.lge2
ly gt 1.30e8 1.40e8 1.30e8 1.30e8 1.Oe8 9.80e7 1.00e8 9.80e7 9.20e7 bt 3.70e7 3.70e7 3.70e7 3.70e7 3.70e7 3.70e7 3.70e7 3.70e7 3.70e7
Annulus A B C D _E_
lh gr 4.7geS 1.SleS 1.07eS 9.96e4 1.32eS br 2.l8e6 2.l8e6 2.l8e6 2.l8e6 2.l8e6
ly gr 3.l4e3 6.84e2 3.04e2 1.28e2 3.82el br 3.l4e3 3.l4e3 3.l4e3 3.l4e3 3.l4e3
• ly 1.60e7 w gt 7.00e7 7.8e6 4.20e6 2.90e6 0'> . bt 1.60e8 1.60e8 1.60e8 1.60e8 1.60e8
Op Floor/Dome F G H I _J_
lh gr 9.0ge4 1.72eS 1.6leS 2.6geS 2.48eS br 7.86eS 7.86eS 7.86eS 7.86eS 7.86eS
ly gr 0.77 1.46 1. 37 2.29 2.13 br 1.3le3 1.3le3 1.3le3 1.3le3 1.31e3
ly gt 1.6e6 3.00e6 2.80e6 4.60e6 4.30e6 bt 6.80e7 6.80e7 6.80e7 6.80e7 6.80e7
h: hour y: year
gr: gamma dose rate br: beta dose rate gt: gamma total dose bt: beta total dose
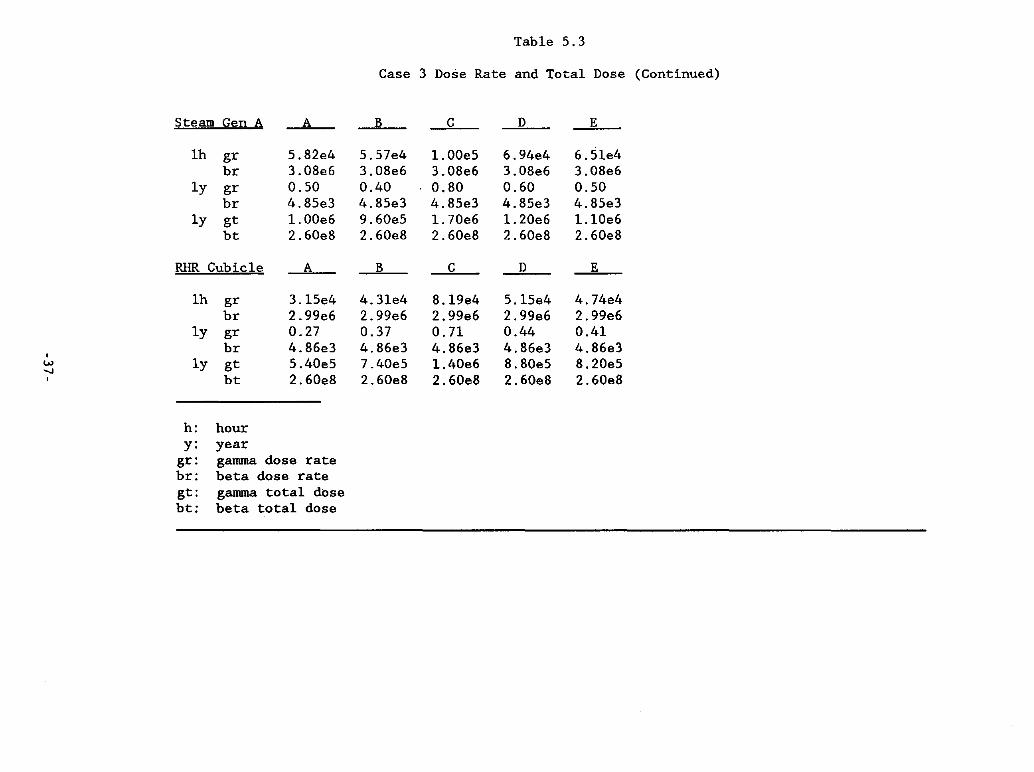
Table S.3
Case 3 Dose Rate and Total Dose (Continued)
Steam Gen A A B C D ---1:
lh gr S.S2e4 S.S7e4 1.00eS 6.94e4 6.Sle4 br 3.0Se6 3.0Se6 3.0Se6 3.0Se6 3.0Se6
ly gr O.SO 0.40 O.SO 0.60 O.SO br 4.SSe3 4.SSe3 4.SSe3 4.SSe3 4.SSe3
ly gt 1.00e6 9.60eS 1.70e6 1. 20e6 l.lOe6 bt 2.60eS 2.60eS 2.60eS 2.60eS 2.60eS
RHR Cubicle A B C D E
lh gr 3.lSe4 4.3le4 S.1ge4 S.lSe4 4.74e4 br 2.9ge6 2.9ge6 2.9ge6 2.9ge6 2.9ge6
ly gr 0.27 0.37 0.71 0.44 0.41 br 4.S6e3 4.S6e3 4.S6e3 4.S6e3 4.S6e3 ,
w ly "
gt S.40eS 7.40eS l.40e6 S.SOeS S.20eS , bt 2.60eS 2.60eS 2.60eS 2.60eS 2.60eS
h: hour y: year
gr: gamma dose rate br: beta dose rate gt: gamma total dose bt: beta total dose

5.1.4 Case 4 Dose Results
The Case 3 and Case 4 airborne radionuclide activities were approximately identical. Differences between Case 3 and Case 4 occurred in the sump radionuclide activities. Since Case 4 was an arrested sequence, less radionuclide activity was introduced into the sump when compared to the Case 3 sump activity. Therefore, Case 4 gamma dose rates in the basement region and lower annulus regions can be expected to be less than Case 3 gamma dose rates in the same regions. Beta dose rates for Case 4 were identical to thos"e of Case 3 because the ITS code calculated that no sump electron activity could escape beyond the sump water. All dose points in the basement region were located above the sump in this study.
Table 5.4 lists the gamma total dose for the Surry basement region. Total dose showed a moderate dependence upon location. Total gamma dose for the basement level varied from 5.9 X 10⁷ rads to 8.9 X 10⁷ rads. Recall that Case 3 total gamma dose for the basement region varied from 9.2 x 10⁷ rads to 1.4 x 10⁸ rads.
As in Case 3, dose rate decreased with increasing annulus elevation. Case 4 dose rates were less than the Case 3 dose rates because less activity was in the sump water due to Case 4 being an arrested sequence. Case 4 total gamma dose in the annulus was less than in corresponding Case 3 dose point locations. Interior compartment and dome gamma total doses for Case 4 were identical to those in Case 3.
Dose rate and total dose figures for Case 4 are listed in Appendix B. The airborne and sump contributions to the Case 4 basement and annulus dose rates are listed in Appendix C. Dose rates in the remainder of containment are due only to airborne sources.
-38-

Table 5.4
Case 4 Dose Rate and Total Dose
Basement A B C D E F G H _1_
lh gr 8.s0es 8.6les 8.42es 8.27es 6.42es 6.l0es 6.48es 6.l0es s.68es br 4.s8es 4.s8es 4.s8es 4.s8es 4.s8es 4.s8es 4.s8es 4.s8es 4.s8es
ly gr 4.86e3 4.92e3 4.82e3 4.74e3 3.67e3 3.s3e3 3.78e3 3.s3e3 3.3le3 br 7.l4e2 7.l4e2 7.l4e2 7.l4e2 7.l4e2 7.l4e2 7.l4e2 7.l4e2 7.l4e2
ly gt 8.70e7 8.90e7 8.70e7 8.s0e7 6.60e7 6.30e7 6.80e7 6.30e7 s.90e7 bt 3.70e7 3.70e7 3.70e7 3.70e7 3.70e7 3.70e7 3.70e7 3.70e7 3.70e7
Annulus A B C D ~
lh gr 4.80es 1. sles 1.07es 9.96e4 l.32es br 7.97es 7.97es 7.97es 7.97es 7.97es
ly gr 2.4ge3 s.42e2 2.4le2 l.02e2 3.0sel , br l.30e3 1. 30e3 l.30e3 l.30e3 l.30e3
"" ly gt 4.60e7 1.l0e7 s.30e6 3.20e6 2.70e6 '" , bt 6.80e7 6.80e7 6.80e7 6.80e7 6.80e7
00 Floor/Dome _F_ G H I --:!
1h gr 9.10e4 1.72es 1.61es 2.70es 2.4ges br 2.3se6 2.3se6 2.3se6 2.3se6 2.3se6 ,~ t;;
1y gr 0.58 0.58 1.10 1.10 0.33 br 3.14e3 3.14e3 3.14e3 3.14e3 3.14e3
1y gt l.60e6 3.0e6 2.80e6 4.60e6 4.s0e6 bt 1.60e8 1.60e8 1.60e8 1.60e8 1.60e8

Table S.4
Case 4 Dose Rate and Total Dose (Continued)
RHR Cubicle A B C D E
lh gr 3.14e4 4.31e4 8.1ge4 S.ISe4 4.77e4 br 3.08e6 3.08e6 3.08e6 3.08e6 3.08e6
ly gr 0.27 0.36 0.69 0.44 0.40 br 4.82e3 4.82e3 4.82e3 4.82e3 4.82e3
ly gt S.30eS 7.30eS 1.40e6 8.80eS 8.10eS bt 2.60e8 2.60e8 2.60e8 2.60e8 2.60e8
Steam Gen A A B C D _E_ m v
lh gr S.82e4 S.S7e4 l.OOeS 6.94e4 6.Sle4 br 3.01e6 3.01e6 3.01e6 3.01e6 3.01e6
ly gr 0.49 0.47 0.8S 0.S9 O.SS I br 4.83e3 4.83e3 4.83e3 4.83e3 4.83e3
""" ly gt 1.0e6 9.SeS l. 7e6 1.2e6 1.le6 0 I bt 2.6e8 2.6e8 2.6e8 2.6e8 2.6e8
gr: gamma dose rate br: beta dose rate gt: gamma total dose bt: beta total dose

5.2 Peach Bottom Dose Results
Four variations of the AE sequence were calculated. The AE sequence is a large break LOCA with one initiating event and a combination of failures in two emergency cooling systems. Case 1 is the base case or the AE sequence itself. Case 2 investigates the effect of arresting the core meltdown in Case 1, with core-concrete attack radionuclide release being removed. Case 3 simulates drywell spray operation by removing all airborne activity except noble gases. No activity remains on the containment surface. Case 4 simulates an arrested sequence (with drywell sprays operational) by removing all radionuclide activity generated during core-concrete attack.
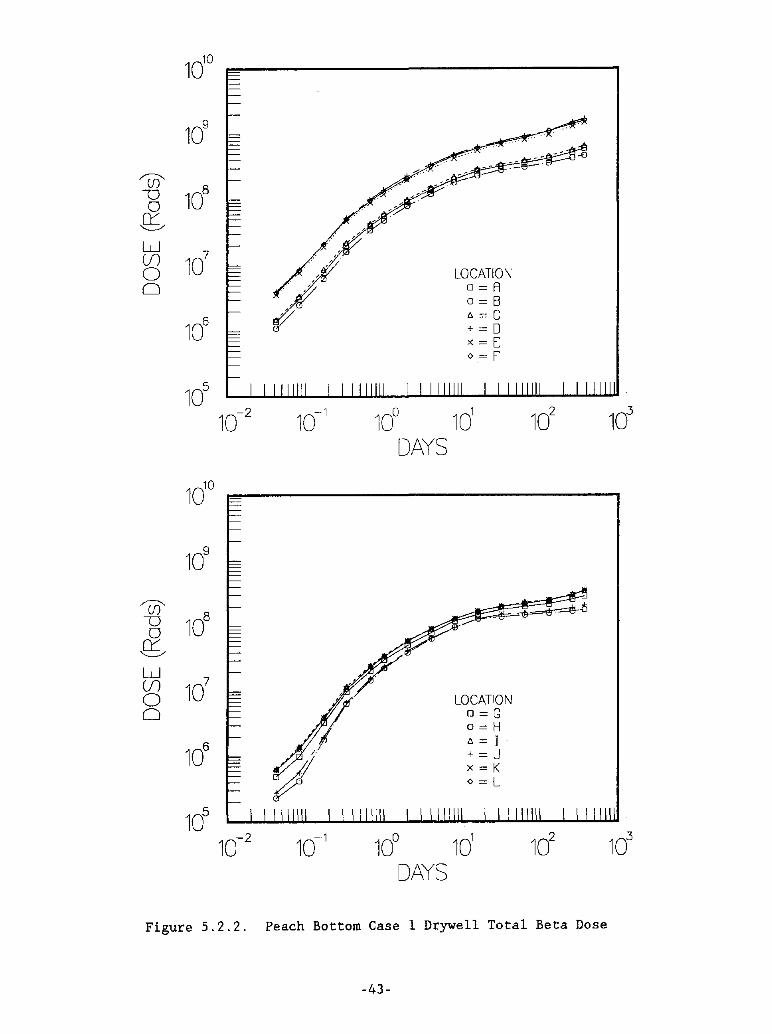
5.2.1 Case 1 Dose Results
Figures 5.2.1 and 5.2.2 show total dose in the Peach Bottom drywell. Gamma doses showed moderate positional dependence for dose points in the drywell bulb; dose was lower for dose points located in the "upper stem" of the drywell bulb. Gamma doses showed minor positional dependence for dose points at the same elevation. The dose at points in the middle of the drywell bulb were greater than the other locations. The floor and wall sources dominated the gamma total dose values; both were within an order of magnitude of each other throughout the entire scenario. The airborne source activity was equal in magnitude to the floor and wall source activittes at early scenario times «16 hours) but rapidly decayed during later scenario times becoming two to three orders of magni tude less than the floor and wall sources (Table C.23).
Beta dose also showed substantial positional dependence in the drywell. Beta dose was highest in the center of the drywell bulb and lowest at the top of the bulb and stem. Dose points near the walls generally had higher dose values than dose points in the bulb interior at the same elevation. Contributions to total beta dose from the airborne, wall, and floor sources were generally within an order of magnitude of one another for locations in the drywell bulb along the wall. Floor contributions were minimal at dose point locations in the drywell stem (Table C.24). Early discontinuities in the beta dose rate plots (Appendix B) reflected drywell gas density changes.
Gamma total dose values ranged from 9.8 x 10⁷ rads to 1.8x 10⁸ rads in the drywell bulb and from 3.3 x 10⁷ rads to 5.2 x 10⁷ rads in the drywell stem. Beta total dose values ranged from 4.7 x 10⁸ rads to 6.6 X 10⁸
rads at the bottom of the drywell bulb, 1.5 x 10⁹ rads to 1.7 x 10⁹ rads at the middle of the drywell bulb, and 1.8 x 10⁸ to 3.5 X 10⁸ rads at the top of the drywell bulb and in the stem.
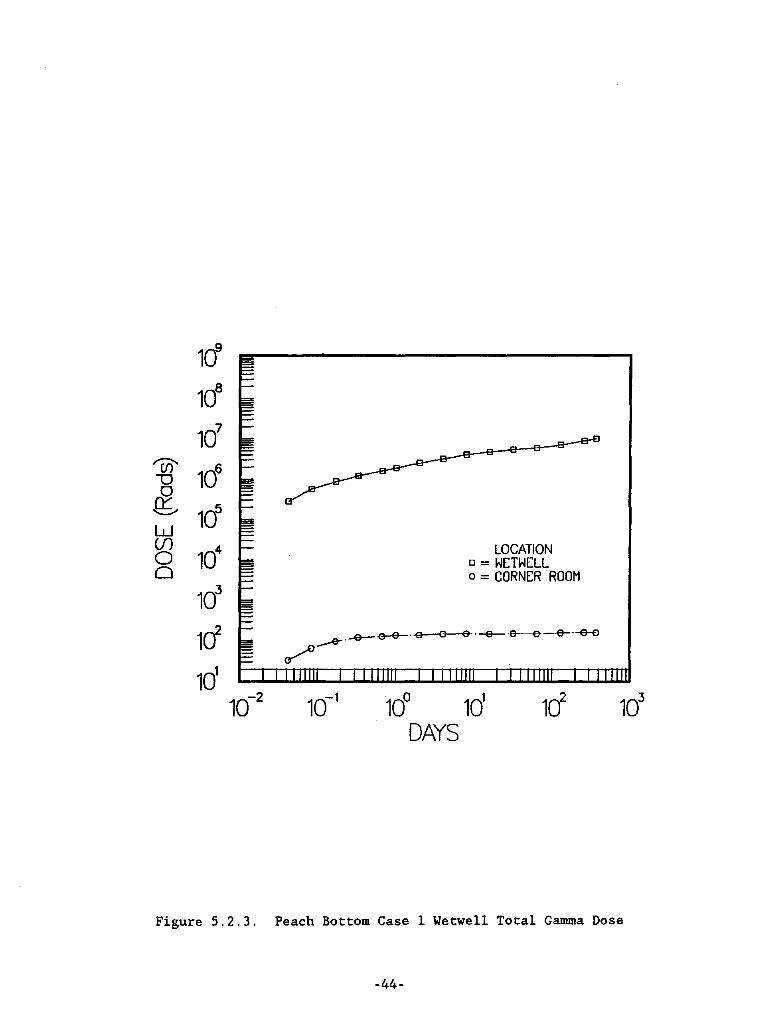
Figure 5.2.3 illustrates the gamma total dose due to the radionuclide activity in the toroidal wetwel1. The gamma dose was significantly reduced when comparing dose values inside the torus room to dose values inside the corner (quad) room. Total gamma dose at one year in the torus room was calculated to be 1 x 10⁷ rads. Total gamma dose in the quad room was 1.6 x 10² rads. Beta dose was not calculated to occur in the
-41-

108
'U)' '" u 0
-Q; 10
7
W (J) 0 LOCATION 0 o=A
106 0=8
(; = C + = 0 x=E 0= F'
105
10-2 10-1 10° 1d 102
103
DAYS
109
108
'U)' u 0
-Q; 10
7
W (J) 0 LOCATION 0 o=G
106 o=H
{; = I + = J x = K o=L
105
10-2 10-1 10° 1d 102
103
DAYS
Figure 5.2.1. Peach Bottom Case 1 Drywe11 Total Gamma Dose
-42-
1do =-----------------,
109
'CiJ' 10
8 U 0
-Q; w
1d fJ) 0 LOCATION 0 o=A
o=B
106 " = C
+ = 0 x = E 0= r
105
10-2 10-1 10° 1d 102 10'3
DAYS
1do
109
'CiJ' 10
8 U 0
-Q; W
107 fJ)
0 LOCATION 0 o=G
o=H
106 I'. = J .
+ = J x = K 0= L
105
10-2 10-1 10° 1d 102
103
DAYS
Figure 5.2.2. Peach Bottom Case 1 Drywell Total Beta Dose
-43-
-v>' ""0 0 g; w (f) 0 0
109
108
107
106
1cT
104
103
1d 1d
10-2
LOCATION 0= WETWELL o = CORNER ROOM
Figure 5.2.3. Peach Bottom Case 1 Wetwell Total Gamma Dose
-44-

torus room due to the shielding of the wetwell torus. Dose at the ceiling of the torus room would be approximately equal to that shown in Figure 5.2.3. Dose in the reactor building just above the torus room (elevation 135) should be similar to the dose calculated to occur in the quad room.
Appendix B contains the dose rate plots corresponding to the doses shown in Figures 5.2.1 through 5.2.3.
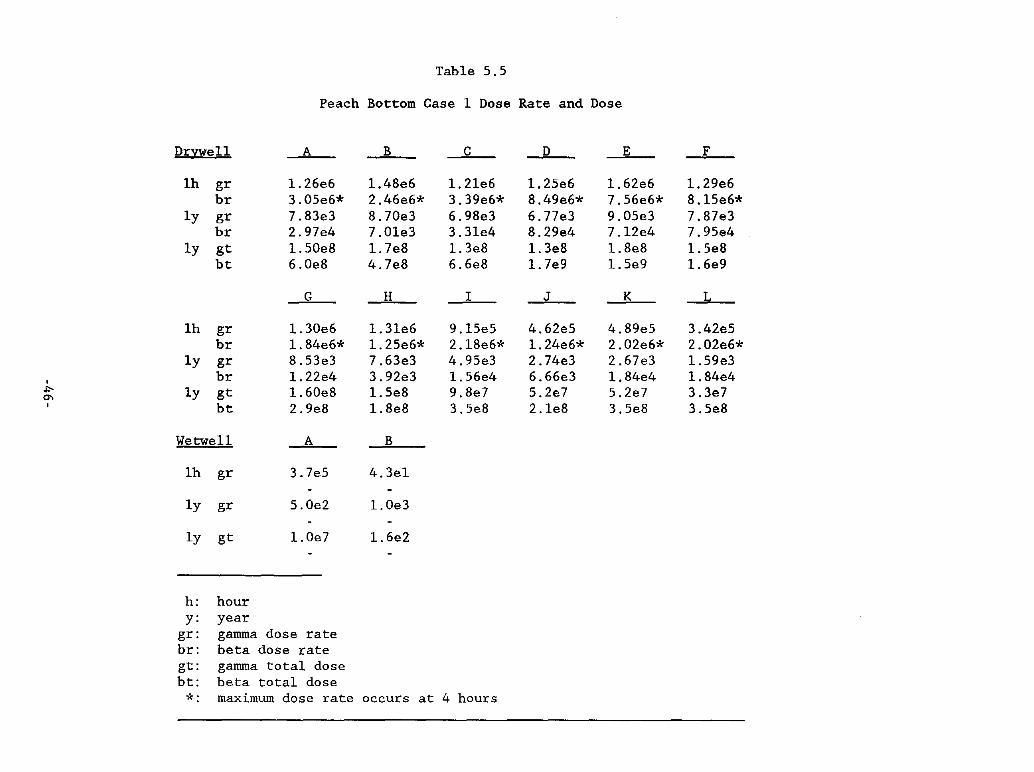
Table 5.5 summarizes the dose rate at one hour and one year and total dose at one year.
The airborne, floor, and wall contributions for the Case 1 drywell dose rates are listed in Appendix C. The sump, airborne, and wall contributions for the wetwell dose rates are also listed in Appendix C.
-45-
, +:-0'\ ,
Table 5.5
Peach Bottom Case 1 Dose Rate and Dose
Drywe11
1h gr br
1y gr br
1y gt bt
1h gr br
1y gr br
1y gt bt
We twe 11
1h gr
1y gr
1y gt
h: hour y: year
A
1.26e6 3.05e6* 7.83e3 2.97e4 1. 50e8 6.0e8
G
1.30e6 1.84e6* 8.53e3 1. 22e4 1.60e8 2.ge8
A
3.7e5
5.0e2
1.0e7
gr: gamma dose rate br: beta dose rate gt: gamma total dose bt: beta total dose
B C
1.48e6 1. 21e6 2.46e6* 3.3ge6* 8.70e3 6.98e3 7.01e3 3.31e4 1. 7e8 1.3e8 4.7e8 6.6e8
H I
1.31e6 9.15e5 1.25e6* 2.18e6* 7.63e3 4.95e3 3.92e3 1.56e4 1.5e8 9.8e7 1.8e8 3.5e8
J
4.3e1
1.0e3
1.6e2
*: maximum dose rate occurs at 4 hours
D E
1.25e6 1.62e6 8.4ge6* 7.56e6* 6.77e3 9.05e3 8.2ge4 7.12e4 1.3e8 1.8e8 1. 7e9 1.5e9
J K
4.62e5 4.8ge5 1.24e6* 2.02e6* 2.74e3 2.67e3 6.66e3 1.84e4 5.2e7 5.2e7 2.1e8 3.5e8
F
1. 2ge6 8.15e6* 7.87e3 7.95e4 1.5e8 1.6e9
-.l
3.42e5 2.02e6* 1.5ge3 1.84e4 3.3e7 3.5e8

5.2.2 Case 2 Dose Results
Table 5.6 summarizes total dose for the Case 2 calculations. Case 2 gamma doses were essentially the same as those calculated for Case 1; PATH calculated no significant differences between the two cases. Drywell beta dose calculated for Case 2 was lower than that calculated for Case 1, but the fact that these changes can be attributed to scenario radionuclide inventory variations is not clear. The lower beta doses are more likely due to the different thermal-hydraulic conditions (drywell gas temperature, pressure, and density) that were calculated for Case 1 and Case 2. Total maximum beta doses at one year ranged from 2 x 10⁸
rads at the drywell bottom to 6 x 10⁸ rads at the drywell center to 2.1 x 10⁸ rads at the top of the drywell. PATH calculated no difference in wetwell gamma dose rates for Case 1 and Case 2.
Case 2 dose rate and total dose figures are given in Appendix B. The airborne, floor, and wall contributions for the drywell rates are listed in Appendix C. The wetwell sump, airborne, and wall contributions for the wetwell dose rates are also listed in Appendix C.
-47-
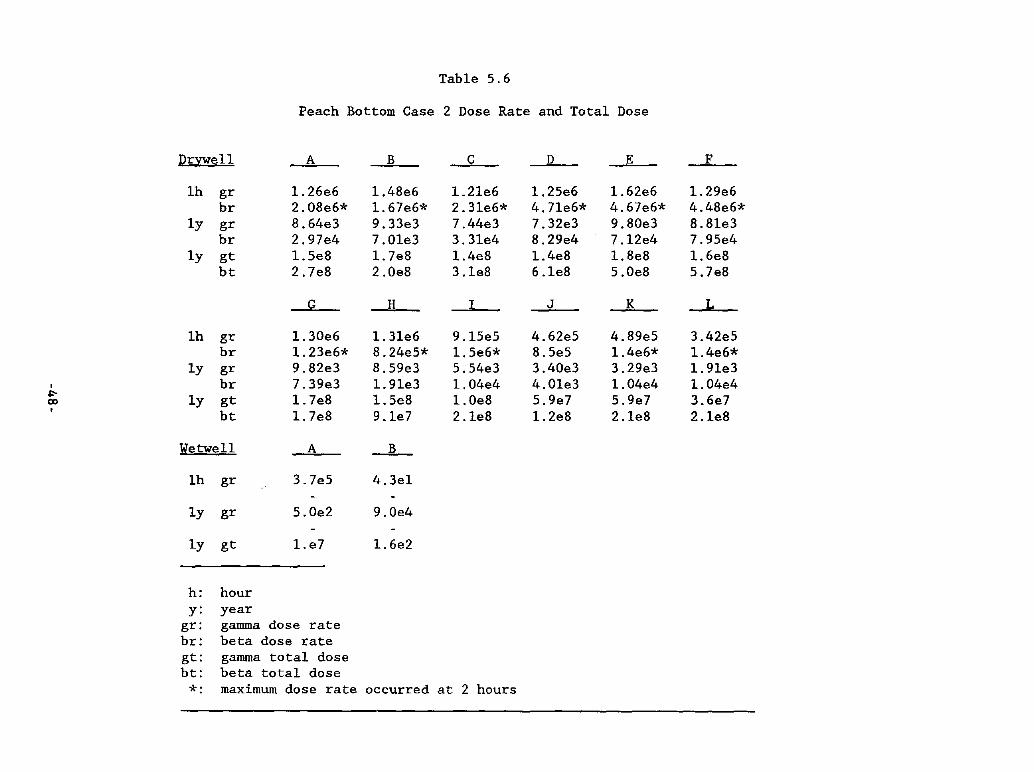
Table S.6
Peach Bottom Case 2 Dose Rate and Total Dose
Drywe11 A B C D E F
lh gr 1.26e6 1.48e6 1.21e6 1.2Se6 1.62e6 1. 2ge6 br 2.0Se6* 1. 67e6* 2.31e6* 4.71e6* 4.67e6* 4.4Se6*
ly gr S.64e3 9.33e3 7.44e3 7.32e3 9.S0e3 S.81e3 br 2.97e4 7.01e3 3.31e4 S.2ge4 7.12e4 7.9Se4
ly gt 1.SeS 1. 7e8 1.4eS 1.4eS 1.8e8 1.6eS bt 2.7eS 2.0eS 3.1eS 6.1eS S.Oe8 S.7e8
_G_ H I J K J
lh gr 1.30e6 1. 31e6 9.1SeS 4.62eS 4.SgeS 3.42eS br 1.23e6* S.24eS* 1.Se6* S.SeS 1.4e6* 1.4e6*
ly gr 9.B2e3 S.Sge3 S.S4e3 3.40e3 3.2ge3 1.91e3 , br 7.3ge3 1. 9le3 1.04e4 4.01e3 1.04e4 1.04e4
.j>o ly gt 1. 7eS 1.Se8 1.OeB S.ge7 S.ge7 3.6e7 00 ,
bt 1. 7eS 9.1e7 2.1e8 1.2eB 2.1eS 2.1e8
We twe 11 A _B_
lh gr 3.7eS 4.3el
ly gr S.Oe2 9.0e4
ly gt l.e7 l.6e2
h: hour y: year
gr: gamma dose rate br: beta dose rate gt: gamma total dose bt: beta total dose
*: maximum dose rate occurred at 2 hours
5.2.3 Case 3 and Case 4 Dose Results
Spray operation greatly reduced radionuclide activity in the drywell region. Gamma dose showed a moderate dependence on dose point location; this dependence was less than in Case 1 since surface sources were assumed not to exist in Case 3. Total gamma dose at one year ranged from 6.5 x 10⁶ rads in the drywell stem to 1.7 x 10⁷ rads at mid-elevation in the drywell bulb. Case 3 beta dose was also substantially below the Case 1 beta dose. Total beta dose in the drywell was calculated to be 0.93 X 10⁸ rad at one year. Since only uniform airborne activity was assumed to occur in Case 3, a one volume drywell model was used for Case 3. Therefore, there is no data on beta dose dependence with drywell position.
Total gamma dose in the torus room was 1 x 10⁷ rads. Total gamma dose at one year in the quad room was 1.5 x 10² rads. No beta dose was calculated to occur in the torus room of the wetwell because the steel toroid shielded the torus room from electron activity inside the wetwell torus.
PATH and ITS Case 4 gamma and beta dose rates were almost identical to those calculated for Case 3. Case 4 dose rate and dose value figures are located in Appendix B.
Table 5.7 summarizes dose rate values at one hour and one year as well as total dose values at one year for Cases 3 and 4.
Case 3 and Case 4 sump, airborne, and wall contributions to the wetwell dose rates are listed in Appendix C.
-49-
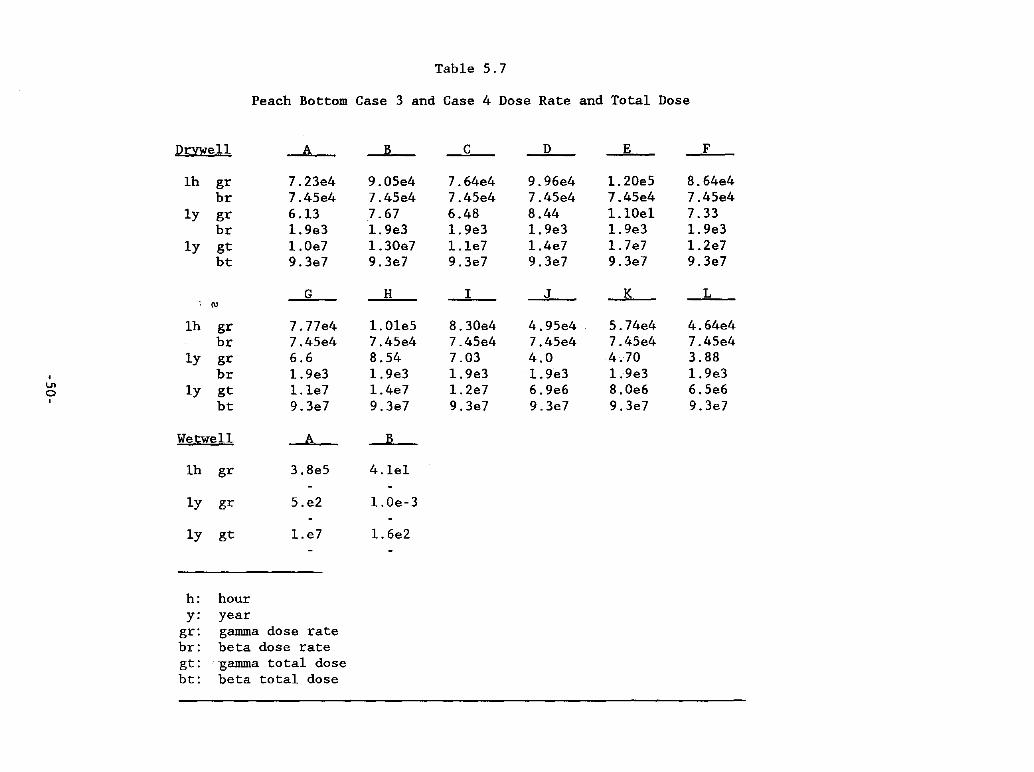
• 1.11 0 •
Table 5.7
Peach Bottom Case 3 and Case 4 Dose Rate and Total Dose
Drywell
lh gr br
ly gr br
ly gt bt
'; N
lh gr br
ly gr br
ly gt bt
Wetwell
lh gr
ly gr
ly gt
h: hour y: year
A
7.23e4 7.45e4 6.13 1.ge3 1.0e7 9.3e7
G
7.77e4 7.45e4 6.6 1.ge3 1.le7 9.3e7
A
3.8e5
5.e2
1.e7
gr: gamma dose rate br: beta dose rate gt: ~amma total dose bt: beta total dose
B
9.05e4 7.45e4 7.67 1.ge3 1.30e7 9.3e7
H
1.01e5 7.45e4 8.54 1.ge3 1.4e7 9.3e7
B
4.lel
1.0e-3
1.6e2
C D E _F_
7.64e4 9.96e4 1.20e5 8.64e4 7.45e4 7.45e4 7.45e4 7.45e4 6.48 8.44 1.l0el 7.33 1.ge3 1.ge3 1.ge3 1. ge3 1.le7 1.4e7 1. 7e7 1.2e7 9.3e7 9.3e7 9.3e7 9.3e7
I -----.J: K L
8.30e4 4.95e4 5.74e4 4. 64e4 7.45e4 7.45e4 7.45e4 7.45e4 7.03 4.0 4.70 3.88 1.ge3 1.ge3 1.ge3 1.ge3 1.2e7 6.ge6 8.0e6 6.5e6 9.3e7 9.3e7 9.3e7 9.3e7
5.3 Comments on Surry and Peach Bottom Case 1 and Case 2 Dose Results
The Surry and Peach Bottom Case 1 total dose values are relatively high at certain containment locations when compared to current DBA total dose equipment qualification levels. Locations at which high doses are calculated generally occur where two or more of the airborne, wall, and floor sources have a significant effect on dose rate.
The dose rate tables in Appendix C show that the floor and wall sources are the major contributors to the gamma dose rate values. The gamma floor and wall source dose rates diminish slowly and are significantly higher than the airborne source dose rate after 1 to 4 days into the scenario analysis. At one year, floor and wall gamma dose rate values have been calculated to be i~ the 103 rads/hour range.
The same general trend between airborne, wall, and floor sources for beta dose was also observed. Beta airborne sources did not diminish as rapidly as the gamma airborne sources, but. the beta wall and floor sources resulted in year end dose rates to be roughly an order of magnitude larger than year end dose rates due to the airborne source. At one year, floor and wall beta dose rate values have been calculated to be in the 103 to 104 rads/hour range.
The primary reason for the high calculated gamma and beta total dose is due to the radionuc1ide inventory makeup of the floor and wall sources at latter time periods in the analysis. When compared to the airborne isotopes, the floor and wall sources have isotopes with long lived and relatively high activities combined with large energy decays per particle. The top three isotopes for the floor and wall sources at late time periods included CS 134, BA 137M (a daughter of CS 137), and NB 95. The top three isotopes and their contributions to dose for the Surry and Peach Bottom calculations are listed in Appendix D. The major isotopes are listed for airborne, wall, floor, and sump source terms.
Surry Case 1 total gamma and beta dose was calculated to range from 1.17 x 10⁹ rads to 3 x 10⁹ rads in the basement, 3.22 x 10⁸ rads to 1.29 x 10⁹
rads in the annulus, 2.7 x 10⁸ rads to 1.86 x 10⁹ rads in the dome, and 2.38 X 10⁸ rads to 1. 99 X 109 rads in the steam generator A cubicle (containment interior). Reg Guide 1.89, Appendix D, suggests an equipment qualification dose of 2.2 X 10⁸ rads. Therefore, Reg Guide 1.89, Appendix D levels are exceeded by 530 to 1360 percent in the basement, 146 to 590 percent in the annulus, 125 to 845 percent in the dome, and 108 to 904 percent in the steam generator A cubicle. The wall and floor sources were the major contributors to the higher doses calculated in this study.
Surry Case 2 total gamma and beta dose was less than the Case 1 total dose. Given the uncertainties in the source calculations, PATH, and ITS codes, the agreement between total calculated dose and the 2.2 x 10⁸ rad Reg Guide 1.89, Appendix D dose is not bad. Appendix D levels were exceeded by 136 to 645 percent in the basement, 0 to 142 percent in the annulus, 0 to 231 percent in the dome, and 0 to 353 percent in steam generator cubicle A.
-51-
Peach Bottom Case 1 drywell total gamma and beta dose was calculated to range from 2.35 X 10⁸ rads to 1.83 X 10⁹ rads. These calculated doses exceed the Reg Guide 1.89, Appendix D .level by 107 to 832 percent. Case 2 drywell total gamma and beta dose ranged from 1.79 x 10⁸ rads to 7.50 x 10⁸ rads; Appendix D test levels were exceeded by 0 to 340 percent.
The beta wall and floor dose rate calculations used relatively simple and symmetric zoning of the Surry and Peach Bottom containments. Wall and floor sources were frequently cylindrical, circular, or spherical in nature; therefore zones of concentric cylinders or spheres were often chosen for the containment zones. Nonuniform dose rate variation between adj acent zones has been observed in these calculations and is demonstrated in Table C. 2 for a wall source calculation. The beta dose rates for location F under column W were calculated for the zone adjacent to the reactor cavity wall in Figure A.I. Dose rates under column w' were calculated for the second zone from the reactor cavity wall. We believe that the simple and symmetric zoning used and the nonuniform dose rates indicate that the current models may provide somewhat conservative wall and floor beta dose rates. Further parametric studies using finer zone nodalizations in regions of containment with calculated high beta dose should be performed.
5.4 Comments on PATH and ITS Isotope Inventory
Many gamma shielding codes are limited by the number of radionuclides which they can use for shielding calculations; some problems can occur when the number of radionuclides determined to occur in a simulation exceeds those used by the shielding code.
PATH has a standard gamma energy group structure library to convert an isotopic source into a gamma source energy spectrum. The PATH library can handle 125 isotopes. The source term radionuclide inventory calculated by BCL contains 152 isotopes. Isotopes common to both PATH and the BCL list were limited to 81 of the 152 isotopes. Table 5.8 lists the BCL isotopes; isotopes common to BCL and PATH are noted in Table 5.8.
To quantify the relative contribution of isotopes missing from PATH, beta and gamma decay energies per particle were obtained for all of the BCL isotopes from the ENDF/B-V8 data for fission products and actinides. The activity of each isotope for each time period of each case was multiplied by their respective decay energies to get the total energy associated with each isotope as a function of time. The energies of the missing isotopes were then compared with the energies of the isotopes used by PATH. Table 5.9 presents the sum of the isotope energies used by PATH divided by the sum of missing and PATH isotope energies. Table 5.9 only addresses the gamma energies. Table 5.9 shows that the missing gamma isotopes contribute less than 5 percent of the total energies.
Beta energy spectra were available for 131 of the 152 isotopes during the ITS calculations. Table 5.8 also lists the isotopes common to the BCL output and ITS calculations. ENDF/B-V energy calculations similar to
-52-
those discussed above for the gamma energies were also performed for the beta energies. Energies of the missing isotopes contributed less than 2 percent of the total energies.
-53-
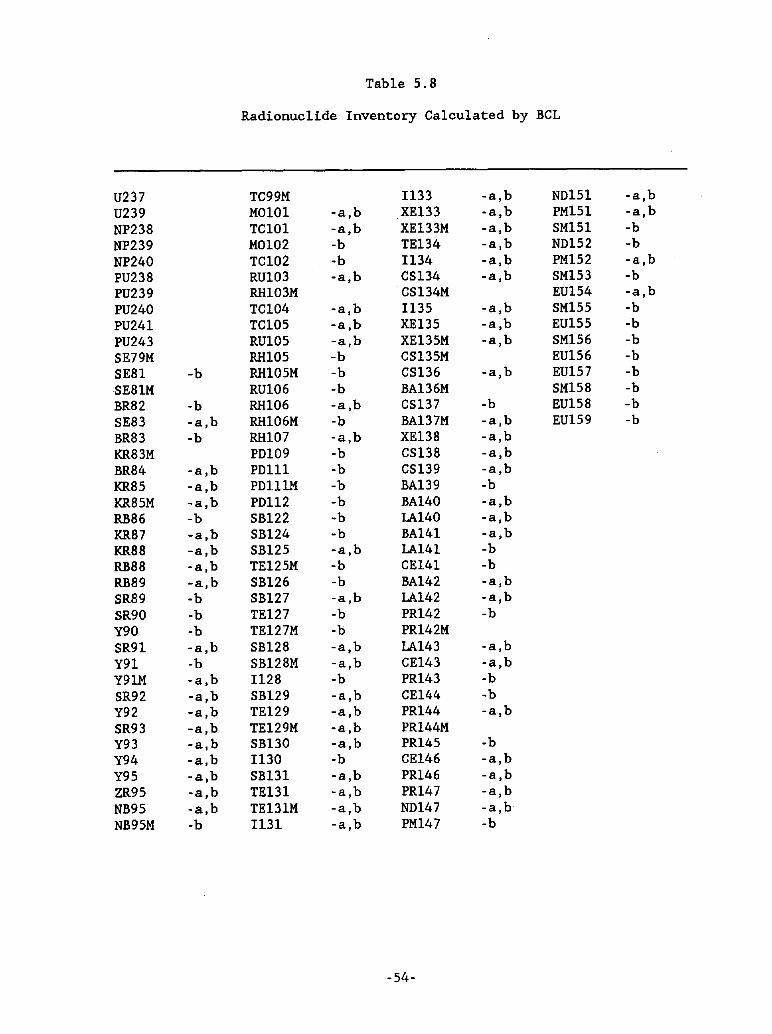
Table 5.8
Radionuclide Inventory Calculated by BCL
U237 TC99M I133 -a,b NDl51 -a,b U239 MOIOI -a,b XEl33 -a,b PMl51 -a,b NP238 TCIOI -a,b XE133M -a,b SMl51 -b NP239 MOI02 -b TE134 -a,b NDl52 -b NP240 TCI02 -b I134 -a,b PMl52 -a,b PU238 RUI03 -a,b CS134 -a,b SM153 -b PU239 RHI03M CSl34M EUl54 -a,b PU240 TCI04 -a,b I135 -a,b SMl55 -b PU241 TCI05 -a,b XE135 -a,b EU155 -b PU243 RUI05 -a,b XE135M -a,b SMl56 -b SE79M RH105 -b CSl35M EUl56 -b SE81 -b RHI05M -b CS136 -a,b EUl57 -b SE8lM RUI06 -b BA136M SMl58 -b BR82 -b RHI06 -a,b CS137 -b EUl58 -b SE83 -a,b RHI06M -b BA137M -a,b EUl59 -b BR83 -b RHI07 -a,b XE138 -a,b KR83M PDI09 -b CS138 -a,b BR84 -a,b PDlll -b CS139 -a,b KR85 -a,b PDlllM -b BA139 -b KR85M -a,b PD112 -b BAl40 -a,b RB86 -b SBl22 -b LAl40 -a,b KR87 -a,b SBl24 -b BAl41 -a,b KR88 -a,b SBl25 -a,b LAl41 -b RB88 -a,b TEl25M -b CEl41 -b RB89 -a,b SBl26 -b BAl42 -a,b SR89 -b SBl27 -a,b LAl42 -a,b SR90 -b TEl27 -b PRl42 -b Y90 -b TEl27M -b PRl42M SR91 -a,b SBl28 -a,b LAl43 -a,b Y91 -b SBl28M -a,b CEl43 -a,b Y9lM -a,b 1128 -b PRl43 -b SR92 -a,b SBl29 -a,b CEl44 -b Y92 -a,b TEl29 -a,b PRl44 -a,b SR93 -a,b TEl29M -a,b PRl44M Y93 -a,b SB130 -a,b PRl45 -b Y94 -a,b 1130 -b CEl46 -a,b Y95 -a,b SB131 -a,b PRl46 -a,b ZR95 -a,b TE131 -a,b PRl47 -a,b NB95 -a,b TE13IM -a,b NDl47 -a,b NB95M -b I131 -a,b PMl47 -b
-54-

Table 5.8
Radionuclide Inventory Calculated by BCL (Continued)
NB96 -a,b XEl3lM -b PMl48 -a,b ZR97 -a,b TEl32 -a,b PMl48M -a,b NB97 -a,b Il32 -a,b NDl49 -a,b NB97M -a,b TE133 -a,b' PMl49 -b M099 -a TE133M -a,b PMl50 -b
a: isotopes used in PATH b: isotopes used in ITS
-55-

Table 5.9
Gamma Total Energies Used by PATH
Surry ~ ~ --.m..... ~
1h a 0.995 0.995 0.999 0.999 w 0.994 0.994 f 0.994 0.994 s 0.994 0.994
4h a 0.945 0.992 0.999 0.999 w 0.985 0.991 f 0.975 0.991 5 0.966 0.990
16h a 0.992 0.999 0.999 0.999 w 0.973 0.990 f 0.950 0.990 s 0.956 0.990
2d a 0.998 0.998 0.998 0.998 w 0.973 0.993 f 0.948 0.992 5 0.955 0.993
8d a 0.995 0.995 0.995 0.995 w 0.980 0.995 f 0.964 0.994
. ·5 0.968 0.994
32d a 0.956 0.956 0.956 0.956 w 0.977 0.988 f 0.971 0.987 5 0.972 0.987
128d a 0.972 0.972 0.972 0.972 w 0.985 0.987 f 0.983 0.987 5 0.983 0.987
1y a 1. 1. l. l. w 0.984 0.985 f 0.983 0.985 s 0.983 0.985
-56-

Table 5.9
Gamma Total Energies Used by PATH (Continued)
Peach Bottom ~ ~ ~ ~
1h da 0.996 0.996 0.999 0.999 dw 0.995 0.995 df 0.995 0.995 wa 0.999 0.999 0.999 0.999 ww 0.995 0.995 0.995 0.995 ws 0.995 0.995 0.995 0.995
4h da 0.998 0.999 0.999 0.999 dw 0.978 0.994 df 0.979 0.994 wa 0.999 0.999 0.999 0.999 ww 0.994 0.994 0.994 0.994 ws 0.989 0.994 0.988 0.994
16h da 0.999 0.999 0.999 0.999 dw 0.994 0.994 df 0.990 0.994 wa 0.999 0.998 0.999 0.998 ww 0.994 0.994 0.994 0.994 ws 0.991 0.994 0.986 0.994
2d da 0.998 0.998 0.998 0.998 dw 0.996 0.996 df 0.992 0.997 wa 0.998 0.997 0.998 0.997 ww 0.997 0.997 0.997 0.997 ws 0.993 0.997 0.987 0.996
8d da 0.995 0.995 0.995 0.995 dw 0.997 0.997 df 0.994 0.997 wa 0.994 0.996 0.995 0.996 ww 0.997 0.997 0.997 0.997 ws 0.994 0.997 0.989 0.997
32d da 0.956 0.956 0.956 0.956 dw 0.988 0.988 df 0.985 0.988 wa 0.956 0.965 0.956 0.965 ww 0.989 0.989 0.989 0.989 ws 0.985 0.988 0.981 0.987
-57-

Table 5.9
Gamma Total Energies Used by PATH (Concluded)
Peach Bottom ~ ~ -li.. ~
128d da 0.973 0.976 0.976 0.976 dw 0.985 0.985 df 0.984 0.985 wa 0.974 0.979 0.974 0.974 ww 0.985 0.985 0.985 -0.985 ws 0.985 0.985 0.984 0.984
ly da 1.0 1.0 1.0 1.0 dw 0.982 0.982 df 0.982 0.982 wa 0.984 0.984 0.999 0.984 ww 0.982 0.982 0.982 0.982 ws 0.982 0.982 0.983 0.982
a: airborne w: wall f: floor s: sump
da: drywell airborne dw: drywell wall df: drywell floor wa: wetwell airborne ww: wetwell wall ws: wetwell sump
-58-

5.5 Other Dose Rate and Dose Work
Appendix D of Regulatory Guide 1.89 presents methodology and sample calculations for equipment qualification radiation dose. This appendix discusses the staff model for calculating dose rates and integrated doses for equipment qualification purposes. Gamma and beta doses were calculated at the midpoint of containment for a PWR plant with a free containment volume of 2.5 X 10⁶ cubic feet and a power rating of 4,100 MWt (Surry has a free containment volume of 1.75 x 10⁶ cubic feet and a power rating of 2,441 MWt). ESF fans and sprays were modeled to be operational. The staff assumed that 50 percent of the iodine core activity inventory and 100 percent of the core noble gas activity inventory were released instantaneously to the containment atmosphere. The reader is referred to Reg Guide 1.89 for further details and assumptions used in the analysis.
The Reg Guide 1.89 airborne noble gas gamma and beta dose are shown in Figure 5.4.1. The Surry Case 4 annulus and dome integrated gamma and beta dose are shown in Figures 5.4.2 and 5.4.3. No direct comparison is intended since both reactors analyzed are different, but both analyses do show the dose due to noble gas activity. The gamma and beta doses for each analysis have roughly equivalent values; the Surry minimum and maximum dose values bound the staff dose values.
-59-
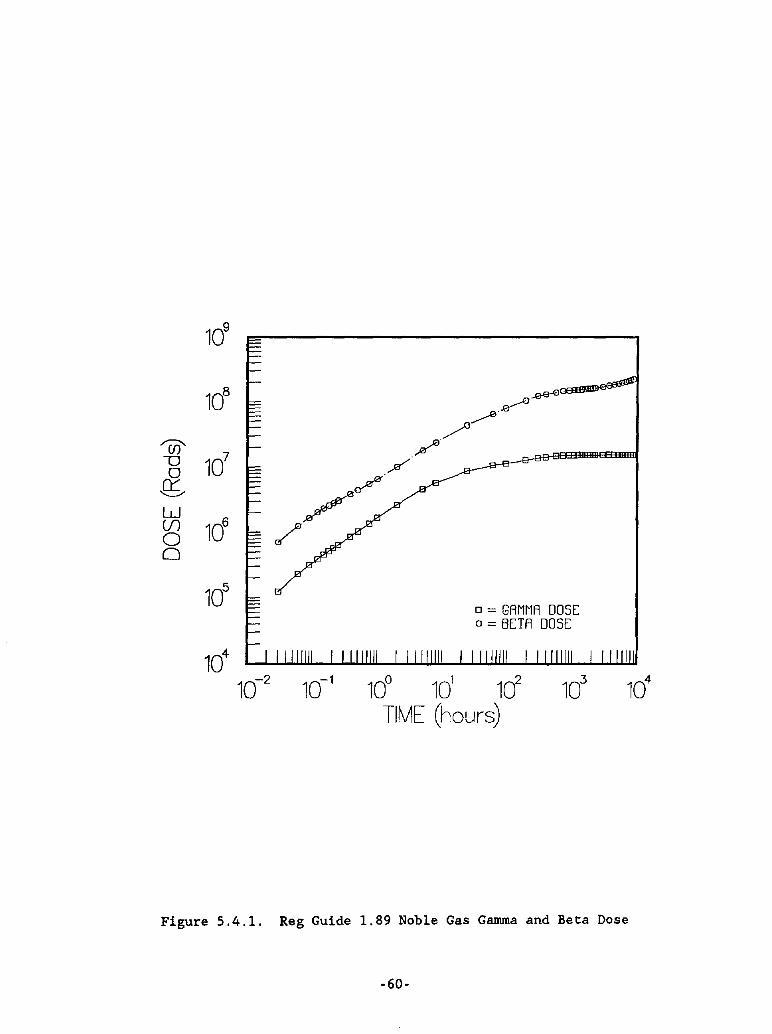
109
108 ..e-e-e
.....--e.~ /
'(jj'
107 /
""0 / 0 -Q; // W
106 (f) / 0
0
105
o = GAMMA DOSE 0= BETA DOSE
104
10-2 10-1 10° 1d 102
103
104
TIME (hours)
Figure 5.4.1. Reg Guide 1.89 Noble Gas Gamma and Beta Dose
-60-

107
~ u 0 g,
106
W (J) 0 0
105
108
~ u 0
g, 10
7
W (J) 0 0
106
105
10-2 10-1
LOCATION o=A 0=8 6=C +=0 x=[
10° 1d DAYS
LOCATION 0= A-I
10° 1d DAYS
102
103
Figure 5.4.2. Surry Case 4 Annulus Total Gamma and Beta Dose
-61-

1cf
107
"(ff "'0
& ~ 10
6
W (f) 0 0 LOCATION
1cf []=r o=G A=H + = I x=J
104
10-2 10-1 10° 1d 1ct 1d
DAYS
1dO
109
""eli' 1cf u
0 ,Q; W
107 VJ
0 0
106
LOCATION 0= r-J
105
10-2 10-1 10° 1d 102
103
DAYS
Figure 5.4.3. Surry Case 4 Dome Total Gamma and Beta Dose
-62-

6.0 SUMMARY AND RECOMMENDATIONS
Dose rates and total dose have been calculated for the Surry and Peach Bottom containments using radionuclide sources which have been developed as a function of time with the Source Term Code Package. The AB epsilon scenario and three variations were used to calculate dose rate for Surry and the AE scenario and three variations were used for Peach Bottom. For each plant,1 the variations involved (1) an arrested core meltdown, (2) operation of containment sprays and meltdown, and (3) an arrested sequence .with operation of containment sprays. The base case for each plant resulted in the highest dose rates and total dose. Surry total gamma and beta dose exceeded the Reg Guide 1.89 Appendix D dose of 2.2 x 10⁸ rads by as much as 1360 percent, and Peach Bottom total gamma and beta dose exceeded the Appendix D dose by as much as 832 percent. Therefore, equipment qualified to Appendix D levels may not be qualified for the base case severe accident levels. The Case 2 arrested sequence dose calculations for both Surry and Peach Bottom resulted in substantial total dose reduction throughout the containments. The majority of dose point locations studied were within a factor of 2 to 3 above the Appendix D levels. Case 3 and 4 scenarios resulted in total gamma and beta doses well below the Appendix D levels; Appendix D qualified equipment exposed to these environments should maintain their functional integrity.
Dose rate calculations in containment are highly dependent on the source term calculations. BCL staff believe that source term analysis uncertainties have been adequately bounded by the case variations selected for this study. Therefore, bounding source terms will give bounding dose rates. BCL staff also believes that the source terms are representative of the increased data base and improved calculational tools.
The BCL Surry source term analysis treated the containment as a single volume, and the Peach Bottom analysis treated the containment as two volumes (the drywell and wetwell). Deposition of radionuclides to walls, floors, and sumps was also characterized for the two reactor containment models. Calculations of physical transport of radionuclides in a multicompartment containment during and after the accident was beyond the scope of this study. BCL staff believed that the limited containment nodalization was adequate to reasonably predict deposition, but that addi tional modeling was needed to characterize the effects of compartmentalization.
The Surry dose rate calculations used actual compartment models. Dose rates were calculated for the dome region, operating floor region, basement, annulus, steam generator A cubicle, steam generator B cubicle, RHR cubicle, and incore instrumentation room. Uniform distribution of source terms was assumed for this calculation. This method could result in underestimating dose rate in compartments into which the source is released early in the accident and overestimating dose rate in compartments away from the source release point. Operation of ESFs such as sprays and fans could enhance source mixing in containment. Physical
-63-
transport of radionuclides in a multicompartment containment during the accident should be one area of future work.
Peach Bottom dose rate calculations modeled the drywell as one region and the wetwell as two regions (the wetwell torus and the torus room). Uniform distribution of radionuclides was also assumed during and after the accident; the uniform distribution assumption should- be reasonable for the drywell since it is a relatively open volume. . Operation of drywell sprays should also enhance mixing in the drywell. Uniform distribution in the wetwell torus may also be reasonable due to the mixing action of drywell gas/liquid injection into the torus.
Gamma dose rate calculations for Surry and Peach Bottom were true threedimensional calculations. Volume sources and surface sources had to be approximated by a series of point sources. PATH calculations become prohibitively expensive as volume or surface sources are approximated by increasing number of point sources. Al though care was taken to characterize the function of dose rate versus source point number, gamma dose rates could vary by as much as ±10 percent depending on the source point scheme used. One Peach Bottom and Surry case each should be selected from the eight examined and studied in greater detail assuming that further quantification of radionuclide transport in a multicompartment containment would be available.
ITS beta dose rate calculations for Surry and Peach Bottom were also three-dimensional calculations but were not as versatile as the PATH calculations for containment applications. Three-dimensional containment models are made by combining simple geometric shapes into a number of containment zones. Electron transport can be tracked three-dimensionally from zone to zone. Dose rate calculations are presented in terms of average electron energy deposition in each containment zone from specified electron sources. Finely dividing or nodalizing a containment into small zones would approach true three-dimensional electron dose rate calculations but would also result in prohibitive computing expenses. The Case 1 Surry and Peach Bottom wall and sur:face source dose rate calculations should be repeated with finer containment nodalization in locations which have high calculated beta doses.
BCL stated the Case 1 scenarios for Peach Bottom and Surry represented worst case radionuclide release. Case 2 scenarios were arrested sequences and radionuclide activity due only to core-concrete attack was removed from the radionuclide output; the removal of only the coreconcrete contribution implies that 100 percent core degradation occurred. Therefore, Case 2 could also represent a worst case scenario for radionuclide release when compared to accident sequences with less core damage. Other lesser core degradation percentages may be more likely to occur during accidents and may result in smaller dose calculations.
-64-

1. Theoretical Possibilities Large Nuclear Power Plants, June 1957.
REFERENCES
and Consequences of Major Accidents in WASH-740, U.S. Atomic Energy Commission,
2. DiNunno, J. J., et a1., Calculation of Distance Factors for Power and Test Reactor Sites, TID-14844, March 1962.
3. Silberberg, M., et a1., Reassessment of the Technical Bases for Estimatina: Source Terms, NUREG-0956, U.S. Nuclear Regulatory Commission, June 1986.
4. Environmental Oua1ification of Certain Electric Equipment Important to Safety for Nuclear Power Plants, Regulatory Guide 1.89, U. S. Nuclear Regulatory Commission, June 1984.
5. Su, S. D., et a1., PATH Gamma Shielding Code User's Manual, GAA16772, General Atomic Company, September 1982.
6. Ha1b1eib, J. A. and T. A., Mehlhorn, ITS: The Integrated Tiger Series of Coupled Electron/Photon Monte Carlo Transport Codes, SAND84-0573, Sandia National Laboratories, November 1984.
7. Report of the Special Committee on Source Terms, American Nuclear Society, September 1984.
8. England, T. R., et a1., Summary of ENDF/B-V Data for Fission Products and Actinides, EPRI NP-3787, LA-UR83-l285, Electric Power Research Institute, December 1984.
-65-

APPENDIX A
ITS CONTAINMENT BUILDING ZONES

Beta dose calculations required that the compartments listed in Table 4.1 (for gamma dose calculations) be further subdivided because of the shorter range of beta dose when compared to gamma dose. Subdividing the containment too finely would result in exorbitant ITS computing costs. Figure A.I shows the Surry containme~t subdivision used when dose rates caused by surface sources were calculated. Figure A.2 shows containment subdivision for floor source calculations. Figure A.3 shows the steam generator A cubicle subdivision; subdivision of the steam generator B cubicle, RHR cubicle, and incore instrumentation room are similar.
Figure A.4 shows the Peach Bottom drywell subdivision for wall surface sources. The Peach Bottom drywell subdivision for floor surface sources is shown in Figure A.S.
A-I

· . '., .. .... · .. .". " .~ .'. , ,
,', , ..• .~ ' . . ' . ',' · ., , . · .: '. I · . ,'. ,
.:: ! ., "
I I
I
/ " /
/ I
/
.,., .,.,
/
-/
I I I I / /
I I I I I I I
- , - -- .....
-... " , , , ,
......
, " , \ ,
, \
\
, , \ , , \ \
\ \ \
\ I
\ \
\ \ I I I _.,.' _.,I __ I.. ____ ... _____ .1 __ I __ .J ____ ....
J I I I I I ; I I I. I , I I I I 'I
I I
• I
2 I
, I , , I
, I · I ' , . ' , , " ,
~, ., , I
12 " , 9
I
: I 13 • I
". 16
I UU1II
14
Figure A.I. Surry Containment Zones for Surface Sources
A-2
· . · ,.. · . , .. . '. · . · . I .;; '. J ~':
• ",': ~ .. ,~
'f .'!
I .,:' I : •. ,
I .:~. ' ..
";'. , ,
. ", .... ~ . .. "

o . " '. , . .. , ... . 0. " .. --.', ~ .. ..• o. .. ',' • I : . ':
" :.: .~: '0
, I
I
I
I I
I
" / /
/ /
I / I
I I I I
- ---- -
1 -- ---
....
'" "
.... ....
\ \
.... ....
, , ,
\
\
, , \
\
\ , I I \ \ I _~_~ ________________ L_J __
I
- - - --i~=====~r:J:~, ':;';~I::r----------,.-;:::=::::=::::::::::;:::===~.' .- ~
13
,. ~ .... _.f . •• '., .' t~: •
12
~~~:.I TE~ 'I-,':,!'; ~:.:~ . .,
,"
" ... 9
",
15
, . , .... . .
Figure A.2. Surry Containment Zones for Floor Sources
A·3
-- • e', '. · . · ' , .. . '. · , 0' ,.'; '. ~' ..
", •... ~ , , .

Figure A;3. Surry Steam Generator A Cubicle Zones
A-4

--~~---.
Figure A.4. Peach Bottom Drywell Zones for Surface Sources
A-S
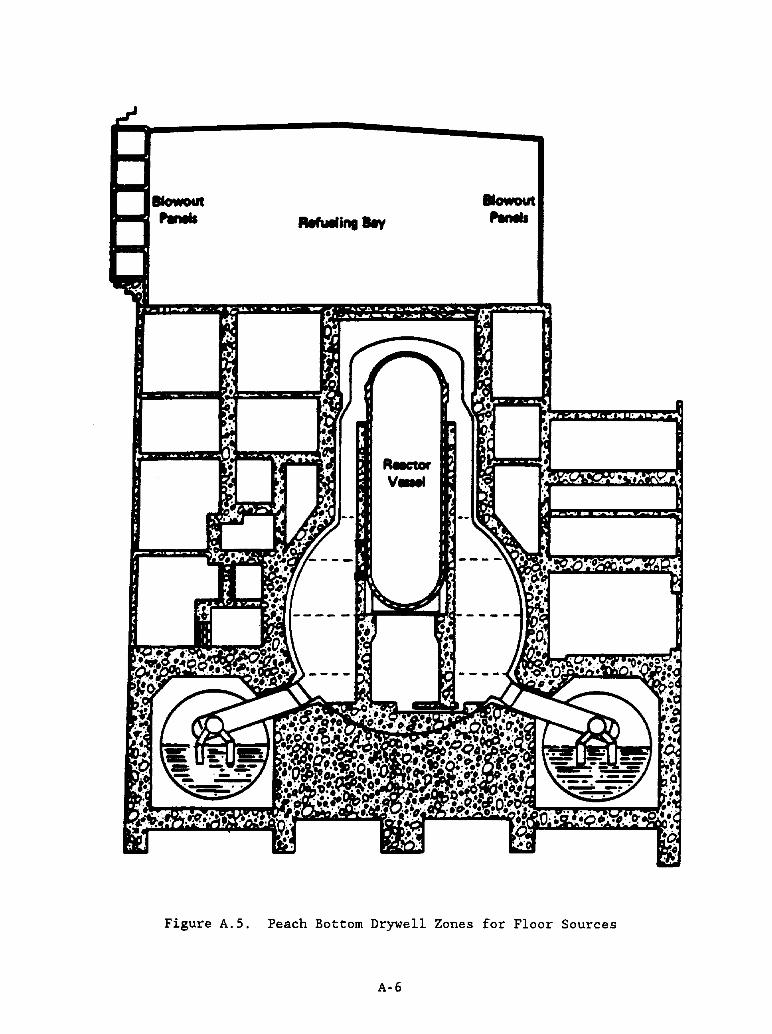
Blowout t-aPlnels RIfuIIing ...,
Blowout ,....
Figure A.S. Peach Bottom Drywell Zones for Floor Sources
A-6

APPENDIX B
ADDITIONAL DOSE RATE AND DOSE FIGURES

? 0- 10
6
U 0
,Q; W 10
5
t;:( 0::: W LOCATION (J)
104 o=A
0 o=s 0 6=C
+ = 0 x=[
103
10-2 10-1 10° 1d 102
103
DAYS
107
? 0- 10
6
U 0
,Q; W 10
5
t;:( 0::: W (J)
104 LOCATION
0 0=1" 0 o=G
6=H +=[
103
10-2 10-1 10° 1d 10
2 10
3
DAYS
Figure B:t. Surry Case t Basement Gamma Dose Rate
B-t

? ~ "U 0
Q; W
~ 0::: W U1 0 0
107
106
105
104
10-2
108
LOCATION D=A o=B l!.=C +=0 x=[
10-1
LOCATION D=F o=G l!.=H + = I
10° 1d 102
DAYS
Figure B.2. Surry Case 1 Basement Beta Dose Rate
B-2
103

? ~ U 0
0::: '-...../
W
~ 0::: W (f) 0 0
LOCATION o=A 0=6 !> = C + = 0 x = E
Figure B.3. Surry Case 1 Annulus Gamma Dose Rate
106
~ 10
5 , ~ LOCATION
104 o=A
0=6 '\ !> = C + = 0
J x = E
103
10-2 10-1 10° 101
102
DAYS Figure B.4. Surry Case 1 Annulus Beta Dose Rate
B-3
103

'? ~ 10
6
"D 0
Q; W 10
5
~ 0:::: W LOCATION (J)
104 O=r
0 Q=G 0 L1=H
+ = I x = J
103
10-2 10-1 10° 10
1 10
2 10
3
DAYS Figure B.S. Surry Case 1 Operating Floor and Dome Gamma Dose Rates
107
"
'~' '. "'4
? 106 ~~~"~"
~ 'X, :A., '. '~
"D ,,~ ,
0 '"~.~ , -Q; -I<. .~ ',_
W 105
\"~ " ~ ...... :~ 'A;-.:. 0:::: \'< W LOCATION ····x "s,~ (f)
104 O=r
0 o=G
~~ 'X'X
0 A=H + = I x=J
'+-10
3
10-2 10-1 10° 10' 10
2 10
3
DAYS Figure B.6. Surry Case 1 Operating Floor and Dome Beta Dose Rates
B-4
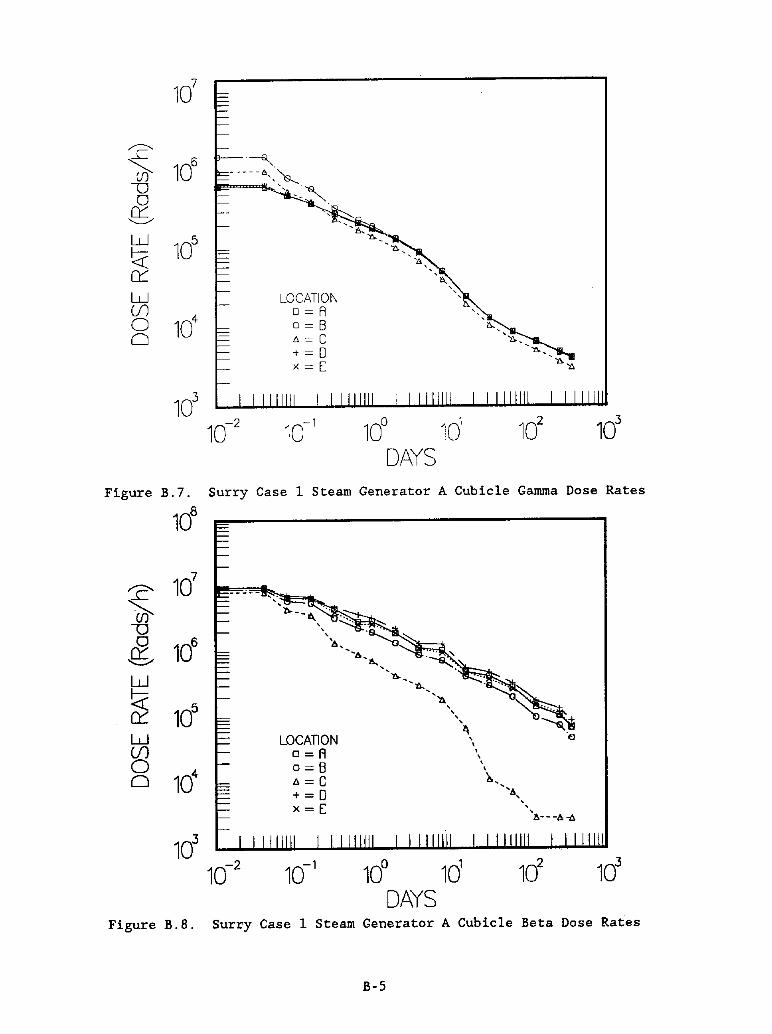
? ~ 10
6
U 0
S W
105
t<c Cl:: W LOCATION Ul
104
o=A 0 o=B 0 6 == C
+ == 0 X == [
103
10-2 10-1 10° ld 102
103
DAYS Figure B.7. Surry Case 1 Steam Generator A Cubicle Gamma Dose Rates
? ~
(f) u o ,Q; w ~ Cl:: W Ul o o
108
, . , 'l>-_-t.. " .....
, , , 1.,
LOCATION o=A o=B Il=C +=0 x=E
"6 'a.,
'''~ .. 'll..,
''lI. , , , , l\ ,
\ \ \ ,
\
~ ........ 1.,
, , '.6---/:$-6,
Figure B.B. Surry Case 1 Steam Generator A Cubicle Beta Dose Rates
B-5

? ~ 10
6
V 0 ,g;
W 105
~ 0:::: W LOCATION (.f)
104 o=A
0 o=B 0 t>=C
+ = 0 x = E
103
10-2 10-1 10° 1d 10
2 10
3
DAYS Figure B.9. Surry Case 1 RHR Cubicle Gamma Dose Rates
108
? 107
~ "D 0
106
,Q; W
~ 10
5 0:::: W LOCATION , (f) o=A
, , 0
, 0=8 ,
104 ,
0 t>=C ~ , +=0 , , , x=[ 1'.-_
-6---6--<1
103
10-2 10-1 10° 1d 10
2 10
3
DAYS Figure B.lO. Surry Case 1 RHR Cubicle Beta Dose Rates
B-6

? 106
..... -)(- ... x· ..... x. ···x.
0T ..
··X··x . ..
V ··x.
0 x
,Q; x
W 105
x
~ x 0:::
.. ··x. W LOCATION ··x·x Ul
104 o=R
0 0=6 0 A=C
+ = 0 x = E
103
10-2 10-1 10° 1d 10
2 10
3
DAYS
Figure B.II. Surry Case I Steam Generator B Gamma Dose Rate
? 107
~ v , 0
106 ..... ,
0::: 'I!., "t>. "-../
W "", -r.
~ , ,
'l\.
105 ,
0::: ,
W l:.
LOCATION , Ul o=R , , 0
104 0=6
0 A = C ~, + = 0
,
x = E , 1>- -- ,, __ -tr ""
103
10-2 10-1 10° 1d 10
2 10
3
DAYS Figure B.12. Surry Case I Steam Generator B Beta Dose Rate
B-7

108
'if)' U 0 ~ 10
7
W (J) 0 x 0
106 x
x )(
x·
)(
.X·
x ....
.)(" ... X'0"
x····
LOCATION D=A 0=6 A =·C +=0 X = E
.K·
Figure B.13. Surry Case 1 Steam Generator B Total Gamma Dose
1dO
LOCATION D=A 0=6 A = C + = o. x=E
Figure B.14. Surry Case 1 Steam Generator B Total Beta Dose
B-8
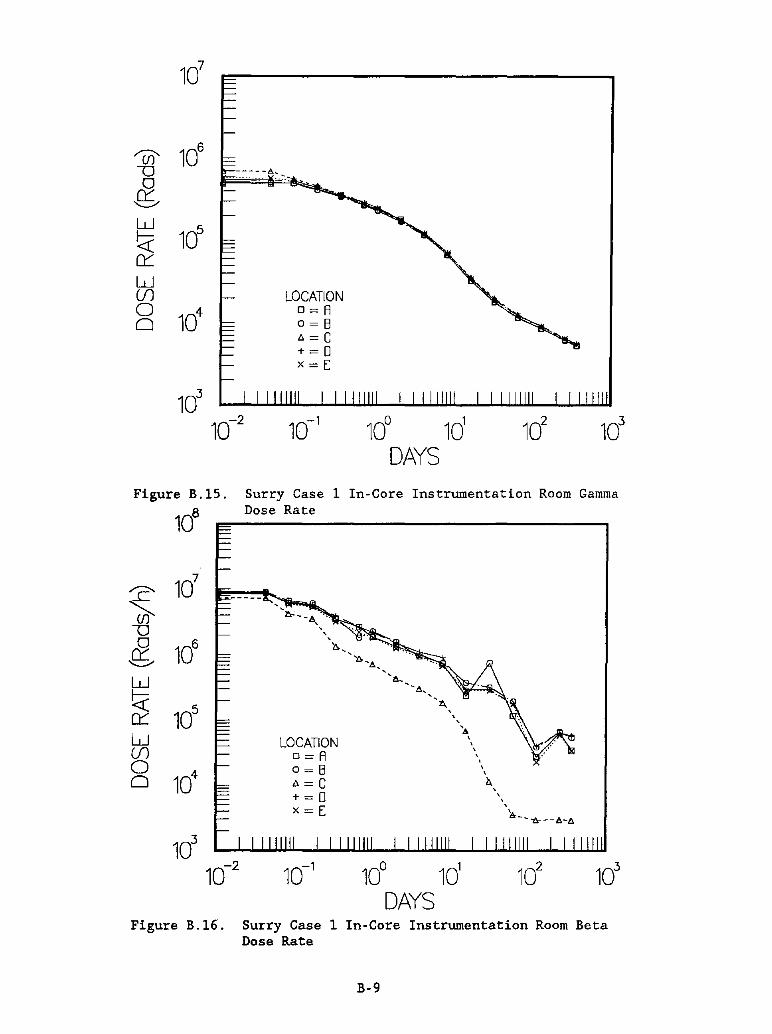
-'ifi' 106
"""0 0
,Q; W
105
~ 0::: W (.f) 0
104
0
Figure B.1S.
'L' ~ """0 o
,Q; w ~ 0::: W (.f) o o
108
LOCATION o=A o=B ",=c +=0 x=E
Surry Case 1 In-Core Instrumentation Room Gamma Dose Rate
LOCATION o=A o=B "'=C +=0 x=E
'b'A,
"a, "A,
"~ , , , .... , , , , . , ,
~ , , , , 6_--6---a-.6
Figure B.16. Surry Case 1 In-Core Instrumentation Room Beta Dose Rate
B-9

108
"'CiJ' ""0 0
6 107
W (f)
0 0
106
Figure B .17 .
1do
LOCATION D=A o=B f>=C +=0 x=[
Surry Case 1 In-Gore Instrumentation Room Total Gamma Dose
LOCATION D=A o=B f>=C +=0 x=[
Figure B.lS. Surry Case 1 In-Gore Instrumentation Room Total Beta Dose
B-IO

LOCATION Q=A 0=6 6=C +=0 )(=[
LOCATION D=f o=G A=H + = I
Figure B.19. Surry Case 2 Basement Gamma Dose Rate
LOCATION 0= A-[ 0= F'- J
Figure B.20. Surry Case 2 Basement Beta Dose Rate
B-ll

qio 10
9 10
9
1(j 1d "iii' "iii' "D "D c2
107 ~ 10
7 =-W
!7J (f) 0 8 0 LOCATION
106 D=A
106 LOCATION 0=8 o=r .a=C o=G +=0 4=H x=E: + = I
1(j 1(j 10-2 10-' 10° 10' 10
2 103 10-2 10-' 10° 10' 1d 1cY
DAYS DAYS
Figure B.2l. Surry Case 2 Basement Total Gamma Dose
1dO
109
~ ~~
'(jj' ~ U / 0 ? Q;
108 /
W / (J) ;/ 0
0 ;1 10
7 /
LOCATION
I 0= A-[ 0= r-l
106
10-2 10-1 10° 1d 10
2 10
3
DAYS Figure B.22. Surry Case 2 Basement Total Beta Dose
B-12
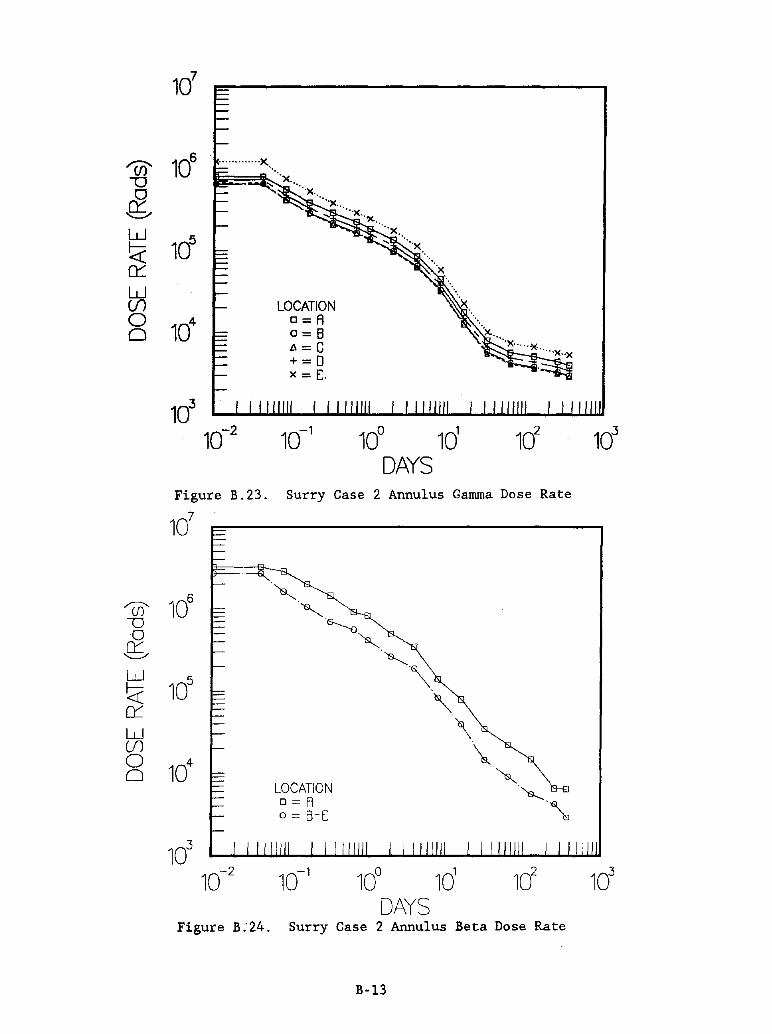
••••••.•..•. -l<.
~==.:::;t,,;:..:·····x .... ··x ....
LOCATION D=A 0=6 IJ.=C +=0 X = E.
Figure B.23. Surry Case 2 Annulus Gamma Dose Rate
'if) 106
-0 o ~ w ~ 10
5
0:::: w en 8 10
4
LOCATION D=A 0= B-[
10° 1d DAYS
Figure B:24. Surry Case 2 Annulus Beta Dose Rate
B-13
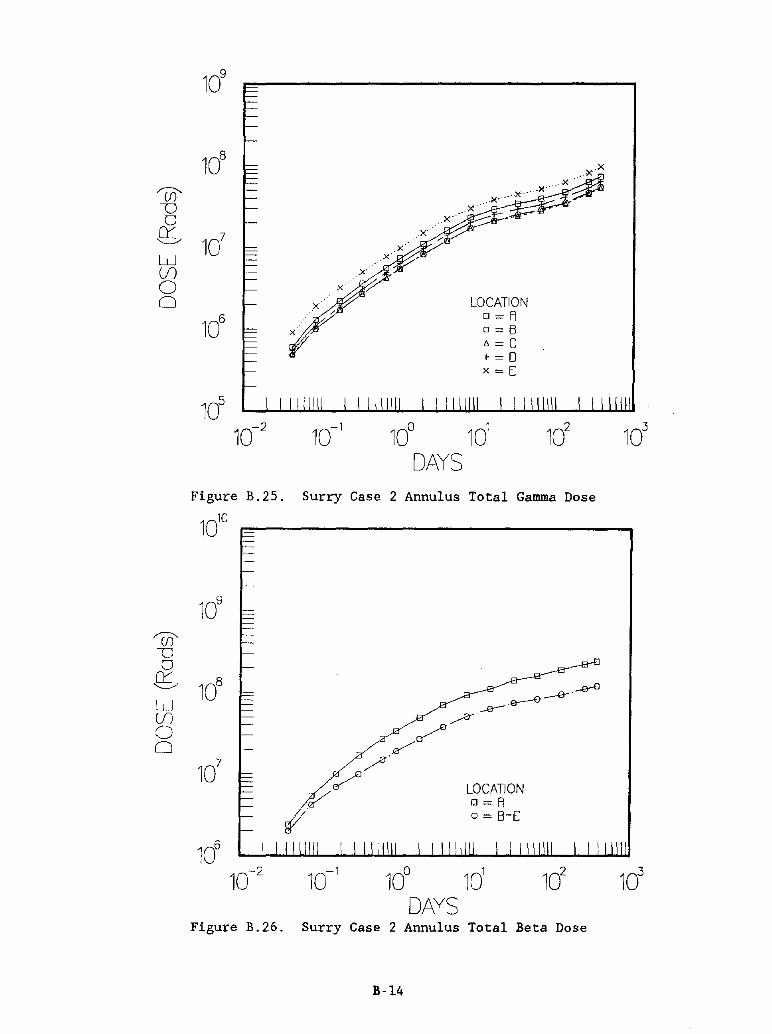
~ v 0
fS W (f) 0 0
~ v 0
fS W (f) 0 0
108
107
LOCATION
106 D=A
0=8 "=C + = 0 x=[
Figure B.2S. Surry Case 2 Annulus Total Gamma Dose
109
108
107
LOCATION D=A 0=8-[
Figure B.26. Surry Case 2 Annulus Total Beta Dose
B-l4
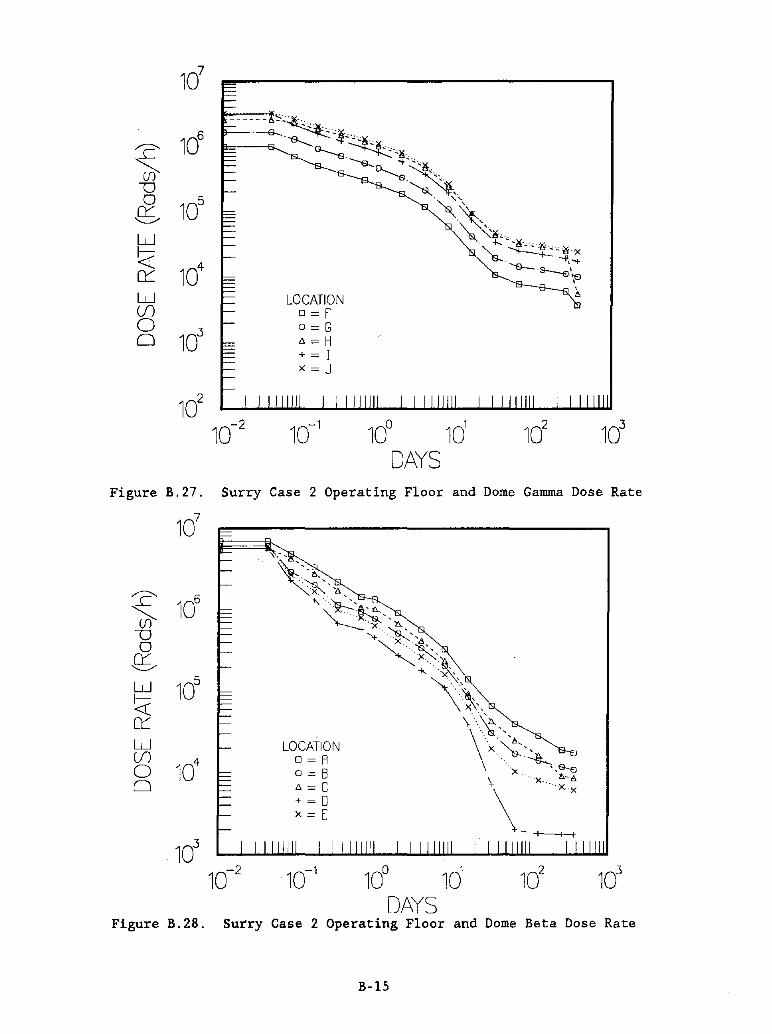
LOCATION 0= r O=G A = H + = I x = J
Figure B.27. Surry Case 2 Operating Floor and Dome Gamma Dose Rate
LOCATION D=A 0= B A = C + = 0 x=E
10° 1d DAYS
Figure B.2B. Surry Case 2 Operating Floor and Dome Beta Dose Rate
B-1S
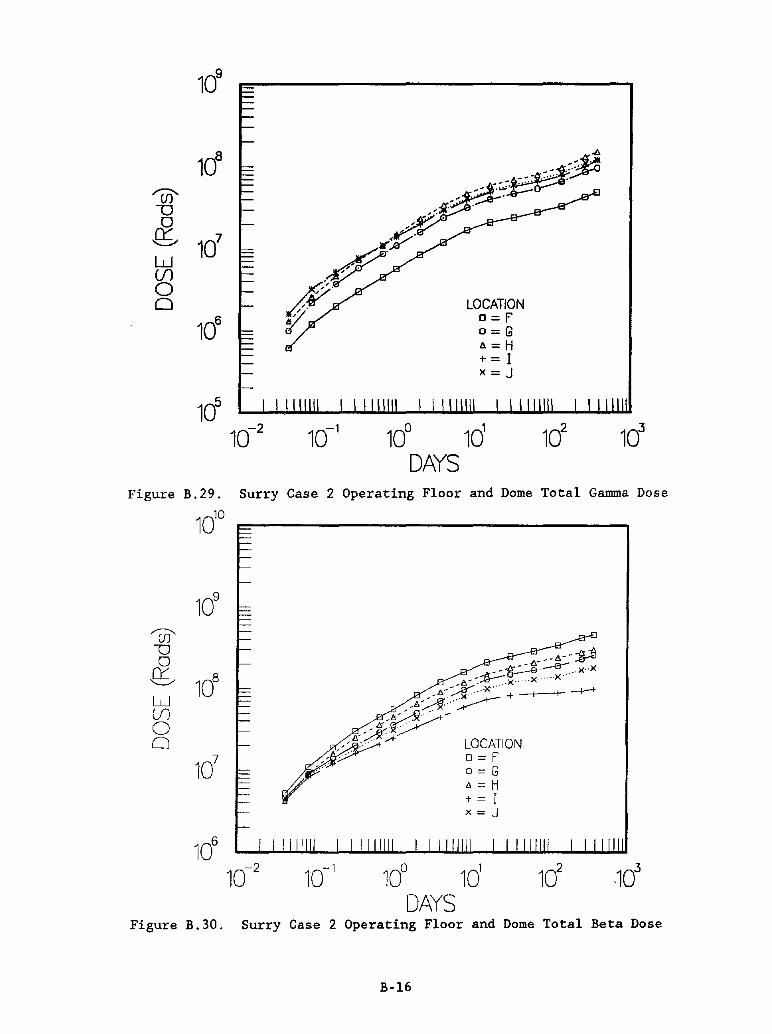
108
'UJ' "U 0
,Q; 10
7
W (f)
0 0 LOCATION
106 []=p
o=G Il=H + = I x=J
105
10-2 10-1 10° 1d 102
103
DAYS Figure B.29. Surry Case 2 Operating Floor and Dome Total Gamma Dose
1dO
109
'Ul' "U 0 ~ 10
8
W Ul 0 0
107
10° 1d DAYS
Figure B.30. Surry Case 2 Operating Floor and Dome Total Beta Dose
B-16

LOCATION D=A o=B t;.=C +=0 x=[
Figure B.3l. Surry Case 2 Steam Generator A Gamma Dose Rate
'Ci>' -0 o ~ w ~ 0::: W (j) o o
108
LOCATION D=A o=B t;.=C +=0 x=[
Figure B.32. Surry Case 2 Steam Generator A Beta Dose Rate
B-17

'(ff "D 0 ~ W (J) 0 0
108
107
106
LOCATION D=A o=B t.=C +=0 x=[
Figure B.33. Surry Case 2 Steam Generator A Total Gamma Dose
1010
109
'(ff "D 0 ~ 10
8
W 6' (J) 6''-
0 -'
0 LOCATION
107 D=A
o=B t.=C +=0 x=[
106
10-2 10-1 10
0 1d 10
2 10
3
DAYS Figure B.34. Surry Case 2 Steam Generator A Total Beta Dose
B-l8

LOCATION o=R o=B lJ.=c +=0 x=E
10° 1d DAYS
Figure B.3S. Surry Case 2 RHR Cubicle Gamma Dose Rate
107
LOCATION o=A o=B lJ.=c +=0 x=E
10° 101
102
DAYS Figure B.36. Surry Case 2 RHR Cubicle Beta Dose Rate
B-19
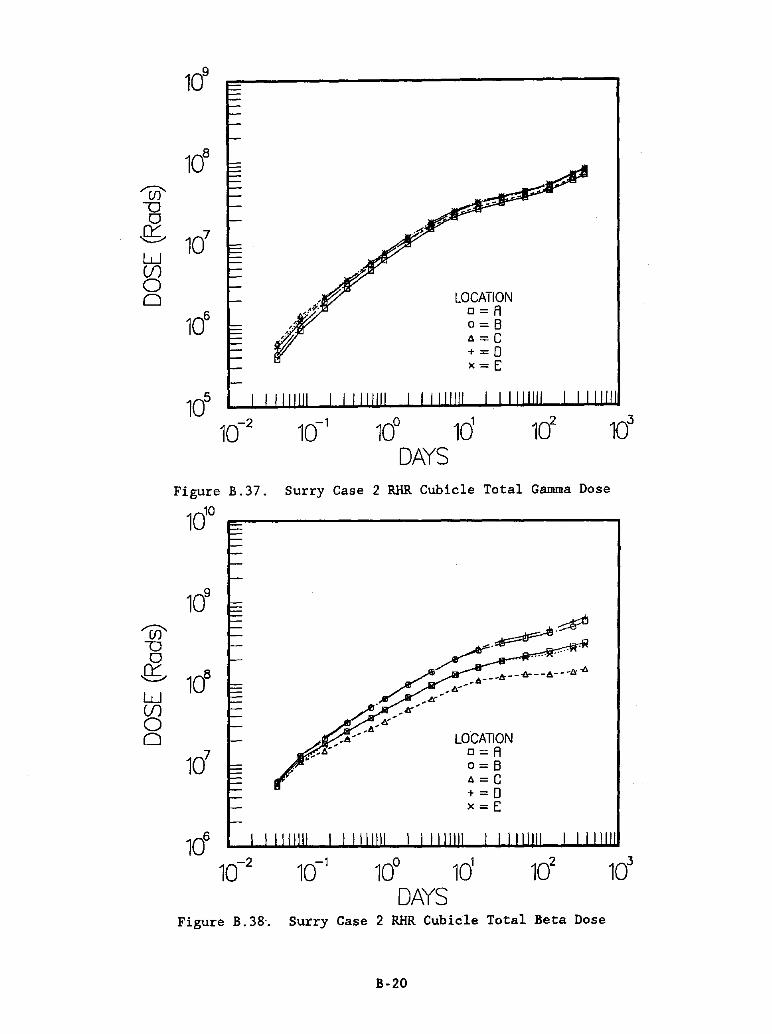
108
'UJ' -0 0
g;, 10
7
W (f) 0 0 LOCATION
106 D=A
0=8 a=C +=0 x=E
Figure B.37. Surry Case 2 RHR Cubicle Total Gamma Dose
1dO
109
'UJ' -0 0
g;, 10
8
W (f) 0 0 LOCATION
107 D=A
0=8 a=C +=0 x=E
Figure B. 38·. Surry Case 2 RHR Cubicle Total Beta Dose
B-20

• ••••.....••. )(- ...• )( .•...• X •..•. l( ...... x.." .. .
LOCATION D=A o=B ~=C +=0 x·= E
Figure B.39. Surry Case 2 Steam Generator B Gamma Dose Rates
LOCATION D=A o=B ~=C +=0 x=E
10° 1d DAYS
, , , , , ~ , , , , , ,
b---t>---A--iI
Figure B.40. Surry Case 2 Steam Generator B Beta Dose Rates
B-21

108
'U)' --0 0
-Q; 10
7
W (f) 0 0
106
... x .. ···~·····x ... ···X'····
LOCATION D=A o=B A=C +=D x=[
10° 1d DAYS
X·X
Figure B.4l. Surry Case 2 Steam Generator B Total Gamma Dose
'U)' --0 o
-Q; w (f) o o
1dO
LOCATION D=A o=B A=C +=0 x=[
Figure B.42. Surry Case 2 Steam Generator B Total Beta Dose
B-22

'if)' 106
U 0
b W
105
t::c 0:::: W (f) LOCATION 0
104 o=A
0 o=B t.=c + = 0 x=E
Figure B.43. Surry Case 2 In-Core Instrumentation Room Gamma Dose Rates
LOCATION o=A o=B t.=C +=0 x=E
10° 1d DAYS
, , , , , , ~
Figure B.44. Surry Case 2 In-Core Instrumentation Room Beta Dose Rates
B-23

108
'Cf5' """0 0 g;
107
W (f) 0 0 LOCATION
106 D=A
o=B A=C +=0 x=E
10° 101
DAYS Figure B.4S. Surry Case 2 In-Core Instrumentation Room Total
Gamma Dose
IJ.-
.. ' _~ __ -A---IJ.---A:.fJ. _IJ.--~
LOCATION D=A o=B A=C +=0 x=E
Figure B.46. Surry Case 2 In-Core Instrumentation Room Total Beta Dose
B-24

107 107
~ 106 ? 10
6
~ i9 0 0
.Q; .Q; W 10
5
~ 105
~ cr: W LOCATION W
~ 10' o=A U1
10' LOCATION o=B 0 (J=f
0 ~ = C 0 a=G -t = 0 6=H x = E .f.=)
1tJ 1tJ 10-2 10-' 10° 10' 10
2 103 10-2 10-' 10° 10' 10
2 10
3
DAYS DAYS
Figure B.47. Surry Case 3 Basement Gamma Dose Rate
'L' ~ 10
5
"'0 0
.Q; W 10
4
~ cr:: w (j)
103
0 0
LOCATION 0= f-I
102
10-2 10-' 10° 10' 102 10
3
DAYS Figure B.48. Surry Case 3 Basement Beta Dose Rate
B-25

let let
1Cf let 'Iii' 'iff
1 "0
107 &
107 '="
W W
~ (j) 0
Cl LOCATION Cl
let D=A let
LOCATION 0=8 o=f 6=C o=G +=0 .4=H x=E + = I
lei 105
10-2 10-2 10-' 100 ld 1cf ld DAYS
Figure B.49. Surry Case 3 Basement Total Gamma Dose
108
'(j)' -0 0
,Q; 10
7
W (f) 0 0
106
LOCATION 0= A-I
105
10-2 10-1 10° 10
1 10
2
DAYS Figure B.SO. ,Surry Case 3 Basement Total Beta Dose
B-26
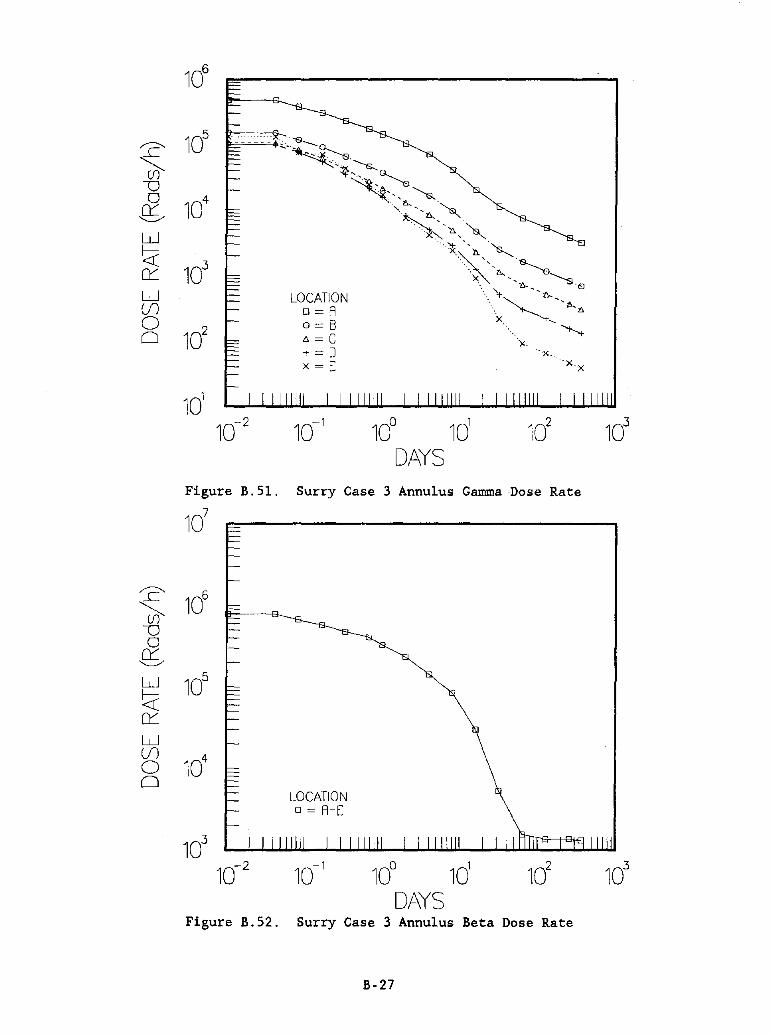
? JJ V 0 g;
W
~ cr:: W Ul 0 0
? ~ v
0 g; W
~ cr:: w Ul 0 0
105
104
103
102
LOCATION D==A o=B ll=C + == 0 x = [
Figure B.S1. Surry Case 3 Annulus Gamma Dose Rate
106
105
104
LOCATION 0= A-[
103
10-2 10-1 10° 10' 10
2
DAYS Figure B.S2. Surry Case 3 Annulus Beta Dose Rate
B-27
103
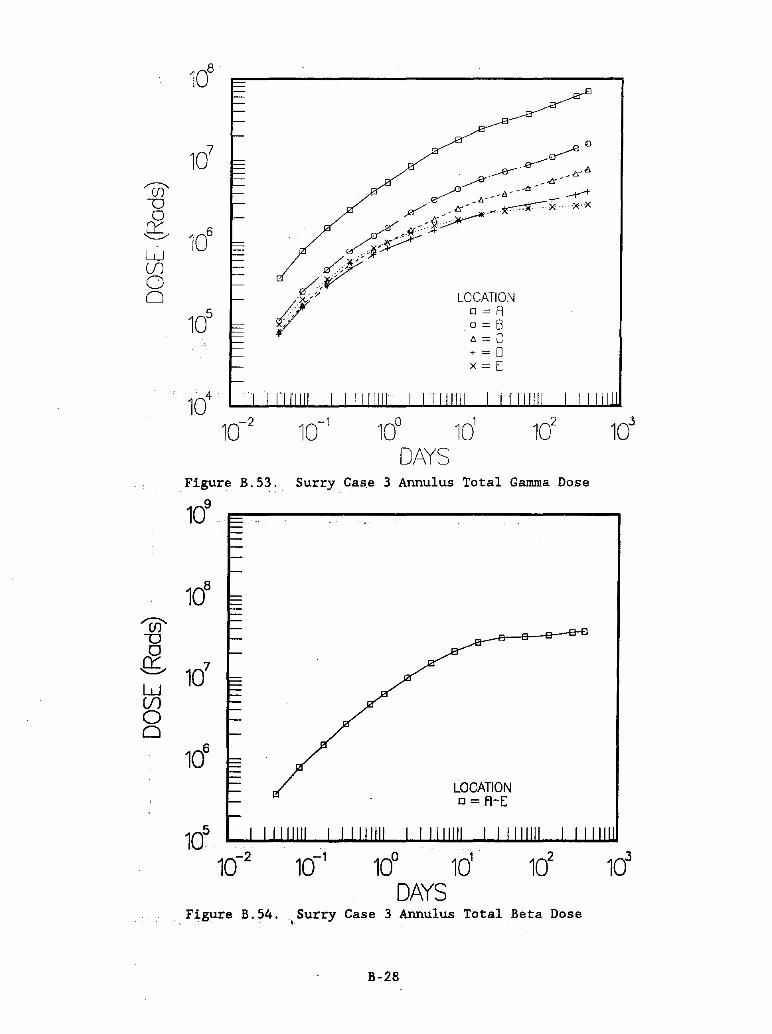
'(j)' v 0
g; W (f) 0 0
107
106
1d LOCATION
o=A o=B I1=C + = 0 x = E
Figure B.S3: Surry Case 3 Annulus Total Gamma Dose
109
Figure B.S4. I
LOCATION D = A-E
Surry Case 3 Annulus Total Beta Dose
B-28

107
106
r ~ 10
5
U 10
4 0 ,g; W 10
3
t( Cl::.
102
W (f)
1d 0 0
10°
10-1
10-2
LOCATION D=A a=B "'=C + = 0 x = E
.~
10° 1d DAYS
Figure B.SS. Surry Case 3 Operating Floor and Dome Gamma Dose Rate
1d
LOCATION 0= i"-J
10° 10' DAYS
2· 10,
Figure B.S6. Surry Case 3 Operating Floor and Dome Beta Dose Rate
B-29
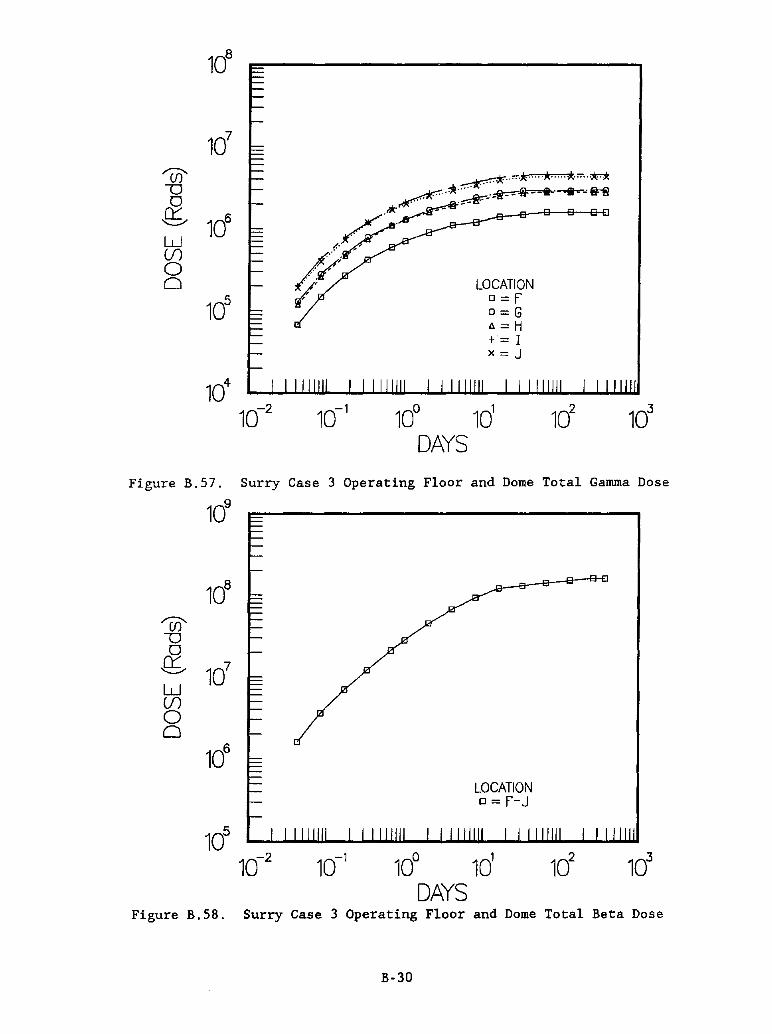
107
'U)' u 0 ~ 10
6
W (JJ 0 0 LOCATION
105 D=P
D=G A=H +.= I x = J
104
10-2 10-' 10° 1d 102
103
DAYS
Figure B.S7. Surry Case 3 Operating Floor and Dome Total Gamma Dose
108
'U)' U 0 ~ 10
7
W (JJ 0 0
106
LOCATION o = 1"-J
105
10-2 10-' 10° 10' 102
103
DAYS Figure B.SS. Surry Case 3 Operating Floor and Dome Total Beta Dose
B-30

? ~ V 0
g; W
~ cr: W (j) 0 0
107
106
105
104
103
102
101
10°
10-1
10-2
LOCATION o=A Q=B A=C +=0 x=E
Figure B.S9. Surry Case 3 Steam Generator A Gamma Dose Rate
107
? ~ 10
6
v 0 cr:
'----'"
W 105
~ cr: w (j)
104
0 0
LOCATION 0= A-E
Figure B.60. Surry Case 3 Steam Generator A Beta Dose Rate
B-31

'U)' u 0 ~ W (f) 0 0
107
106
105
6- - -6 - - -& --6-- -6 - - fr 6 .J!s-_-Ir-- .. :,:" ........... -
I! --.tr - -.<'iIi_
LOCATION D=A o=B tJ.=C +=0 x=[
Figure B.6l. Surry Case 3 Steam Generator A Total Gamma Dose
1dO
109
'U)' u 0 ~ 10
8
W (f) 0 0
1d LOCATION 0= A-[
106
10-2 10-1 10° 10
1 10
2 10
3
DAYS FigureB.62. Surry Case 3 Steam Generator A Total Beta Dose
B-32
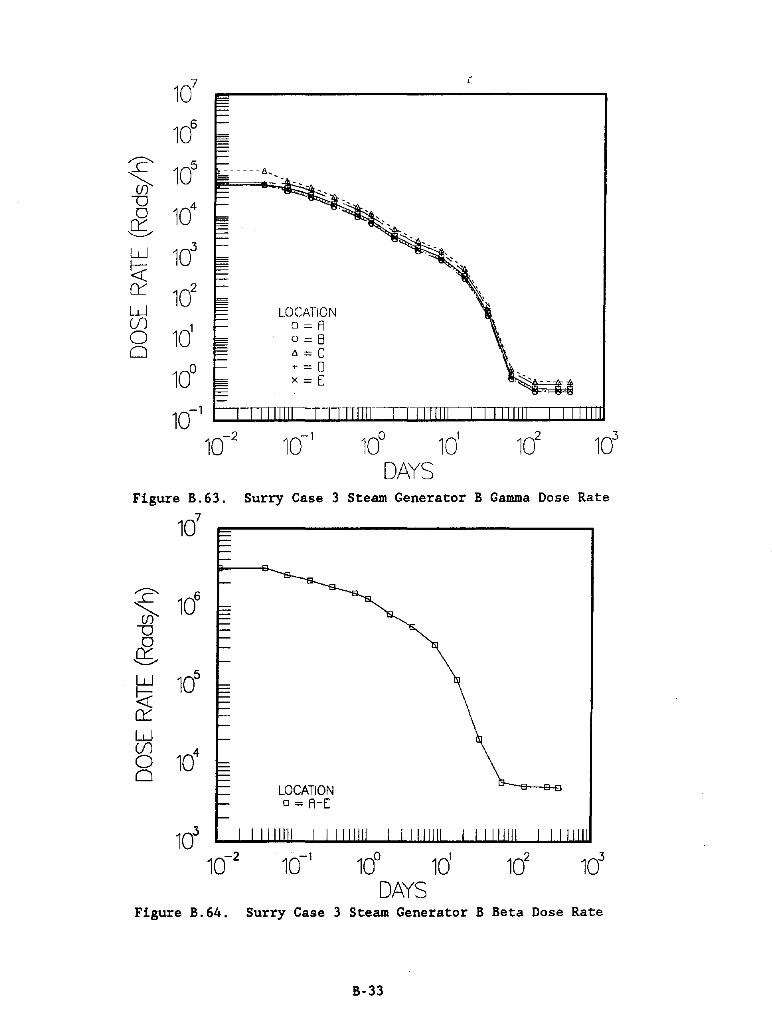
107
106
'? 'cff 10
5
U 10
4 0 ~ W 10'3 t(( et: 10
2
W Ul
1d 0 0
10°
10-1
10-2
Figure B.63.
107
? ~ 10
6
U
£ W 10
5
t(( et: W Ul
104
0 0
LOCATION o=A o=B A = C "'=0 x = E
Surry Case 3 Steam Generator B Gamma Dose Rate
LOCATION 0= A-E
Figure B.64. Surry Case 3 Steam Generator B Beta Dose Rate
B-33
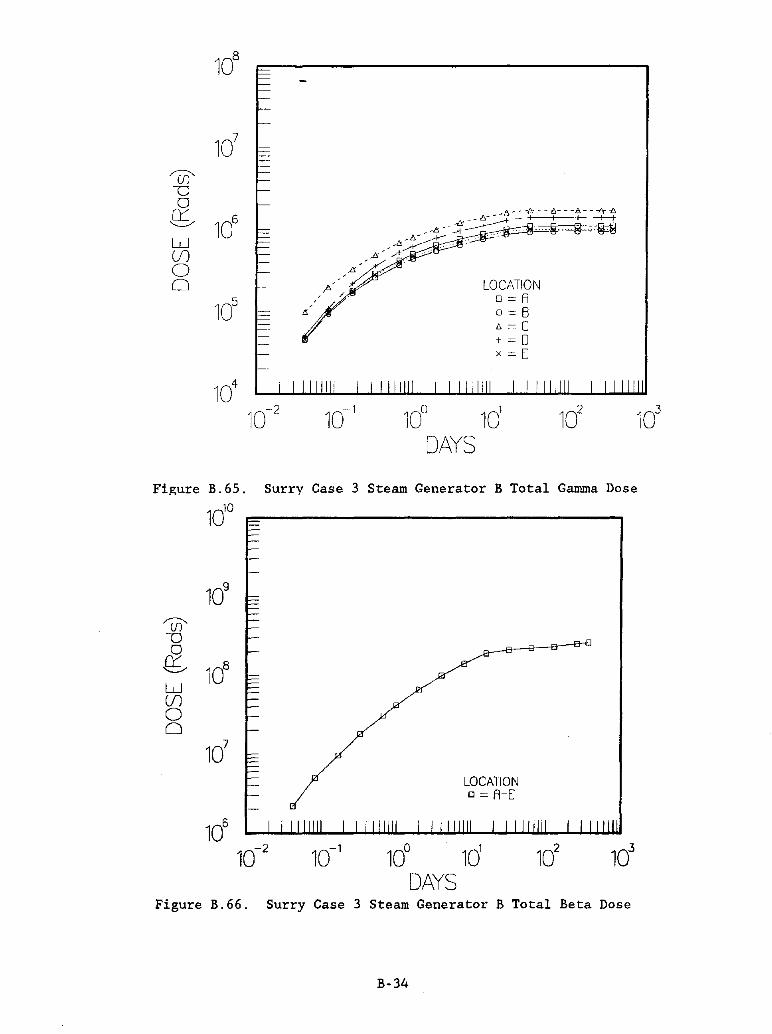
~ v o ~ w (/) o o
104
10 --2
101
LOCATION D=A 0= B 6=C + = 0 x = E
Figure B.6S. Surry Case 3 Steam Generator B Total Gamma Dose
1010 =-----------------.
109
'Ui' -0 0
,Q; 10
8 -
W (f) 0 0
107
LOCATION 0= A-[
106
10-2 10-1 10° ld 10
2 10
3
DAYS Figure B.66. Surry Case 3 Steam Generator B Total Beta Dose
B-34
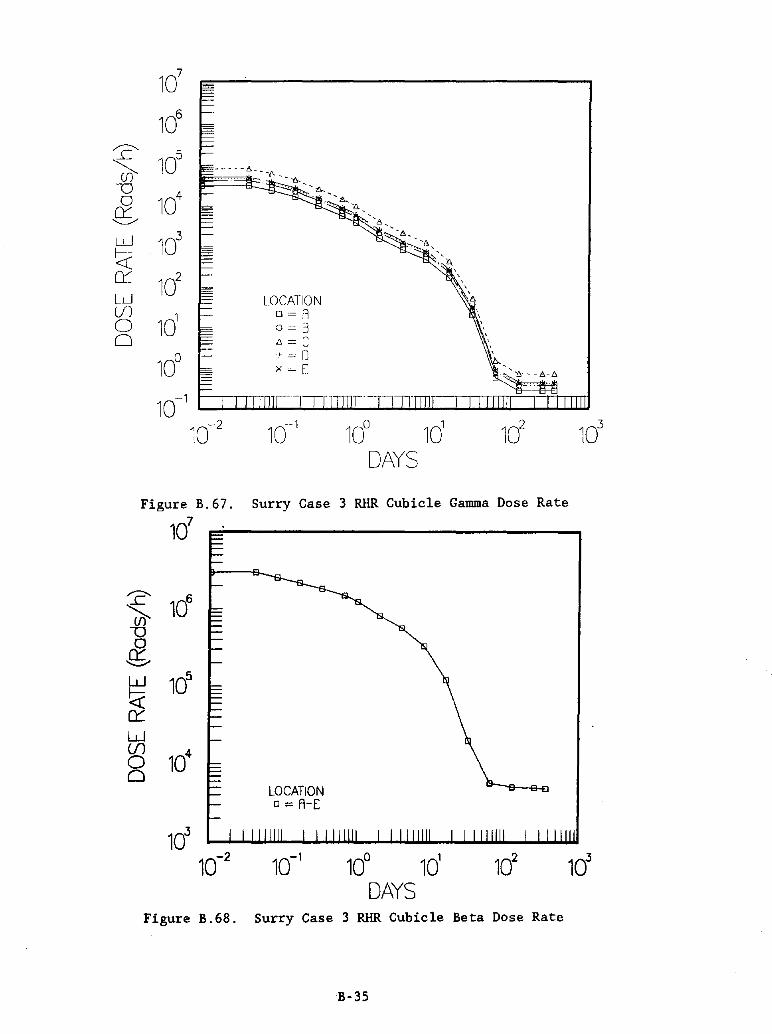
? 'uT U 0 ~ W f--<c cr: LiJ U) 0 0
107
106
105
104
103
102
1d
10°
10-1
10-2
LOCAriON D=A 8=6 to. = C ., = lJ x = [
--1
10
Figure B.67. Surry Case 3 RHR Cubicle Gamma Dose Rate
107
LOCATION D = A-E
Figure B.6S. Surry Case 3 RHR Cubicle Beta Dose Rate
B-35
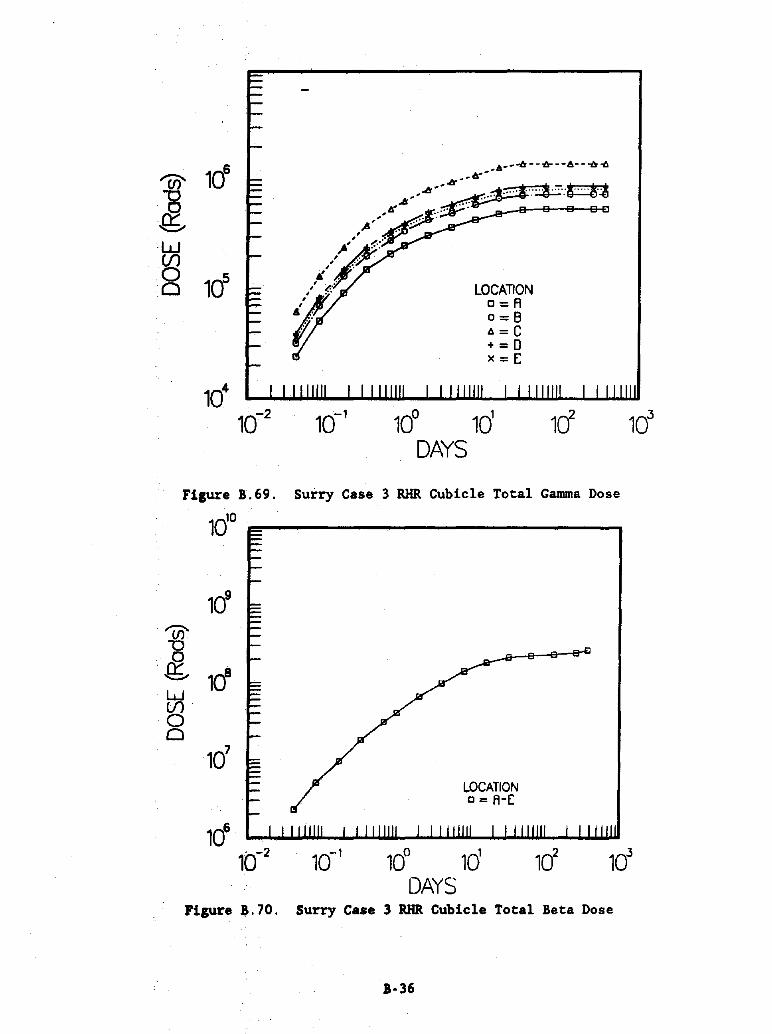
LOCATION D=A 0=8 Il.=C +=0 x=E
Figure B.69. Surry Case 3 RHR Cubicle Total Gamma Dose
1dO ~----------------------------
LOCATION 0:: A-[
Figure ~.70. Surry Case 3 RHR Cubicle Total Beta Dose
B·36

? ~ V 0
er:: "--.-/
W
~ er:: w U)
0 0
107
106
105
104
103
102
101
10°
10-1
10-2
Figure B.7l.
LOCATION o=A 0=8 {; = C + = 0 x = E
Surry Case 3 Incore Instrumentation Room Gamma Dose Rate
LOCATION 0= A-E
10° 1d DAYS
Figure B.72. Surry Case 3 Incore Instrumentation Room Beta Dose Rate
B-37

~ -0 0
Q; W lfl 0 0
'rj:' u 0
Q; W lfl 0 0
107
106
105
Figure B.73.
1010
109
108
107
LOCATION o=A 0=6 to. = C + = 0 x=[
Surry Case 3 Incore Instrumentation Room Total Gamma Dose
---B--~
LOCATION 0= A-[
Figure B.74. Surry Case 3 Incore Instrumentation Room Total Beta Dose
B-38

r:l 107
1d -:c 106
i
i £ u W 10
5
!«
~ £r
lOCATION W
r:f D=A (J)
104 LOCATION
0=6 0 [J=f
~ 6=C 0 Q=G ·=0 It.=H -=E ... = I
103
10-2 10-1 10° 10' 1ei let DAYS
Figure B.7S. Surry Case 4 Basement Gamma Dose Rate
? 106
~ v 0
105
Q; W
~ 10
4 cr: W (f) 0
103 0
LOCATION 0= A- J
102
10-2 10-1 10° 10
1 10
2 10
3
DAYS Figure B.76. Surry Case 4 Basement Beta Dose Rate
B-39

? ~ u o ~ w ~ cr::: w CJ1 o o
>,
LOCATION D=A o=s l!.=C + = 0 x=[
Figure B.77. Surry Case 4 Annulus Gamma Dose Rate
? ~ "'0 0 ~ W ~ 0:::: W (f) 0 0
107
106
105
104
103
1d 10-2
LOCATION 0= R-E
Figure B.7B. Surry Case 4 Annulus Beta Dose Rate
B-40
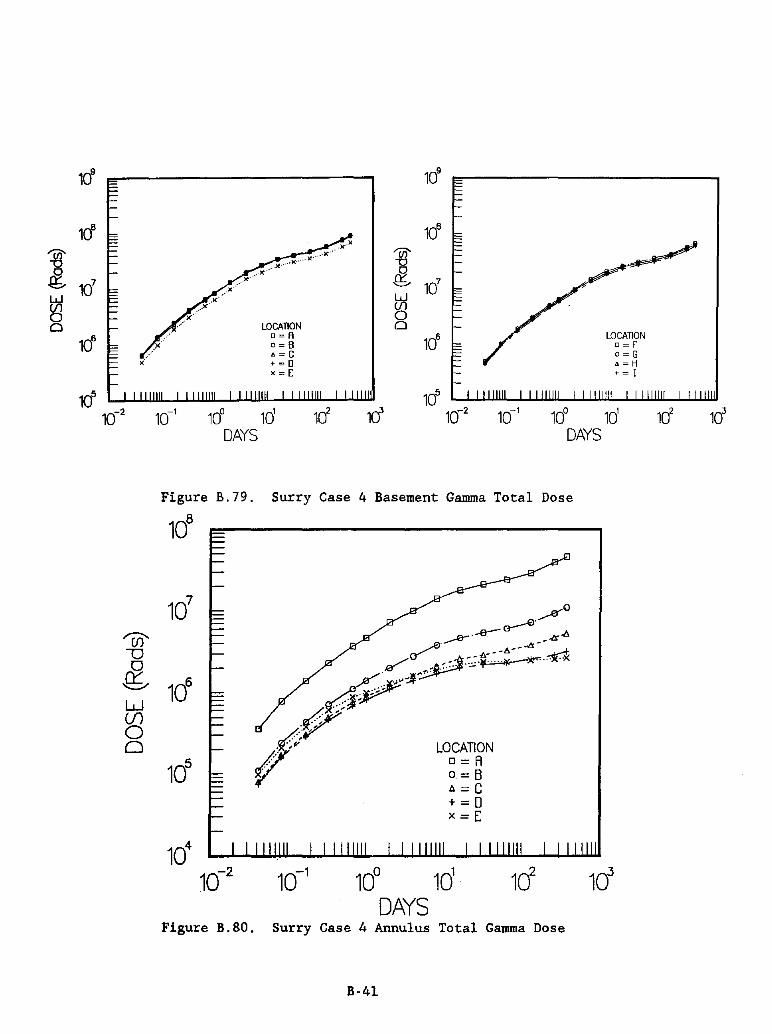
1cY
1cf 'iii' "U g
1d W
~ 0
106
1Cf 10-2
'UJ' 'U 0 ~ W if) 0 0
109
1cf 'Til" "U
& 10
7 '=" W
~ LOCATION 0
D=A 10
6 0=6 A=C + = 0 x=[
1cT 10-1 10° 1d 1cJ 1d 1(}2 10-1 10°
DAYS DAYS
Figure B.79. Surry Case 4 Basement Gamma Total Dose
107
106
105
LOCATION D=A o=B A=C +=0 x=[
10° 1d DAYS
Figure B.SO. Surry Case 4 Annulus Total Gamma Dose
B-4l
LOCATION D=P o=G It. = H + = I
1d 1cJ 103

107
106
? ~ 10
5
U
104 0
g; W 10
3
~ et:: 10
2
W (f)
ld 0 0
100
10-1
10-2
Figure B. 81.
107
LOCATION o=F o=G 6=H +=1 x = J
Surry Case 4 Operating and Dome Gamma Dose Rate
LOCATION 0= F- J
Figure B.82. Surry Case 4 Operating Floor and Dome Beta Dose Rate
B-42

107
'C/)' -0 0
,Q; 106
W (f) 0 0 LOCATION
105 D=P
o=G l!.=H + = I x=J
104
10-2 10-' 10° 10' 102
103
DAYS Figure B.B3. Surry Case 4 Operating Floor and Dome Gamma Total Dose
1dO
LOCATION 0= r- J
103
Figure B.B4. Surry Case 4 Operating Floor and Dome Beta Total Dose
B-43

? ~ U 0
g; W
~ 0::: w lf) 0 0
107
106
105
104
103
ld ld 10°
10-1
10-2
LOCATION D=A 0=6 c.=C + = 0 x=E
Figure B.BS. Surry Case 4 Steam Generator A Gamma Dose Rate
107
? ~ 10
6
U 0
g; W 10
5
~ 0::: W lf)
104
0 0
LOCATION 0= A-E
10° 101
DAYS Figure B.B6. Surry Case 4 Steam Generator A Beta Dose Rate
B-44

,..lJ"
b,- - -t<---(r - -b,- - -A-{> -a-_-Ir-- _
LOCATION D=A o=B Il=C +=0 x=E
Figure B.B7. Surry Case 4 Steam Generator A Gamma Total Dose 1dO
109
'(j)' u 0
-Q; 10
8
W ()) 0 0
1d LOCATION 0= A-[
10° 1d DAYS
Figure B.SS. Surry Case 4 Steam Generator A Beta Total Dose
B-45

? ~ U 0
fS W
~ c::t: W (j) 0 0
107
106
105
104
103
102
ld 10°
10-1
10-2
LOCAYION Do=A
00= B {; 0= C + = 0 x 0= E
Figure B.89. Surry Case 4 Steam Generator B Gamma Dose Rate
LOCATION 0= A-[
Figure B.90. Surry Case 4 Steam Generator B Beta Dose Rate
B-46

'(j)' 106
U 0
,Q; w (f) 0
105
0 LOCATION D=A 0=6
" " = C + = 0 x = E
104
10-2 10-1 10° ld 10
2 10
3
DAYS Figure B.9l. Surry Case 4 Steam Generator B Total Gamma Dose
109
'(j)' u 0
,Q; 10
8
W (f) 0 0
107
LOCATION o = A-E
Figure 8.92. Surry Case 4 Steam Generator B Total Beta Dose
B-47

? 'cff V 0
-Q; W
~ 0:::: W If) 0 0
107
106
105
104
103
102
1d
10°
10-1
10-2
LOCATION o=A 0=8 A=C + = 0 x=[
Figure B.93. Surry Case 4 RHR Cubicle Gamma Dose Rate
LOCATION 0= A-[
Figure B.94. Surry Case 4 RHR Cubicle Beta Dose Rate
B-48
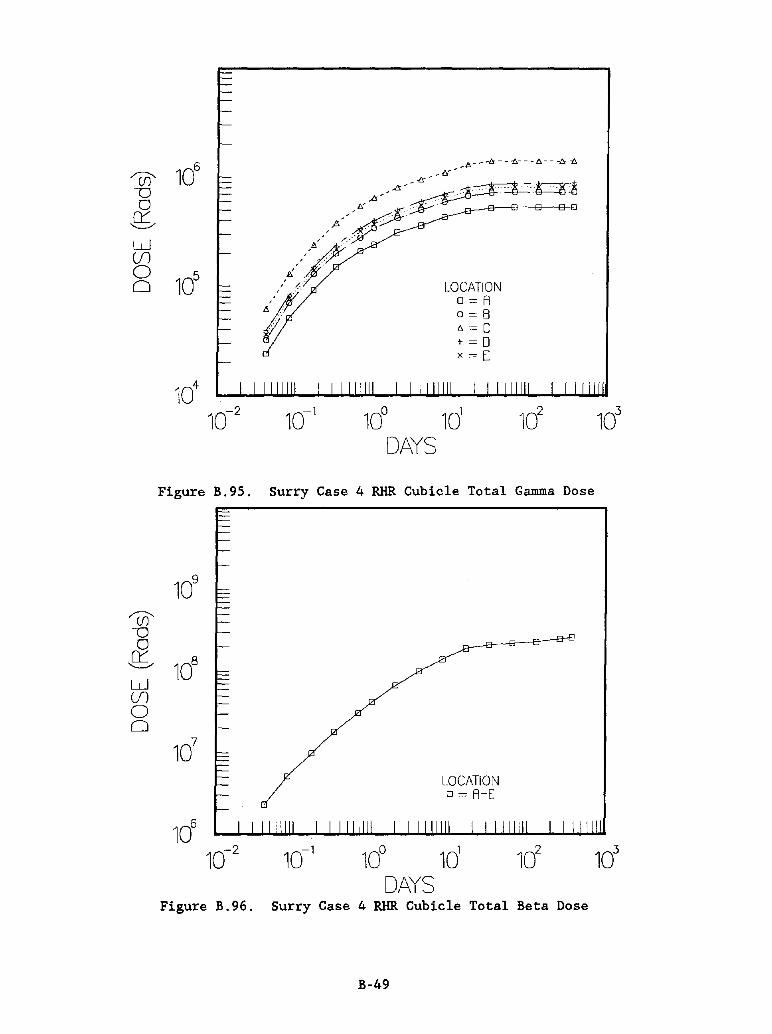
'Cf)' u 0
Q;. W If) 0 0
,6- - -ts - - -f;.- - -f::.- - -Do ~
LOCATION o=A 0= B t, = C + = 0 x = E
Figure B.95. Surry Case 4 RHR Cubicle Total Gamma Dose
109
108
107
LOCATION 0= A-E
106
10-2 10-1 10° 1d 1c1
DAYS Figure B.96. Surry Case 4 RHR Cubicle Total Beta Dose
B-49
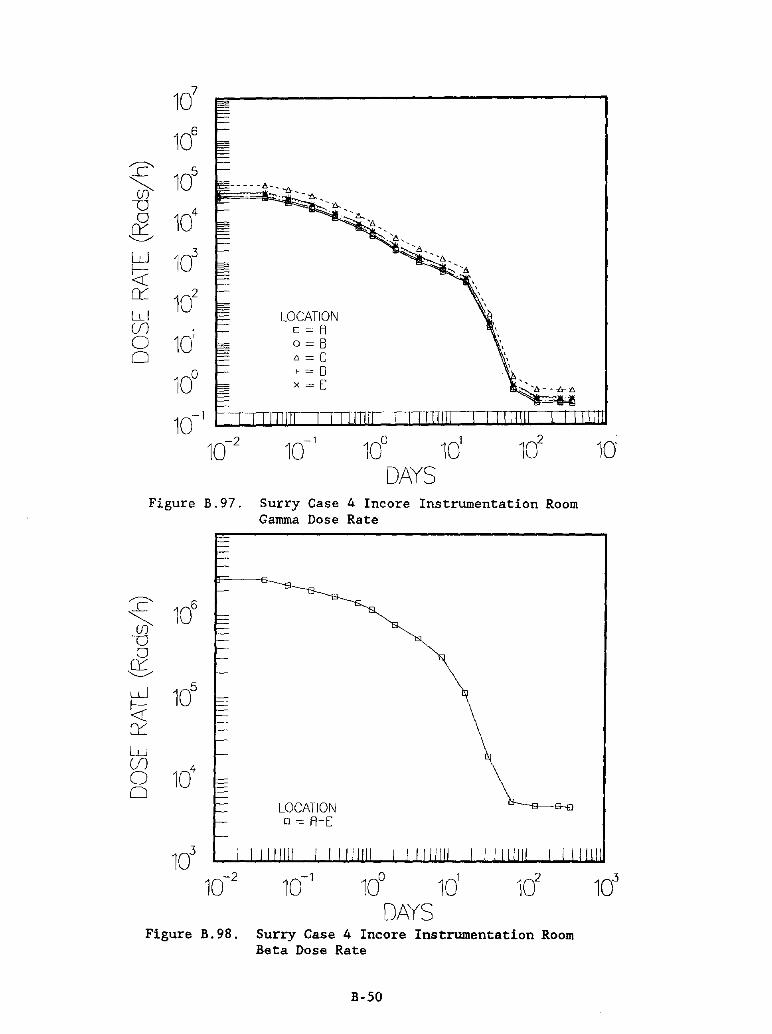
r JJ---0 0
Q; W
~ Q::
W Ul 0 0
107
106
105
104
103
102
1d 10°
10-1
10-2
LOCATION D=A 0=6 1\ = C +=0 x = [
Figure B.9? Surry Case 4 Incore Instrumentation Room Gamma Dose Rate
LOCATION 0= A-[
Figure B.9S. Surry Case 4 Incore Instrumentation Room Beta Dose Rate
B-50
10'
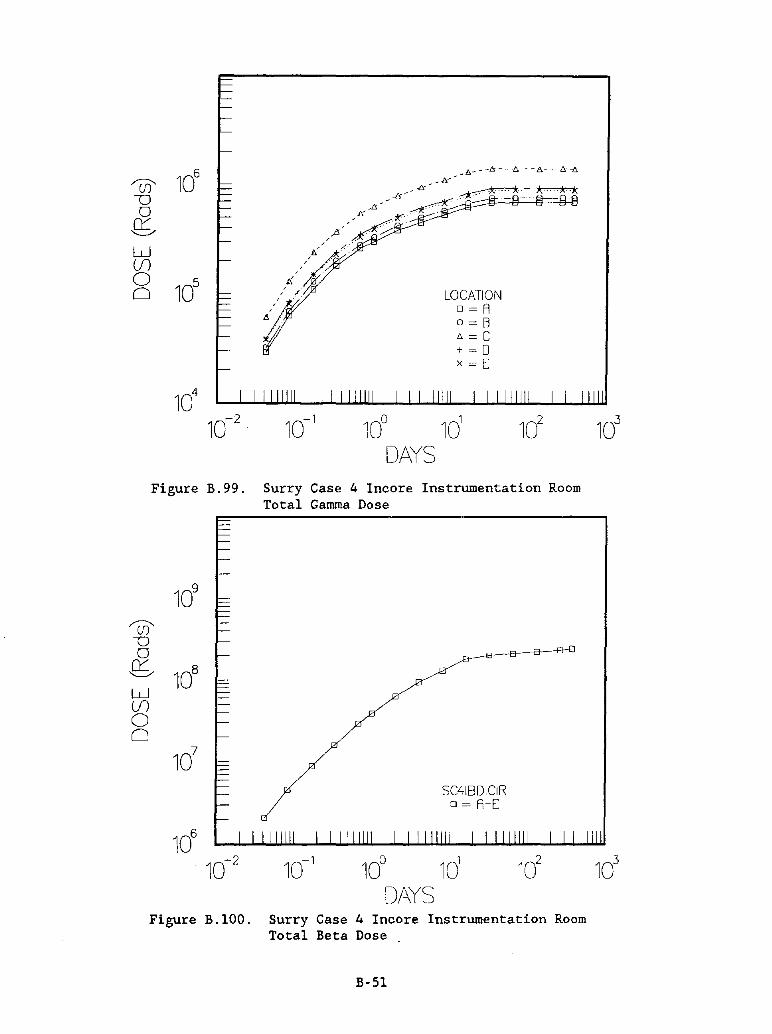
LOCATION 0= A 0= B to. = C + = 0 x = E
Figure B.99. Surry Case 4 Incore Instrumentation Room Total Gamma Dose
109
'(j)' -0 0 ~ W IJJ 0 0
108
107
106
10-2
/ 10-1
SC41BDICIR 0= A-E
Figure B.IOO. Surry Case 4 Incore Instrumentation Room Total Beta Dose
B-SI
103

? ~ 10
6
U 0
.,Q; W 10
5
~ ~
LOCATION W D=A (f)
104 o=B
0 lJ.=c 0 +=0
x=E o=p
103
10-2 10-1 10° 101
102
103
DAYS
r 0- 10
6
U 0
-Q; W 10
5
~ cr:::
LOCATION W D=G (f)
104 0= H 0 IJ.=! 0 + = J
x=K o=L
103
10-2 10-1 10° ld 10
2 10
3
DAYS
Figure B.IOI. Peach Bottom Case I Drywell Gamma Dose Rates
B-52

108
'(jj' u 0
g;, 10
7
W U) 0 LOCATION 0 o=A
106 0=8
A=C +=0 x=E <>=F
105
10-2 10-1 10° 1d 102
103
DAYS
109
108
'(jj' U 0
g;, 10
7
W U) 0 LOCATION 0 o=G
106 o=H
A = I + = J x = K <> = L
105
10-2 10-1 10° 1d 10
2 10
3
DAYS
Figure B.I02. Peach Bottom Case 1 Drywell Total Gamma Dose
B·53

? ~
107
U 0
106
Ct:': '---'
W
~ 10
5 Ct:':
LOCATION W D=R (.f) 0=6 0
104 l1=C
0 + = 0 x = E ~
0=1"
103
10-2 10-1 10° ld 10
2 10
3
DAYS
108
? 107
~ U 0
106 g;
W
~ 10
5 cr: LOCATION
W o=G (.f) o=H 0
104 l!. = I
0 +=J x=K o=L
103
10-2 10-1 10
0 10
1 la 103
DAYS
Figure B.103. Peach Bottom Case 1 Drywell Beta Dose Rates
B-54
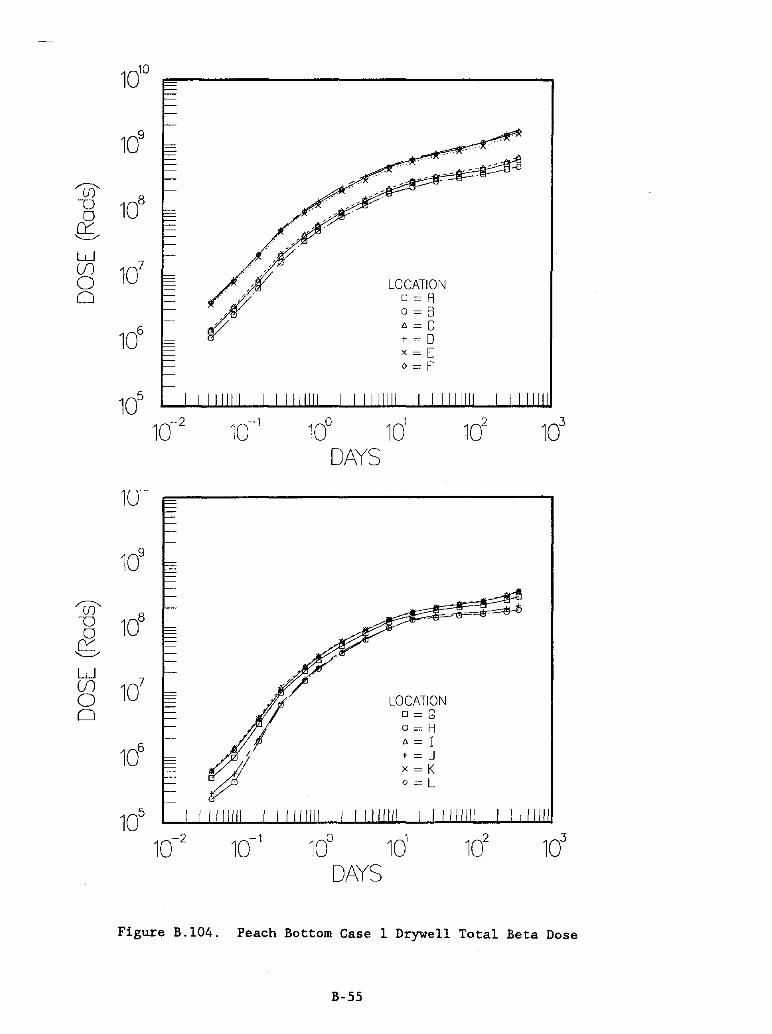
109
'lf5' 10
8 V 0 g;
W
107 Ul
0 LOCATION 0 0= A
0= B
106 lJ. = C
+ = 0 x = E 0= r
105
10-2 10-1 10° ld 10
2 10
3
DAYS
10-
109
'lf5' 10
8 v 0 g;
W
107 Ul
0 LOCATION 0 D=G
0= H
106 lJ. = I
+ = J x = K 0= L
105
10-2 10-1 10° 10
1 10
2 10
3
DAYS
Figure B.104. Peach Bottom Case 1 Drywell Total Beta Dose
B-55
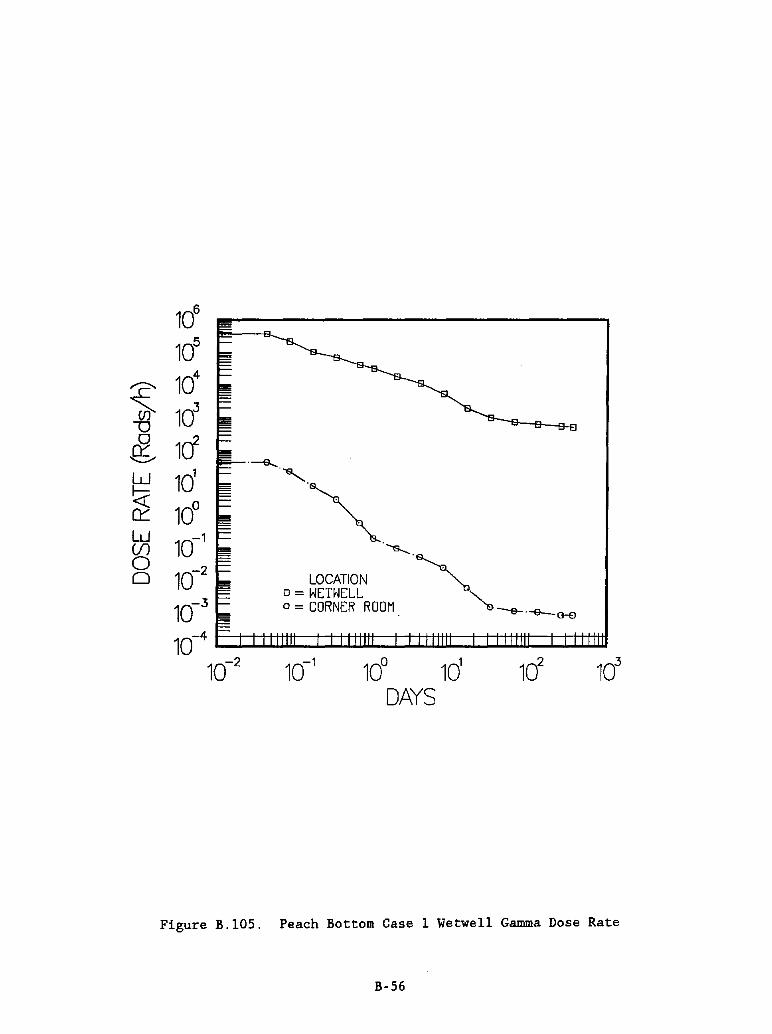
? ~ ""0 o .Q;
~ 0::::: W (f) o o
106
105
104
103
1d 10' 10° 10-' 10-2
10-3
.---s...
'~ LOCATION 's......~
o = WEH.JELL "-0= CORNER ROOM "e-e-.-e-.o-e
10-4 E:t:tttJ:Wt::ttttttttt::!:!:tttttJt:::t::t::tttWt::tttttttiJ 10-2 10-' 10° 10' 102 103
DAYS
Figure B.IOS. Peach Bottom Case I Wetwell Gamma Dose Rate
B-S6

rui' -0 0 ~ W Ul 0 0
109
108
107
106
105
104
103
102
101
10-2
LOCATION 0= WET WELL a = CORNER ROOM
Figure B.106. Peach Bottom Case 1 Wetwell Total Gamma Dose
B-S7
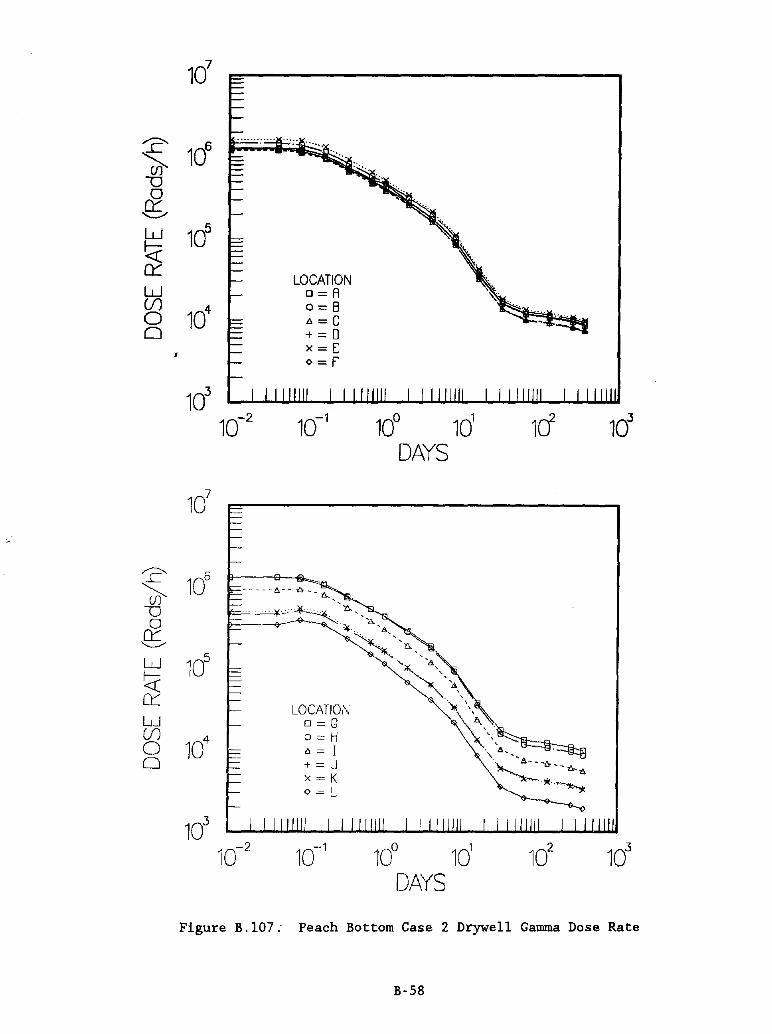
L' ~ -0
~ W
t« et::: W (f) 0 0
106
105
104
103
10-2
107
LOCATION D=A o=B 6=C +=0 x=[ o=F'
10-1
LOCATION D=G Q==H II == I + == J x=K o=L
10° 1d 102
103
DAYS
Figure B.107: Peach Bottom Case 2 Drywell Gamma Dose Rate
B-S8
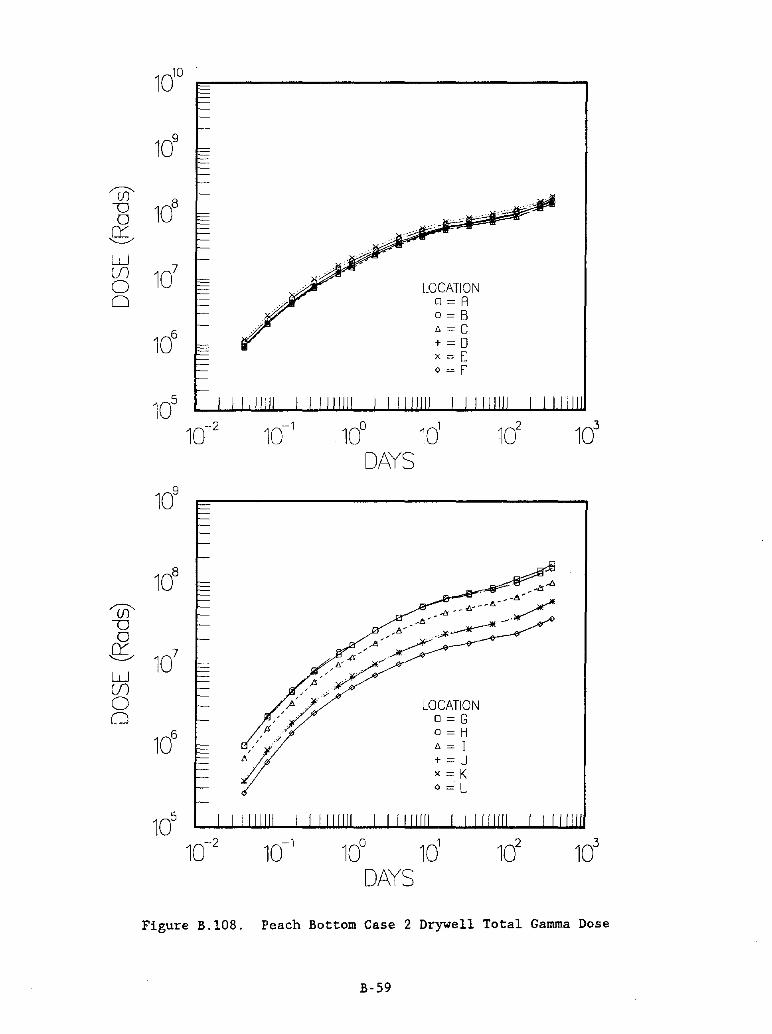
109
~ 10
8 --0 0 g; W
107 If)
0 lDCATION 0 o=A
0=8
106 c; = C
+ = 0 x=[ 0= r
105
10-2 10-1 10° 1d 10
2 1d
DAYS
109
108
~ --0 0 g;
107
W If) 0 LOCATION 0 0= G
106 0= H
c; = I + = J x = K 0= L
105
10-2 10-1 10° 1d 10
2 10
3
DAYS
Figure B.lOS. Peach Bottom Case 2 Drywell Total Gamma Dose
B-59

? ~ 10
6
U 0
,Q; W 10
5
~ 0::::
LOCATION W o==A en
104 o==s
0 t:;==C 0 +==0
x==[ o==F
103
10-2 10-1 10° 1d 10
2 10
3
DAYS
107
? ~ 10
6
U 0
,Q; W 10
5
~ cr:: LOCATION
W 0=8 en
104 o==H
0 t:;==! 0 + == J
x = K o=L
103
10-2 10-1 10° 1d 10
2 10
3
DAYS
Figure B.I09~ Peach Bottom Case 2 Drywell Beta Dose Rate
B-60
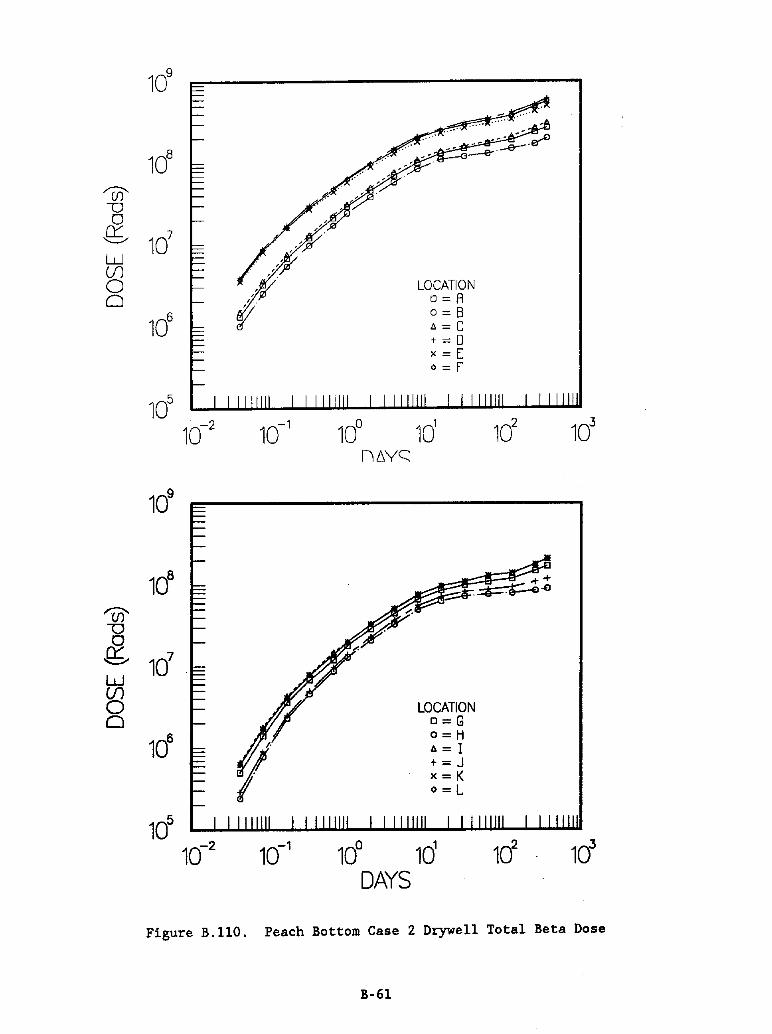
'(f)' -0 0
,g; w (f) 0 0
'(f)' -0 0 ~ W (f) 0 0
108
1d
106
105
10-2 10-1
109
108
107
106
f 10
5
10-2 10-1
10° nL'NC::
LOCATION D=A 0= B " = c + = 0 x = E 0= f
1d
LOCATION D=G o=H A = I +=J x=K o=L
102
103
Figure B.llO. Peach Bottom Case 2 Drywell Total Beta Dose
B·6l

? 'en-V
g W
t<c cr::: W (f) 0 0
106
105
104
103
102
1d 10° 10-1
10-2
10-3
10-4
10-2
LOCATION 0= WETWELL o = CORNER ROOM
Figure B.lll. Peach Bottom Case 2 Wetwell Gamma Dose Rates
B-62
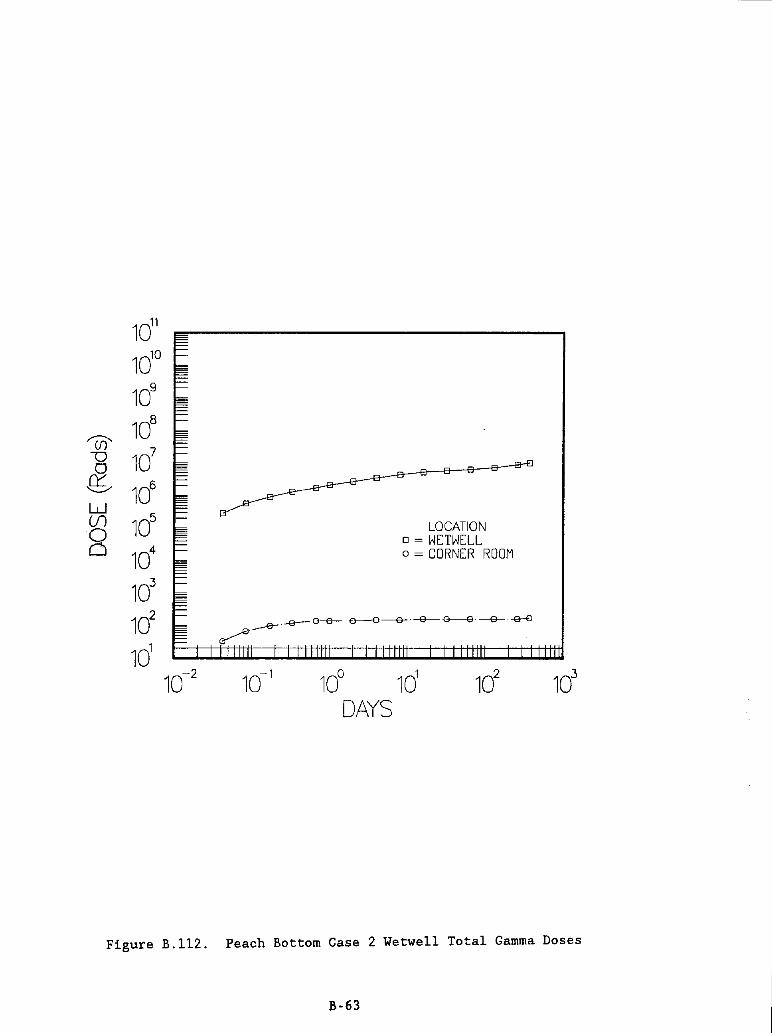
'(jj' -0 o g; w Ul o o
1d1
1do 10
9
108
107
106
105
104
103
102
1d ~.
LOCATION 0= WEH-JELL o = CORNER ROOM
_. _ o-e-. e---o ----e-. -e--- G----<3. ---e-- .-e-e
Figure B.112. Peach Bottom Case 2 Wetwell Total Gamma Doses
B-63

108
107
? 0- 10
6
U 10
5 0 g; W 10
4
~ 0::: 10'3 LOCATION W D==A Ul
102 0==8
0 LI==C 0 t == 0
1d x==[ o == F
10° 10-2 10-1
10° 101
102
103
DAYS
108
107
? 0- 10
6
U 10
5 0 g; W 10
4
~ 0::: 10
3 LOCATION
W D==G Ul
102 o==H
0 LI == I 0 + == J
101 x = K
o=L
10° 10-2 10-1 10° 1d 10
2 10
3
DAYS
Figure B.113. Peach Bottom Case 3 Drywell Gamma Dose Rates
B-64

107
~ --0 0 ~ 10
6
W if) 0 LOCATION 0 D=A
105 o=B
A=C + = 0 x=[ 0= f
104
10-2 10-1 10° ld 10
2 10
3
DAYS
108
107
~ -0 c! 0 ~ 10
6
W if) 0 LOCATION 0 D=G
105 o=H
A = I + = J x = K o=L
104
10-2 10-1 10
0 ld 102
103
DAYS
Figure B.114. Peach Bottom Case 3 Drywell Total Gamma Dose
B-65

? ~ 10
6
V 0
Q; W 10
5
tc 0::: W (J)
104
0 0
LOCATION 0= A-F
103
10-2 10-1 10° 1d 10
2 10
3
DAYS
Figure B.IIS. Peach Bottom Case 3 Drywell Beta Dose Rates
B-66

107
'lfJ u 0
g; 10
6
W (f) 0 0
105
LOCATION 0= A-L
104
10-2 10-1 10° 1d 10
2 10'3 DAYS
Figure B.1l6.. Peach Bottom Case 3 Drywell Total Beta Dose
B-67

? ~ u o g.. w tt n::: w (/) o o
106
105
104
10'3
102
1d 10° 10-1
10-2
.~.~.~
.'s-.
LOCATION ~ 10-3
104~~~~~=w~~~~~wm
10-2 -10-1 10° 1d 102 103
o = WETWELL .'-.. o = CORNER ROOM 'o-e-.--e-9-B
DAYS
Figure B.ll7. Peach Bottom Case 3 Wetwell Gamma Dose Rate
B-6S
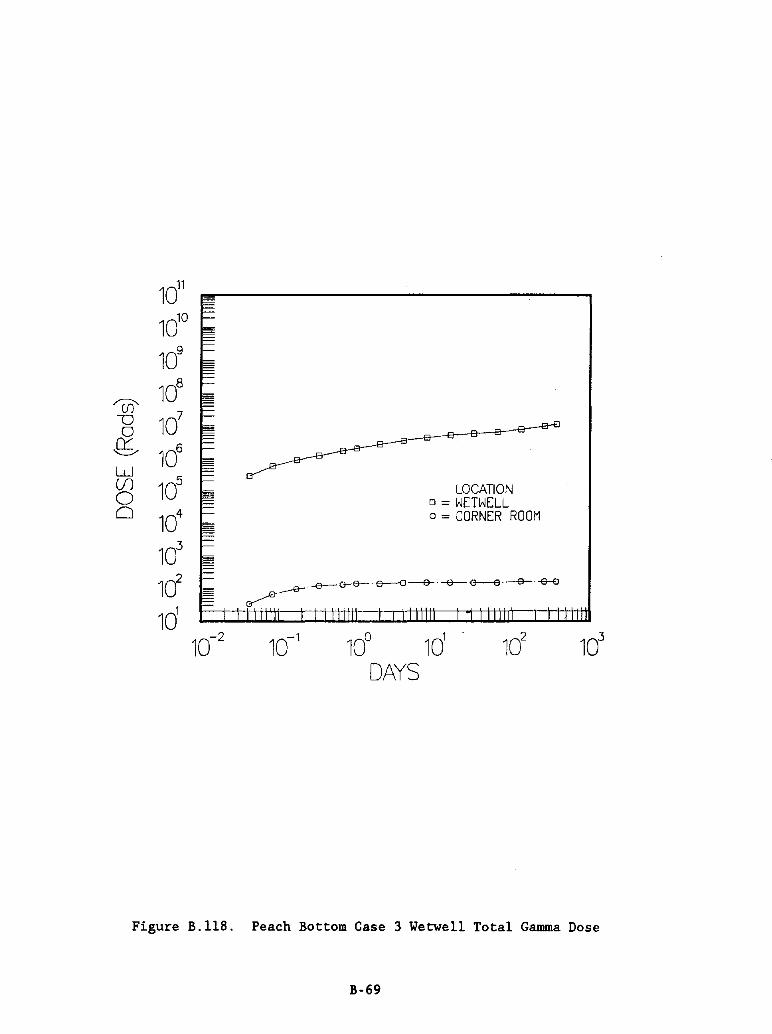
'(f)' u o
.Q; w Ul o o
1011
ldo
109
108
107
106
105
104
103
102
ld
LOCATION 0= WEn-JELL o = CORNER ROOM
Figure B.llS. Peach Bottom Case 3 Wetwell Total Gamma Dose
B-69

108
107
I' ~ 10
6
Ll 10
5 a .Q; W 10
4
~ 0::: 10
3
W Ul
ld 0 0
10'
100 ---
10-2
108
-
107
? 'Ur 10
6 -
Ll 10
5 a .Q; W 10' ~
LOCATION 0::: 10
3 LOCATiON
o:::G W U:7 f-l a=H Ul
102 o=-:£j
A=[ 0 1I == C 1" ::: J 0 -! c:: 0 X::c K
10' )( c_ [
()o = L 0== r
lOa 10-' 10° 10' 10
2 10
3 10-2 10- ' 1Cf DAYS DAYS
Figure B.119. Peach Bottom Case 4 Drywe11 Gamma Dose Rate
LOCATION 0= A-L
Figure B.120. Peach Bottom Case 4 Drywe11 Beta Dose Rate
B-70
10' 10' 103
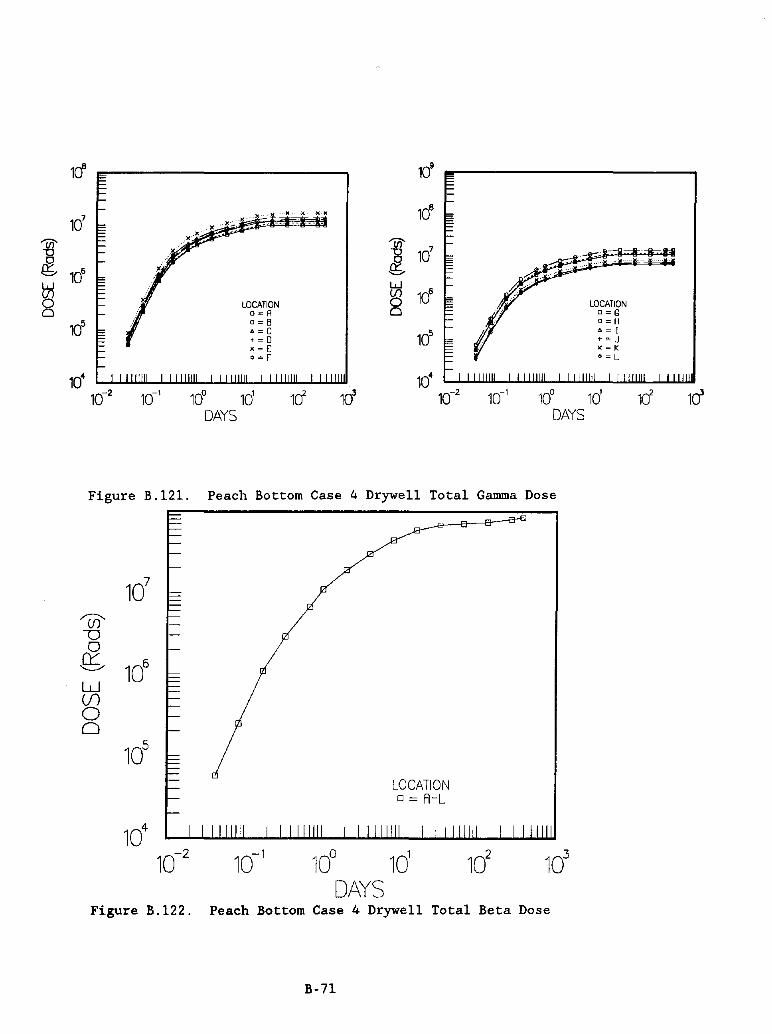
1(1 109
107 ., ···M x- -)(-)( lOB •
'iii' 'iii' 10
7 D "8 0 ,Q;
106 ,Q;
W W
~ LOCATION ~ 106
LOCATION 0 o=A 0 o=G
105 o=B Q=H
'" = C 10
5 6=1 +=0 +=J )( = E X=K 0= f O=L
104 10
4
10-2 10-' 100 10' 102 ld 10-2 10-' 100 10' ld ld DAYS DAYS
Figure B.12l. Peach Bottom Case 4 Drywell Total Gamma Dose
107
'UJ' --0 0
Q; 10
6
W (f) 0 0
105
LOCATION 0= A-L
104
10-2 10-1 10° 1d 10
2 10
3
DAYS Figure B.122. Peach Bottom Case 4 Drywell Total Beta Dose
B-n

r ~ u o
8; w ~ 0:::: W (f) o o
106
105
104
103
102
10' 10° 10-' 10-2
10-3 -
LOCATION 0= HETHELL a = CORNER ROOM
10-4 t:::t:ttU:tttt:::.tt1!l1ttt:::.:J:j::t:J:11j:Jt::j=t11ttttt::::::t::t::t::t:tttrl
10-2 10-' 10° 1d 102 103
DAYS
Figure B.123. Peach Bottom Case 4 Wetwell Gamma Dose Rate
108
107
'(j)' 10
6 U 0
Q; 10
5
W (f)
104
0 0
103
102
1d 10-2
Figure B.124.
LOCATION 0= HETHELL a = CORNER ROOM
~ 1£f 1d ',DAYS
Peach Bottom Case 4 Wetwell Total Gamma Dose
B-72

APPENDIX C
AIRBORNE, WALL, FLOOR, AND SUMP CONTRIBUTIONS TO DOSE RATES FOR SELECTED CONTAINMENT LOCATIONS

Surry Case I
A a f
lh 7.77eS 3.0geS 2h 3.0geS 7.17eS 4h 1.91eS 7.lleS 8h S.27e4 7.07eS
16h 2.2Se4 S.74eS ld 1.42e4 4.94eS 2d S.91e3 3.7leS 4d 3.06e3 2.S8eS 8d 1.7ge3 I.S3eS
16d 6.22e2 8.01e4 32d 7.60el 4.Sle4 64d 2.14eO 2.92e4
128d I.04eO 2.06e4 2S6d I.OleO 1.3ge4
ly 9.9Se-1 1.16e4
Capital letters refer to dose
a - airborne contribution f - floor contribution w - wall contribution h - hour(s) d - day(s) y - year
Table C.I
Basement Gamma Dose Rates
F w a f
2.21e4 S.97eS 2.12eS 2.93e4 2.12eS 4.87eS 2.78e4 1.31eS 4.82eS 2.23e4 3.63e4 4.8eS 1. 7Se4 I.SSe4 3.8geS 1. S8e4 9.81e3 3.3SeS 1.lle4 4.07e3 2.S2eS 6.94e3 2.10e3 1. 7SeS S.22e3 1. 23e3 I.04eS 1.88e3 4.28e2 S.43e4 9.24e2 S.24el 3.06e4 7.98e2 1.48eO 1. 98e4 S.9ge2 7.ISe-1 1.40e4 4.9ge2 6.9ge-1 9.48e3 2.9ge2 6.86e-1 7.ge3
locations.
These abbreviations apply to all Appendix C tables.
C-I
w
S.98e4 1.IOeS 2.23eS 7.87e4 6.4Se4 S.S2e4 3.9ge4 2.6ge4 I.S8e4 6.77e3 3.SSe3 2.40e3 1.90e3 1.42e3 1. 26e3

Table C.2
Surry Case 1 Basement Beta Dose Rates
A F __ F
a f w a f w w'
1h 1.25e6 5.35e5 1.1ge5 1.25e6 5.35e5 2.71e6 4.68e5 2h 6.74e5 1.03e6 1.51e5 6.74e5 1.03e6 4.20e6 5.36e5 4h 5.58e5 1.28e6 8.98e4 5.58e5 1.28e6 3.37e6 2.96e5 8h 1.84e5 1.36e6 1.0e5 1.84e5 1.36e6 3.78e6 4.28e5
16h 1.2e5 1.07e6 8.36e4 1.20e5 1.07e6 3.15e6 3.28e5 1d 9.9ge4 8 .l1e5 6.54e4 9.9ge4 8.11e5 2.72e6 2.81e5 2d 6.06e4 5.80e5 4.68e4 6.06e4 5.80e5 1.97e6 2.23e5 4d 4.24e4 5.07e5 3.17e4 4.24e4 5.07e5 1.45e6 1.42e5
n 8d 2.52e4 3.77e5 2.31e4 2.52e4 3.77e5 9.94e5 9.22e4 • '" 16d 9.54e3 2.66e5 1. 3ge4 9.54e3 2.66e5 6.13e5 6.02e4
32d 1. 57e3 2.14e5 1.04e4 1. 57e3 2.14e5 3.87e5 4.38e4 64d
128d 4.0ge2 8.65e4 4.42e3 4.0ge2 8.65e4 1. 57e5 1. 68e4 256d 4.03e2 4.76e4 2.71e3 4.03e2 4.76e4 1.04e5 8.26e3
1y 3.9ge2 3.37e4 2.21e3 3.9ge2 3.37e4 8.8ge4 6.95e3

Table C.3
Surry Case 1 Annulus Gamma Dose Rates
A C E a f w a f w a f w
lh S.94eS 7.46e4 1.3leS 4.90eS 9.27e3 1. 64eS 8.8SeS 1.18e3 3.24eS 2h 2.2SeS 1.74eS 1.78eS 1. 87eS 2.l6e4 1.80eS 3.3geS 9.lle3 4.38eS 4h 1.42eS 1. 72eS 1.8leS 1.l7eS 2.l4e4 1. 97eS 2.l2eS 2.74e3 3.74eS 8h 3.91e4 1.7leS 1. 27eS 3.23e4 2.l3e4 1.64eS S.84e4 2.73e3 3.23eS
l6h 1. 67e4 1.3geS 1.02eS 1.32e4 1. 73e4 1.32eS 2.S0e4 2.22e3 2.60eS ld 1.06e4 1.1geS 8.87e4 8.72e3 1. 4ge4 1.l3eS 1.S8e4 1. 9le3 2.23eS 2d 4.38e3 8.98e4 6.S3e4 3.62e3 1.l2e4 8.37e4 6.SSe3 1. 44e3 1. 67eS 4d 2.28e3 6.24e4 4.3ge4 1. 88e3 7.80e3 S.64e4 3.3ge3 9.90e2 1.lleS
n 8d 1.S6e3 3.72e4 2.40e4 1.0ge3 4.6Se3 3.lle4 1.98e3 S.96e2 6.l0e4 , w l6d 4.6le2 1.93e4 1.0ge4 3.8le2 2.42e3 1. 32e4 6.8ge2 3.l0e2 2.77e4
32d S.7lel 1.0ge4 S.7e3 4.66el 1.36e3 7.27e3 8.42el 1.74e2 1.43e4 64d 1.6eO 7.08e3 3.8le3 1.30eO 8.84e2 4.9ge3 2.4eO 1.l3e2 9.8le3
l28d 7.7e-l 4.9ge3 3.03e3 6.4e-l 6.2Se2 3.90e3 1.lSeO 8.0lel 7.32e3 2S6d 7.Se-l 3.38e3 2.33e3 6.2e-l 4.23e2 3.02e3 1.l2eO S.42el S.9Se3
ly 7.4e-l 2.8le3 2.07e3 6.le-l 3.S2e2 2.63e3 1.leO 4.S2el S.2Se3

Table C.4
Surry Case 1 Annulus Beta Dose Rates
A C E a f w a f w a f w
lh 2.l4e6 S.36eS S.64eS 2.l4e6 S.64eS 2.l4e6 S.64eS 2h l.l1e6 I.03e6 7.38eS l.l1e6 7.38eS l.l1e6 7.38eS 4h 9.41eS 1. 2ge6 3.3geS 9.41eS 3.3geS 9.41eS 3.3geS 8h 3.6SeS 1.36e6 S.23eS 3.6SeS S.23eS 3.6SeS S.23eS
16h 2.33eS 1. 07e6 3.68eS 2.33eS 3.68eS 2.33eS 3.68eS ld 1. 87eS 8.13eS 2.91eS 1. 87eS 2.91eS 1. 87eS 2.91eS 2d 1.14eS S.80eS 2.08eS 1.14eS 2.08eS 1.14eS 2.08eS 4d 7.7Se4 S.07eS 1.3SeS 7.7SeS 1.3SeS 7.7Se4 1.3SeS
C"l 8d 4.72e4 3.7SeS I.OleS 4.72e4 1.0leS 4.72e4 I.OleS , .,. 16d 1.62e4 2.66eS 6.21e4 1. 62e4 6.2le4 1.62e4 6.21e4 32d 2.92e3 2.14eS 4.43e4 2.92e3 4.43e4 2.92e3 4.43e4 64d
128d 7.82e2 8.6Se4 1.84e4 7.82e2 1.84e4 7.82e2 1.84e4 2S6d 7.4Se2 4.76e4 1. 92e3 7.4Se2 1.92e3 7.4Se2 1.92e3
ly 7.22e2 3.37e4 7.0Se2 7.22e2 7.0Se2 7.22e2 7.0Se2
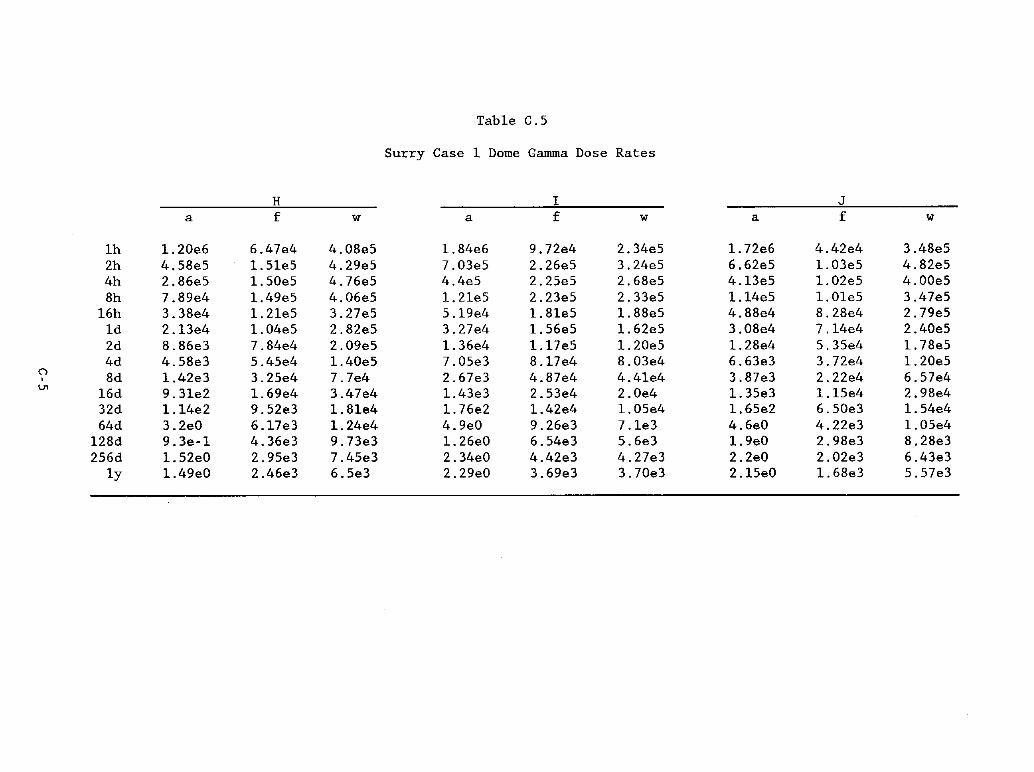
Table C.S
Surry Case I Dome Gamma Dose Rates
H I J a f w a f w a f w
lh 1.20e6 6.47e4 4.08eS 1.84e6 9.72e4 2.34eS 1.72e6 4.42e4 3.48eS 2h 4.S8eS 1.SleS 4.2geS 7.03eS 2.26eS 3.24eS 6.62eS 1.03eS 4.82eS 4h 2.86eS 1.SOeS 4.76eS 4.4eS 2.2SeS 2.68eS 4.13eS 1.02eS 4.00eS 8h 7.8ge4 1.4geS 4.06eS 1. 2leS 2.23eS 2.33eS 1.14eS 1.OleS 3.47eS
l6h 3.38e4 1.2leS 3.27eS S.1ge4 1.8leS 1.88eS 4.88e4 8.28e4 2.7geS ld 2.13e4 1.04eS 2.82eS 3.27e4 1.S6eS 1.62eS 3.08e4 7.l4e4 2.40eS 2d 8.86e3 7.84e4 2.0geS 1. 36e4 1.l7eS 1.20eS 1. 28e4 S.3Se4 1.78eS 4d 4.S8e3 S.4Se4 1.40eS 7.0Se3 8.l7e4 8.03e4 6.63e3 3.72e4 1.20eS
C"l 8d 1.42e3 3.2Se4 7.7e4 2.67e3 4.87e4 4.4le4 3.87e3 2.22e4 6.S7e4 , V1 l6d 9.3le2 1.6ge4 3.47e4 1.43e3 2.S3e4 2.0e4 1.3Se3 1.1Se4 2.98e4
32d 1.l4e2 9.S2e3 1. 8le4 1. 76e2 1.42e4 1.OSe4 1.6Se2 6.S0e3 1.S4e4 64d 3.2eO 6.l7e3 1.24e4 4.geO 9.26e3 7.le3 4.6eO 4.22e3 1. OSe4
l28d 9.3e-l 4.36e3 9.73e3 1. 26eO 6.S4e3 S.6e3 1.geO 2.98e3 8.28e3 2S6d 1. S2eO 2.9Se3 7.4Se3 2.34eO 4.42e3 4.27e3 2.2eO 2.02e3 6.43e3
ly 1. 4geO 2.46e3 6.Se3 2.2geO 3.6ge3 3.70e3 2.1SeO 1.68e3 S.S7e3

Table C.6
Surry Case 1 Dome Beta Dose Rates
H I J a f w a f w a f w
1h 5.56e6 8.27e3 4.04e5 5.56e6 8.27e3 6.3e2 5.56e5 3.26e5 2h 3.01e6 5.24e4 5.76e5 3.01e6 5.24e4 4.3eO 3.01e6 4.37e5 4h 2.37e6 1. 6ge4 4.95e5 2.37e6 1. 6ge4 7.07e2 2.37e6 2.94E5 8h 8.77e5 1. 99e4 5.50e5 8.77e5 1.9ge4 9.52e2 8.77e5 3.65e5
16h 5.63e5 2.31e3 4.51e5 5.63e5 2.31e3 9.6e1 5.63e5 2.81e5 1d 4.51e5 5.18e2 3.61e5 4.51e5 5.18e2 8.4e-1 4.51e5 2.3ge5 2d 2.71e5 7.24e1 2.82e5 2.71e5 7.24e1 1.16e1 2.71e5 1.71e5 4d 1. 86e5 7.44e1 2.14e5 1.86e5 7.44e1 1.86e5 1.22e5 8d 1.12e5 8.97e2 1.46e5 1.12e5 8.97e2 1.12e5 8.72e4
C"l 16d 4.06e4 3.68e2 8.92e4 4.06e4 3.68e2 4.06e4 5.55e4 , 32d 7.0ge3 3.41e1 5.45e4 7.0ge3 3.41e1 7.0ge3 3.58e4 0'\
64d 128d 1.85e3 7.94e1 2.26e4 1.85e3 7.94e1 1.85e3 1. 3ge4 256d 1.7ge3 1. 52e2 1. 4ge4 1.7ge3 1.52e1 1.7ge3 8.91e3
1y 1.73e3 9.7eO 1.24e4 1.73e3 9.70eO 1.73e3 7.02e3

Table C.7
Surry Case 1 Steam Generator A Cubicle Gamma Dose Rates
C D E a f w a f w a f w
lh S.73e5 4.94e4 7.26e4 4.77e5 3.9Se4 l. 57e5 4.5ge5 3.9ge4 l.57e5 2h 3.34e5 1.15e5 l.Ole5 1.S2e5 9.2Se4 2.lSe5 l. 76e5 9.3le4 2.l6e5 4h 2.0Se5 1.14e5 S.40e4 1.14e5 9.2e4 l.7ge5 1.0ge5 9.23e4 1.SOe5 Sh 5.75e4 l.l3e5 7.25e4 3.l4e4 9.l5e4 1.56e5 3.02e4 9.lSe4 1.56e5
l6h 2.45e4 9.22e4 5.S3e4 1.34e4 7.43e4 1.25e5 l. 2ge4 7.45e4 1.25e5 ld l. 55e4 7.94e4 5.0le4 S.4ge3 6.4e4 l.OSe5 S.l7e3 6.42e4 1.08e5 2d 6.44e3 5.96e4 3.7e4 3.S2e3 4.S0e4 S.OSe4 3.3ge3 4.S2e4 7.94e4 4d 3.34e3 4.l4e4 2.48e4 1.S2e3 3.34e4 S.3Se4 l. 76e3 3.3Se4 S.34e4
(') 8d 1.94e3 2.47e4 l. 37e4 1.06e3 l. 9ge4 2.9Se4 1.02e3 1.9ge4 l. 95e4 0 ..... l6d 6.7Se2 l. 2Se4 6.22e3 3.71e2 l. 03e4 1.34e4 3.57e2 l.04e4 l.33e4 32d 8.2gel 7.24e3 3.lSe3 4.53el 5.S4e3 7.0le3 4.36el 5.S5e3 6.9le3 64d 2.33eO 4.6ge3 2.20e3 l.27eO 3.78e3 4.76e3 1.23eO 3.7ge3 4.75e3
l2Sd 1.l3eO 3.3le3 1.72e3 6.l8e-l 2.67e3 3.73e3 5.95-1 2.6Se3 3.71e3 256d 1.lOeO 2.24e3 1.36e3 6.04e-l 1.80e3 2.88e3 5.S2e-l l. 8le3 2.86e3
ly 1.08eO l. 87e3 1.15e3 5.93e-l l.51e3 2.5e3 5.71e-l l.Sle3 2.4ge3

Table C.8
Surry Case 1 Steam Generator A Cubicle Beta Dose Rates
C D E a f w a f w a f w
1h 8.03e6 2.62e2 4.34e2 8.03e6 7.02e5 7.71e5 8.03e6 5.53e5 7.32e5 2h 4.33e6 6.04e2 5.05e2 4.33e6 1.71e6 1.lle6 4.33e6 1.18e6 1.0ge6 4h 3.58e6 7.30e2 4.lle2 3.58e6 2.13e6 1.06e6 3.58e6 1.65e6 1.07e6 8h 1.33e6 8.36e2 3.28e2 1. 33e6 2.3ge6 9.80e5 1.33e6 1. 75e6 8.73e5
16h 8.9ge5 7.87e2 8.9ge5 2.43e6 8.9ge5 1.6ge6 1d 7.0ge5 5.87e2 2.24e2 7.0ge5 1. 77e6 7.14e5 7.0ge5 1.24e6 6.33e5 2d 4.20e5 4.60e2 1. 3ge2 4.20e5 1.28e6 5.31e5 4.20e5 1.00e6 4.81e5 4d 3.01e5 3.50e2 3.01e5 1.00e6 3.01e5 7.98e5
(') 8d 1.82e5 2.60e2 7.20e1 1.82e5 8.28e5 2.67e5 1. 82e5 5.21e5 2.44e5 ,
00 16d 6.61e4 1.84e2 6.61e4 4.92e5 6.61e4 4.07e5 32d 1. 12e4 1.30e2 3.30e1 1. 12e4 3.60e5 1.05e5 1. 12e4 2.70e5 9.3ge4 64d
128d 2.90e3 4.70e1 1.40e1 2.90e3 1. 31e5 4.lle4 2.90e3 1.15e5 3.4ge4 256d
1y 2.78e3 2.lle1 5.40eO 2.78e3 6.33e4 2.06e4 2.78e3 4.77e4 2.00e4

Table G.9
Surry Gase 1 RHR Cubicle Gamma Dose Rates
C D E a f w a f w a f w
Ih S.4geS 1.08eS 7.30e4 3.40eS 8.2Se4 2.08eS 3.73eS 7.86e4 1. SleS 2h 2.40eS 2.S3eS 8.70e4 1. 7SeS 1.93eS 2.02eS 1.92eS 1.83eS 2.1SeS 4h 1.SOeS 2.S1eS 7.40e4 1.0geS 1.91eS 1.68eS 1.20eS 1.82eS 1. 74eS 8h 4.13e4 2.4geS 6.97e4 3.02e4 1.90eS 1.4SeS 3.31e4 1. 81eS 1. SleS
16h 1. 76e4 2.02eS S.24e4 1.2ge4 1. 54e5 1.17eS 1.41e4 1. 47eS 1. 21eS Id 1.l1e4 1.74eS 4.4ge4 8.16e3 1. 33eS 9.98e4 3.93e3 1.26eS LOSeS 2d 4.62e3 1.30eS 3.44e4 3.3ge3 9.98e4 7.38e4 3.71e3 9.S0e4 7.83e4 4d 2.40e3 9.10e4 2.26e4 1. 7Se3 6.93e4 S.Oe4 1.92e3 6.6e4 S.21e4
() 8d , 1.3ge3 S.42e4 1.23e4 1.02e3 4.13e4 2.77e4 1.12e3 3.93e4 2.86e4
'" 16d 4.87e2 2.82e4 S.Sle3 3.S6e2 2.15e4 1.24e4 3.90e2 2.0Se4 1.2ge4 32d S.9Sel 1.Sge4 3.04e3 4.36el 1.21e4 6.S6e3 4.77el 1.lSe4 6.7Se3 64d 1. 67eO 1.03e4 2.00e3 1. 22eO 7.86e3 4.44e3 1.34eO 7.4ge3 4.61e3
128d 8.12e-l 7.28e3 1.S4e3 S.94e-l S.SSe3 3.4Se3 6.S1e-l S.27e3 3.60e3 2S6d 7.94e-l 4.92e3 1.1ge3 S.81e-l 3.7Se3 2.66e3 6.36e-l 3.57e3 2.77e3
ly 7.78e-l 4.10e3 1.04e3 S.70e-l 3.13e3 2.31e3 6.24e-l 2.98e3 2.42e3

Table C.IO
Surry Case 1 RHR Cubicle Beta Dose Rates
C Q E a f w a f w a f w
Ih 7.92e6 1.2ge3 2.2ge2 7.92e6 S.24eS 7.S4eS 7.92e6 S.91eS 4.30eS 211 4.2ie6 2.86e3 2.9Se2 4.21e6 1.06e6 9.77eS 4.21e6 6.03eS 1.03e6 . 4h, 3.S6e6 3.2ge3 2.43e2 3.S6e6 1.30e6 9.S2eS 3.S6e6 1.23e6 S.98eS 8h 1.34e6 3.48e3 2.07e2 1. 34e6 1.62e6 9.SSeS 1.34e6 1.32e6 S.42eS
16h 8.8SeS 2.61e3 1.3ge2 8.8SeS 9.66eS 7.8SeS 8.8SeS 8.9SeS 4.34eS Id 7.28eS 2.24e3 1.27e2 7.28eS 7.geS 6.87eS 7.28eS 7.32eS 3.73eS 2d 4.34eS I.SSe3 8.3gel 4.34eS 6.04eS 4.7SeS 4.34eS S.64eS 2.62eS 4d 3.06eS 1.l3e3 S.64el 3.06eS 4.SgeS 3.S0eS 3.06eS 4.62eS 1.83eS
C'l 8d 1.84eS 9.3ge2 4.1gel 1. 84eS 4.74eS 2.4geS 1.84eS 3.70eS 1. 30eS , t-' I6d 6.88e4 6.68e2 6.88e4 2.24eS 6.88e4 2.20eS 0
32d 1.14e4 S.22e2 2.11el 1.14e4 1.92eS 9.02e4 1.14e4 2.22eS S.23e4 64d 3.24e3 3.2ge2 1. 34eI 3.24e3 1.21eS S.74e4 3.24e3 1.40eS 3.33e4
128d 2.91e3 2.91e3 3.78e4 2.91e3 1.98e4 2S6d 2.86e3 1.14e2 4.08eO 2.86e3 3.77e4 2.41e4 2.86e3 4.3Se4 1.32e4
Iy 2.82e3 8.46el 2.87eO 2.82e3 3.Sle4 2.00e4 2.82e3 2.08e4 I.04e4
;,-

Table C.11
Surry Case 2 Basement Gamma Dose Rates
A F a f w a f w
Ih 7.9ge5 3.07e5 1.40e4 5.51e5 2.08e5 8.00e4 2h 2.71e5 7.07e5 3.20e4 1.86e5 4.80e5 1.10e5 4h 1.24e5 6.01e5 2.60e4 8.52e4 4.08e5 9.28e4 8h 3.73e4 5.31e5 2.17e4 2.57e4 3.60e5 8.23e4
16h 2.0ge4 4.21e5 1. 81e4 1.44e4 2.86e5 6.56e4 1d 1. 42e4 3.61e5 1.48e4 9.81e3 2.44e5 5.62e4 2d 5.91e3 2.65e5 1.11e4 4.07e3 1.80e5 4.0ge4 4d 3.06e3 1. 73e5 7.94e3 2.10e3 l.17e5 2.6ge4 8d 1.7ge3 8.91e4 3.71e3 1.23e3 6.05e4 1. 37e4
16d 6.22e2 3.47e4 1.48e3 4.2ge2 2.35e4 5.37e3 32d 7.60e1 1. 62e4 7.24e2 5.24e1 1.10e4 2.45e3 64d 2.14eO 1. 18e4 5.98e2 1. 47eO 8.05e3 1. 81e3
128d 1.04eO 1.04e4 4.9ge2 7.15e-1 7.0ge3 1. 61e3 256d 1.01eO 9.06e3 3.7ge2 6.9ge-1 6.15e3 1.40e3
1y 9.95e-1 8.14e3 3.4ge2 6.85e-1 5.53e3 1. 26e3
C-11

Table C.12
Surry Case 2 Basement Beta Dose Rates
A F a f w a f w
1h 1.22e6 5.17e5 1.06e5 1. 22e6 5.17e5 2.66e6 2h 4.78e5 1. 24e6 1.48e5 4.78e5 1.24e6 4.04e6 4h 2.60e5 9.50e5 1.42e5 2.60e5 9.50e5 3.71e6 8h 1.45e5 7.42e5 9.18e4 1.45e5 7.42e5 3.38e6
16h 1. 27e5 6.08e5 7.95e4 1. 27e5 6.08e5 2.65e6 1d 9.96e4 4.10e5 5.22e4 9.96e4 4.10e5 2.21e6 2d 6.56e4 2.37e5 4.00e4 6.56e4 2.37e5 1.62e6 4d 4.18e4 1. 58e5 2.43e4 4.18e4 1. 58e5 1.0ge6 8d 2.54e4 8.63e4 1.22e4 2.54e4 8.63e4 6.38e5
16d 8.91e3 4.00e4 6.94e3 8.91e3 4.00e4 3.31e5 32d 1.5ge3 2.00e4 3.42e3 1.5ge3 2.00e4 1. 6ge5 64d 4.58e2 1.32e4 2.07e3 4.58e2 1. 32e4 1.06e5
128d 4.1ge2 9.25e3 1.83e3 4.1ge2 9.25e3 8.4ge4 256d 4.06e2 5.10e3 1.41e3 4.06e2 5.1Oe3 7.30e4
1y 4.00e2 3.52e3 1. 21e3 4.00e2 3.52e3 6.75e4
C-12

Table C.l3
Surry Case 2 Annulus Gamma Dose Rates
A C E a f w a f w a f w
lh 5.93e5 7.46e4 1.28e5 4.90e5 9.27e3 1.65e3 8.85e5 1.lSe3 3.24e5 2h 2.0le5 1.7le5 1.84e5 1.66e5 2.l3e4 2.2Se5 3.00e5 2.46e3 4.46e5 4h 9.16e4 1.45e5 1.52e5 7.57e4 1. Sle4 1.94e5 1. 37e5 2.32e3 3.SSe5 Sh 2.77e4 1.2Se5 1.34e5 2.2ge4 1.60e4 1.7le5 4.14e4 2.05e3 3.37e5
l6h 1. 56e4 I.02e5 1.06e5 1.2Se4 1. 27e4 1. 37e5 2.32e4 1.63e3 2.67e5 ld S.Sge3 S.73e4 8.9Se4 S.72e3 1.0ge4 1.16e5 1. 5Se4 1.40e3 2.30e5 2d 4.3Se3 6.42e4 6.74e4 3.62e3 S.03e3 S.61e4 6.55e3 1.03e3 1.6Se5
(j 4d 2.27e3 4.1ge4 4.24e4 1. 87e3 5.24e3 5.5Se4 3.3ge3 6.72e2 1.IOe5 I ,.... 8d 1.32e3 2.l5e4 2.25e4 I.0ge3 2.6ge3 2.S6e4 1. 97e3 3.45e2 5.6ge4 w
16d 4.61e2 S.40e3 S.74e3 3.Sle2 1.05e3 1.12e4 6.88e2 1.34e2 2.35e4 32d 5.63el 3.93e3 4.05e3 4.65el 4.91e2 5.11e3 8.41el 6.30el 1.Ole4 64d 1.SgeO 2.S6e3 2.94e3 1.31eO 3.5Se2 3.S0e3 2.37eO 4.60el 7.44e3
128d 7.70e-1 2.53e3 2.60e3 6.35e-1 3.16e2 3.36e3 1.15eO 4.05el 6.6ge3 256d 5.22e-l 2.lge3 2.27e3 6.21e-1 2.74e2 2.94e3 1.12eO 3.15el 5.7le3
ly 7.3Se-l 1.97e3 2.04e3 6.0ge-1 2.46e2 2.64e3 1.lOeO 3.16el 5.30e3

Table C.14
Surry Case 2 Annulus Beta Dose Rates
A C E a f w a f w a f w
1h 2.11e6 5.17e5 5.92e5 2.11e6 5.92e5 2.11e6 5.92e5 2h 8.83e5 1.24e6 7.34e5 8.83e5 7.34e5 8.83e5 7.34e5 4h 4.94e5 9.5e5 5.60e5 4.94e5 5.60e5 4.94e5 5.60e5 8h 2.80e5 7.42e5 4.17e5 2~80e5 4.17e5 2.80e5 4.17e5
16h 2.11e5 3.58e5 3.48e5 2.11e5 3.48e5 2.11e5 3.48e5 1d 1.78e5 4.10e5 2.35e5 l. 78e5 2.35e5 l. 78e5 2.35e5 2d 1.13e5 2.37e5 1.51e5 1.13e5 1.51e5 1.13e5 l.51e5 4d 8.03e4 1.58e5 1.0ge5 8.03e4 1.0ge5 8.03e4 1.0ge5
n 8d 4.61e4 8.63e4 7.93e4 4.61e4 7.93e4 4.61e4 7.93e4 , ~ 16d 1. 71e4 3.9ge4 2.23e4 1.71e4 2.23e4 l. 71e4 2.23e4 ~
32d 2.90e3 2.01e4 1. 17e4 2.90e3 1. 17e4 2.90e3 l.17e4 64d 8.36e2 1.32e4 8.34e3 8.36e2 8.34e3 8.36e2 8.34e3
128d 7.64e2 9.25e3 4.78e3 7.64e2 4.78e3 7.64e2 4.78e3 256d 7.50e2 5.10e3 6.87e2 7.50e2 6.87e2 7.50e2 6.87e2
1y 7.45e2 3.52e3 2.15e3 7.45e2 2.15e3 7.45e2 2.15e3

Table C.1S
Surry Case 2 Dome Gamma Dose Rates
H I J a f w a f w a f w
lh 1.08e6 1.62eS 4.28eS 1.83e6 9.7le4 2.43eS 1.7le6 4.42e4 3.S6eS 2h 3.67eS 3.66eS 3.87eS 6.13eS 2.23eS 3.34eS S.8SeS 1.OleS 4.84eS 4h 1.S4eS 3.05e5 3.0SeS 2.S4eS 1.90eS 2.76e5 2.67eS S.66e4 4.l0eS Sh S.07e4 2.63eS 2.63eS S.5ge4 1. 68eS 2.3Se5 S.07e4 7.65e4 3.61e5
l6h 2.S3e4 2.04e5 2.27e5 4.Sle4 1.33e5 1. 94e5 4.S3e4 6.08e4 2.9le5 ld 1. 93e4 1. 73e5 1.93eS 3.27e4 1.14e5 1.66e5 3.0Se4 S.2le4 2.4ge5 2d S.02e3 1.2Se5 1. 44e5 1.36e4 S.40e4 1.21e5 1. 2Se4 3.83e4 1. SleS 4d 2.73e3 3.66e4 1.41e5 3.73e3 S.4ge4 8.14e4 S.62e3 2.50e4 1.1ge5
n Sd 1.5ge3 1.88e4 7.23e4 2.17e3 2.82e4 4.25e4 3.27e3 1.28e4 6.l2e4 , ~ 16d S.S4e2 7.34e3 2.7ge4 7.S7e2 1.lOe4 1.64e4 1.14e3 5.02e3 2.37e4 VI
32d 6.7Sel 3.43e3 1. 2Se4 9.2Sel 5.l4e3 7.27e3 1.3ge2 2.34e3 1.OSe4 64d 1. 91eO 2.5le3 9.3ge3 2.61eO 3.7Se3 S.4Se3 3.92eO 1.7le3 8.02e3
12Sd 9.26e-l 2.2le3 8.3ge3 1.26eO 3.3le3 4.S4e3 1.90eO 1.Sle3 7.l5e3 256d 9.05e-l 1.9le3 7.2ge3 1.23eO 2.S7e3 4.2le3 1.S5eO 1.30e3 6.28e3
ly S.SSe-l 1.72e3 2.S7e3 1. 21eO 2.SSe3 8.30e2 1.S2eO 1.17e3 4.2le3 .~~

Table C.l6
Surry Case 2 Dome Beta Dose Rates
H I J a f w a f w a f w
lh S.6Se6 9.90e3 4.04eS S.6Se6 9.90e3 8.77e2 S.6Se6 3.30eS 2h 2.22e6 S.87e4 S.9geS 2.22e6 S.87e4 2.4le2 2.22e6 4.4SeS 4h 1. 3le6 8.8ge3 S.37eS l.3le6 8.8ge3 1.82e2 1. 3le6 3.70eS 8h 6.76eS S.l8e3 4.68eS 6.76eS S.l8e3 6.76eS 3.2SeS
l6h S.S2eS 2.62e4 3.72eS S.S2eS 2.62e4 2.44el S.S2eS 2.4geS ld 4.4geS 7.S3e3 3.20eS 4.4geS 7.S3e3 4.4geS 1. 90eS 2d 2.76eS 1.7ge2 2.3SeS 2.76eS 1.7ge2 2.76eS 1. 37eS
C) 4d 1.83eS 1. 67el 1.S6eS 1.83eS 1. 67el 1.83eS 8.63e4 , 8d 1.12eS l.88el 9.2Se4 1.12eS 1.88el 1.12eS 4.98e4 ..... ~ l6d 3.98e4 S.84el 4.S6e4 3.98e4 3.98e4 2.S0e4
32d 7.04e3 1. 78el 2.40e4 7.04e3 1. 78el 7.04e3 1.28e4 64d 2.0le3 1. S3e4 2.01e3 2.0le3 8.38e3
l28d 1.7ge3 1. 23e4 1.7ge3 1.7ge3 6.31e3 2S6d 1. 76e3 1.OOe4 1. 76e3 1. 76e3 4.9le3
ly 1. 74e3 9.11e3 1.74e3 1. 74e3 4.3Se3
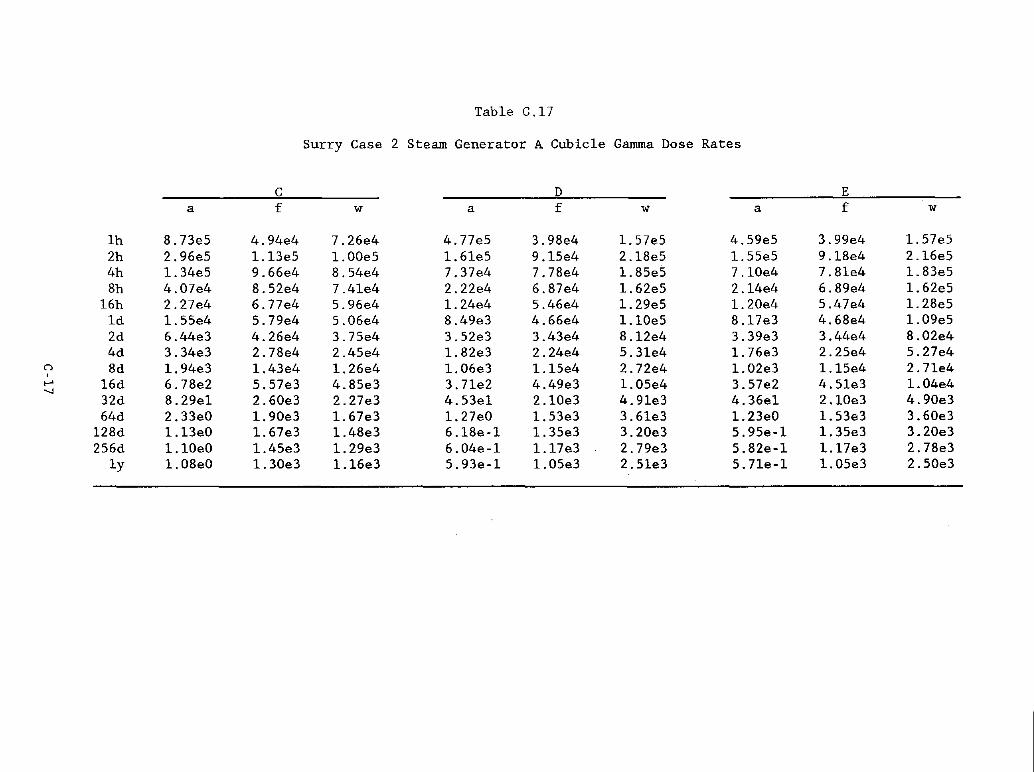
Table C.l7
Surry Case 2 Steam Generator A Cubicle Gamma Dose Rates
C D E a f w a f w a f w
lh 8.73eS 4.94e4 7.26e4 4.77eS 3.98e4 1.S7eS 4.SgeS 3.9ge4 1. S7eS 2h 2.96eS 1.l3eS 1.00eS 1.6leS 9.1Se4 2.l8eS 1. SSeS 9.l8e4 2.l6eS 4h 1.34eS 9.66e4 8.S4e4 7.37e4 7.78e4 1.8SeS 7.l0e4 7.8le4 1. 83eS 8h 4.07e4 8.S2e4 7.4le4 2.22e4 6.87e4 1.62eS 2.l4e4 6.8ge4 1.62eS
l6h 2.27e4 6.77e4 S.96e4 1.24e4 S.46e4 1. 2geS 1. 20e4 S.47e4 1.28eS ld 1.SSe4 S.7ge4 S.06e4 8.4ge3 4.66e4 1.lOeS 8.l7e3 4.68e4 1.0geS 2d 6.44e3 4.26e4 3.7Se4 3.S2e3 3.43e4 8.l2e4 3.3ge3 3.44e4 8.02e4 4d 3.34e3 2.78e4 2.4Se4 1.82e3 2.24e4 S.3le4 1. 76e3 2.2Se4 S.27e4
() 8d , 1.94e3 1.43e4 1. 26e4 1.06e3 1.lSe4 2.72e4 l.02e3 1.lSe4 2.71e4 ..... l6d 6.78e2 S.S7e3 4.8Se3 3.71e2 4.4ge3 1. OSe4 3.S7e2 4.Sle3 1.04e4 -...,J
32d 8.2gel 2.60e3 2.27e3 4.53el 2.l0e3 4.9le3 4.36el 2.l0e3 4.90e3 64d 2.33eO 1.90e3 1. 67e3 1. 27eO 1. 53e3 3.6le3 1. 23eO 1. S3e3 3.60e3
l28d 1.l3eO 1. 67e3 1.48e3 6.l8e-l 1.3Se3 3.20e3 5.9Se-l 1.3Se3 3.20e3 2S6d 1.lOeO 1.4Se3 1.2ge3 6.04e-l 1.l7e3 2.7ge3 S.82e-l 1.l7e3 2.78e3
ly 1.08eO 1. 30e3 1.16e3 S.93e-l 1.05e3 2.5le3 S.71e-l 1.05e3 2.S0e3
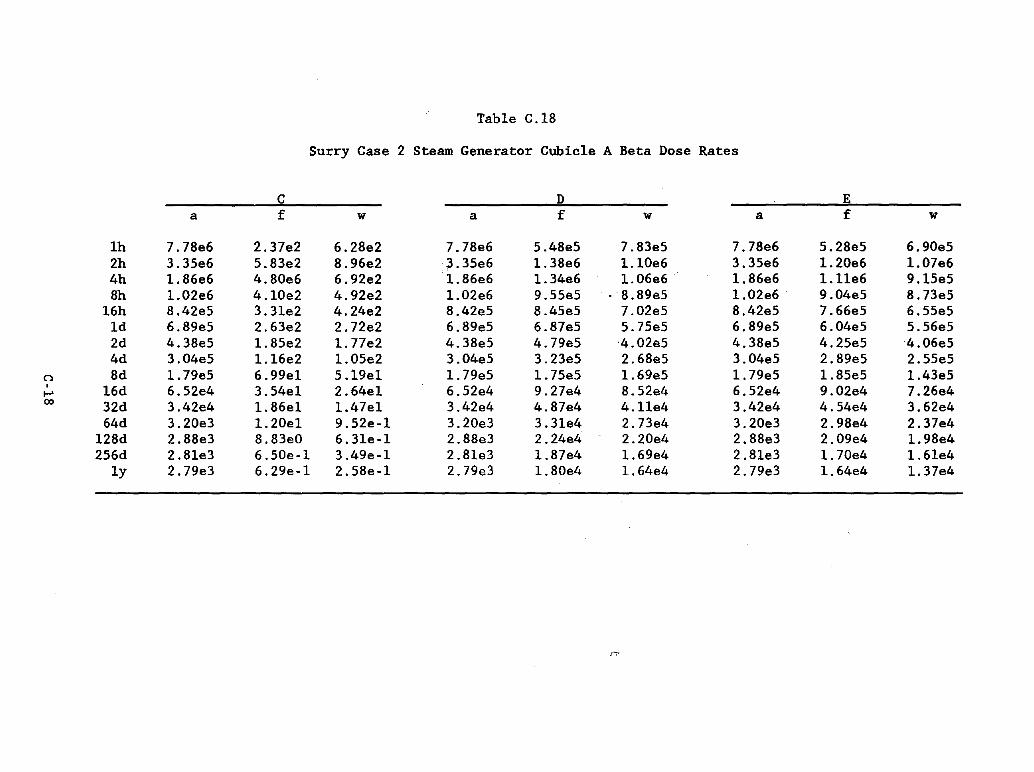
Table C.lS
Surry Case 2 Steam Generator Cubicle A Beta Dose Rates
C D E a f w a f w a f w
lh 7.7Se6 2.37e2 6.2Se2 7.7Se6 S.4SeS 7.S3eS 7.7Se6 S.2SeS 6.90eS 2h 3.3Se6 S.S3e2 S.96e2 3.3Se6 1.3Se6 1.lOe6 3.3Se6 1.20e6 l.07e6 4h 1.S6e6 4.S0e6 6.92e2 1.S6e6 1.34e6 1.06e6 l.S6e6 1.l1e6 9.lSeS Sh 1.02e6 4.l0e2 4.92e2 1.02e6 9.SSeS ·S.SgeS l.02e6 9.04eS S.73eS
l6h S.42eS 3.3le2 4.24e2 S.42eS S.4SeS 7.02eS S.42eS 7.66eS 6.SSeS ld 6.SgeS 2.63e2 2.72e2 6.SgeS 6.S7eS S.7SeS 6.SgeS 6.04eS S.S6eS 2d 4.3SeS 1.SSe2 1. 77e2 4.3SeS 4.7geS 4.02eS 4.3SeS 4.2SeS 4.06eS 4d 3.04eS 1.16e2 1.OSe2 3.04eS 3.23eS 2.6SeS 3.04eS 2.SgeS 2.SSeS
C"l Sd 1.7geS 6.9gel S.1gel 1.7geS 1.7SeS 1.6geS 1.7geS 1.SSeS 1.43eS , l6d 6.S2e4 3.S4el 2.64el 6.S2e4 9.27e4 S.S2e4 6.S2e4 9.02e4 7.26e4 to-'
00 32d 3.42e4 1.S6el 1. 47el 3.42e4 4.S7e4 4.l1e4 3.42e4 4.S4e4 3.62e4 64d 3.20e3 1. 20el 9.S2e-l 3.20e3 3.3le4 2.73e4 3.20e3 2.9Se4 2.37e4
l2Sd 2.SSe3 S.S3eO 6.3le-l 2.S8e3 2.24e4 2.20e4 2.SSe3 2.0ge4 1.98e4 2S6d 2.8le3 6.S0e-l 3.4ge-l 2.Sle3 l.S7e4 1. 6ge4 2.Sle3 1.70e4 1. 6le4
ly 2.7ge3 6.2ge-l 2.S8e-l 2.7ge3 1.SOe4 1.64e4 2.7ge3 1.64e4 1. 37e4
[1"

Table C.19
Surry Case 3 Basement Gamma Dose Rate
A F s a s a
lh 7.56e5 9.40e4 5.4ge5 6.l0e4 2h 6.0le5 7.27e4 4.36e5 4.BOe4 4h 4.9ge5 5.05e4 3.62e5 3.33e4 Bh 3.9le5 3.00e4 2.B3e5 2.07e4
l6h 3.05e5 1. 75e4 2.22eS 1.14e4 ld 2.60eS 1. 2Se4 1.BBeS 7.8le3 2d 1.93eS S.40e3 1.40eS 3.92e3 4d 1.33e5 2.40e3 9.64e4 1.63e3 8d 7.l7e4 1. SOe3 5.60e4 9.BOe2
16d 3.B8e4 5.50e2 2.Ble4 3.BOe2 32d 2.l7e4 1.lOe2 1. SBe4 3.96el 64d 1.43e4 9.00el 1,05e4 1.lleO
l28d 1.04e4 8.23e-l 7.S6e3 S.41e-l 256d 7.27e3 B.05e-l 5.28e3 5.30e-l
ly 6.12e3 7.90e-l 4.44e3 S.20e-l
s - sump contribution a - airborne contribution
C-19

Table C.20
Surry Case 3 Annulus Gamma Dose Rate
A C E s a s a s a
lh 2h 3.08eS 7.l0e4 2.97e4 S.36e4 3.6Se3 9.64e4 4h 2.SSeS 4.97e4 2.46e4 3.73e4 3.02e3 6.7Se4 8h 2.00eS 2.96e4 1.93e4 2.24e4 2.37e3 4.0Se4
l6h 1.S7eS 1.64e4 1. Sle4 1. 2Se4 1. 84e3 2.27e4 ld 1.33eS 1.06e4 1.28e4 8.60e3 1. S7e3 1.S4e4 2d 9.9le4 4.90e3 9.S7e3 3.S3e3 1.l7e3 6.4le3 4d 6.80e4 2.40e3 6.S7e3 1. 83e3 8.03e2 3.32e3 8d 3.9Se4 1.40e3 3.82e3 1.07e3 4.66e2 1.93e3
l6d 1.9ge4 S.SOe2 1. 92e3 3.70e2 2.34e2 6.7Se2 32d 1.12e4 4.60el 1.07e3 4.S4el 1.3le2 8.23el 64d 7.38e3 1. 2geO 7 .13e2 1.28eO 8.73el 2.32eO
l28d S.34e3 6.22e-l S.16e2 6.20e-l 6.3lel 1.13eO 2S6d 3.72e3 6.011e-l 3.60e2 S.8ge-l 4.4lel 1.10eO
ly 3.l3e3 S.96e-l 3.03e2 S.94e-l 3.71el 1.OSeO
C-20
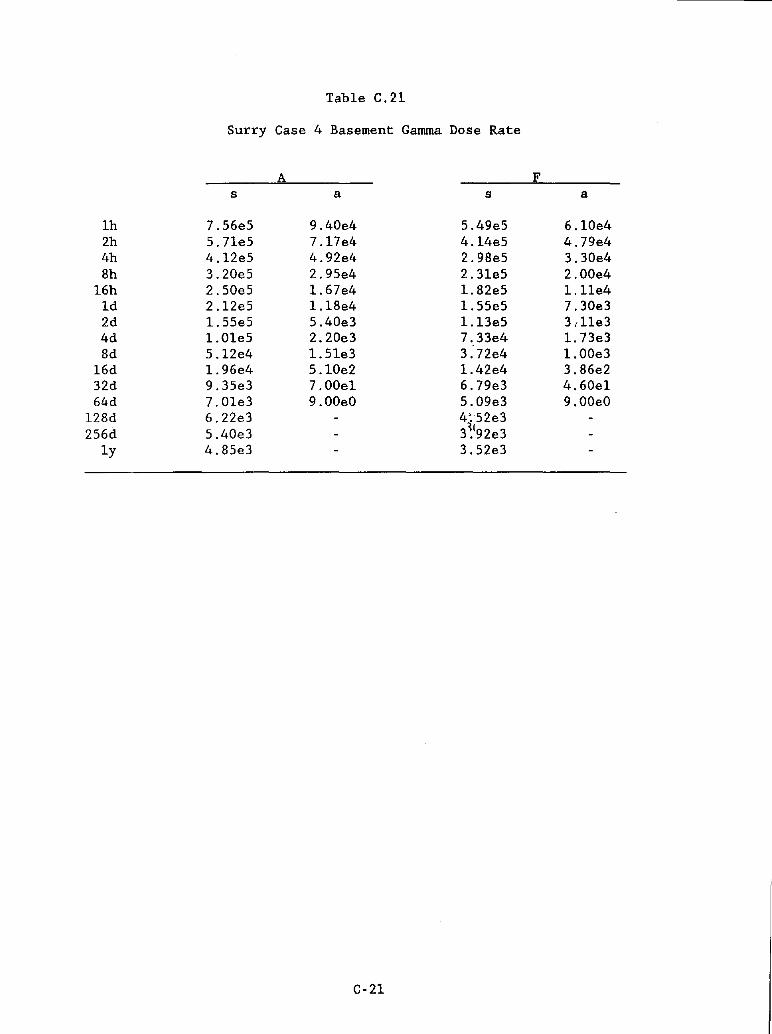
Table C.21
Surry Case 4 Basement Gamma Dose Rate
A F s a s a
Ih 7.56e5 9.40e4 5.4ge5 6.10e4 2h 5.71e5 7.17e4 4. 14e5 4.7ge4 4h 4.12e5 4.92e4 2.98e5 3.30e4 8h 3.20e5 2.95e4 2.31e5 2.00e4
16h 2.50e5 1. 67e4 1.82e5 1.11e4 Id 2.12e5 1. 18e4 1.55e5 7.30e3 2d 1.55e5 5.40e3 1.13e5 3,l1e3 4d 1.01e5 2.20e3 7.33e4 1. 73e3 8d 5.12e4 1. 51e3 3.72e4 1.00e3
16d 1. 96e4 5.10e2 1. 42e4 3.86e2 32d 9.35e3 7.00el 6.7ge3 4.60el 64d 7.01e3 9.00eO 5.0ge3 9.00eO
128d 6.22e3 4:52e3 256d 5.40e3 3~192e3
ly 4.85e3 3.52e3
C-21
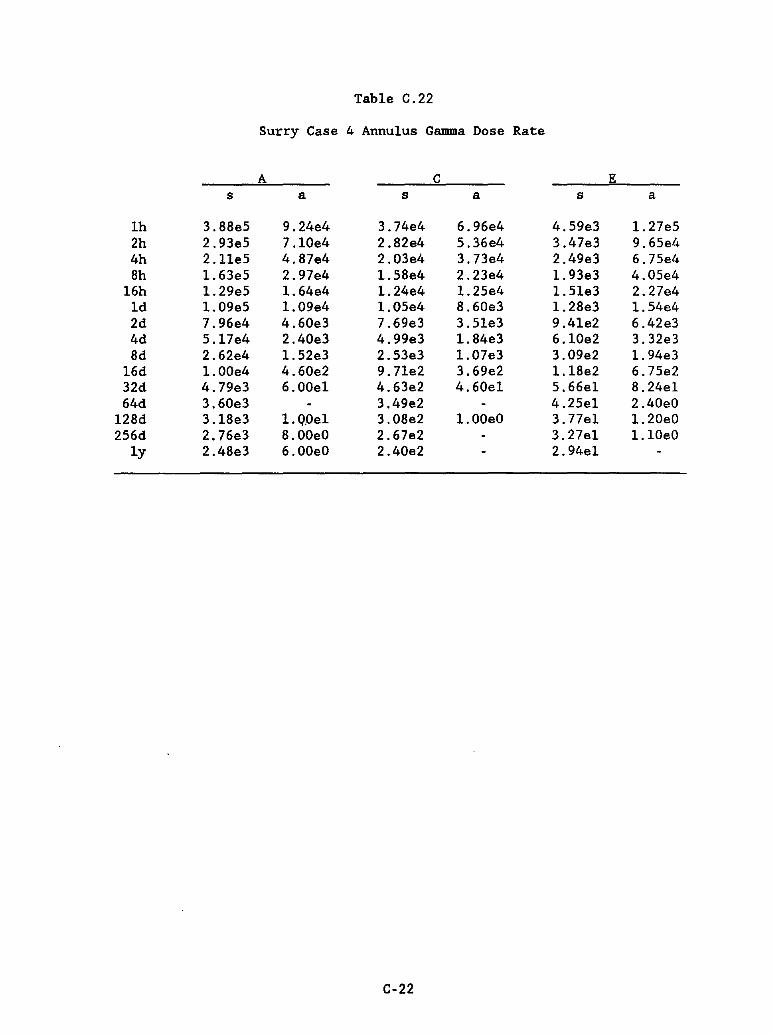
Table C.22
Surry Case 4 Annulus Gamma Dose Rate
A C E s a s a s a
lh 3.BBe5 9.24e4 3.74e4 6.96e4 4.5ge3 1. 27e5 2h 2.93e5 7.l0e4 2.B2e4 5.36e4 3.47e3 9.65e4 4h 2.11e5 4.B7e4 2.03e4 3.73e4 2.4ge3 6.75e4 Bh 1.63e5 2.97e4 1. 5Be4 2.23e4 1.93e3 4.05e4
l6h 1.2ge5 1.64e4 1.24e4 1. 25e4 1.5le3 2.27e4 ld 1.0ge5 1.0ge4 1.05e4 B.60e3 1.2Be3 1.54e4 2d 7.96e4 4.60e3 7.6ge3 3.5le3 9.4le2 6.42e3 4d 5.l7e4 2.40e3 4.9ge3 1. B4e3 6.l0e2 3.32e3 Bd 2.62e4 1.52e3 2.53e3 1.07e3 3.0ge2 1. 94e3
l6d 1.OOe4 4.60e2 9.71e2 3.6ge2 1.lBe2 6.75e2 32d 4.7ge3 6.00el 4.63e2 4.60el 5.66el B.24el 64d 3.60e3 3.4ge2 4.25el 2.40eO
l2Bd 3.l8e3 1.qOel 3.0Be2 1.OOeO 3.77el 1. 20eO 256d 2.76e3 B.OOeO 2.67e2 3.27el 1.IOeO
ly 2.4Be3 6.00eO 2.40e2 2.94el
C-22

Table C.23
Peach Bottom Case 1 Drywell Gamma Dose Rates
A B C a f w a f w a f w
Ih 2.57e5 7.20e5 2.S0e5 3.22e5 9.l3e5 2.42e5 2.72e5 7.61e5 l. 76e5 2h 3.6ge5 5.51e5 2.63e5 4.62e5 7.02e5 2.23e5 3.90e5 5.S3e5 1.64e5 4h 3.72e5 5.2le5 2.5ge5 4.66e5 6.62e5 2.20e5 3.93e5 5.50e5 1.61e5 Sh 2.15e5 3.3ge5 1.5Se5 2.6Se5 4.31e5 1.34e5 2.27e5 3.5Se5 9.90e4
C') 16h l.1ge5 2.61e5 1.20e5 1.4geS 3.32eS l.02eS 1.26e5 2.76e5 7.50e4 , Id S.05e4 2.23e5 1.03eS 1.OleS 2.S4eS S.70e4 S.50e4 2.36e5 6.40e4 ~ w 2d 3.27e4 1.64e5 7.60e4 4.0ge4 2.0SeS 6.S0e4 3.46e4 l. 73e5 4.70e4
4d l.67e4 l.07e5 5.00e4 2.0ge4 1.36eS 4.20e4 l. 77e4 1.l3e5 3.11e4 Sd 9.74e3 5.47e4 2.5ge4 l. 22e4 6.94e4 2.22e4 1.03e4 5.7Se4 1.60e4
16d 3.3ge3 2.10e4 1.04e4 4.24e3 2.6Se4 S.70e3 3.5Se3 2.23e4 6.40e3 32d 4.15e2 9.74e3 5.16e3 S.1ge2 1.24e4 4.40e3 4.3Se2 S.96e3 4.57e3 64d l.27el 7.0ge3 4.07e3 1.Sgel 9.02e3 3.45e3 l. 34el 7.50e3 2.53e3
12Sd 6.61eO 6.2Se3 3.72e3 -, '"8. 26eO 7.95e3 3.1Se3 6.9SeO 6.61e3 2.31e3 2S6d 6.43eO S.40e3 3.2ge3 S.04eO 6.S6e3 2.S0e3 6.7geO 5.71e3 2.04e3
1y 6.30eO 4.SSe3 2.9Se3 7.S7eO 6.16e3 2.53e3 6.65eO 5.12e3 1.S6e3
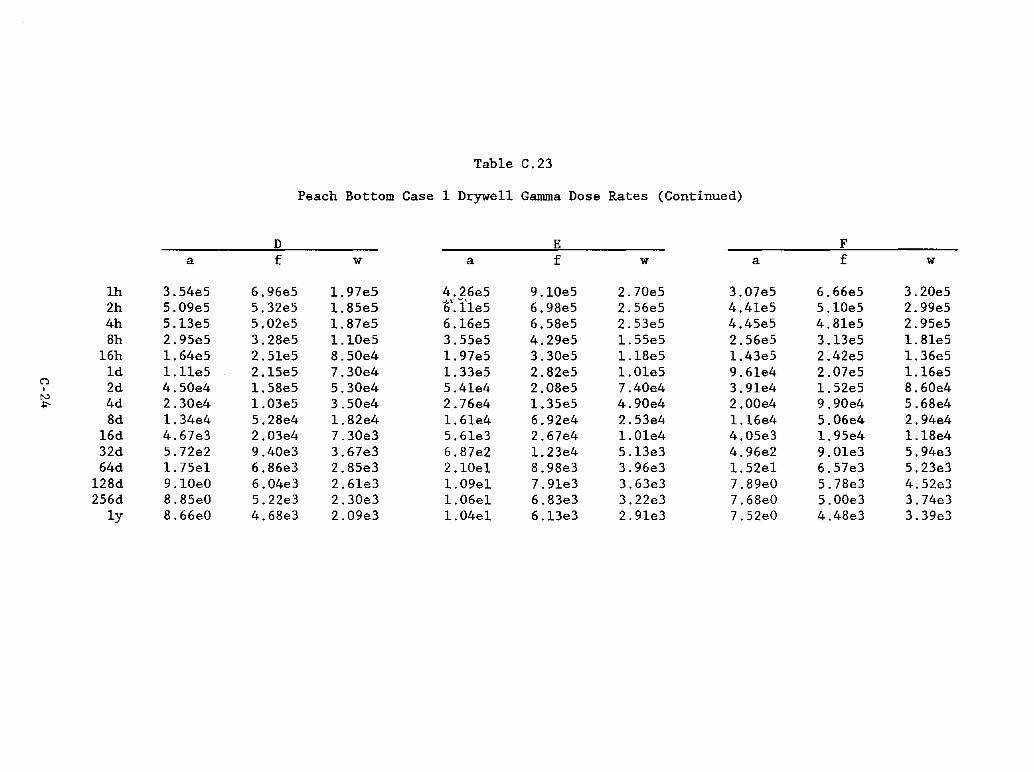
Table C.23
Peach Bottom Case 1 Drywell Gamma Dose Rates (Continued)
D E F a f w a f w a f w
Ih 3.S4eS 6.96eS 1. 97eS 4.26eS 9.10eS 2.70eS 3.07eS 6.66eS 3.20eS 2h S.0geS S.32eS 1.8SeS t;'~ l'leS 6.98eS 2.S6eS 4.41eS S.lOeS 2.9geS 4h S.13eS S.02eS 1. 87eS 6.16eS 6.S8eS 2.S3eS 4.4SeS 4.81eS 2.9SeS 8h 2.9SeS 3.28eS 1.lOeS 3.SSeS 4.2geS 1.SSeS 2.S6eS 3.l3eS 1.81eS
16h 1.64eS 2.S1eS 8.S0e4 1. 97eS 3.30eS 1.18eS 1.43eS 2.42eS 1.36eS Id 1.lleS 2.1SeS 7.30e4 1. 33eS 2.82eS 1.01eS 9.61e4 2.07eS 1.16eS
C1 2d 4.S0e4 1.S8eS S.30e4 S.41e4 2.08eS 7.40e4 3.91e4 1.S2eS 8.60e4 , N 4d 2.30e4 1.03eS 3.S0e4 2.76e4 1.3SeS 4.90e4 2.00e4 9.90e4 S.68e4 ~
8d 1.34e4 S.28e4 1.82e4 1.61e4 6.92e4 2.S3e4 1.16e4 S.06e4 2.94e4 16d 4.67e3 2.03e4 7.30e3 S.61e3 2.67e4 1.01e4 4.0Se3 1.9Se4 1.18e4 32d S.72e2 9.40e3 3.67e3 6.87e2 1.23e4 S.13e3 4.96e2 9.01e3 S.94e3 64d 1. 7Sel 6.86e3 2.8Se3 2.10el 8.98e3 3.96e3 1. S2el 6.S7e3 S.23e3
128d 9.10eO 6.04e3 2.61e3 1.0gel 7.91e3 3.63e3 7.8geO S.78e3 4.S2e3 2S6d 8.BSeO S.22e3 2.30e3 1.06el 6.83e3 3.22e3 7.68eO S.OOe3 3.74e3
ly B.66eO 4.6Be3 2.0ge3 1.04el 6.l3e3 2.91e3 7.S2eO 4.48e3 3.3ge3
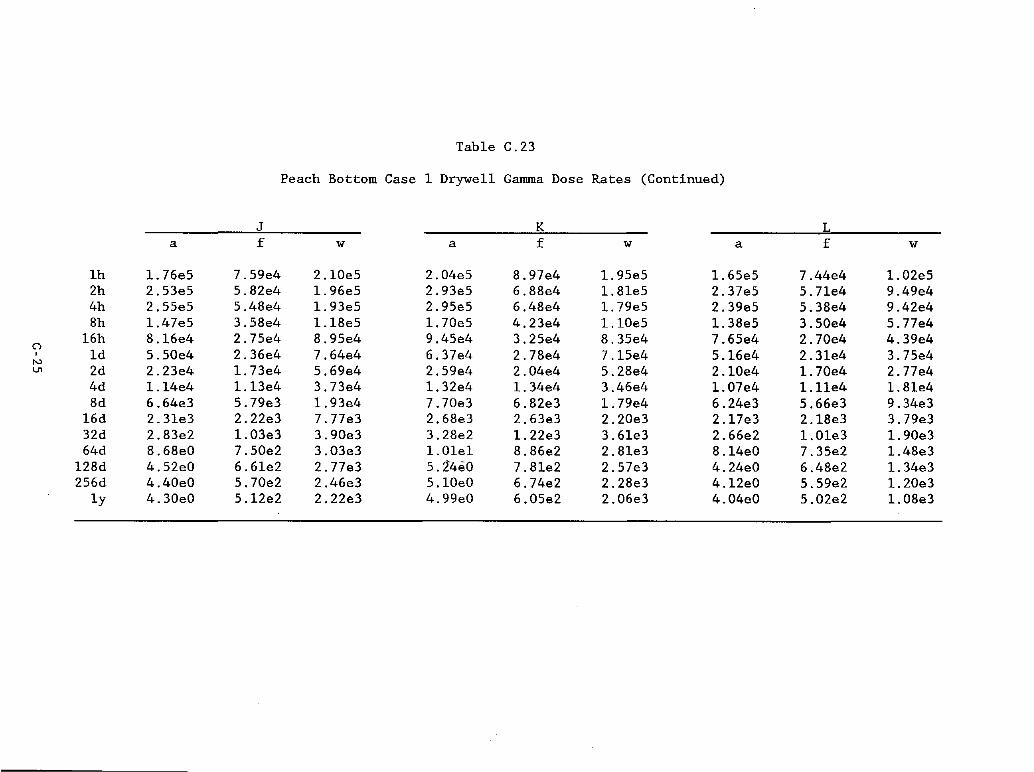
Table C.23
Peach Bottom Case 1 Drywell Gamma Dose Rates (Continued)
J K L a f w a f w a f w
lh 1. 76eS 7.Sge4 2.l0eS 2.04eS 8.97e4 l.9SeS l.6SeS 7.44e4 l.02eS 2h 2.S3eS S.82e4 l.96eS 2.93eS 6.88e4 1. 8leS 2.37eS S.71e4 9.4ge4 4h 2.SSeS S.48e4 1. 93eS 2.9SeS 6.48e4 l.7geS 2.3geS S.38e4 9.42e4 8h 1. 47eS 3.S8e4 l.l8eS 1.70eS 4.23e4 1.10eS 1.38eS 3.S0e4 S.77e4
16h 8.16e4 2.7Se4 8.9Se4 9.4Se4 3.2Se4 8.3Se4 7.6Se4 2.70e4 4.3ge4 () , ld S.SOe4 2.36e4 7.64e4 6.37e4 2.78e4 7.lSe4 S.l6e4 2.3le4 3.7Se4 '" U1 2d 2.23e4 l.73e4 S.6ge4 2.Sge4 2.04e4 S.28e4 2.l0e4 1. 70e4 2.77e4
4d l.l4e4 1.13e4 3.73e4 1. 32e4 l.34e4 3.46e4 1. 07e4 1.11e4 1.8le4 8d 6.64e3 S.7ge3 1. 93e4 7.70e3 6.82e3 l.7ge4 6.24e3 S.66e3 9.34e3
l6d 2.3le3 2.22e3 7.77e3 2.68e3 2.63e3 2.20e3 2.l7e3 2.l8e3 3.7ge3 32d 2.83e2 1.03e3 3.90e3 3.28e2 l.22e3 3.6le3 2.66e2 l.Ole3 1. 90e3 64d 8.68eO 7.S0e2 3.03e3 1.0lel 8.86e2 2.8le3 8.l4eO 7.3Se2 1.48e3
l28d 4.S2eO 6.6le2 2.77e3 S.:t4eO 7.8le2 2.S7e3 4.24eO 6.48e2 1. 34e3 2S6d 4.40eO S.70e2 2.46e3 S.lOeO 6.74e2 2.28e3 4.l2eO S.Sge2 l.20e3
ly 4.30eO S.l2e2 2.22e3 4.9geO 6.0Se2 2.06e3 4.04eO S.02e2 l.08e3
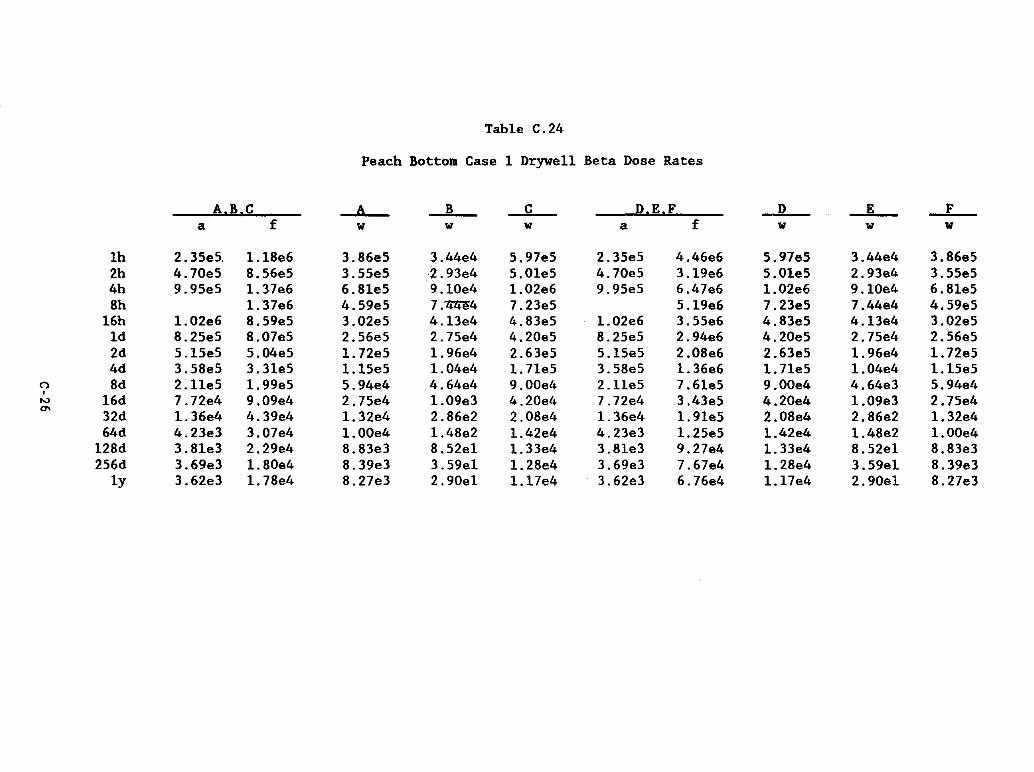
Table C.24
Peach Bottom Case 1 Drywell Beta Dose Rates
A.~ !;; A B C ~.E.F D E -1: a f w w w a f w w w
lh 2.35e5. 1.lSe6 3.S6e5 3.44e4 5.97e5 2.35e5 4.46e6 5.97e5 3.44e4 3.S6e5 2h 4.70e5 S.56e5 3.55e5 2.93e4 5.0le5 4.70e5 3.lge6 5.0le5 2.93e4 3.55e5 4h 9.95e5 1. 37e6 6.Sle5 9.l0e4 1.02e6 9.95e5 6.47e6 1.02e6 9.l0e4 6.Sle5 Sh 1. 37e6 4.5ge5 7.~4 7.23e5 5.lge6 7.23e5 7.44e4 4.Sge5
l6h 1.02e6 S.5ge5 3.02e5 4.13e4 4.S3eS 1.02e6 3.SSe6 4.S3e5 4.13e4 3.02eS ld S.2Se5 S.07e5 2.56eS 2.7Se4 4.20e5 S.25e5 2.94e6 4.20eS 2.7Se4 2.S6eS 2d S.15e5 S.04eS 1.72e5 1.96e4 2.63e5 5.l5eS 2.0Se6 2.63e5 1.96e4 1.72eS 4d 3.SSe5 3.3le5 1.lSeS 1.04e4 1.71e5 3.5Se5 1.36e6 1.71e5 1.04e4 1.15eS
(') Sd 2.l1e5 1.9geS S.94e4 4.64e4 9.00e4 2.l1eS 7.6leS 9.00e4 4.64e3 5. 94e4 • l6d 9.0ge4 1.0ge3 3.43eS 2.7Se4 '" 7.72e4 2.7Se4 4.20e4 7.72e4 4.20e4 1.0ge3 '" 32d 1.36e4 4.3ge4 1.32e4 2.S6e2 2.0Se4 1.36e4 1.91eS 2.0Se4 2.S6e2 1.32e4
64d 4.23e3 3.07e4 1.OOe4 1.4Se2 1.42e4 4.23e3 1.2SeS 1. 42e4 1.4Se2 1.OOe4 l2Sd 3.Sle3 2.2ge4 S.S3e3 S.S2el 1. 33e4 3.Sle3 9.27e4 1. 33e4 S.S2el S.S3e3 2S6d 3.6ge3 1.SOe4 S.3ge3 3.5gel 1. 2Se4 3.6ge3 7.67e4 1.2Se4 3.Sgel S.3ge3
ly 3.62e3 1. 7Se4 S.27e3 2.90el 1.l7e4 3.62e3 6.76e4 1.17e4 2.90el S.27e3

Table C.24
Peach Bottom Case 1 Drywell Beta Dose Rates (Continued)
G,H,I G H I J,K,L J ....K...1. a f w w w a f w w
1h 2.35e5 3.24e4 3.86e5 3.44e4 5.97e5 2.35e5 1. 44e5 5.97e5 2h 4.70e5 1. 8ge4 3.55e5 2.93e4 5.01e5 4.70e5 1. 31e5 5.01e5 4h 9.95e5 1. 61e5 6.81e5 9.1e4 1.02e6 9.95e5 2.43e5 1.02e6 8h 6.18e4 4.5ge5 7.44e4 7.23e5 1.82e5 7.23e5
16h 1.02e6' 2.8ge4 3.02e5 4.13e4 4.83e5 1.02e6 1.14e5 4.83e5 1d 8.25e5 1.0ge4 2.56e5 2.75e4 4.20e5 8.25e5 9.56e4 4.20e5 2d 5.15e5 1.72e5 1.96e4 2.63e5 5.15e5 6.96e4 2.63e5 4d 3.58e5 1.15e5 1.04e4 1.71e5 3.58e5 4.18e4 1.71e5 8d 2.11e5 4.01e3 5.94e4 4.64e3 9.00e4 2.11e5 2.26e4 9.00e4
C1 16d 7.72e4 2.75e4 1.0ge3 4.20e4 7.72e4 1.06e4 4.20e4 , r-> 32d 1. 36e4 2.88e3 1.32e4 2.86e2 2.08e4 1. 36e4 5.27e3 2.08e4 -J
64d 4.23e3 1.00e4 1. 48e2 1.42e4 4.23e3 3.83e3 1.42e4 128e 3.81e3 8.83e3 8.52e1 1. 33e4 3.81e3 3.38e3 1. 33e4 256e 3.6ge3 1.36e3 8.3ge3 3.5ge1 1. 28e4 3.6ge3 3.06e3 1. 28e4
ly 3.62e3 2.66e2 8.27e3 2.90e1 1. 17e4 3.62e3 3.06e3 1. 17e4 tf~) ....

Table C.2S
Surry Case 1 Wetwell Gamma Dose Rates
A B s a w s a w
lh 1.68e4 2.9geS S.58e4 4.l6el 2.40eO 2h 1.22e4 1.S8eS 4.26e4 2.l4el 1.42eO 4h 9.43e3 6.0le4 3.l4e4 7.6leO 6.90e-l 8h 6.88e3 3.3ge4 .~2..47e4 2.73eO 3.86e-l
l6h 5.l6e3 1.68e4 1. 95e4 3.83e-l 2.l7e-l ld 4.2ge3 1.02e4 1. 67e4 5.4ge-2 1.45e-l 2d 3.06e3 2.4ge3 1. 23e4 4d 1.95e3 4.26e2 7.93e3
C) 8d 9.63e2 2.07e2 3.9ge3 0 16d 3.53e2 7.05el 1.4ge3 N 00 32d 1. 74e2 9.56eO 7.01e2
64d 1.35e2 1.42eO 5.40e2 128d 1.20e2 1. 27eO 4.95e2 256d 1. 04e2 1.24eO 4.38e2
ly 9.43el 1.2leO 3.96e2
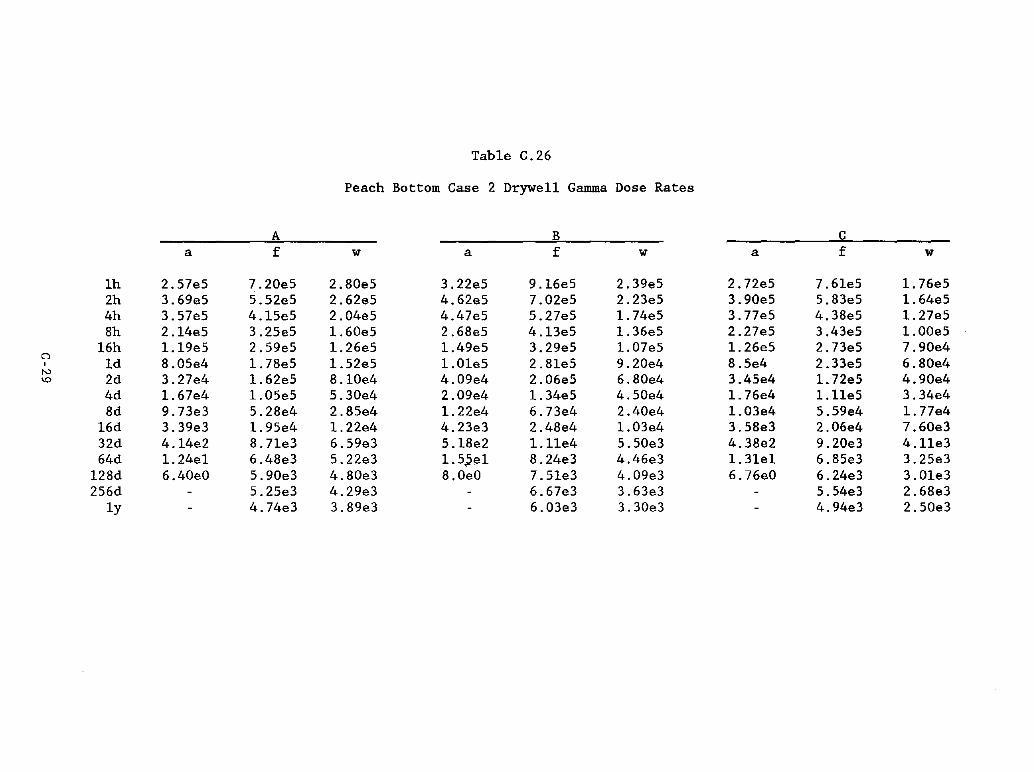
Table C.26
Peach Bottom Case 2 Drywell Gamma Dose Rates
A B C a f w a f w a f w
lh 2.S7eS 7.20eS 2.BOeS 3.22eS 9.16eS 2.3geS 2.72eS 7.61eS l. 76eS 2h 3.6geS S.S2eS 2.62eS 4.62eS 7.02eS 2.23eS 3.90eS S.B3eS 1.64eS 4h 3.S7eS 4.ISeS 2.04eS 4.47eS S.27eS 1.74eS 3.77eS 4.3BeS l.27eS Bh 2.l4eS 3.2SeS 1.60eS 2.6BeS 4.13eS 1.36eS 2.27eS 3.43eS 1.OOeS
l6h l.1geS 2.SgeS 1.26eS l.4geS 3.2geS l.07eS 1.26eS 2.73eS 7.90e4 ()
ld B.OSe4 1.7BeS l.S2eS 1.OleS 2.BleS 9.20e4 B.Se4 2.33eS 6.BOe4 0
'" 2d 3.27e4 l.62eS B.1Oe4 4.0ge4 2.06eS 6.BOe4 3.4Se4 1.72eS 4.90e4 \.0
4d l.67e4 l.OSeS S.30e4 2.0ge4 1.34eS 4.S0e4 l. 76e4 1.l1eS 3.34e4 Bd 9.73e3 S.2Be4 2.BSe4 l. 22e4 6.73e4 2.40e4 l.03e4 S.Sge4 l. 77e4
16d 3.3ge3 1.9Se4 1.22e4 4.23e3 2.4Be4 l.03e4 3.SBe3 2.06e4 7.60e3 32d 4.l4e2 B.71e3 6.Sge3 S.lBe2 l.l1e4 S.SOe3 4.3Be2 9.20e3 4.l1e3 64d l. 24el 6.4Be3 S.22e3 1.S.5~1 B.24e3 4.46e3 l.3lel 6.BSe3 3.2Se3
l2Bd 6.40eO S.90e3 4. BOe3 B.OeO 7.Sle3 4.0ge3 6.76eO 6.24e3 3.0le3 2S6d S.2Se3 4.2ge3 6.67e3 3.63e3 S.S4e3 2.6Be3
ly 4.74e3 3.Bge3 6.03e3 3.30e3 4.94e3 2.S0e3

Table C.26
Peach Bottom Case 2 Drywell Gamma Dose Rates (Continued)
D E F a f w a f w a f w
lh 3.S4eS 6.96eS 2.00eS 4.26eS 9.10eS 2.70eS 3.07eS 6.66eS 3.20eS 2h S.0geS S.32eS 1.8SeS 6.lleS 6.98eS 2.S6eS 4.4leS S.32eS 2.77eS 4h 4.92eS 4.00eS 1.44eS S.9leS S.23eS 2.0leS 4.27eS 3.82eS 2.34eS 8h 2.9SeS 3.l4eS 1.12eS 3.SSeS 4.lleS l.S7eS 2.S6eS 3.0leS 1.82eS
l6h 1.64eS 2.4geS 9.00e4 l. 97eS 3.27eS 1.24eS 1.42eS 2.40eS 1.43eS (') ld 1.lleS 2.13eS 7.70e4 1.33eS 2.7geS l.07eS 1.33eS 2.0SeS 1.23eS , 2d 4.S0e4 l.S7eS S.60e4 S.4le4 2.0Se4 7.90e4 3.9le4 1.SOeS 9.20e4 v.> 0 4d 2.30e4 1.02eS 3.70e4 2.76e4 1.33eS S.24e4 2.00e4 9.74e4 6.08e4
8d 1.34e4 S.lle4 2.00e4 l.6le4 6.6ge4 2.7ge4 1.16e4 4.90e4 3.23e4 l6d 4.66e3 l. 8ge4 8.S0e3 S.60e3 2.48e4 l.l8e4 4.0Se3 l.8le4 l.38e4 32d S.71e2 8.42e3 4.63e3 6.8Se2 l.lOe4 6.48e3 4.9Se2 8.06e3 7.44e3 64d l.71el 6.27e3 3.70e3 2.0Sel 8.1ge3 S.l7e3 l.48el 6.00e3 6.0le3
l28d 8.8leO S.71e3 3.3ge3 l.06el 7.47e3 4.74e3 7.6SeO S.47e3 S.SOe3 2S6d S.06e3 3.02e3 6.63e3 4.2le3 4.86e3 4.88e3
ly 4.S7e3 2.74e3 6.00e3 3.80e3 4.3ge3 4.42e3
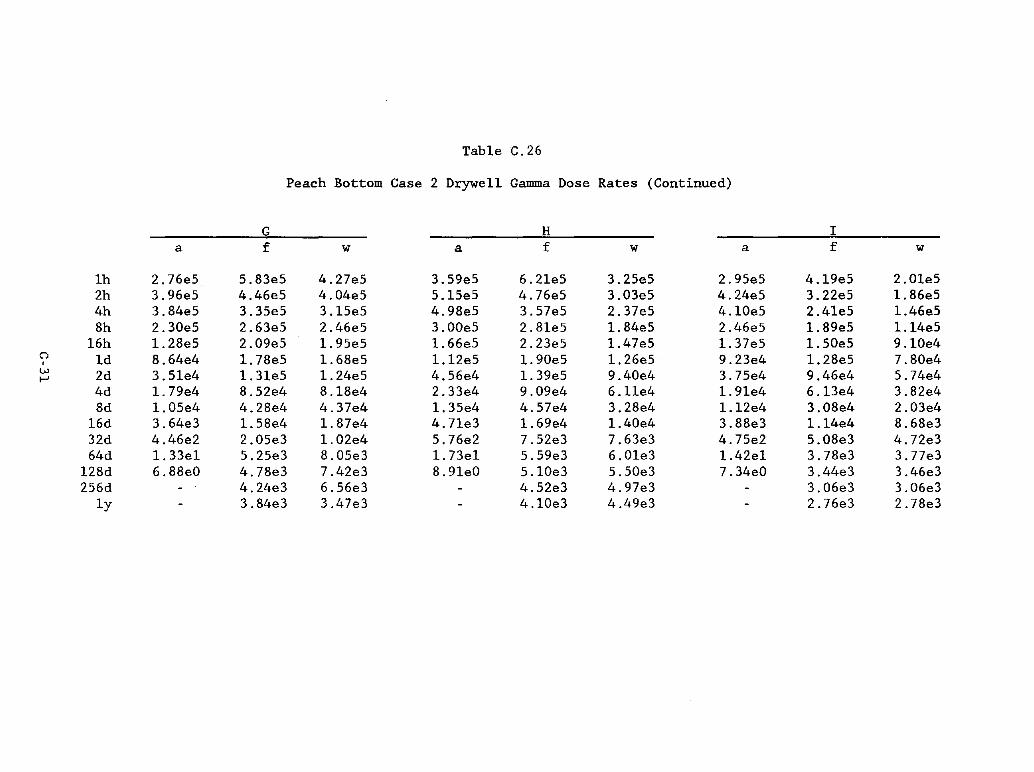
Table C.26
Peach Bottom Case 2 Drywell Gamma Dose Rates (Continued)
G H I a f w a f w a f w
lh 2.76eS S.83eS 4.27eS 3.SgeS 6.21eS 3.2SeS 2.9SeS 4.1geS 2.01eS 2h 3.96eS 4.46eS 4.04eS S.ISeS 4.76eS 3.03eS 4.24eS 3.22eS 1.86eS 4h 3.84eS 3.3SeS 3.ISeS 4.98eS 3.S7eS 2.37eS 4.10eS 2.41eS 1.46eS 8h 2.30eS 2.63eS 2.46eS 3.00eS 2.81eS 1. 84eS 2.46eS 1. 8geS 1.14eS
16h 1.28eS 2.0geS 1.9SeS 1. 66eS 2.23eS 1.47eS 1. 37eS 1. SOeS 9.10e4 C"l ld 8.64e4 1. 7SeS 1.6SeS 1.12eS 1.90eS 1.26eS 9.23e4 1.2SeS 7.S0e4 , w 2d 3.Sle4 1.31eS 1.24eS 4.S6e4 1.3geS 9.40e4 3.7Se4 9.46e4 S.74e4 t-'
4d 1. 7ge4 S.S2e4 S.ISe4 2.33e4 9.0ge4 6.11e4 1. 9le4 6.13e4 3.S2e4 Sd 1. OSe4 4.2Se4 4.37e4 1. 3Se4 4.S7e4 3.2Se4 1.12e4 3.08e4 2.03e4
16d 3.64e3 I.SSe4 1. S7e4 4.71e3 1.6ge4 1.40e4 3.SSe3 1.14e4 S.6Se3 32d 4.46e2 2.0Se3 1. 02e4 S.76e2 7.S2e3 7.63e3 4.7Se2 S.OSe3 4.72e3 64d 1.33el S.2Se3 S.OSe3 1. 73el S.Sge3 6.01e3 1.42el 3.7Se3 3.77e3
12Sd 6.8SeO 4.7Se3 7.42e3 S.9IeO S.IOe3 S.SOe3 7.34eO 3.44e3 3.46e3 2S6d 4.24e3 6.S6e3 4.S2e3 4.97e3 3.06e3 3.06e3
ly 3.S4e3 3.47e3 4.10e3 4.4ge3 2.76e3 2.7Se3

Table C.26
Peach Bottom Case 2 Drywe11 Gamma Dose Rates (Continue:1)
J K L a f w a f w a f w
1h 1. 76e5 7.5ge4 2.10e5 2.04e5 8.97e4 1.94e5 1. 65e5 7.44e4 1.02e5 2h 2.53e5 5.82e4 1.96e5 2.93e5 6.88e4 1. 81e5 2.37e5 5.71e4 9.4ge4 4h 2.44e5 4.36e4 1.52e5 2.83e5 5.16e4 1.41e5 2.2ge5 4.28e4 7.42e4 8h 1.47e5 3.43e4 1. 1ge5 1. 70e5 4.05e4 1.11e5 1.38e5 3.36e4 5.83e4
16h 8.15e4 2.73e4 9.47e4 9.45e4 3.22e4 8.78e4 7.65e4 2.68e4 4.62e4 1d 5.50e4 2.33e4 8.07e4 6.37e4 2.76e4 7.54e4 5.16e4 2.2ge4 3.96e4 2d 2.23e4 1. 72e4 6.03e4 2.5ge4 2.02e4 5.60e4 2.10e4 1. 68e4 2.94e4 4d 1.14e4 1.11e4 4.00e4 1.32e4 1.31e4 3.71e4 1.07e4 1.0ge4 1.95e4
(") 8d 6.33e3 5.60e3 2.12e4 7.44e3 6.61e3 1. 97e4 6.14e3 5.48e3 1.03e4
, 16d 2.20e3 2.07e3 9.07e3 2.5ge3 2.44e3 8.41e3 2.14e3 2.02e3 4.43e3 "" N 32d 2.70e2 9.21e2 4.93e3 3.17e2 1.0ge3 4.57e3 2.62e2 9.03e2 2.40e3
64d 8.10e1 6.85e2 3.95e3 9.50e1 8.10e2 3.65e3 7.84e1 6.72e2 1.92e3 128d 7.34eO 6.24e2 3.62e3 4.17eO 7.38e2 3.35e3 4.05eO 6.12e2 1.76e3 256d 5.54e2 3.21e3 6.56e2 2.97e3 5.43e2 1.56e3
1y 5.01e2 2.90e3 5.93e2 2.6ge3

Table C.27
Peach Bottom Case 2 Drywell Beta Dose Rates
A,B,C A B C D,E,F D E --1: a f w w w a f w w w
lh 2.44eS 1.lle6 3.84eS 3.S8e4 S.97eS 2.44eS 4.34e6 S.97eS 3.S8e4 3.84eS 2h 6.63eS 9.43eS 4.72eS 6.S4e4 7.06eS 6.63eS 3.34e6 7.06eS 6.4Se4 4.72eS 4h S.88eS S.6leS 2.77eS 2.17e4 4.l8eS S.88eS 2.S6e6 4.l8eS 2.l7e4 2.77eS 8h S.0geS 4.86eS 2.0geS 7.92e3 3.06eS S.0geS 1.8ge6 3.06eS 7.92e3 2.0geS
l6h S.06eS 3.S2eS 1.8geS 7.0le3 2.90eS S.06eS 1.43e6 2.90eS 7.0le3 1.8geS () ld 4.l4eS 2.9leS 1. S3eS 6.66e3 2.3SeS 4.l4eS 1.14e6 2.3SeS 6.66e3 1.S3e5 , w 2d 2.6SeS 2.04eS 1.06eS 1.96e3 1. S7eS 2.6SeS 7.60eS 1.S7eS 1.96e3 1.06eS w
4d 2.43eS 1.2SeS 6.68e4 1.70e3 1.04eS 2.43eS 4.70eS 1.04eS 1.70e3 6.68e4 8d 1.07eS 6.13e4 3.S4e4 7.2Se2 S.37e4 1.07eS 2.44eS S.37e4 7.25e2 3.S4e4
l6d 3.98e4 2.72e4 1. 66e4 2.28e2 2.62e4 3.98e4 1.0leS 2.62e4 2.28e2 1.66e4 32d 6.82e3 1.11e4 8.4ge3 8.27el 1.30e4 6.82e3 4.24e4 1. 36e4 8.27el 8.4ge3 64d 2.l7e3 7.2ge3 6.SSe3 2.48el 9.9le3 2.l7e3 2.8Se4 9.9le3 2.48el 6.SSe3
l28d 1.9ge3 6.78e3 6.42e3 2.3lel· 9.2Se3 1.9ge3 2.68e4 9.2Se3 2.3lel 6.42e3 2S6d 1. 93e3 6.6ge3 S.93e3 8.8le3 1.93e3 2.Sle4 8.8le3 S.93e3
ly 1.9le3 6.l2e3 S.48e3 2.2gel 8.4ge3 1.9le3 2.3ge4 8.4ge3 2.2gel S.48e3

Table C.27
Peach Bottom Case 2 Drywe11 Beta Dose Rates (Continued)
G,H,! G H I J,K,L J ...K....1. a f w w w a f w w
1h 2.44e5 3.27e4 3.84e5 3.58e4 5.97e5 2.44e5 1.43e5 5.97e5 2h 6.63e5 9.65e4 4.72e5 6.45e4 7.06e5 6.63e5 1. 87e5 7.06e5 4h 5.88e5 1. 70e4 2.77e5 2.17e4 4.18e5 5.88e5 1.06e5 4.18e5 8h 5.0ge5 9.65e3 2.0ge5 7.92e3 3.06e5 5.0ge5 7.56e4 3.06e5
16h 5.06e5 7.82e3 1. 8ge5 7.01e3 2.90e5 5.06e5 7.20e4 2.90e5 1d 4.14e5 1.53e5 6.66e3 2.35e5 4.14e5 5.86e4 2.35e5 2d 2.65e5 1.58e2 1.06e5 1.96e3 1. 57e5 2.65e5 4.38e4 1.57e5 4d 2.43e5 6.68e4 1.70e3 1.04e5 2.43e5 2.46e4 1.04e5
()
1.07e5 3.5ge4 7.25e2 5.37e4 1.07e5 1.36e4 5.37e4 , 8d w -I'- 16d 3.98e4 1.66e4 2.28e2 2.62e4 3.98e4 6.53e3 2.62e4
32d 6.82e3 8.4ge3 8.27e1 1. 36e4 6.82e3 3.21e3 1. 36e4 64d 2.17e3 6.55e3 2.48e1 9.91e3 2.17e3 2.45e3 9.91e3
128d 1.9ge3 6.42e3 2.31e1 9.25e3 1.9ge3 2.38e3 9.25e3 256d 1.93e3 5.93e3 8.81e3 1. 93e3 2.21e3 8.81e3
1y 1.91e3 5.48e3 2.2ge1 8.4ge3 1.91e3 2.10e3 8.4ge3

Table C.28
Peach Bottom Case 2 Wetwell Gamma Dose Rates
A B s a w s a w
lh l. 68e4 2.9ge5 5.5ge4 4.l6el 2.44eO 2h 1.23e4 1.55e5 4.26e4 2.l3el 1.40eO 4h 8.66e3 6.86e4 3.0ge4 7.7geO 6.11e-l 8h 6.4ge3 4.08e4 2.43e4 2.84eO 3.96e-l
l6h 4.9le3 2.22e4 l. 93e4 4.4ge-l 2.0le-l ld 4.08e3 l. 4ge4 l. 65e4 l. 02e-l l.38e-l 2d 2.9le3 5.84e3 1.2le4 2.9le-2 9.0ge-2 4d l. 85e3 2.53e3 7.8le3 8d 8.9ge2 l.17e3 3.92e3
l6d 3.l7e2 3.23e2 l.47e3 32d 1.54e2 5.35el 6.90e2 64d 1.26e2 l.4gel 5.32e2
l28d 1.16e2 1.20el 4.87e2 256d l.07el 4.33e2
ly 9.32el 9.83eO 3.9le2
C-35
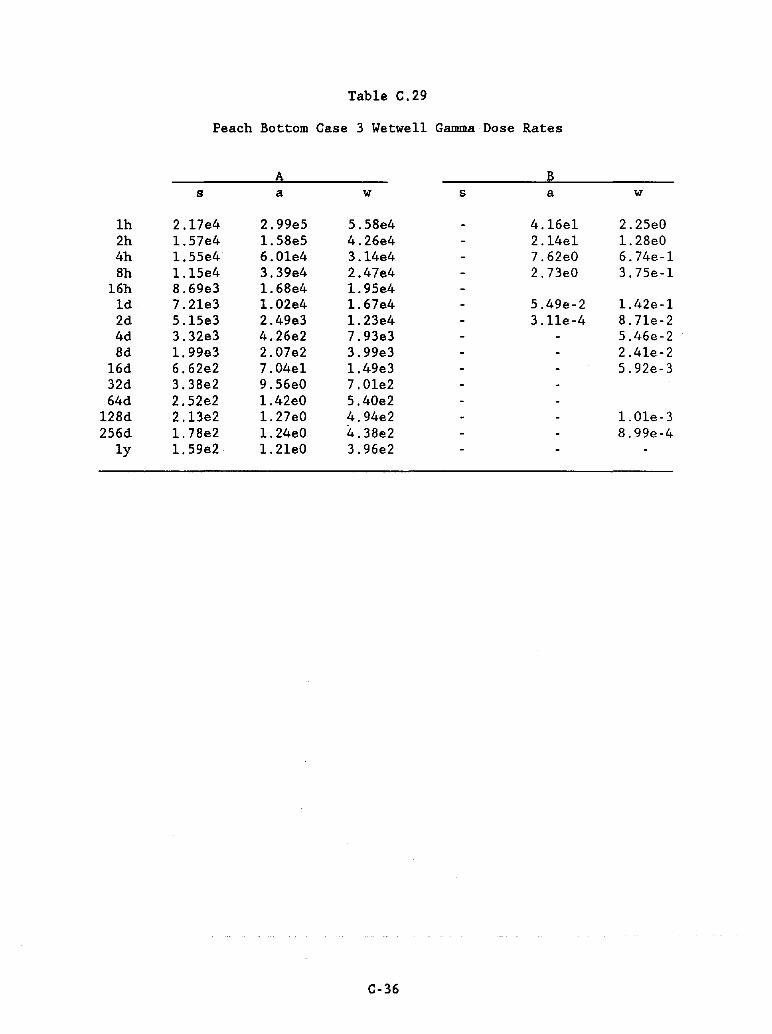
Table C.29
Peach Bottom Case 3 Wetwe11 Gamma Dose Rates
A B s a w s a w
1h 2.17e4 2.9ge5 5.58e4 4.16e1 2.25eO 2h 1. 57e4 1.58e5 4.26e4 2.14e1 1.28eO 4h 1. 55e4 6.01e4 3.14e4 7.62eO 6.74e-1 8h 1.15e4 3.3ge4 2.47e4 2.73eO 3.75e-1
16h 8.6ge3 1.68e4 1. 95e4 1d 7.21e3 1.02e4 1. 67e4 5.4ge-2 1. 42e-1 2d 5.15e3 2.4ge3 1. 23e4 3.11e-4 8.71e-2 4d 3.32e3 4.26e2 7.93e3 5.46e-2 8d 1.9ge3 2.07e2 3.9ge3 2.41e-2
16d 6.62e2 7.04e1 1.4ge3 5.92e-3 32d 3.38e2 9.56eO 7.01e2 64d 2.52e2 1.42eO 5.40e2
128d 2.13e2 1. 27eO 4.94e2 1.01e-3 256d 1.78e2 1.24eO 4.38e2 8.9ge-4
1y 1. 5ge2 1. 21eO 3.96e2
C-36

Table C.30
Peach Bottom Case 4 Wetwell Gamma Dose Rates
A B s a w s a w
Ih 2.17e4 2.9ge5 5.58e4 4.16el 2.25eO 2h 1. 57e4 1.55e5 4.26e4 2.13el 1. 2geO 4h 1.43e4 6.86e4 3.0ge4 7.57eO 6.66e-l 8h 1. 07e4 4.08e4 2.42e4 2.84eO 3.70e-l
16h 8.11e3 2.22e4 1. 83e4 4.4ge-l 2.01e-l Id 6.74e3 1. 4ge4 1.65e4 1.02e-l 1.40e-l 2d 4.80e3 5.84e3 1. 21e4 2.91e-2 8.58e-2 4d 3.04e3 2.52e3 7.80e3 1.77e-2 5.37e-2 8d 1.46e3 1. 17e3 3.92e3 7.51e-3 2.3ge-2
16d 5.07e2 3.23e2 1.47e3 1.41e-3 5.80e-3 32d 2.42e2 5.35el 8.1ge2 64d 1.96e2 1.4gel 5.32e2
128d 1.80e2 1.20el 4.87e2 256d 1.5ge2 1. 07el 4.33e2
ly 1.44e2 9.83el 3.91e2
C-37
APPENDIX D
MAJOR ISOTOPE CONTRIBUTORS TO TOTAL DOSE

Table D.1
Surry Major Radionuc1ide Contributors to Gamma Dose
Case 1 Case 2
A F W A F W
1h 1134 (.24) 1134 (.28) 1134 (.28) 1134 (.24) 1134 (.28) 1134 (.28) 1132 (.20) 1132 (.23) 1132 (.23) 1132 (.20) 1132 (.23) 1132 (.23) 1135 ( .15) 1135 ( .17) 1135 (.17) 1135 (.15) 1135 ( .17) 1135 ( .18)
2h KR88 ( .18) 1132 (.30) 1132 (.31) KR88 (.20) 1132 (.30) 1132 (.30) 1132 (.16) 1134 (.22) 1134 (.22) 1132 (.19) 1134 (.22) 1134 (.22) 1134 ( .12) 1135 (.21) 1135 (.21) 1134 (.14) 1135 (.21) 1135 (.21)
4h KR88 ( .17) 1132 (.36) 1132 (.39) KR88 (.27) 1132 ( .41) 1132 ( .41) t:;I 1132 (.12) 1135 (.20) 1135 (.22) 1132 (.19) 1135 (.23) 1135 (.23) ,
SR91 ( .07) 1133 ( .13) 1133 ( .14) XE135 ( .11) 1133 (.15) 1133 ( .15) t-'
8h XE135 (.29) 1132 (.39) 1132 ( .46) XE135 ( .41) 1132 (.50) 1132 (.50) KR88 (.24) 1135 (.15) 1135 (.17) KR88 (.34) 1135 ( .19) 1135 (.19) XE133 (.08) 1133 ( .13) 1133 (.15) XE133 ( .11) 1133 ( .16) 1133 (.17)
16h XE135 (.57) I132 ( .46) 1132 (.53) XE135 (.62) 1132 (.59) 1132 (.59) XE133 (.lS) 1133 (.12) 1133 (.14) XE133 (.20) 1133 (.16) 1133 (.16) KR88 (. OS) 1135 (.08) 1135 (.09) KRS8 (.09) 1135 (.10) 1135 (.10)
1d XE135 (.63) 1132 (.50) I132 (.58) XE135 (.63) 1132 (.64) 1132 (.64) XE133 (.2S) 1133 ( .11) I133 ( .13) XE133 (.28) 1133 (.14) 1133 (.14) XE135M (.05 ) 1131 ( .07) I131 (.OS) XE135M (.05) 1131 (.09) 1131 (.09)
2d XE133 ( .63) 1132 (.54) I132 (.64) XE133 (.63) 1132 (.70) 1132 (.71) XE135 (.35) 1131 ( .OS) I131 ( .09) XE135 (.35) 1131 ( .11) I131 ( .11) XE133M (.01) lA140 (. OS) I133 (. OS) XE133M (.01) I133 (.09) I133 (.09)
4d XE133 ( .96) I132 (.50) I132 (.62) XE133 ( .96) I132 (.70) I132 (.71) XE135 (.02) lA140 (.10) I131 (.12) XE135 ( .02) I131 (.14) I131 (.14) XE133M (.01) I131 (.10) CS134 (.06) XE133M (.01) CS134 (.06) CS134 (.06)

Table D.l
Surry Major Radionuclide Contributors to Gamma Dose (Continued)
Case 1 Case 2
A F w: A F W
8d XE133 (.99) 1132 (.36) 1132 ( .48) XE133 (.99) 1132 (.58) 1132 (.59) XE133M ( .007) lA140 (.14) 1131 ( .15) XE133M (.007) 1131 (.19) 1131 (.19) KR85 (.0006) 1131 ( .12) CS134 ( .10) KR85 (.0006) CS134 (.12) CS134 (.12)
16d XE133 (.99) lA140 ( .18) .CS134 (.22) XE133 (.99) CS134 (.31) CS134 (.32) KR85 (.0017) CS134 (.14) 1132 (.19) KR85 (.002) 1132 (.27) 1132 (.28) XE133M (.0016) 1132 ( .13) 1131 (.18) XE133M (.002) 1131 (.25) 1131 (.25)
t:I 32d XE133 (.99) CS134 (.25) CS134 (.42) XE133 (.99) CS134 (.66) CS134 (.67) • KR85 (.014) NB95 (.21) NB95 (.14) KR85 ( .01) 1131 ( .13) 1131 (.14) '" XE133M (.0001) ZR95 (.16) ZR95 (.10) XE133M (.0001) CS136 ( .07) CS136 (.07)
64d XE133 (.51) CS134 (.38) CS134 (.60) XE133 (.51) CS134 (.87) CS134 (.89) KR85 ( .49) NB95 (.27) NB95 ( .17) KR85 ( .49) NB95 (.03) NB95 (.03)
ZR95 (.17) ZR95 ( .11) ZR95 (.02) CS136 (.02)
128d KR85 (.9998) CS134 (.50) CS134 (.72) KR85 (.99) CS134 (.93) CS134 (.944) XE133 (.0002) NB95 (.23) NB95 ( .13) XE133 (.0002) NB95 (.02) BA137M (.02)
ZR95 (.12) BA137M (.07) BA137M (.02) NB95 (.02)
256d KR85 (1. 0) CS134 (.66) CS134 (.83) KR85 (1. 0) CS134 (.96) CS134 (.96) BA137M ( .17) BA137M (.09) BA137M (.03) BA137M (.02) NB95 (.10) NB95 (.05) NB95 C.008) NB95 (.006)
1y KR85 (1. 0) CS134 (.72) CS134 (.86) KR85 (1.0) CS134 (.96) CS134 (.97) BA137M (.2) BA137M (.10) BA137M (.03) BA137M (.02) NB95 (.04) NB95 (.02) SB125 (.004) SB125 (.003)


Table D.1
Surry Major Radionuc1ide Contributors to Gamma Dose (Concluded)
Case 3 Case 4
A S A S
Sd XE133 (.99) 1132 ( .41) XE133 (.99) 1132 (.61) XE133M (.007) LA140 ( .14) XE133M (.007) 1131 (.16) KRS5 (.0006) 1131 ( .11) KRS5 (.0006) CS134 ( .13)
16d XE133 ( .997) LA140 (.lS) XE133 (.997) CS134 (.33) KRS5 (.002) CS134 (.17) KRS5 (.002) Il32 (.29) XE133M (.001) 1132 (.15) XE133M (.001) Il31 (.21)
0 32d XE133 (.99) CSl34 (.29) XEl33 ( .99) CS134 (.6S) , KRS5 (.009) NB95 (.20) KRS5 (.009) Il31 ( .11) .j::-
XEl33M (.0001) ZR95 (.15) XEl33M (.0001) CS136 ( .07)
64d XE133 (.51) CS134 (.43) XE133 (.51) CS134 (.SS) KRS5 ( .49) NB95 (.25) KRS5 (.49) NB95 (.03)
ZR95 (.16) ZR95 (.02)
128d KRS5 (.999S) CSl34 (.56) KRS5 (.999S) CS134 (.94) XEl33 (.0002) NB95 (.21) XEl33 (.0002) NB95 (.02)
ZR95 ( .11) BAl37M ( .02)
256d KRS5 (1.0) CS134 (.71) KRS5 (1. 0) CS134 (.96 ) BA137M (.14) BA137M (.02) NB95 (. OS) NB95 ( .001)
ly KRS5 (1. 0) CSl34 (.76) KRS5 (1. 0) CS134 (.96) BA137M ( .17) BA137M ( .03) NB95 (.03) SB125 ( .004)
A: Airborne W: Wall F: Floor S: Sump
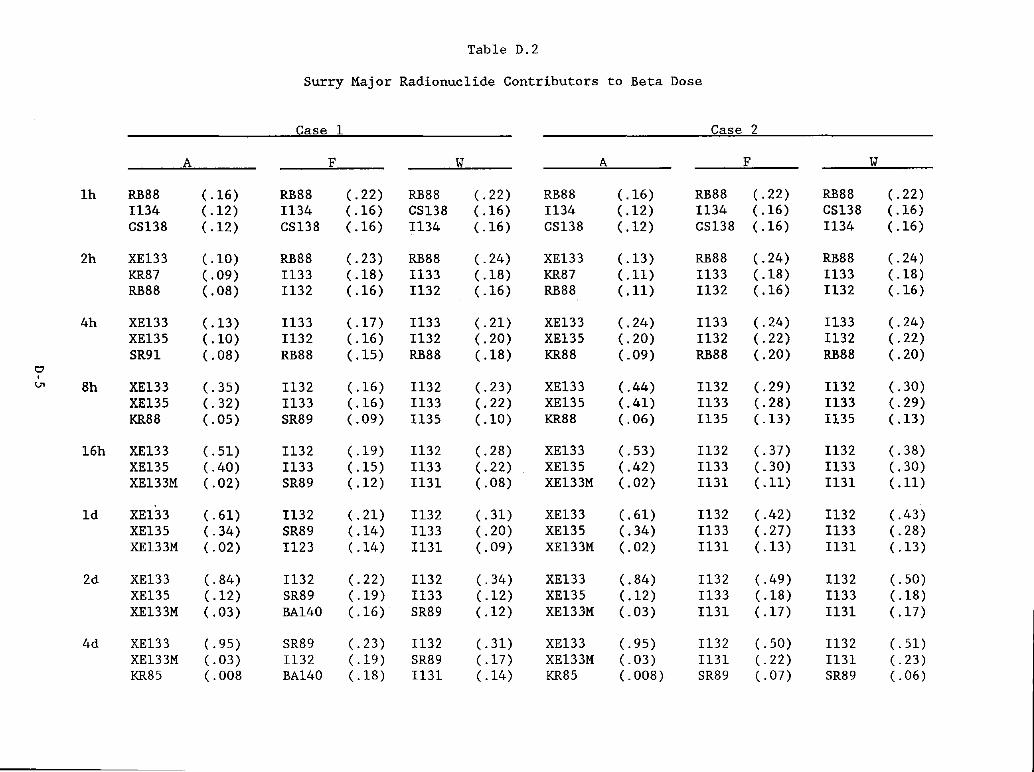
Table D.2
Surry Major Radionuc1ide Contributors to Beta Dose
Case 1 Case 2
A F W A F W
1h RB88 (.16) RB88 (.22) RB88 (.22) RB88 ( .16) RB88 (.22) RB88 (.22) Il34 ( .12) Il34 (.16) CS138 ( .16) Il34 ( .12) Il34 (.16) CS138 ( .16) CS138 (.12) CS138 (.16) Il34 (.16) CS138 ( .12) CS138 ( .16) Il34 (.16)
2h XE133 ( .10) RB88 (.23) RB88 (.24) XE133 ( .13) RB88 (.24) RB88 (.24) KR87 (.09) Il33 ( .18) Il33 ( .18) KR87 ( .11) Il33 ( .18) 1133 (.18) RB88 (.08) Il32 (.16) 1132 (.16) RB88 ( .11) Il32 (.16) 1132 (.16)
4h XE133 ( .13) Il33 (.17) Il33 (.21) XE133 (.24) Il33 (.24) 1133 (.24) XE135 (.10) Il32 (.16) Il32 (.20) XE135 (.20) Il32 (.22) 1132 (.22) SR91 (.08) RB88 ( .15) RB88 ( .18) KR88 ( .09) RB88 (.20) RB88 (.20)
0 , Ul 8h XE133 (.35) Il32 (.16) Il32 (.23) XE133 ( .44) 1132 (.29) 1132 (.30)
XE135 (.32) Il33 (.16) Il33 (.22) XE135 ( .41) 1133 (.28) 1133 (.29) KR88 (.05) SR89 (.09) Il35 (.10) KR88 (.06) 1135 ( .13) 1135 ( .13)
16h XE133 (.51) 1132 (.19) Il32 (.28) XE133 (.53) 1132 ( .37) 1132 (.38) XE135 (.40) 1133 ( .15) Il33 (.22) XE135 ( .42) 1133 (.30) 1133 (.30) XE133M (.02) SR89 (.12) Il31 (.08) XE133M (.02) Il31 ( .11) 1131 ( .11)
1d XE133 (.61) Il32 (.21) 1132 (.31) XE133 (.61) Il32 (.42) 1132 (.43) XE135 (.34) SR89 (.14) 1133 (.20) XE135 (.34) 1133 (.27) 1133 (.28) XE133M (.02) 1123 (.14) 1131 (.09) XE133M (.02) Il31 ( .13) 1131 ( .13)
2d XE133 (.84) Il32 (.22) 1132 (.34) XE133 (.84) Il32 (.49) 1132 (.50) XE135 (.12) SR89 (.19) 1133 (.12) XE135 (.12) Il33 (.18) 1133 (.18) XE133M (.03) BA140 (.16) SR89 ( .12) XE133M (.03) Il31 ( .17) 1131 ( .17)
4d XE133 (.95) SR89 C.23) 1132 C.31) XE133 (.95) Il32 C.50) 1132 (.51) XE133M (.03) Il32 C.19) SR89 (.17) XE133M (.03) 1131 (.22) 1131 (.23) KR85 (.008 BA140 (.18) 1131 (.14) KR85 (.008 ) SR89 ( .07) SR89 (.06)

Table D.2
Surry Major Radionuclide Contributors to Beta Dose (Continued)
Case 1 Case 2
A F W A F W
8d XE133 (.96) SRS9 (.29) SRS9 (.23) XE133 (.96) Il32 (.37) Il32 (.39) KRS5 (.01) BA140 (.20) Il32 (.20) KRS5 (.013) Il31 (.27) Il31 (.29) XE133M (.01) Il32 ( .11) BA140 ( .16) XE133M (.012) SR89 ( .11) SRS9 ( .10)
16d XE133 (.93) SR89 ( .37) SR89 (.33) XE133 (.93) Il31 (.2S) Il31 (.30) KRS5 (.04) BA140 (.lS) BA140 (.16) KR8S ( .04) SRS9 ( .20) SRS9 ( .19) XE131M (.02) .PR144 ( .11) Il31 ( .11) XE131M (.02) Il32 (.14) Il32 (.15)
32d XE133 (.70) SRS9 ( .44) SR89 ( .41) XE133 (.70) SRS9 (.31) SRS9 (.29) KR8S (.23) PR144 ( .16) PR144 (.14) KRS5 (.23) CS137 (.14) CS137 (.15)
t;j XE13lM ( .OS) BA140 ( .11) BA140 ( .10) XE131M ( .OS) Il31 ( .13) CS134 ( .15) • 0\
64d KRS5 (.90) SR89 ( .45) SR89 (.42) KRSS (.90) SRS9 (.32) SRS9 (.30) XE131M (.06) PR144 (.23) PR144 (.20) XE131M (.06) CS137 (.22) CS137 ( .24) XE133 (.04) Y91 (.OS) CS137 ( .07) XE133 (.04) CS134 ( .21) CS134 (.23)
12Sd KRSS (.99) PR144 (.34) SRS9 (.29) KRSS (.998) CS137 (.31) CS137 ( .33) XE131M (.002) SRS9 (.32) PR144 (.2S) XE131M (.002) CS134 (.28) CS134 (.30) XE133 (-) Y91 (.07) CS137 (.12) XE133 (-) SRS9 ( .19) SRS9 ( .17)
2S6d KRS5 (1. 0) PR144 ( .4S) PR144 (.36) KRSS (1. 0) CS137 ( .42) CS137 ( .44) XE131M (-) CS137 ( .11) CS137 (.21) XE13lM (-) CS134 (.34) CS134 (.36) XE133 (-) SRS9 ( .11) CS134 ( .17) XE133 (-) PR144 (.10) PR144 (.OS)
1y KRS5 (1. 0) PR144 ( .49) PR144 (.34) KRS5 (1. 0) CS137 ( .46) CS137 ( .4S) XE131M (-) CS137 (.14) CS137 (.26) XE131M (-) CS134 ( .34) CS134 (.36) XE133 (-) CS134 ( .11) CS134 (.19) XE133 (-) PR144 (.09) PR144 ( .07)

Table D.2
Surry Major Radionuc1ide Contributors to Beta Dose (Continued)
Case 3 Case 4
A S A S
1h KR87 (.34) RB88 ( .21) KR87 (.34) RB88 (.21) XEl33 (.23) 1134 (.16) XE133 (.23) 1134 ( .16) KR88 (.17) CS138 (.16) KR88 ( .17) CS138 ( .16)
2h XE133 (.29) RB88 (.20) XE133 (.29) RB88 (.23) KR87 (.25) 1133 ( .15) KR87 (.25) 1133 (.17) XE135 (.20) 1132 (.14) XE135 (.20) 1132 ( .15)
4h XE133 (.37) 1133 ( .15) XE133 (.37) 1133 (.23) XE135 (.30) 1132 ( .14) XE135 (.30) 1132 (.22)
t::I KR88 ( .13) RB88 ( .13) KR88 ( .13) RB88 (.20) , -...J
8h XE133 ( .44) 1132 (.17) XE133 ( .44) 1132 (.29) XE135 ( .41) 1133 ( .17) XE135 ( .41) 1133 (.28) KR88 (.06) SR89 (.09) KR88 (.06) 1135 ( .13)
16h XEl33 (.52) 1132 (.22) XE133 ( .53) 1132 (.38) XEl35 ( .42) 1133 ( .17) XE135 ( .42) 1133 (.30) XEl33M (.02) SR89 ( .11) XE133M (.22) 1131 ( .11)
1d XEl33 (.61) 1132 (.24) XEl33 (.62) 1132 ( .42) XEl35 (.34) 1133 (.15) XE135 (.34) 1133 (.28) XEl33M (.02) SR89 (.13) XE133M (.02) 1131 (.13)
2d XEl33 (.84) 1132 (.25) XE133 (.84) 1132 ( .49) XE135 (.12) SR89 (.17) XE135 ( .12) 1133 ( .18) XE133M (.03) BA140 ( .14) XE133M (.03) 1131 (.17)
4d XEl33 (.95) SR89 (.22) XE133 (.95) 1132 (.50) XE133M (.03) 1132 (.22) XE133M (.03) 1131 (.22) KR85 (.008) BA140 (.17) KR85 (.008) SR89 (.06)

Table D.2
Surry Major Radionuclide Contributors to Beta Dose (Concluded)
Case 3 Case 4
A S A S
8d XE133 (.96) SR89 (.28) XE133 (.96) Il32 (.38) KR8S (.013 ) BA140 ( .19) KR8S ( .013) Il31 ( .28) XE133M (.012) Il32 (.12) XE133M (.012) SR89 ( .11)
16d XE133 (.93) SR89 (.36) XE133 (.94) Il31 (.29) KR8S (.04) BA140 ( .17) KR8S (.04) SR89 (.20) XE131M (.02) PR144 ( .11) XE131M (.02) Il32 (.14)
32d XE133 (.70) SR89 ( .43) XE133 (.70) SR89 (.31) KR8S (.23) PR144 (.15) KR8S (.23) CS137 (.14)
t;;:1 XE131M ( .08) BA140 ( .11) XE131M (.08) CS134 (.14) , 00
64d KR8S (.90) SR89 ( .44) KR8S (.90) SR89 (.31) XE131M (.06) PR144 (.22) XE131M (.06) CS137 (.23) XE133 ( .04) Y91 (.08) XE133 (.04) CS134 (.22)
128d KR8S (.998) PR144 (.33) KR8S (.998) CS137 (.32) XE131M (.002) SR89 (.32) XE131M (.0017) CS134 (.29) XE133 (-) CS137 ( .07) XE133 (-) SR89 (.18)
2S6d KR8S (1. 0) PR144 ( .45) KR8S (1. 0) CS137 ( .42) XE131M (-) CS137 (.13) XE131M ( -) CS134. (.34) XE133 (-) CS134 (.10) XE133 (-) PR144 (.10)
1y KR8S (1.0) PR144 ( .46) KR8S (1. 0) CS137 ( .47) XE131M (-) CS137 ( .17) XE131M (-) CS134 (.35) XE133 (-) CS134 (.12) XE133 (-) PR144 (.08)
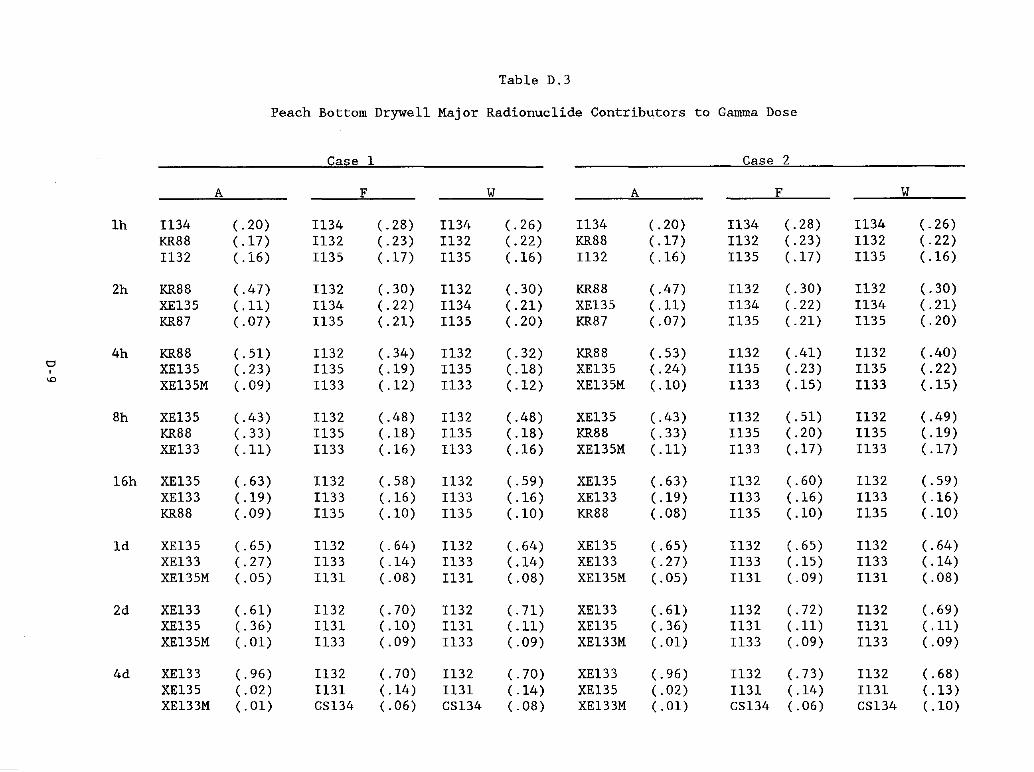
Table D.3
Peach Bottom Drywe11 Major Radionuc1ide Contributors to Gamma Dose
Case 1 Case 2 - --
A F W A F w
1h 1134 (.20) 1134 (.28) 1134 (.26) 1134 (.20) 1134 (.28) 1134 (.26) KR88 (.17) 1132 (.23) 1132 (.22) KR88 ( .17) 1132 (.23) 1132 (.22) 1132 (.16) Il35 ( .17) 1135 ( .16) 1132 (.16) 1135 ( .17) Il35 ( .16)
2h KR88 ( .47) 1132 (.30) 1132 (.30) KR88 (.47) 1132 (.30) 1132 (.30) XE135 ( .11) Il34 (.22) 1134 (.21) XEl35 ( .11) 1134 (.22) Il34 (.21) KR87 ( .07) Il35 (.21) Il35 (.20) KR87 ( .07) Il35 (.21) Il35 (.20)
4h KR88 (.51) Il32 (.34) 1132 (.32) KR88 (.53) Il32 ( .41) 1132 (.40) '=' XEl35 (.23) Il35 (.19) 1135 (.18) XEl35 (.24) Il35 (.23) Il35 (.22) . '-0
XE135M (.09) Il33 (.12) 1133 ( .12) XE135M (.10) 1133 ( .15) 1133 (.15)
8h XEl35 ( .43) 1132 ( .48) 1132 ( .48) XEl35 (.43) 1132 (.51) 1132 ( .49) KR88 (.33) Il35 (.18) Il35 ( .18) KR88 (.33) Il35 (.20) Il35 (.19) XEl33 ( .11) Il33 (.16) 1133 (.16) XEl35M ( .11) 1133 (.17) 1133 ( .17)
16h XE135 (.63) Il32 (.58) 1132 (.59) XEl35 (.63) 1132 (.60) 1132 (.59) XEl33 ( .19) Il33 (.16) 1133 (.16) XEl33 (.19) 1133 ( .16) 1133 (.16) KR88 (.09) Il35 (.10) 1135 ( .10) KR88 (.08) 1135 (.10) Il35 (.10)
1d XEl35 (.65) Il32 (.64) 1132 (.64) XEl35 (.65) 1132 (.65) 1132 (.64) XEl33 (.27) Il33 (.14) 1133 (.14) XEl33 (.27) 1133 (.15) 1133 (.14) XEl35M (.05) Il31 (.08) 1131 (.08) XEl35M (.05) 1131 (.09) 1131 (.08)
2d XE133 (.61) Il32 (.70) 1132 (.71) XEl33 (.61) 1132 (.72) 1132 (.69) XEl35 (.36 ) Il31 (.10) 1131 ( .11) XEl35 (.36) 1131 ( .11) 1131 ( .11) XEl35M (.01) Il33 (.09) 1133 (.09) XEl33M (.01) 1133 (.09) 1133 (.09)
4d XEl33 (.96) Il32 (.70) 1132 (.70) XEl33 (.96) 1132 (.73) 1132 (.68) XEl35 (.02) 1131 (.14) 1131 ( .14) XEl35 (.02) 1131 (.14) 1131 ( .l3) XEl33M (.01) CS134 (.06) CSl34 (.08) XEl33M (.01) CSl34 (.06) CSl34 (.10)
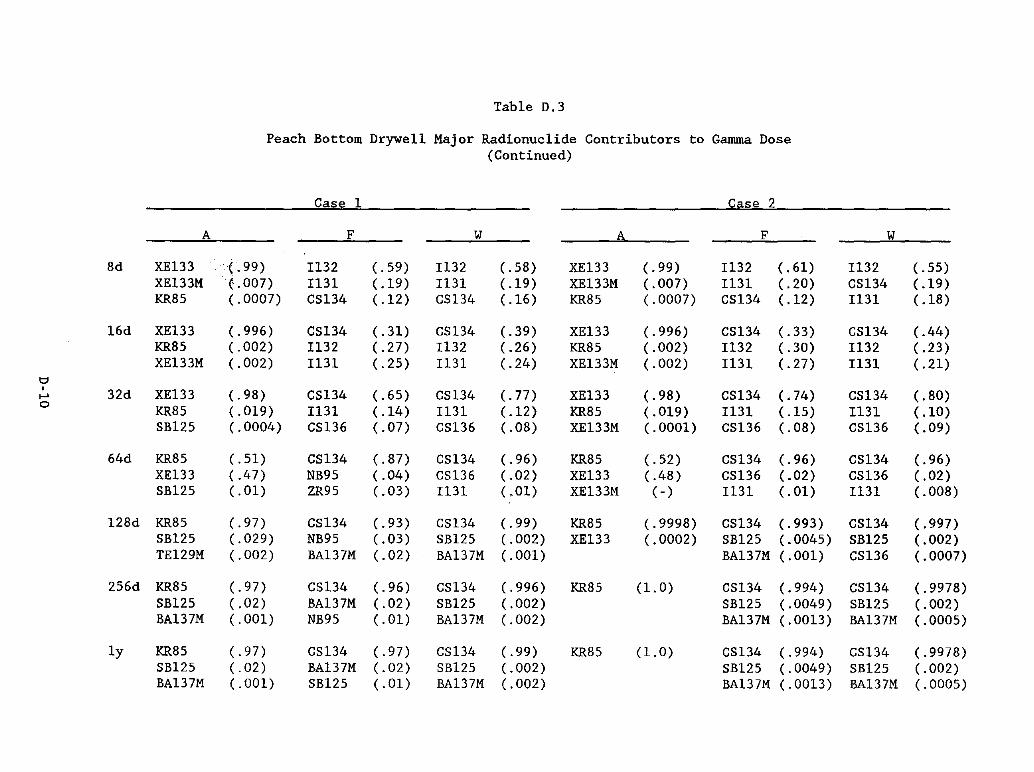
Table D.3
Peach Bottom Drywe11 Major Radionuc1ide Contributors to Gamma Dose (Continued)
Case 1 Case 2
A F W A F W
8d XE133 . (.99) Il32 (.59) Il32 (.58) XE133 (.99) Il32 (.61) Il32 (.55) XE133M (.007) Il31 (.19) Il31 (.19) XE133M (.007) Il31 (.20) CS134 (.19) KR85 (.0007) CS134 (.12) CS134 ( .16) KR85 ( .0007) CS134 (.12) Il31 (.18)
16d XE133 (.996) CS134 (.31) CS134 (.39) XE133 (.996) CS134 (.33) CS134 ( .44) KR85 (.002) Il32 (.27) Il32 (.26) KR85 (.002) Il32 (.30) Il32 (.23) XE133M (.002) Il31 (.25) Il31 (.24) XE133M (.002) Il31 ( .27) Il31 ( .21)
t:; I 32d XE133 (.98) CS134 (.65) CS134 (.77) XE133 (.98) CS134 (.74) CS134 (.80) ... 0 KR85 (.019) I131 (.14) I131 (.12) KR85 ( .019) Il31 (.15) Il31 (.10)
SB125 (.0004) CS136 (.07) CS136 ( .08) XE133M (.0001) CS136 (.08) CS136 ( .09)
64d KR85 (.51) CS134 (.87) CS134 (.96) KR85 (.52) CS134 (.96) CS134 (.96) XE133 ( .47) NB95 (.04) CS136 (.02) XE133 ( .48) CS136 (,02) CS136 (.02) SB125 (.01) ZR95 (.03) I131 (,01) XE133M (-) Il31 (.01) Il31 (.008)
128d KR85 (.97) CS134 (.93) CS134 (.99) KR85 (.9998) CS134 (.993) CS134 ( .997) SB125 (.029) NB95 (.03) SB125 (.002) XE133 (.0002) SB125 (.0045) SB125 (.002) TE129M (.002) BA137M (,02) BA137M (.001) BA137M (.001) CS136 (.0007)
256d KR85 (.97) CS134 (.96) CS134 (.996) KR85 (1. 0) CS134 (.994) CS134 (.9978) SB125 ( .02) BA137M (.02) SB125 (.002) SB125 (.0049) SB125 (.002) BA137M ( .001) NB95 (.01) BA137M (.002) BA137M (.0013) BA137M (.0005)
1y KR85 ( .97) CS134 (.97) CS134 (.99) KR85 (1.0) CS134 (.994) CS134 (.9978) SB125 ( .02) BA137M (.02) SB125 (.002) SB125 (.0049) SB125 ( .002) BA137M ( .001) SB125 (.01) BA137M ( .002) BA137M (.0013) BA137M (.0005)

Table D.3
Peach Bottom Drywe11 Radionuc1ide Contributors to Gamma Dose (Continued)
Case 3 Case 4
A A
1h KR88 (.59) KR88 (.59) KR87 ( .13) KR87 ( .13) XE135 (.10) XE135 (.10)
2h KR88 (.61) KR88 (.61) XE135 (.15) XE135 ( .15) KR87 (.09) KR87 (.09)
4h KR88 (.53) KR88 (.53) XE135 (.24) XE135 (.24)
0 XE135M (.10) XE135M ( .10) , t-' t-'
8h XE135 ( .43) XE135 ( .43) KR88 (.33) KR88 (.33) XE135M ( .11) XE133 ( .11)
16h XE135 (.63) XE135 (.63) XE133 (.33) XE133 ( .19) KR88 ( .11) KR88 (.09)
1d XE135 (.65) XE135 (.65) XE133 (.27) XE133 (.27) XE135M (.05) XE135M (.05)
2d XE133 (.62) XEl33 (.62) XEl35 (.36) XE135 (.36) XE133M (.012) XE133M (.01)
4d XE133 (.96) XE133 (.96) XE135 (.02) XE135 (.02) XE133M (.014) XEl33M (.01)
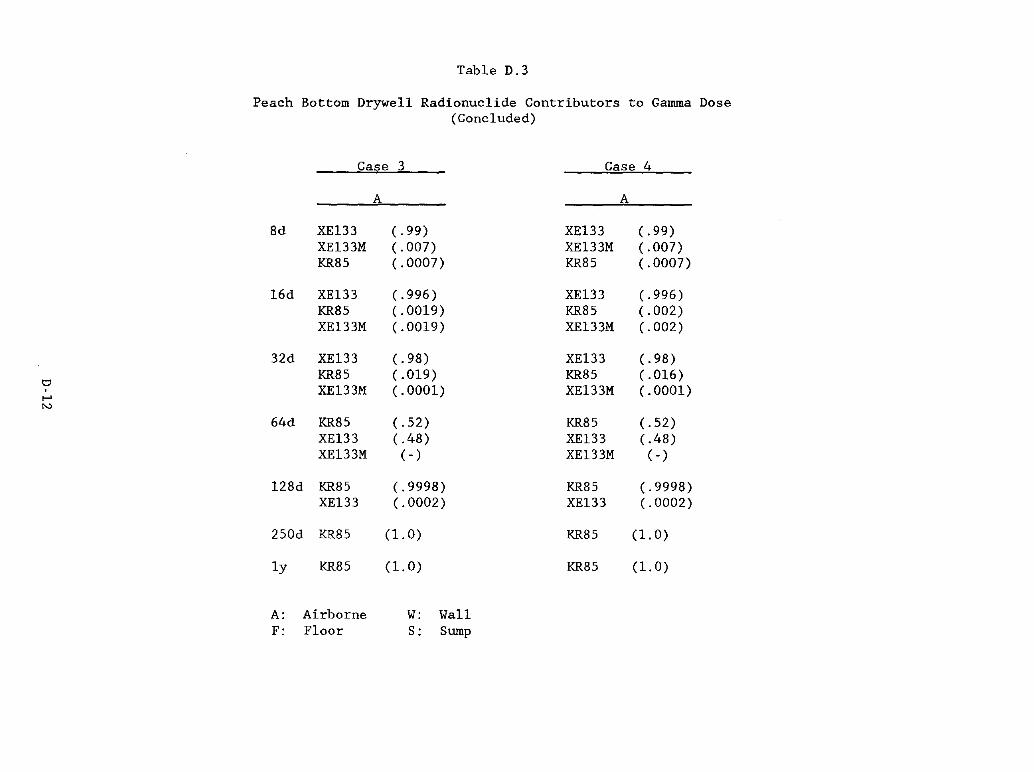
Table D.3
Peach Bottom Drywe11 Radionuc1ide Contributors to Gamma Dose ( Concluded)
Case 3 Case 4
A A
Sd XEl33 (.99) XEl33 (.99) XEl33M (.007) XEl33M ( .007) KRS5 (.0007) KRS5 ( .0007)
16d XEl33 (.996) XEl33 (.996) KRS5 (.0019) KRS5 (.002) XEl33M (.0019) XEl33M (.002)
32d XEl33 (.9S) XE133 (.9S) KRS5 (.019) KRS5 (.016)
0 , XEl33M (.0001) XEl33M (.0001) .... I'V
64d KRS5 (.52) KRS5 (.52) XEl33 (.4S) XEl33 ( .4S) XEl33M ( -) XEl33M (-)
12Sd KRS5 (.999S) KRS5 (.999S) XE133 (.0002) XE133 (.0002)
250d KRS5 (l. 0) KRS5 (l. 0)
1y KRS5 (l. 0) KR85 (l. 0)
A: Airborne W: Wall F: Floor S: Sump
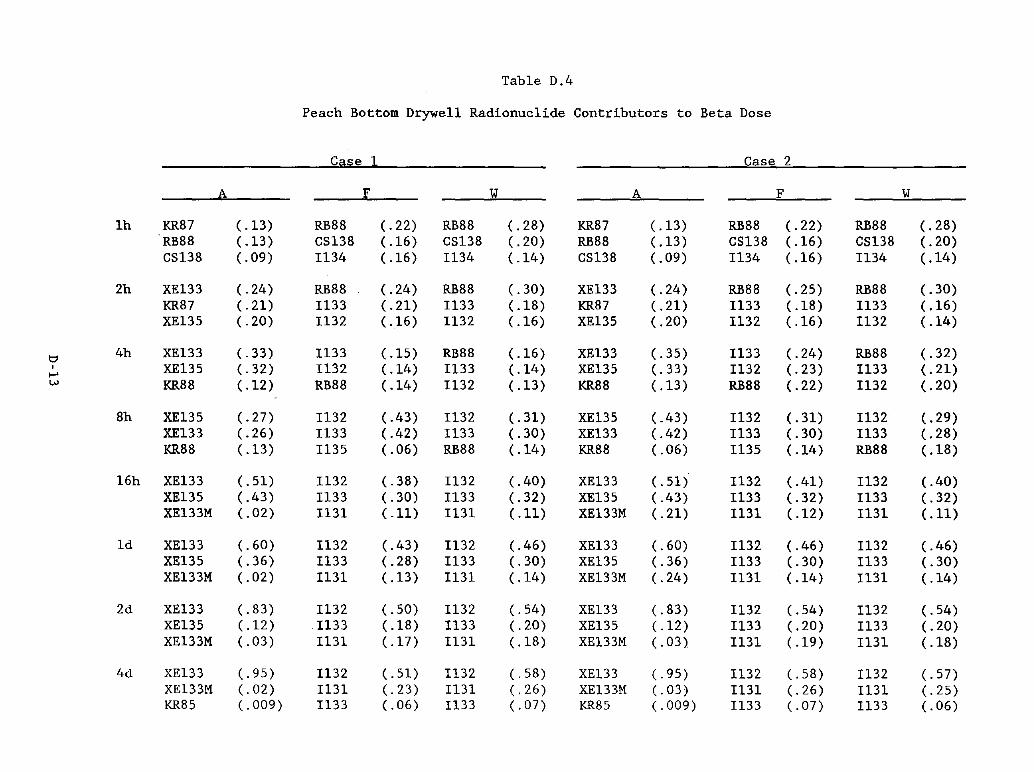
Table D.4
Peach Bottom Drywell Radionuclide Contributors to Beta Dose
Case 1 Case 2
A F W A F W
lh KR87 ( .13) RB88 (.22) RB88 (.28) KR87 ( .13) RB88 (.22) RB88 (.28) RB88 ( .13) CS138 ( .16) CS138 (.20) RB88 (.13) CS138 ( .16) CS138 (.20) CS138 (.09) 1134 ( .16) 1134 ( .14) CS138 (.09) 1134 (.16) 1134 (.14)
2h XE133 (.24) RB88 (.24) RB88 (.30) XE133 (.24) RB88 (.25) RB88 (.30) KR87 (.21) 1133 ( .21) 1133 ( .18) KR87 (.21) 1133 ( .18) 1133 ( .16) XE135 (.20) 1132 ( .16) 1132 ( .16) XE135 (.20) 1132 ( .16) 1132 (.14)
t;j 4h XE133 (.33) 1133 ( .15) RB88 ( .16) XE133 (.35) 1133 (.24) RB88 (.32) , XE135 (.32) 1132 (.14) 1133 (.14) XE135 (.33) 1132 (.23) 1133 (.21) ..... w KR88 (.12) RB88 (.14) 1132 ( .13) KR88 ( .13) RB88 (.22) 1132 (.20)
8h XE135 (.27) 1132 ( .43) 1132 (.31) XE135 ( .43) 1132 (.31) 1132 (.29) XE133 (.26) 1133 ( .42) 1133 (.30) XE133 (.42) 1133 (.30) 1133 (.28) KR88 ( .13) 1135 (.06) RB88 (.14) KR88 (.06) 1135 (.14) RB88 ( .18)
16h XE133 (.51) 1132 (.38) 1132 (.40) XE133 (.51) 1132 (.41) 1132 ( .40) XE135 (.43) 1133 (.30) 1133 (.32) XE135 (.43) 1133 (.32) 1133 (.32) XE133M (.02) 1131 ( .11) 1131 ( .11) XE133M (.21) Il31 ( .12) Il31 ( .11)
1d XE133 (.60) 1132 (.43) 1132 (.46) XE133 (.60) Il32 (.46) Il32 (.46) XE135 (.36) Il33 (.28) 1133 (.30) XE135 (.36) 1133 (.30) Il33 (.30) XE133M (.02) Il31 ( .13) 1131 ( .14) XE133M (.24) 1131 ( .14) Il31 (.14)
2d XE133 (.83) Il32 (.50) 1132 (.54) XE133 (.83) 1132 (.54) 1132 (.54) XE135 (.12) Il33 (.18) 1133 (.20) XE135 (.12) Il33 (.20) 1133 (.20) XE133M (.03) Il31 (.17) 1131 (.18) XE133M (.03) 1131 (.19) Il31 ( .18)
4d XE133 (.95) Il32 (.51) 1132 (.58) XE133 (.95) 1132 (.58) Il32 (.57) XE133M (.02) Il31 (.23) Il31 (.26 ) XE133M (.03) Il31 (.26) Il31 (.25) KR85 (.009) Il33 (.06) Il33 (.07) KR85 (.009) 1133 ( .07) Il33 (.06)
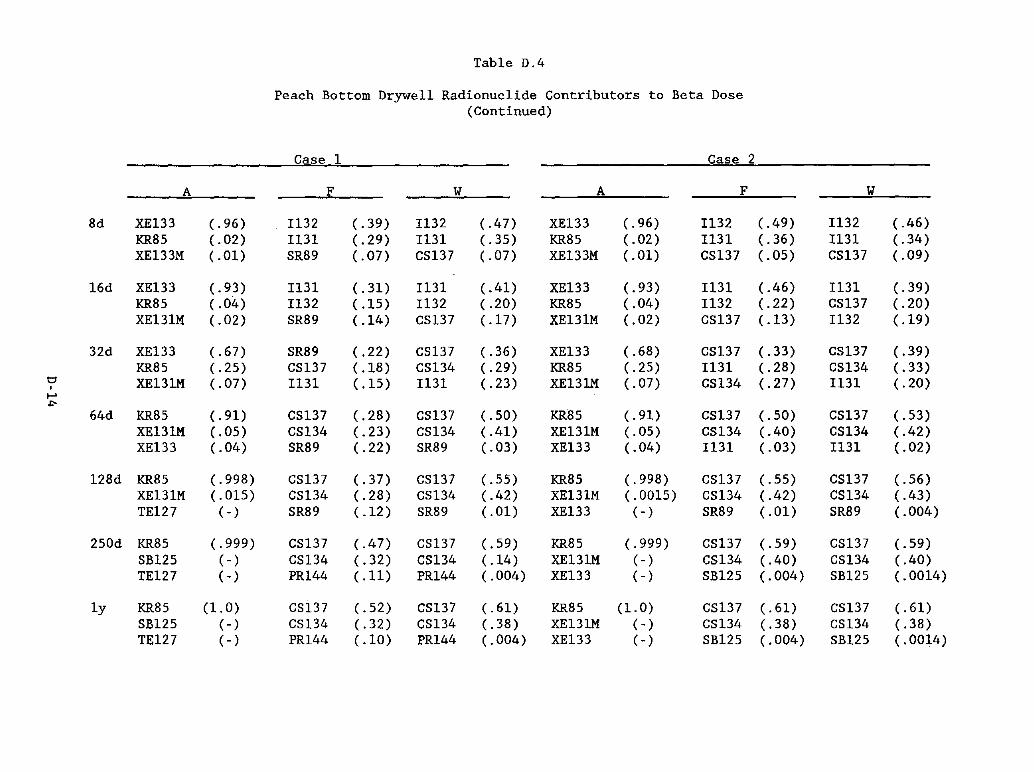
Table D.4
Peach Bottom Drywe11 Radionuc1ide Contributors to Beta Dose (Continued)
Case 1 Case 2 -- --------
A F W A F W
8d XE133 (.96) Il32 (.39) Il32 ( .47) XE133 (.96) Il32 ( .49) Il32 ( .46) KR85 (.02) Il31 (.29) Il31 (.35) KR85 (.02) Il31 (.36) Il31 ( .34) XE133M (.01) SR89 ( .07) CS137 (.07) XE133M ( .01) CSl37 (.05) CS137 (.09)
16d XEl33 (.93) Il31 (.31) Il31 ( .41) XE133 (.93) Il31 ( .46) Il31 (.39) KR85 ( .04) Il32 (.15) Il32 (.20) KRS5 (.04) Il32 (.22) CS137 (.20) XE131M (.02) SR89 (.14) CS137 ( .17) XE131M (.02) CSl37 ( .13) Il32 (.19)
32d XE133 ( .67) SRS9 ( .22) CS137 (.36) XE133 (.6S) CSl37 (.33) CS137 (.39) KRS5 (.25) CS137 ( .1S) CSl34 (.29) KRS5 (.25) Il31 (.2S) CS134 (.33)
t:1 XEl31M ( .07) Il31 (.15) Il31 (.23) XE131M ( .07) CSl34 (.27) Il31 (.20) , .... ..,..
64d KR85 (.91) CS137 (.2S) CS137 (.50) KRS5 (.91) CS137 (.50) CS137 (.53) XEl31M (.05) CSl34 (.23) CS134 ( .41) XE131M (.05) CS134 ( .40) CS134 ( .42) XEl33 (.04) SRS9 (.22) SR89 (.03) XE133 (.04) Il31 (.03) Il31 (.02)
12Sd KR85 (.998) CSl37 (.37) CSl37 (.55) KRS5 (.998) CSl37 (.55) CS137 (.56) XEl31M (.015) CS134 (.28) CSl34 (.42) XE131M (.0015) CSl34 ( .42) CS134 ( .43) TE127 (-) SR89 ( .12) SR89 (.01) XEl33 (-) SR89 ( .01) SR89 (.004)
250d KR85 (.999) CSl37 ( .47) CS137 (.59) KR85 (.999) CS137 (.59) CSl37 (.59) SB125 (-) CS134 (.32) CS134 (.14) XEl31M ( - ) CS134 (.40) CS134 ( .40) TE127 (-) PR144 ( .11) PR144 (.004) XEl33 (-) SB125 (.004) SB125 (.0014)
1y KR85 (1. 0) CS137 (.52) CS137 (.61) KR85 (1. 0) CS137 (.61) CS137 (.61) SB125 (-) CS134 (.32) CS134 (.38) XE131M (-) CSl34 (.38) CS134 (.38) TE127 (-) PR144 (.10) PR144 (.004) XE133 (-) SB125 (.004) SB125 (.0014)

Table D.4
Peach Bottom Drywell Radionuclide Contributors to Beta Dose (Continued)
Case 3 Case 4
A A
lh KR87 (.33) KR87 (.33) XE133 (.22) XE133 (.22) KR88 ( .16) KR88 (.16)
2h XE133 (.27) XE133 (.27) KR87 (.24) KR87 ( .24) XE135 (.23) XE135 (.23)
4h XE133 (.35) XE133 (.35) XE135 (.33) XE135 (.33) t::! , KR88 ( .13) KR88 ( .13) ,...
\Jl
8h XE135 ( .43) XE135 ( .43) XE133 ( .42) XE133 ( .42) KR88 ( .06) KR88 (.06)
16h XE133 (.51) XE133 (.51) XE135 ( .43) XE135 ( .43) XE133M (.02) XE133M (.02)
Id XE133 ( .60) XE133 (.60) XE135 (.36) XE135 (.36) XE133M (.02) XE133M (.02)
2d XE133 (.83) XE133 (.83) XE135 ( .12) XEl35 ( .12) XE133M ( .03) XE133M (.03)
4d XE133 (.95) XEl33 (.95) XE133M (.03) XE133M ( .03) KR85 ( .009) KR85 ( .009)

Table D.4
Peach Bottom Drywell Radionuclide Contributors to Beta Dose (Concluded)
1\ Case 3 Case 4
A A
8d XEl33 (.96) XEl33 (.96) KR85 ( .02) KR85 (.02) XE133M (.01) XEl33M (.01)
16d XEl33 (.93) XEl33 (.93) KR85 (.04) KR85 (.04) XEl31M (.02) XEl31M (.02)
32d XEl33 (.68) XEl33 (.68) KR85 (.25) KR85 (.25) XEl31M (.07) XEl31M ( .07)
t:l , (.91) (.91) >-' 64d KR85 KR85
0'> XEl31M (.05) XEl31M (.05) XE133 (.04) XEl33 (.04)
128d KR85 (.998) KR85 (.998) XEl31M (.0015) XEl31M (.0015) XE133 (-) XEl33 (-)
256d KR85 (1. 0) KR85 (1. 0) XEl31M (-) XEl31M (-) XE133 (-) XEl33 (-)
ly KR85 (1. 0) KR85 (1. 0) XEl31M (-) XEl31M (-) XEl33 ( -) XEl33 (-)
A: Airborne W: Wall F: Floor S: Sump
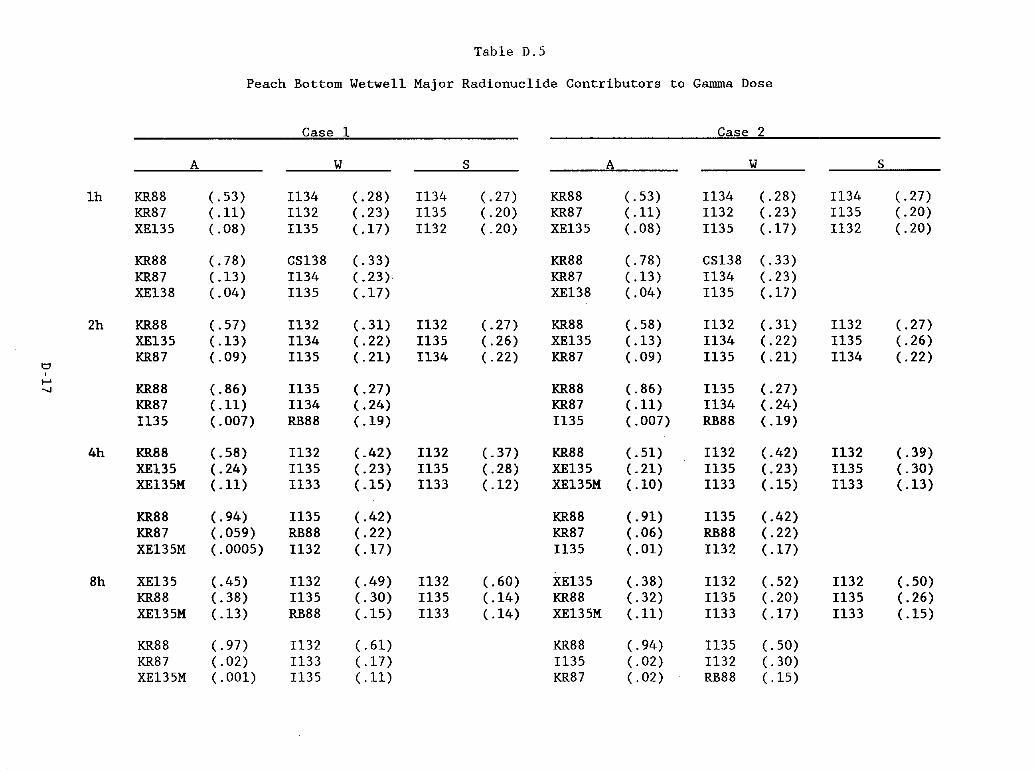
Table D.5
Peach Bottom Wetwe11 Major Radionuc1ide Contributors to Gamma Dose
Case 1 Case 2
A W S A W S
1h KR88 (.53) Il34 (.28) Il34 (.27) KR88 (.53) Il34 (.28) Il34 ( .27) KR87 ( .11) Il32 (.23) IUS (.20) KR87 ( .11) Il32 (.23) IUS (.20) XE135 (.08) IUS ( .17) Il32 (.20) XE135 (.08) Il35 (.17) Il32 (.20)
KR88 (.78) CS138 (.33) KR88 (.78) CS138 (.33) KR87 ( .13) Il34 (.23) KR87 ( .13) Il34 (.23) XE138 (.04) IUS (.17) XE138 (.04) IUS (.17)
2h KR88 (.57) Il32 (.31) Il32 ( .27) KR88 (.58) Il32 (.31) Il32 ( .27) XE135 ( .13) Il34 (.22) 1135 (.26) XE135 ( .13) Il34 (.22) IUS (.26) KR87 (.09) 1135 (.21) Il34 (.22) KR87 ( .09) IUS (.21) Il34 (.22)
t1 , ......
KR88 (.86) IUS (.27) KR88 (.86) IUS ( .27) ..... KR87 ( .11) Il34 (.24) KR87 ( .11) Il34 (.24) IUS (.007) RB88 (.19) IUS (.007) RB88 ( .19)
4h KR88 (.58) Il32 (.42) Il32 (.37) KR88 (.51) Il32 ( .42) Il32 (.39) XE135 (.24) Il35 (.23) Il35 (.28) XE135 (.21) Il35 (.23) 1135 (.30) XE135M ( .11) Il33 (.15) Il33 ( .12) XE135M ( .10) Il33 ( .15) Il33 ( .13)
KR88 (.94) IUS ( .42) KR88 (.91) Il35 ( .42) KR87 (.059) RB88 (.22) KR87 (.06) RB88 (.22) XE135M (.0005) Il32 ( .17) IUS (.01) Il32 ( .17)
8h XE135 ( .45) Il32 ( .49) Il32 (.60) XE135 (.38) Il32 (.52) Il32 (.50) KR88 (.38) IUS (.30) IUS ( .14) KR88 (.32) IUS (.20) IUS (.26) XE135M ( .13) RB88 ( .15) Il33 ( .14) XE135M (.11) Il33 ( .17) Il33 ( .15)
KR88 (.97) Il32 (.61) KR88 (.94) IUS (.50) KR87 (.02) Il33 (.17) IUS (.02) Il32 (.30) XE135M (.001) IUS ( .11) KR87 (.02) RB88 (.15)

Table D.5
Peach Bottom Wetwell Major Radionuclide Contributors to Gamma Dose (Continued)
Case 1 Case 2
A W S A W S
16h XE135 ( .74) Il32 (.61) Il32 (.60) XE135 (.56) Il32 (.61) Il32 (.62) XE135M ( .11) Il33 ( .17) IDS (.14) Il32 (.15) Il33 ( .17) IDS ( .15) KR88 ( .11) Il35 ( .11) Il33 ( .14) XE135M (.08) IDS ( .11) Il33 (.15)
KR88 (.99) Il32 (.51) KR88 (.84) Il32 (.51) XE135M (.003) IDS (.39) Il32 ( .08) IDS (.39) XE135 (.002) Il33 (.04) IDS (.06) Il33 (.04)
ld XE135 (.84) Il32 (.66) Il32 (.67) XE135 (.58) Il32 (.66) Il32 (.69) t:;)
XE135M (.08) Il33 (.15) Il33 ( .13) Il32 ( .21) Il33 (.15) Il33 (.14) I t-' XE133 (.05 ) Il31 ( .08) Il35 (.07) XE135M ( .05) Il31 ( .08) IDS ( .08) co
KR88 (.98) Il32 (.68) KR88 (.52) Il32 (.68) XE135 (.01) IDS (.24) Il32 (.33) IDS ( .24) XE135M (.01) Il33 (.04) IDS (.12) Il33 (.04)
2d XE135 (.76) Il32 (.73) Il32 (.76) Il32 ( .44) Il32 (.73) Il32 (.79) XE133 (.19) Il31 (.10) Il33 (.08) XE135 (.33) Il31 (.10) Il33 ( .09 XE135M (.03) Il33 (.09) CS134 (.04) XE133 (.08) Il33 (.09) CS134 (.04)
KR88 (.48) Il32 (.90) Il32 (.91) Il32 (.90) XE135 (.37) IDS (.03) Il33 (.03) IDS (.03) XE135M (.12) Il33 (.03) IDS (.03) Il33 (.03)
4d XE133 (.79) Il32 (.74) Il32 (.78) Il32 (.65) Il32 (.74) Il32 (.81) XE135 ( .13) CS136 ( .13) CS134 (.06) XE133 (.15) Il31 ( .13) CS134 (.07) XE133M (.08) CS134 ( .07) Il31 (.05) Il31 ( .11) CS134 (.07) Il31 (.05)
XE13S (.4S) Il32 (.94) Il32 (.98) Il32 (.94) TE131M (.34) CS136 (.03) Il33 (.01) CS136 (.02) KR8S (.09) CS134 (.02) TE131M (.004) CS134 (.02)
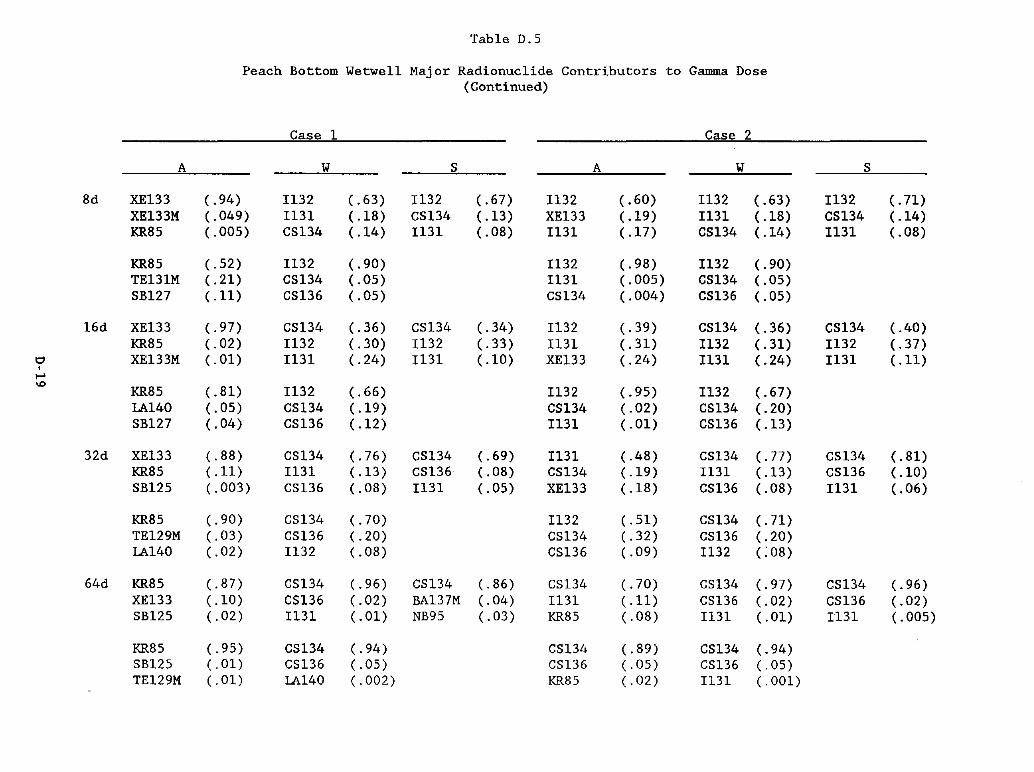
Table D.s
Peach Bottom Wetwe11 Major Radionuc1ide Contributors to Gamma Dose (Continued)
Case 1 Case 2
A W S A W S
Sd XE133 (.94) I132 (.63) I132 (.67) 1132 (.60) 1132 (.63) 1132 (.71) XE133M (.049) 1131 (.lS) CS134 ( .13) XE133 ( .19) 1131 (.lS) CS134 (.14) KRS5 (.005 ) CS134 ( .14) I131 (. OS) 1131 ( .17) CS134 (.14) 1131 (.08)
KRS5 (.52) 1132 (.90) I132 (.9S) I132 (.90) TE131M (.21) CS134 ( .05) 1131 (.005) CS134 (.05) SB127 ( .11) CS136 (.05) CS134 (.004) CS136 (.05)
16d XE133 (.97) CS134 (.36) CS134 (.34) 1132 (.39) CS134 (.36) CS134 ( .40) KRS5 (.02) 1132 (.30) 1132 (.33) 1131 (.31) I132 (.31) I132 (.37)
t:;I XE133M (.01) I131 (.24) I131 (.10) XE133 (.24) I131 (.24) I131 ( .11) I ,...
>D KRS5 (.Sl) I132 (.66) I132 (.95) I132 (.67) LA140 (.05) CS134 ( .19) CS134 (.02) CS134 (.20) SB127 (.04) CS136 ( .12) I131 (.01) CS136 ( .13)
32d XE133 (.SS) CS134 (.76) CS134 (.69) I131 ( .4S) CS134 (.77) CS134 (.Sl) KRSs ( .11) I131 ( .13) CS136 (. OS) CS134 (.19) I131 ( .13) CS136 (.10) SB125 ( .003) CS136 (. OS) I131 (.05) XE133 ( .1S) CS136 (. OS) 1131 ( .06)
KRS5 (.90) CS134 (.70) I132 (.51) CS134 (.71) TE129M (.03) CS136 (.20) CS134 (.32) CS136 (.20) LA140 (.02) I132 (. OS) CS136 ( .09) I132 c: OS)
64d KRS5 (. S7) CS134 (.96) CS134 (.S6) CS134 (.70) CS134 (.97) CS134 (.96) XE133 (.10) CS136 (.02) BA137M (.04) 1131 ( .11) CS136 (.02) CS136 (.02) SB125 (.02) I131 (.01) NB9s (.03) KRSs (.OS) 1131 (.01) I131 (.005 )
KRS5 (.95) CS134 (.94) CS134 (. S9) CS134 (.94) SB125 (.01) CS136 ( .05) CS136 ( .05) CS136 (.05) TE129M (.01) LA140 ( .002) KRSs ( .02) I131 (.001 )

Table D.5
Peach Bottom Wetwell Major Radionuclide Contributors to Gamma Dose (Concluded)
Case 1 Case 2
A W S A IV S
128d KR85 (.97) CSl34 (.99) CSl34 (.91) CS134 (.82) CSl34 (.99) CS134 (.994) SB125 (.02) SB125 (.002) BAl37M (.04) KR85 (.10) SB125 (.002) SB125 (.003) BAl37M (.002) BAl37M (.002) NB95 (.02) SB125 (.05) CS136 (.0007) BA137M (.001)
KB85 (.97) CSl34 (.996) CSl34 (.95) CSl34 (.997) SB125 (.014) CS136 (.002) KR85 (.03) CSl36 (.002) TE129M ( .004) PR144 (.0004) SB125 (.01) SB125 (.003)
l::' 256d KR85 (.97) CSl34 (.996) CSl34 (.94) CSl34 (.82) CSl34 (.997) CS134 (.995) , N SB125 ( .02) SB125 (.0025) BA137M (.05) KR85 ( .11) SB125 (.002) SB125 (.003) 0
BAl37M (.002) BA137M (.002) NB95 ( .007) SB125 (.05) BA13 7M (.0004) BA137M (.001)
KR85 (.98) CSl34 (.999) CS134 (.95) CS134 (.9996) SB125 (.01) SB125 (.0004) KR85 (.03) SB125 (.0003) BA137M (.002) BA137M (.0004) SB125 (.01) BA137M (.0001)
ly KR85 (.98) CSl34 (.996) CSl34 (.94) CSl34 (.81) CSl34 (.9977) CS134 (.995) SB125 (.018) SB125 (.0026) BAl37M (.05) KR85 (.12) SB125 (.0018) SB125 ( .003) BA137M ( .002) BA137M (.0018) SB125 (.007) SB125 (.05) BAl3 7M (.0004) BAl37M (.001)
KR85 (.984) CSl34 (.9988) GSl34 (.95) CSl34 (.999) SB125 ( .013) SB125 (.0004) KR85 ( .03) SB125 (.0003) BA137M (.002) BA137M (.0004) SB125 (.01) BAl37M (.0001)

Table D.6
Peach Bottom Wetwell Major Radionuc1ide Contributors to Beta Dose
Case 3
A W S A W S
lh KR88 (.53) 1134 (.28) 1134 (.27) KR88 (.53) 1134 (.28) 1134 (.27) KR87 ( .11) 1132 (.23) 1135 (.20) KR87 ( .11) 1132 (.23) 1135 (.20) XE135 (.08) 1135 (.17) 1132 (.20) XE135 (.08) 1135 ( .17) 1132 (.20)
KR88 (.78) CS138 (.33) KR88 ( .78) CS138 ( .33) KR87 ( .13) 1134 (.23) KR87 ( .13) 1134 (.23) XE138 (.04) 1135 (.17) XE138 (.04) 1135 ( .17)
t:I 2h KR88 (.57) 1132 (.31) 1132 (.27) KR88 ( . 58) 1132 (.31) 1132 (.27)
, XE135 ( .13) 1134 (.22) 1135 (.26) XE135 ( .13) 1134 (.22) 1135 (.26) '" ..... KR87 ( .09) IUS (.21) 1134 (.22) KR87 (.09) 1135 (.21) 1134 (.22)
KR88 (.86) 1135 (.27) KR88 (.86) 1135 (.27) KR87 ( .11) 1134 (.24) KR87 ( .11) 1134 (.24) 1135 (.007) RB88 ( .19) 1135 (.007) RB88 (.19)
4h KR88 (.58) 1132 ( .42) 1132 (.36) KR88 (.51) 1132 (.42) 1132 (.38) XE135 (.24) 1135 (.23) 1135 ( .27) XE135 (.21) IUS (.23) 1135 (.29) XE135M ( .11) 1133 (.15) 1133 (.12) XE135M ( .10) 1133 (.15) 1133 ( .12)
KR88 (.94) 1135 ( .42) KR88 (.9l) 1135 ( .42) KR87 (.059) RB88 (.22) KR87 (.06) RB88 (.22) XE135M (.0005) 1132 (.17) IUS (.01) 1132 ( .17)
8h XE135 (.45 ) 1132 (.52) 1132 ( .46) XE135 (.38) 1132 (.52) 1132 ( .49) KR88 (.38) .1135 (.20) 1135 (.24) KR88 ( .32) 1135 (.20) 1135 (.26) XE135M ( .13) 1133 ( .17) 1133 (.14) XE135M ( .11) 1133 (.17) 1133 ( .14)
KR88 (.97) 1135 (.50) KR88 ( .94) IUS (.50) KR87 (.02) 1132 (.30) 1135 (.02) 1132 (.30) XE135M (.001) RB88 (.15) KR87 (.02) RB88 (.15)
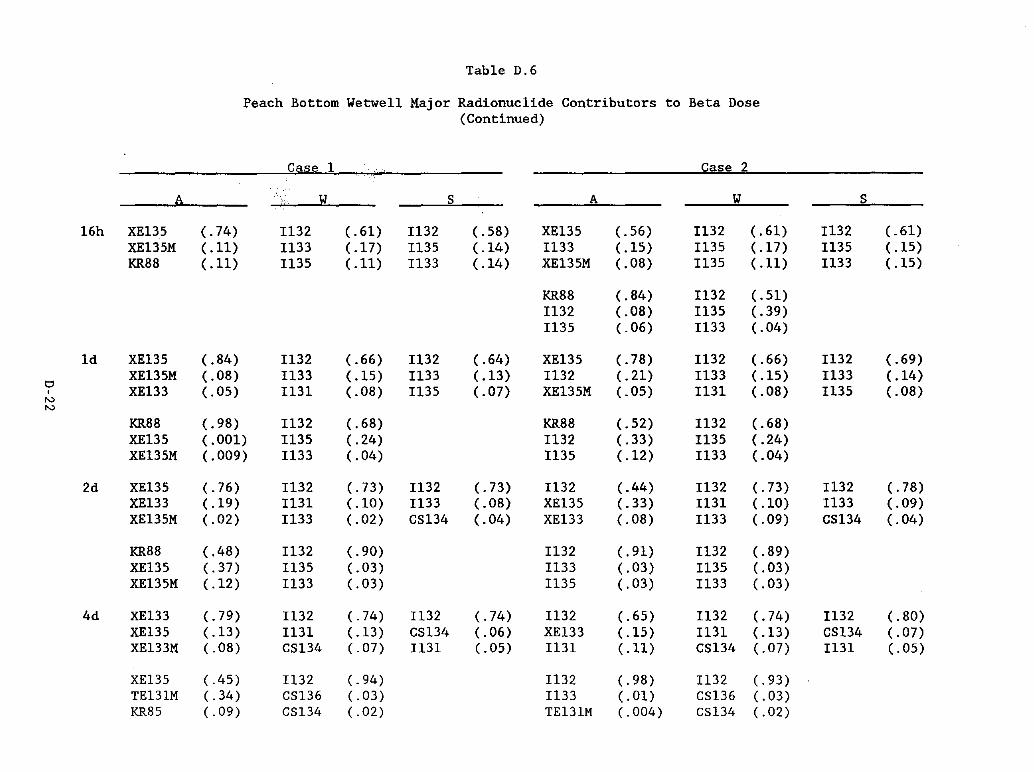
Table D.6
Peach Bottom Wetwell Major Radionuclide Contributors to Beta Dose (Continued)
Case 1 Case 2
A W S A W S
16h XE135 (.74) Il32 (.61) Il32 (.58) XE135 (.56) Il32 (.61) Il32 (.61) XE135M ( .11) Il33 ( .17) Il35 ( .14) Il33 ( .15) Il35 (.17) Il35 ( .15) KR88 ( .11) Il35 ( .11) Il33 (.14) XE135M (.08) 1135 ( .11) Il33 ( .15)
KR88 (.84) Il32 (.51) Il32 (.08) Il35 (.39) Il35 (.06) Il33 ( .04)
1d XE135 ( .S4) Il32 (.66) Il32 (.64) XE135 (.7S) Il32 (.66) Il32 (.69) XE135M (.08) Il33 (.15) Il33 ( .13) Il32 (.21) Il33 ( .15) Il33 (.14)
0 XE133 (.05) Il31 (.OS) Il35 ( .07) XE135M (.05) Il31 (.08) 1135 (.08) 0
"-> "->
KRS8 (.98) Il32 (.68) KR88 (.52) Il32 (.68) XE135 (.001) Il35 (.24) Il32 (.33) Il35 (.24) XE135M (.009) Il33 (.04) Il35 (.12) Il33 ( .04)
2d XE135 (.76) Il32 (.73) Il32 (.73) Il32 ( .44) Il32 (.73) Il32 (.78) XE133 (.19) Il31 (.10) Il33 ( .08) XE135 (.33) Il31 (.10) Il33 (.09) XE135M (.02) Il33 (.02) CS134 ( .04) XE133 (.08) Il33 (.09) CS134 (.04)
KR88 ( .48) Il32 (.90) Il32 (.91) Il32 (.89) XE135 (.37) Il35 (.03) Il33 (.03) 1135 (.03) XE135M (.12) Il33 (.03) 1135 (.03) Il33 (.03)
4d XE133 (.79) Il32 (.74) Il32 (.74) Il32 (.65) Il32 (.74) Il32 (.80) XE135 (.13) Il31 ( .13) CS134 (.06) XE133 (.15) Il31 ( .13) CS134 ( .07) XE133M (.08) CS134 (.07) Il31 (.05) Il31 ( .11) CS134 ( .07) Il31 (.05)
XE135 ( .45) Il32 (.94) Il32 (.98) Il32 (.93) TE131M (.34) CS136 (.03) Il33 (.01) CS136 (.03) KR85 (.09) CS134 (.02) TE131M (.004) CS134 (.02)

Table D.6
Peach Bottom Wetwe11 Major Radionuc1ide Contributors to Betaa Dose (Continued)
Case 1 Case 2
A W S A W S
Sd XE133 (.94) 1132 (.63) 1132 (.60) 1132 (.63) 1132 (.71) XE133M ( .04) 1131 (.lS) XE133 (.19) 1131 (.lS) CS134 ( .14) KRS5 (.005 ) CS134 ( .14) 1131 ( .17) CS134 (.14) 1131 (. OS)
KRS5 (.52) 1132 (.90) 1132 (.9S) 1132 (.90) TE131M (.21) CS134 ( .05) 1131 (.005 ) CS134 (.05) SB127 ( .11) CS136 (.05) CS134 (.004) CS136 (.05)
0 16d XE133 (.97) CS134 (.36) CS134 (.30) 1132 (.39) CS134 (.36) CS134 (.39) , N KRS5 (.015) 1132 (.30) 1132 (.29) 1131 (.31) 1132 (.30) 1132 (.37) w
XE133M (.01) 1131 (.24) 1131 (.09) XE133 (.24) 1131 (.24) 1131 (.12)
KRS5 (.Sl) 1132 (.67) 1132 (.95) 1132 (.67) LA140 ( .05) CS134 (.19) CS134 (.02) CS134 (.20) SB127 ( .04) CS136 (.12) 1131 (.01) CS136 ( .13)
32d XE133 (. SS) CS134 (.76) CS134 (.5S) 1131 ( .4S) CS134 (.77) CS134 (. SO) KRS5 ( .11) 1131 ( .13) NB95 ( .07) CS134 (.19) 1131 ( .13) CS136 ( .09) SB125 (.003 ) CS136 ( .08) CS136 ( .07) XE133 (.lS) CS136 (. OS) 1131 (.06)
KRS5 (.90) CS134 (.70) 1132 (.51) CS134 (.71) TE129M (.026) CS136 (.20) CS134 (.32) CS136 (.20) LA140 (.02) 1132 ( .08) CS136 (.09) 1132 (. OS)
64d KR85 (. S7) CS134 (.96) CS134 (.75) CS134 (.70) CS134 (.97) CS134 (.96) XE133 ( .10) CS136 (.02) NB95 (.08) 1131 ( .11) CS136 (.02) CS136 (.02) SB125 ( .02) 1131 (.01) ZR95 (.05 ) KRS5 (. OS) 1131 (.01) SB125 ( .007)
KRS5 ( .95) S134 (.94) CS134 (.S9) CS134 (.95) SB125 (.01) CS136 ( .05) CS136 (.05) CS136 (.05) TE129M (.01) LA140 ( .002) KRSS (.02) 1131 (.OOOS)

Table D.6
Peach Bottom Wetwe11 Major Radionuc1ide Contributors to Betaa Dose (Concluded)
Case 1 Case 2
A W S A W S
128d KR85 (.97) CS134 (.994) CS134 (.83) CS134 (.82) CS134 (.996) CS134 (.99) SB125 (.02) SB125 (.002) NB95 ( .06) KR85 (.10) SB125 (.002) SB125 (;008) BA137M (.002) BA137M (.0015) BA137M (.06) SB125 (.05) CS136 (.001) BA137M (.002)
KR85 (.97) CS134 (.996) CS134 (.95) CS134 (.997) SB125 (.01) CS136 (.002) KR85 (.03) CS136 (.002) TE129M (.004) PR144 (.0004) SB125 (.01) SB125 (.0003)
t;I 256d KR85 (.97) CS134 (.996) CS134 (.89) CS134 (.82) CS134 (.997) CS134 (.98) ,
'" SB125 (.02) SB125 (.0025) BA137M ( .07) KR85 ( .11) SB125 (.002) SB125 (.0076) +-BA137M (.002) BA137M (.002) NB95 (.02) SB125 (.05) BA13 7M (.0004) BA137M (.002)
KR85 (.98) CS134 (.998) CS134 (.956) CS134 (.9996) SB125 (.014) SB125 (.0004) KR85 (.03) SB125 (.0003) BA137M (.002) BA137M (.0004) SB125 (.01 BA137M (.0001)
1y KR85 (.98) CS134 (.995) CS134 (.90) CS134 (.81) CS134 (.9977) CS134 (.99) SB125 (.018) SB125 (.0026) BA137M (.08) KR85 (.12) SB125 (.0018) SB125 (.008) BA137M ( .0019) BA137M (.0018) SB125 (.01) SB125 (.05) BA13 7M (.0004) BA137M ( .002)
KR85 (.98) CS134 (.998) CS134 (.95) CS134 (.9996) SB125 ( . 013) SB125 (.0004) KR85 (.03) SB125 (.0003) BA137M (.0019) BA137M ( .0004) SB125 (.01) BA137M (.0001)
DISTRIBUTION
W. S. Farmer (5) U.S. Nuclear Regulatory Commission Office of Nuclear Regulatory Research Division of Engineering Washington DC 20555
Z. Rosztoczy U.S. Nuclear Regulatory Commission Office of Nuclear Regulatory Research Division of Regulatory Applications washington, DC 20555
G. Arlotto U.S. Nuclear Regulatory Commission Office of Nuclear Regulatory Research Division of Engineering Washington, DC 20555
M. Vag ins U.S. Nuclear Regulatory Commission Office of Nuclear Regulatory Commission Division of Engineering washington, DC 20555
S. Carfagno Franklin Research Center Valley Forge Corporate Center 2600 Monroe Blvd. Norristown, PA 19403
R. Denning Battelle Columbus Laboratory 505 King Avenue Columbus, OH 43201
G. Sliter EPRI 3412 Hillview Ave. Palo Alto, CA 94304
DIST-1

Sandia Distribution:
6400 D. J. McCloskey 6500 A. W. Snyder 6410 D. A. Dahlgren 6413 E. Gorham-Bergeron 6413 S. J. Higgins 6419 M. P. Bohn 6419 L. D. Bustard 6419 M. J. Jacobus 6420 W. B. Gauster 6521 D. D. Carlson 6524 W. R. Dawes 6524 S. M. Luker 6524 F. V. Thome 6524 D. B. King (15) 3141 S. A. Landenberger (5) 3151 W. I. Klein 8524 J. A. Wackerly
DIST-2
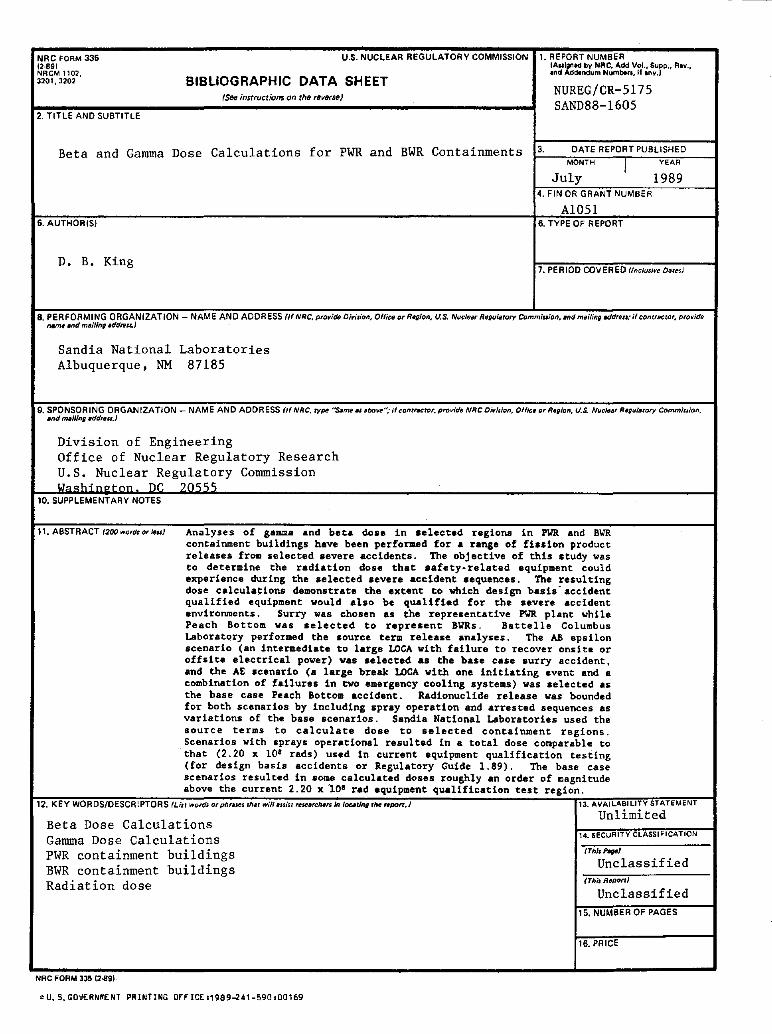
NRC FORM 335 U.S. NUCLEAR REGULATORY COMMISSION I. REPORT NUMBER (2·891 1A&lI~ntd by NRC. Add Vol.. SUpp" R.II., NRCM 1102, .nd Addendum Numbert. If .nv.l 3201,3202 BIBLIOGRAPHIC DATA SHEET
NUREG/CR-5175 (See insrrucOons on the reverse)
SAND88-1605 2. TITLE AND SUBTITLE
Beta and Gamma Dose Calculations for PWR and BWR Containments 3. DATE REPORT PUBLISHED
MONTH I YEAR
July 1989 4. FIN OR GRANT NUMBER
A1051 5. AUTHORIS} 6. TYPE OF REPORT
D. B. King 7. PERIOD COVERED (Inclusive Daces)
8. PERFORMING ORGANIZATION - NAME AND ADDRESS IIfNRC.provide tJivision, Office orR~Jon. V.S. NucleMRtlgulsrory Cammiuion, mid mailing addreu;if conffactor, provide INI'I'I" Md ~iIIng addtfls.s.)
Sandia National Laboratories Albuquerque, NM 87185
9. SPONSORING ORGANIZA nON - NAME AND ADDRESS Of NRC, type ''$6me.u .t){1'Ie";Ucontractor. provide NRC Divl$irm, Ollie. or Region, U.s. NuclHf Ragllilltory Commillion, and mailing ~d'tlu.)
Division of Engineering Office of Nuclear Regulatory Research U.S. Nuclear Regulatory Commission W""hinqton DC 205.5..2
10. SUPPLEMENTARY NOTES
11. ABSTRACT (200wordIOf"MU) Analyses of gamma and beta dose in .elected regions in PWR and BIIR containment buildings have been performed for a range of fi •• ion product releases from selected severe accidents. The objective of this study was to determine the radiation dose that aafety-related equipment could experience during the selected severe accident sequences. The resultIng dose calcula~ions demonstrate the extent to which design basis'accident qualified equipment would also be qualified for the severe accident environments. Surry was chosen a. the representative PWR plant while Peach Bott:om was selected to represent BIIRs. Battelle Columbus Laboratory performed the source term release analyses. The All eps Hon scenario <an intermediate to large toCA with failure to recover onsite or offsite electrical power) was • elected as the base case surry accident • and the AE scenario (a large break LOCA with one InItIating event and a combinatIon of failure. In two emergency cooling systems) was selected as the base case Peach Bottom accIdent. Radionuclide release was bounded for both scenarios by including spray operation and arrested sequences as variations of the base scenarios. Sandia National Laboratories used the source terms to calculate dose to selected containment regions. Scenarios with sprays operational resulted in a total dose comparable to that (2.20 X 10· rads) used in current equipment qualification testIng (for design basis accidents or Regulatory Guide 1. 89). The base case scenarios resulted in some calculated doses roughly an order of magnitude above the current 2.20 x 101 rad equipment qualIfication test region.
12. KEY WORDS/DESCRIPTORS (Ust words 0' pIlrnes ,h., wiflllwsr '~~.rr:h.1'$ in ioc~Unll 'h~ RPl".,.) 13. AVAILABILITY STATEMENT
Unlimited Beta Dose Calculations Gamma Dose Calculations 14. SECURITY CLASSIFICATION
PWR containment buildings (ThJs~)
BWR containment buildings Unclassified
Radiation dose (This R~ponJ
Unclassified 15. NUMBER OF PAGES
16. PRICE
NRC FORM 335 (2-89)
<U. S.GOUERNMENT PRINTING OFFICE'1989-241-590.00169