best practices in core lab design - executive · pdf file© ortho-clinical diagnostics,...
TRANSCRIPT
© Ortho-Clinical Diagnostics, Inc.
Best Practices in Core Lab Design
Will today’s designs meet tomorrow’s needs?
Steve Friedland
Director, ValuMetrix Services
2 © Ortho-Clinical Diagnostics, Inc.
Key Concepts—Core Lab Design
Healthcare Reform
Understanding Production Costs
Footprint vs. Workflow
Automation-Our Current State
Closing Thoughts
3 © Ortho-Clinical Diagnostics, Inc.
“By every measure, the clinical laboratory industry is
entering a high-stakes period during the next 24 months.
Powerful trends are reducing lab budgets and payers
are cutting the prices paid for medical laboratory
testing”.
Dark Daily
Future of Healthcare Reform
Source: [email protected] Apri l3, 2013
4 © Ortho-Clinical Diagnostics, Inc.
“You absolutely cannot make a series of good decisions
without first confronting the brutal facts.”
Jim Collins
Good to Great
Reference: Good To Great, Jim Collins Harper Collins Publishers, Inc 2001

5 © Ortho-Clinical Diagnostics, Inc.
Understanding Production Costs
What is the customer willing to pay for?
Make or buy?
6 © Ortho-Clinical Diagnostics, Inc.
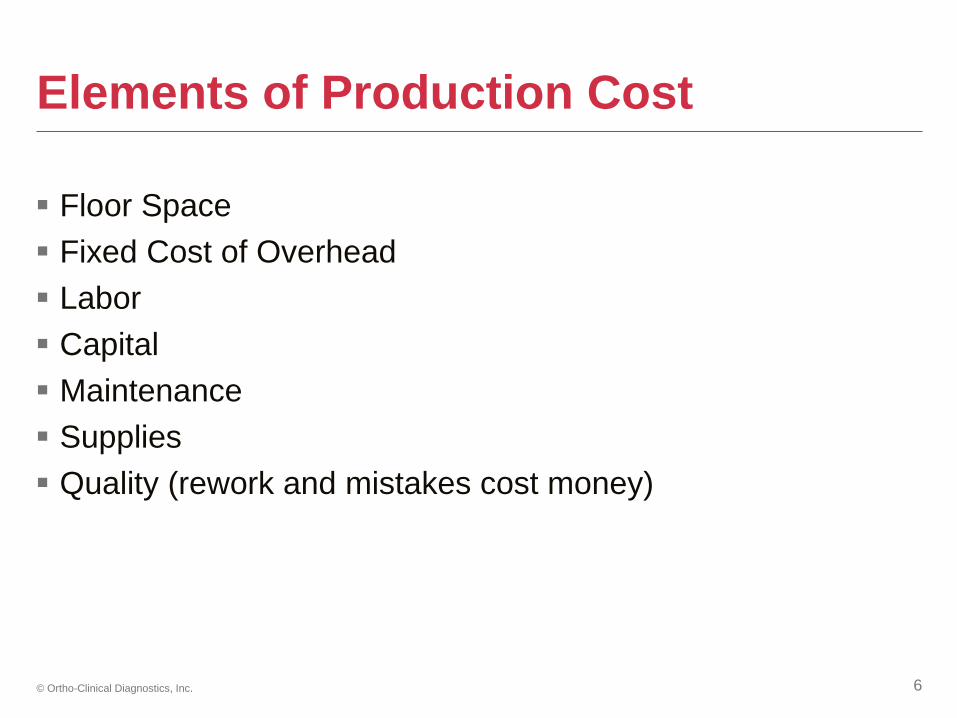
Elements of Production Cost
Floor Space
Fixed Cost of Overhead
Labor
Capital
Maintenance
Supplies
Quality (rework and mistakes cost money)
7 © Ortho-Clinical Diagnostics, Inc.
Current State: Typical Core Lab
Typically we invest up to 80% of our space, labor and capital
resources on the core tests of basic chemistry, hematology
coag and urinalysis. Is this what the healthcare system of
the future will support?
Conventional wisdom and industry trends have been
towards systems that are taking ever more space, labor and
capital investment.
Will healthcare reform require us to create a new paradigm
as these basic tests receive lower reimbursements or
become part of a bundled network or ACO payment?
8 © Ortho-Clinical Diagnostics, Inc.
Bending the Cost Curve: Core Lab of the Future
Should we be designing systems that produce these basic test
results in the smallest amount of space with the least
investment in labor and capital equipment?
9 © Ortho-Clinical Diagnostics, Inc.
Footprint vs. Workflow
If the lowest possible production cost is the goal….
What needs to change?
10 © Ortho-Clinical Diagnostics, Inc.
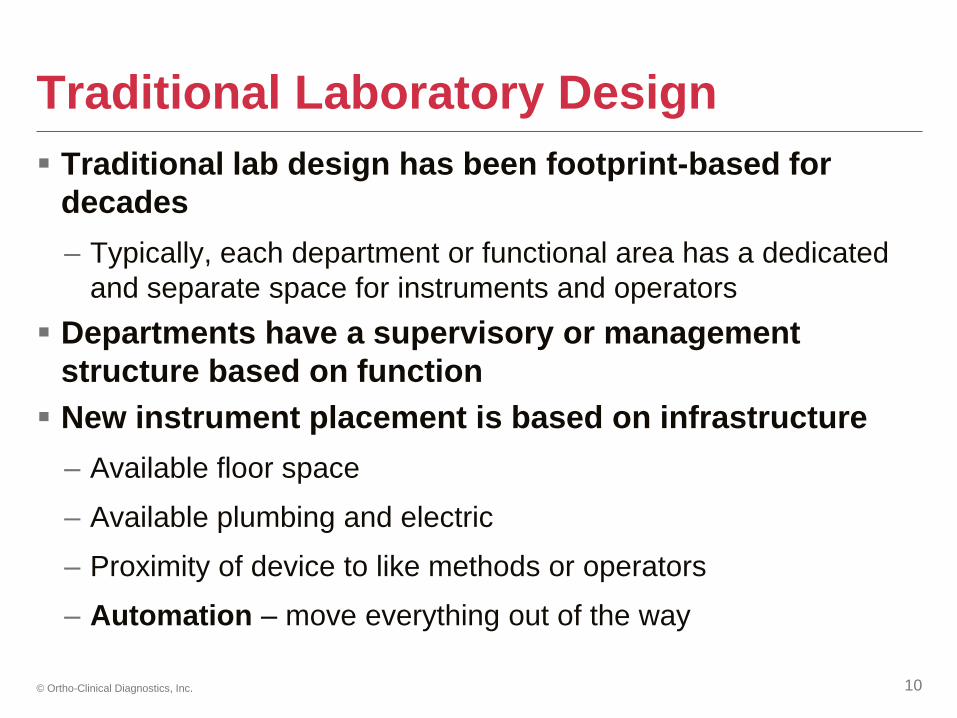
Traditional Laboratory Design
Traditional lab design has been footprint-based for
decades
– Typically, each department or functional area has a dedicated
and separate space for instruments and operators
Departments have a supervisory or management
structure based on function
New instrument placement is based on infrastructure
– Available floor space
– Available plumbing and electric
– Proximity of device to like methods or operators
– Automation – move everything out of the way
11 © Ortho-Clinical Diagnostics, Inc.
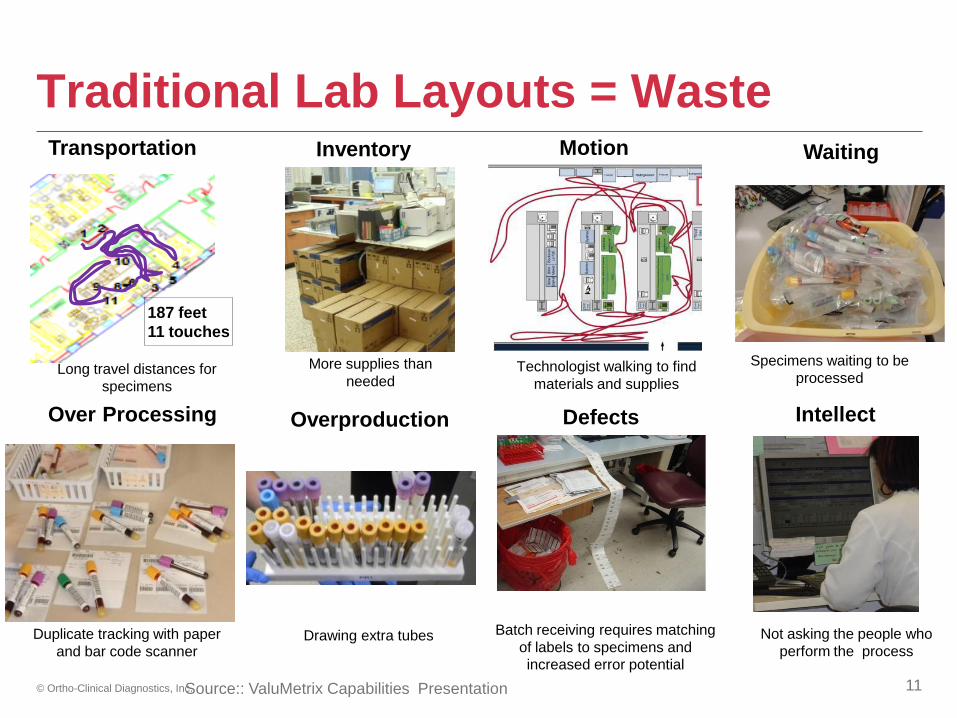
Traditional Lab Layouts = Waste
Not asking the people who
perform the process
Transportation Inventory Motion Waiting
187 feet
11 touches
Long travel distances for
specimens
More supplies than
needed Technologist walking to find
materials and supplies
Specimens waiting to be
processed
Over Processing Overproduction Defects Intellect
Duplicate tracking with paper
and bar code scanner Drawing extra tubes Batch receiving requires matching
of labels to specimens and
increased error potential
Source:: ValuMetrix Capabilities Presentation
12 © Ortho-Clinical Diagnostics, Inc.
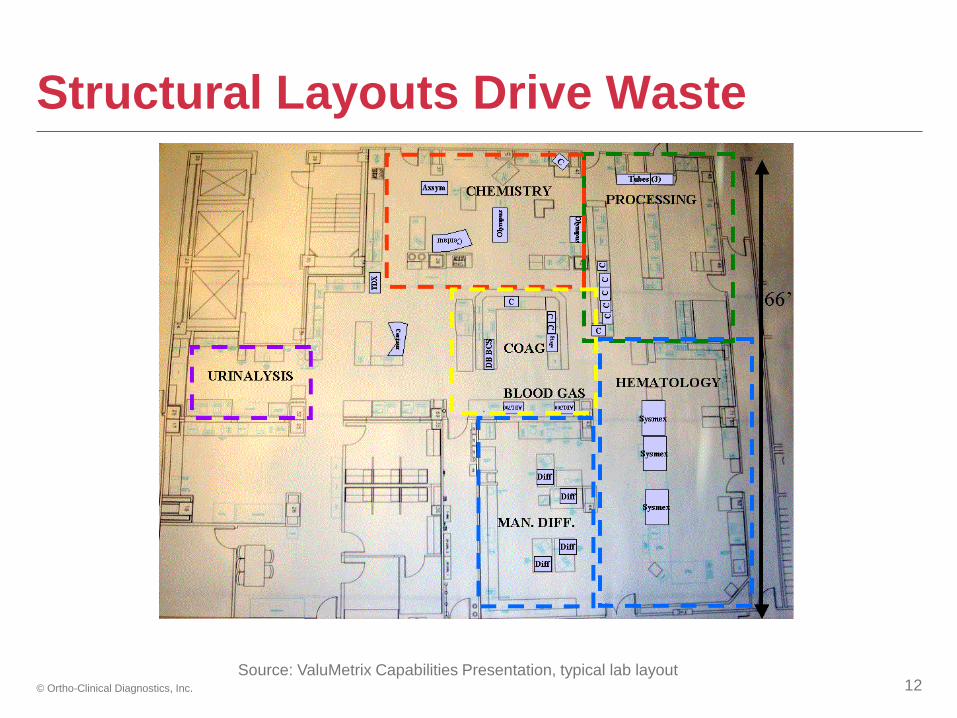
Structural Layouts Drive Waste
Source: ValuMetrix Capabilities Presentation, typical lab layout
13 © Ortho-Clinical Diagnostics, Inc.
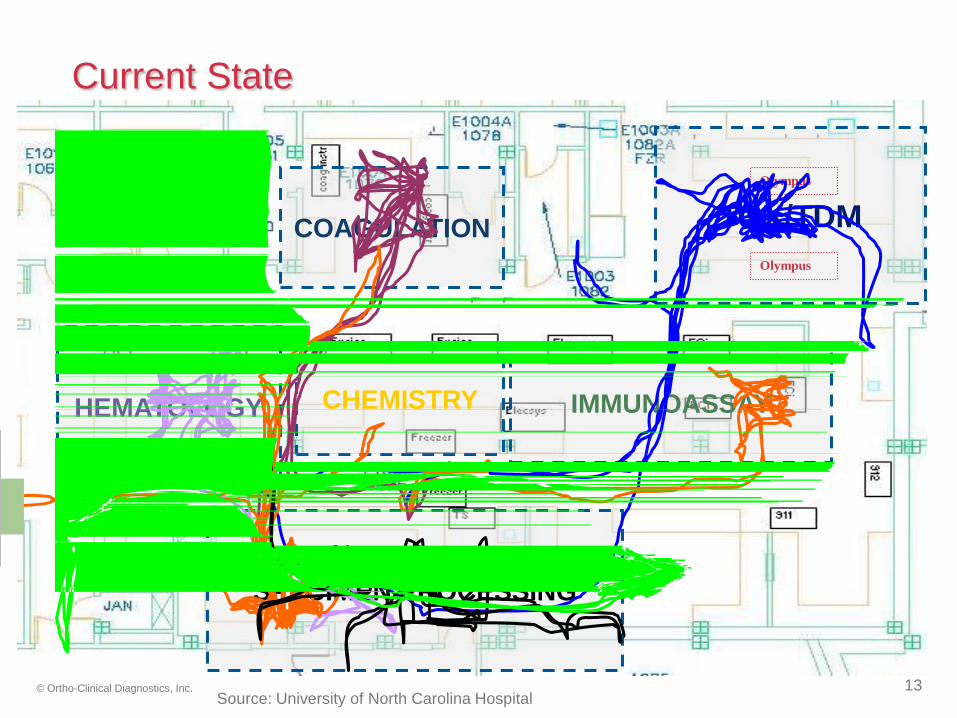
Current State
COAGULATION
CHEMISTRY IMMUNOASSAY HEMATOLOGY
TOX/TDM
SPECIMEN PROCESSING
Olympus
Olympus
Source: University of North Carolina Hospital
14 © Ortho-Clinical Diagnostics, Inc.
Current State of Lab Automation
What will it do for my lab?

15 © Ortho-Clinical Diagnostics, Inc.
Typical Goals of Automation Projects
Labor savings
Reduced manual operations
Service line expansion (with no new resources)
Error reduction
Instrument consolidation
Free resources for higher value opportunities
Be “modern” or keep pace with industry
16 © Ortho-Clinical Diagnostics, Inc.
Common Pitfalls of Automation Projects
Bottlenecks can be hard wired
– Sort and pick on front end
– Centrifugation – large batch and lock outs
– Sorting hematology can slow down chemistry
– Hard to flex staff and instruments if peak demand exceeds
automation capacity
Handling Exceptions
– Stats, short samples, peds neonates, interfering substances
– Coag – sample integrity while riding the track
17 © Ortho-Clinical Diagnostics, Inc.
Automation Footprint Options
Linear
Loop
Parallel Lines
18 © Ortho-Clinical Diagnostics, Inc.
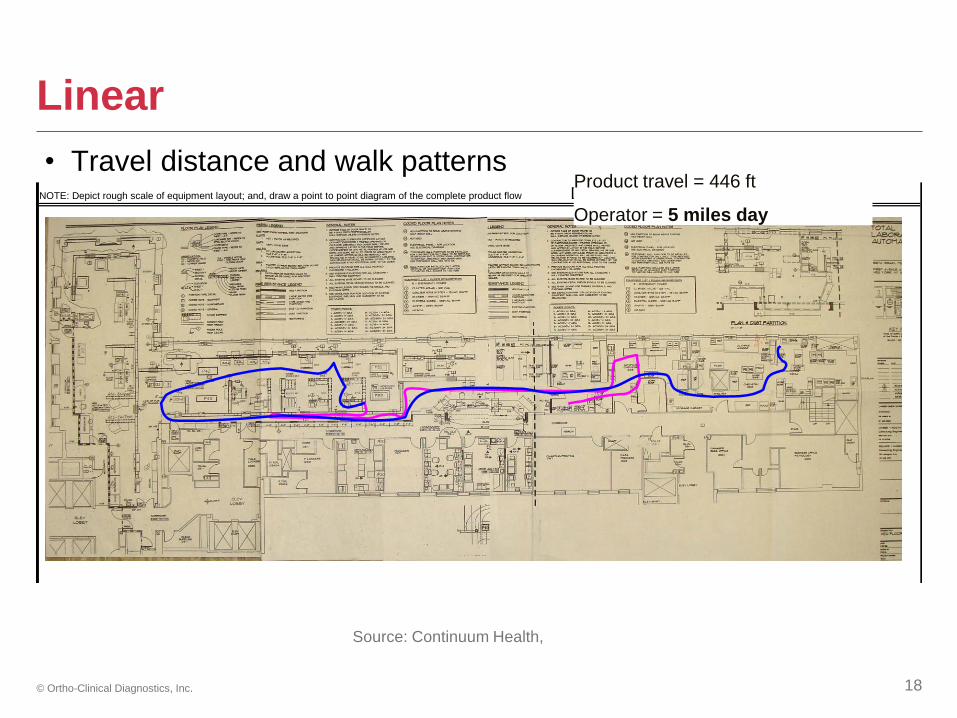
Linear
NOTE: Depict rough scale of equipment layout; and, draw a point to point diagram of the complete product flow Distance Traveled: 446 FEET
Source: Continuum Health,
Product travel = 446 ft
Operator = 5 miles day
• Travel distance and walk patterns
19 © Ortho-Clinical Diagnostics, Inc.
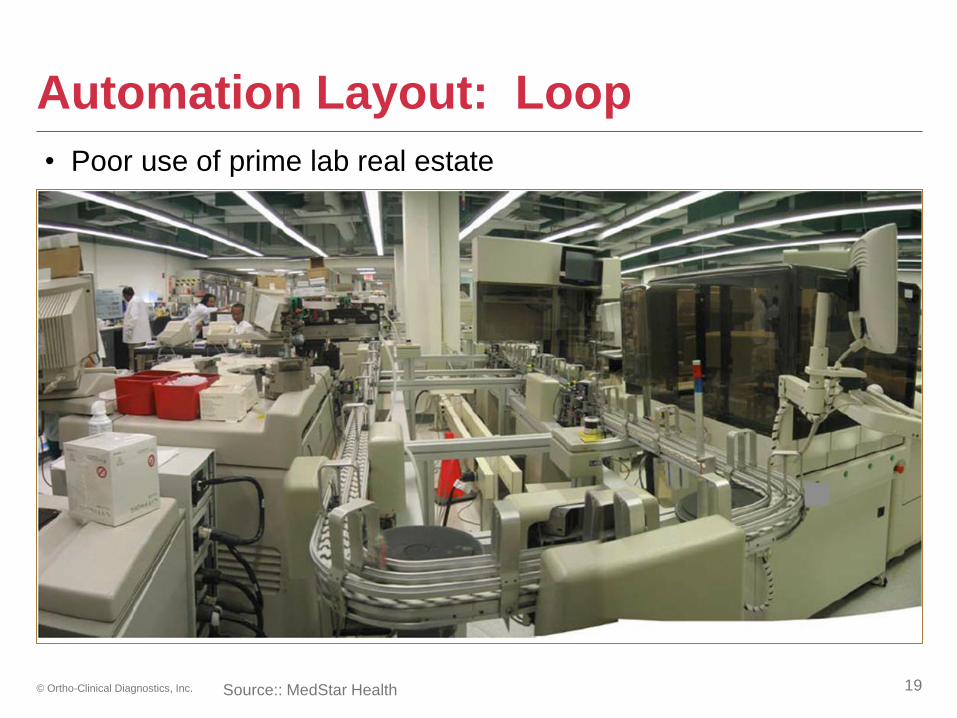
Automation Layout: Loop
• Poor use of prime lab real estate
Source:: MedStar Health
20 © Ortho-Clinical Diagnostics, Inc.
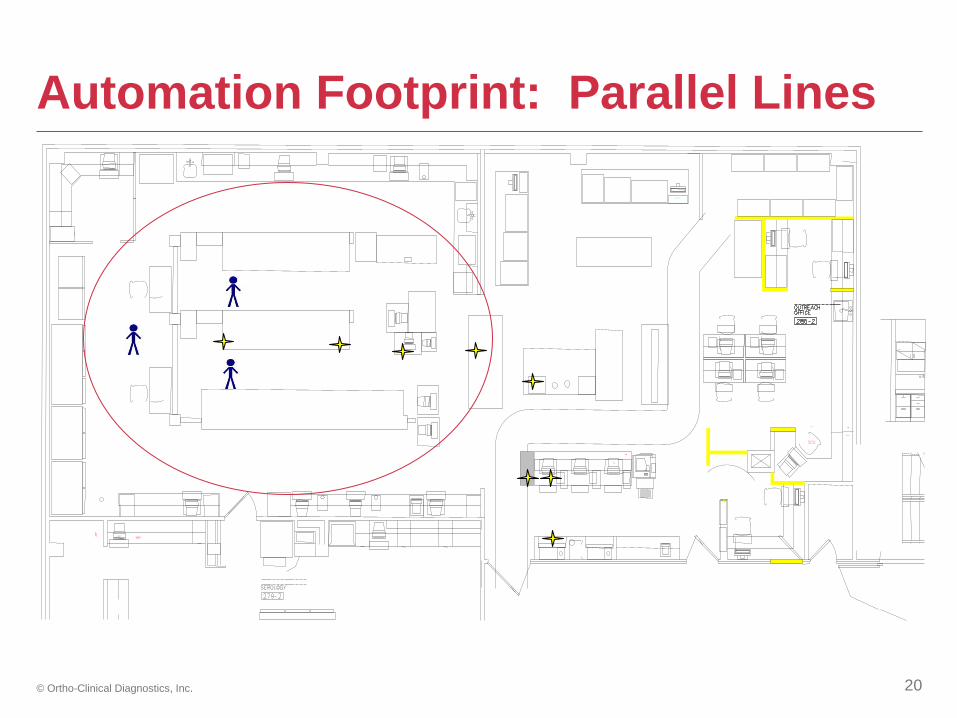
Automation Footprint: Parallel Lines
O U T R E A C H
F A C I L I T A T O R
3 6 H
3 6 H
3 0 H
P C
E D P T 4
D R
W
F I L
E
P R I N T E R A B O V E
F L A T P C
K A Y

21 © Ortho-Clinical Diagnostics, Inc.
Front End Options?
Voice of Customer
– Out-Patient / reference
– In-Patient Turn Around Time expectations
– Morning run – results on floor by what time?
– Expectations for stats?
Exception Handling
– Stats
– Short samples
– Peds
– Neonates
22 © Ortho-Clinical Diagnostics, Inc.
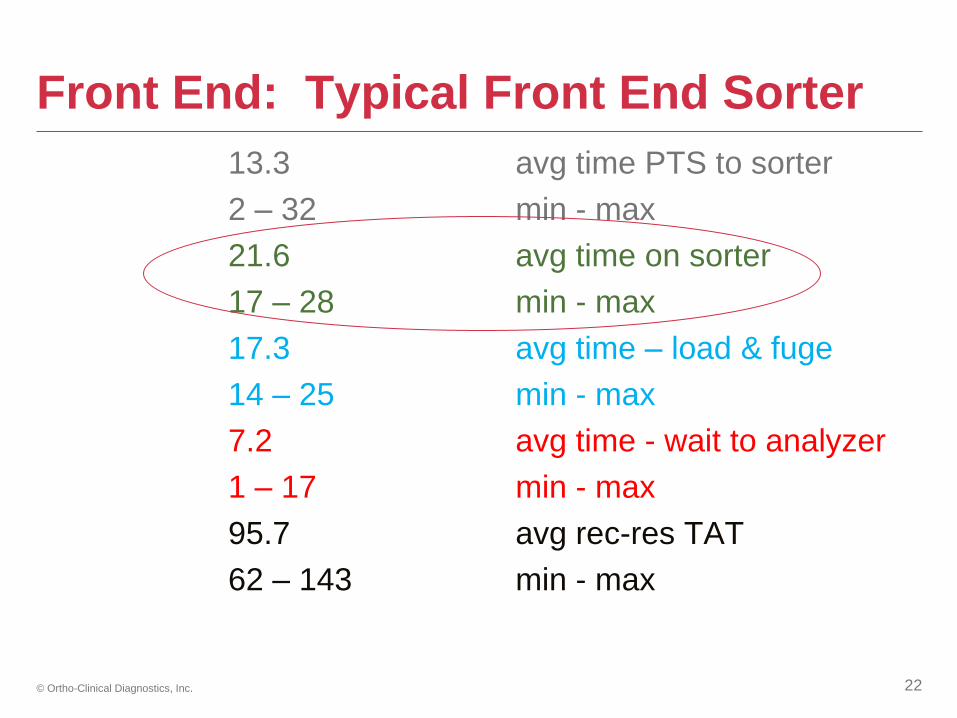
Front End: Typical Front End Sorter
13.3 avg time PTS to sorter
2 – 32 min - max
21.6 avg time on sorter
17 – 28 min - max
17.3 avg time – load & fuge
14 – 25 min - max
7.2 avg time - wait to analyzer
1 – 17 min - max
95.7 avg rec-res TAT
62 – 143 min - max
23 © Ortho-Clinical Diagnostics, Inc.
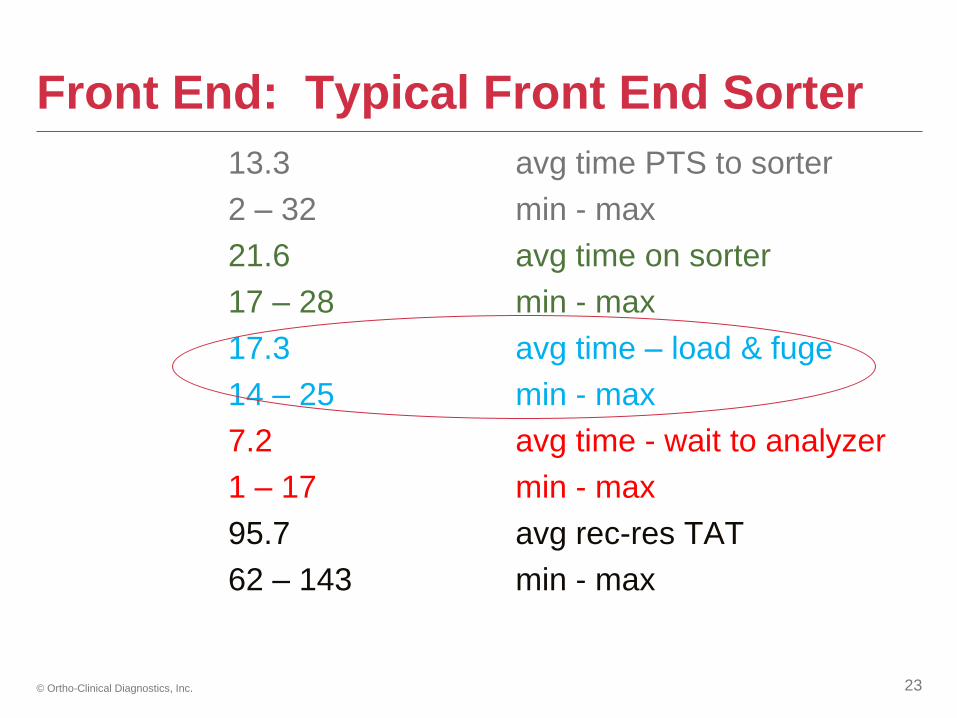
Front End: Typical Front End Sorter
13.3 avg time PTS to sorter
2 – 32 min - max
21.6 avg time on sorter
17 – 28 min - max
17.3 avg time – load & fuge
14 – 25 min - max
7.2 avg time - wait to analyzer
1 – 17 min - max
95.7 avg rec-res TAT
62 – 143 min - max
24 © Ortho-Clinical Diagnostics, Inc.
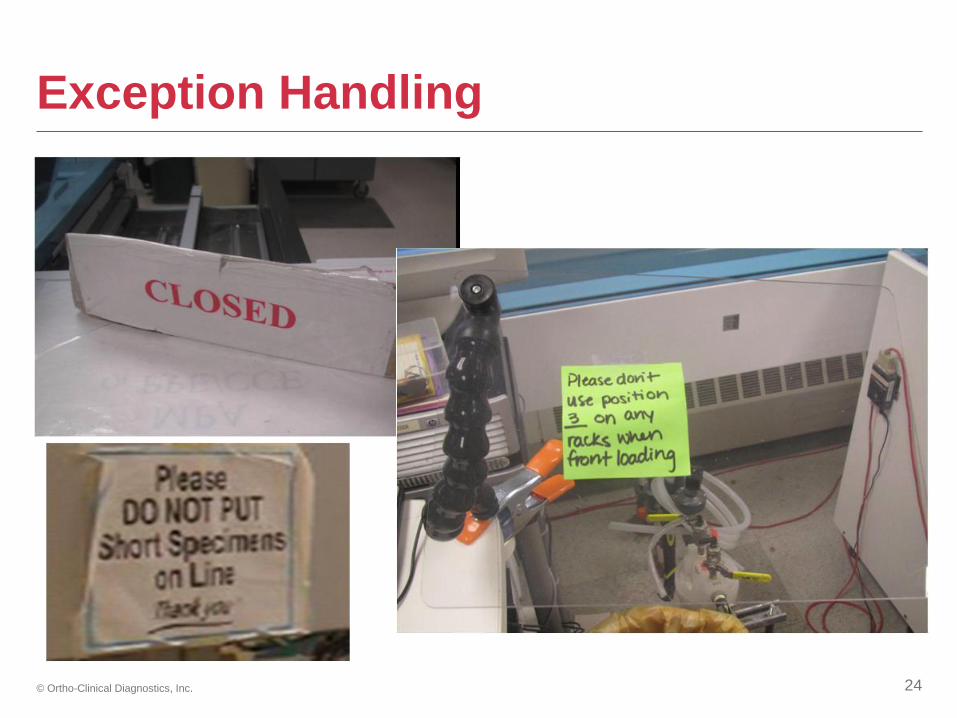
Exception Handling
25 © Ortho-Clinical Diagnostics, Inc.
Flow of Specimen and Operator
Some Common Barriers To Flow
26 © Ortho-Clinical Diagnostics, Inc.
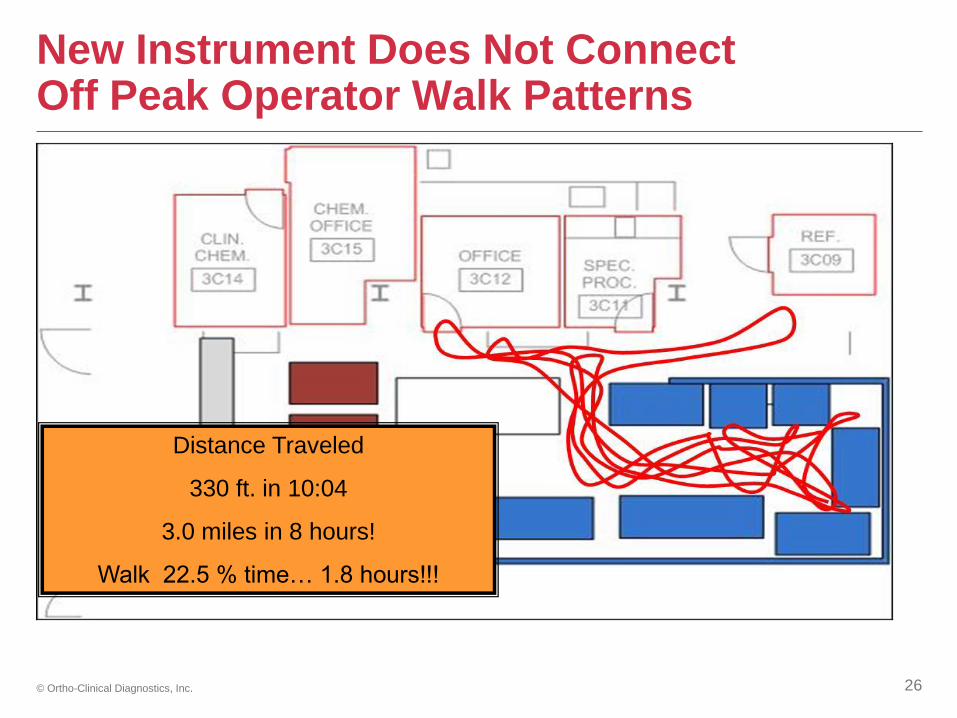
New Instrument Does Not Connect Off Peak Operator Walk Patterns
Distance Traveled
330 ft. in 10:04
3.0 miles in 8 hours!
Walk 22.5 % time… 1.8 hours!!!

27 © Ortho-Clinical Diagnostics, Inc.
Potential Hidden Costs of Footprint Designs Can’t meet customer demand?
– Redundant stat operations
– Ancillary labs
– POC testing
Flexibility
– Cost of change
– Adding menu or devices
– Product and operator flow during off peak times
Capital
– High capital investment
– On-going maintenance
– Floor space
Labor
– Job functions shift but no reduction

28 © Ortho-Clinical Diagnostics, Inc.
Layout is Critical
Rule 1:
– It is difficult or impossible to overcome a poor layout.
Rule 2:
– Focus on devices over work processes always adds time and
cost.
Rule 3:
– Cost of change can be significant and is frequently overlooked.
29 © Ortho-Clinical Diagnostics, Inc.
In-Cycle / Out-of-Cycle Work
In-Cycle Work – any specimen that flows through the layout
in a defined time without wait time, interruptions or human
intervention.
Out-of-Cycle Work – Any specimen that requires
intervention or that will compromise in-cycle production time.
30 © Ortho-Clinical Diagnostics, Inc.
Case Study
Marquette General Hospital
Marquette, MI
31 © Ortho-Clinical Diagnostics, Inc.
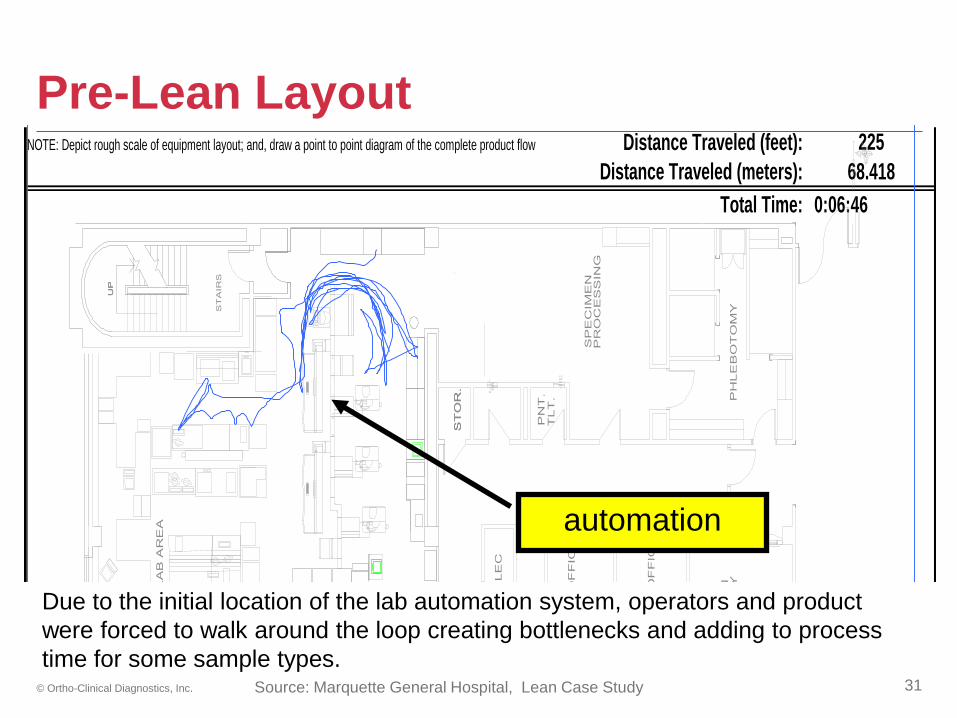
Pre-Lean Layout NOTE: Depict rough scale of equipment layout; and, draw a point to point diagram of the complete product flow Distance Traveled (feet):
Distance Traveled (meters):
Total Time: 0:06:46
68.418
225
0.00
0000
0000
0000
0
0.00
0000
0000
0000
0
ST
AIR
S
UP
UP
LA
BO
RA
TO
RY
CO
RE
LA
B A
RE
A
CO
RR
.
ST
OR
.B
LO
OD
BA
NK
OF
FIC
E
OF
FIC
E
EL
EC
ST
OR
.
TL
T.
PN
T.
OF
FIC
E
PH
LE
BO
TO
MY
SE
RV
ICE
SC
LIE
NT
SE
CR
ET
AR
YR
EC
EP
TIO
N
PR
OC
ES
SIN
GB
LO
OD
PR
OC
ES
SIN
GS
PE
CIM
EN
EL
EC
LIF
T B
ST
OR
.
Due to the initial location of the lab automation system, operators and product
were forced to walk around the loop creating bottlenecks and adding to process
time for some sample types.
automation
Source: Marquette General Hospital, Lean Case Study

32 © Ortho-Clinical Diagnostics, Inc.
New Design: Lean Core Cell Layout
UA
One operator to run 85% to 90% of ALL tests in
the Core Lab (not just chemistry tests)
Heme
Coag
Source: Marquette General Hospital, Lean Case Study
33 © Ortho-Clinical Diagnostics, Inc.
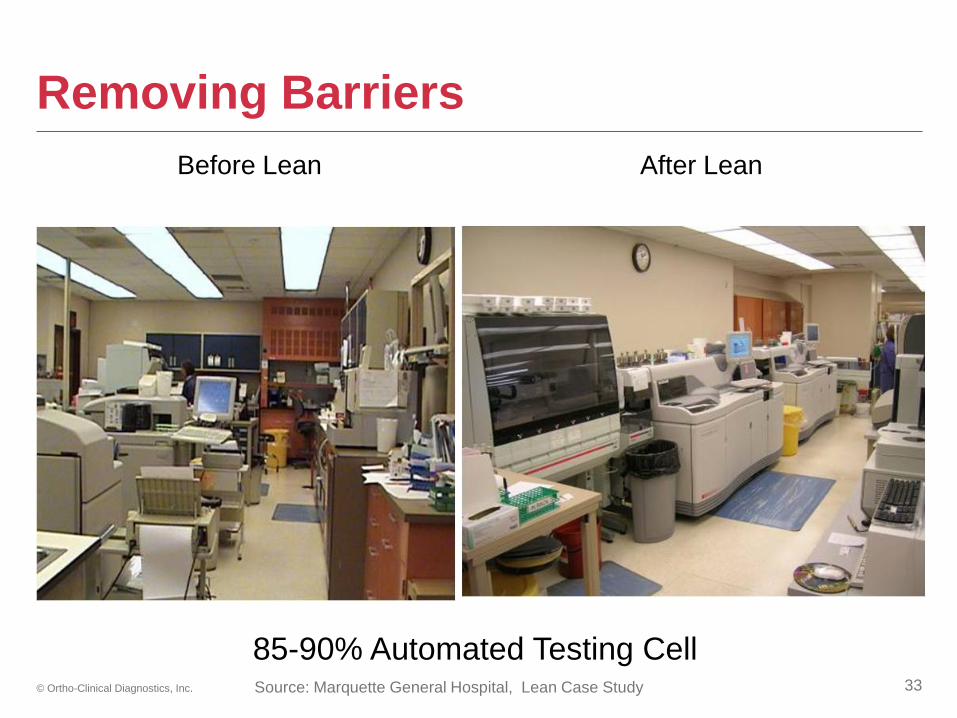
Removing Barriers
85-90% Automated Testing Cell
Before Lean After Lean
Source: Marquette General Hospital, Lean Case Study
34 © Ortho-Clinical Diagnostics, Inc.
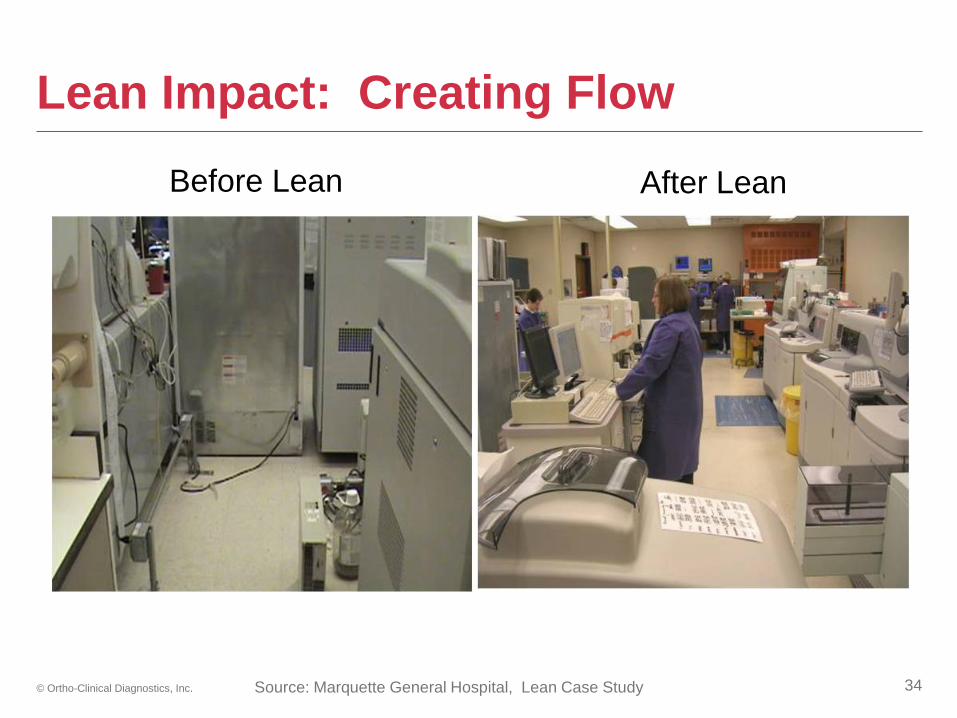
Lean Impact: Creating Flow
Before Lean After Lean
Source: Marquette General Hospital, Lean Case Study
35 © Ortho-Clinical Diagnostics, Inc.
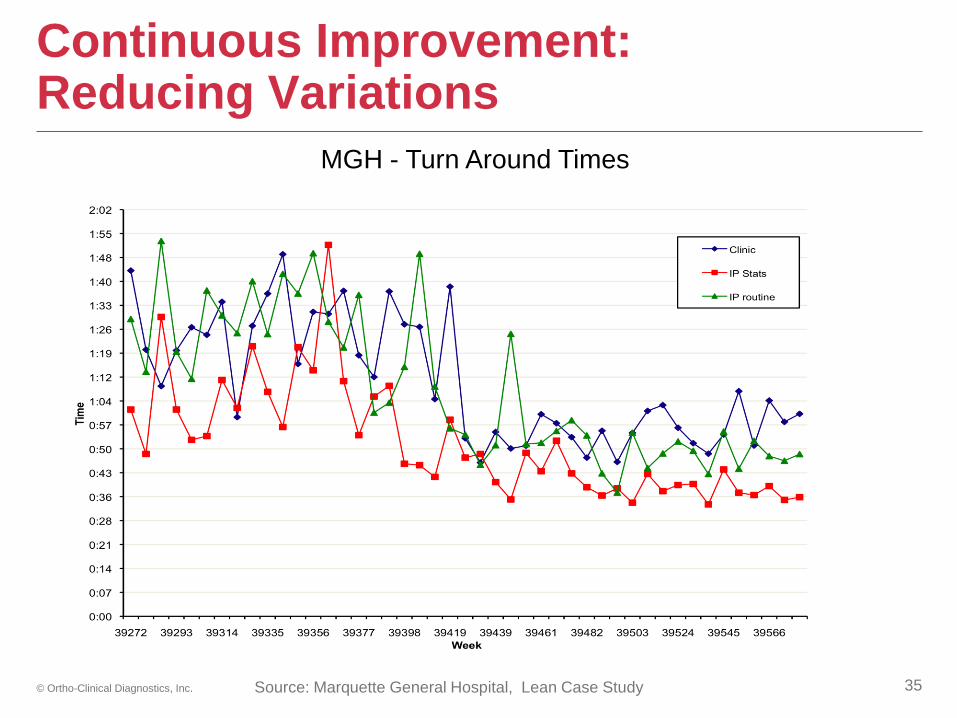
Continuous Improvement: Reducing Variations
MGH - Turn Around Times
Source: Marquette General Hospital, Lean Case Study
36 © Ortho-Clinical Diagnostics, Inc.
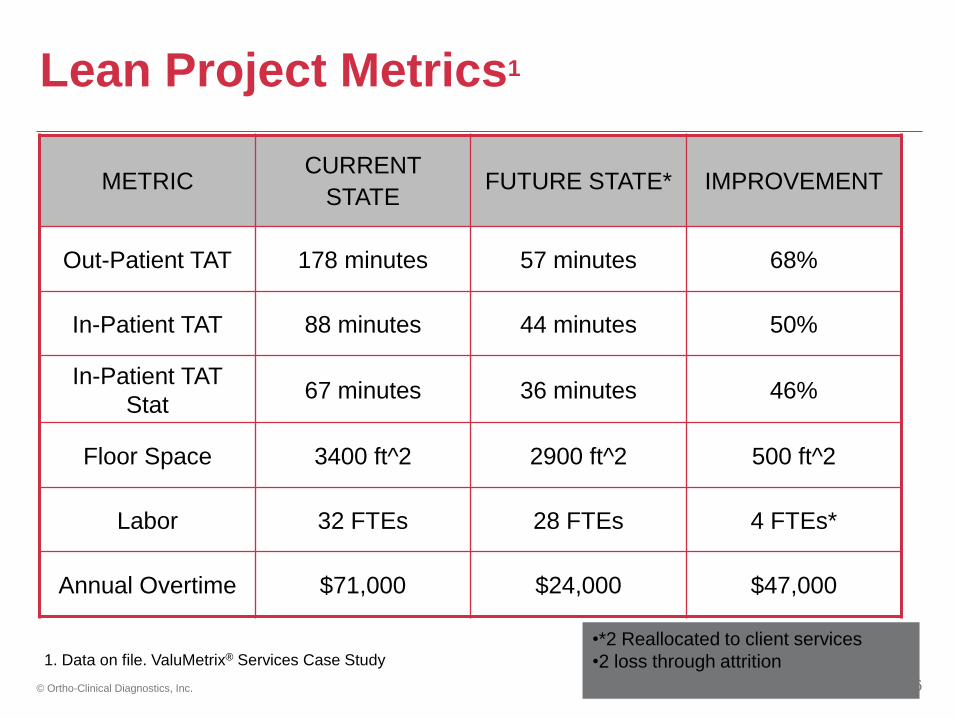
Lean Project Metrics1
•*2 Reallocated to client services
•2 loss through attrition
METRIC CURRENT
STATE FUTURE STATE* IMPROVEMENT
Out-Patient TAT 178 minutes 57 minutes 68%
In-Patient TAT 88 minutes 44 minutes 50%
In-Patient TAT
Stat 67 minutes 36 minutes 46%
Floor Space 3400 ft^2 2900 ft^2 500 ft^2
Labor 32 FTEs 28 FTEs 4 FTEs*
Annual Overtime $71,000 $24,000 $47,000
1. Data on file. ValuMetrix® Services Case Study
37 © Ortho-Clinical Diagnostics, Inc.
Operator and Product Flow
MGH Final videos\Operator Flow-YouTube sharing.mp4
MGH Final videos\Product FlowAPRIL25YouTube
sharing.mp4
38 © Ortho-Clinical Diagnostics, Inc.
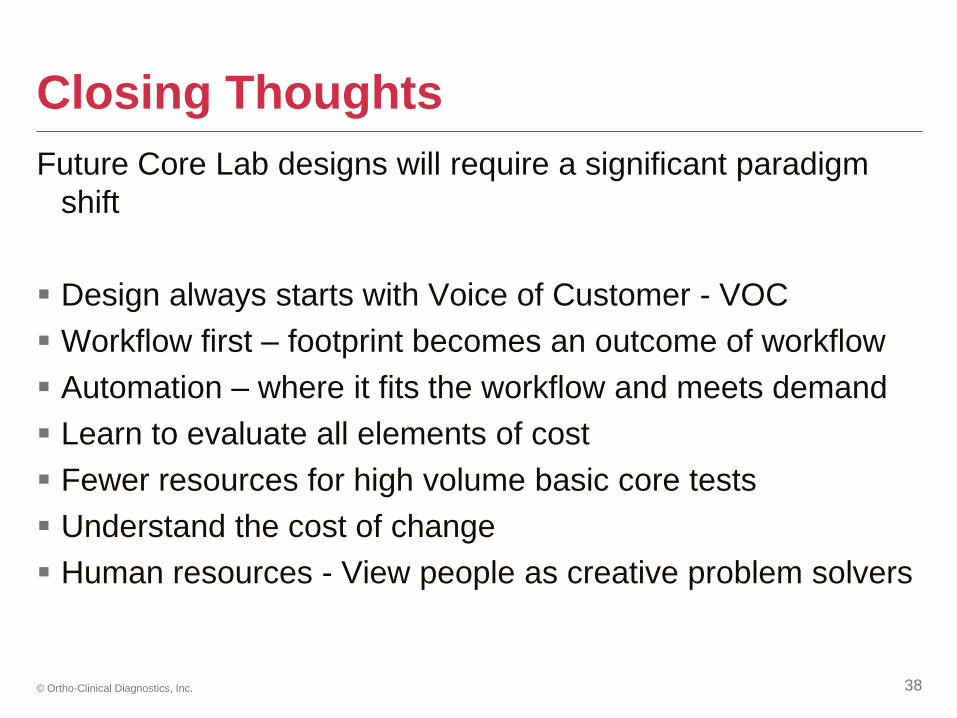
Closing Thoughts
Future Core Lab designs will require a significant paradigm
shift
Design always starts with Voice of Customer - VOC
Workflow first – footprint becomes an outcome of workflow
Automation – where it fits the workflow and meets demand
Learn to evaluate all elements of cost
Fewer resources for high volume basic core tests
Understand the cost of change
Human resources - View people as creative problem solvers
39 © Ortho-Clinical Diagnostics, Inc.
Thank You!