“bernie baumohl has written a must-read educational...
TRANSCRIPT


“Bernie Baumohl has written a must-read educational and reference book that every indi-vidual investor will find indispensable for watching, monitoring, and interpreting the mar-kets. The daily flow of high-frequency economic indicators is the stuff that makesfinancial markets move and that can signal the big trends that make or break investorportfolios. Most important, Bernie’s long experience in reporting economics for TimeMagazine helps make the ‘dismal science’ lively and interesting.”
—Allen Sinai, CEO and Chief Global Economist, Decision Economics, Inc.
“This is the most up-to-date guide to economic indicators and their importance to finan-cial markets in print. The coverage of less-reported indicators, especially those from non-government sources, is hard to find elsewhere. The inclusion of the actual publishedtables helps the newer student of the markets find the data in the public release. For any-one trying to follow the economic data, this should be next to your computer so that youcan understand and find the data on the Internet.”
—David Wyss, Former Chief Economist, Standard and Poor’s
“Bernie Baumohl has accomplished something of real value in The Secrets of EconomicIndicators. He has successfully demystified the world of financial and economic newsthat bombards us in our daily lives. Both professional investors and casual observers ofthe world of finance and economics will be grateful for what he has done. The constantstream of heretofore bewildering news from the world of business and finance can now beeasily understood. Every businessperson or investor should keep a copy of Baumohl’sbook close at hand as he or she catches up on the business, stock market, and economicevents of the day. It is great, at long last, to have someone who has eliminated what mayhave been so perplexing to so many and to have done so with such remarkable clarity.”
—Hugh Johnson, Chairman and Chief Investment Officer of Hugh Johnson Advisors
“Economic statistics, employment data, Federal Reserve surveys. Think they are boring?Think again! They can drive markets into a frenzy, causing billions of dollars to be madeor lost in an instant. Bernie Baumohl brilliantly, clearly, and, yes, entertainingly describeswhat every investor and business manager should know about economic indicators: whichones move markets, how to interpret them, and how to use them to spot and capitalize onfuture economic trends. The Secrets of Economic Indicators is an extraordinary andinsightful work—an enormously important contribution to the body of financial literature.Read it and then keep it on your desk. Consult it the next time you are deluged with aflurry of economic statistics. Your understanding certainly will be enhanced, and yourportfolio will likely be as well.”
—Robert Hormats, Former Vice Chairman, Goldman Sachs (International)

“If you want to make money investing, this is an essential trend-tracking tool that will helpget you to the bank. This book is the real deal. Bernard Baumohl miraculously breathes lifeinto deadly economic indicators and boring statistics…he knows what he’s talking about,and his expertise proves it.”
—Gerald Celente, Founder, The Trends Research Institute
“Baumohl has a gift for taking a complicated subject and allowing it to read like a fast-moving novel. My confidence in reading and understanding economic indicators as por-trayed in this book made me realize the possibilities this information holds for improving mypersonal net worth as well as navigating my business toward higher profits. I recommendthis book if you care about your future finances.”
—Morris E. Lasky, CEO, Lodging Unlimited, Inc.; has managed and consulted on morethan $7 billion in problem hotel assets; Chairman, Lodging Conference; Chairman,International Hotel Conference
“I find Baumohl’s writing fascinating. In addition to the famous indicators, he includes manythat I hadn’t heard of. I really appreciate that he tells you exactly where to find each indica-tor on the Web. Just about anyone who’s serious about understanding which way the econ-omy is headed will want to read this book. It could be a classic.”
—Harry Domash, Columnist for MSN Money and Publisher, Winning Investing Newsletter
“I think this is an excellent book. It’s well written, accessible to a variety of readers, dealswith an interesting and important subject, and covers the topic well. It deserves to get a lot ofnotice and use.”
—D. Quinn Mills, Alfred J. Weatherhead, Jr., Professor Emeritus, Harvard Business School

ECONOMICINDICATORS
THE SECRETS OF

This page intentionally left blank

ECONOMICINDICATORS
THIRD EDITION
THE SECRETS OF
Hidden Clues to Future Economic Trends and Investment Opportunities
BERNARD BAUMOHL

Vice President, Publisher: Tim MooreAssociate Publisher and Director of Marketing: Amy NeidlingerExecutive Editor: Jim BoydEditorial Assistant: Pamela BolandOperations Manager: Jodi KemperMarketing Manager: Megan GraueCover Designer: Alan ClementsManaging Editor: Kristy HartProject Editor: Betsy HarrisCopy Editor: Cheri ClarkProofreader: Kathy RuizIndexer: Larry SweazyCompositor: Nonie RatcliffManufacturing Buyer: Dan Uhrig
© 2013 by Pearson Education, Inc.Publishing as FT PressUpper Saddle River, New Jersey 07458
This book is sold with the understanding that neither the author nor the publisher is engaged in rendering legal,accounting, or other professional services or advice by publishing this book. Each individual situation is unique.Thus, if legal or financial advice or other expert assistance is required in a specific situation, the services of acompetent professional should be sought to ensure that the situation has been evaluated carefully and appropri-ately. The author and the publisher disclaim any liability, loss, or risk resulting directly or indirectly, from theuse or application of any of the contents of this book.
FT Press offers excellent discounts on this book when ordered in quantity for bulk purchases or special sales. For moreinformation, please contact U.S. Corporate and Government Sales, 1-800-382-3419, [email protected] sales outside the U.S., please contact International Sales at [email protected].
Company and product names mentioned herein are the trademarks or registered trademarks of their respective owners.
All rights reserved. No part of this book may be reproduced, in any form or by any means, without permission in writ-ing from the publisher.
Printed in the United States of America
First Printing July 2012
ISBN-10: 0-13-293207-5ISBN-13: 978-0-13-293207-3
Pearson Education LTD.Pearson Education Australia PTY, LimitedPearson Education Singapore, Pte. Ltd.Pearson Education Asia, Ltd.Pearson Education Canada, Ltd.Pearson Educatión de Mexico, S.A. de C.V.Pearson Education—JapanPearson Education Malaysia, Pte. Ltd.
Library of Congress Cataloging-in-Publication Data
Baumohl, Bernard.The secrets of economic indicators : hidden clues to future economic trends and investment opportunities / Bernard
Baumohl. — 3rd ed.p. cm.
ISBN 978-0-13-293207-3 (pbk. : alk. paper) 1. Economic forecasting. 2. Economic indicators. 3. Business forecast-ing. I. Title.
HB3730.B38 2012330.01’12—dc23
2012018000

To my mother, Eva Baumohl, a Holocaust survivor; and in memory of my father, Naftali Baumohl

This page intentionally left blank

ix
Contents
What’s New in the Third Edition? . . . . . . . . . . . . . . . . . . . . . xvii
Preface . . . . . . . . . . . . . . . . . . . . . . . . . . . . . . . . . . . . . . . . . . xxi
C H A P T E R 1 The Lock-Up . . . . . . . . . . . . . . . . . . . . . . . . . . . . . . . . . . . . . . . 1U.S. Economic Indicators . . . . . . . . . . . . . . . . . . . . . . . . . . . . . .6International Economic Indicators . . . . . . . . . . . . . . . . . . . . . . .14
C H A P T E R 2 A Beginner’s Guide: Understanding the Lingo . . . . . . . . . . 19Annual Rates . . . . . . . . . . . . . . . . . . . . . . . . . . . . . . . . . . . . . . .19Business Cycle . . . . . . . . . . . . . . . . . . . . . . . . . . . . . . . . . . . . . .20Consensus Surveys . . . . . . . . . . . . . . . . . . . . . . . . . . . . . . . . . . .22Moving Average . . . . . . . . . . . . . . . . . . . . . . . . . . . . . . . . . . . . .23Nominal Dollars Versus Real Dollars (Also Known as Current
Dollars Versus Constant Dollars) . . . . . . . . . . . . . . . . . . . . .24Revisions and Benchmarks . . . . . . . . . . . . . . . . . . . . . . . . . . . .24Seasonal Adjustments . . . . . . . . . . . . . . . . . . . . . . . . . . . . . . . .25The Great Recession of 2008–2009 . . . . . . . . . . . . . . . . . . . . . .27
C H A P T E R 3 The Most Influential U.S. Economic Indicators . . . . . . . . . . 31
EmploymentEmployment Situation . . . . . . . . . . . . . . . . . . . . . . . . . . . . . . . .31Job Openings and Labor Turnover . . . . . . . . . . . . . . . . . . . . . . .49Weekly Claims for Unemployment Insurance . . . . . . . . . . . . . .55Help-Wanted Online Advertising . . . . . . . . . . . . . . . . . . . . . . . .59Corporate Layoff and Hiring Announcements . . . . . . . . . . . . . .64Mass Layoff Statistics (MLS) . . . . . . . . . . . . . . . . . . . . . . . . . .70ADP National Employment Report . . . . . . . . . . . . . . . . . . . . . .75
Consumer Spending and ConfidencePersonal Income and Spending . . . . . . . . . . . . . . . . . . . . . . . . .82Retail Sales . . . . . . . . . . . . . . . . . . . . . . . . . . . . . . . . . . . . . . . . .93E-Commerce Retail Sales . . . . . . . . . . . . . . . . . . . . . . . . . . . . .99Weekly Chain Store Sales Reports . . . . . . . . . . . . . . . . . . . . . .102Consumer Credit Outstanding . . . . . . . . . . . . . . . . . . . . . . . . .107Consumer Confidence Index . . . . . . . . . . . . . . . . . . . . . . . . . .112Survey of Consumer Sentiment . . . . . . . . . . . . . . . . . . . . . . . .117Bloomberg Consumer Comfort Index . . . . . . . . . . . . . . . . . . .120

Contentsx
Google Insights . . . . . . . . . . . . . . . . . . . . . . . . . . . . . . . . . . . .123Las Vegas Gaming Revenues . . . . . . . . . . . . . . . . . . . . . . . . . .126
National Output and InventoriesGross Domestic Product (GDP) . . . . . . . . . . . . . . . . . . . . . . . .130Durable Goods Orders . . . . . . . . . . . . . . . . . . . . . . . . . . . . . . .148Factory Orders . . . . . . . . . . . . . . . . . . . . . . . . . . . . . . . . . . . . .155Business Inventories . . . . . . . . . . . . . . . . . . . . . . . . . . . . . . . . .162Industrial Production and Capacity Utilization . . . . . . . . . . . .170Institute for Supply Management (ISM)
Manufacturing Survey . . . . . . . . . . . . . . . . . . . . . . . . . . . . .181Institute for Supply Management (ISM) Non-Manufacturing
Business Survey . . . . . . . . . . . . . . . . . . . . . . . . . . . . . . . . .188Chicago Purchasing Managers Index (Business Barometer) . .191Index of Leading Economic Indicators (LEI) . . . . . . . . . . . . .196
Housing and ConstructionHousing Starts and Building Permits . . . . . . . . . . . . . . . . . . . .204Existing Home Sales . . . . . . . . . . . . . . . . . . . . . . . . . . . . . . . .210New Home Sales . . . . . . . . . . . . . . . . . . . . . . . . . . . . . . . . . . .217Housing Market Index: National Association of Home
Builders (NAHB) . . . . . . . . . . . . . . . . . . . . . . . . . . . . . . . .223Weekly Mortgage Applications Survey and the National
Delinquency Survey . . . . . . . . . . . . . . . . . . . . . . . . . . . . . .227Construction Spending . . . . . . . . . . . . . . . . . . . . . . . . . . . . . . .232
The Federal ReserveRegional Federal Reserve Bank Reports . . . . . . . . . . . . . . . . .235Federal Reserve Bank of New York: Empire State
Manufacturing Survey . . . . . . . . . . . . . . . . . . . . . . . . . . . . .236Federal Reserve Bank of Philadelphia: Business
Outlook Survey . . . . . . . . . . . . . . . . . . . . . . . . . . . . . . . . . .242Federal Reserve Bank of Kansas City: Manufacturing
Survey of the 10th District . . . . . . . . . . . . . . . . . . . . . . . . .246Federal Reserve Bank of Richmond: Manufacturing
Activity in the Fifth District . . . . . . . . . . . . . . . . . . . . . . . .249Federal Reserve Bank of Chicago: National Activity Index
(CFNAI) . . . . . . . . . . . . . . . . . . . . . . . . . . . . . . . . . . . . . . .252The Federal Reserve Board’s Beige Book . . . . . . . . . . . . . . . .255The Federal Open Market Committee Statement . . . . . . . . . . .260
Foreign TradeInternational Trade in Goods and Services . . . . . . . . . . . . . . .269Current Account Balance (U.S. International Transactions) . .283

Contents
Assets and Liabilities of Commercial Banks in the United States (Federal Reserve Board) . . . . . . . . . . . . . . . .291
Treasury International Capital (TIC) System . . . . . . . . . . . . . .296
Prices, Productivity, and WagesConsumer Price Index (CPI) . . . . . . . . . . . . . . . . . . . . . . . . . .305Producer Price Index (PPI) . . . . . . . . . . . . . . . . . . . . . . . . . . . .317Employment Cost Index . . . . . . . . . . . . . . . . . . . . . . . . . . . . . .323Import and Export Prices . . . . . . . . . . . . . . . . . . . . . . . . . . . . .328Productivity and Costs . . . . . . . . . . . . . . . . . . . . . . . . . . . . . . .335Employer Costs for Employee Compensation . . . . . . . . . . . . .342Real Earnings . . . . . . . . . . . . . . . . . . . . . . . . . . . . . . . . . . . . . .346Yield Curve . . . . . . . . . . . . . . . . . . . . . . . . . . . . . . . . . . . . . . .349
Other Noteworthy U.S. Economic IndicatorsCredit Manager’s Index . . . . . . . . . . . . . . . . . . . . . . . . . . . . . .355Small Business Economic Trends . . . . . . . . . . . . . . . . . . . . . .356Cass Freight Index . . . . . . . . . . . . . . . . . . . . . . . . . . . . . . . . . .357Weekly Railroad Traffic (freight) . . . . . . . . . . . . . . . . . . . . . . .358Architecture Billings Index . . . . . . . . . . . . . . . . . . . . . . . . . . .359S&P/Case-Shiller U.S. National Home Price Index . . . . . . . .360
C H A P T E R 4 International Economic Indicators: Why Are They SoImportant? . . . . . . . . . . . . . . . . . . . . . . . . . . . . . . . . . . . . . . . 361
German Industrial Production . . . . . . . . . . . . . . . . . . . . . . . . .364German IFO Business Climate Index . . . . . . . . . . . . . . . . . . .366German Consumer Price Index (CPI) . . . . . . . . . . . . . . . . . . .368ZEW Indicator of Economic Sentiment . . . . . . . . . . . . . . . . . .371Japan Industrial Production . . . . . . . . . . . . . . . . . . . . . . . . . . .373Japan’s Tankan Survey . . . . . . . . . . . . . . . . . . . . . . . . . . . . . . .378Manufacturing Purchasing Managers Index (PMI)
by Country and Region . . . . . . . . . . . . . . . . . . . . . . . . . . . .384OECD Composite Leading Indicators (CLI) . . . . . . . . . . . . . .393China Industrial Production . . . . . . . . . . . . . . . . . . . . . . . . . . .396India: Industrial Production and Inflation . . . . . . . . . . . . . . . .403Brazil’s Industrial Production and the
IBC-Br Economic Activity Index . . . . . . . . . . . . . . . . . . . .410Canada: International Merchandise Trade, Composite
Leading Indicators, Ivey Purchasing Managers Index . . . .416Australia: Consumer Prices, Retail Trade,
International Trade . . . . . . . . . . . . . . . . . . . . . . . . . . . . . . .422
xi

Contents
C H A P T E R 5 Best Web Sites for U.S. Economic Indicators . . . . . . . . . . 429Schedule of Releases . . . . . . . . . . . . . . . . . . . . . . . . . . . . . . . .429Economic News . . . . . . . . . . . . . . . . . . . . . . . . . . . . . . . . . . . .429Free Mobile Phone Apps on the Economy . . . . . . . . . . . . . . .429The U.S. Economy . . . . . . . . . . . . . . . . . . . . . . . . . . . . . . . . . .430Consumer Behavior . . . . . . . . . . . . . . . . . . . . . . . . . . . . . . . . .431Employment Conditions . . . . . . . . . . . . . . . . . . . . . . . . . . . . . .432Home Sales and Construction Activity . . . . . . . . . . . . . . . . . .433International Trade . . . . . . . . . . . . . . . . . . . . . . . . . . . . . . . . . .433Inflation Pressures . . . . . . . . . . . . . . . . . . . . . . . . . . . . . . . . . .434Federal Reserve Reports . . . . . . . . . . . . . . . . . . . . . . . . . . . . .434The Federal Budget . . . . . . . . . . . . . . . . . . . . . . . . . . . . . . . . .435Interest Rates . . . . . . . . . . . . . . . . . . . . . . . . . . . . . . . . . . . . . .435Money and Credit . . . . . . . . . . . . . . . . . . . . . . . . . . . . . . . . . . .436U.S. Dollar . . . . . . . . . . . . . . . . . . . . . . . . . . . . . . . . . . . . . . . .436One-Stop Shopping for Economic Statistics . . . . . . . . . . . . . .436Other Useful Economic Sources on the Web . . . . . . . . . . . . . .437Unconventional Economic Indicators . . . . . . . . . . . . . . . . . . .437
C H A P T E R 6 Best Web Sites for International Economic Indicators . . . 439Calendar of Releases for Foreign Economic Data . . . . . . . . . .439Sources of Global Economic News . . . . . . . . . . . . . . . . . . . . .439Economic Statistics from Other Countries . . . . . . . . . . . . . . . .439Best Megasites for International Economic Statistics . . . . . . .444
Index . . . . . . . . . . . . . . . . . . . . . . . . . . . . . . . . . . . . . . . . . . . 447
xii

xiii
Acknowledgments
One gratification that comes with completing a book is that I now get a chance to thank thosewhom I relied on for advice, contacts, and support along the way. To be sure, there are manypeople to thank—so many, in fact, that mentioning all their names would greatly lengthen thisbook. Still, there are some who deserve special mention because they were so giving of theirtime and their counsel.
I must begin by breaking with tradition. It is customary in these pages to reserve thankingyour family until the end. However, that order makes little sense to me in this case. My familydeserves top billing here because I relied on their support the most these past two years. Fromday one I expropriated a room in our home and turned it into an impassable maze of docu-ments, newspapers, and boxes. Indeed, we can no longer recall the color of the carpet under-neath. Moreover, during the past two years, when I was writing or traveling, the burden ofoverseeing family and household matters fell largely on my wife, Debbie. She was the one whogot our three girls off to school every morning, prepared their lunches, helped with their home-work, chauffeured them to playdates, met with teachers, accompanied them to doctor checkups,got them ready for bed, paid the bills, and so much more. Without a doubt, this book would nothave been possible without her support and love. Nor will I ever forget how my daughters,Ashley, Rachel, and Nicole, tried to help me in the first days by printing “Do not disturb” signsand taping them outside my door. From beginning to end, my family provided the best homeenvironment for me to carry out this project, and for that I will always be grateful.
I am also indebted to Carolina Buia (writer and television journalist) and Marc Lieberman(NYU economics professor). Both listened to my concept for this book and read its initial treat-ment, and opened some very important doors to the publishing world. I also benefited greatlyfrom the experience and wisdom of others, including Adam Cohen (the New York Times),Jordan Goodman (personal finance author), Dan Kadlec (TIME), Jeffrey Liebenson (KMZRosenman), Larry Moran (Bureau of Economic Analysis, Commerce Department), MichaelPanzner (HSBC Securities), David Skidmore (Federal Reserve Board), Sue Hensley and GarySteinberg (Department of Labor), Sam Slater (Fidelity International), Chris Williamson(Markit), Joel Prakken and Ben Herzon (Macroeconomic Advisers, LLC), Douglas Offer (ADP,Inc.), James Pedderson (Challenger, Gray & Christmas), Frank Streshley (Nevada GamingControl Board) Caroline Zimmerman (National Association of Credit Management), NellCallahan (Association of American Railroads), and Frank Cirimele (Cass InformationSystems).
There are two people I’d like to name who were not involved in the preparation of thisbook, but were nevertheless enormously important to me because I learned so much from themabout economic journalism. They are Bill Saporito, TIME’s exceptionally gifted business editor,and the late George Church (TIME and the Wall Street Journal), who was a brilliant writer on

Acknowledgments
all topics, but none more so than on economics. I view the work of both of them as the bench-mark in excellent writing and editing.
Finally, one of the luckiest things to have happened to me was to work with Jim Boyd, myeditor at Pearson Education. As with the first and second editions, Jim made the process oforchestrating this third edition so much easier with his intelligent guidance and sense of humor.It has always been a privilege working with him. I am also deeply indebted to Betsy Harris, theproject editor at Pearson Education, who supervised the production of this rather complicatedthird edition with great skill and prodigious patience.
Let me make one last note. Though I made every effort to make sure this book is accurate, Ialone am responsible for any follies that might have slipped through.
xiv

xv
About the Author
Bernard Baumohl, Chief Global Economist at The Economic Outlook Group, overseesits forecasts of economic trends and geopolitical risks. He also conducts seminars on howcorporate leaders and investors can use forward-looking economic indicators to stayahead of the business cycle. He has lectured on economics at New York University, DukeUniversity, and the New York Institute of Finance.
Baumohl was also an award-winning TIME magazine economics reporter who cov-ered Wall Street, the Federal Reserve, and the White House. As an economist forEuropean American Bank, he conducted research on the global economy. He also servedas an analyst with the Council on Foreign Relations. Baumohl has a Master’s degree ininternational affairs and economics from Columbia University.

This page intentionally left blank

xvii
What’s New in the Third Edition?
When it comes to spicing up a subject like economic indicators, no one described it morecolorfully than the late Business Professor Aaron Levenstein: “Statistics are like a bikini.What they reveal is suggestive, but what they conceal is vital.”
That intriguing analogy sums up fairly well the challenge of this book. From thebeginning, I had two goals in mind. The first is to make readers more comfortable work-ing with economic indicators. Why are they important to follow? Where can they befound on the Internet? And how can these barometers on the economy improve thedecision-making process for investors and business leaders? The second objective is tofind out what they conceal about the future. How does one uncover the hidden clues inthese weekly and monthly reports that give us fresh insights on the outlook for consumerand business spending, jobs, inflation, and interest rates?
Both goals have been the primary mission of this book. While this mission hasalways been clear, the task of keeping a book on economic indicators properly updatedand useful has proven to be a daunting task. Just look at what has transpired in just thepast few years. The U.S. economy suffered the most devastating recession since the GreatDepression. Overseas, the spotlight has shifted to Europe, where a sovereign debt crisishas gripped the region and even threatens to affect many other economies outside thatcontinent. Then there is China, the second-largest economy, which is having growingpains of its own, worrying many nations that depend on the Chinese market. Equallystunning is that many long-held beliefs by economists and investors either have beenditched or are being viewed with fresh skepticism. For instance, many people now ques-tion the safety of holding foreign government bonds, the wisdom of owning a home as asecure investment, and even the effectiveness of monetary policy by the Federal Reserve.It is absolutely remarkable how much has changed since the second edition of this book.
Adding yet another layer of complexity has been the cascade of geopolitical shocksthat have lately erupted across North Africa, the Middle East, and parts of Asia. Worriesabout disruptions in oil supplies, U.S. military engagements in the Persian Gulf, and ter-rorists acquiring weapons of mass destruction seem to play a larger role in the dialogueabout the economic outlook.
All this upheaval has immensely complicated both forecasting and policymaking.American business leaders, for example, are moving much more cautiously when itcomes to hiring workers or giving the green light to major capital spending projects.Investors, faced with an unstable global financial and political environment, continue totoil over how to protect their money, or the funds of their clients—yet still earn a reason-able return. Policymakers in Washington are struggling more than ever to come up withnew strategies that would promote faster growth without planting the seeds of a new crisisdown the road, like inflation or another crippling debt mess.
What’s New in the Third Edition?
The one constant throughout this turmoil has been the role of economic indicators.These metrics continue to serve as critical optics that tell us how the economy is perform-ing and even where it is likely heading. But to keep those optics polished and precisedemands constant fine-tuning too. Some of the metrics noted in earlier editions no longerexist. Others have undergone changes in methodology that should improve their predic-tive value. Finally, several promising new economic indicators have been introduced inthis edition that I believe warrant the attention of readers. The criteria they all must meetis simple: Do these indicators help business managers, investors, and policymakers betterunderstand the economic outlook?
In addition, some key changes were made in Chapter 2 on the nature of the businesscycle itself and how it can affect the price of commodities, stocks, and bonds during anupswing and downswing. Though much has been said on the events that led up to the2008–09 Great Recession, I added my own brief history of how that calamity unfolded.
Several new indicators were introduced in Chapter 3. We start with the hot topic ofthe U.S. job market by adding releases such as the Job Openings and Labor Turnover(JOLT) report, a revamped Help-Wanted Online Advertising publication by theConference Board, and weekly reports from the Federal Reserve of bank loans to con-sumers and businesses, and even introduced some novel ways to gauge consumer confi-dence like tracking Las Vegas Gaming Revenues. Other new indicators focus on howbusy trucks and railroads are carrying goods around the country. I have also highlighted apromising metric from the folks at Google, called Google Insights.
Chapter 4 deals with the international economy, and it has been expanded. A numberof indicators underwent revisions, and I have also highlighted several new foreign eco-nomic measures. Both Chapters 5 and 6 were totally revisited to make sure that all Websites are valid and to also insert new ones—including a list of free cellphone apps nowavailable that help you monitor the latest economic news and indicators wherever you are.
As for the charts displayed in this edition, you will see they refer to different years.That’s because I chose not to redo those charts that appear essentially the same. Onlythose charts that were substantially reconfigured, by either the government or tradegroups, were replaced for this edition. So at times you will see tables with years thatappear current next to others that are several years old. Remember, the point of thesecharts is to familiarize readers with how the data is presented in these economic reports.That familiarity will come in handy when readers go online to examine the very latestrelease.
Finally, I have to end by sharing a deep concern with readers. As pressure builds onWashington to cut government spending, there is a growing danger that the agencies whoproduce so many vital economic indicators (such as Bureau of Labor Statistics, Bureau ofEconomic Analysis, and the Census department) will be in the cross hairs of budget cut-ters. Any action that deprives these agencies of the resources they need to properly collectinformation on the economy is foolhardy and will ultimately backfire. When CEOs andinvestors have a better grasp of the economic outlook, the decision-making process
xviii

What’s New in the Third Edition?
becomes more productive and there are typically fewer miscalculations. That, in turn,paves the way for a stronger, more sustainable period of economic growth. However, anyattempt to slash the budgets of the statistical agencies risks undermining the integrity ofeconomic indicators, and that will weaken their value. In that case everyone loses—con-sumers, investors, business managers, and ultimately policymakers in Washington, too.The benefit of having access to the best set of economic statistics in the world easily out-weighs the cost savings the government may achieve. One can only hope that wisdomprevails where all agree that detailed and accurate federal economic statistics areabsolutely indispensable to the proper function and growth of the U.S. economy.
Bernard BaumohlMay 2012Princeton, New Jersey
xix

This page intentionally left blank

Preface
“You want to write a book about what? Economic indicators? How did you come upwith this death wish?”
That was the first response I got after telling a colleague at TIME what I was up to.She, too, was a financial journalist, so I expected some sage advice and support. We con-tinued our conversation over lunch. “Did I hear you correctly?” she asked, still incredu-lous. “We are talking about your writing a book on economic statistics, right?” Yes, Inodded, and then went on to explain why this idea had been percolating in my mind formonths. I knew it was a tough topic to write about, but I was ready to take it on. She lis-tened patiently to my reasoning and then let loose a barrage of suggestions.
“First, let’s get real here. To make this work, a book on economic indicators has to besexy. Edgy. Really funny. Get in some lurid details about consumer prices. Tell some las-civious tales about industrial production and capacity utilization. Toss in lots of jokes ondurable goods orders. Then there’s the humor that just springs at you when writing aboutforeign trade and non-farm productivity. And…hey, shouldn’t you be taking notes on allthis?”
The appetite I came to the restaurant with was suddenly gone. Not because she waspoking fun at the idea. Just the opposite. Beneath all that sarcasm was a genuine messagethat I knew had to be taken seriously. The subject of economic indicators can be lethallyboring because of its impenetrable jargon and reliance on tedious statistics. I realizedfrom that brutal lunch encounter that my biggest challenge in writing this book was notsimply to identify and describe the world’s most influential economic indicators, but tomake the whole subject approachable and even—dare I say it—interesting. My purposefrom the start was to reach out to those who had little or no experience navigating themaze of key economic statistics and to dispel the notion that you need an economicsdegree, an MBA, or a CPA to understand what these indicators tell us about the economyand how we can use them to make better investment and business decisions.
The broader question, of course, is why do this book at all? Why should anyone out-side the economics profession even care about economic indicators? Why is it importantfor the ordinary person to know how many new homes are under construction, whetherfactories produced more or fewer goods in the latest month, or whether executivescharged with buying raw material for their companies are increasing their orders or cut-ting back? Why bother with any of this stuff? Why not let the experts sort out the mish-mash of economic numbers and tell us what it means?
Indeed, most Americans have little desire to follow such esoteric measures. They arecontent to rely on the insights of their investment advisers or hear television pundits museendlessly about the economy and the financial markets. Other than that, few show interest

in probing any further. However, that attitude changed abruptly after Americans con-fronted two bone-chilling shocks in the first years of the new century. The first was thecollapse of the dot.com bubble in 2000, which happened after individual investors andprofessional money managers made a mad rush to acquire Internet-related stocks—eventhough most of these companies never earned a single penny. That lemming-like stam-pede into technology and software equities catapulted prices to unsupportable levels,which eventually set the stage for a severe implosion in stock market values that resultedin $2 trillion in losses.
But it was the second shock that became truly historic in the devastation it wroughtworldwide. The 2008–09 recession brought the U.S. and international economy to itsknees. It was triggered by a voracious addiction to leverage and aggravated by the flawednotion that real estate values will always move in one direction: up. The reckless use debtand blind worship of real estate eventually so mutilated the workings of the economy thatthey produced a horrific crash that rivaled the Great Depression. (A brief outline on theevents that led to the “Great Recession of 2008–09” can be found at the end of Chapter 2,“A Beginner’s Guide: Understanding the Lingo.”)
The two shocks traumatized many Americans. Investors were sickened and angeredby the resulting loss of tens of trillions of dollars in personal wealth. It made no differ-ence whether the money was in one’s personal savings, a 401(k), a pension, or real estate,like a home. No investment escaped unscathed. The decimation was universal, and forAmericans it became a painful and sobering reminder of just how much one’s financialwell-being is staked to the risky business of stocks, bonds, and property.
Perhaps the most troubling revelation to come out of this awful experience was howutterly dependent ordinary investors had allowed themselves to become on so-called“experts” for virtually all investment advice. It turned out that these very “experts”—portfolio managers and longtime professional market watchers—failed miserably in theirresponsibility to help protect the assets and curb the losses of their investing clients.Worse still, investors became justifiably furious when they realized they were also beinglied to by some of the companies they had invested in and even by the brokerage firmswith whom they had entrusted their hard-earned money.
The result was predictable. Disillusioned by the ineffectual advice of their brokers,the seemingly endless revelations of corporate fraud, Ponzi schemes, and the biasedresearch reports put out by some well-known Wall Street firms, a growing number ofAmericans have since decided to venture into the investment world by themselves, trust-ing their own instincts rather than someone else’s. These investors are emboldened by thefact that they can now instantaneously access a mind-boggling assortment of informationresources from home and work, day or night. The profusion of laptops, tablets, smart-phones, and Wi-Fi pockets means they can even access financial and economic newswhile sunning on a remote island beach. In addition, Americans now have more invest-ment vehicles to choose from. They can buy individual stocks or purchase an Exchange
xxii Preface
Traded Fund (ETF), which allows anyone to buy a basket of U.S. or international stocks,much like a mutual fund, except that they have the right to sell them anytime, which can-not be done easily with a mutual fund. The popularity of ETFs has exploded in recentyears because they give investors extraordinary flexibility (with access to stocks, bonds,currencies, futures, and commodities) and come with lower fees. How do the economicindicators fit into all this? Why should investors—or business executives, entrepreneurs,and ordinary workers—pay particular attention to these reports? Because they are thevital barometers that tell us what the economy is up to and, more important, in whatdirection it is likely to go in the future. These indicators describe the economic backdropthat will ultimately affect corporate earnings, interest rates, and inflation. They can alsoinfluence the future cost of financing a car or house, the security of our jobs, and ouroverall standard of living. Even business leaders are under pressure to monitor economicindicators more closely. Knowledge of economic conditions in the U.S. enables CEOs tomake decisions with greater confidence about whether to buy more equipment, increaseinventories, hire workers, or raise fresh capital. In addition, for firms competing in theglobal marketplace, international economic indicators are of particular importance,because they allow executives to assess business opportunities abroad.
But how do you begin to evaluate these economic reports? There is such a bewilder-ing variety of economic statistics in the public domain that following them all can beharmful to your health. New sets of economic numbers come out every day, week, month,and quarter, and they often tell conflicting stories about what’s going on in the U.S. Inaddition, stocks, bonds, and currencies react differently to economic indicators. Someeconomic news can cause tremors in the financial markets, while other news produces noreaction at all. Many indicators have no forecasting value whatsoever, yet others haveestablished an impressive track record of being able to predict how the economy willbehave during the next 12 months.
Moreover, different indicators originate from different sources. The U.S. governmentpumps out loads of economic data through agencies such as the Commerce Department’sBureau of Economic Analysis and the Federal Reserve Board. However, numerous pri-vate groups also release market-moving indicators. One of the best known is theConference Board, known for its Consumer Confidence and Leading Economic Indi-cators series. In addition, the National Association of Realtors reports monthly data onexisting home sales, and Challenger, Gray & Christmas, the outplacement firm, tallies thenumber of announced corporate layoffs and hiring plans each month. Note that thesesources gauge just U.S. economic activity. When you look at the assortment of economicindicators released by other countries, the quantity of information available becomesmind-numbing.
Clearly there is too much economic information out there, and not all of it is useful.So what do you focus on? How does an investor, a CEO, or even an economist decidewhich of the many gauges of business activity are worth tracking? Which indicators packthe greatest wallop in the financial markets? Which ones are known for doing the best job
xxiiiPreface
of predicting where the economy is heading? These are the key questions I try to answerin this book.
The book is organized in a way that I believe makes the most sense for you. Chapter1, “The Lock-Up,” begins with the drama that typically surrounds the release of a sensi-tive economic indicator. After the embargo is lifted and the economic report flashesacross computer screens around the world, reaction to the latest news by global moneymarkets can affect the financial well-being of every American.
One cannot successfully write a book on economic indicators without at least gentlyintroducing a few basic economic terms. In Chapter 2, “A Beginner’s Guide:Understanding the Lingo,” I try to define as painlessly as possible those key phrases andconcepts that are essential to know when reading about economic indicators. The chapterends with a brief account of what led to the calamitous 2008–2009 recession.
The essence of the book begins with Chapter 3, “The Most Influential U.S.Economic Indicators.” Here, all the major U.S. economic indicators are evaluated, andeach one is discussed in a format designed to answer these vital questions:
• Why is this indicator important to know?• How is it computed? (Sure, not everyone will want to get into the nitty-gritty
details of how economic indicators are put together. Nevertheless, by understand-ing the underlying methodology of how they are calculated, one is better able toappreciate the usefulness of these indicators, as well as their shortcomings.)
• What does the economic indicator have to say about the future? The purpose of thisquestion is twofold. First, you are shown how to interpret the official report and itsaccompanying tables. Particular emphasis is placed on the most interesting anduseful data points in the economic release. Second, guidance is given on how tolocate valuable clues in the tables that might offer you a heads up on how the econ-omy might perform in the months ahead. To make this task easier, copies of actualreleases are included with most indicators covered in this book. Virtually all theeconomic releases mentioned are available on the Internet free. You can read themon their respective Web sites or download the releases as PDF files. (Note thatInternet addresses for the economic indicators are included in this book.)
• How might bonds, stocks, and the dollar react to the latest economic reports? Thefinancial markets often respond differently to economic data. Much depends on thespecific indicator released, how timely it is, whether investors are surprised by thenews, and what else is going on in the economy at the time.
Chapter 4, “International Economic Indicators: Why Are They So Important?” exam-ines the most influential foreign economic indicators. Because the U.S. economy and itsfinancial markets are closely integrated with the rest of the world, one can no longerafford to ignore measures of economic activity in other countries. If the economies ofother nations are growing, they’ll buy more from U.S. producers. On the other hand, poor
xxiv Preface

growth abroad bodes ill for many large U.S. companies and their employees. In addition,American investors interested in buying foreign stocks and bonds for their own portfoliosshould track foreign economic indicators to identify those countries and regions in theworld that might offer the most attractive returns.
Chapter 5, “Best Web Sites for U.S. Economic Indicators,” is evidence of how muchtimes have changed. Not too long ago, anyone interested in obtaining a set of current andhistorical economic statistics had to purchase them from a private number-crunchingfirm. The more stats you wanted, the more costly it was. Today, nearly all this data can beaccessed instantly on the Internet, free! The democratization of economic statistics giveseveryone, from the experienced professional to the weekend investor, the opportunity todownload, read, and analyze economic information. In this chapter, I’ve assembled what Ithink are among the best and most authoritative Web sites for economic data. You willalso find a list of cellphone apps that can keep you informed of the latest economicreports no matter where you are. Again, all are free, though some might ask users to reg-ister.
Chapter 6, “Best Web Sites for International Economic Indicators,” is a compilationof Web sites that enables you to quickly locate foreign economic data that might other-wise be tough to find. However, there’s one important caveat to keep in mind: No countrycollects and disseminates as much high-quality economic information as the U.S. Itsbreadth and integrity make it the gold standard in the world. Although there is a vastamount of international economic data on the Web, one has to approach such sourceswith caution. There are issues concerning language (many are not in English), compre-hensiveness, accuracy, and timeliness. In this chapter, I’ve listed sites on the Internet thatin my judgment are the most comprehensive international economic databases—and thatare available in English! Once again, every site listed is free (at least at the time of thiswriting).
Finally, let me close by saying that this book is not meant to be a textbook or someintellectual treatise on the economy. My purpose throughout is to help give you a betterunderstanding of how to look at economic indicators, why they can be so influential, whatthey might tell us about the future, and how people can best utilize all that information. IfI have accomplished this in some way, then it was worth all the swearing and tempertantrums I went through every time my computer crashed in the course of this endeavor.
xxvPreface

This page intentionally left blank

C H A P T E R 1
The Lock-Up
Shortly after dawn on most weekday mornings, a strange ritual takes place inWashington, D.C. Two dozen select men and women leave their homes, grab their news-papers, and rush off to spend part of the day under virtual house arrest. Yes, housearrest—as in incarceration. Precisely where they go to be confined can vary from day today. It could be in a dilapidated government building one morning and a high-tech officecomplex the next. Regardless of the location, what occurs in all these places is alwaysthe same. They enter a strict, prison-like setting where contact with the outside world iscut off.
One Friday morning, this same group climbs a long set of steps to the side entranceof a sleek, white-stone building on 3rd Avenue and C Street in the heart of the nation’scapital. Armed guards greet them at the entrance for a security check; from this point on,everyone has to wear their ID tags at all times. The visitors proceed across a lobby anddown a quiet, narrow corridor, eventually stopping in front of a locked, heavy woodendoor. A government official awaits them and quickly opens the door to reveal a drab, win-dowless, L-shaped room 40 feet long and some 10 feet across. It is empty except for twodozen plain-looking orange-and-chrome chairs, each resting alongside a row of narrowcubicle-like desks. A digital clock high on the wall breaks time down to seconds. It is7:30:15 a.m., and already 12 people have found their way into the “lock-up” room. Moreare expected within the next 15 minutes. All who enter dutifully sign their names on aspecial sheet.
Despite the room’s austere appearance, there is an atmosphere of calm in the room,at least for now. Some visitors talk excitedly about the previous night’s televised basket-ball game. Others are either chatting on cellphones or checking for messages. A few keepto themselves by catching up on the morning paper or downing a quick muffin and coffee.Everyone in the room, however, makes a point of always knowing the time, with somepeople eyeing the digital clock so frequently that their actions might be mistaken fornervous tics.
As the time approaches 8 a.m., there is a palpable change in mood. Gone now are thesounds of light conversation; these sounds are replaced by the din of laptops firing up.Everyone appears to be focused on what is about to occur.

At 7:55 a.m. sharp, a government official walks in and picks up a wall phone to callthe Naval Observatory, home to the Vice President of the United States. It is also the loca-tion of the ultra-accurate atomic clock. She listens intently for a few seconds and thenabruptly hangs up without saying a word. The individual then inserts a key into a lock onthe wall, which allows her to adjust the digital clock to the precise second. With the cor-rect time now set, the official then turns around to make a terse announcement.
“Please turn off all cellphones and other communication devices, and disconnectlaptops from your telephone lines.”
To make sure everyone complies, the official walks across the room and eyes eachdesk. Meanwhile, a second federal employee arrives, carrying copies of a highly sensitivegovernment report. Each one is placed facedown on an empty desk.
Then it begins.At precisely 8 a.m., the door to the lock-up room clicks shut. From this point on, all
those inside are out of touch with the rest of the world. No one is permitted to leave. Nocalls or messages can come into or go out of the room. Security is tight. A guard standsby outside, ready to use force if anyone attempts to sneak out.
What secret is the government protecting? Is the CIA about to begin a classifiedbriefing on intelligence activities? Are Congressional investigators huddling to hear thenewest terrorist threat? No. All these precautions are taken for one reason: The govern-ment is about to release numbers. Statistics. More precisely, economic statistics. The visi-tors in the room are business reporters representing news organizations from around theworld, and this morning they’re working out of the Department of Labor’s secure press-room.
Why such tight secrecy? Because in the next few seconds, these journalists will bethe first to lay their eyes on one of the country’s most sensitive economic measures—themonthly report on employment conditions. It can shed fresh light on whether the U.S.economy is growing or facing a slowdown. Did the number of Americans who have jobsrise or fall in the latest month? Have hourly wages gone up, or did they drop? Did peoplework more hours or fewer? These statistics might not seem particularly earthshaking tomost Americans, but they can and do whip the global stock, bond, and currency marketsinto a frenzy. For individual investors and professional money managers, the informationin the jobs report can mean the difference between a winning and a losing portfolio. Italso explains the need for the security measures. Individuals getting such hot figuresahead of time can make a quick bundle of money, because they know something aboutwhich no one else in the financial markets is yet aware. To prevent such abuses, the gov-ernment guards these and dozens of other key economic indicators as tightly as a militarybase. It also implements a carefully controlled procedure to disseminate sensitive eco-nomic news.
8:00:00 The instant the door is shut, reporters dive in to grab the latest release onemployment conditions, which up to now has been facedown. They have just 30 minutes
2 Chapter 1 • The Lock-Up

to read, digest, and write their stories on how the job market changed during the previousmonth. Most of the journalists arrived that morning with the expectation that the employ-ment release would carry dismal economic news, with the number of people without jobsrising—a troubling sign that the economy was weakening. At least that was the opinionof most professional forecasters whom these reporters had consulted just days earlier.
But on this particular morning, the employment report stuns everyone. Those in thelock-up room read with amazement that companies actually hired workers in far greaternumbers than anyone expected. Moreover, other figures in the report appear to corrobo-rate signs that the economy is doing quite well. Wages are rising, and factory overtime isincreasing. Far from slowing, the latest evidence indicates that the economy is actuallypicking up steam. It is astounding news of which the rest of the world is yet unaware.
As the digital clock continues its silent countdown, reporters working on the storysuddenly face some urgent questions. What’s really happening in the economy? Whywere so many “experts” caught off guard? What does this mean for future inflation andinterest rates? How might the stock, bond, and currency markets react to the news?
Though the latest jobs report was unexpected, these journalists are not completelyunprepared. As is their routine, a day or two earlier they showered private economistswith questions that covered various hypothetical employment scenarios: What does itmean if the job market worsens? What if it actually improves? Now the reporters are fran-tically searching through their interview notes to help them file their stories.
8:28:00 A Labor Department worker in the lock-up room notifies televisionreporters that they can now leave under escort to prepare for their live 8:30 broadcast ofthe jobs report.
For the remaining journalists in the room, there is just a brief warning: “Two minutesleft!” By now, most have pieced together their initial versions of the story—the headline,the opening sentences, key numbers, and the implications for the economy. All that’s leftare some last-minute fact-checking and a word tweak here and there.
8:29:00 “One minute. You can open your telephone lines—BUT DO NOT TRANSMIT!”
The level of tension is not just high in the lock-up room. At that moment, moneymanagers and traders in New York, Chicago, Tokyo, Hong Kong, London, Paris, andFrankfurt are riveted to their computer screens, anxiously waiting for the release of thecrucial jobs report. It’s a stomach-churning time for them because investment decisionsthat involve hundreds of billions of dollars will be made the instant the latest employmentnews flashes across their monitors. Why such worldwide interest in how jobs fare inAmerica? For one thing, many foreign investors own U.S. stocks and bonds, and theirvalues can rise or fall based on what the job report says. Second, the international econ-omy is now so tightly interconnected that a weak or strong jobs report in the U.S. candirectly impact business activity in other countries. If joblessness in America climbs, con-sumers will likely purchase fewer cars from Germany, wine from France, and clothing
3Chapter 1 • The Lock-Up

from Indonesia. In contrast, a jump in employment means households will have moreincome to spend on imports, and this can stimulate foreign economies.
8:29:30 “Thirty seconds!” The fingers of reporters hover over their computers’Send button, ready to dispatch the latest employment news to the world. On-air reportersare also prepared to deliver the news live.
8:29:50 An official counts the final seconds out loud:“Ten…nine…eight…seven…six…five…four…three…two…one!”8:30:00 “Transmit!” Reporters simultaneously hit the Send button on their key-
boards. In seconds, electronic news carriers, including Bloomberg, AP, Reuters, andJapan’s Kyodo News, release their stories. Television and cable news stations, such asCNBC, Bloomberg TV, CNN, and MSNBC, broadcast the report live. A second or twolater, computer screens around the globe carry the first surprising words: “Jobs unexpect-edly rose the previous month, with the unemployment rate falling instead of rising!”
For journalists in the lock-up room, the stress-filled half-hour grind is over, and theyare now free to leave. But the work has just begun for those in the investment community.
At the Chicago Board of Trade (CBOT), where U.S. Treasury bonds and notes aretraded, news of the strong job growth sparks pandemonium. Bond traders were so surethey would see a deterioration in the job market that many had bet millions on such anoutcome. These traders bought bonds for clients prior to the government’s release onunemployment and expected to earn a quick bundle of money based on the followingstrategy: If the number of people employed fell, it would drag down consumer spending.That, in turn, would slow the economy, reduce inflation pressures, and cause bond pricesto turn up and interest rates to fall, thereby guaranteeing traders an easy profit.
The strategy was sound, but they bet on the wrong horse. Instead of laying off work-ers, companies were substantially adding to their workforce. The economy was not slow-ing, but demonstrating remarkable strength, and those bond traders who had hoped tomake a fast buck for their customers now face losing lots of money. With more peoplegetting jobs, household income increases, and that leads to greater spending and borrow-ing. The presence of a more robust economy heightens concerns about future inflationand rising interest rates. The result: Bond prices begin tumbling and interest rates startclimbing. To cut their losses, hundreds of floor traders at the CBOT are now screaming,jumping up and down, flailing hand signals in a desperate attempt to rid themselves ofbonds whose values are fast eroding.
Stock investors are also dazed by the news and jump into action. A drop in unem-ployment is bullish for the economy. More consumer spending translates into higher business sales and fatter corporate profits, which can lift share prices. However, since theNew York Stock Exchange, the world’s largest marketplace for equities, doesn’t starttrading on the floor for another hour (9:30 a.m.), money managers rush to buy the popularE-Mini S&P 500 stock index futures contracts, which are traded electronically virtually24 hours a day, five days a week on the Chicago Mercantile Exchange (CME). Actionhere occurs at lightning speed, with orders being executed in just two-tenths of a
4 Chapter 1 • The Lock-Up

second—faster than the blink of an eye. In the first five minutes after the release of thejobs report, about $3 billion worth of E-Mini contracts are traded—about ten times theaverage pace seen in a five-minute interval in the past decade. The enthusiasm of tradersin the premarket hours is a harbinger of things to come. By noon that day, stocks acrossthe board reach their highest prices in months.
At the same time, the New York Mercantile Exchange explodes into action.Commodity specialists in the cavernous trading room are also caught off guard by thejobs report and are now gesturing wildly and barking out orders to buy oil and gasolinecontracts on the expectation that a resilient economy will drive up demand for fuel in thefuture. After all, as business activity accelerates, factories operate longer hours and usemore electricity. Business and leisure travel should pick up as well. Airlines will usegreater amounts of fuel. The positive jobs report will encourage more shopping andweekend getaway trips, resulting in greater gasoline consumption. Thus, moments afterthe Labor Department releases the news on jobs, the futures prices of gasoline, heatingoil, and other types of fuel shoot up.
Meanwhile, in currency markets across Asia and Europe, news of the rebound inU.S. jobs makes the dollar a more attractive currency to own. Foreign investors arealways keen on placing their money wherever they can earn a better payoff in the globalmarketplace. This morning, with U.S. interest rates and stocks both heading higher, own-ing American securities makes the most sense. Foreigners proceed to load up on U.S.equities and bonds, causing the dollar to climb in value against other currencies.
Back in Washington, hours earlier an emissary from the Labor Department deliveredan advance copy of the employment release in a sealed package to the president’s topeconomic adviser. White House officials now huddle to discuss ways to spin the positivejobs report for political gain. How should the president comment on it? Does the employ-ment news require a change in public policy? How can it be used to support the adminis-tration’s economic plan? What impact might it have on the federal budget?
Unquestionably, the single most important institution to evaluate the crucial employ-ment report is the Federal Reserve. Economists there also see the release before it goespublic. They begin to scrutinize the data to detect any stress or imbalance in the labormarket that could destabilize the economy. Fed experts ponder whether the unemploy-ment rate is falling so fast that it will drive wages higher and fire up inflation pressures.As they pore over the jobs statistics, a secret but informal discussion commences insidethe Fed on whether a change in interest-rate policy is needed.
It has been a hectic morning for investors, policymakers, and reporters. But whatabout the vast majority of Americans? How did they respond to the turn of events in theemployment report? Did they drop everything at 8:30 a.m. and rush off with paper andpen to the nearest television or radio to take notes on how the economy changed themonth before? Not likely. In sharp contrast to all the frenetic activity in world financialmarkets, most households were preoccupied with carrying out the routines of daily life—getting ready for work, sending kids off to school, or doing some early shopping before
5Chapter 1 • The Lock-Up

the crowds show up at the supermarkets. Let’s face it—the data released on jobs is justtoo remote and abstract to be of much interest to them. However, that doesn’t mean theemployment news will not affect them; everyone in the country will in some manner betouched by what transpired in the financial markets after the jobs report went public. Itmakes no difference whether one is a business owner, a retiree, a housewife, an employee,a homeowner, or a renter. All will eventually feel the fallout from the news that camefrom the Labor Department’s pressroom that morning. That fallout will produce a mix-ture of both favorable and unfavorable developments.
What might the benefits be? Clearly, rising employment is positive for the economy.The more American workers earn, the more they have to spend on goods and services. Aslong as there’s no danger of the economy expanding so fast that it threatens higher infla-tion, everyone gains from rising employment. Furthermore, the government spends lesson unemployment benefits, which eases the strain on the federal budget. Now for the badnews. You’ll recall that when the government released its surprisingly strong jobs report,it spooked bond traders into selling Treasury securities, which quickly drove up interestrates. With the cost of credit going up, banks and other lenders have little choice but toraise their rates on home mortgages and car loans. Even homeowners holding variable-rate mortgages now have to dig deeper into their pockets to make higher monthly pay-ments. There’s more bad news. Remember how commodity investors at the New YorkMercantile Exchange reacted by bidding up the price of oil and other kinds of fuel? Thatwill shortly spill into the retail sector, which means drivers will end up paying extra forgas, and homeowners will shell out more for heating oil. Plane travel becomes moreexpensive too as airlines boost fares to offset the higher cost of aviation fuel.
Now let’s return to positive consequences. In foreign exchange markets, the dollar’svalue jumped in response to the jobs news. A stronger U.S. currency is good forAmerican consumers because it lowers the price of imports such as foreign-made cars,home electronics, and perfumes. That, in turn, puts pressure on U.S. firms to keep theirown prices down, all of which helps contain U.S. inflation. Americans traveling overseasalso can purchase more with each dollar. However, here’s the flip side to a musculargreenback: If your job depends on selling products in foreign markets, you could be introuble. A strong dollar makes U.S.-made goods more expensive in other countries, andforeign buyers might want to look elsewhere for better deals.
U.S. ECONOMIC INDICATORS
It might be hard to believe that all this action and reaction can be triggered by just a sin-gle statistic. If you multiply that by more than 50 economic indicators that are releasedevery week, month, or quarter, you begin to understand why the stock, bond, and currency
6 Chapter 1 • The Lock-Up

markets are in a perpetual state of motion. Among the other influential economic indica-tors that can rattle financial markets are consumer prices, industrial production, retailsales, and new-home construction. It is precisely because these indicators can so easilysway the value of investments that the government takes extraordinary steps to control theflow of sensitive economic information.
That wasn’t always the case. Thirty years ago, barely any guidelines applied to therelease of economic reports. A lock-up room was a term reserved for prisons, not press-rooms. The lack of strict ground rules on the publication of these influential statistics cre-ated the perfect climate for abuse. Politicians tried to control the release of economicnews to score points with voters. When President Nixon heard that the CommerceDepartment was about to go public with an upbeat figure on housing starts, he pressed theagency to time the release for maximum political effect. On those occasions when eco-nomic figures turned out to be a liability, Nixon sought to hold up the report until hebelieved its release would get little notice.
Even Wall Street firms realized that big money could be made off the economic num-bers given the lax supervision of their release. Some brokerages went so far as to dish outlarge amounts of money to reporters who were willing to leak economic news to thefirm’s traders before writing about it. Anyone who got an advance peek at the economicstatistics stood to gain millions in a matter of minutes by knowing which stocks andbonds to trade. Eventually, this blatant manipulation of the economic indicators led a furi-ous Senator William Proxmire to schedule Congressional hearings in the 1970s on howthese reports are released. Later that decade, the government set up a strict calendar thatincluded rigid rules on how economic data would be distributed. Today, nearly everymajor economic indicator is released under tight lock-up conditions, which has enhancedthe integrity of how the public gets such sensitive information. Trading based on insideinformation of economic indicators is now virtually unheard of.
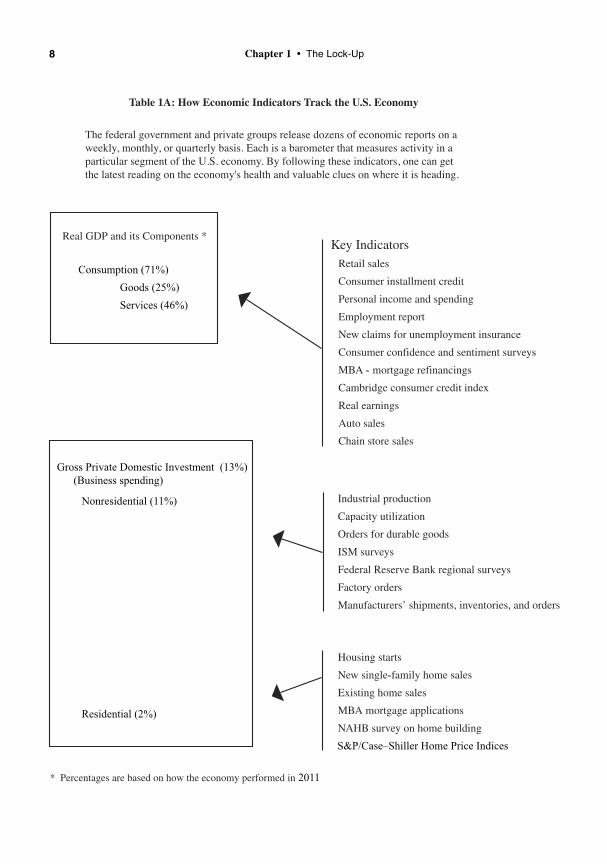
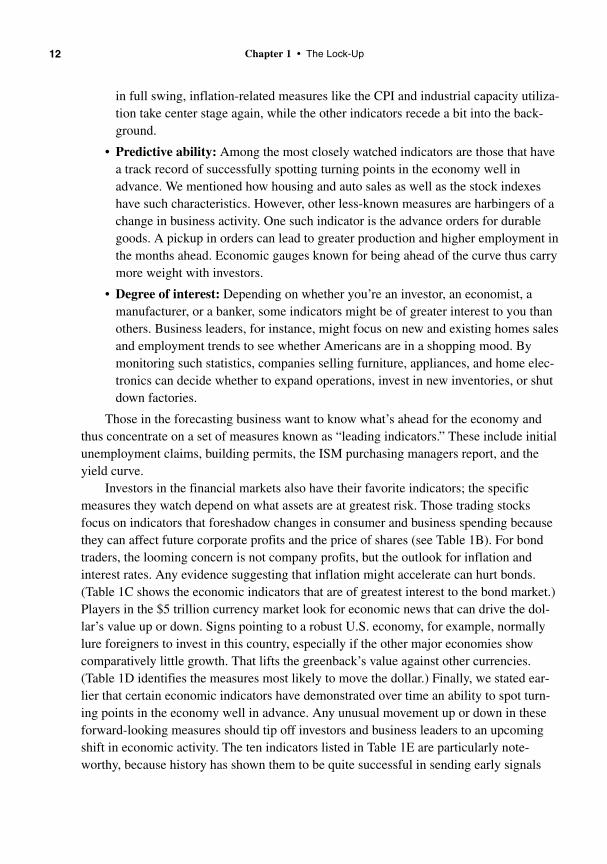
This still leaves us with the most important task of all, though. How do you decipherwhat all these indicators actually tell us about the economy? After all, at least six keyeconomic indicators are released on a weekly basis, more than 40 every month, and adozen each quarter. Do we really need so many measures? Absolutely. The U.S. is thelargest and most complex economy in the world. No single indicator can provide a com-plete picture of what the economy is up to. Nor is there a simple combination of measuresthat provides a connect-the-dots path to the future. At best, each indicator can give you asnapshot of what conditions are like within a specific sector of the economy at a particu-lar point in time (see Table 1A). Ideally, when you piece together all these snapshots, theyshould provide a clearer picture of how the economy is faring and offer clues on where itis heading.
7U.S. Economic Indicators
8 Chapter 1 • The Lock-Up
The federal government and private groups release dozens of economic reports on a weekly, monthly, or quarterly basis. Each is a barometer that measures activity in a particular segment of the U.S. economy. By following these indicators, one can get the latest reading on the economy's health and valuable clues on where it is heading.
Consumption (71%)
Goods (25%)
Services (46%)
S&P/Case–Shiller Home Price Indices
2011
Gross Private Domestic Investment (13%)
(Business spending)
Residential (2%)
Nonresidential (11%)

9U.S. Economic Indicators
Federal Reserve Beige Book
Net exports (-3%)
Government spending (19%)
Change in business inventories (<1%)

Yet even if you took the time to absorb every bit of economic information and moni-tored each squiggle in the indicators, don’t expect to uncover a crystal-ball formula thatcan single-handedly forecast what consumer spending, inflation, and interest rates will doin the months ahead. That’s because there are some important caveats when dealing witheconomic indicators. First, they often fail to paint a consistent picture of the economy.Different indicators can simultaneously flash conflicting signals on business conditions.One can show the economy improving, while another might point to a clear deterioration.For example, the government might report a drop in the unemployment rate, normally abullish sign for the economy. However, a different employment survey might show a dayor two later that companies are laying off workers in record numbers. You’re now pre-sented with two contradictory portraits of labor market conditions, both covering thesame time period. Which should you believe?
The confusion doesn’t stop there. Another complication, one especially maddeningto investors and economists, is that people can behave counterintuitively. Just look at twoostensibly related reports: consumer confidence and consumer spending. The first meas-ures the general mood of potential shoppers: If they are upbeat about the economy, itstands to reason they will spend more. If there is widespread gloom and uncertainty aboutthe future, logic would lead you to believe people will curb their spending and savemoney instead. However, that’s not the way it plays out in the real world. There appearsto be little relationship between these two measures on a month-to-month basis. Duringthe mild 2001 recession, consumer confidence kept plummeting throughout the year,reaching levels not seen in decades. Yet these same consumers not only refused to cutback on spending that year, but bought homes and cars at a record pace. Just the oppositehappened in 2005. Consumer confidence was on the rise, but that did not lead to moreshopping. Obviously, one cannot determine the outlook for consumer spending just bymonitoring the psychological state of American households. The inclination to spend isinfluenced by many factors, including personal income growth, job security, interestrates, and the buildup in wealth from the value of one’s home and the ownership of stocksand bonds.
There is also the quandary that comes with abundance. Everyone—from the profes-sional money manager down to the mom dabbling part time in the financial markets—canbe overwhelmed by the statistical minutia out there. How do you discern which indicatorsare worth watching and which ones to view with skepticism or even ignore? How does aninvestor employ economic indicators to help choose which stocks and bonds to buy andsell, and when? Which measures should a business forecaster follow to spot coming eco-nomic trends? What key indicators should corporate chiefs rely on to help them decidewhether to hire new workers or invest in new equipment?
You can find the answers to these questions in subsequent chapters, but clearly someeconomic indicators are far more telling than others. Generally, the most influential statis-tics—those most likely to shake up the stock, bond, and currency markets—possess someof the following attributes:
10 Chapter 1 • The Lock-Up

• Accuracy: Certain economic measures are known to be more reliable than othersin assessing the economy’s health. What determines their accuracy is linked to howthe data is compiled. Most economic indicators are based on results of public sur-veys. Getting a large and representative sample is thus a prerequisite for accuracy.For instance, to measure the change in consumer price inflation (CPI), the govern-ment’s Bureau of Labor Statistics sends out agents and conducts telephone inter-views every month to find out how much prices have changed on 80,000 items andservices at 26,000 retail outlets around the country. To calculate shifts in consumerconfidence, the Conference Board, a business research organization, polls 5,000households each month.Another variable is the proportion of those queried who actually came back withanswers. How quickly did they respond? The bigger and faster the response, thebetter the quality of the data and the smaller the subsequent revisions. If an indica-tor has a history of suffering large revisions, it generally carries less weight in thefinancial markets. After all, why should an investor buy stocks or a company hireadditional workers when the underlying economic statistic is suspect to beginwith? The monthly report on construction spending by the Commerce Departmentis one that gets substantially revised and is thus often ignored by the investmentcommunity. In contrast, consumer price inflation figures are rarely revised, whichis why this indicator is taken far more seriously.
• Timeliness of the indicator: Investors want the most immediate news of the econ-omy that they can get their hands on. The older the data, the more yawns it evokes.The more current it is, the greater the wallop it packs on the markets. Case in point:Investors pay close attention to the employment situation report because it comesout barely a week after the month ends. In contrast, there’s far less interest in theFederal Reserve’s consumer installment credit report, whose information is twomonths old by the time it’s released.
• The business cycle stage: There are moments when the release of certain eco-nomic indicators is awaited with great anticipation. Yet those same indicatorsbarely get noticed at other times. Why do these economic measures jump in andout of the limelight? The answer is that much depends on where the U.S. economystands in the business cycle. (The business cycle is a recurring pattern in the econ-omy consisting first of growth, followed by weakness and recession, and finally bya resumption of growth. We’ll take a closer look at the business cycle in the nextchapter.) During a recession, when there are lots of unemployed workers and idlemanufacturing capacity, inflation is less of a concern. Thus, measures such as theconsumer price index, which gauges inflation at the retail level, do not have thesame impact on the financial markets that they would if the economy were operat-ing at full speed. During recessionary periods, indicators that grab the headlines arehousing starts, auto sales, and the major stock indexes, because they often providethe earliest clues that an economic recovery is imminent. Once business activity is
11U.S. Economic Indicators
in full swing, inflation-related measures like the CPI and industrial capacity utiliza-tion take center stage again, while the other indicators recede a bit into the back-ground.
• Predictive ability: Among the most closely watched indicators are those that havea track record of successfully spotting turning points in the economy well inadvance. We mentioned how housing and auto sales as well as the stock indexeshave such characteristics. However, other less-known measures are harbingers of achange in business activity. One such indicator is the advance orders for durablegoods. A pickup in orders can lead to greater production and higher employment inthe months ahead. Economic gauges known for being ahead of the curve thus carrymore weight with investors.
• Degree of interest: Depending on whether you’re an investor, an economist, amanufacturer, or a banker, some indicators might be of greater interest to you thanothers. Business leaders, for instance, might focus on new and existing homes salesand employment trends to see whether Americans are in a shopping mood. Bymonitoring such statistics, companies selling furniture, appliances, and home elec-tronics can decide whether to expand operations, invest in new inventories, or shutdown factories.
Those in the forecasting business want to know what’s ahead for the economy andthus concentrate on a set of measures known as “leading indicators.” These include initialunemployment claims, building permits, the ISM purchasing managers report, and theyield curve.
Investors in the financial markets also have their favorite indicators; the specificmeasures they watch depend on what assets are at greatest risk. Those trading stocksfocus on indicators that foreshadow changes in consumer and business spending becausethey can affect future corporate profits and the price of shares (see Table 1B). For bondtraders, the looming concern is not company profits, but the outlook for inflation andinterest rates. Any evidence suggesting that inflation might accelerate can hurt bonds.(Table 1C shows the economic indicators that are of greatest interest to the bond market.)Players in the $5 trillion currency market look for economic news that can drive the dol-lar’s value up or down. Signs pointing to a robust U.S. economy, for example, normallylure foreigners to invest in this country, especially if the other major economies showcomparatively little growth. That lifts the greenback’s value against other currencies.(Table 1D identifies the measures most likely to move the dollar.) Finally, we stated ear-lier that certain economic indicators have demonstrated over time an ability to spot turn-ing points in the economy well in advance. Any unusual movement up or down in theseforward-looking measures should tip off investors and business leaders to an upcomingshift in economic activity. The ten indicators listed in Table 1E are particularly note-worthy, because history has shown them to be quite successful in sending early signals
12 Chapter 1 • The Lock-Up

of a change underway in the economy. However, unlike in the other tables, I have chosennot to formally rank the leading indicators, since no single one can act as the perfect crys-tal ball. The real value here is to see whether two or more of these measures tell a similarstory on where the economy is headed. The more these early-warning indicators agree,the greater the confidence in the message they send.
Table 1B Economic Indicators Most Sensitive to Stocks
Rank Indicator Page
1 Employment Situation Report 31
2 ISM Purchasing Managers Report—Manufacturing 181
3 Weekly Claims for Unemployment Insurance 55
4 Consumer Prices 305
5 Producer Prices 317
6 Retail Sales 93
7 Consumer Confidence and Sentiment Surveys 112
8 Personal Income and Spending 82
9 Advance Report on Durable Goods 148
10 GDP 130
Table 1C Economic Indicators Most Sensitive to Bonds
Rank Indicator Page
1 Employment Situation Report 31
2 Consumer Prices 305
3 ISM Purchasing Managers Report—Manufacturing 181
4 Producer Prices 317
5 Weekly Claims for Unemployment Insurance 55
6 Retail Sales 93
7 Housing Starts 204
8 Personal Income and Spending 82
9 Industrial Production/Capacity Utilization 170
10 GDP 130
13U.S. Economic Indicators

Table 1D Indicators That Most Influence the U.S. Dollar’s Value
Rank Indicator Page
1 Employment Situation Report 31
2 International Trade 269
3 GDP 130
4 Current Account 283
5 Industrial Production/Capacity Utilization 170
6 ISM Purchasing Managers Report—Manufacturing 181
7 Retail Sales 93
8 Consumer Prices 305
9 Consumer Confidence and Sentiment Surveys 112
10 Index of Leading Economic Indicators 196
Table 1E Indicators That Often Lead the Rest of the Economy
Indicator Page
Yield Curve 349
New Orders for Durable Goods (minus transportation and defense) 149
ISM Purchasing Managers Report—New orders 184
Producer Prices (crude goods without food and energy) 317
Personal Income and Spending—Real purchases of durable goods 89
Housing Permits (single-family houses) 205
Weekly Applications for Mortgages (to purchase a home) 227
Housing Market Index—Traffic into home-builder showrooms 223
Weekly Claims for Unemployment Insurance 55
Employment Situation Report—Hiring of temporary workers and truckers 45
INTERNATIONAL ECONOMIC INDICATORS
Up to now, we’ve dealt only with U.S. economic reports. Now let’s look at the growingimportance of monitoring international economic indicators. During much of the twenti-eth century, Americans had only a remote interest in following the economic affairs ofother nations. Few saw a need to take them more seriously. The U.S., after all, possessedthe largest and most self-sufficient economy in the world and, by and large, had beenimpervious to the ups and downs of foreign economic cycles. If Germany or France oreven the emerging countries of Asia suffered an economic downturn, barely anyone in theU.S. would care or even notice.
14 Chapter 1 • The Lock-Up

That’s not the case any longer. One historic change that has emerged early in the 21stcentury is the number of powerful new players on the global stage. For instance, the maindriving forces of growth in the world today are not the mature industrial countries of theU.S., Eurozone, and Japan, but the developing nations across Asia and Latin America.Their entry has fundamentally reshaped the international economic landscape. Thoughthe U.S. economy still reigns supreme in terms of size and influence, little else remainsthe same. China’s economy, for example, was seventh in size in 1995. It has since grownat hyperspeed, vaulting past the United Kingdom in 2005, Germany in 2008, and Japan in2010, to become the second largest in the world. Brazil’s GDP has surged to seventhplace, beating out Canada and Italy. Business activity in India has grown so much that its economy is now bigger than those of the Netherlands, Switzerland, and Austria,combined! These astonishing transformations were brought on by a reduction in tradebarriers, greater economic liberalization, the modernization of global financial markets,and the extraordinary advances in telecommunications, the Internet, computer technology,and software. The results have reshuffled the economic map. For better or worse, theworld economy has become more tightly integrated than ever before.
The implications for the U.S. are huge. Healthy domestic economic performancedepends increasingly on how well other nations are doing. Gone forever are the dayswhen this country was immune to financial and political mishaps originating halfwayaround the world. When OPEC decided to sharply boost oil prices in the mid- to late1970s, Americans felt real pain. Indeed, U.S. inflation subsequently exploded, ultimatelyleading to one of the worst U.S. recessions since the Great Depression. Years later,investors took another beating during the Asian financial crisis in 1997 when the Dowplummeted by more than 550 points on October 27 because investors were worried thatproblems in Asia would hurt the U.S. economy and corporate earnings. In addition, whowould have imagined that a bond default by Russia in 1998—a country with an economythe size of Illinois and Wisconsin combined—would be considered so grave a threat toworld financial markets that the Federal Reserve was under pressure to orchestrate aglobal rescue plan to calm investors worldwide? More recently, the U.S. economy andfinancial markets have shown even greater sensitivity to foreign events. The fear of sover-eign debt defaults spreading across Europe and rising anxiety over instability in theMiddle East not only pummeled U.S. stocks but helped push America’s economy to thebrink of recession the first half of 2011.
When it comes to sales and profits, U.S. companies are becoming more dependent onforeign economic activity. The numbers speak for themselves. About half the earnings ofS&P 500 firms come from business generated outside the United States. More than 50million Americans are now employed by firms engaged in foreign trade, according to theU.S. Department of the Treasury. One in three factory jobs is export related, and one in three acres on American farms is planted to satisfy the demand of hungry people overseas. It should not come as a surprise that the export industry has been the best per-forming sector in the U.S. economy over the past decade.
15International Economic Indicators

All this boils down to a crucial new reality: With 95% of the world’s consumersresiding outside the U.S., foreign economic indicators should be followed with the sameregularity, interest, and scrutiny as the domestic indicators. If foreign economies do well,U.S. firms are in a better position to sell more exports, earn more money, and keep mil-lions of American workers employed. By closely monitoring the international indicators,U.S. companies can seek out new foreign markets or decide whether to expand (or shutdown) facilities overseas. American investors can diversify their portfolios more smartlyby identifying and purchasing those foreign stocks and bonds that might offer a lucrativereturn.
Another important reason to monitor the performance of other major economies isthat it helps us check the mood of foreign investors. As long as they view the U.S. as asafe and attractive place to invest, capital from abroad will continue to flow into thiscountry, and that is vital to the well-being of the U.S. economy. Foreign investors play anindispensable role in financing U.S. economic growth by lending this country an averageof $2 billion a day—money that goes into buying stocks, bonds, and other Americanassets. Why does the U.S. need to borrow such huge sums from other nations? Becauseconsumers and the federal government together spend so much on cars, computers, mili-tary hardware, and healthcare (to name just a few items) that little domestic savings is leftover. Yet savings is the lifeblood that keeps an economy healthy. It’s used to finance pro-ductive investments, such as building efficient factories and funding the research anddevelopment of new and better products. Without adequate savings, the U.S. would beincapable of showing healthy long-term growth.
To make up for the shortfall in domestic savings, the U.S. has to lure the surplus sav-ings of other countries. In addition, while all that foreign capital entering the U.S. haskept the economy humming, serious risks come with being so dependent on overseascreditors. Since the 1990s, America’s net foreign debt has skyrocketed from $50 billion toa staggering $3 trillion—the most of any nation in the world. In the process, foreignershave acquired an unprecedented share of U.S. assets; they own more than 50% of all U.S.Treasury issues, 25% of American corporate bonds, and about 15% of all equities. Shouldthe mood of those investors turn sour on the U.S. market—something that can occur ifthere is poor expectation of investment returns here as compared with other countries—itcould spark a sell-off of American stocks and bonds by foreigners.
For all these reasons, international economic indicators have lately taken on a moreprominent role in the formulation of investment and business strategies. However, as withU.S. economic data, literally hundreds of foreign economic measures are released everymonth. With so much information being thrown at investors and business executives eachday, how do you know which of these statistics are worthy of consideration? There is noone simple answer to this question. American companies and investors have differentinterests and risk exposures in the global economy.
16 Chapter 1 • The Lock-Up

In this book three factors are considered in determining the most influential interna-tional economic indicators: First, after the U.S., which are the largest economies in theworld? Second, how liquid are the markets in those countries—that is, how easy is it tobuy and sell securities on their exchanges? Third, who are the important trading partnersof the U.S.? By trade, we’re talking about the exchange of goods (such as the sale oftrucks, pharmaceuticals, and computers) and the exchange of services (such as insurance,consulting, transportation, and entertainment). The service sector is especially importantbecause it includes the all-important category of investment flows. Table 1F lists the“must watch” international economic indicators.
Table 1F Top International Economic Indicators
Indicator Page
German Industrial Production 364
German IFO Business Climate Survey 366
German Consumer Price Index 368
China Purchasing Managers Report—Manufacturing 390
China Industrial Production 396
Eurozone Purchasing Managers Report—Manufacturing 385
Japan Tankan Survey 378
Japan Industrial Production 373
India Industrial Production 403
Brazil Industrial Production 410
17International Economic Indicators

This page intentionally left blank

447
Index
Aabundance, 10accuracy of statistics, 11adjustments
for inflation, 138seasonal, 25-26
ADP National Employment report, 75-81market impact, 80-81tables, 77-80
American Institute of Architects, 359annual rates, 19AP (Associated Press), 4applications, free mobile phone, 429Architecture Billings Index, 359Asia, 15, 361Assets and Liabilities of Commercial Banks in the
United States report, 291-295attributes, statistics, 10Australia, 422-427Australia Bureau of Statistics, 422Austria, 15Automatic Data Processing, Inc. (ADP), 75averages
Johnson Redbook, 104moving, 23private non-farm payrolls, 40
BBangalore, 406Bank of Japan, 378. See also Japanbanking systems, India, 405bankruptcy, 64behavior of consumers, 431benchmarks, 24benefits, 343best megasites for international statistics, 444Bloomberg Consumer Comfort Index, 120
market impact, 121tables, 121
Bloomberg News, 120
Bloomberg TV, 4, 23bonds. See also stocks
ADP National Employment report, 80-81Bloomberg Consumer Comfort Index, 121Business Inventories report, 168Business Outlook Survey, 245Chicago Purchasing Managers Index (Business
Barometer), 194Consumer Confidence Index, 116Consumer Credit Outstanding report, 111Consumer Price Index (CPI) report, 314-316Corporate Layoff and Hiring Announcements
report, 69Current Account Balance (U.S. International
Transactions) report, 289Durable Goods Orders report, 154E-Commerce Retail Sales report, 100Empire State Manufacturing Survey, 241Employment Cost Index, 326Existing Home Sales report, 216Factory Orders report, 160-161Federal Open Market Committee (FOMC)
Statement, 266-268Federal Reserve Board’s Beige Book, 258forecasting, 12Gross Domestic Product (GDP) report, 146Help-Wanted Online Advertising report, 63Housing Market Index (NAHB), 226Housing Starts and Building Permits report,
209Import and Export Prices report, 332-333Index of Leading Economic Indicators (LEI),
203indicators most sensitive to, 13Industrial Production and Capacity Utilization
report, 179Institute for Supply Management (ISM)
Manufacturing Survey, 187International Trade in Goods and Services
report, 281Job Openings and Labor Turnover report, 54jobs report, 31-35, 47

448 Index
Manufacturing Activity in the 5th District, 251Manufacturing Survey of the 10th District, 247New Home Sale report, 222Personal Income and Spending report, 92Producer Price Index (PPI) report, 321-322Productivity and Costs report, 341Real Earnings report, 348Retail Sales report, 97Survey of Consumer Sentiment report, 119Treasury International Capital (TIC) System
report, 303Weekly Claims for Unemployment
Insurance, 58Weekly Mortgage Applications Survey and the
National Delinquency Survey, 230Yield Curve report, 354
Brazil, 15Brazilian Institute for Geography and Statistics
(IBGE), 410Brazilian National Statistics Institute, 410IBC-Br Economic Activity Index, 410-415Industrial Production report, 410-415
Bundesbank, 368-369Bureau of Economic Analysis (BEA), xxiii, 82,
130, 286Bureau of Labor Statistics (BLS), 11, 31, 33, 49,
60, 70, 343Bureau of the Census, 93business cycles, 11, 20-22Business Inventories report, 162-164
market impact, 168-169tables, 164-168
Business Outlook Survey, 242market impact, 245tables, 244
Ccalculations, inflation rates (Germany), 369Calendar of Releases for Foreign Economic
Data, 439Canada, 15, 416-421
establishment surveys, 34stock markets, 362
Canada Free Trade Agreement (CFTA), 418
capacityof production (Japan), 382utilization, 23, 171
capital accounts, 285Cass Freight Index, 357Census Bureau, 99, 148, 155, 217Central Bank of Brazil, 410Central Statistical Organization (CSO), 403, 406CESifo, 366Challenger report, 65, 69Challenger, Gray & Christmas (CGC), xxiii, 64Chicago Board of Trade (CBOT), 4Chicago Purchasing Managers Index (Business
Barometer), 191market impact, 194-195tables, 192-194
China, 15China Industrial Production report, 396-402China Manufacturing Purchasing Managers
Index (PMI), 390-392class of workers, employment by, 41CNBC, 4CNN, 4coincident indicators, 198Commerce Department, 7, 130commodities, 5-6Composite Leading Indicators report (Canada),
416-418computations
ADP National Employment report, 76Assets and Liabilities of Commercial Banks in
the United States report, 292Bloomberg Consumer Comfort Index, 120-121Business Inventories report, 164Business Outlook Survey, 242-243capacity utilization, 172-173Chicago Purchasing Managers Index (Business
Barometer), 191-192Construction Spending report, 233Consumer Confidence Index, 114Consumer Credit Outstanding report, 108Consumer Price Index (CPI) report, 308-309Corporate Layoffs and Hiring Announcements
report, 65Current Account Balance (U.S. International
Transactions) report, 286Durable Goods Orders report, 149E-Commerce Retail Sales report, 100

449Index
Empire State Manufacturing Survey, 237Employer Costs for Employee Compensation
report, 342-343Employment Cost Index, 324Employment Situation report, 32-35
market impact, 47-48tables, 35-47
Existing Home Sales report, 211Factory Orders report, 156Federal Open Market Committee (FOMC)
Statement, 262-264Federal Reserve Board’s Beige Book, 258Google Insights report, 124Gross Domestic Product (GDP), 140-141Help-Wanted Online Advertising report, 60Housing Market Index (NAHB), 223-224Housing Starts and Building Permits report, 206Import and Export Prices report, 329Index of Leading Economic Indicators (LEI),
200-201industrial production (IP), 172Institute for Supply Management (ISM)
Manufacturing Business Survey, 182-183Non-Manufacturing Business Survey,
189-190International Trade in Goods and Services
report, 271-272jobs report, market impact, 47-48Las Vegas Gaming Revenues, 127Manufacturing Activity in the 5th District,
249-250Manufacturing Survey of the 10th District,
246-247Mass Layoff Statistics (MLS) report, 71National Activity Index (CFNAI), 252-253New Home Sales report, 218Personal Income and Spending report, 85Producer Price Index (PPI) report, 318-319Productivity and Costs report, 338-339Real Earnings report, 346-347Retail Sales report, 94
market impact, 97-98tables, 94-97
Survey of Consumer Sentiment report, 118Treasury International Capital (TIC) System
report, 298Weekly Chain Store Sales report, 103-104
market impact, 106tables, 104
Weekly Claims for Unemployment Insurance, 56
Weekly Mortgage Applications Survey and theNational Delinquency Survey, 228
Yield Curve report, 352-353comScore Networks, 100conditions, employment, 432Conference Board, The, 11, 59, 112, 196confidence, consumer, 10consensus surveys, 22-23constant dollars, 24construction
activity (Web sites), 433Existing Home Sales report, 210
market impact, 202, 216tables, 211-216
Housing Starts and Building Permits report,204-205market impact, 209tables, 206-208
New Home Sales report, 217-218market impact, 222tables, 218-220
Construction Spending report, 232-234Consumer Credit Outstanding report, 107-108
market impact, 111tables, 108-111
Consumer Confidence Index, 112-114Consumer Price Index (CPI), 139
Germany, 368, 370report, 305-316
Consumer Prices report (Australia), 422-426consumers
behavior, 431Bloomberg Consumer Comfort Index, 120
market impact, 121tables, 121
confidence, 10Google Insights report, 123-125Las Vegas Gaming Revenues report, 126prices, 11, 23spending, 5Survey of Consumer Sentiment report, 117
market impact, 119tables, 118
Corporate Layoff and Hiring Announcementsreport, 64-69

450 Index
cost cutting, 64countries, Manufacturing Purchasing Managers
Index (PMI), 384credit
Consumer Credit Outstanding report, 107-108market impact, 111tables, 108
Web sites, 436Credit Manager’s Index, 355crude goods, PPI, 317Cultural Revolution, 396. See also Chinacurrencies. See also dollars
Australia, 423exchange markets, 6international, 362markets, 5
Current Account Balance (U.S. InternationalTransactions) report, 283-290
cyclesbusiness, 20-22stages of, 11
Ddebt
Japan as owner of, 373U.S., 16
deflatorfor Gross Domestic Purchases, 139for Personal Consumption Expenditures
(PCE), 139degrees of interest (indicators), 12demand, labor, 61democracy, India, 404demographics, 33Department of Commerce, 82, 93, 99, 148, 155,
217Department of Labor, 31, 49, 55, 70
release of statistics, 2-6Department of the Treasury, 15discharges, 52diversification, 362dividend income, 83dollars
ADP National Employment report, 81Australia, 423Bloomberg Consumer Comfort Index, 122
Business Inventories report, 169Business Outlook Survey, 245Chicago Purchasing Managers Index (Business
Barometer), 195constant, 24Consumer Confidence index, 116Consumer Credit Outstanding report, 111Consumer Price Index (CPI) report, 316Corporate Layoff and Hiring Announcements
report, 69Current Account Balance (U.S. International
Transactions) report, 290Durable Goods Orders report, 154E-Commerce Retail Sales report, 100Empire State Manufacturing Survey, 241Employer Costs for Employee Compensation
report, 342-345Employment Cost Index, 327Existing Home Sales report, 216Factory Orders report, 161Federal Open Market Committee (FOMC)
Statement, 268Federal Reserve Board’s Beige Book, 259Gross Domestic Product (GDP) report, 147Help-Wanted Online Advertising report, 63Housing Market Index (NAHB), 226Housing Starts and Building Permits report,
209Import and Export Prices report, 334Index of Leading Economic Indicators (LEI),
203Industrial Production and Capacity Utilization
report, 180Institute for Supply Management (ISM)
Manufacturing Survey, 187International Trade in Goods and Services
report, 282Job Openings and Labor Turnover report, 54Manufacturing Activity in the 5th District, 251Manufacturing Survey of the 10th District, 248New Home Sales report, 222nominal, 24Personal Income and Spending report, 92Productivity and Costs report, 341Real Earnings report, 348Retail Sales report, 98Survey of Consumer Sentiment report, 119

451Index
Treasury International Capital (TIC) Systemreport, 304
Web sites, 436Weekly Chain Store Sales report, 106Weekly Claims for Unemployment
Insurance, 58Weekly Mortgage Applications Survey and the
National Delinquency Survey, 231Yield Curve report, 354
domestic product, final sales of, 137domestic savings, 16Dow Jones, 23Durable Goods Orders report, 134-154
market impact, 154tables, 149-154
duration of unemployment, 44
EE-Commerce Retail Sales report, 99-100
market impact, 100tables, 100
earnings, Real Earnings report, 346-348economies
business cycles, 20-22Construction Spending report, 232-233international indicators, 361-363
Brazil Industrial Production report, 410-413Canada, 416-426China Industrial Production report, 396-400China Manufacturing Purchasing Managers
Index (PMI), 390-392Eurozone Manufacturing Purchasing
Managers Index (PMI), 385-387German Consumer Price Index (CPI) Index,
368-370German IFO Business Climate Index, 366German Industrial Production report, 364Global Manufacturing Purchasing
Managers Index (PMI), 387-389IBC-Br Economic Activity Index, 410-413India Industrial Production and Inflation
report, 403-406Japan Industrial Production report, 373-375Japan’s Tankan Survey, 378-383Manufacturing Purchasing Managers Index
(PMI), 384
OECD Composite Leading Indicators (CLI)report, 393-395
ZEW Indicator of Economic Sentimentreport, 371
S&P/Case-Shiller U.S. National Home PriceIndex, 360
U.S.ADP National Employment report, 75-81Architecture Billings Index, 359Assets and Liabilities of Commercial Banks
in the United States report, 291-295Bloomberg Consumer Comfort Index,
120-121Business Inventories report, 162-168Business Outlook Survey, 242-245Cass Freight Index, 357Chicago Purchasing Managers Index
(Business Barometer), 191-195Consumer Credit Outstanding report,
107-111Consumer Confidence Index, 112-114Consumer Price Index (CPI) report, 305-315Corporate Layoff and Hiring
Announcements report, 64-69Credit Manager’s Index, 355Current Account Balance (U.S.
International Transactions) report, 283-288
Durable Goods Orders report, 148-154E-Commerce Retail Sales report, 99-100Empire State Manufacturing Survey,
236-241Employer Costs for Employee
Compensation report, 342-345Employment Cost Index report, 323-327Employment Situation report, 31-41, 44-48Existing Home Sales report, 210-216Factory Orders report, 155-160Federal Open Market Committee (FOMC)
Statement, 260-268Federal Reserve Board’s Beige Book,
255-259Google Insights report, 123-125Gross Domestic Product (GDP) report,
130-147Help-Wanted Online Advertising report,
59-63Housing Market Index (NAHB), 223-226

452 Index
Housing Starts and Building Permits report,204-209
Import and Export Prices report, 328-334Index of Leading Economic Indicators
(LEI), 196-203Industrial Production and Capacity
Utilization report, 170-180Institute for Supply Management (ISM)
Manufacturing Survey, 181-187Institute for Supply Management (ISM)
Non-Manufacturing Business Survey,188-190
International Trade in Goods and Servicesreport, 269-272, 276-282
Job Openings and Labor Turnover report,49-54
Las Vegas Gaming Revenues report, 126-129Manufacturing Activity in the 5th District,
249-253Manufacturing Survey of the 10th District,
246-247Mass Layoff Statistics (MLS) report, 70-74New Home Sales report, 217-222Personal Income and Spending report, 82-92Producer Price Index (PPI) report, 317-322Productivity and Costs report, 335-341Real Earnings report, 346-348Regional Federal Reserve Bank Reports,
235Retail Sales report, 93-98Small Business Economic Trends report, 356Survey of Consumer Sentiment report,
117-119Treasury International Capital (TIC) System
report, 296-304Weekly Chain Store Sales report, 102-106Weekly Claims for Unemployment
Insurance report, 55-58Weekly Railroad Traffic (Freight) report, 358Yield Curve report, 349-354
Weekly Mortgage Applications Survey and theNational Delinquency Survey, 227-230
efficiency, Productivity and Costs report, 335-341emerging countries, 361Empire State Manufacturing Survey, 236
market impact, 241tables, 237-241
Employer Costs for Employee Compensationreport, 342-345
employmentADP National Employment report, 75-76
market impact, 80-81tables, 77-79
by class of workers/part-time status, 41conditions, 432Corporate Layoff and Hiring
Announcements report, 64-69market impact, 69tables, 64-67
Employment Situation report, 31-48market impact, 47-48tables, 35-47
Help-Wanted Online Advertising report, 59-63
Job Openings and Labor Turnover report, 49market impact, 54tables, 51-53
Mass Layoff Statistics (MLS) report, 70market impact, 74tables, 71
Weekly Claims for Unemployment Insurancereport, 55-56market impact, 58tables, 56
Employment and Training Administration, 55Employment Cost Index report, 323-326Employment Situation report, 31-48equities, 5. See also stocks; bondsestablishment surveys, 33-35Europe, 361European Central Bank (ECB), 368European Union (EU), 369euros, 368. See also currenciesEurozone Manufacturing Purchasing Managers
Index (PMI), 385-387exchange markets, 6exchange rates, Japan, 381Exchange Traded Funds (ETFs), xxiiiExisting Home Sales report, 210-216
market impact, 216tables, 211-216
expenditures, government, 137exports of goods and services, 136, 142

453Index
FFactory Orders report, 155-156
market impact, 160-161tables, 156-160
Federal Budget reports (Web sites), 435Federal Open Market Committee (FOMC)
Statement, 260-268Federal Reserve, 5, 32
Assets and Liabilities of Commercial Banks inthe United States report, 291-295
Bankof Chicago, National Activity Index
(CFNAI), 252-254of Kansas City, Manufacturing Survey of
the 10th District, 246-248of New York, Empire State Manufacturing
Survey, 236-241of Philadelphia, Business Outlook Survey,
242-245of Richmond, Manufacturing Activity in the
5th District, 249-251Beige Book, 255-259Board, xxiii, 107, 170Federal Reserve Board’s Beige Book, 255-259Regional Federal Reserve Bank reports, 235reports (Web sites), 434
Federal Statistics Office, Germany, 364, 368final sales of domestic product, 137financial accounts, 285financial indicators, 197finished goods, PPI, 318Fiserv, 360Fitch, 397forecasting, 12
Japan, 375labor, 59
foreign debt (U.S.), 16Forrester Research, 100France, 14free alongside ship (FAS) prices, 329free mobile phone apps, 429free on board (FOB) basis, 329freight
Cass Freight Index, 357Weekly Railroad Traffic (Freight) report, 358
GGaming Control Board, 126geographic coverage, Consumer Price Index
(CPI), 310Germany, 14
German Consumer Price Index (CPI), 368-370
German IFO Business Climate Index, 366-367
German Industrial Production report, 364-365
stock markets, 362ZEW Indicator of Economic Sentiment
report, 371-372global economies, 361-363
Australia, 422-423, 426Brazil Industrial Production report, 410-413Canada, 416-418China
Industrial Production report, 396-400Manufacturing Purchasing Managers Index
(PMI), 390-392Eurozone Manufacturing Purchasing Managers
Index (PMI), 385-387Germany
Consumer Price Index (CPI), 368-370IFO Business Climate Index, 366Industrial Production report, 364ZEW Indicator of Economic Sentiment
report, 371Global Manufacturing Purchasing Managers
Index (PMI), 387-389IBC-Br Economic Activity Index, 410-413India Industrial Production and Inflation report,
403-406Japan
Industrial Production report, 373-375Tankan Survey, 378-383
Manufacturing Purchasing Managers Index(PMI), 384
OECD Composite Leading Indicators (CLI)report, 393-395
Global Manufacturing Purchasing Managers Index(PMI), 387-389
Google Insights report, 123-125

454 Index
governmentsexpenditures, 137international indicators, 362. See also
international indicatorsrelease of statistics, 2-6
Great Depression, 15, 22, 182Great Recession (2008-2009), 27-29gross domestic product (GDP)
Australia, 424Brazil, 413China, 398India, 406Japan, 374negative growth, 21
Gross Domestic Product (GDP) report, 130market impact, 146-147tables, 132-143, 145
Gross Private Domestic Investment, 134growth
GDP, 21of employment, 48India, 403
HHarmonized Index of Consumer Prices (HICP), 369Help-Wanted Online Advertising report, 59-63hiring, Corporate Layoff and Hiring
Announcements report, 64-69. See alsoemployment
home sales (Web sites), 433Hoover, Herbert, 182household surveys, 32-33, 35Housing Affordability Index (HAI), 215Housing Market Index (NAHB), 223
market impact, 226tables, 224-226
Housing Starts and Building Permits report, 204-205
market impact, 209tables, 206-208
HSBC Holdings plc, 384
IICSC-GS (International Council of Shopping
Centers/Goldman Sachs), 102impact, markets
ADP National Employment report, 80-81Assets and Liabilities of Commercial Banks in
the United States report, 295Bloomberg Consumer Comfort Index, 121Business Inventories report, 168Business Outlook Survey, 245Chicago Purchasing Managers Index (Business
Barometer), 194-195Consumer Confidence Index, 116Consumer Credit Outstanding report, 111Consumer Price Index (CPI) report, 314, 316Corporate Layoff and Hiring Announcements
report, 69Current Account Balance (U.S. International
Transactions) report, 289Durable Goods Orders report, 154E-Commerce Sales report, 100Empire State Manufacturing Survey, 241Employer Costs for Employee Compensation
report, 345Employment Cost Index, 326-327Employment Situation reports, 47-48Existing Home Sales report, 216Factory Orders report, 160Federal Open Market Committee (FOMC)
Statement, 266Federal Reserve Board’s Beige Book, 258Google Insights report, 125Gross Domestic Product (GDP) report, 146-147Help-Wanted Online Advertising report, 63Housing Market Index (NAHB), 226Import and Export Prices report, 328-334Index of Leading Economic Indicators (LEI),
202-203Industrial Production and Capacity Utilization
report, 179-180Institute for Supply Management (ISM)
Manufacturing Survey, 187International Trade in Goods and Services
report, 280Job Openings and Labor Turnover report, 54Las Vegas Gaming Revenues report, tables, 129Manufacturing Activity in the 5th District, 251

455Index
Mass Layoff Statistics (MLS) report, 74National Activity Index (CFNAI), 253New Home Sales report, 222Personal Income and Spending report, 91-92Producer Price Index (PPI) report, 321-322Productivity and Costs report, 341Real Earnings report, 348Retail Sales report, 97-98Survey of Consumer Sentiment report, 119Treasury International Capital (TIC) System
report, 303-304Weekly Chain Store Sales report, 106Weekly Claims for Unemployment
Insurance, 58Weekly Mortgage Applications Survey and the
National Delinquency Survey, 230Yield Curve report, 354
Import and Export Prices report, 328-334importance of
ADP National Employment report, 75Assets and Liabilities of Commercial Banks in
the United States report, 291Bloomberg Consumer Comfort Index, 120Business Inventories report, 162-164Business Outlook Survey, 242Chicago Purchasing Managers Index (Business
Barometer), 191Construction Spending report, 232Consumer Confidence Index, 112-114Consumer Credit Outstanding report, 107-108Consumer Price Index (CPI) report, 305-307Corporate Layoff and Hiring
Announcements, 64Current Account Balance (U.S. International
Transactions) report, 283-285Durable Goods Orders report, 148E-Commerce Retail Sales report, 99-100Empire State Manufacturing Survey, 236Employer Costs for Employee Compensation
report, 342Employment Cost Index, 323Employment Situation report, 31Existing Home Sales report, 210Factory Orders report, 155Federal Open Market Committee (FOMC)
Statement, 260-262Federal Reserve Board’s Beige Book, 255, 257Gross Domestic Product (GDP) report, 130
Help-Wanted Online Advertising report, 59Housing Market Index (NAHB), 223Housing Starts and Building Permits report,
204-205Import and Export Prices report, 328Index of Leading Economic Indicators
(LEI), 196Industrial Production and Capacity Utilization
report, 170-180Institute for Supply Management (ISM)
Manufacturing Survey, 181-182Non-Manufacturing Business Survey, 188
international indicators, 361-363International Trade in Goods and Services
report, 269-271Job Openings and Labor Turnover report, 49jobs report, 32Las Vegas Gaming Revenues report, 126Manufacturing Activity in the 5th District, 249Manufacturing Survey of the 10th District, 246Mass Layoff Statistics (MLS) report, 70National Activity Index (CFNAI), 252New Home Sales report, 217Personal Income and Spending report, 82-84Producer Price Index (PPI) report, 317-318Productivity and Costs report, 335-338Real Earnings report, 346Survey of Consumer Sentiment report, 117Treasury International Capital (TIC) System
report, 296-297Weekly Chain Store Sales report, 102-103Weekly Claims for Unemployment Insurance
report, 55Weekly Mortgage Applications Survey and the
National Delinquency Survey, 227Yield Curve report, 349, 351
income, Personal Income and Spending report, 82-85
market impact, 91-92tables, 85-90
Income Account, 284Index of Leading Economic Indicators (LEI),
196-200market impact, 202-203tables, 201-202
indexesArchitecture Billings Index, 359Australia, 422-423, 426

456 Index
Bloomberg Consumer Comfort Index, 120market impact, 121tables, 121
Canada, 416-418Cass Freight Index, 357Chicago Purchasing Managers Index (Business
Barometer), 191market impact, 194-195tables, 192
China Manufacturing Purchasing ManagersIndex (PMI), 390-392
coincident indicators, 198Consumer Confidence Index, 112-114Consumer Price Index (CPI), 139, 305-315Credit Manager’s Index, 355Employment Cost Index report, 323-326Eurozone Manufacturing Purchasing Managers
Index (PMI), 385-387GDP price, 138German Consumer Price Index (CPI), 368-370German IFO Business Climate Index, 366Global Manufacturing Purchasing Managers
Index (PMI), 387-389Harmonized Index of Consumer Prices
(HICP), 369Housing Affordability Index (HAI), 215Housing Market Index (NAHB), 223
market impact, 226tables, 224-226
IBC-Br Economic Activity Index, 410-413Index of Consumer Sentiment, 118Index of Leading Economic Indicators (LEI),
196-200market impact, 202-203tables, 201-202
Johnson Redbook, 102lagging indicators, 199Manufacturing Purchasing Managers Index
(PMI), 384National Activity Index (CFNAI), 252-253Pending Home Sales Index (PHSI), 213Producer Price Index (PPI) report, 317-319,
322Purchasing Managers Index (PMI), 182S&P/Case-Shiller U.S. National Home Price
Index, 360wholesale price index (WPI), 406
India Industrial Production and Inflation report,403-409
indicatorsinternational, 361-363
Australia, 422-423, 426Brazil Industrial Production report, 410-413Calendar of Releases for Foreign Economic
Data Web site, 439Canada, 416-418China Industrial Production report, 396-400China Manufacturing Purchasing Managers
Index (PMI), 390-392Eurozone Manufacturing Purchasing
Managers Index (PMI), 385-387German Consumer Price Index (CPI),
368-370German IFO Business Climate Index, 366German Industrial Production report, 364Global Manufacturing Purchasing
Managers Index (PMI), 387-389IBC-Br Economic Activity Index, 410-413India Industrial Production and Inflation
report, 403-406Japan Industrial Production report, 373-375Japan’s Tankan Survey, 378-383Manufacturing Purchasing Managers Index
(PMI), 384OECD Composite Leading Indicators (CLI)
report, 393-395Web sites, 439-444ZEW Indicator of Economic Sentiment
report, 371leaders, 14most sensitive to bonds, 13most sensitive to stocks, 13most sensitive to U.S. dollar’s value, 14U.S.
ADP National Employment report, 75-81Architecture Billings Index, 359Assets and Liabilities of Commercial Banks
in the United States report, 291-295Bloomberg Consumer Comfort Index,
120-121Business Inventories report, 162-168Business Outlook Survey, 242-245Cass Freight Index, 357Chicago Purchasing Managers Index
(Business Barometer), 191-195

457Index
Construction Spending report, 232-233Consumer Credit Outstanding report, 107-111Consumer Confidence Index, 112-114Consumer Price Index (CPI) report, 305-315Corporate Layoff and Hiring
Announcements report, 64-69Credit Manager’s Index, 355Current Account Balance (U.S.
International Transactions) report, 283-288
Durable Goods Orders report, 148-154E-Commerce Retail Sales report, 99-100Empire State Manufacturing Survey,
236-241Employer Costs for Employee
Compensation report, 342-345Employment Cost Index report, 323-326Employment Situation report, 31-38, 40-48Existing Home Sales report, 210-216Factory Orders report, 155-160Federal Open Market Committee (FOMC)
Statement, 260-268Federal Reserve Board’s Beige Book,
255-259Google Insights report, 123-125Gross Domestic Product (GDP) report,
130-147Help-Wanted Online Advertising report,
59-63Housing Market Index (NAHB), 223-226Housing Starts and Building Permits report,
204-209Import and Export Prices report, 328-334Index of Leading Economic Indicators
(LEI), 196-203Industrial Production and Capacity
Utilization report, 170-180Institute for Supply Management (ISM)
Manufacturing Survey, 181-187Institute for Supply Management (ISM)
Non-Manufacturing Business Survey,188-190
International Trade in Goods and Servicesreport, 269-282
Job Openings and Labor Turnover report,49-54
Las Vegas Gaming Revenues report, 126-129
Manufacturing Activity in the 5th District,249-251
Manufacturing Survey of the 10th District,246-247
Mass Layoff Statistics (MLS) report, 70-74National Activity Index (CFNAI), 252-253New Home Sales report, 217-222Personal Income and Spending report, 82-92Producer Price Index (PPI) report, 317-322Productivity and Costs report, 335-341Real Earnings report, 346-348Regional Federal Reserve Bank Reports,
235Retail Sales report, 93-98S&P/Case-Shiller U.S. National Home
Price Index, 360Small Business Economic Trends report, 356Survey of Consumer Sentiment report,
117-119Treasury International Capital (TIC) System
report, 296-304Web sites, 429-438Weekly Chain Store Sales report, 102-106Weekly Claims for Unemployment
Insurance report, 55-58Weekly Mortgage Applications Survey and
the National Delinquency Survey, 227-230
Weekly Railroad Traffic (Freight) report, 358Yield Curve report, 349, 352-354
industrial production (IP), 23, 171Industrial Production and Capacity Utilization
report, 170-171market impact, 179-180tables, 173-178
industries. See also manufacturingGerman Industrial Production report, 364Japan, 374jobs
cuts by, 65report tables, 46-47
quit levels, 53inflation, 15
adjusting, 138China, 398Consumer Price Index (CPI) report, 305-315Employment Cost Index, 323German Consumer Price Index (CPI), 368-370

458 Index
India Industrial Production and Inflation report,403-406
National Activity Index (CFNAI), 252-253Real Earnings report, 346-348Web sites, 434
Institute for Supply Management (ISM), 75, 181-182, 188, 384
Manufacturing Survey, 181-182market impact, 187tables, 183-186
Non-Manufacturing Business Survey, 188market impact, 190tables, 190
insurance, unemployment, 56. See also WeeklyClaims for Unemployment Insurance report
interest income, 83interest rates, 48, 435intermediate goods, PPI, 318International Council of Shopping Centers and
Goldman Sachs (ICSC-GS), 103international economic indicators, 14-17International Federation of Purchasing and Supply
Management (IFPSM), 384international indicators, 361-363
Australia, 422-426Brazil Industrial Production report, 410-413Canada, 416-418China
Industrial Production report, 396-400Manufacturing Purchasing Managers Index
(PMI), 390-392Eurozone Manufacturing Purchasing Managers
Index (PMI), 385-387Germany
Consumer Price Index (CPI) Index, 368-370IFO Business Climate Index, 366Industrial Production report, 364
Global Manufacturing Purchasing ManagersIndex (PMI), 387-389
IBC-Br Economic Activity Index, 410-413India Industrial Production and Inflation report,
403-406Japan
Industrial Production report, 373-375Tankan Survey, 378-383
Manufacturing Purchasing Managers Index(PMI), 384
OECD Composite Leading Indicators (CLI)report, 393-395
Web sitesbest megasites for statistics, 444Calendar of Releases for Foreign Economic
Data, 439economic statistics from other countries,
439-444sources of global economic news, 439
ZEW Indicator of Economic Sentiment report, 371
International Merchandise Trade report (Canada),416-421
international trade, 433International Trade in Goods and Services report,
269-277, 280-282International Trade Report (Australia), 422-426Internet
China, 396E-Commerce Retail Sales report, 99-100
market impact, 100tables, 100
Help-Wanted Online Advertising report, 59-63inventories
Business Inventories report, 162-164market impact, 168tables, 164, 167
change, 135Durable Goods Orders report, 153ISM surveys, 186Japan, 375
investments, 5Japan, 381Job Openings and Labor Turnover report, 54jobs report, 31-35, 47-48
Italy, 15Ivey Purchasing Managers Index, 416-418
JJ.P. Morgan, 384Japan
Industrial Production report, 373-377stock markets, 362Tankan Survey, 378-383
Job Openings and Labor Turnover report, 49-54

459Index
jobscreation, Employment Situation report, 31-41,
44-48Help-Wanted Online Advertising report, 59-63Job Openings and Labor Turnover report, 49
market impact, 54tables, 51-54
reports, 5Weekly Claims for Unemployment Insurance
report, 55-56market impact, 58tables, 56
Johnson RedbookAverage, 104index, 102
K–LKyodo News, 4
labordemand, 61disputes, 64forecasting, 59income, 83turnover, 49
market impact, 54tables, 51, 53
underutilization, 44labor markets, 10Labrador, 417lagging indicators, 199Las Vegas Gaming Revenues report, 126
market impact, 129tables, 128
Latin America, 15, 361layoffs, 52
Corporate Layoff and Hiring Announcementsreport, 64-69market impact, 69tables, 64-67
Mass Layoff Statistics (MLS) report, 70market impact, 74tables, 71
leaders, indicators, 14lock-up room, 1-6
MMacroeconomic Advisers, LLC, 75MacroMarkets, LLC, 360manufacturing
Business Outlook Survey, 242market impact, 245tables, 244
Canada, 417Empire State Manufacturing Survey, 236
market impact, 241tables, 237-240
Factory Orders report, 155-156market impact, 160tables, 156-159
Institute for Supply Management (ISM)Manufacturing Survey, 181-182market impact, 187tables, 183, 186
Institute for Supply Management (ISM) Non-Manufacturing Business Survey, 188-190
Japan, 375, 379Manufacturing Activity in the 5th District, 249
market impact, 251tables, 250
Manufacturing Survey of the 10th District, 246market impact, 247tables, 247
Manufacturing Activity in the 5th District, 249market impact, 251tables, 250
Manufacturing Purchasing Managers Index (PMI), 384-392
Manufacturing Survey of the 10th District, 246market impact, 247tables, 247
market impact, Construction Spending report, 233Market News International, 23marketing, 33markets
Australia, 424bonds, forecasting, 12exchange, 6impact
ADP National Employment report, 80-81Assets and Liabilities of Commercial Banks
in the United States report, 295

460 Index
Bloomberg Consumer Comfort Index, 121Business Inventories report, 168Business Outlook Survey, 245Chicago Purchasing Managers Index
(Business Barometer), 194-195Consumer Confidence Index, 116Consumer Credit Outstanding report, 111Consumer Price Index (CPI) report, 314Current Account Balance (U.S.
International Transactions) report, 289Durable Goods Orders report, 154E-Commerce Retail Sales report, 100Empire State Manufacturing Survey, 241Employer Costs for Employee
Compensation report, 345Employment Cost Index, 326-327Employment Situation report, 47-48Existing Home Sales report, 216Factory Orders report, 160Federal Open Market Committee (FOMC)
Statement, 266Federal Reserve Board’s Beige Book, 258Google Insights report, 125Gross Domestic Product (GDP) report,
146-147Help-Wanted Online Advertising report, 63Housing Starts and Building Permits report,
209Import and Export Prices report, 332-334Index of Leading Economic Indicators
(LEI), 202-203Industrial Production and Capacity
Utilization report, 179-180Institute for Supply Management (ISM)
Manufacturing Survey, 187Institute for Supply Management (ISM)
Non-Manufacturing Business Survey, 190
International Trade in Goods and Servicesreport, 280
Job Openings and Labor Turnover report, 54jobs reports, 47-48Las Vegas Gaming Revenues report, 129Manufacturing Activity in the
5th District, 251Manufacturing Survey of the
10th District, 247National Activity Index (CFNAI), 253
New Home Sales report, 222Personal Income and Spending report, 91-92Producer Price Index (PPI) report, 321-322Productivity and Costs report, 341Real Earnings report, 348Retail Sales report, 97-98Survey of Consumer Sentiment report, 119Treasury International Capital (TIC) System
report, 303-304Weekly Chain Store Sales report, 106Weekly Claims for Unemployment
Insurance, 58Weekly Mortgage Applications Survey
and the National Delinquency Survey,230
Yield Curve report, 354impact of business cycles on, 20jobs report, 31-33, 35labor, 10reactions to release of statistics, 5
Markit Economics (formerly NTC Economics), 384Mass Layoff Statistics (MLS) report, 70-74measurements of labor underutilization, 44Merchandise Trade Account, 284Mexico, establishment surveys, 34Middle East, instability, 15mining, Japan, 375Ministry of Economy, Trade, and Industry
(METI), 373Ministry of Statistics & Programme
Implementation, 403mobile phone apps (free), 429money, Web sites, 436monitoring performance, 16Moody’s, 397Mortgage Bankers Association (MBA), 227mortgages, Weekly Mortgage Applications Survey
and the National Delinquency Survey, 227-230
moving averages, 23MSNBC, 4
NNational Activity Index (CFNAI), 252-253National Association of Credit Management
(NACM), 355

461Index
National Association of Home Builders, 223National Association of Purchasing Management,
Chicago affiliate, 191National Association of Realtors, xxiii, 210National Bureau of Economic Research (NBER), 21National Bureau of Statistics (NBS), 398National Bureau of Statistics of China (NBS), 396National Federation of Independent Business
(NFIB), 356National Income and Product Accounts (NIPA), 140natural resources, Canada, 417negative growth, GDP, 21net exports of goods and services, 136, 142net long-term securities transactions, 302Netherlands, 15Nevada Gaming Commission, 126New Home Sales report, 217-218
market impact, 222tables, 218-222
New Residential Construction report, 204-209market impact, 209tables, 206-208
New York Mercantile Exchange, 5-6Newfoundland, 417news
Web sites, 429sources of global economic, 439
Nielsen Company, The, 100Nixon, Richard, 7nominal dollars, 24nominal GDP, 138Nondurable Goods, 134nonfinancial indicators, 197North American Free Trade Agreement
(NAFTA), 418
OOECD Composite Leading Indicators (CLI)
report, 393-395online, 60. See also InternetOPEC, 15openings, jobs, 49
market impact, 54Help-Wanted Online Advertising report, 59-60tables, 51-53, 60-63
Organization for Economic Cooperation andDevelopment (OECD), 393
origins of recessions, 27outsourcing, 64
Ppart-time jobs, 41. See also employmentpayments, transfer, 83payrolls. See also employment
private non-farm, 40surveys, 33, 35
Pending Home Sales Index (PHSI), 213People’s Republic of China. See Chinaperformance, monitoring, 16personal consumption expenditures (PCEs), 83,
133, 328Personal Income and Spending report, 82-85
market impact, 91-92tables, 85-91
personal income, 82. See also incomePonzi schemes, xxiipopulation surveys, 34predictions, 23
recessions, 61statistic attributes, 12
press release of government statistics, 3-6prices
Import and Export Prices report, 328-334Indexes, GDP, 138Japan, 381S&P/Case-Shiller U.S. National Home Price
Index, 360private inventories, change in, 135private non-farm payrolls, 40Producer Price Index (PPI) report, 317-322producer prices, 23production
Brazil Industrial Production report, 410-413China Industrial Production report, 396-400India Industrial Production and Inflation report,
403-406Japan, 375, 382
Productivity and Costs report, 335-341proprietors’ income, 83Proxmire, William, 7

462 Index
purchasingChicago Purchasing Managers Index (Business
Barometer), 191market impact, 194-195tables, 192
gross domestic, 137Purchasing Managers Index (PMI), 182
Q–Rquit levels, 53
rallies, stocks, 48. See also stocksrates
annual, 19exchange (Japan), 381quit levels, 53unemployment, 32
ratios, unemployed to job openings, 53reading jobs reports, 35-41, 44-48Real Earnings report, 346-348real GDP, 138reasons for job cuts, 66recessions, 10
Great Recession (2008-2009), 27-29predictions, 61stages of business cycles, 11U.S., 22
Regional Federal Reserve Bank Reports, 235regions, Manufacturing Purchasing Managers
Index (PMI), 384releases, schedule of, 429rental income, 83reports, xxiii
Architecture Billings Index, 359Assets and Liabilities of Commercial Banks in
the United States report, 291-295Australia, 422-423, 426Bloomberg Consumer Comfort Index, 120
market impact, 121tables, 121
Brazil Industrial Production report, 410-413Business Inventories report, 162-164
market impact, 168tables, 164, 167
Business Outlook Survey, 242market impact, 245tables, 244
Canada, 416-418Cass Freight Index, 357Chicago Purchasing Managers Index (Business
Barometer), 191market impact, 194-195tables, 192
China Industrial Production report, 396-400Construction Spending report, 232-233Consumer Credit Outstanding report, 107-108
market impact, 111tables, 108
Consumer Confidence Index, 112-114Consumer Price Index (CPI) report, 305-315Credit Manager’s Index, 355Current Account Balance (U.S. International
Transactions) report, 283-288Durable Goods Orders report, 148
market impact, 154tables, 149-152
E-Commerce Retail Sales, 99-100market impact, 100tables, 100
Empire State Manufacturing Survey, 236market impact, 241tables, 237, 239-240
Employer Costs for Employee Compensationreport, 342-345
Employment Cost Index report, 323-326Employment Situation, 31-35
market impact, 47-48tables, 35-46
Existing Home Sales report, 210market impact, 216tables, 211-216
Factory Orders report, 155-156market impact, 160tables, 156-159
Federal Budget (Web sites), 435Federal Open Market Committee (FOMC)
Statement, 260-268Federal Reserve (Web sites), 434Federal Reserve Board’s Beige Book, 255-259Germany
Consumer Price Index (CPI) Index, 368-370IFO Business Climate Index, 366Industrial Production report, 364ZEW Indicator of Economic Sentiment
report, 371

463Index
Google Insights report, 123-125Gross Domestic Product (GDP) report, 130
market impact, 146-147tables, 132-146
Help-Wanted Online Advertising report, 59-63Housing Market Index (NAHB), 223
market impact, 226tables, 224-226
Housing Starts and Building Permits report,204-205market impact, 209tables, 206-208
Import and Export Prices report, 328-334Index of Leading Economic Indicators (LEI),
196-200market impact, 202-203tables, 201-202
India Industrial Production and Inflation report,403-406
Industrial Production and Capacity Utilizationreport, 170-171market impact, 179-180tables, 173-178
Institute for Supply Management (ISM)Manufacturing Survey, 181-182market impact, 187tables, 183, 186
Institute for Supply Management (ISM) Non-Manufacturing Business Survey, 188market impact, 190tables, 190
interest rates (Web sites), 435International Trade in Goods and Services
report, 269-277, 280-282Japan
Industrial Production report, 373-375Tankan Survey, 378-383
Job Openings and Labor Turnover, 49market impact, 54tables, 51-53
jobs, 5, 31Las Vegas Gaming Revenues report, 126-128Manufacturing Activity in the 5th District, 249
market impact, 251tables, 250
Manufacturing Survey of the 10th District, 246market impact, 247tables, 247
National Activity Index (CFNAI), 252-253New Home Sales report, 217-218
market impact, 222tables, 218-222
OECD Composite Leading Indicators (CLI)report, 393-395
Personal Income and Spending, 82-85market impact, 91-92tables, 85-90
Producer Price Index (PPI) report, 317-322Productivity and Costs report, 335-341Real Earnings report, 346-348Regional Federal Reserve Bank reports,
235release of, 7Retail Sales, 93-94
market impact, 97-98tables, 94-97
S&P/Case-Shiller U.S. National Home PriceIndex, 360
Small Business Economic Trends report, 356Survey of Consumer Sentiment report, 117
market impact, 119tables, 118
Treasury International Capital (TIC) Systemreport, 296-304
Weekly Chain Store Sales, 102-104market impact, 106tables, 104
Weekly Claims for Unemployment Insurancereport, 55-56market impact, 58tables, 56
Weekly Mortgage Applications Survey and theNational Delinquency Survey, 227-228market impact, 230tables, 228-229
Weekly Railroad Traffic (Freight) report, 358Yield Curve report, 349, 352-354
Reserve Bank of Australia (RBA), 422resources, Canada, 417retail sales, 23Retail Sales report, 93-94
market impact, 97-98tables, 94-97
Retail Trade report (Australia), 422-426Reuters, 4, 23

464 Index
revisions, 24Employment Situation report, 31Job Openings and Labor Turnover report, 49
Richard Ivey School of Business, 416risk, currencies, 362
SS&P/Case-Shiller U.S. National Home Price
Index, 360salaries, 83, 343sales
E-Commerce Retail Sales report, 99-100market impact, 100tables, 100
Retail Sales report, 93-94market impact, 97-98tables, 94, 96-97
Weekly Chain Store Sales report, 102-104market impact, 106tables, 104
savings, 84domestic, 16
schedule of releases, 429seasonal adjustments, 25-26seasonal employment
demand, 61quit rates, 53
securities, U.S. treasury, 48self-employment income, 83. See also employ-
mentservices, Canada, 417-418Services Trade Account, 284shipments, Durable Goods Orders report, 152shocks, xxiiSmall Business Economic Trends report, 356sources
of global economic news, 439jobs reports, 32
stages of business cycles, 11Standard & Poor’s, 397states
labor demand, 61Weekly Claims for Unemployment Insurance
report, 56statistics
attributes, 10best megasites for, 444
Canada, 416-418government release of, 2-6Mass Layoff Statistics (MLS) report, 70
market impact, 74tables, 71
Web sites, 436, 439-444stocks, 5
ADP National Employment report, 81Bloomberg Consumer Comfort Index, 122Business Inventories report, 168Business Outlook Survey, 245Chicago Purchasing Managers Index (Business
Barometer), 194Consumer Confidence index, 116Consumer Credit Outstanding report, 111Consumer Price Index (CPI) report, 315-316Corporate Layoff and Hiring Announcements
report, 69Current Account Balance (U.S. International
Transactions) report, 289Durable Goods Orders report, 154E-Commerce Retail Sales report, 100Empire State Manufacturing Survey, 241Employment Cost Index, 327Existing Home Sales report, 216Factory Orders report, 161Federal Open Market Committee (FOMC)
Statement, 268Federal Reserve Board’s Beige Book, 258Gross Domestic Product (GDP) report,
146-147Help-Wanted Online Advertising report, 63Housing Market Index (NAHB), 226Housing Starts and Building Permits report,
209Import and Export Prices report, 333-334Index of Leading Economic Indicators (LEI),
203indicators most sensitive to, 13Industrial Production and Capacity Utilization
report, 180Institute for Supply Management (ISM)
Manufacturing Survey, 187international markets, 362International Trade in Goods and Services
report, 282Job Opening and Labor Turnover, 54jobs report, 31-35, 48Manufacturing Activity in the 5th District, 251

465Index
Manufacturing Survey of the 10th District, 248New Home Sale report, 222Personal Income and Spending report, 92Producer Price Index (PPI) report, 322Productivity and Costs report, 341Real Earnings report, 348Retail Sales report, 97-98Survey of Consumer Sentiment report, 119Treasury International Capital (TIC) System
report, 304Weekly Chain Store Sales report, 106Weekly Claims for Unemployment
Insurance, 58Weekly Mortgage Applications Survey and the
National Delinquency Survey, 230-231Yield Curve report, 354
strong dollars, 331. See also dollarssummaries. See also reports
establishment data, 38household data, 35
Survey of Consumer Sentiment report, 117market impact, 119tables, 118
surveys. See also reportsBusiness Outlook Survey, 242
market impact, 245tables, 244
consensus, 22-23Empire State Manufacturing Survey, 236
market impact, 241tables, 237-240
establishment, 33-35household, 32-35Institute for Supply Management (ISM)
Manufacturing Survey, 181-182market impact, 187tables, 183, 186
Institute for Supply Management (ISM) Non-Manufacturing Business Survey, 188market impact, 190tables, 190
Manufacturing Activity in the 5th District, 249market impact, 251tables, 250
Manufacturing Survey of the 10th District, 246market impact, 247tables, 247
Switzerland, 15
Ttables
ADP National Employment report, 77-79Assets and Liabilities of Commercial Banks in
the United States report, 292-295Bloomberg Consumer Comfort Index, 121Business Inventories report, 164-168Business Outlook Survey, 244Chicago Purchasing Managers Index (Business
Barometer), 192Construction Spending report, 233Consumer Confidence Index, 114-115Consumer Credit Outstanding report, 108-111Consumer Price Index (CPI) report, 311-312Corporate Layoff and Hiring Announcements,
65-68Current Account Balance (U.S. International
Transactions) report, 286-289Durable Goods Orders report, 149-154E-Commerce Retail Sales report, 100Empire State Manufacturing Survey, 237-241Employer Costs for Employee Compensation
report, 343-345Employment Cost Index, 325-326Employment Situation report, 35-47Existing Home Sales report, 211-216Factory Orders report, 156-160Federal Open Market Committee (FOMC)
Statement, 264Federal Reserve Board’s Beige Book, 258Gross Domestic Product (GDP) report,
132-146Help-Wanted Online Advertising report, 60-63Housing Market Index (NAHB), 224-226Housing Starts and Building Permits report,
206-208Import and Export Prices report, 329-332Index of Leading Economic Indicators (LEI),
201-202Industrial Production and Capacity Utilization
report, 173-179Institute for Supply Management (ISM)
Manufacturing Survey, 183-187Non-Manufacturing Business Survey, 190
International Trade in Goods and Servicesreport, 272-280
Job Openings and Labor Turnover report, 51-54

466 Index
Las Vegas Gaming Revenues report, 128Manufacturing Activity in the 5th District,
250-251Manufacturing Survey of the 10th District, 247Mass Layoff Statistics (MLS) report, 71-74National Activity Index (CFNAI), 253Personal Income and Spending report, 85-91Producer Price Index (PPI) report, 319-321Productivity and Costs report, 339-341Real Earnings report, 347-348Retail Sales report, 94-97Survey of Consumer Sentiment report, 118-119Treasury International Capital (TIC) System
report, 298-303Weekly Chain Store Sales report, 104-105Weekly Claims for Unemployment
Insurance, 56-57Weekly Mortgage Applications Survey and the
National Delinquency Survey, 228-230Yield Curve report, 353-354
Target, 103television, release of government statistics, 3-6terminology
annual rates, 19benchmarks, 24business cycles, 20-22consensus surveys, 22-23constant dollars, 24moving averages, 23nominal dollars, 24revisions, 24seasonal adjustments, 25-26
Thomson Reuters, 117timeliness of indicators, 11trade
Canada, 418international, 433
transfer payments, 83Treasury International Capital (TIC) System
report, 296-304Treasury securities, Yield Curve report, 349-354trends, Small Business Economic Trends
report, 356Truman, Harry S., 59turnover, labor, 49
market impact, 54tables, 51-53
UU.S. (United States)
Consumer Price Index (CPI) report, 305-315dollar value, 14economic indicators, 6, 10-14indicators
ADP National Employment report, 75-81Architecture Billings Index, 359Assets and Liabilities of Commercial Banks
in the United States report, 291-295Bloomberg Consumer Comfort Index,
120-121Business Inventories report, 162-168Business Outlook Survey, 242-245Cass Freight Index, 357Chicago Purchasing Managers Index
(Business Barometer), 191-195Construction Spending report, 232-233Consumer Credit Outstanding report,
107-111Consumer Confidence Index, 112-114Corporate Layoff and Hiring
Announcements report, 64-69Credit Manager’s Index, 355Current Account Balance (U.S.
International Transactions) report, 283-288
Durable Goods Orders report, 148-154E-Commerce Retail Sales report, 99-100Empire State Manufacturing Survey,
236-241Employer Costs for Employee
Compensation report, 342-345Employment Cost Index report, 323-326Employment Situation report, 31-41, 44-48Existing Home Sales report, 210-216Factory Orders report, 155-1160Federal Open Market Committee (FOMC)
Statement, 260-268Federal Reserve Board’s Beige Book,
255-259Google Insights report, 123-125Gross Domestic Product (GDP) report,
130-143, 145-147Help-Wanted Online Advertising report,
59-63

467Index
Housing Market Index (NAHB), 223-226Housing Starts and Building Permits report,
204-209Import and Export Prices report, 328-334Index of Leading Economic Indicators
(LEI), 196-203Industrial Production and Capacity
Utilization report, 170-180Institute for Supply Management (ISM)
Manufacturing Survey, 181-187Institute for Supply Management (ISM)
Non-Manufacturing Business Survey,188-190
International Trade in Goods and Servicesreport, 269-272, 276-282
Job Openings and Labor Turnover report,49-54
Las Vegas Gaming Revenues report, 126-129Manufacturing Activity in the 5th District,
249-251Manufacturing Survey of the 10th District,
246-247Mass Layoff Statistics (MLS) report, 70-74National Activity Index (CFNAI), 252-253New Home Sales report, 217-222Personal Income and Spending report, 82-92Producer Price Index (PPI) report, 317-322Productivity and Costs report, 335-341Real Earnings report, 346-348Regional Federal Reserve Bank reports, 235Retail Sales report, 93-98S&P/Case-Shiller U.S. National Home
Price Index, 360Small Business Economic Trends report, 356Survey of Consumer Sentiment report,
117-119Treasury International Capital (TIC) System
report, 296-304Web sites, 429-438Weekly Chain Store Sales report, 102-106Weekly Claims for Unemployment
Insurance report, 55-58Weekly Mortgage Applications Survey and
the National Delinquency Survey, 227-230
Weekly Railroad Traffic (Freight) report, 358Yield Curve report, 349, 352-354
recessions, 22Treasury, 48, 373
underutilization, labor, 44unemployment
duration of, 44rates, 5, 32reasons for, 42Weekly Claims for Unemployment Insurance
report, 55-56market impact, 58tables, 56
unfilled orders, Durable Goods Orders report, 152-153
Unilateral Transfers, 284United Kingdom, 15University of Michigan, 117
Vvalues, currencies, 362
Wwages, 83, 343Wal-Mart, 103Wall Street
equities, 5investments. See investmentsopportunities from economic numbers, 7
Wanted Technology, 60weak dollars, 331. See also dollarsWeb sites
Calendar of Releases for Foreign EconomicData, 439
international indicatorsbest megasites for statistics, 444-445economic statistics from other countries,
439-444sources of global economic news, 439
U.S. indicators, 429-438construction activity/home sales, 433consumer behavior, 431credit/money, 436employment conditions, 432Federal Budget reports, 435

468 Index
Federal Reserve reports, 434free mobile phone apps, 429inflation, 434interest rates, 435international trade, 433news, 429schedule of releases, 429statistics, 436U.S. dollar, 436
Weekly Chain Store Sales report, 102-104market impact, 106tables, 104-105
Weekly Claims for Unemployment Insurancereport, 55-58
weekly hours and overtime, 40Weekly Mortgage Applications Survey and the
National Delinquency Survey, 227-228market impact, 230-231tables, 228-230
Weekly Railroad Traffic (Freight) report, 358Wells Fargo, 223Western University, Canada, 416wholesale price index (WPI), 406World Trade Organization (WTO), 397World War II, 368
recessions since, 21
X–Y–Zyen, 373. See also currenciesYield Curve report, 349-354yuan, 405. See also currencies
ZEWCentre for European Economic Research, 371Indicator of Economic Sentiment report, 371