beringer weinstock group - ta signals
TRANSCRIPT

8/2/2019 Beringer Weinstock Group - TA Signals
http://slidepdf.com/reader/full/beringer-weinstock-group-ta-signals 1/33
DanWantrobski, CMT
215-665-4446
[email protected] STRATEGY
October 14, 2009
Equity Research
Industry Report
Fourth Quarter 2009 Outlook
INVESTMENT CONCLUSION:
We remain of the opinion that U.S. equity markets reside within a cyclical bull market- born between the October 2008lows and the March 2009 lows. Cyclical uptrends tend to be multi-month (oftentimes multi- year ) phenomenon that provide a rising tide for most sectors and stocks to enjoy. We believe the current tide can carry us into the New Year andallow the S&P 500 to reach targets within the 1140-1180 region. Though nominal lows for this structural bear marketcould have been finalized via the 666 print on the SPX back in March, we highly doubt that the U.S. markets areembarking upon a new secular bull market right now. In fact, we strongly believe that current strength will be met by yetanother cyclical bear market in the years ahead (possibly as early as 2010), which will serve to carve out a multi-year trading range in the key benchmark indices and eventually exhaust the secular bear (in place since 2000) once and for all.
KEY POINTS:
• Markets remain oversold, internal lows present a positive divergence, the 'best summer ever' bodes well for year-end, breadth has been strong and banks are participating- all feathers in the cap of our current uptrend
• Looking for SPX targets within 1140-1180; Dow targets within 10,400-11,000; and NASDAQ targets within2400-2600
• Despite our bullishness heading into Q4, we still believe the markets remain within a deflationary bear marketoverall- and that key ingredients (such as technical breakouts, valuations, demographics, and credit expansion) arenot yet in place to warrant the call for a new secular bull market in stocks
• The U.S. dollar will continue to play an important role in the months ahead
• Interest rates likely to remain range-bound, but at historically low levels, as we continue on within a deflationary bear cycle
• Commodities remain within a secular uptrend, through recent strength has pushed the precious metals intooverbought territory as we head into Q4 2009
Research Analyst Certifications and Important Disclosuresare on page 33 of this report

8/2/2019 Beringer Weinstock Group - TA Signals
http://slidepdf.com/reader/full/beringer-weinstock-group-ta-signals 2/33
U.S. Equity Markets Within Cyclical Uptrend…
We remain of the opinion that U.S. equity markets reside within a cyclical bull market- born between the October 2008
lows and the March 2009 lows. Cyclical uptrends tend to be multi-month (oftentimes multi- year ) phenomenon which
provide a rising tide for most sectors and stocks to enjoy. We believe the current tide can carry us into the New Year andallow the S&P 500 to reach targets within the 1140-1180 region. Though nominal lows for this structural bear market
could have been finalized via the 666 print on the SPX back in March, we highly doubt that the U.S. markets are
embarking upon a new secular bull market right now. In fact, we strongly believe that current strength will be met by yet
another cyclical bear market in the years ahead (possibly as early as 2010), which will serve to carve out a multi-year
trading range in the key benchmark indices and eventually exhaust the secular bear (in place since 2000) once and for all.
A. Markets Remain Oversold on Long-term Charts
All three indicators we track- stochastcs, MACD, and RSI- are still trending higher from oversold territory on thelong-term monthly charts of the S&P 500. This comes after the index reached some of its most oversold conditions in
modern history, off the back of its 2008-2009 decline. In particular, the monthly MACD indicator (center) hastriggered a cyclical ‘buy’ signal due to its recent bullish cross.
SPX: 1076.18
Still bullish!
Here is what we are currently looking at:
- 2 -

8/2/2019 Beringer Weinstock Group - TA Signals
http://slidepdf.com/reader/full/beringer-weinstock-group-ta-signals 3/33
DJIA: 9851.86
The Dow Jones Industrial Average sports the same bullish set of indicators at this time as well. As we can see
via the long-term monthly chart above, stochastics, MACD, and RSI are all trending higher from deep oversold
territory. Furthermore, the MACD indicator (center) sports a recent bullish cross and has quite a distanceto travel simply to mean revert back to its zero line.
Comparisons to the 1929-1932 period have the bears awaiting another major down wave (and soon…), which
would bring us to new lows (below 666 on the S&P; below 6469 on the Dow) within the next several months.
The MACD indicator would disagree with this assessment- and instead suggests that any short-term weakness /
retracement in the market should be used as a buying opportunity.
DJIA: 1924-1946 1929
1932
The monthly MACD on the Dow triggered a bullish cross from deep oversold territory in 1932. It signaled the
cyclical bull market from the 1932 lows to the 1937 peak- a 5-year run that witnessed a nominal gain of more
than 200% for the Average. Furthermore, from 1929 to 1932, this MACD indicator gave no false signals-
remaining bearish for the entire decline until the bottom was achieved in 1932. Though history does not repeat
itself, we believe the current position and cross of the MACD bodes well for a higher Dow into 2010 as the
indicators reverts back to its zero line on these monthly charts.
- 3 -

8/2/2019 Beringer Weinstock Group - TA Signals
http://slidepdf.com/reader/full/beringer-weinstock-group-ta-signals 4/33
COMP: 2132.32
The NASDAQ Composite (COMP) also sports bullish indicators on its monthly charts. As we can see in the chart
above, the stochastics, MACD and RSI are all still trending higher from their recent oversold position. And here
again, the COMP is sporting a bullish MACD cross. There is one caveat in regards to the COMP however: the
index- through leading the charge technically in the market rally thus far, has pushed itself into its declining 30-
week moving average (red line; upper red circle above). The moving average currently resides at 2165 and may
present the index with some stiff resistance on a short-term basis. Bullish support from this longer-term perspectivewould come at the COMP’s rising 10-month line, which currently sits near the 1800 zone. If we are indeed within
a cyclical uptrend, the index should have no problem punching through its 30-week in the months ahead, en route
to targets north of 2,500.
B. 80-Month MA Indicator Supports Cyclical Bull
Even though an overbought correction can hit us over the short-run, the long-term charts still have us trending
higher from deep oversold conditions- in fact with plenty of room to run higher before the markets become
overheated on a cyclical basis. Though we have shown this condition mainly through the use of the MACD line,
have a look at a lesser known indicator that we take out from the vaults during market panics- the 80-monthmoving average indicator:
- 4 -

8/2/2019 Beringer Weinstock Group - TA Signals
http://slidepdf.com/reader/full/beringer-weinstock-group-ta-signals 5/33
C. Extremes Reached in 2008: Positive Divergence
In the long-term chart above, we plot the monthly close of the S&P 500 (black line) against its 80-month moving
average indicator (gray line). This indicator performs like an oscillator- running between overbought and oversold
market conditions on a very long-term scale. When market panics occur (in fact during most of the cyclical bear
markets of the last 100-years or so), we will typically see the indicator break below the zero line (0%, shown via the
red dashed line above) as the market lodges itself into deep oversold territory.
It is rare for this indicator to register extremes well below that zero threshold. In fact, we note through the red circles
above where the indicator posted a reading at or below -20% (indicating extreme levels had been reached): 1932,1942, 1974, 2002, and 2009. Each of the instances prior to 2009 proved to be a cyclical market bottom (where
1942 is believed to be a secular market bottom by some historians). In other words, the panic of ’08-’09 has put us in
some good company, historically speaking.
Furthermore, what is intriguing about this indicator is that it tends to revert back to the zero line (and in many cases
beyond), once such extremes are reached. Notice that according to its current location then, there is still some
distance left to travel upward before we hit neutral territory. This in fact bodes well for the presence of a cyclical
uptrend in our opinion- one that can potentially take us past 1100 on the S&P into the New Year in our view.
The chart above illustrates the fact that the U.S. equity markets actually made an internal low last year during the
October-November capitulation phase- when new 52-week lows reached an extreme reading (white circle above).
This level was the highest since the 1998 emerging markets crisis and 1987 crash (which both occurred against the
backdrop of a secular bull trend), eclipsing even the levels reached during our last cyclical market bottom in 2002.We now know that the indices went on from their October-November levels to make new nominal lows this past
March against a much smaller portion of new 52-week lows: this is a sign of positive divergence; a signal of sellingexhaustion – which is ultimately healthy for the markets from a technical perspective.
October ‘08
March ‘09
New 52-week Lows
The markets made lower-lows on
fewer new 52-week lows- a sign of
exhaustion, and a positive
divergence in our opinion.
- 5 -
8/2/2019 Beringer Weinstock Group - TA Signals
http://slidepdf.com/reader/full/beringer-weinstock-group-ta-signals 6/33
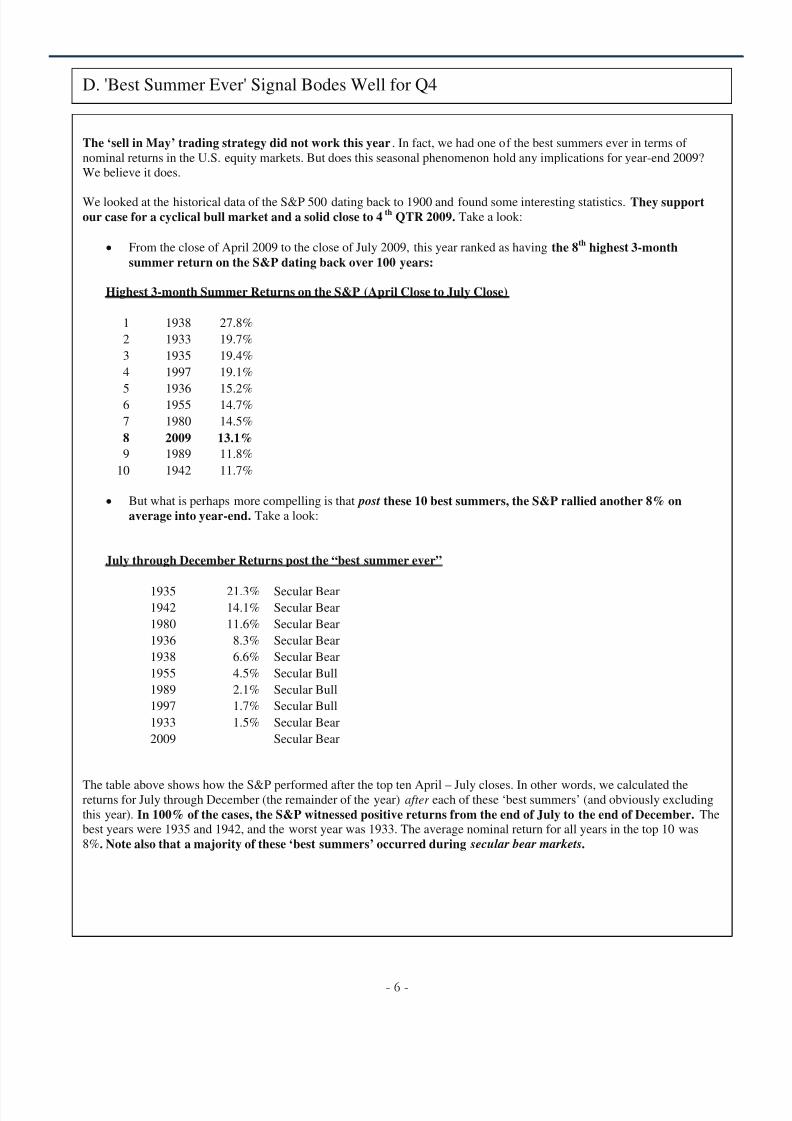
The ‘sell in May’ trading strategy did not work this year. In fact, we had one of the best summers ever in terms of
nominal returns in the U.S. equity markets. But does this seasonal phenomenon hold any implications for year-end 2009?
We believe it does.
We looked at the historical data of the S&P 500 dating back to 1900 and found some interesting statistics. They supportour case for a cyclical bull market and a solid close to 4 th QTR 2009. Take a look:
x From the close of April 2009 to the close of July 2009, this year ranked as having the 8th highest 3-monthsummer return on the S&P dating back over 100 years:
Highest 3-month Summer Returns on the S&P (April Close to July Close)
1 1938 27.8%
2 1933 19.7%
3 1935 19.4%
4 1997 19.1%
5 1936 15.2%6 1955 14.7%
7 1980 14.5%
8 2009 13.1%
9 1989 11.8%
10 1942 11.7%
x But what is perhaps more compelling is that post these 10 best summers, the S&P rallied another 8% onaverage into year-end. Take a look:
July through December Returns post the “best summer ever”
1935 21.3% Secular Bear1942 14.1% Secular Bear
1980 11.6% Secular Bear
1936 8.3% Secular Bear
1938 6.6% Secular Bear
1955 4.5% Secular Bull
1989 2.1% Secular Bull
1997 1.7% Secular Bull
1933 1.5% Secular Bear
2009 Secular Bear
The table above shows how the S&P performed after the top ten April – July closes. In other words, we calculated thereturns for July through December (the remainder of the year) after each of these ‘best summers’ (and obviously excluding
this year). In 100% of the cases, the S&P witnessed positive returns from the end of July to the end of December. The
best years were 1935 and 1942, and the worst year was 1933. The average nominal return for all years in the top 10 was
8%. Note also that a majority of these ‘best summers’ occurred during secular bear markets.
D. 'Best Summer Ever' Signal Bodes Well for Q4
- 6 -

8/2/2019 Beringer Weinstock Group - TA Signals
http://slidepdf.com/reader/full/beringer-weinstock-group-ta-signals 7/33
x When we use this data to calculate some potential year-end target zones for the S&P 500, we get the following:
o If the index falls at the low-end of the range of returns (in line with 1933), it would imply a year-end level
near 1002. We are well past this target as of October 2009.
o If the index performs on average with all data points in the this study (8% return), it would imply a year-end
level near the 1066 zone- we reached this milestone when the index traded to our target zone of 1040-1080
just a few weeks ago, and have recently tested this zone as support in early October.
o If the index falls at the upper end of the range of returns (1935), it would imply a year-end level near 1197-
essentially in line with the S&P’s declining 30-month moving average (which will be just below 1200 nextmonth).
It still may not be easy sailing into year-end…
In our study of these ‘best summers,’ we also found that a majority of them witnessed a sizable correction between the July
close and the December close (so far, we haven’t had one…)- the four exceptions were 1935, 1936, 1942 and 1980- and as we
can see from the chart above, these were the top four best performers for the remainder of the year. This suggests to us that2009 can still witness a correction or retracement in the fourth quarter that is bigger than our summer retracement(which proved to be rather shallow).
The average magnitude of a second half correction in these ‘best summer’ years was around -13% from peak to trough. This
implies that if the recent highs near 1080 were to be the temporary peak heading into year-end, a correction or retracement
could take the S&P down toward the 940 zone before rallying again. We believe the 50-day moving averages will be the firstalert to such a development- for now, they are still rising- which suggests we should remain fully invested.
Despite the common belief that summers and the stock markets don’t mix, 2009 managed to make history. If we look at how
the other ‘best summer’ years played out heading into the 4th
quarter, it gives us a generally positive picture for year-end ‘09.
Of course, this data also tells us that the road to December will not be without its bumps; but clearly at this time statistical data
argues for a long position in the equity markets, with perhaps an opportunity to pick up more shares at cheaper levels in the
weeks just ahead.
E. Bonus: The ‘Best Summer Ever’ Ended on a Positive Outside Month…
SPX: 1069.31
Not only did the U.S. equity markets give us one of the best summers in modern history, it ended with positive outside months
being posted on the SPX, Dow, and COMP- as well as a host of sectors that make up these indices. Positive outside months
are a reversal phenomenon- where higher highs, lower lows and a higher close over the previous month are all recorded.
Though in and of themselves they cannot trigger full-blown bull markets, when combined with other long-term technical
attributes (such as we have noted in this report) they can help support the argument for a multi-month period of rising equity
prices.
- 7 -

8/2/2019 Beringer Weinstock Group - TA Signals
http://slidepdf.com/reader/full/beringer-weinstock-group-ta-signals 8/33
BKX vs SPX
BKX underperforms as sign of
impending 2000 market top…
Banks begin
outperforming prior to the
cyclical bull market of
2003-2007
Banks break down
in early 2007
Thus far, this key segment of the marketplace has not only participated in the broader market uptrend, but has for the mostpart led in terms of performance (vs other sectors of the S&P 500). That is a good characteristic for any equity uptrend-and we believe it must remain this way in order for us to achieve targets just shy of 1200 on the SPX in 2010.
In the chart above, we plot the relative strength of the BKX index versus the S&P 500. Since RS charts display the same
technical characteristics as nominal price charts, we can extrapolate current patterns to forecast future performance trends.
Our current position has the banking sector still within oversold territory and reverting higher against the S&P. This implies
that the banking sector can continue to outperform the broader markets in the weeks / months ahead. Again, this is an
important development since the health of the broader cyclical bull market depends on how the banks will act in the future.
While it is still early to suggest that a major long-term uptrend in outperformance (banks vs SPX) has commenced, this
chart implies that it could take several more months to correct the oversold condition. In other words, a continued ‘mean
reversion’ higher on this chart would be a positive development for both the banking sector as well as the broader markets
in our opinion.
F. Breadth has been Supportive Thus Far
Off the March lows, we have seen very positive sector participation throughout most of the market surge. Our breadth
indicator has tracked several strong ‘buying participation’ days with relatively few ‘heavy bleeding’ sessions. As a result,
the S&P has been able to make new recovery highs and is now positive for the year on strong breadth readings
overall. This bodes well for the internal health of the markets- and suggests that interest has not been lop-sided and sector-based, but rather in stocks ‘in aggregate.’ To put it simply- so far, the engine has been firing on all cylinders in our view-
and this is a bullish technical characteristic. We would like to continue to see the SPX push higher with readings of 1500 or
greater on our breadth indicator (shown above).
G. Banks Still Acting Well Technically (No Banks, No Bull…)
- 8 -

8/2/2019 Beringer Weinstock Group - TA Signals
http://slidepdf.com/reader/full/beringer-weinstock-group-ta-signals 9/33
Conclusion: We are still on track for SPX 1140-1180…
We believe that current technical conditions are conducive to higher index levels into 2010. This is not to say there is no
downside risk right now (in fact, we will address our feelings regarding this Q4 risk in the next section). Rather it suggests
that the primary market trend has shifted (from cyclical bear to cyclical bull), and this is likely to carry stock prices higher
into next year in our view. We continue to look at the following levels as potential upside targets in the months ahead:
SPX: 1072.86
A 50% retracement of the prior bear decline-
coupled with this cyclical downtrend line
(red circle) and the index’s declining 30-
month moving average suggest a resistance
range within the 1140-1180 zone on theS&P in the months ahead.
DJIA: 9878.47
A 50% retracement of the prior bear decline-coupled with this cyclical downtrend line (red
circle) and the index’s declining 30-month
moving average suggest a resistance range
within the 10400-11000 zone on the DJIA in
the months ahead.
COMP: 2141.25
The COMP has been a technical leader for some time now…the index has already broken through its respective
50% retracement (2065) and is en route toward a 61.8% retracement near the 2260 zone. We noted earlier that the
COMP’s declining 30-month moving average lies just near 2200- and this may provide some initial resistance.
However, if this is broken going forward, we believe the COMP can achieve targets within the 2400-2600 range
into the New Year.
- 9 -

8/2/2019 Beringer Weinstock Group - TA Signals
http://slidepdf.com/reader/full/beringer-weinstock-group-ta-signals 10/33
Keep in mind- these targets may be conservative, if history is any guide…
Past cyclical bull markets (within a broader structural bear cycle) have many times retraced 100% of the prior bear decline.
The cyclical bull from 2003 to 2007 is a prime example, but so is the entire secular bear market from 1966 to 1982:
1970 c clical bottom
1974 c clical bottom
SPX: 1967-1980
2002-2003 cyclical bottom
SPX: 1073.27
Current
If we were to see similar cyclical performance trends this time around, it would imply an S&P target in the vicinityof 1500, a Dow target north of 12,000, and the NASDAQ approaching the 3100 zone.
While we admit these targets are possible, it remains our belief that the U.S. equity markets will likely finish out the secular
bear cycle within a more muted trading range- one that may stall out before the prior cyclical peaks are met.
- 10 -

8/2/2019 Beringer Weinstock Group - TA Signals
http://slidepdf.com/reader/full/beringer-weinstock-group-ta-signals 11/33
‘New Normal’ for Cyclical Trends?
Our belief is that secular bear markets typically ‘go out like lambs’ instead of lions. That is to say that in the past,
a crash and final lows (capitulation) have never marked the true end of a secular bear market cycle. Rather, the market
would go on to stabilize and base-build in a series of smaller cyclical waves during subsequent years that completed a
large trading range. As the bear then ‘petered’ out in the aftermath of the final crash lows, the majority of investors
simply turned their backs on the stock markets, leaving them to the traders as valuations pushed toward historical
trough levels.
We do not expect this deflationary bear market to be an exact replica of past secular bears; but we do expect (and have
already achieved) similar developments and macro events that surround such trading ranges (such as market crashes,
recessions, massive government intervention, etc.). Furthermore, past U.S. experiences argue that we can have several
more years of range-bound / cyclical markets before the next secular trend (a bullish one) takes hold.
S&P through inflationary bear: 1960s-1980S&P through deflationary bear: 1930s-1940s
Major crash/lows
End of bear…
Major crash/lows
End of bear…
In the two historical charts above, we plot the S&P 500 from the late-1920s through the 1940s (left) and then again from
the early-1960s through the 1980s. We have indicated the final lows by red circles: these were the ‘capitulation’ points
that marked the market crash / flush-out. Note that in subsequent years, these lows were never again breached, yet the
index failed to break to new highs past its prior secular peaks. We think these charts provide some good insights into what
we can expect in the years ahead: a continued series of ‘cyclical’ market swings which are more muted in terms of size
and scope.
There is a distinct difference between these two graphs: during the inflationary bear market of the ‘60s and ‘70s, the S&P
was able to retest its prior peak (a few times in fact); while during the deflationary bear market of the ‘30s and ‘40s, the
index was unable to achieve such heights. Because we believe our current cycle puts us within a deflationary bear market,
we feel the remaining years of this bear will more closely resemble that of the 1930s-1940s period: again, a more muted
trading range that can very well fall short of prior peaks during its next few cyclical uptrends (such as the one we are
currently in).
- 11 -
8/2/2019 Beringer Weinstock Group - TA Signals
http://slidepdf.com/reader/full/beringer-weinstock-group-ta-signals 12/33
Within this theme of a more muted trading range going forward, we would like to state again that we do not believe
history constantly repeats, but rather rhymes with itself through long-term cycles (a similar concept to the business
cycle, though not as widely accepted by western academia….). Outside of questioning the sustainability of our recentbear market rally (which we feel more closely resembles a cyclical bull market), folks are starting to ponder whether or
not this could be our very own 1974…or 1932…or even 1982…. These years are significant to market historians
because each of them marked either a cyclical or secular stock market bottom. Though none of them created underlying
prosperity right away, from an investment perspective there was at least a final capitulation that created a floor in these
years through which stock prices would never again break.
So what if there is another scenario- perhaps suggesting that the worst is indeed over, but the aftermath may prove anti-
climatic to both bulls and bears?
What if this isn’t 1982, but rather 1938?
Over the past several years, chart comparisons between the S&P 500 during the Great Depression and the NASDAQ
Composite of today have been brought up from time to time. The comparisons are not without merit in our opinion:x Both indices peaked in an historic bubble built from years of prosperity (and culminating in greed)- the S&P
in 1929 and the COMP in 2000
x Both were considered gauges of a new age- a new economy if you will, where the S&P represented industrial /
transportation technology, and the COMP represented computer / internet technology- both promising a ‘new
metric’ of infinite rising productivity and prosperity (at their heights no less)
x Both crashed approximately 70% from peak to trough once the bubble burst- over the course of 2-3 years (the
S&P from 1929-1932; the COMP from 2000-2003)
x Both witnessed a strong 4-5 year cyclical bull market post the crash- retracing nearly 50% of the prior move
before succumbing to yet another cyclical bear decline
x Both did all of this over the course of nearly a decade… as interest rates declined and commodity prices
inflated …
To sum up- pattern, magnitude, and duration all line up in eerie fashion during the deflationary bear marketcycles of the 1930s-1940s and today- suggesting that for the NASDAQ Composite at least, it may be 1938 all overagain:
In the chart on the following page, we plot the S&P 500 from 1929 through the Great Depression (our last deflationary
bear market cycle) against the NADSAQ Composite from 1998 through present. While we understand that one week’s,
or one month’s (or even one year’s) worth of coincidence should be discarded, we are now going on nearly 15 years of
seeing these key benchmarks track each other almost perfectly. How can/should this be explained? The people that
participated in the Crash of ’29 and subsequent Great Depression are long gone…what is the invisible hand that is
driving such multi-year correlation? We believe the answer lies in our long-term cycle work- which suggests that just
like the seasons of the year, the financial markets pass through a continuous, repetitive loop- one where the singers may
change, but the song remains the same.
1938 All Over Again?
- 12 -

8/2/2019 Beringer Weinstock Group - TA Signals
http://slidepdf.com/reader/full/beringer-weinstock-group-ta-signals 13/33
What are the Implications
If these charts remain correlated, and we are to view our current position within the deflationary cycle as being closest to
that of 1938, it would imply that the second half of 2009 should end reasonably well but we should expect another cyclical
downturn sometime in 2010. That next cyclical bear decline is not likely to break the March 2009 lows by any significant
percentage, but more importantly- will mark the beginning of a new secular bull market in equities.
1938 was ‘the Best Summer Ever’…
As noted in the pages above, 1938 was also number 1 in summer returns since 1900- garnering an impressive 27% returnover the course of three months:
Highest 3-month Summer Returns on the S&P (April Close to July Close)
1 1938 27.8%
2 1933 19.7%
3 1935 19.4%
4 1997 19.1%
5 1936 15.2%
6 1955 14.7%
7 1980 14.5%
8 2009 13.1%
9 1989 11.8%
10 1942 11.7%
With both the S&P and the COMP losing approximately 56% off their prior cyclical peaks (the S&P in 1937 and the COMP
in 2007), we looked closer into the duration and return of the 1938 cyclical upturn:
x From its lows in March of 1938 to its intraday highs in November of 1938, the S&P gained 66% from trough to
peak. If we apply these returns to the NASDAQ Composite, it would imply an upside target of approximately
2100. This was achieved this past September- and the COMP is now hovering within this zone as we pen this
piece.
x If we were to apply this same calculation to the S&P and Dow today (using their respective March lows), it would
render the following targets:
The S&P from 1929 vs the COMP of Today
- 13 -

8/2/2019 Beringer Weinstock Group - TA Signals
http://slidepdf.com/reader/full/beringer-weinstock-group-ta-signals 14/33
SPX: 1075.06
…where 1120 is a 50% retracement of the 2007 cyclical bear decline for the S&P, and other technical
factors allow for targets closer to the 1140-1180 region.
…where 10,300 is a 50% retracement of the 2007 cyclical bear decline for the Dow, and we see the potential for a
“right shoulder rally” to come to fruition on the long-term charts.
The duration of recent cyclical swings appears to have increased when comparing today to 1938. Both the cyclical
bull of 2003-2007 and the subsequent cyclical bear of 2007-2009 have ‘right translated’ by several months, whichimplies that November of 2009 does not necessarily have to mark the peak of our current rally effort. Rather itsuggests in our view that a cyclical peak will be reached sometime in 2010.
With these cyclical patterns and targets in mind, let us now turn to potential risk, and how we intend to mange the
markets in the weeks and months ahead.
DJIA: 9866.30
- 14 -

8/2/2019 Beringer Weinstock Group - TA Signals
http://slidepdf.com/reader/full/beringer-weinstock-group-ta-signals 15/33
Risk: 4th
Quarter and Beyond…
As noted earlier, based on historical precedent we believe there is potentially 13% downside risk for the equity markets over
the next 2 ½ months. Furthermore, we believe that such a decline would provide another good buying opportunity for stocks
in general, as we are still within a cyclical uptrend. But beyond this (beyond the short-run), there still lies the risk of a more
significant downturn. Key for managing equity exposure into the New Year will be to watch the 50-day moving averages forall the benchmark and sector indices. So long as they remain in rising mode, the primary uptrend remains intact. If however
they are reversed through a correction in prices and begin to decline, we believe the markets will easily see more than a 13%
decline (which is just an average), and would likely witness a 38.2% retracement from any recovery highs.
Since the markets are rallying aggressively again this morning (10/14/09), short-term risk becomes a moving target as support
and resistance levels constantly change. For the remainder of the year- and likely heading into the New Year, we continue to
advise clients to remain long the S&P above its rising 50-day moving average (red/blue lines above). This indicator has done a
great job of keeping us in the game thus far, and we would not become majorly concerned with a new cyclical bear market
until this line starts to roll over. Keep in mind that from current levels (SPX 1085; 50-day near the 1030 zone), initial risk just
to test the line for support is approximately -5%. Though it would be nice to fade such a move correctly over the short-run, we
do not believe it represents significant danger. However, if the 50-day MA is broken and begins rolling over, we feel
momentum may gather on the downside, and this would likely lead to a 38.2% retracement. Using today’s new recovery highs
(1085), this would equate to a decline toward the 920 region going forward. A 38.2% retracement is not a bearish step
backward during primary uptrends in our view- it is only when the 50% threshold is broken that we become concerned of a
new cyclical bear market taking hold. A 50% retracement from current levels (again, 1085) would equate to a decline towardthe 875 region.
Bottom Line:Stay long above the rising 50-day moving average of the S&P- currently at 1030 (but increasing steadily each day). If this is
broken, we run the risk of a 38.2% retracement (currently the 920 zone) before another strong rally attempt. We do not grow
concerned regarding a new cyclical bear market until the 50% threshold is breached- that currently resides near 875.
SPX: 1085.52
38.2%= 920 area
50%= 875 area
- 15 -

8/2/2019 Beringer Weinstock Group - TA Signals
http://slidepdf.com/reader/full/beringer-weinstock-group-ta-signals 16/33
DJIA: 9957.99
38.2%= 8600 area
50%= 8200 area
For the DJIA, we believe the Average remains bullish above its 50-day moving average. That indicator currentlyresides near the 9550 zone and is rising modestly each day. If this is broken and begins to decline, we believe it
would set the stage for a 38.2% retracement off the recovery highs (which thus far is 9960, although that can
change rather quickly). Such a retracement from current levels equates to a potential decline toward the 8600 zone.
Again we feel that a new cyclical bear market would not be a major threat until we breach the 50% threshold: that
currently resides near the 8200 region.
COMP: 2160.03
38.2%= 1820 zone
50%= 1720 zone
Finally, for the NASDAQ Composite, the 50-day moving average currently resides near the 2050 zone- offering
initial support on a short-term basis. If this is broken and begins to roll over, we believe there would be high
probability of a 38.2% retracement off the recovery highs (currently near 2160, but again that level can changerapidly in sessions ahead). Such a development would equate to a downward move toward the 1820 zone for
support, followed by secondary support at the 50% retracement area of 1720. Again, we do not feel the current
cyclical bull market would be in jeopardy of unless that 50% threshold is breached.
- 16 -

8/2/2019 Beringer Weinstock Group - TA Signals
http://slidepdf.com/reader/full/beringer-weinstock-group-ta-signals 17/33
Overall, looking at year-end and even beyond into 2010, it appears to us that it will continue to be very
much a ‘trader’s market’ going forward. Though we are long the markets cyclically right now, we
understand the risks ahead, are watching the dollar for influence, and are constantly reminding
ourselves just where we are in the grand scheme of things….
A Looming Threat: The U.S. Dollar
We have been harping on the importance of dollar watching for several months now. We believe this currency may hold the
key between continued equity strength- or those potential 38.2% corrections.
Current dollar trading correlations (and we do not expect these to last indefinitely) are as follows in our view:
x Orderly Decline in Dollar Index: reflation / inflation trade= good for equities and commodities, good for precious
metals (what we have been experiencing for the last several months)
x Collapse in Dollar Index: bad for equities initially (knee jerk reaction; potential mini-crash or aftershock in U.S.
stock markets); potentially bullish for commodities- most especially bullish for gold and precious metals
x Rally in Dollar Index: potential unwind of the current ‘dollar carry’ trade; possible loss of confidence in ‘risk
trade’ once again (with the dollar reclaiming its distinction as a global safe haven); could also simply be a function
of oversold technical conditions within the currency right now (Elliot Wave folks predicting major rally based on
their counts)= bad for equities and commodities (as the current correlation is a negative one)
U.S. Dollar: 75.800
Low-90s resistance
75-76 su ort: we’re there!
The bottom line here is: so long as the dollar continues within an orderly downward progression and current (negative)
correlations remain intact, it should bode well for a continuance in equity uptrends going forward in our view. If however
the dollar breaks this trend in a violent manner, it will likely cause major disturbances within the equity (and commodity)
uptrends we have enjoyed this year- with the distinct possibility that those key 50-day moving averages will break and a
correction toward the mid-900 zone on the S&P ensues.
- 17 -

8/2/2019 Beringer Weinstock Group - TA Signals
http://slidepdf.com/reader/full/beringer-weinstock-group-ta-signals 18/33
Forest from the Trees: Four Keys to a New Secular Bull
It has long been our contention that U.S. markets have been in the throes of a deflationary bear market cycle since
approximately 1998-2000. That the NADSAQ has been a near carbon-copy of the S&P 500 during the Great Depression
(our last deflationary bear market cycle) is unexplainable if one thinks from a linear perspective; and yet perfectly
understandable if one thinks from a cyclical perspective (especially considering that the generation which carved the
market path from 1929 to 1938 is nearly all deceased). It is our opinion that it does not matter whether or not the current
COMP/SPX correlation remains in place (and quantum mechanics suggests it won’t ): the secular market cycle is a
permanent fixture which portends the eventual end of this deflationary contraction and the advent of the next inflationary
expansion. Recall that according to our secular market model, there are four major developments that we need to see(in our opinion) to usher in a new secular uptrend:
x The stock markets must complete their base-building efforts (cyclical market swings) and break out to all new
highs (we are still well below previous peaks)
x P/E ratios for key benchmarks such as the S&P must be at trough levels (historically below 10 on the SPX).
Interestingly enough current P/E on the SPX is closer to 1938 levels than 1942 or 1982 levels…
x Secular bull markets typically have a demographic driver- the largest cohort ‘nesting.’ In the past this was the
‘Great Generation’ and the ‘Baby Boomers’ that drove our secular uptrends in the U.S.- we are now waiting for
the ‘Millenials’ to come online (still a few years away in our view)
x Velocity / credit expansion: our historical data of U.S. markets suggests that secular bull markets do not
typically occur against the backdrop of credit contraction and declining velocity of money- until these metrics
are corrected, we would expect range-bound market volatility to persist
These data points suggest that despite the market’s current uptrend, a secular transition is still some years away- and that
further pain from the stock markets is likely in the years ahead- in the form of smaller cyclical swings. Nonetheless, even
having the knowledge that we are still within a ‘trader’s market’ (and will be for some time) can aid us in adjusting our
portfolios, our lives, and our outlook to generate positive results on all fronts in the few years ahead- at least until the next
upwave takes hold in the U.S. and we can all breathe a sigh of relief. Below we look at these 4 points in more detail.
1. Equity Markets are Still Basing
x The stock markets must complete their base-building efforts (cyclical market swings) and break out to all new
highs (we are still well below previous peaks) to confirm a new secular bull
The current base for the S&P 500- the next secular bull
market will see a breakout to new highs…but there is still
quite a ways to travel before we get there…
- 18 -

8/2/2019 Beringer Weinstock Group - TA Signals
http://slidepdf.com/reader/full/beringer-weinstock-group-ta-signals 19/33
The current base for the DJIA…the next
secular bull market cycle will see the Dow
easily above 14,000- likely en route to 18-
20K…once of course, our current bear cycle
ends…
Do you believe the NASDAQ can ever eclipse 5,000
again? We do…although it will likely have a radically
different makeup than what originally powered it to such a
milestone back in 2000…no matter, the ascent is likely to
take years, if not decades, in our view…
- 19 -
8/2/2019 Beringer Weinstock Group - TA Signals
http://slidepdf.com/reader/full/beringer-weinstock-group-ta-signals 20/33
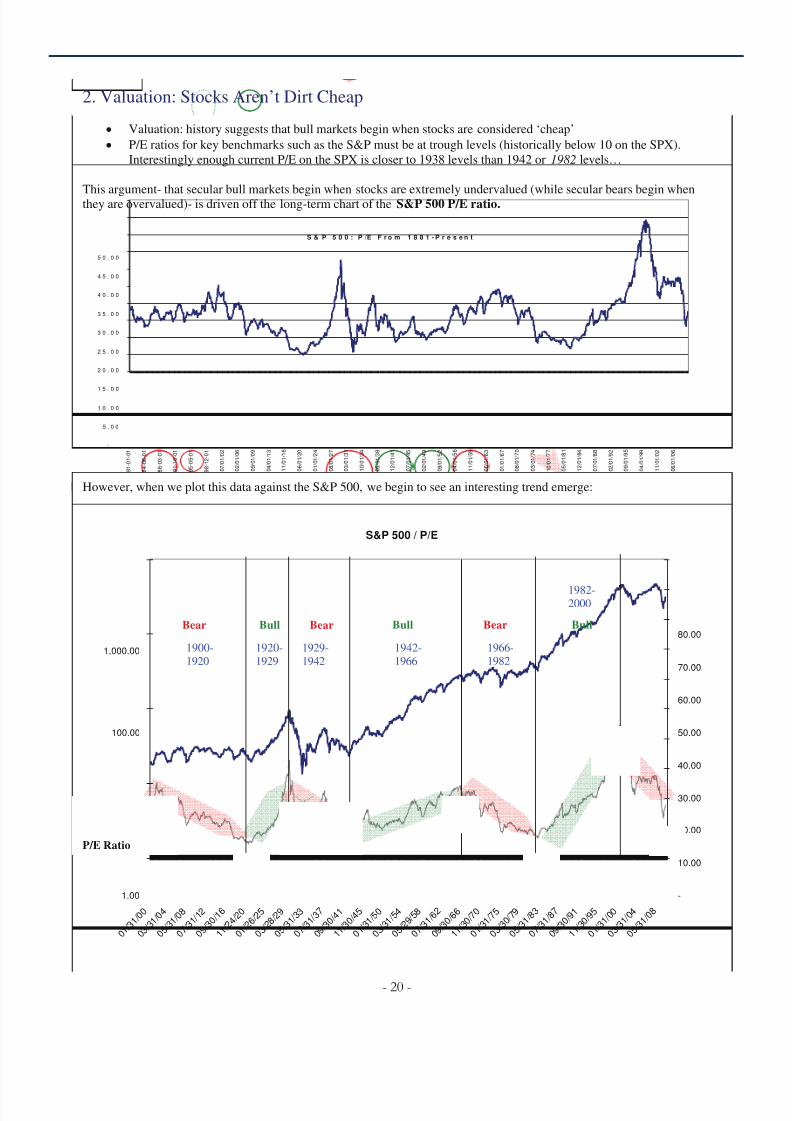
x Valuation: history suggests that bull markets begin when stocks are considered ‘cheap’
x P/E ratios for key benchmarks such as the S&P must be at trough levels (historically below 10 on the SPX).
Interestingly enough current P/E on the SPX is closer to 1938 levels than 1942 or 1982 levels…
This argument- that secular bull markets begin when stocks are extremely undervalued (while secular bears begin when
they are overvalued)- is driven off the long-term chart of the S&P 500 P/E ratio.
S & P 5 0 0 : P /E F r o m 1 8 8 1 - P r e s e n t
-
5 . 0 0
1 0 . 0 0
1 5 . 0 0
2 0 . 0 0
2 5 . 0 0
3 0 . 0 0
3 5 . 0 0
4 0 . 0 0
4 5 . 0 0
5 0 . 0 0
1 8 8 1 - 0 1 - 0 1
1 8 8 4 - 0 8 - 0 1
1 8 8 8 - 0 3 - 0 1
1 8 9 1 - 1 0 - 0 1
1 8 9 5 - 0 5 - 0 1
1 8 9 8 - 1 2 - 0 1
0 7 / 0 1 / 0 2
0 2 / 0 1 / 0 6
0 9 / 0 1 / 0 9
0 4 / 0 1 / 1 3
1 1 / 0 1 / 1 6
0 6 / 0 1 / 2 0
0 1 / 0 1 / 2 4
0 8 / 0 1 / 2 7
0 3 / 0 1 / 3 1
1 0 / 0 1 / 3 4
0 5 / 0 1 / 3 8
1 2 / 0 1 / 4 1
0 7 / 0 1 / 4 5
0 2 / 0 1 / 4 9
0 9 / 0 1 / 5 2
0 4 / 0 1 / 5 6
1 1 / 0 1 / 5 9
0 6 / 0 1 / 6 3
0 1 / 0 1 / 6 7
0 8 / 0 1 / 7 0
0 3 / 0 1 / 7 4
1 0 / 0 1 / 7 7
0 5 / 0 1 / 8 1
1 2 / 0 1 / 8 4
0 7 / 0 1 / 8 8
0 2 / 0 1 / 9 2
0 9 / 0 1 / 9 5
0 4 / 0 1 / 9 9
1 1 / 0 1 / 0 2
0 6 / 0 1 / 0 6
However, when we plot this data against the S&P 500, we begin to see an interesting trend emerge:
2. Valuation: Stocks Aren’t Dirt Cheap
S&P 500 / P/E
1.00
10.00
100.00
1,000.00
10,000.00
0 1 / 3 1 / 0 0
0 3 / 3 1 / 0 4
0 5 / 3 1 / 0 8
0 7 / 3 1 / 1 2
0 9 / 3 0 /
1 6
1 1 / 2 4 / 2 0
0 1 / 2 6 / 2 5
0 3 / 2 8 / 2 9
0 5 / 3 1 / 3 3
0 7 / 3 1 / 3 7
0 9 / 3 0 /
4 1
1 1 / 3 0 /
4 5
0 1 / 3 1 / 5 0
0 3 / 3 1 / 5 4
0 5 / 2 9 / 5 8
0 7 / 3 1 / 6 2
0 9 / 3 0 / 6 6
1 1 / 3 0 / 7 0
0 1 / 3 1 / 7 5
0 3 / 3 0 / 7 9
0 5 / 3 1 / 8 3
0 7 / 3 1 / 8 7
0 9 / 3 0 / 9 1
1 1 / 3 0 / 9 5
0 1 / 3 1 / 0 0
0 3 / 3 1 / 0 4
0 5 / 3 1 / 0 8
-
10.00
20.00
30.00
40.00
50.00
60.00
70.00
80.00
90.00
100.00
Bear
1900-
1920
Bull
1920-
1929
Bear
1929-
1942
Bull Bear Bull
1942-
1966
1966-1982
1982-2000
P/E Ratio
- 20 -
8/2/2019 Beringer Weinstock Group - TA Signals
http://slidepdf.com/reader/full/beringer-weinstock-group-ta-signals 21/33
The chart above plots the S&P 500 (top) against the historical P/E of the index (trailing 12). We have denoted the secular
bull and bear cycles according to our Secular Trend Model, and have circled the peaks and troughs in the ratio. Here are
some of our takeaways:
x Peak levels in the P/E ratio tend to correspond with secular market tops (an ‘end’ of the prior secular bull
market, and the beginning of a new secular bear). Troughs in the P/E tend to correspond with an end to the prior
secular bear market cycle (though not necessarily the “bottom” of the stock market, which tends to precede thistrough in P/E by a few years).
x The P/E ratio actually conforms to a trend function on a secular basis. That is, during secular bull markets, the
P/E displays higher lows and higher highs over a multi-decade period; while during secular bear markets, the
P/E ratio makes lower highs and lower lows- similar to the nominal price action of the SPX during this same
period.
x The high-20 / low-30 range tends to mark secular peak levels for the S&P P/E, although we note that in 2000,
this ratio reached a whopping +40. This is typically where secular bull markets end.
x The single-digit range tends to mark trough levels for the P/E. This is typically where secular bull markets begin.
x Each secular cycle in P/E trend lasts roughly 15-20 years on average in our opinion.
x Our current secular trend has conformed to historical patterns thus far- and it would appear that we still have
some miles to travel within this bear market before the P/E ratio reaches the sub-10 region once again. We
currently have this ratio pegged at about 17. Keep in mind that this P/E ratio can reach trough levels in any
number of ways- including stable prices (the ‘P’) and expanding earnings (the ‘E’)- suggesting that the S&P 500may not necessarily need to crash down to 400-500 to achieve the necessary valuations for a new secular bull
market.
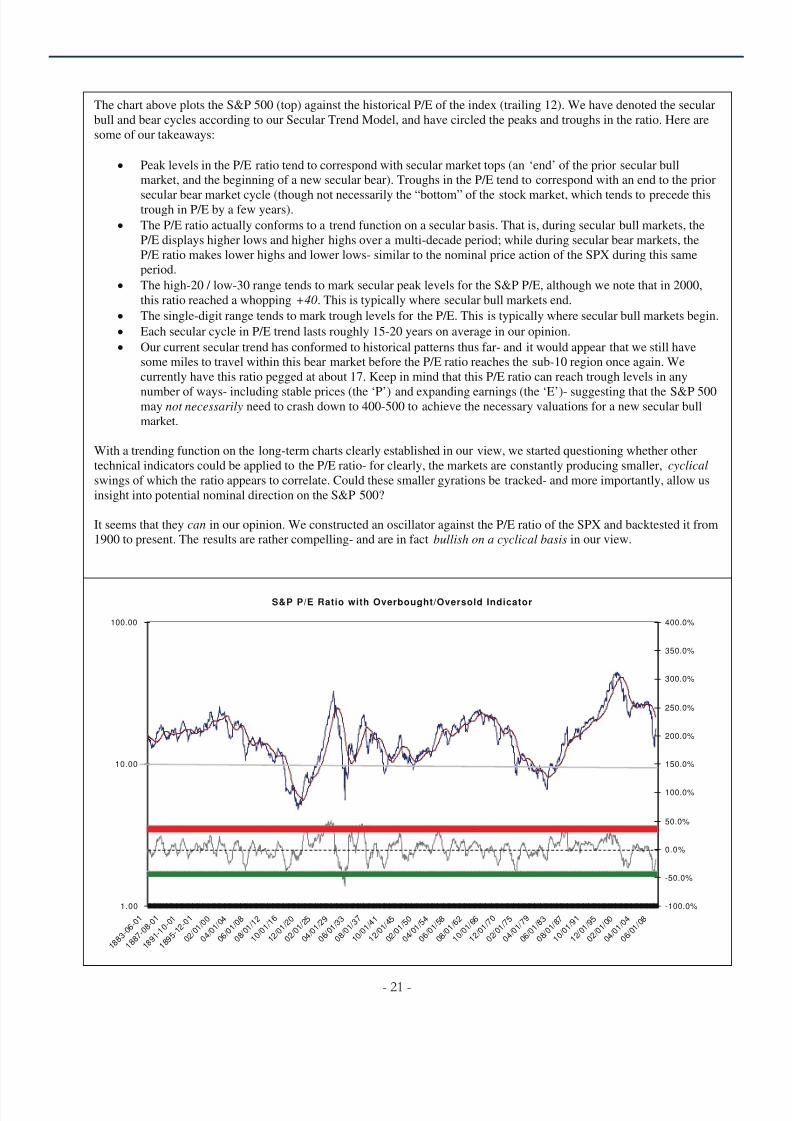
With a trending function on the long-term charts clearly established in our view, we started questioning whether other
technical indicators could be applied to the P/E ratio- for clearly, the markets are constantly producing smaller, cyclical
swings of which the ratio appears to correlate. Could these smaller gyrations be tracked- and more importantly, allow us
insight into potential nominal direction on the S&P 500?
It seems that they can in our opinion. We constructed an oscillator against the P/E ratio of the SPX and backtested it from
1900 to present. The results are rather compelling- and are in fact bullish on a cyclical basis in our view.
S&P P/E Ratio with Overbought/Oversold Indicator
1.00
10.00
100.00
1 8 8 3
- 0 6 - 0 1
1 8 8
7 - 0 8
- 0 1
1 8 9 1
- 1 0 - 0 1
1 8 9
5 - 1 2
- 0 1
0 2 / 0 1 / 0 0
0 4 / 0 1 / 0 4
0 6 / 0 1 / 0 8
0 8 / 0 1 / 1 2
1 0 / 0 1 / 1 6
1 2 / 0 1 / 2 0
0 2 / 0 1 / 2 5
0 4 / 0 1 / 2 9
0 6 / 0 1 / 3 3
0 8 / 0 1 / 3 7
1 0 / 0 1 / 4 1
1 2 / 0 1 / 4 5
0 2 / 0 1 / 5 0
0 4 / 0 1 / 5 4
0 6 / 0 1 / 5 8
0 8 / 0 1 / 6 2
1 0 / 0 1 / 6 6
1 2 / 0 1 / 7 0
0 2 / 0 1 / 7 5
0 4 / 0 1 / 7 9
0 6 / 0 1 / 8 3
0 8 / 0 1 / 8 7
1 0 / 0 1 / 9 1
1 2 / 0 1 / 9 5
0 2 / 0 1 / 0 0
0 4 / 0 1 / 0 4
0 6 / 0 1 / 0 8
-100.0%
-50.0%
0.0%
50.0%
100.0%
150.0%
200.0%
250.0%
300.0%
350.0%
400.0%
- 21 -

8/2/2019 Beringer Weinstock Group - TA Signals
http://slidepdf.com/reader/full/beringer-weinstock-group-ta-signals 22/33
Plotting the long-term SPX P/E and a simple 30-month moving average off the data, we can calculate the distance
between these two data sets and chart it in the form of an overbought/oversold oscillator. This is illustrated in the lower
portion of the chart above. Delineating the 0% line and upper and lower boundaries, we then can observe when the P/E
ratio becomes overbought and oversold. We have found consequently that extreme readings within this indicatorcorrespond to cyclical and secular market tops and bottoms on the S&P 500.
x The indicator is constantly swinging from overbought to oversold levels. When it pushes below the -30%
region (and in some instances, considerably below the -30% zone), cyclical market bottoms on the S&P tendto occur. We noticed this phenomenon in the following years (all cyclical or secular market bottoms): 1904,
1907, 1917, 1932, 1938, 1942, 1970, 1974, 2002, 2009
x As the indicator pushes past the +30% region into overbought territory (and again, in some instances
considerably past +30%), cyclical or secular market tops are signaled. We noted these occurrences during the
following years (all tops- either short- or long-term): 1929, 1934, 1936-1937, 1946, 1955, 1987, 1998-2000
We have plotted this indicator against the S&P 500 for better visual inspection, noting past extremes in the indicator as
well as our current reading (red circle):
S&P 500 and the P/E Oscilator: 1900-Present
1.00
10.00
100.00
1,000.00
10,000.00
0 1 / 3 1 / 0 0
0 3 / 3 1 / 0 4
0 5 / 3 1 / 0 8
0 7 / 3 1 / 1 2
0 9 / 3 0 /
1 6
1 1 / 2 4 / 2 0
0 1 / 2 6 / 2 5
0 3 / 2 8 / 2 9
0 5 / 3 1 / 3 3
0 7 / 3 1 / 3 7
0 9 / 3 0 /
4 1
1 1 / 3 0 /
4 5
0 1 / 3 1 / 5 0
0 3 / 3 1 / 5 4
0 5 / 2 9 / 5 8
0 7 / 3 1 / 6 2
0 9 / 3 0 / 6 6
1 1 / 3 0 / 7 0
0 1 / 3 1 / 7 5
0 3 / 3 0 / 7 9
0 5 / 3 1 / 8 3
0 7 / 3 1 / 8 7
0 9 / 3 0 / 9 1
1 1 / 3 0 / 9 5
0 1 / 3 1 / 0 0
0 3 / 3 1 / 0 4
0 5 / 3 1 / 0 8
-700%
-600%
-500%
-400%
-300%
-200%
-100%
0%
100%
1907 19171931-1932
19381942
1970
1974
2002
2009
As the chart above indicates, a P/E indicator pushing into oversold territory signals an oncoming cyclical bullreversal (as the P/E ratio can actually ‘pull higher’ on a cyclical basis without negating its secular downtrend). Italso appears to confirm our thoughts regarding how exactly secular bear markets end: the final lows / bottom in the
stock market tends to come years before the secular bear trend actually exhausts itself. In these years, the P/E oscillator
hits its most extreme levels before signaling a cyclical uptrend- as is expected. Then, as the markets stabilize but
remain within a trading range (this time a bit more muted), the oscillator will make a higher low as the actual P/E ratio
makes its final trough (the sub-10 threshold we talked about above). Our last two secular bear cycles conformed to this
pattern: 1932 was the final low on the S&P during the bear market from 1929-1942; and 1974 was the finial low on the
S&P during the bear market from 1966-1982.
Technicians refer to this as a ‘positive divergence’- visually, it can be represented by the following:
- 22 -

8/2/2019 Beringer Weinstock Group - TA Signals
http://slidepdf.com/reader/full/beringer-weinstock-group-ta-signals 23/33
Peak in P/ESecular Bear Market Secular Bull Market
Nominal lows in
stock market
End of secular bear
Higher lows in oscillator vs trough in P/E ratio
PE
P/E overbought/oversold indicator
PE
Implications for Q4 and 2010:
In March of 2009, the P/E oscillator reached an oversold level of -43.2% on a monthly closing basis. This was the
third most extreme oversold level recorded since 1900. Of the two years that beat this level:x September 1974 with a reading of -43.3%
x June 1932 with a reading of -65.3%
In our last cyclical bear market (2000-2002), the indicator reached a low of -32.6% in October of ’02 before
launching into the cyclical bull of 2003-2007.
As of October 2009, the indicator posts a reading of -11% and is trending upward toward the zero line from its deep
oversold condition. This implies that there is still room for the current cyclical bull in equities to run furtherbefore our indicator hits positive territory once again. Furthermore, as the P/E ratio of the S&P continues to grind
lower in the years ahead (remember- it still has to break that 10 threshold before the next secular bull can begin), we
would not expect this oscillator to reach the same extreme readings as this past March- but rather would anticipate
another positive divergence (via higher lows) as the bear cycle exhausts itself in earnest.
How a Bear Reall Dies…
- 23 -

8/2/2019 Beringer Weinstock Group - TA Signals
http://slidepdf.com/reader/full/beringer-weinstock-group-ta-signals 24/33
Demographics & Velocity: Not Supportive of Secular Bull ( yet…)
x Secular bull markets typically have a demographic driver- the largest cohort ‘nesting.’ In the past this was the ‘Great
Generation’ and the ‘Baby Boomers’ that drove our secular uptrends in the U.S.- we are now waiting for the ‘Millenials’
to come online (still a few years away in our view)
1.00
10.00
100.00
1,000.00
10,000.00
1 / 3 1 / 1 9 4 2
1 / 3 1 / 1 9 4 4
1 / 3 1 / 1 9 4 6
1 / 3 1 / 1 9 4 8
1 / 3 1 / 1 9 5 0
1 / 3 1 / 1 9 5 2
1 / 3 1 / 1 9 5 4
1 / 3 1 / 1 9 5 6
1 / 3 1 / 1 9 5 8
1 / 3 1 / 1 9 6 0
1 / 3 1 / 1 9 6 2
1 / 3 1 / 1 9 6 4
1 / 3 1 / 1 9 6 6
1 / 3 1 / 1 9 6 8
1 / 3 1 / 1 9 7 0
1 / 3 1 / 1 9 7 2
1 / 3 1 / 1 9 7 4
1 / 3 1 / 1 9 7 6
1 / 3 1 / 1 9 7 8
1 / 3 1 / 1 9 8 0
1 / 3 1 / 1 9 8 2
1 / 3 1 / 1 9 8 4
1 / 3 1 / 1 9 8 6
1 / 3 1 / 1 9 8 8
1 / 3 1 / 1 9 9 0
1 / 3 1 / 1 9 9 2
1 / 3 1 / 1 9 9 4
1 / 3 1 / 1 9 9 6
1 / 3 1 / 1 9 9 8
1 / 3 1 / 2 0 0 0
1 / 3 1 / 2 0 0 2
1 / 3 1 / 2 0 0 4
baby boomers nestmillenials born
millenials incubate
millenials nest
2nd
gen. nests2
ndgen. retires1940s-1950s
1960s-1970s
1980s-1990s
2000s-2010s
baby boomers incubate
S&P 500 from 1942
Source: JMS
baby boomers retire
baby boomers born
The demographic debate is a hotly contested one, and current economic conditions may have the largest demographic (the Baby
Boomers) putting their retirement plans on hold for a while. But if the boomers start cashing in their holdings/investments in
retirement going forward, a capital shortfall would have to be met via investment from foreign countries or perhaps aggressive
domestic monetary policy. Otherwise, history suggests we wait until the next big demographic cohort enters the economy and
begins ‘nesting’ (marrying, buying homes, investing, etc.)- as this phenomenon seems to be correlated with past secular bull
markets. In our case, the children of the boomers (the ‘Millenials’) begin nesting and create conditions for the next secular bull-
and that may still be some years away in our opinion- as a bulk of this demographic remains college age.
V e l o c i t y
1 . 5 0 0
1 . 6 0 0
1 . 7 0 0
1 . 8 0 0
1 . 9 0 0
2 . 0 0 0
2 . 1 0 0
1 9 5 9
1 9 6 1
1 9 6 3
1 9 6
5
1 9 6 7
1 9 6 9
1 9 7 1
1 9 7
3
1 9 7 5
1 9 7 7
1 9 7 9
1 9 8
1
1 9 8 3
1 9 8 5
1 9 8 7
1 9 8
9
1 9 9
1
1 9 9 3
1 9 9 5
1 9 9 7
1 9 9
9
2 0 0 1
2 0 0 3
2 0 0 5
2 0 0
7
Secular bull market in S&P
500 from 1980s-2000
Cyclical bull
market from
- 7
Secular trading range in equities:
1960s, 1970s, early 1980s
x Velocity / credit expansion: our historical data of U.S. markets suggests that secular bull markets do not typically occur
against the backdrop of credit contraction and declining velocity of money- until these metrics are corrected, we would
expect range-bound market volatility to persist
- 24 -

8/2/2019 Beringer Weinstock Group - TA Signals
http://slidepdf.com/reader/full/beringer-weinstock-group-ta-signals 25/33
Officials understand that a decline in velocity is exactly what will lead toward a greater deflationary contraction in the
months ahead. The powers that be can control the money supply- and as such, they have taken to pumping tremendous
amounts of it into the system in the hopes of jump starting the broader economy. However, they cannot control velocity-
that is, the turnover of money supply within the economy (from business to business, from consumer to business, etc.).
A widely accepted method of calculating velocity is to divide GDP by M2 (which is M1 + savings, time, and money market
deposits). We have calculated velocity dating back to 1959 in the chart above and have found some interesting correlations,though we note these are more anecdotal based on visual inspection, and should be evaluated further to see of strong
correlations do indeed exist on a quantitative basis.
Observations1. The trend in velocity correlates to both secular and cyclical trends within the S&P 500, in our opinion. We can see
from the chart above that smaller swings in velocity contributed to the range-bound, choppy market of the 1960s,
1970s and early 1980s. Then, a large “breakout” in the indicator correlated with a new secular bull market from the
mid-1980s up to the late 1990s. After the secular bull market in equities ended, we see that velocity broke down
from a major peak where it underwent one cyclical upswing from 2002 to 2007- this brief uptick in velocity
corresponded to the cyclical bull market in the S&P from 2003-2007.
2. It would appear as if trend changes in velocity lead the equity markets (gauged by the S&P 500). A good example
of this occurred in 1998: velocity peaked before peaks in the stock market (which occurred around the year 2000).
If this is a true leading indicator, we will need to see the chart above reverse higher before we can anticipate at
least a cyclical bull market in equities going forward.
3. If velocity is mean reverting, it would imply a further decline heading into 2009. Though the equity markets could
stage large bear rally over the short-run (and we believe they will), the implication from this indicator is that we
should not expect the emergence of a new secular bull market within the first half of the New Year, as there is still
room to retrace lower over the intermediate-term horizon.
Bottom Line:
Current market cycles have us enjoying a cyclical bull market in equities within a broader, secular bear
trend. This is not new territory for the markets themselves, although for a new generation of players,
events of the past few years have been nothing less than shocking. We are of the belief that the U.S.
markets have not yet transitioned into a ‘buy and hold’ cycle (a secular bull market), but rather residewithin a ‘trader’s market’- and this will remain so for the next few years.
We remain long the U.S. markets heading into the 4th
quarter of 2009, and will continue to hold abovethe rising 50-day moving averages that keep cyclical uptrends intact for a host of benchmarks and
sectors. There is risk over the short-run, but so long as these key indicators remain rising, we believe it
would be prudent to refrain from ‘fighting the tape.’ We believe the S&P 500 is still on track to reachour target zone of 1140-1180, and that may end up being a conservative estimate when all is said and
done. The U.S. dollar index is a wildcard right now, and investors should continue to monitor this key
currency going forward.
In the years ahead, we expect the range-bound scenario to continue- with the U.S likely seeing a moremuted set of boundaries in the major indices- more similar to the 1930s-1940s period, than the 1960s-
1970s.
We do not believe the key drivers for a secular bull market: technical breakouts, stock valuations,
demographics, and financial / credit expansion / innovation- are currently in place- but will likely takeyears to develop / improve. This will most likely aid in keeping the markets range-bound under volatile
conditions for the foreseeable future. Though the party rages on for now, the key phrase as we
approach the New Year will be: Caveat Emptor.
- 25 -

8/2/2019 Beringer Weinstock Group - TA Signals
http://slidepdf.com/reader/full/beringer-weinstock-group-ta-signals 26/33
Interest Rates: Still a Deflationary Bear Market
As a consequence of our ongoing deflationary bear market cycle, we continue to believe that the interest rate environment
(as gauged by the 10-year note yield) will remain range-bound at historically low levels. We do not believe we have turned
the corner into a new secular inflationary regime with respect to this area of the market. Nonetheless, it is unlikely for the
directional bias of the TNX (or the TYX) to be one sided into the New Year; but rather trading opportunities are likely toabound from both the long and short sides in the months ahead.
TNX: 3.388%
The chart above depicts the 10-year note yield from the early-1980s up until today. It confirms our macro thesis that we
remain within a deflationary bear market overall: one where equities are likely to be range-bound for several years, rates are
likely to stay low, and commodities prices are likely to inflate (negatively correlated to the rate environment). The chart
also shows that at current levels (3.38% on the TNX), we are nowhere near the threshold needed to signal the onset of a
new inflationary secular cycle. For that to be confirmed, yields on the 10-year would have to push well above the 5%mark. With the lows being set in place just last year near 2%, this makes for a wide trading range in rates going forward-
easily into Q4 of 2009, and likely into the second half of 2010 in our opinion.
TYX: 4.22%
A similar multi-year downtrend in the TYX confirms our position
still within a deflationary bear cycle. The TYX sports initial
resistance near 5% and support near 2.60%- making for a wide
trading range (at historically low levels) heading into Q4.
- 26 -
8/2/2019 Beringer Weinstock Group - TA Signals
http://slidepdf.com/reader/full/beringer-weinstock-group-ta-signals 27/33
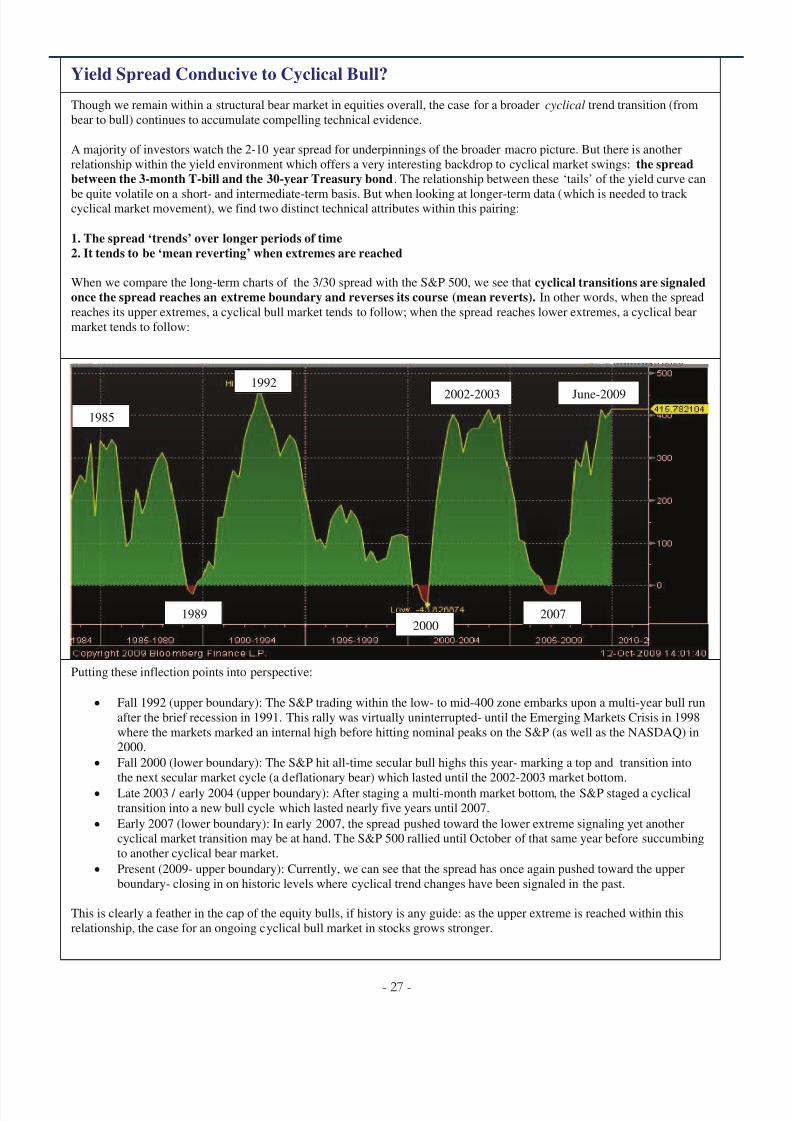
Though we remain within a structural bear market in equities overall, the case for a broader cyclical trend transition (from
bear to bull) continues to accumulate compelling technical evidence.
A majority of investors watch the 2-10 year spread for underpinnings of the broader macro picture. But there is another
relationship within the yield environment which offers a very interesting backdrop to cyclical market swings: the spreadbetween the 3-month T-bill and the 30-year Treasury bond. The relationship between these ‘tails’ of the yield curve can
be quite volatile on a short- and intermediate-term basis. But when looking at longer-term data (which is needed to track cyclical market movement), we find two distinct technical attributes within this pairing:
1. The spread ‘trends’ over longer periods of time2. It tends to be ‘mean reverting’ when extremes are reached
When we compare the long-term charts of the 3/30 spread with the S&P 500, we see that cyclical transitions are signaledonce the spread reaches an extreme boundary and reverses its course (mean reverts). In other words, when the spread
reaches its upper extremes, a cyclical bull market tends to follow; when the spread reaches lower extremes, a cyclical bear
market tends to follow:
1985
1992
2002-2003 June-2009
19892000
2007
Yield Spread Conducive to Cyclical Bull?
Putting these inflection points into perspective:
x Fall 1992 (upper boundary): The S&P trading within the low- to mid-400 zone embarks upon a multi-year bull run
after the brief recession in 1991. This rally was virtually uninterrupted- until the Emerging Markets Crisis in 1998
where the markets marked an internal high before hitting nominal peaks on the S&P (as well as the NASDAQ) in
2000.
x Fall 2000 (lower boundary): The S&P hit all-time secular bull highs this year- marking a top and transition into
the next secular market cycle (a deflationary bear) which lasted until the 2002-2003 market bottom.
x Late 2003 / early 2004 (upper boundary): After staging a multi-month market bottom, the S&P staged a cyclical
transition into a new bull cycle which lasted nearly five years until 2007.
x Early 2007 (lower boundary): In early 2007, the spread pushed toward the lower extreme signaling yet another
cyclical market transition may be at hand. The S&P 500 rallied until October of that same year before succumbing
to another cyclical bear market.
x Present (2009- upper boundary): Currently, we can see that the spread has once again pushed toward the upper
boundary- closing in on historic levels where cyclical trend changes have been signaled in the past.
This is clearly a feather in the cap of the equity bulls, if history is any guide: as the upper extreme is reached within this
relationship, the case for an ongoing cyclical bull market in stocks grows stronger.
- 27 -

8/2/2019 Beringer Weinstock Group - TA Signals
http://slidepdf.com/reader/full/beringer-weinstock-group-ta-signals 28/33
Commodities: Still Within a Secular Bull Trend…
In a broader macro framework, we continue to believe commodities in general remain within a secular uptrend- begun
sometime around 1998-2000 (and just as the equity markets were transitioning from bull to bear). As such, we remain long-term
bulls regarding the major commodity markets at this time, and expect to see higher levels in this sector in the years ahead. If wewere to offer up one group as a ‘buy and hold’ in our current market environment, it would be commodities- and most especially
precious metals. Below we provide a brief update on the gold and silver charts heading into year-end, and then update our call
on natural gas- which we still believe will outperform crude oil prices in the months ahead.
Gold recently hit new all-time highs- and the fervor surrounding it may have pushed sentiment over the edge. Though we like
the metal long-term- and believe it will eventually hit targets north of $1500, we are concerned that it may be too overbought
heading into year-end, and thus may suffer a setback / retracement in the months ahead. The added concern here of course is the
dollar index, which has pushed itself into deep oversold territory on a short-term basis: if it stages an strong rally, it would likely
derail much of the momentum we recently enjoyed in gold prices. We continue to believe initial bullish support resides within
the $950-975 zone, while secular trend line support now sits closer to $750.
Gold: 1063.20
Impressive breakout…nut very
overbought heading into Q4…
Silver: 17.905
Silver is also staging an impressive chart breakout- though in doing so has
lodged itself into overbought territory just as we enter Q4. We would not be
surprised by a near-term fade / retracement (especially if the dollar rallies), and
will be looking for initial support near the 14 zone in the months ahead (ecular
trend line support resides near the 9 region). We believe that longer-term, thismetal will achieve levels north of 25.
- 28 -
8/2/2019 Beringer Weinstock Group - TA Signals
http://slidepdf.com/reader/full/beringer-weinstock-group-ta-signals 29/33
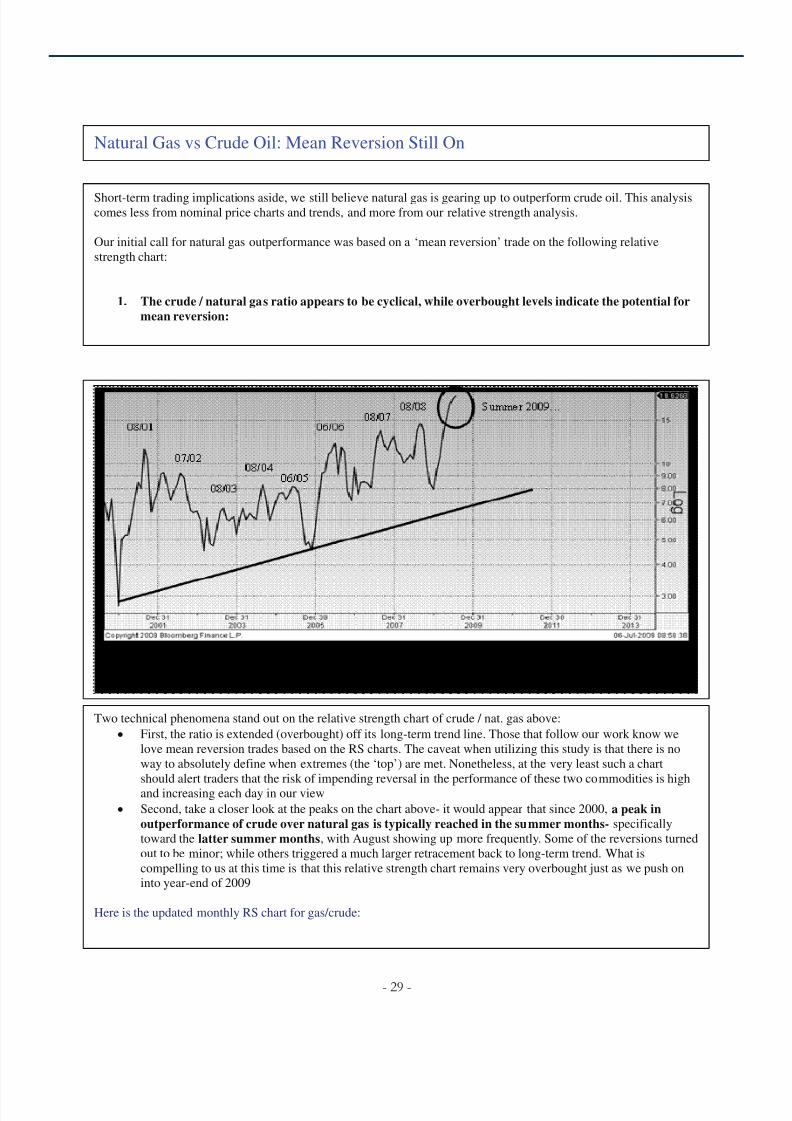
Short-term trading implications aside, we still believe natural gas is gearing up to outperform crude oil. This analysiscomes less from nominal price charts and trends, and more from our relative strength analysis.
Our initial call for natural gas outperformance was based on a ‘mean reversion’ trade on the following relative
strength chart:
1. The crude / natural gas ratio appears to be cyclical, while overbought levels indicate the potential formean reversion:
Natural Gas vs Crude Oil: Mean Reversion Still On
Two technical phenomena stand out on the relative strength chart of crude / nat. gas above:
x First, the ratio is extended (overbought) off its long-term trend line. Those that follow our work know we
love mean reversion trades based on the RS charts. The caveat when utilizing this study is that there is no
way to absolutely define when extremes (the ‘top’) are met. Nonetheless, at the very least such a chart
should alert traders that the risk of impending reversal in the performance of these two commodities is high
and increasing each day in our view
x Second, take a closer look at the peaks on the chart above- it would appear that since 2000, a peak inoutperformance of crude over natural gas is typically reached in the summer months- specifically
toward the latter summer months, with August showing up more frequently. Some of the reversions turned
out to be minor; while others triggered a much larger retracement back to long-term trend. What is
compelling to us at this time is that this relative strength chart remains very overbought just as we push on
into year-end of 2009
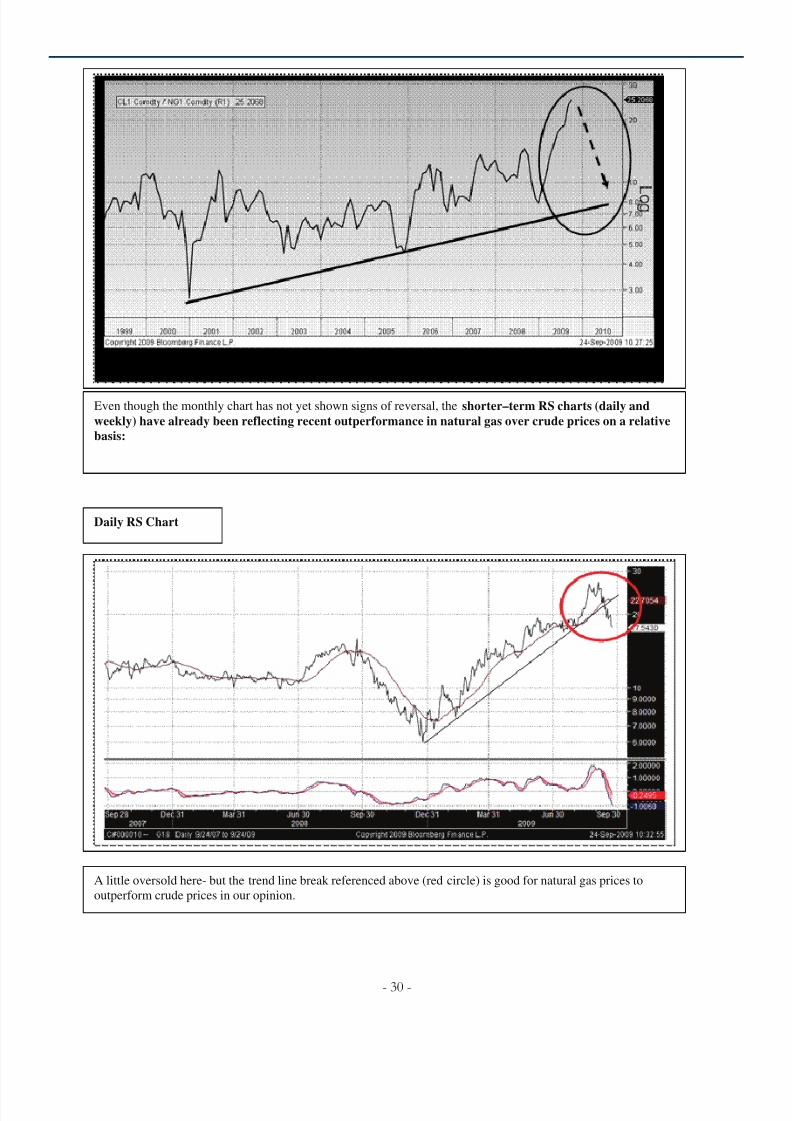
Here is the updated monthly RS chart for gas/crude:
- 29 -
8/2/2019 Beringer Weinstock Group - TA Signals
http://slidepdf.com/reader/full/beringer-weinstock-group-ta-signals 30/33
Even though the monthly chart has not yet shown signs of reversal, the shorter–term RS charts (daily andweekly) have already been reflecting recent outperformance in natural gas over crude prices on a relativebasis:
A little oversold here- but the trend line break referenced above (red circle) is good for natural gas prices to
outperform crude prices in our opinion.
Daily RS Chart
- 30 -
8/2/2019 Beringer Weinstock Group - TA Signals
http://slidepdf.com/reader/full/beringer-weinstock-group-ta-signals 31/33
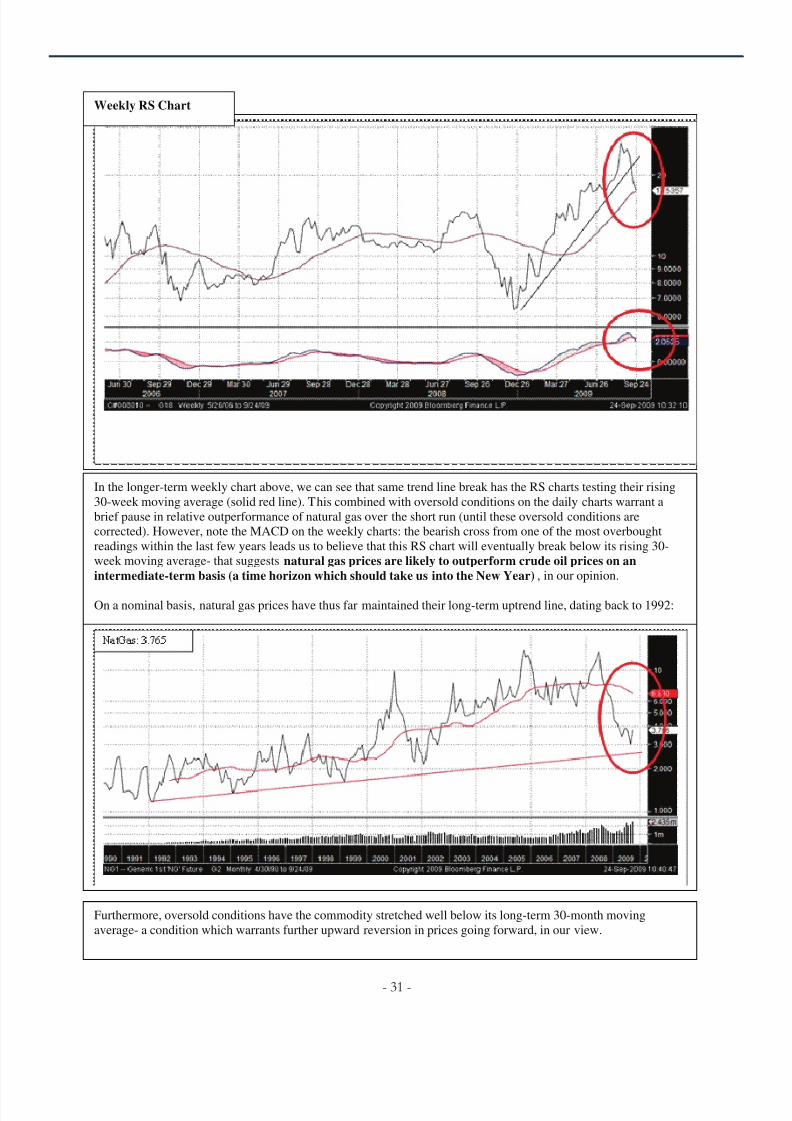
Weekly RS Chart
In the longer-term weekly chart above, we can see that same trend line break has the RS charts testing their rising
30-week moving average (solid red line). This combined with oversold conditions on the daily charts warrant a
brief pause in relative outperformance of natural gas over the short run (until these oversold conditions are
corrected). However, note the MACD on the weekly charts: the bearish cross from one of the most overbought
readings within the last few years leads us to believe that this RS chart will eventually break below its rising 30-
week moving average- that suggests natural gas prices are likely to outperform crude oil prices on anintermediate-term basis (a time horizon which should take us into the New Year), in our opinion.
On a nominal basis, natural gas prices have thus far maintained their long-term uptrend line, dating back to 1992:
Furthermore, oversold conditions have the commodity stretched well below its long-term 30-month moving
average- a condition which warrants further upward reversion in prices going forward, in our view.
- 31 -

8/2/2019 Beringer Weinstock Group - TA Signals
http://slidepdf.com/reader/full/beringer-weinstock-group-ta-signals 32/33
The Wildcard (again…)
Though we feel confident in the relative strength trends regarding natural gas vs crude oil prices at this time, on a
nominal basis the commodity could still suffer some blows- and this would likely come (at least from a technical
standpoint) from any disruption in the dollar index.
We mentioned earlier that current negative correlations bode well for rising equity and commodity markets so long as
the dollar index continues within its orderly (inflationary / reflationary) decline. If the dollar were to surprise the bears
by rallying aggressively in sessions ahead, we believe it would likely serve to deflate the recent equity and commodity
market strength we have been enjoying.
USD: 76.370
At this stage, we are still not seeing signs of a major technical reversal from the currency- and this should bode well for
continued basing efforts in natural gas prices (as well as stabilization in crude oil, even though the relative strength
charts argue for underperformance in that sector). However, a rally in the dollar past its declining 50-day moving
average (around the 77-80 zone) could be the trigger for a much larger reversal: a development which again, could hurt
the natural gas market on a nominal basis.
Bottom Line: We still believe natural gas prices can outperform crude on a relative basis…with some miles to travel
on this call in the weeks, possibly months ahead. From a nominal standpoint however, the fate of natural gas prices
most likely (still) resides in the hand of the U.S. dollar index.
- 32 -

8/2/2019 Beringer Weinstock Group - TA Signals
http://slidepdf.com/reader/full/beringer-weinstock-group-ta-signals 33/33
IMPORTANT DISCLOSURES
Research Analyst Certification
I, Dan Wantrobski, the Primarily Responsible Analyst for this research report, hereby certify that all of the views expressed inthis research report accurately reflect my personal views about any and all of the subject securities or issuers. No part of mycompensation was, is, or will be, directly or indirectly, related to the specific recommendations or views I expressed in thisresearch report.
Janney Montgomery Scott LLC ("JMS") Equity Research Disclosure Legend
Individual disclosures for the companies mentioned in this report can be obtained by calling or writing Janney MontgomeryScott LLC as provided on the first page of this report. Disclosure Site
Definition of Ratings
BUY: Janney expects that the subject company will appreciate in value. Additionally, we expect that the subject company willoutperform comparable companies within its sector.
NEUTRAL: Janney believes that the subject company is fairly valued and will perform in line with comparable companieswithin its sector. Investors may add to current positions on short-term weakness and sell on strength as the valuations orfundamentals become more or less attractive.
SELL: Janney expects that the subject company will likely decline in value and will underperform comparable companieswithin its sector.
Janney Montgomery Scott Ratings Distribution as of 6/30/09
IB Serv./Past 12 Mos.
Rating Count Percent Count Percent
BUY [B] 143 48.60 5 3.50
NEUTRAL [N] 145 49.30 6 4.14
SELL [S] 6 2.00 0 0.00
*Percentages of each rating category where Janney has performed Investment Banking services over thepast 12 months.
Other Disclosures
Investment opinions are based on each stock’s 6-12 month return potential. Our ratings are not based on formal price targetshowever our analysts will discuss fair value and/or target price ranges in research reports. Decisions to buy or sell a stock should be based on the investor’s investment objectives and risk tolerance and should not rely solely on the rating. Investors shouldread carefully the entire research report, which provides a more complete discussion of the analyst’s views.
This research report is provided for informational purposes only and shall in no event be construed as an offer to sell or asolicitation of an offer to buy any securities. The information described herein is taken from sources which we believe to bereliable, but the accuracy and completeness of such information is not guaranteed by us. The opinions expressed herein may begiven only such weight as opinions warrant. This Firm, its officers, directors, employees, or members of their families may have positions in the securities mentioned and may make purchases or sales of such securities from time to time in the open market ootherwise and may sell to or buy from customers such securities on a principal basis.Supporting information related to therecommendation, if any, made in the research report is available upon request.